Article

Research on Stress Sensitivity of Fractured Carbonate Reservoirs Based on CT Technology

1
Research Centre of Multiphase Flow in Porous Media, China University of Petroleum (East China), Qingdao 266580, China
2
Institute of Petroleum Engineering, Heriot-Watt University, Riccarton, Edinburgh EH14 4AS, UK
*
Authors to whom correspondence should be addressed.
Submission received: 17 August 2017 / Revised: 30 October 2017 / Accepted: 31 October 2017 / Published: 10 November 2017
(This article belongs to the Special Issue Flow and Transport Properties of Unconventional Reservoirs)

Abstract

:
Fracture aperture change under stress has long been considered as one of primary causes of stress sensitivity of fractured gas reservoirs. However, little is known about the evolution of the morphology of fracture apertures on flow property in loading and unloading cycles. This paper reports a stress sensitivity experiment on carbonate core plugs in which Computed Tomography (CT) technology is applied to visualize and quantitatively evaluate morphological changes to the fracture aperture with respect to confining pressure. Fracture models were obtained at selected confining pressures on which pore-scale flow simulations were performed to estimate the equivalent absolute permeability. The results showed that with the increase of confining pressure from 0 to 0.6 MPa, the fracture aperture and equivalent permeability decreased at a greater gradient than their counterparts after 0.6 MPa. This meant that the rock sample is more stress-sensitive at low effective stress than at high effective stress. On the loading path, an exponential fitting was found to fit well between the effective confining pressure and the calculated permeability. On the unloading path, the relationship is found partially reversible, which can evidently be attributed to plastic deformation of the fracture as observed in CT images.

1. Introduction

Fractured geological formations are ubiquitous throughout the world, and their stress-sensitive behaviors are of primary interest in a number of contexts including: (1) aquifer exploitation for fresh water supply; (2) underground radioactive waste disposal repositories; (3) petroleum reservoir exploitation; (4) geothermal reservoir exploitation and heat storage; (5) mining and mineralization processes (in situ leaching and location of ore bodies); (6) geotechnical applications (including effects on underground storage reservoirs, tunnels and other structures); and (7) deeper earth systems such as earthquakes and ocean floor hydrothermal venting [1,2]. In petroleum reservoir exploitation, fractured oil and gas reservoirs are primary targets, as they hold a considerable amount of the remaining petroleum resources of this world [3,4,5,6,7], but pose significant challenges to achieving efficient recovery due mainly to their stress-sensitive nature [8,9,10].
The stress sensitivity of fractured gas reservoirs, in terms of their flow properties, has become a focus of much attention of research [11,12]. Permeability is well known to negatively correlate with the effective stress [13], and the stress-dependent permeability becomes the norm of petrophyiscal characterization for, but not limited to, fractured reservoirs [14,15]. Experimental studies on the stress-sensitivity reveal that fracture aperture is the reciprocal of the effective stress, and is one of key factors controlling stress-dependent permeability [16]. However, the in situ evolution of fracture aperture is not yet well understood for better characterizing and modeling of the stress-dependent permeability. For dry rocks, experiments with cylindrical core plugs under loading normal to the side wall show that measured fracture permeability decreases nonlinearly with increasing normal stress [17], and can be very well fitted using many existing empirical and semi-empirical models [18]. Fracture permeability exhibits hysteresis effects under normal loading and unloading cycles [17,19]. With an increase in the normal loading, more asperities come into contact, resulting in plastic deformation, and the damages thus become irreversible during the unloading. However, traditional laboratory test experiments do not provide any information on the evolution of fracture apertures, with respect to fracture dips and azimuths in a sample, necessary for predicating permeability along the stress path. Therefore, it is of great significance to quantitatively evaluate morphological changes to the fracture with respect to confining pressure.
As originally developed for medical research [20,21,22,23,24], Computed Tomography (CT), such as X-ray CT, has rapidly become an essential non-destructive technique for imaging rocks under deformation in petroleum research, due to technology advances in scanning speed, high-quality high-resolution data acquisition, and image processing [21,22,25,26,27,28]. Montemagno et al. (1999) measured the fracture geometry with X-ray tomography [29]; Wolf, Karl Heinz et al. (2008) determined the cleat angle distribution of the RECOPOL coal seams using CT-scans [30]; Cai et al. (2014) conducted permeability evolution in fractured coal by combining triaxial confinement with X-ray computed tomography, acoustic emission, and ultrasonic techniques [31]. Besides, some studies determined aperture structure and fluid flow in a rock fracture by high-resolution numerical modeling on the basis of a flow-through experiment under confining pressure [32,33]. However, few researchers have directly studied the in situ characterization of natural fracture.
In this paper, we conducted a stress sensitivity experiment on a low-porosity carbonate sample in which an advanced X-ray CT instrument was used to acquire tomographic snapshots of the deforming sample at a number of applied confining pressures, in a full loading and unloading cycle, by simulating the stress variation of an actual fractured gas reservoir. Then, we processed the scanned images and reconstructed the digital cores [24,34,35,36,37] of the fracture. Finally, we applied iso2mesh [38], a three-dimensional (3D) mesh generation toolbox, to create a mesh of the fracture at each confining pressure to compute its equivalent permeability by pore-scale flow simulations. By so doing, we successfully presented a numerical basis for the analysis of fractured carbonate reservoirs.

2. Stress Sensitivity Experiment

Stress sensitivity phenomena occur in the process of oil and gas field development of fractured reservoirs [13,14,15,39]. Natural fractures are the main fluid flow channels in tight sandstone and fractured carbonate reservoirs [40], which are the main factors in the development of oil and gas wells. Thus, in this paper, we obtained the cores from Lower Ordovician of Tarim Basin, China. The sample was extracted from the depth of about 2000 m, the average porosity was 2.83%, and the average permeability was 2.58 × 10⁻³ μm2 in this area.

2.1. The Preparation of the Experiment

First, to observe the fracture of a standard core with a 25-mm diameter, we adopted a resolution of approximately 25 μm to scan the core, which was sufficient to view the inner space of the core sample. Second, we reconstructed the data obtained through Xradia Microscopy (XM) Reconstruction and visualized the data obtained through the XM 3Dviewer. We found the location of the fractures in Figure 1. By drilling a small core of 10 mm in this position, we obtained the material for the fracture stress sensitive experiment.
The next step was to place the small sample in the core holder that was fixed to the base so that we could reduce the impact of human factors, that is, to avoid scanning position shifts.
We scanned the small sample to obtain fracture information at a scanning resolution of 3.46 μm, so that it was possible to quantitatively evaluate the width of the fracture. Then, to construct the corresponding 3D digital core, the gray scale correction, the denoising and smoothing, and the two-value segmentation were carried out. Finally the corresponding 3D digital cores were constructed [41].
By observing the scanning results, we located the fracture center and confirmed that the same fracture was scanned under different effective stresses. It can be clearly seen that the fractures were in the center of the field of vision (Figure 2), which was the result when the confining pressure was 0 MPa.
Then, we extracted the fracture zone data (400 × 400 × 400 pixel3) from the scanning results. First, the image denoising and image smoothing were conducted, and then the pictures were segmented. Finally, the 3D digital core of the fracture was obtained, as shown in Figure 3.

2.2. Experimental Conditions and Experimental Apparatus

To control the influence of external conditions (mainly temperature) on the experiment, the CT scans were performed at a set temperature of 24 °C. In this experiment, the sample diameter was approximately 10 mm with a length of around 2 cm.
The core holder used in the stress sensitivity experiment was specially made to match the apparatus. The clamping device had characteristics of high corrosion resistance and low density, and most importantly, it had good X-ray permeability to reduce the interference of external conditions on the results of the scan. Using the clamping device, we applied the CT equipment to accurately acquire the change in the core fracture width and other parameters in the process of changes in the surrounding pressure.

2.3. Experimental Procedure

The experimental procedure of the pressure sensitive effect based on CT scanning was as follows:
(1)
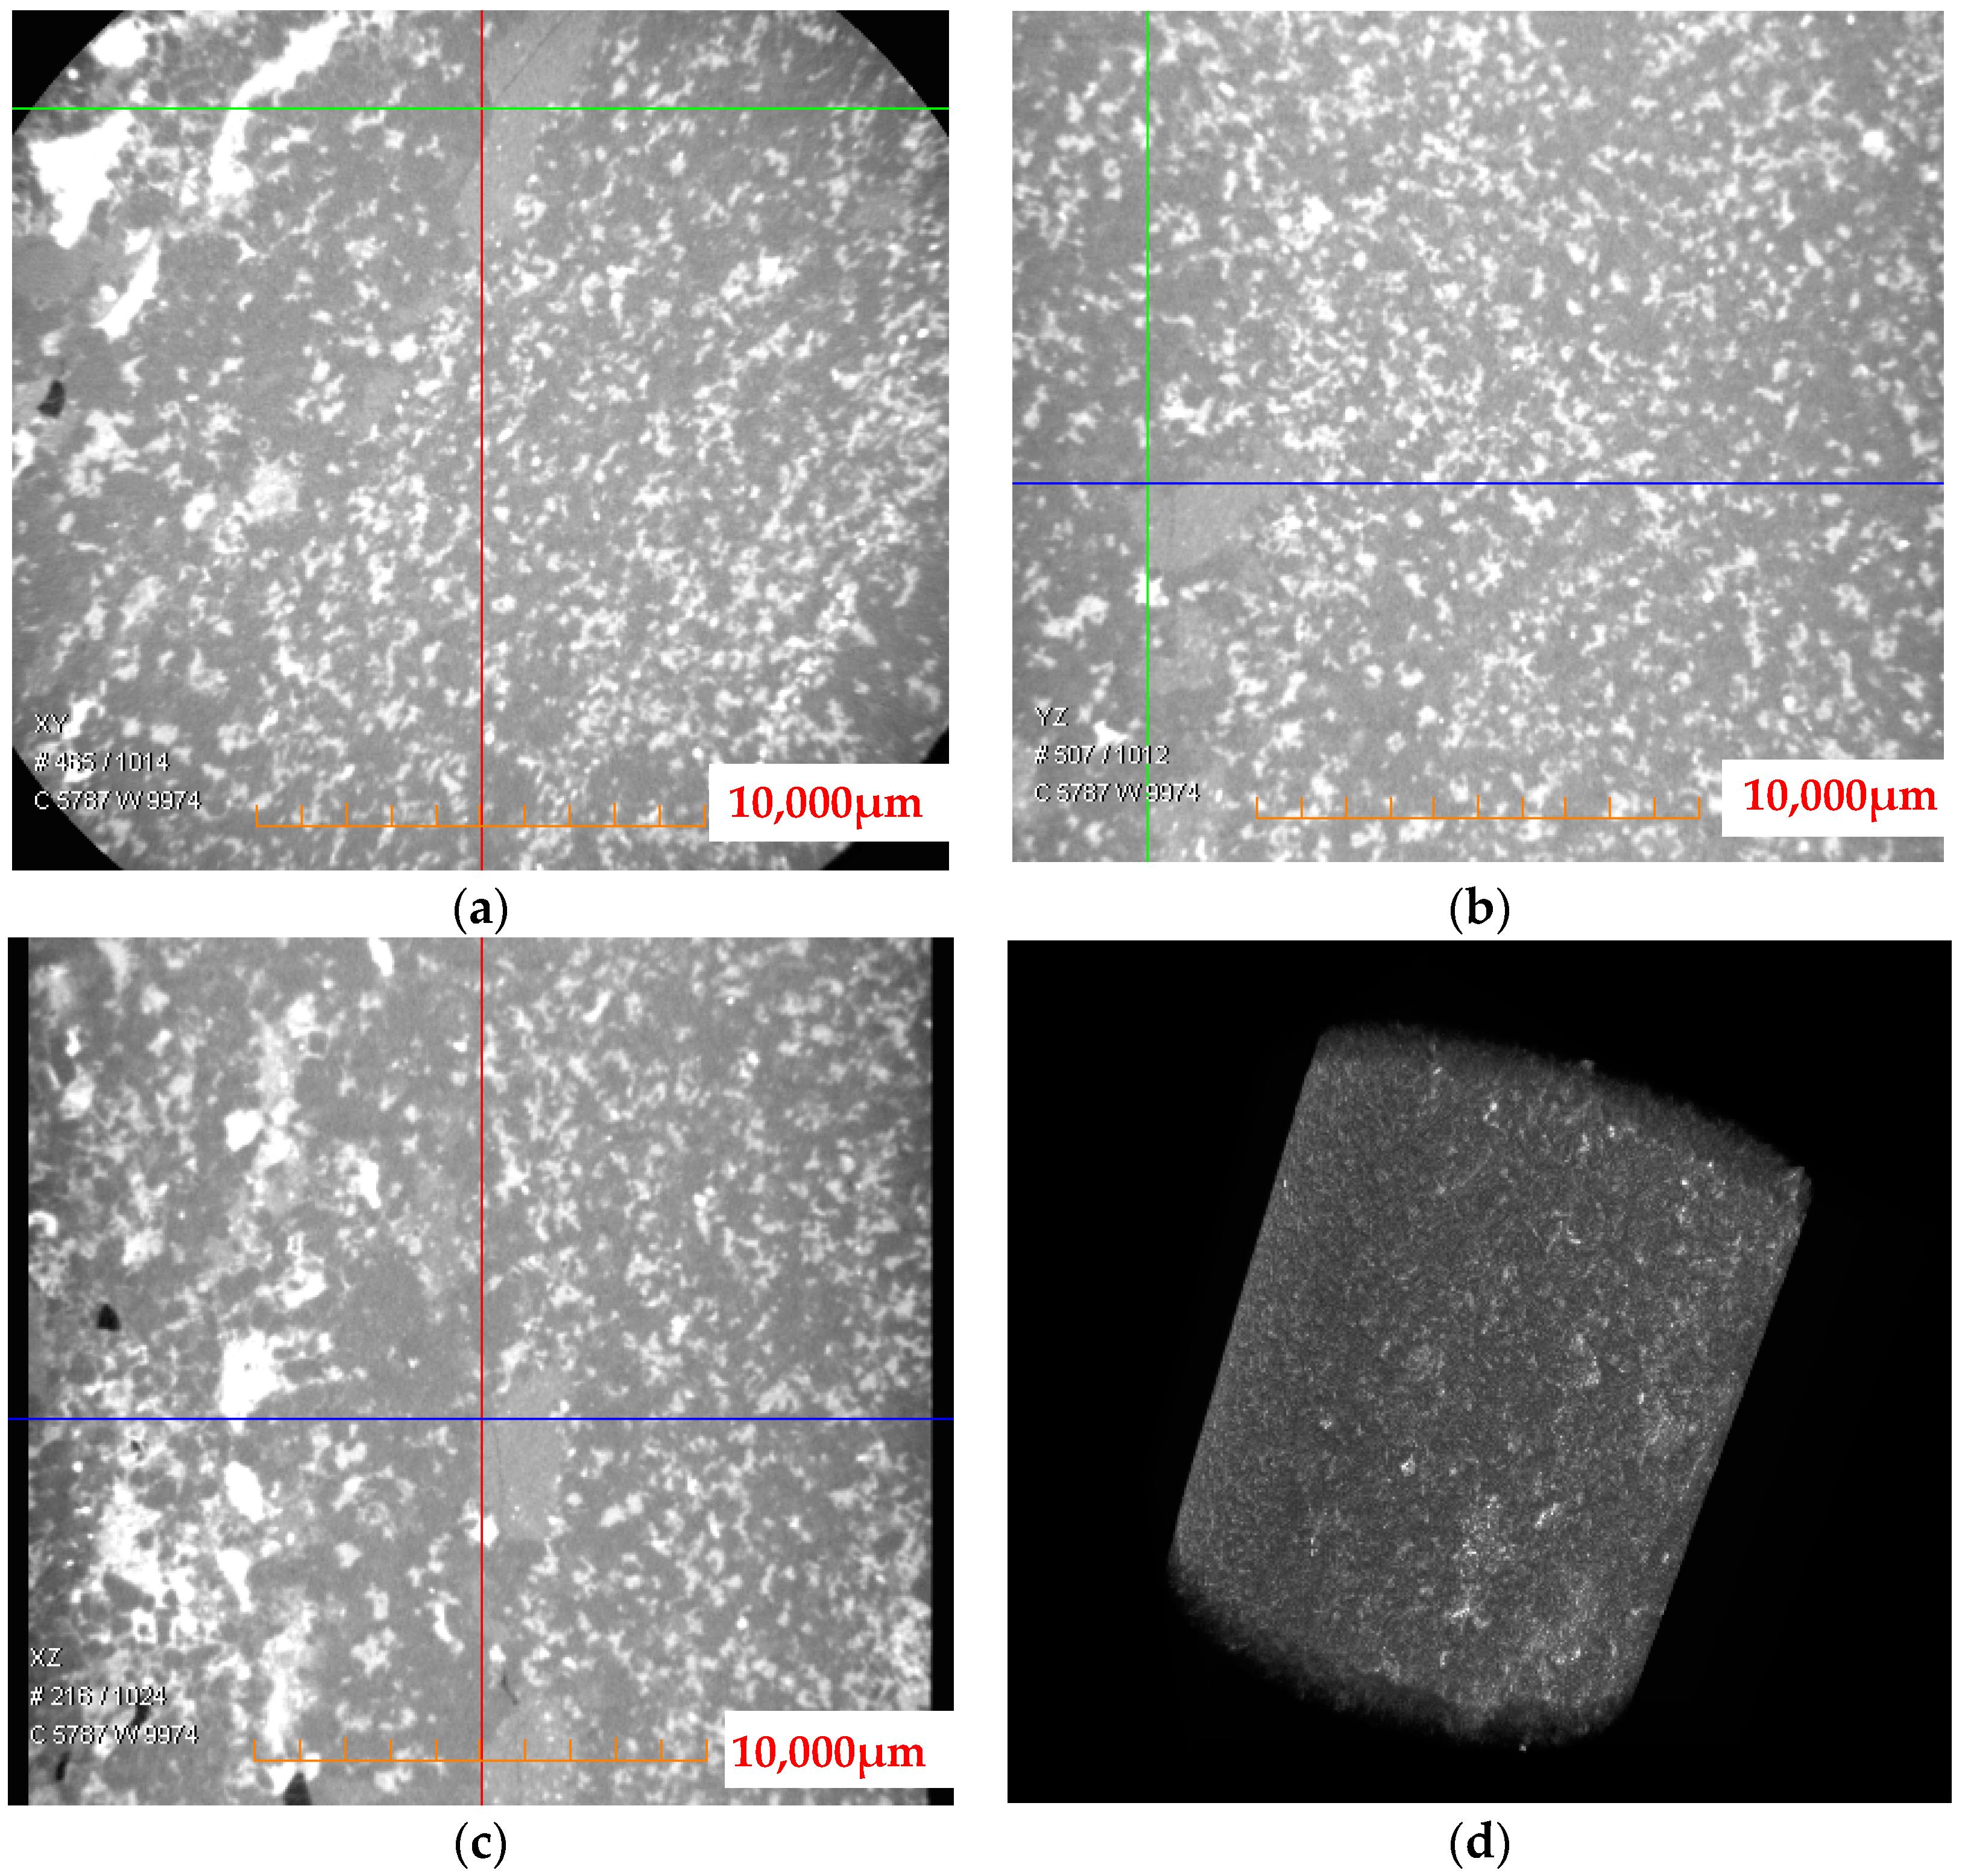
First, the core was placed into the core clamping device, and then a CT scan was conducted when the confining pressure was 0 MPa. The relative positions of the CT X-ray source, detector, and sample before scanning were adjusted so that a 3D core image of 0 MPa was obtained [42].
(2)
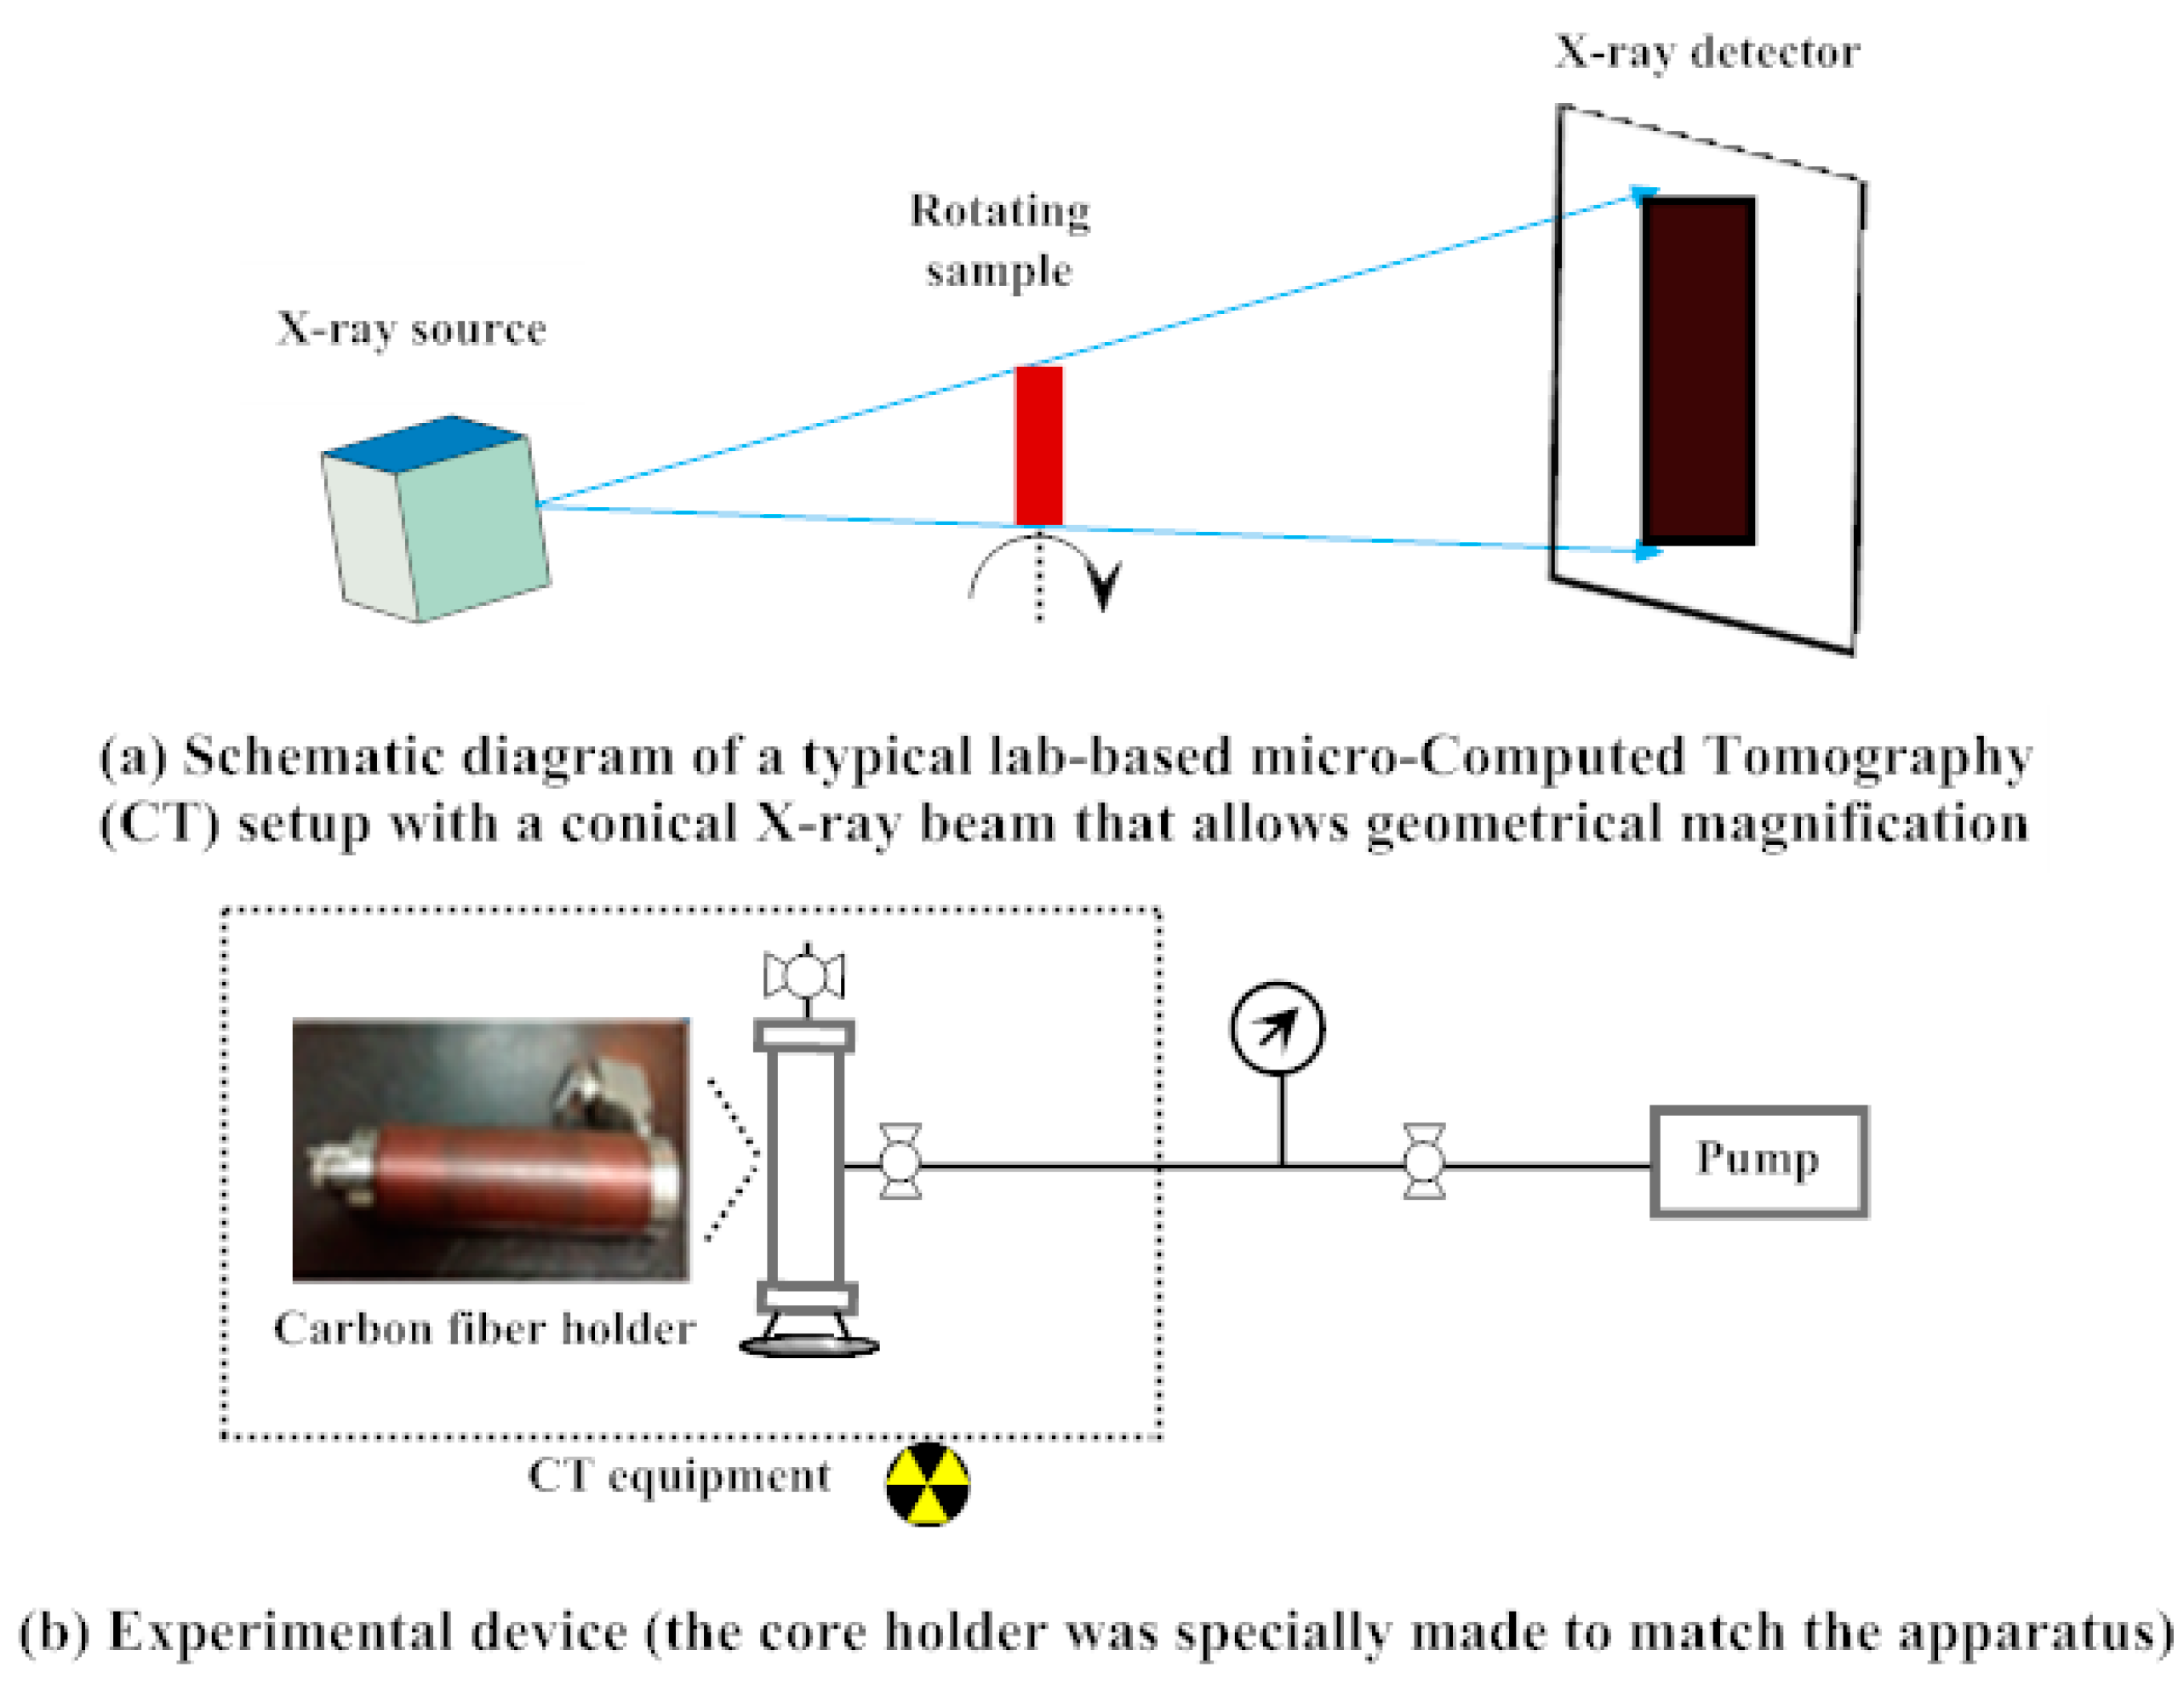
The second step was to assemble the hand pump, pressure gage, valve, pipeline, and clamp holder together as per Figure 4, then increase the confining at the step of 0.2 MPa.
(3)
At each pressure point in the case of loading, that confining pressure was maintained for 1 h to allow the load to dissipate through the sample before a scan was taken; all conditions are kept the same as outlined in Step 1.
(4)
In the case of unloading, the confining pressure was slowly reduced from the maximum confining pressure of 5.4 MPa to 4.0 MPa, then reduced by a step of 1 MPa down to 0 MPa.
(5)
Same as in the loading case; each confining pressure was maintained for 1 h before scanning.
(6)
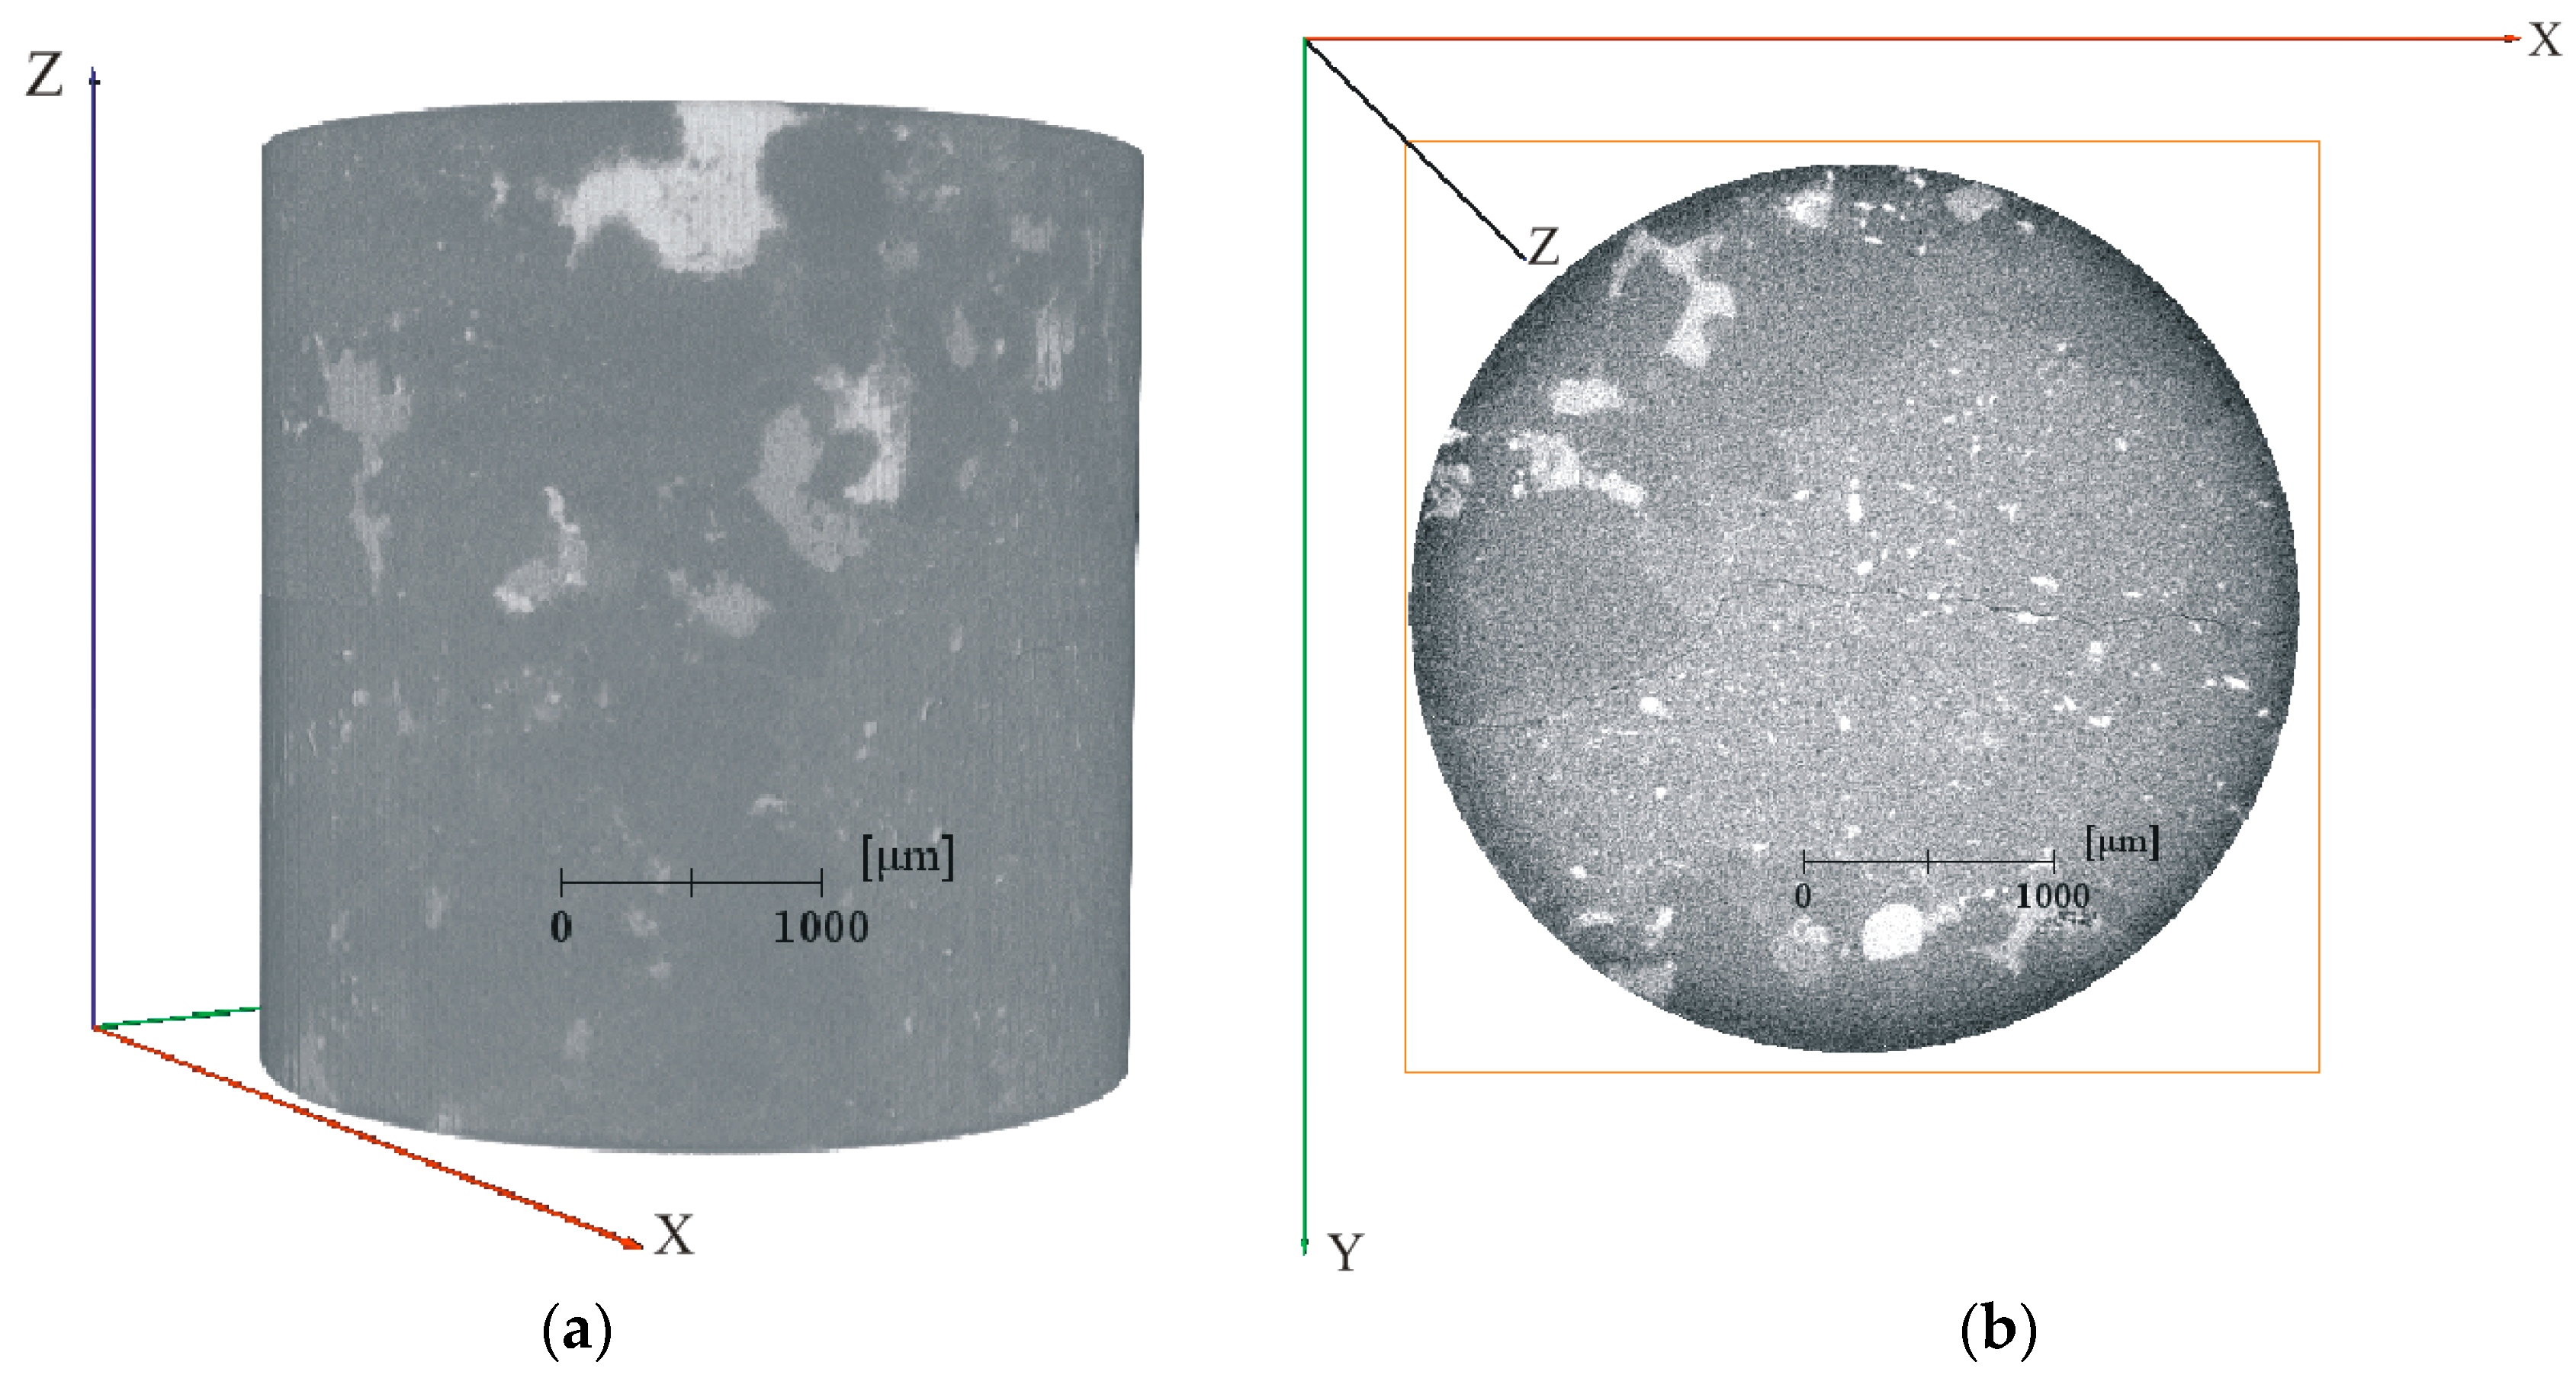
Then we extracted the fracture aperture from all scanned image volumes of 400 × 400 × 400 pixel3. Pre-processing was applied to every image before being segmented. The image was processed, then the pictures were segmented. Finally, the 3D digital core of the fracture was obtained.
(7)
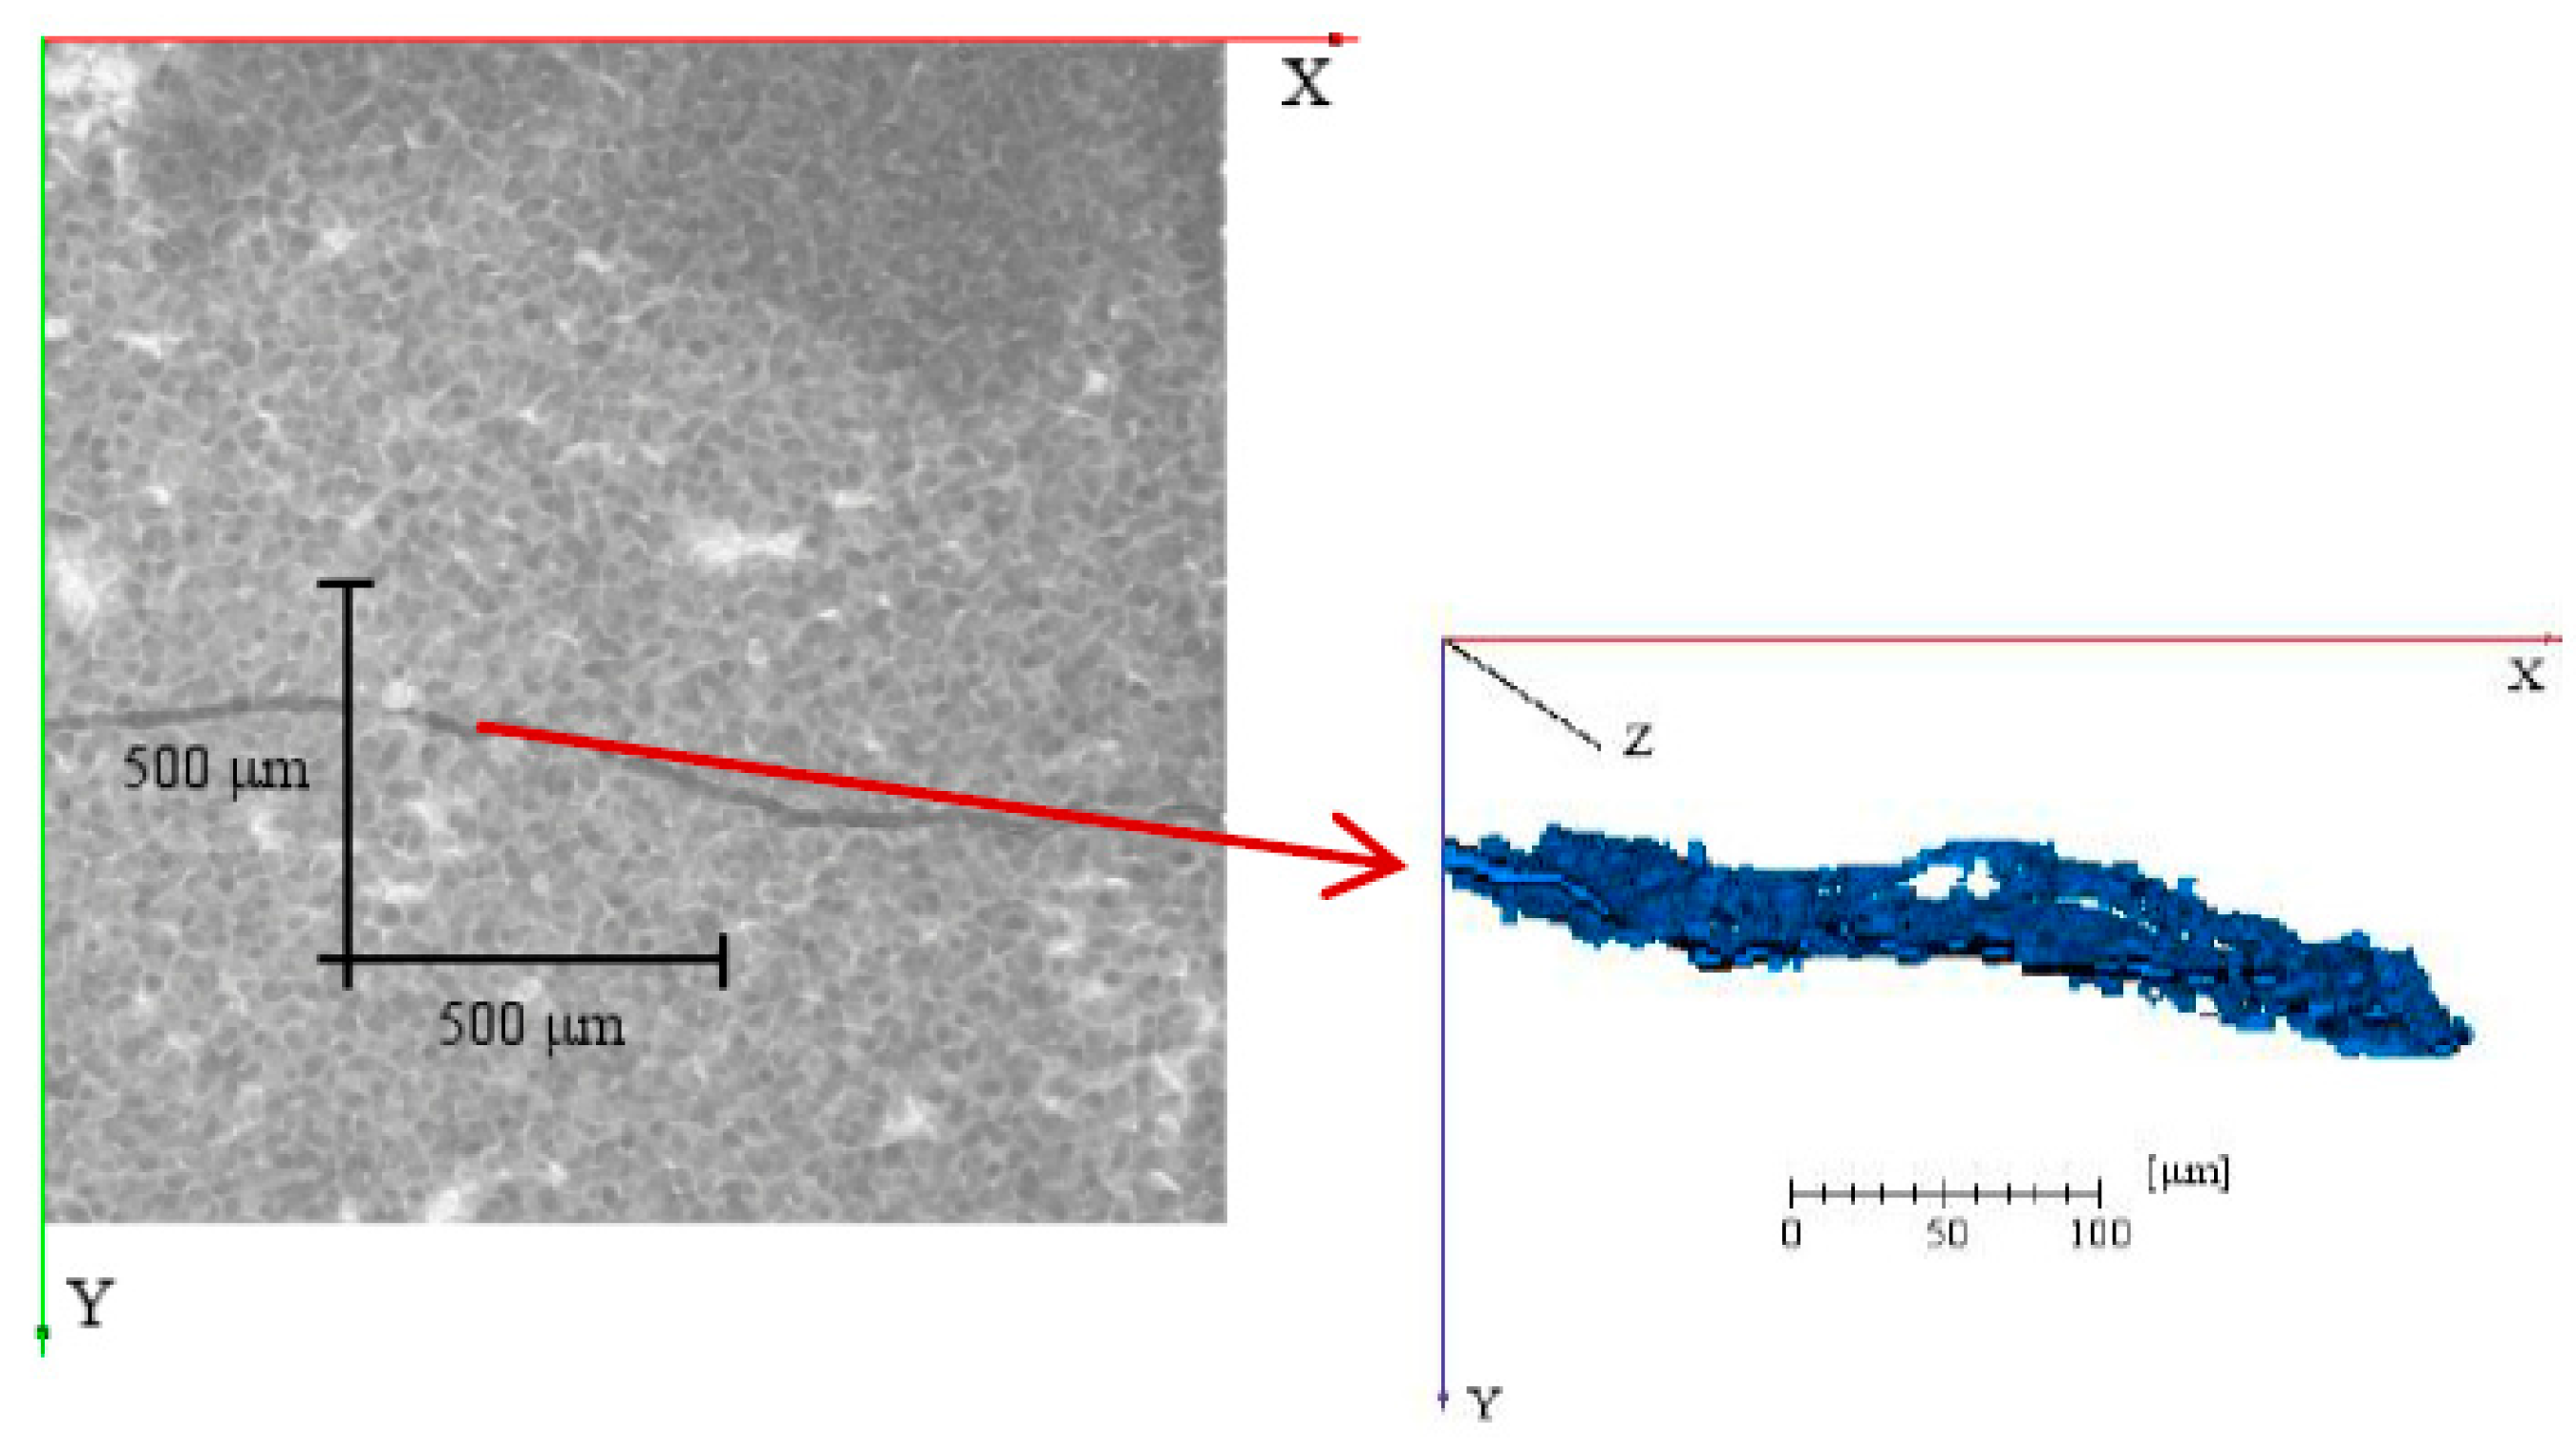
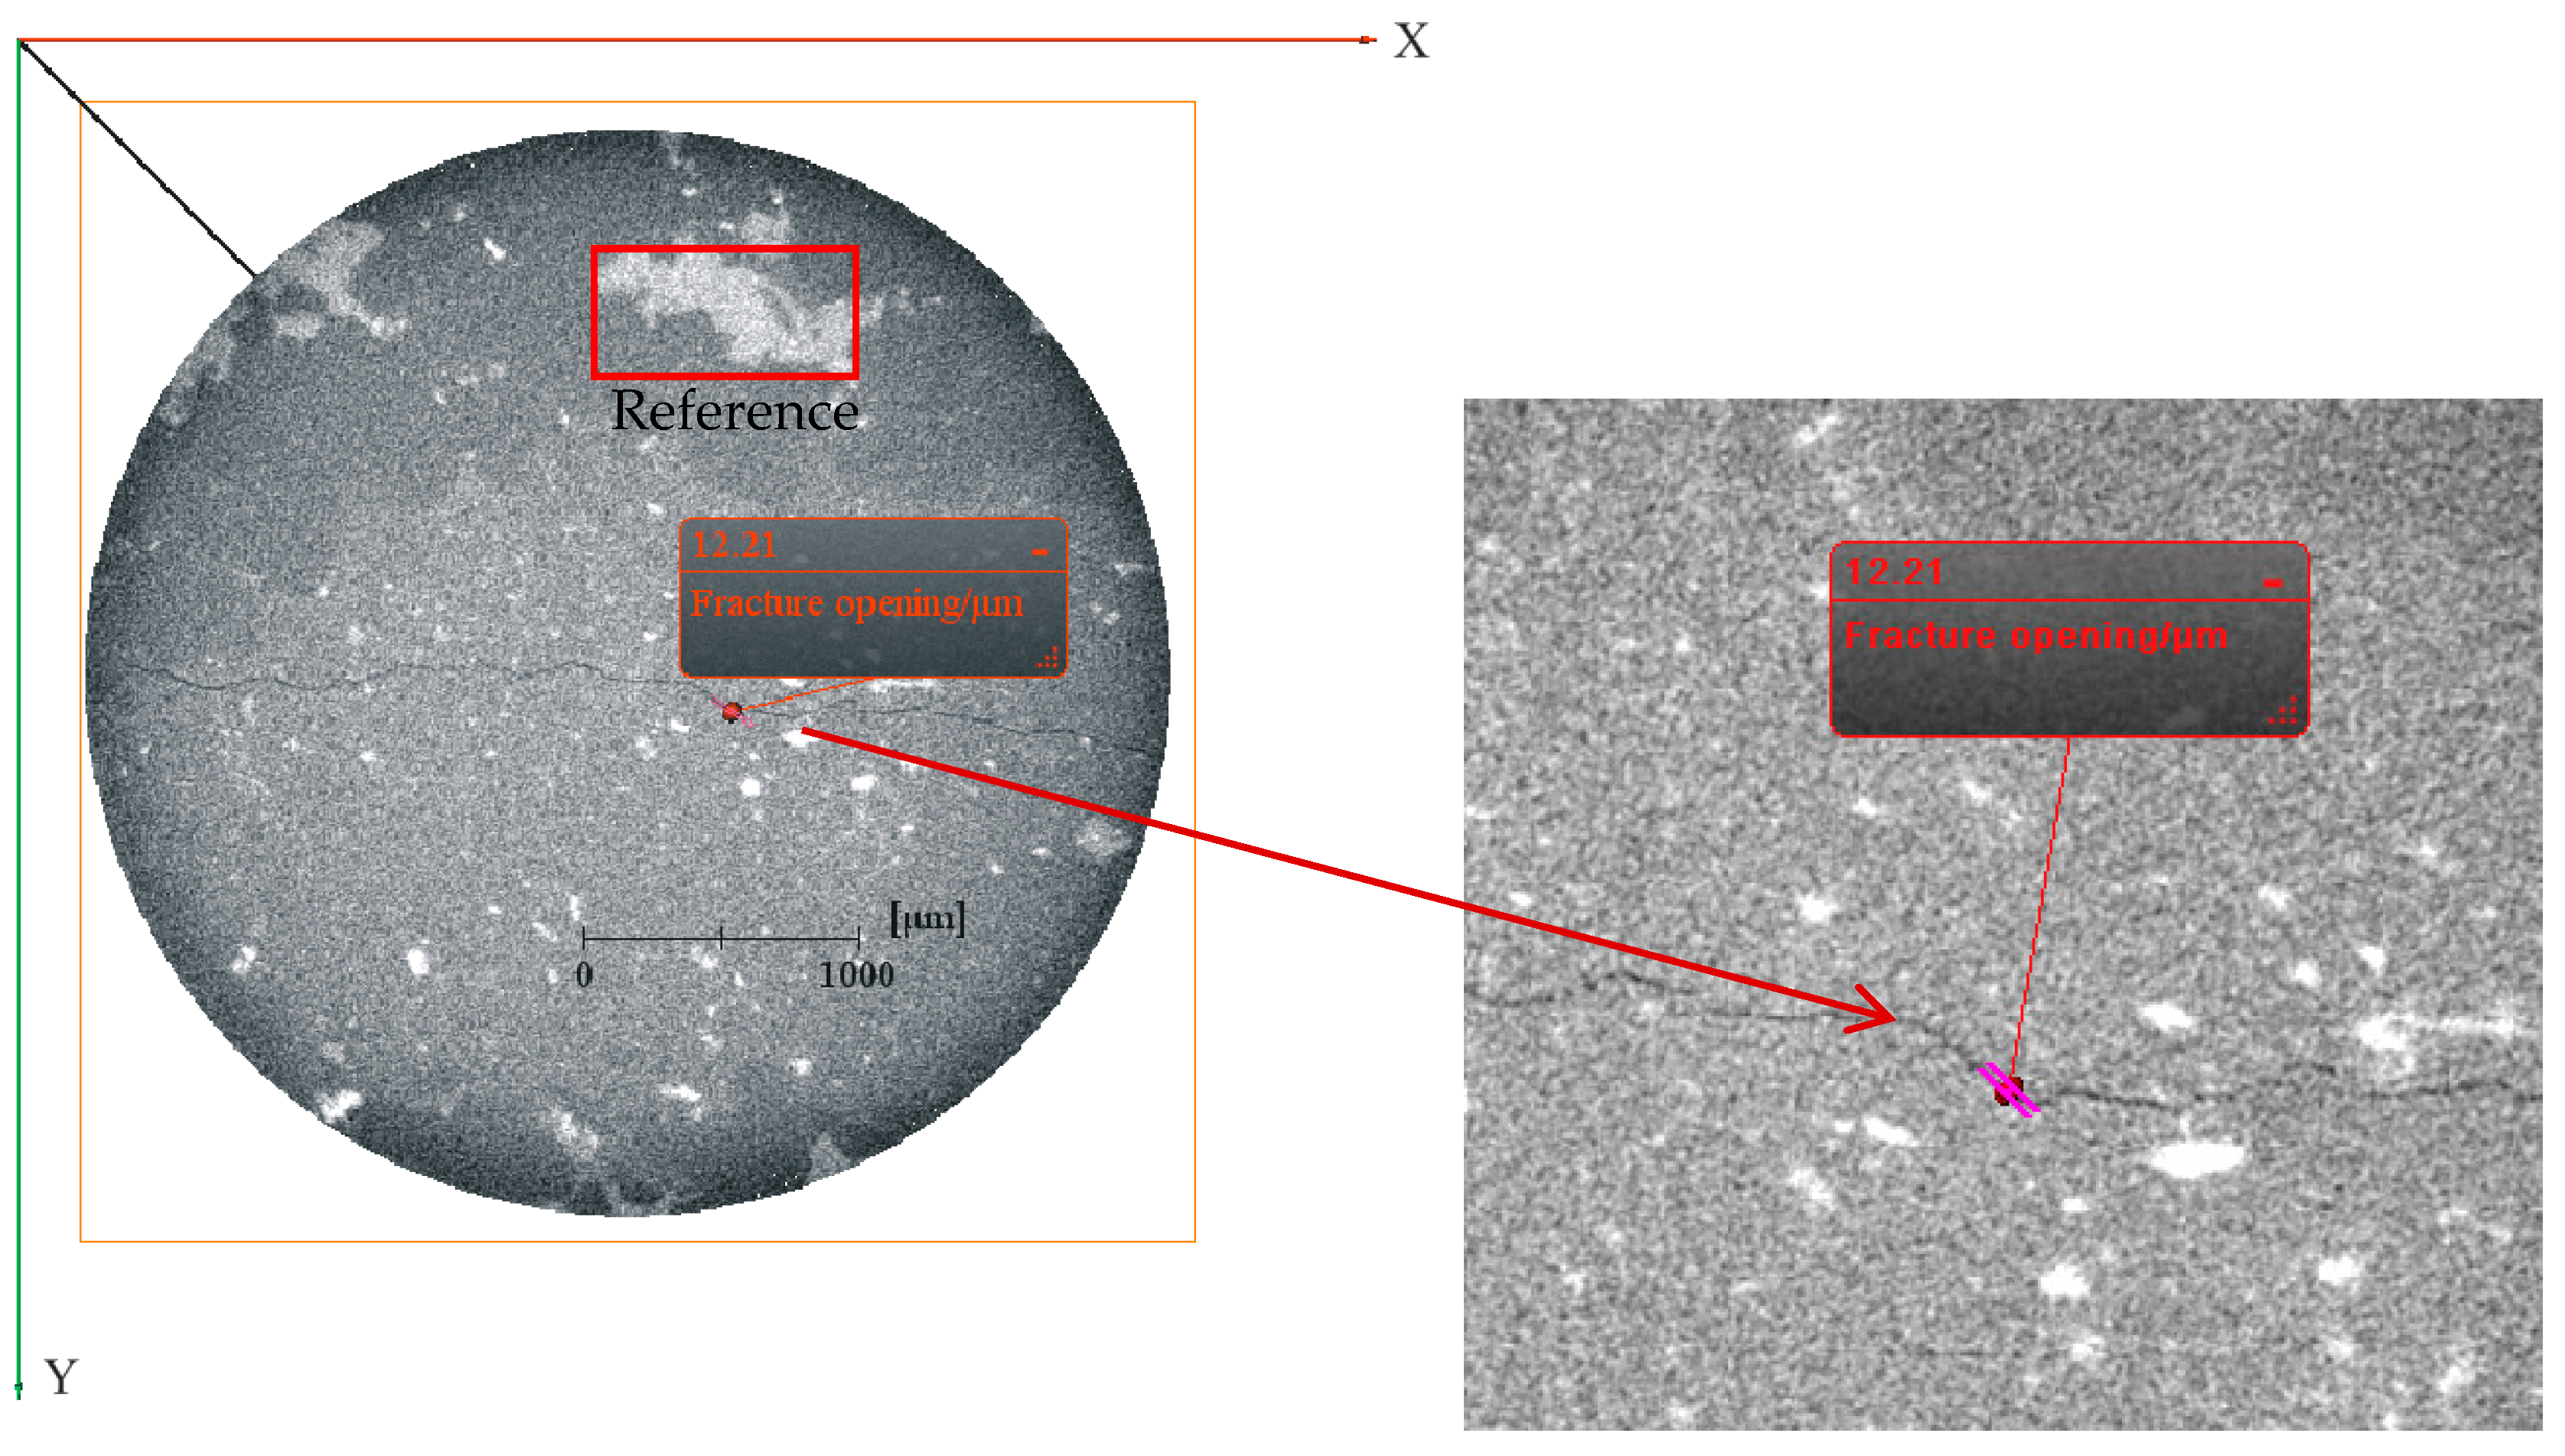
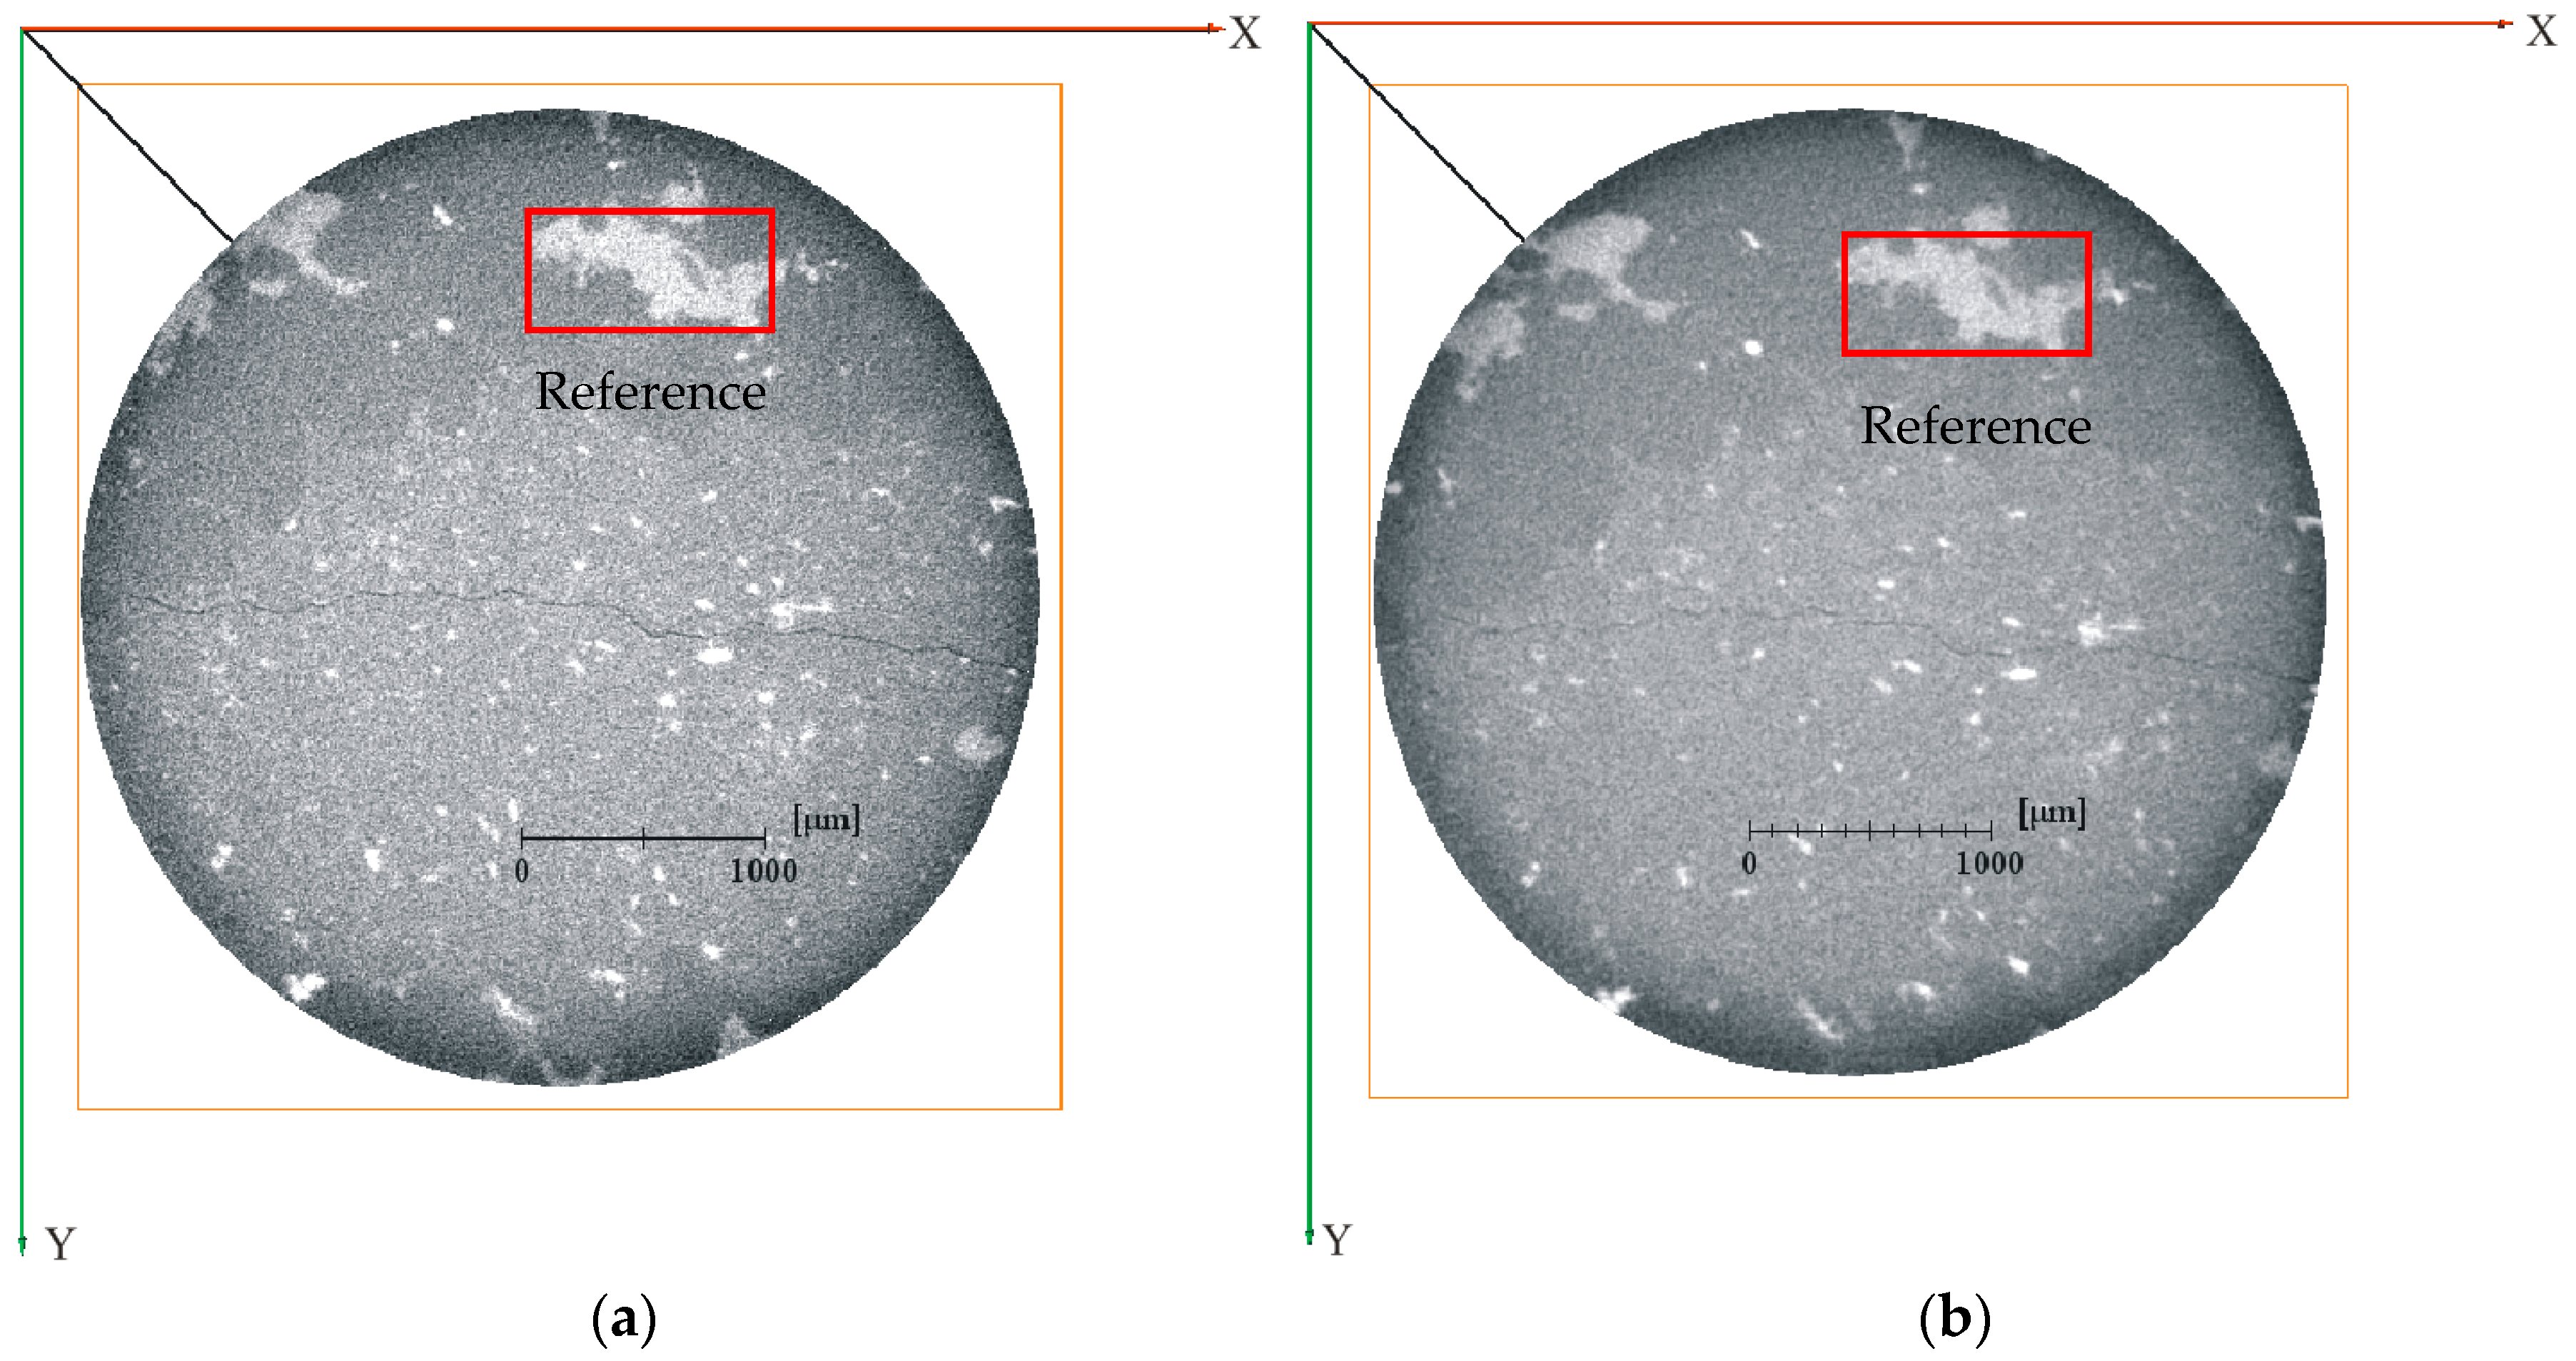
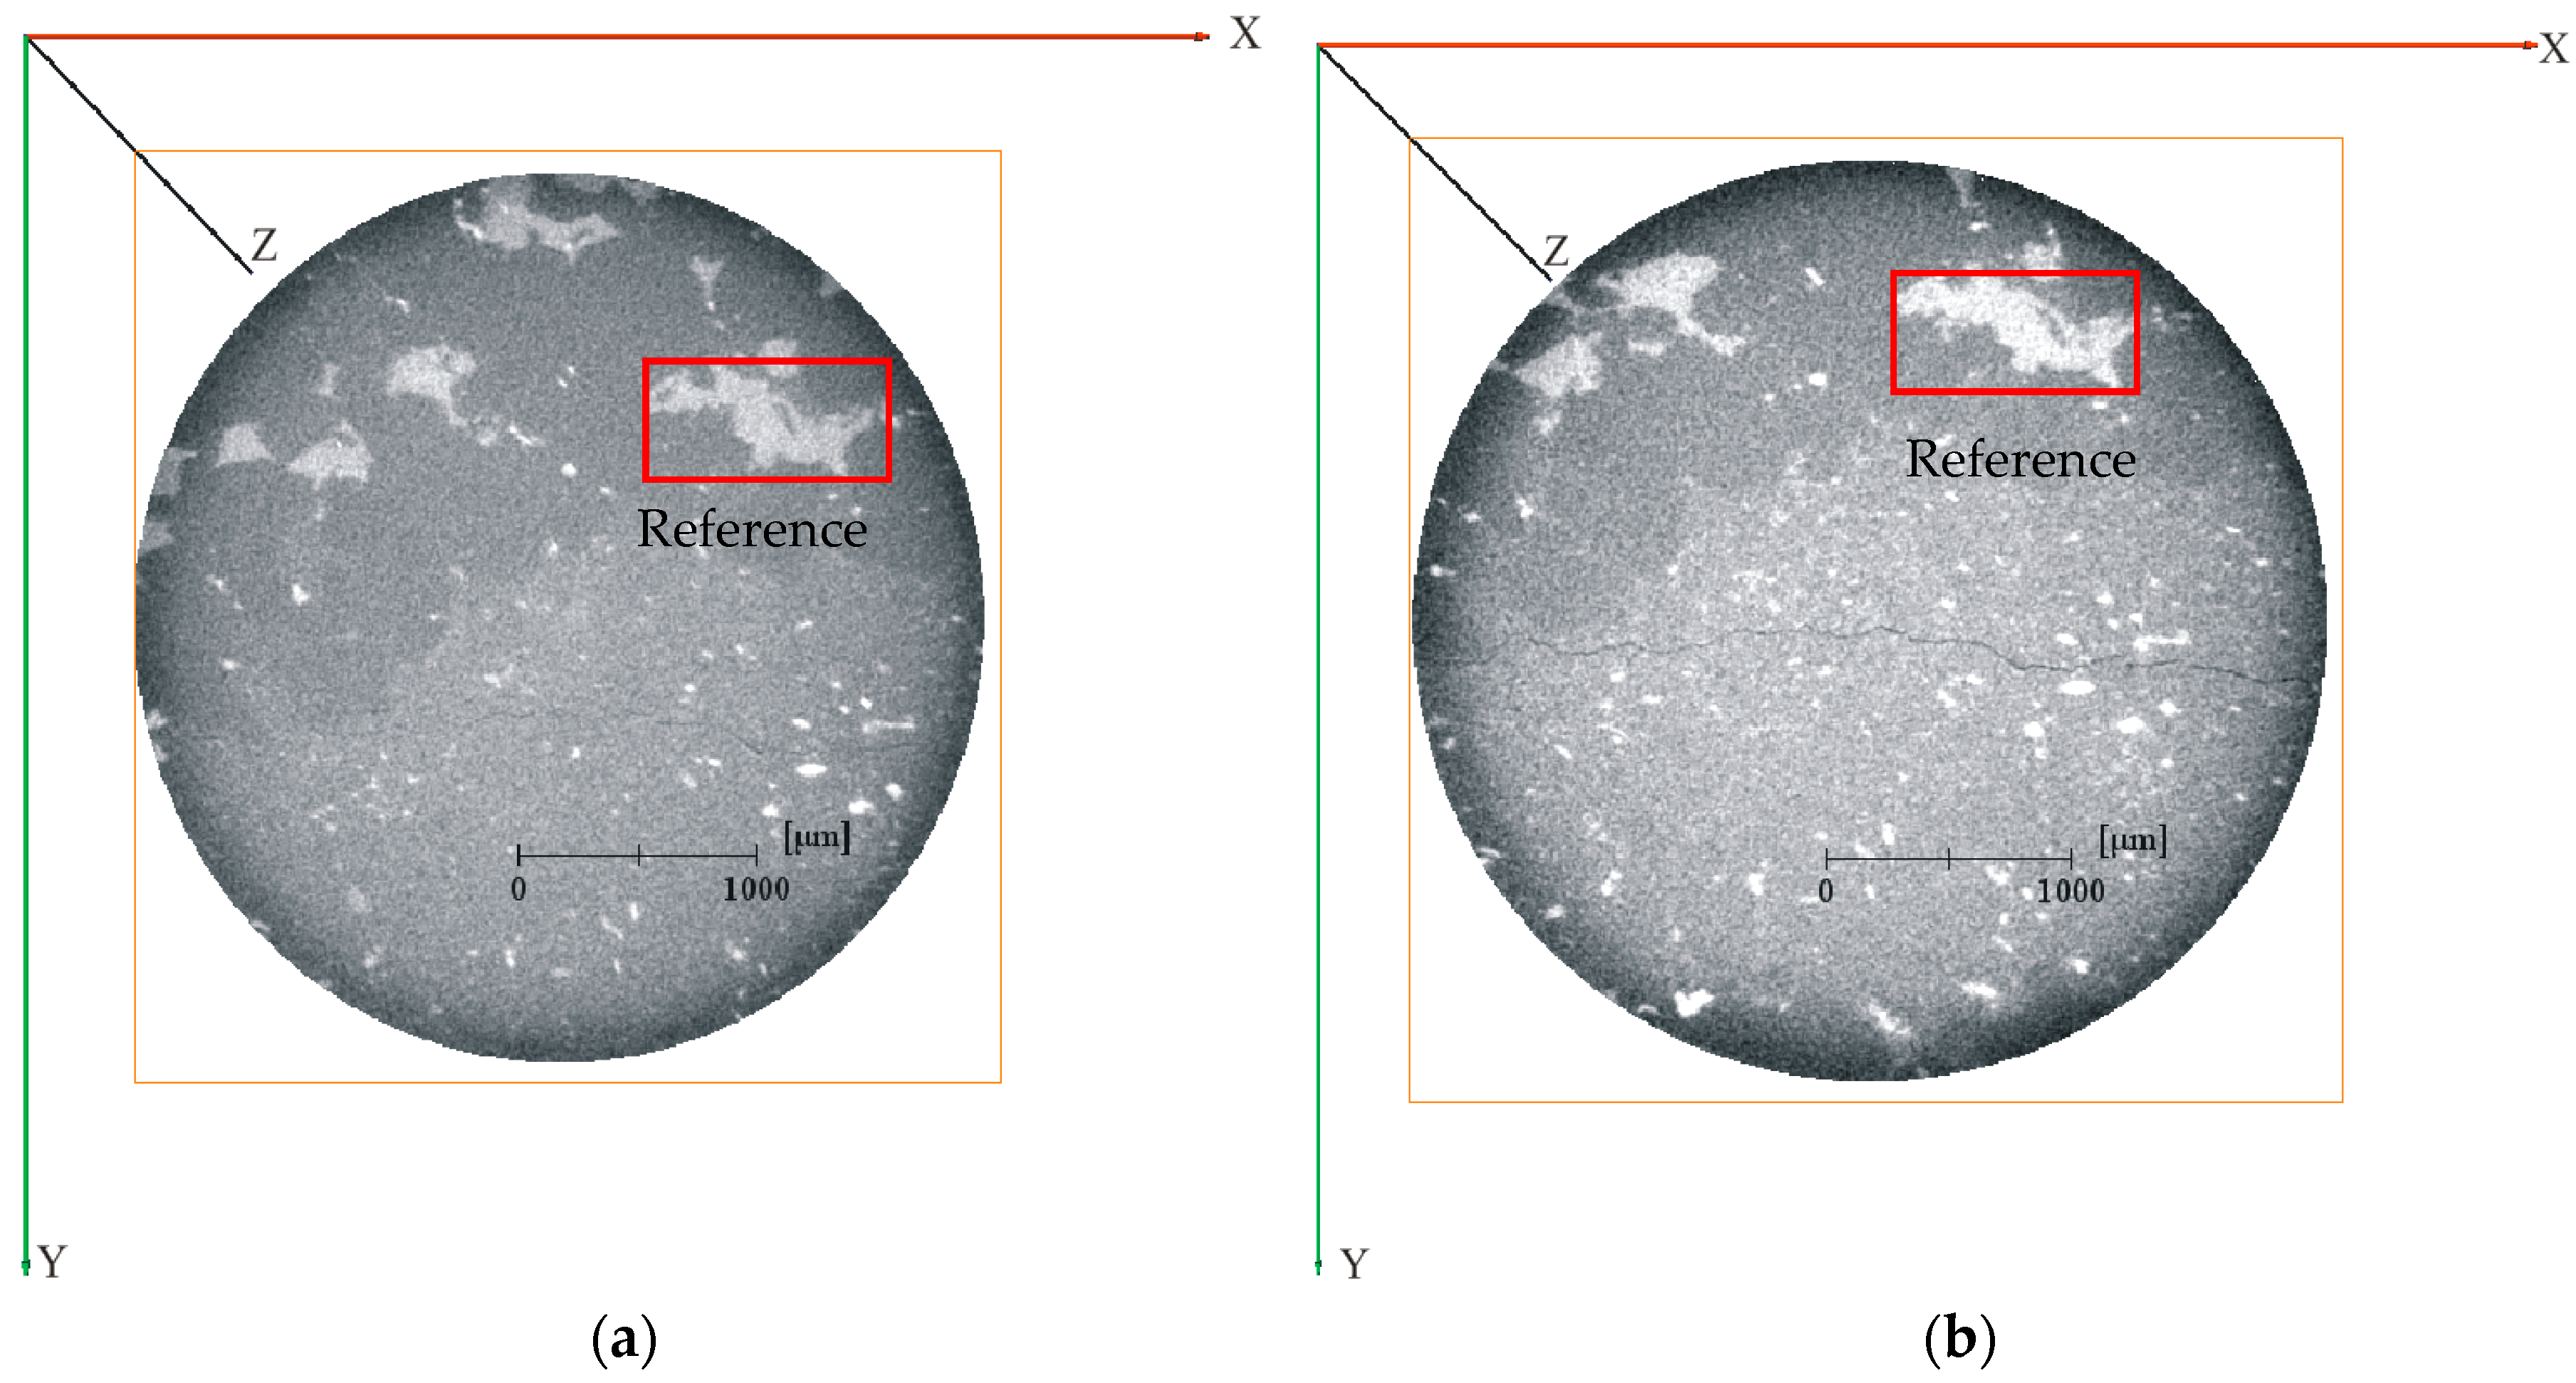
The same location of the fractures was found by using the white mineral as the reference in the larger rectangular figure, and by amplifying the two-dimensional (2D) image, as shown in Figure 5. We measured the width of the fracture in loading and unloading cycles.
Using the above steps, we obtained the value of the fracture width under different confining pressures. The experimental results are shown in the following section.

2.4. Experimental Results and Analysis

According to the above steps and method, we obtained the fracture width of different confining pressures (as a point of reference, we measured the fracture width of different confining pressures in the same position). The 2D images of the same position in different confining pressures are shown in Figure 6 and Figure 7.
The width of the fracture was measured at the same position by enlarging the two-dimensional images, as mentioned in Figure 5. Specific results are shown in the following Table 1 and Table 2.
The relationship between fracture width and confining pressure can be obtained by Table 1 and Table 2, as shown in Figure 8.
It can be seen from the data and graph that the change in fracture width had a non-linear relationship with the change in confining pressure. With an increase in confining pressure, the fracture width decreased, and the fracture width had a larger decrease from 0 MPa to 0.6 MPa in comparison to the other stages, which showed that the rock had strong stress sensitivity at a stage of low effective stress. After 0.6 MPa, the change gradient of the fracture width was obviously weakened, and after 2.6 MPa, the variation was very small, which showed that at a stage of high effective stress, the stress sensitivity of the rock samples weakened. With a decrease in confining pressure, the fracture opening increased, but it could not recover its initial condition.

3. Pore-Scale Simulations

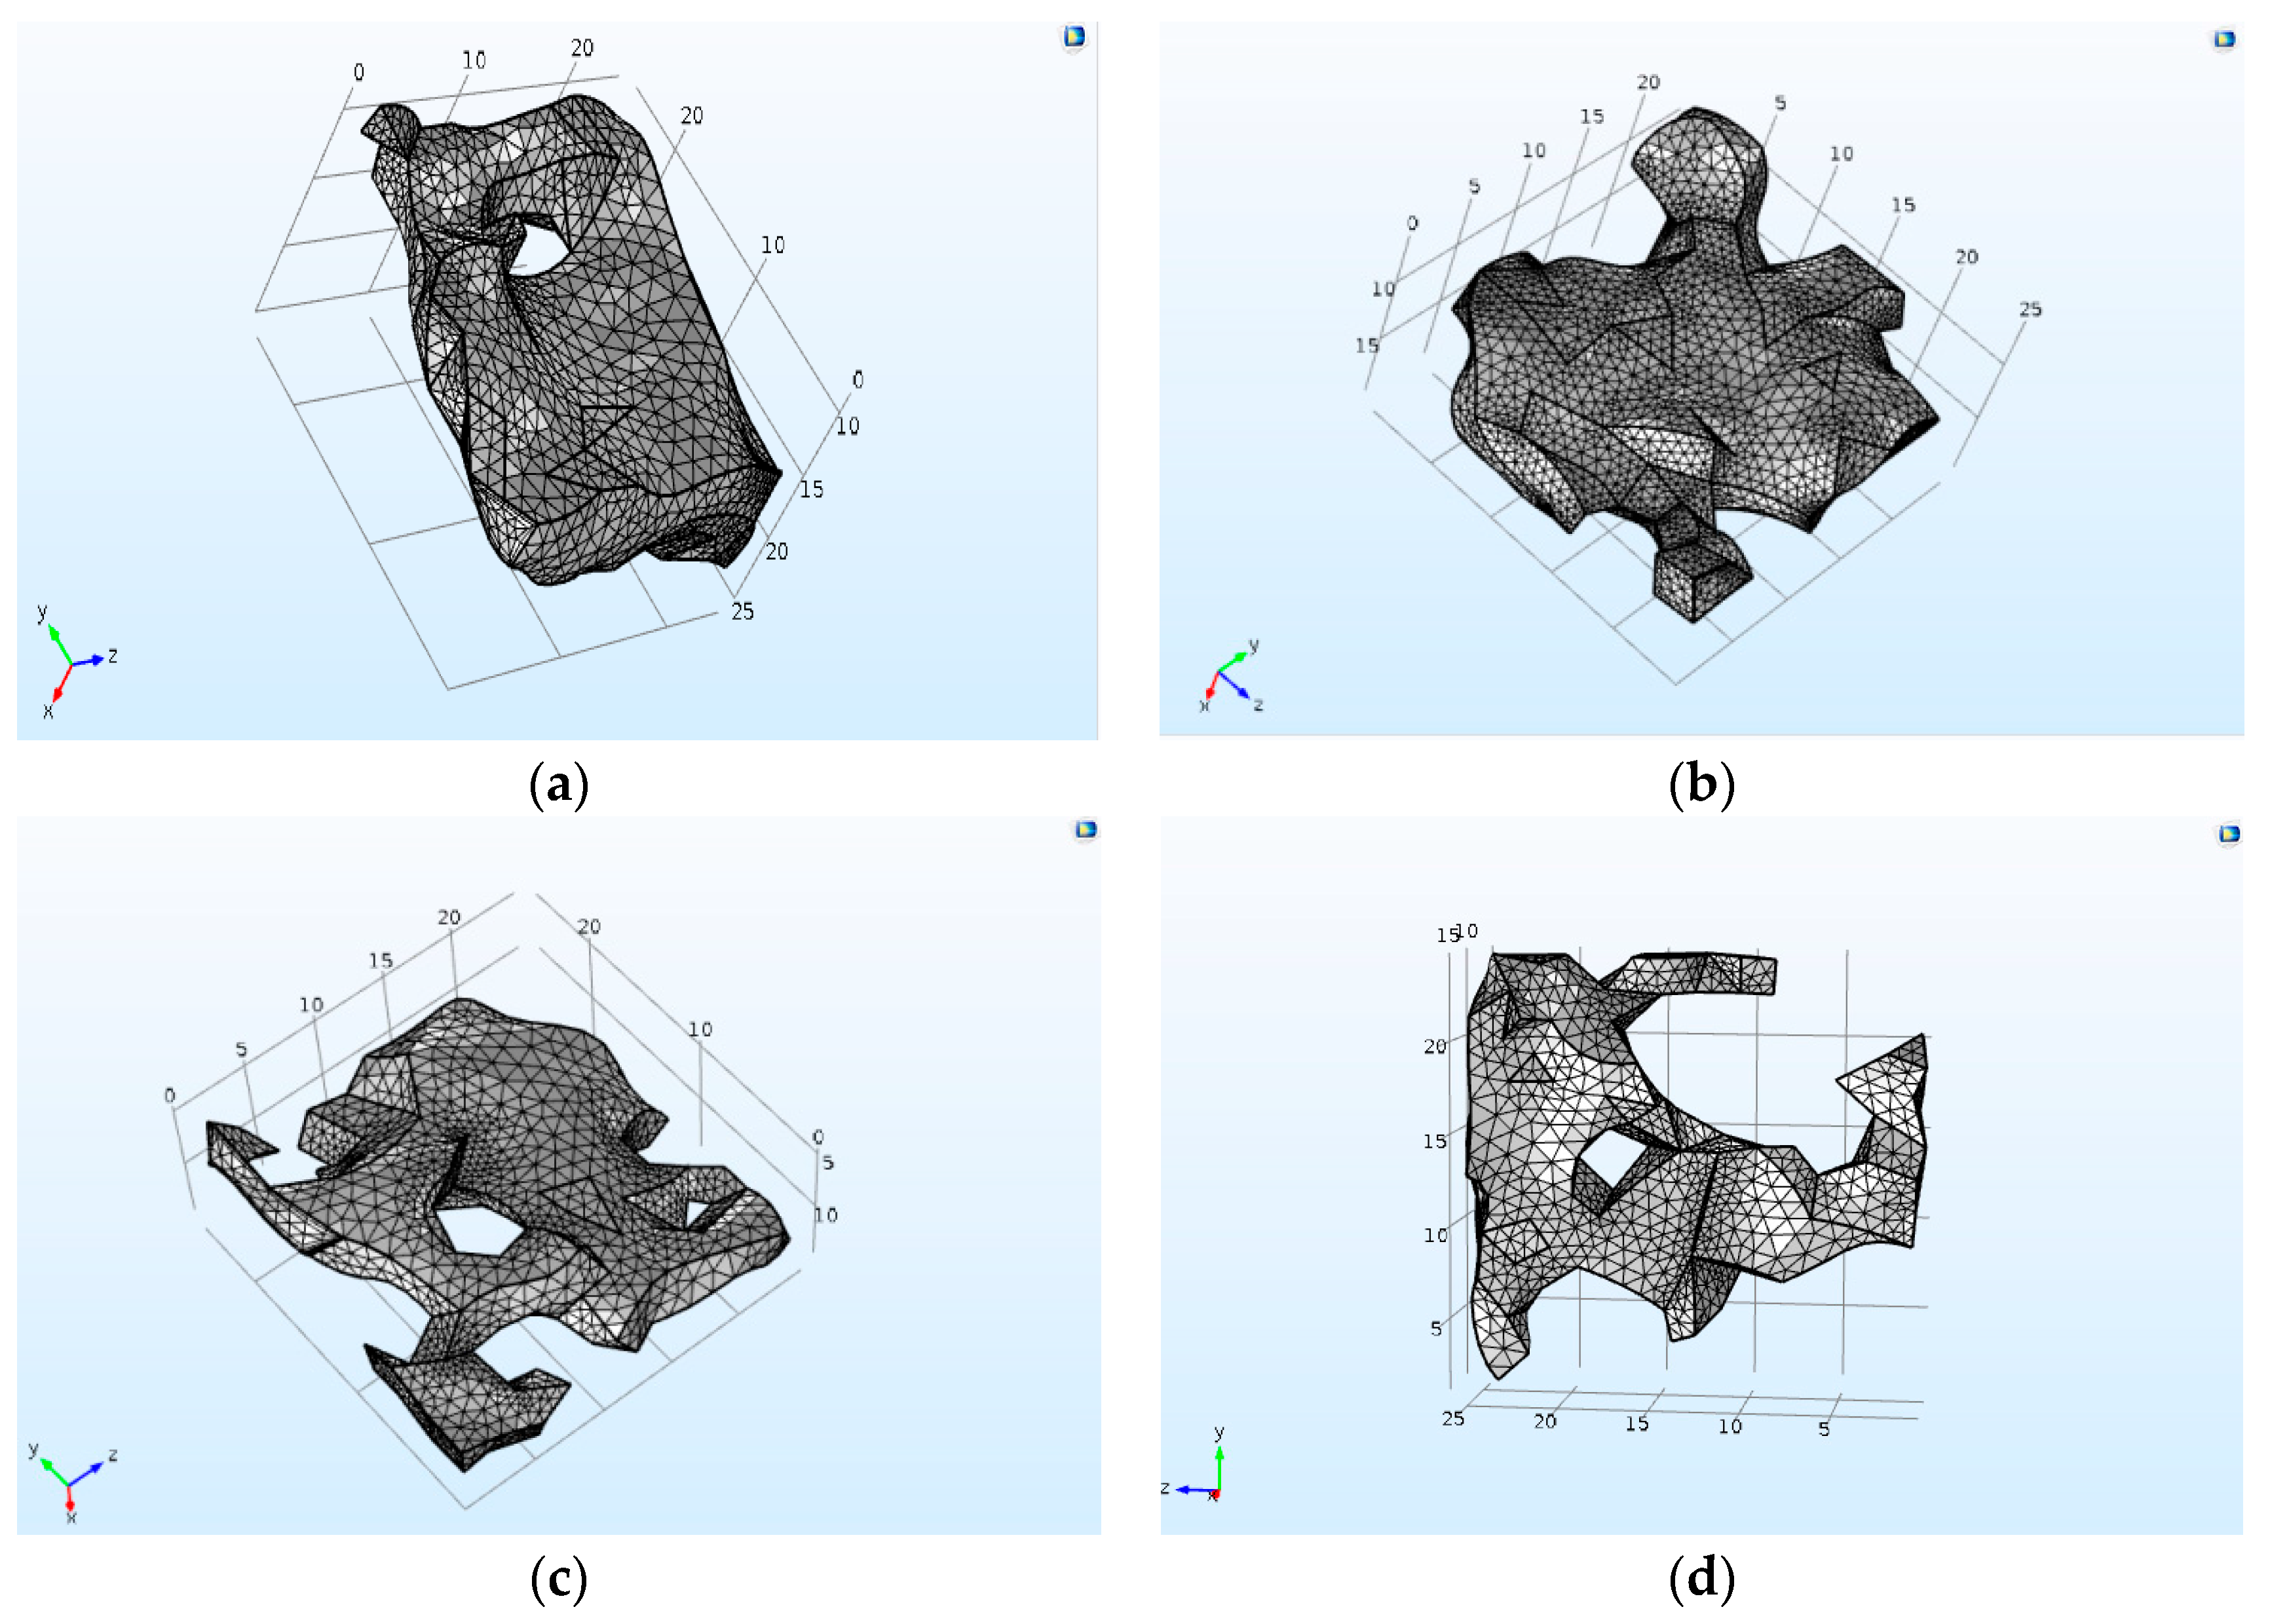
3.1. Mesh Generation

Based on the digital cores of the fractures, we used iso2mesh to grid the digital core of the fracture. Iso2mesh is a simple yet powerful mesh generator that creates a finite-element mesh from surfaces or arbitrary 3D volumetric images with fully automatic workflows [38].
When the meshes were generated, the stereo lithography (STL) file was output. Due to the low porosity and the complex structure of the fractured carbonate rock, errors may have occurred in the grid division; in these cases, the software will not run normally. Thus, the structure should first be smoothed, and then better tetrahedral meshes can be generated. This is the foundation of the pore-scale simulations.
Figure 9 shows the meshes of different effective stress levels.

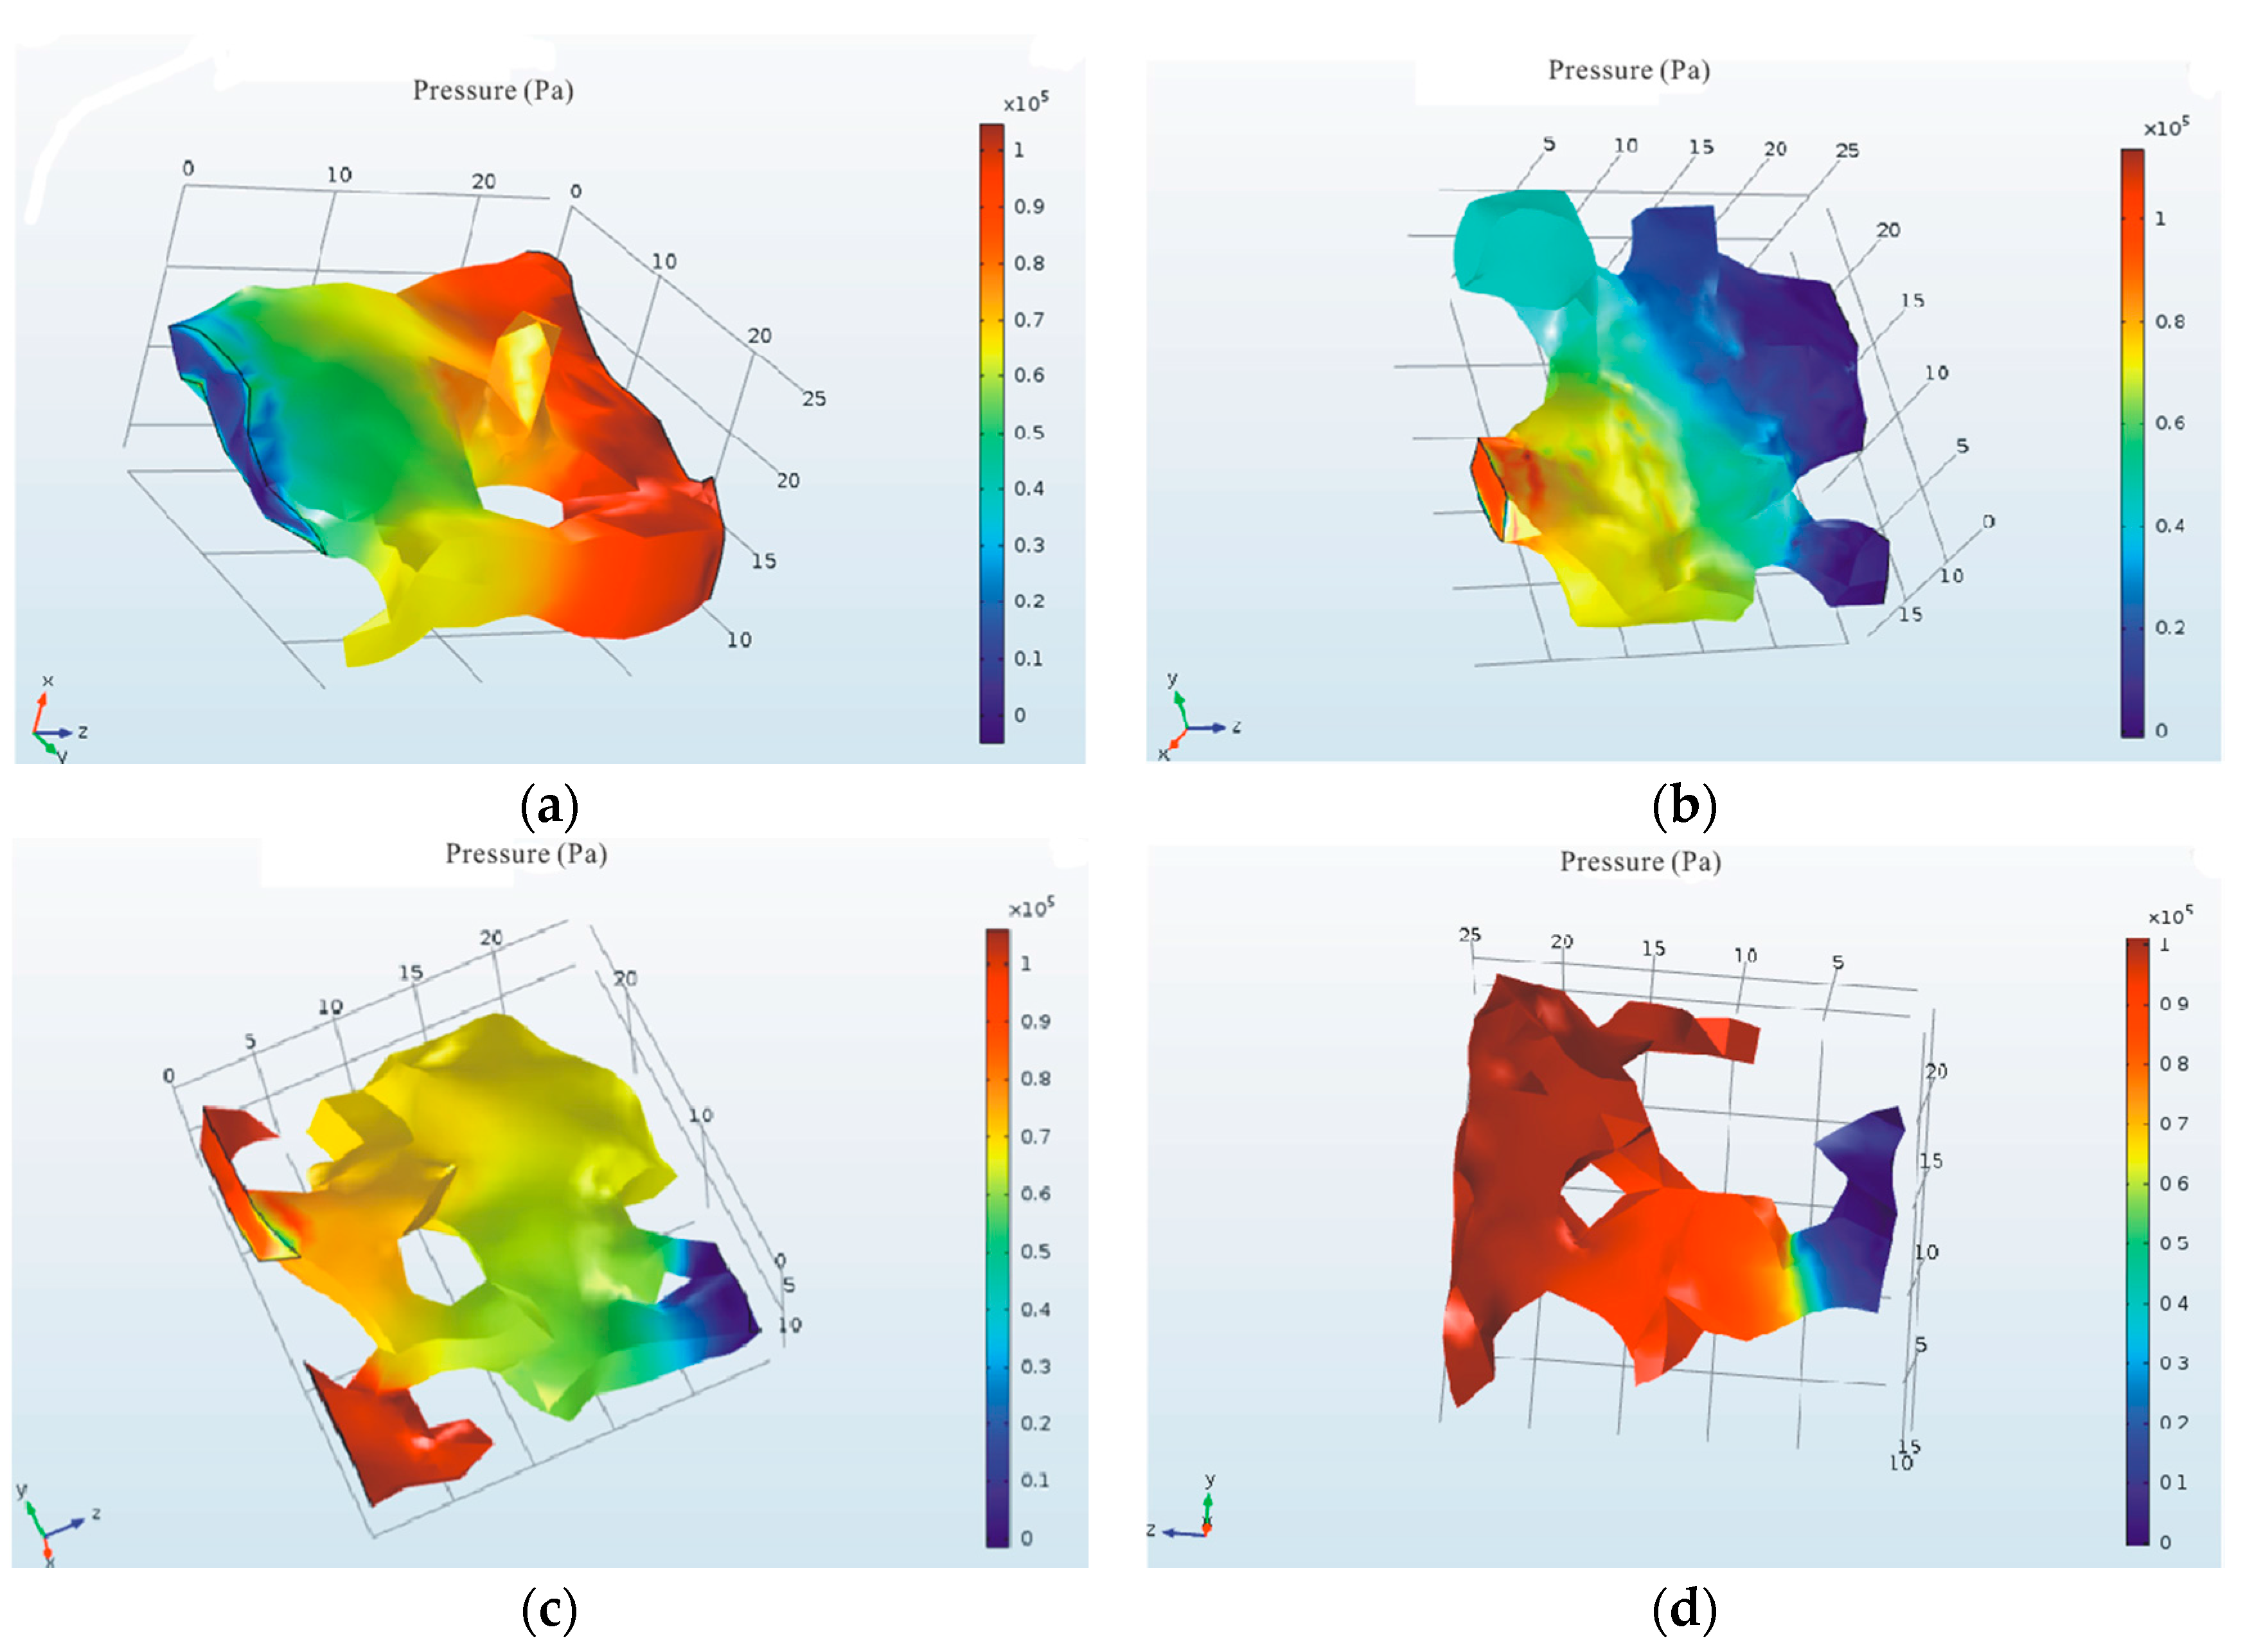
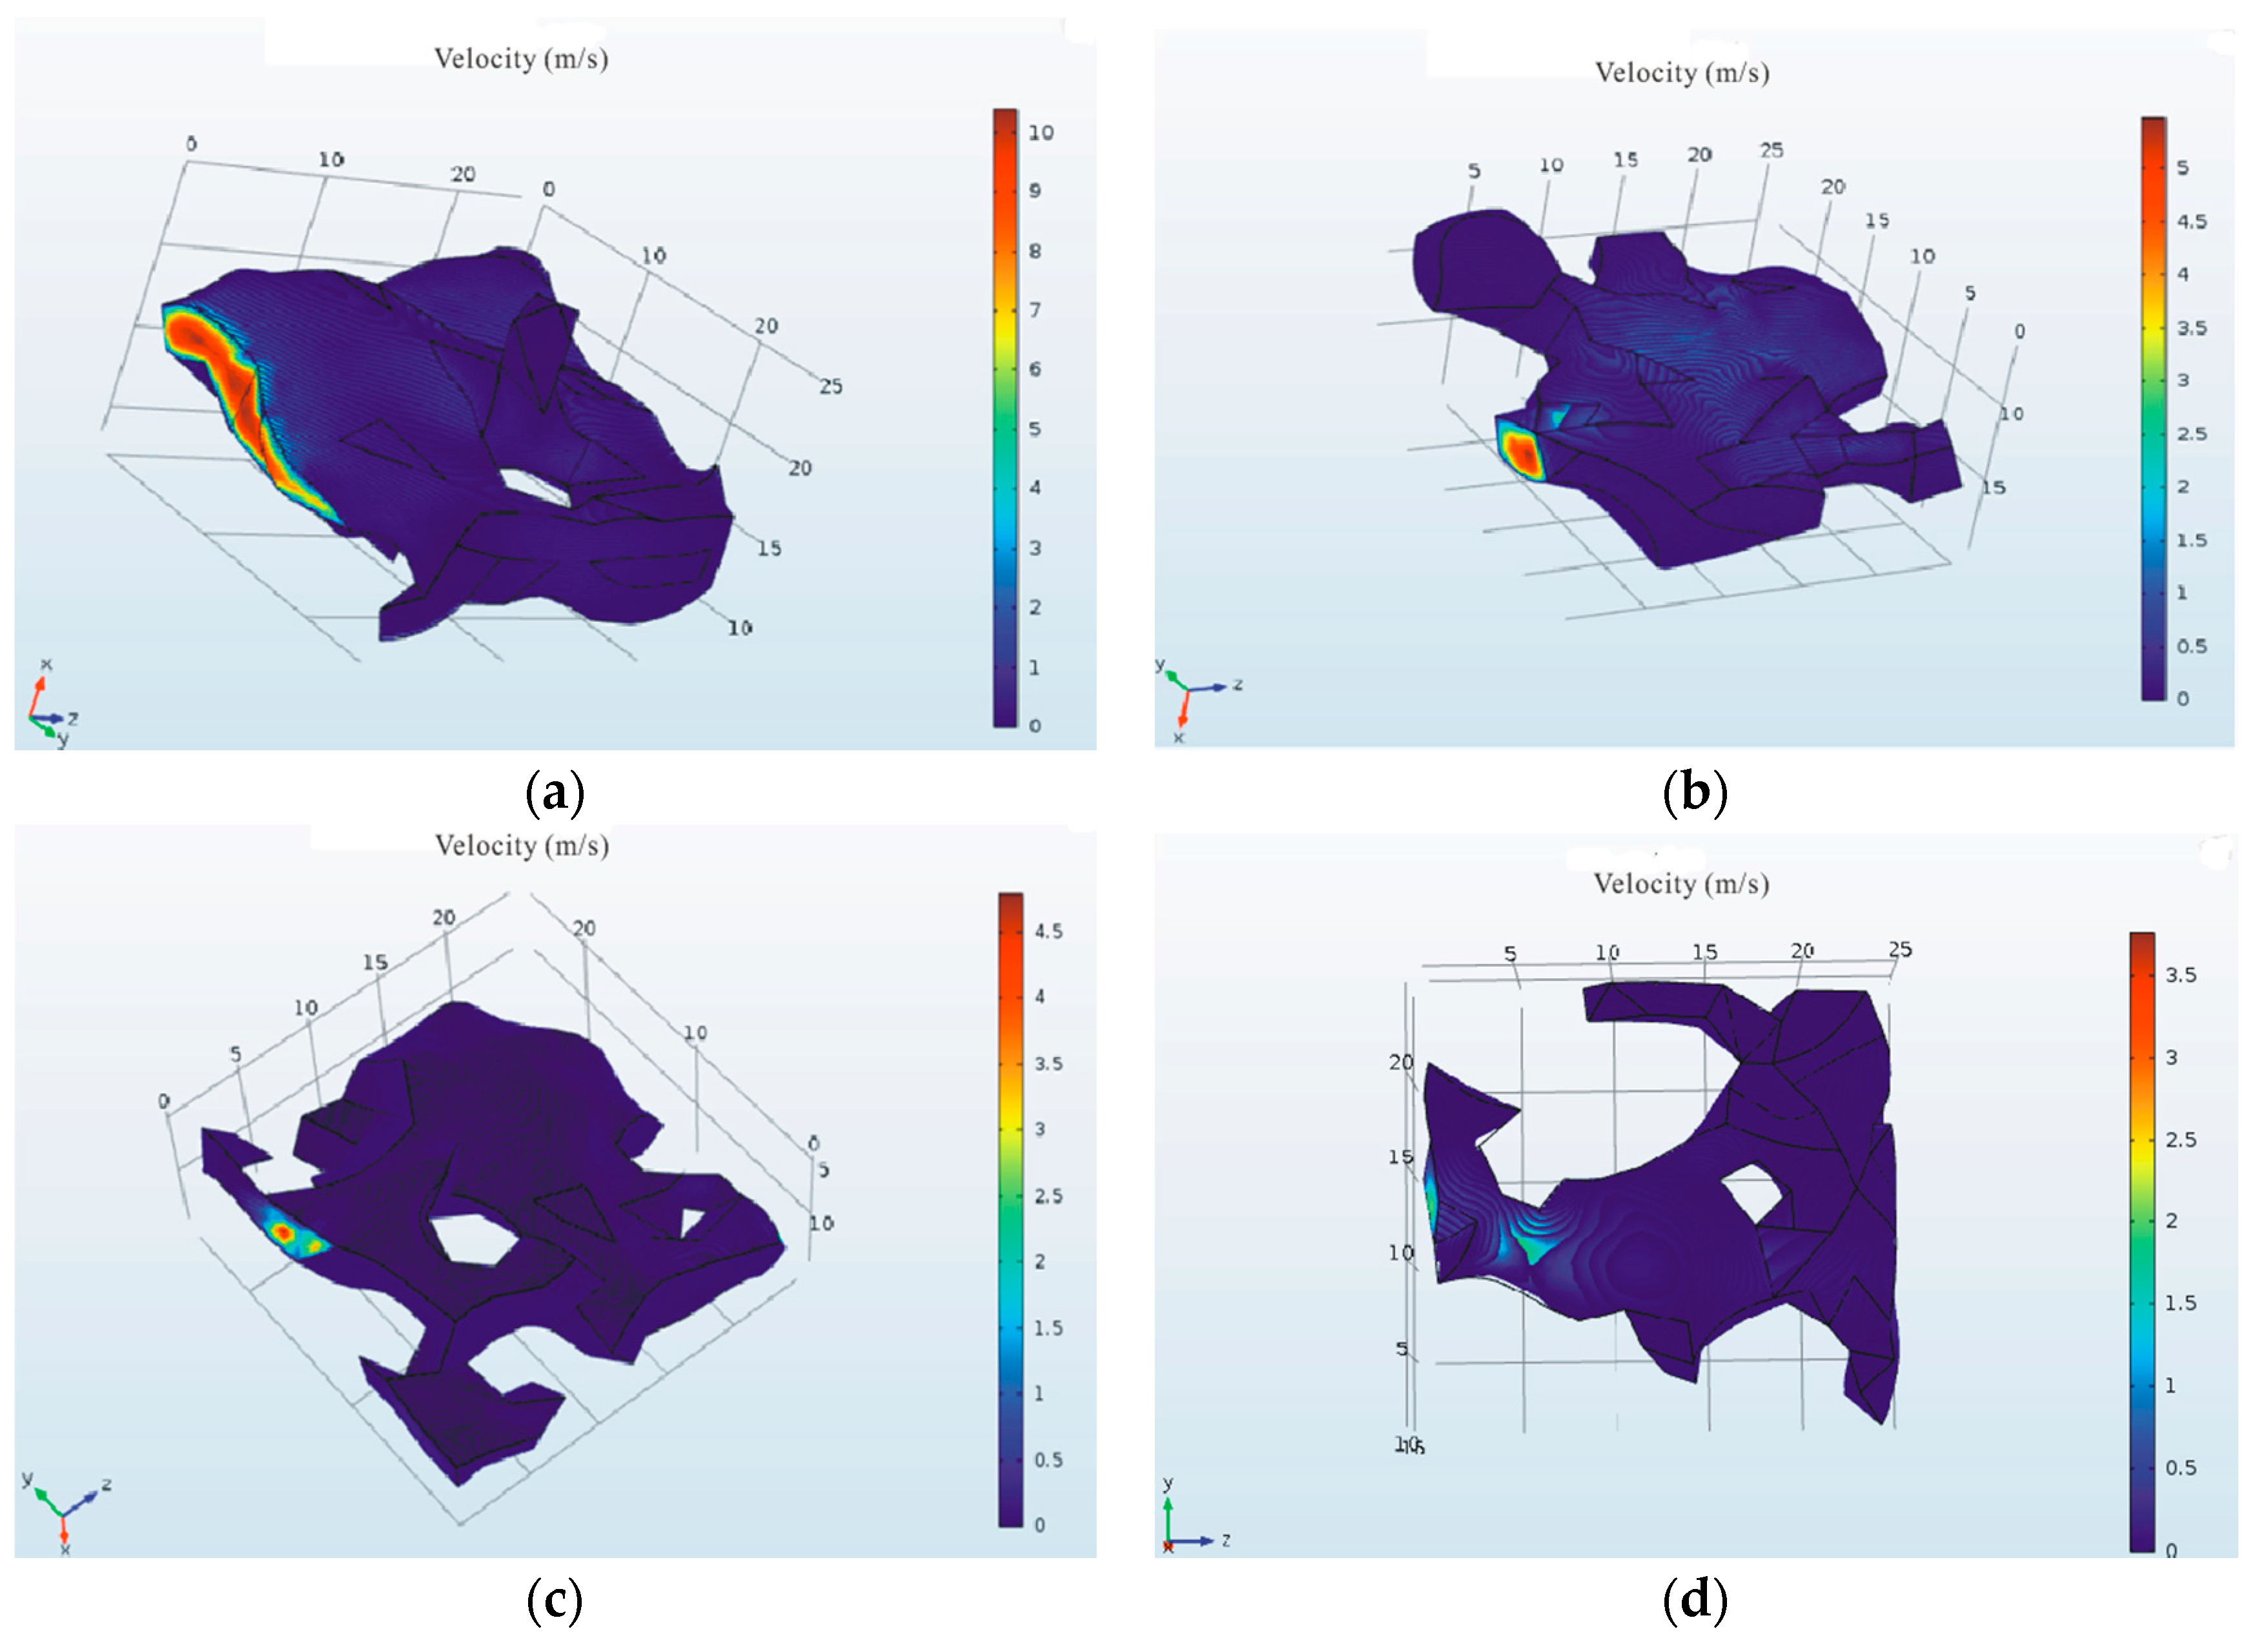
3.2. Simulations of Fracture in Different Confining Pressures

We carried out the fracture simulations in different confining pressures. In this study, we first assumed that the fluid was incompressible, and that flow was laminar. The isothermal and incompressible Navier-Stokes (N-S) equation was used to simulate flow in the fractures. The N-S equation and the continuity equation were as follows:
ρ [ v t + ( v ) v ] = p + [ μ ( v + ( v ) Τ ) ] v + F
ρ v = 0
where ρ and v represent the fluid density and fluid velocity, respectively; and p and μ denote the fluid pressure and viscosity, respectively.
At the entrance and exit, constant pressure boundary conditions were adopted where P 1 and P 2 are the pressure at the entrance and the exit, respectively:
p = p 1 ,   n μ 2 v = 0
p = p 2 ,   n μ 2 v = 0
Furthermore, a no-slip boundary condition was adopted to all the other walls.

3.3. Results and Analysis

In this paper, flow simulations were carried out, and the flow field distributions of the pressure and velocity fields were obtained, as shown in Figure 10 and Figure 11.
The simulation results showed that when the confining pressure was 0 MPa and 0.2 MPa, the pressure in the fracture might have a negative value, which was caused by the complex structure of the fracture. The negative area appeared when some prominent structures appeared prior to the entry interface.
After completing the simulation, we conducted a surface integral of the flow velocity at the outlet boundary so that we could obtain the flow rate through the fracture. Equivalent permeability is a key parameter in the equivalent numerical simulation of fractured reservoirs. Many experts and scholars have conducted a lot of research on the calculation methods of equivalent permeability. In our study, it was easy to calculate the equivalent absolute permeability derived from the application of Darcy’s law:
k = Q μ L A Δ p
where μ is the viscosity of the fluid; Q is the flow rate through the fracture; L is the length of sample; A is the area of outlet; and Δp is the pressure gradient that drives the flow through A.
The results were shown in Table 3, as well as Figure 12 and Figure 13.
From Figure 12 and Figure 13, it was easy to see that flow rate and permeability dropped sharply from 0 to 0.6 MPa, which meant that the rock had strong stress sensitivity at a stage of low effective stress, but after 0.6 MPa, the variation was not obvious; therefore, at a stage of high effective stress, the stress sensitivity of the rock samples weakened tremendously. This phenomenon was consistent with the results shown in Figure 8.
Yihuai Zhang et al. studied the relationships of coal permeability and effective stress, and found that the gas permeability of coal dropped dramatically with increasing effective stress. They concluded that effective stress caused closures of microcleats in the coal [19]. It was also found that with an increase in confining pressure, the permeability of natural fractures decreased exponentially, while the permeability of hydraulic fractures decreased more slowly, following cubic polynomial law [17].
In our study, we noted that there was an obvious inflection point at the position of 0.6 MPa, as shown in Figure 14. The exponential fitting was used to fit the relationship curve of permeability and confining pressure. We thus obtained the fitting equation:
k = 0.954 exp ( Δ p / 0.203 ) 0.009   ( R 2 = 0 . 9984 )
Natural micro-fracture systems are common in tight, low permeability reservoirs. Rational, efficient, and economical development of such reservoirs is an important task and difficult problem in the development of low permeability oil fields. In past numerical simulations of fractured reservoirs, the absolute permeability of reservoir rocks was treated as a constant, no matter whether they were treated as homogeneous or double porosity reservoirs. The results can provide guidance for the numerical simulation and the production of oil fields of fractured reservoirs. With the exploitation of fractured reservoirs, micro-fractures will become smaller and even closed, thus greatly affecting permeability. If numerical simulation and history matching of fractured reservoirs are conducted, the fixed permeability will cause serious discrepancies in the actual production. However, the results of this study can provide effective data for these cases. The same approach can be used in the future for quantifying other types of rocks and for seeking correlations between the permeability changes and the applied pressure.
In the 1950s, Lomize, a former Soviet scientist, obtained the cubic law of flow rate through a single crack by experiments, shown in Equation (7) [43].
q = a 3 l 12 μ Δ p L
where a represents the fracture opening.
Neuzil and Tracy (1981) proposed a model for flow rate in a fracture, which was represented by a set of parallel plate openings with different apertures. A modified Poiseuille equation for flow rate was obtained, which included an aperture frequency distribution for the fracture [44].
q = 1 12 μ Δ p L 0 a 3 f ( a ) d a
On these foundations, fractal theory has made outstanding achievements in the study of porous media [45,46,47,48], the study of fractures includes surface roughness [49], fractal patterns [50], etc. Going forward, we hope to use fractal theory to quantitatively represent the opening and seepage characteristics of fractures under different effective stress levels, so as to reveal the physical mechanism of fluid characteristics in porous media.

4. Conclusions

In this paper, we conducted a stress sensitivity experiment and CT technology was used to visualize the stress change of the actual fractured gas reservoir caused by changes in confining pressure. Then, we reconstructed and visualized the CT images obtained, and quantitatively evaluated the change of fracture openings. Next, we processed the scanned images and reconstructed the digital cores of the fractures. Furthermore, we also took advantage of iso2mesh, a 3D mesh generation toolbox, to grid the digital core of fracture. On this basis, pore-scale simulations were successfully used to estimate the equivalent absolute permeability of different confining pressures to provide a theoretical basis for the rational exploitation of fractured reservoirs.
We can draw the following conclusions:
(1)
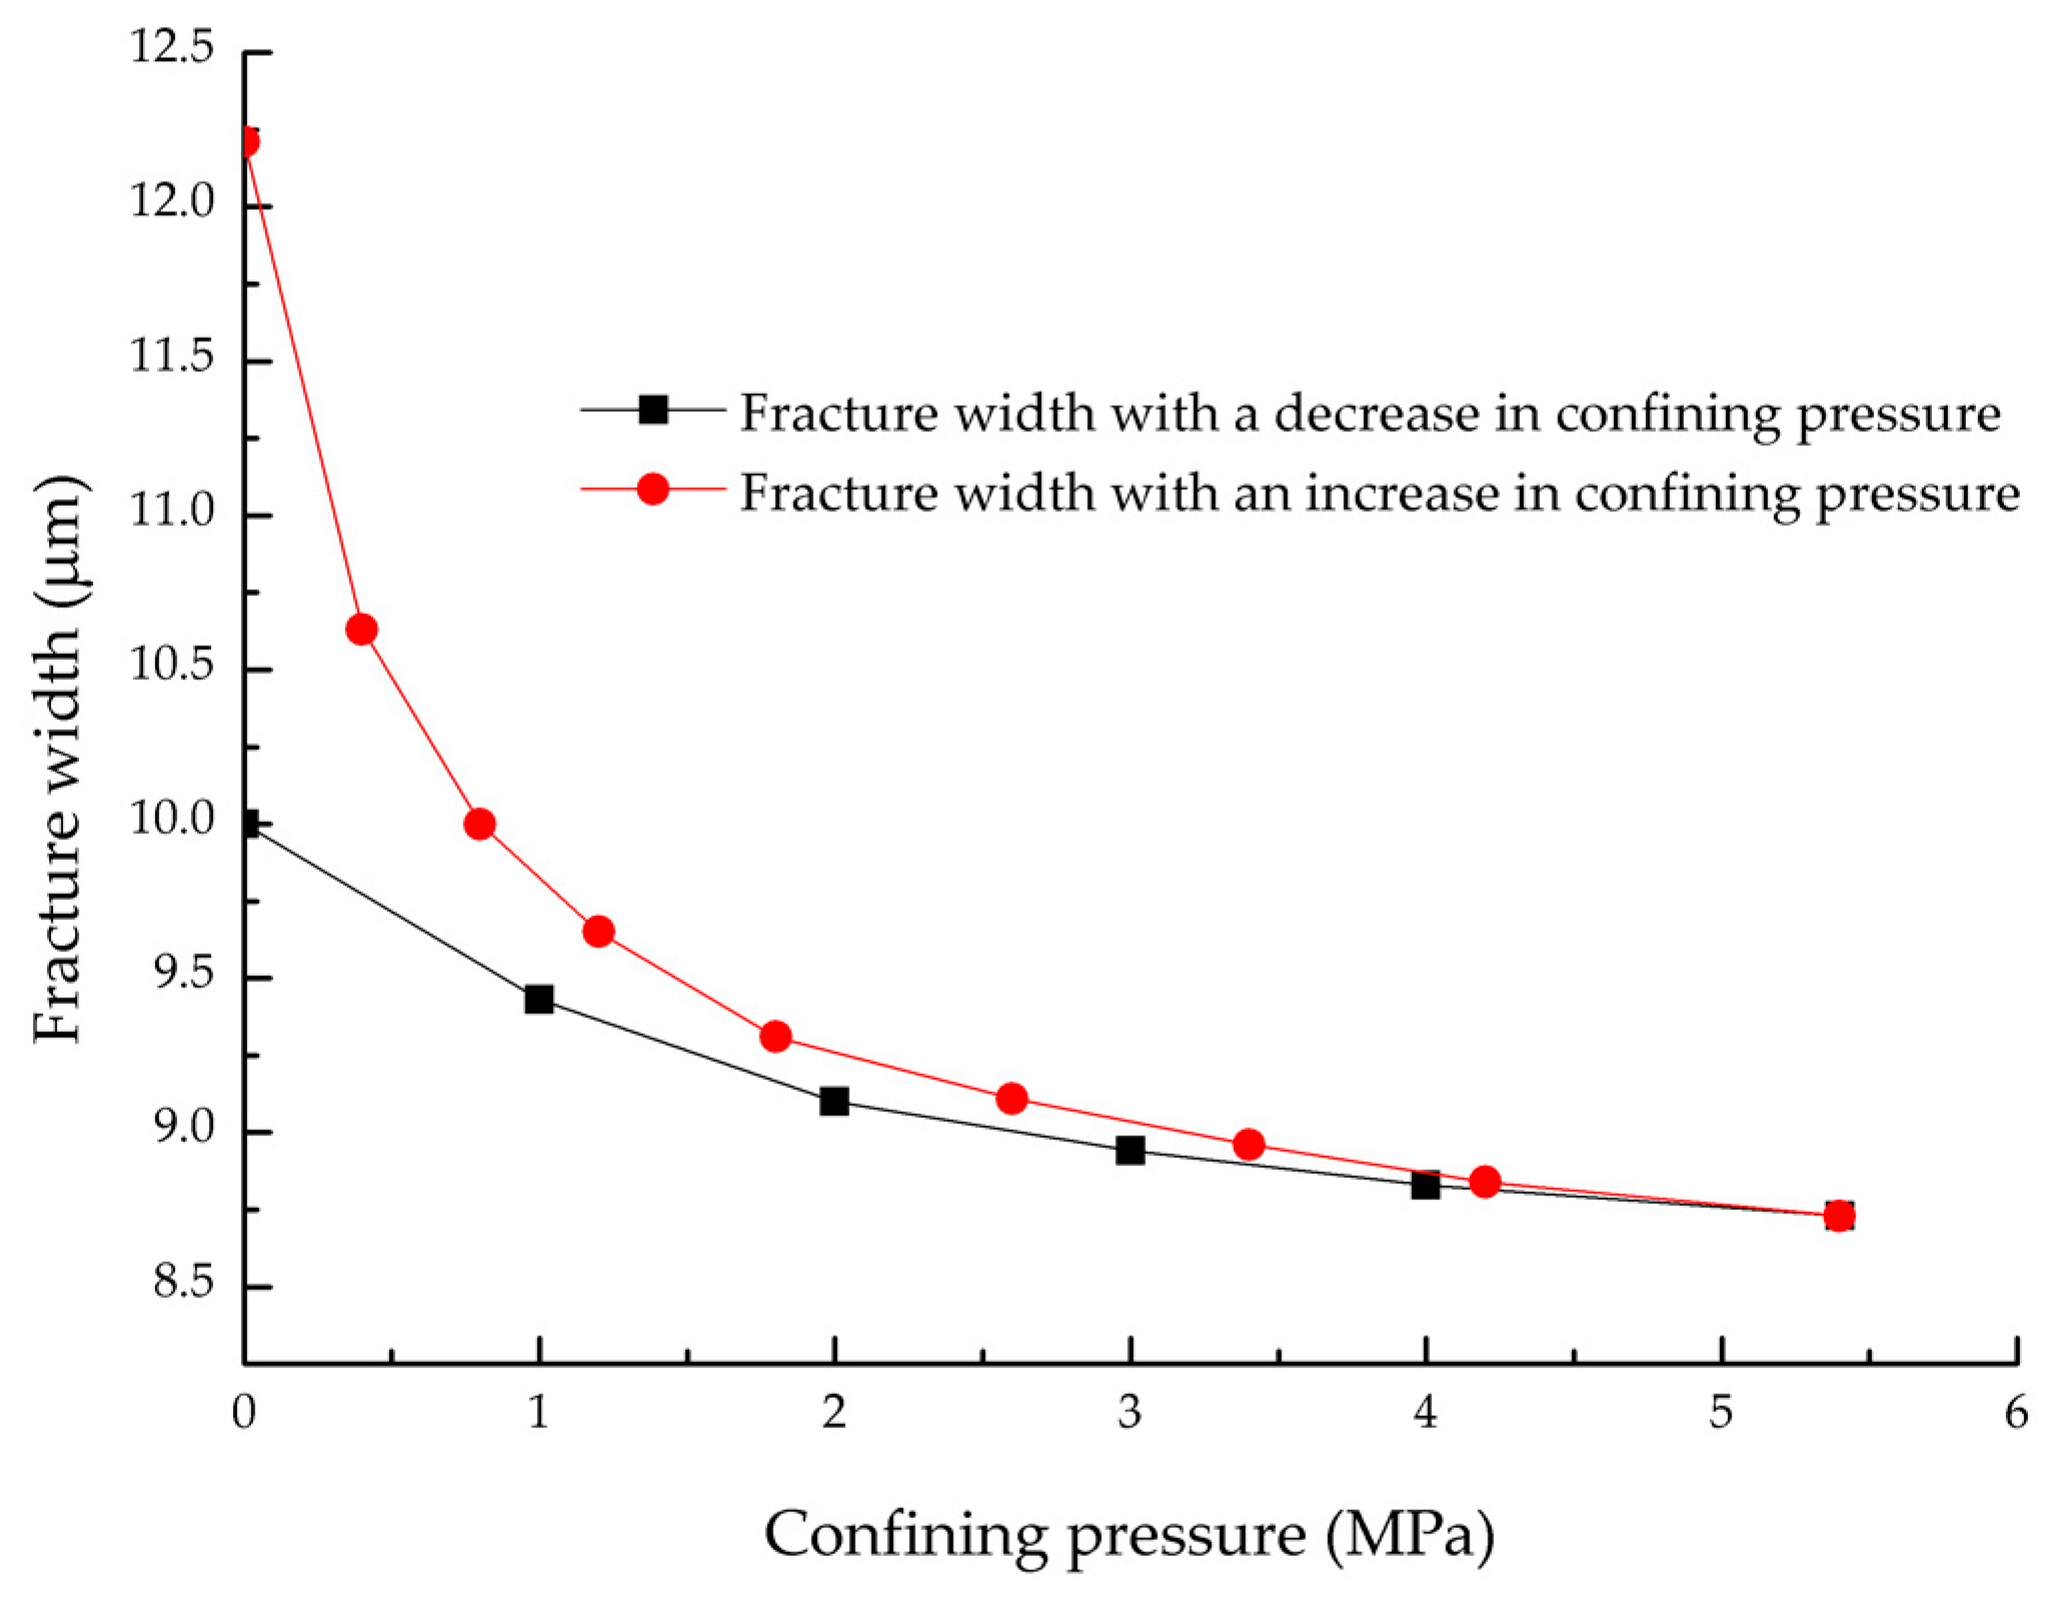
The stress sensitivity experiment of the reservoir showed that a change in fracture width was non-linear in relation to changes in confining pressure through the data and graph. With an increase in confining pressure, the fracture width decreased, and the fracture width decreased more between 0 MPa and 0.6 MPa than at any other stage, which showed that the rock had strong stress sensitivity at a stage of low effective stress. After 0.6 MPa, the change gradient of the fracture width obviously weakened; after 2.6 MPa, there was very little variation, which showed that at a stage of high effective stress, the stress sensitivity of the rock samples weakened. With a decrease in confining pressure, the fracture opening increased, but could not recover its initial condition.
(2)
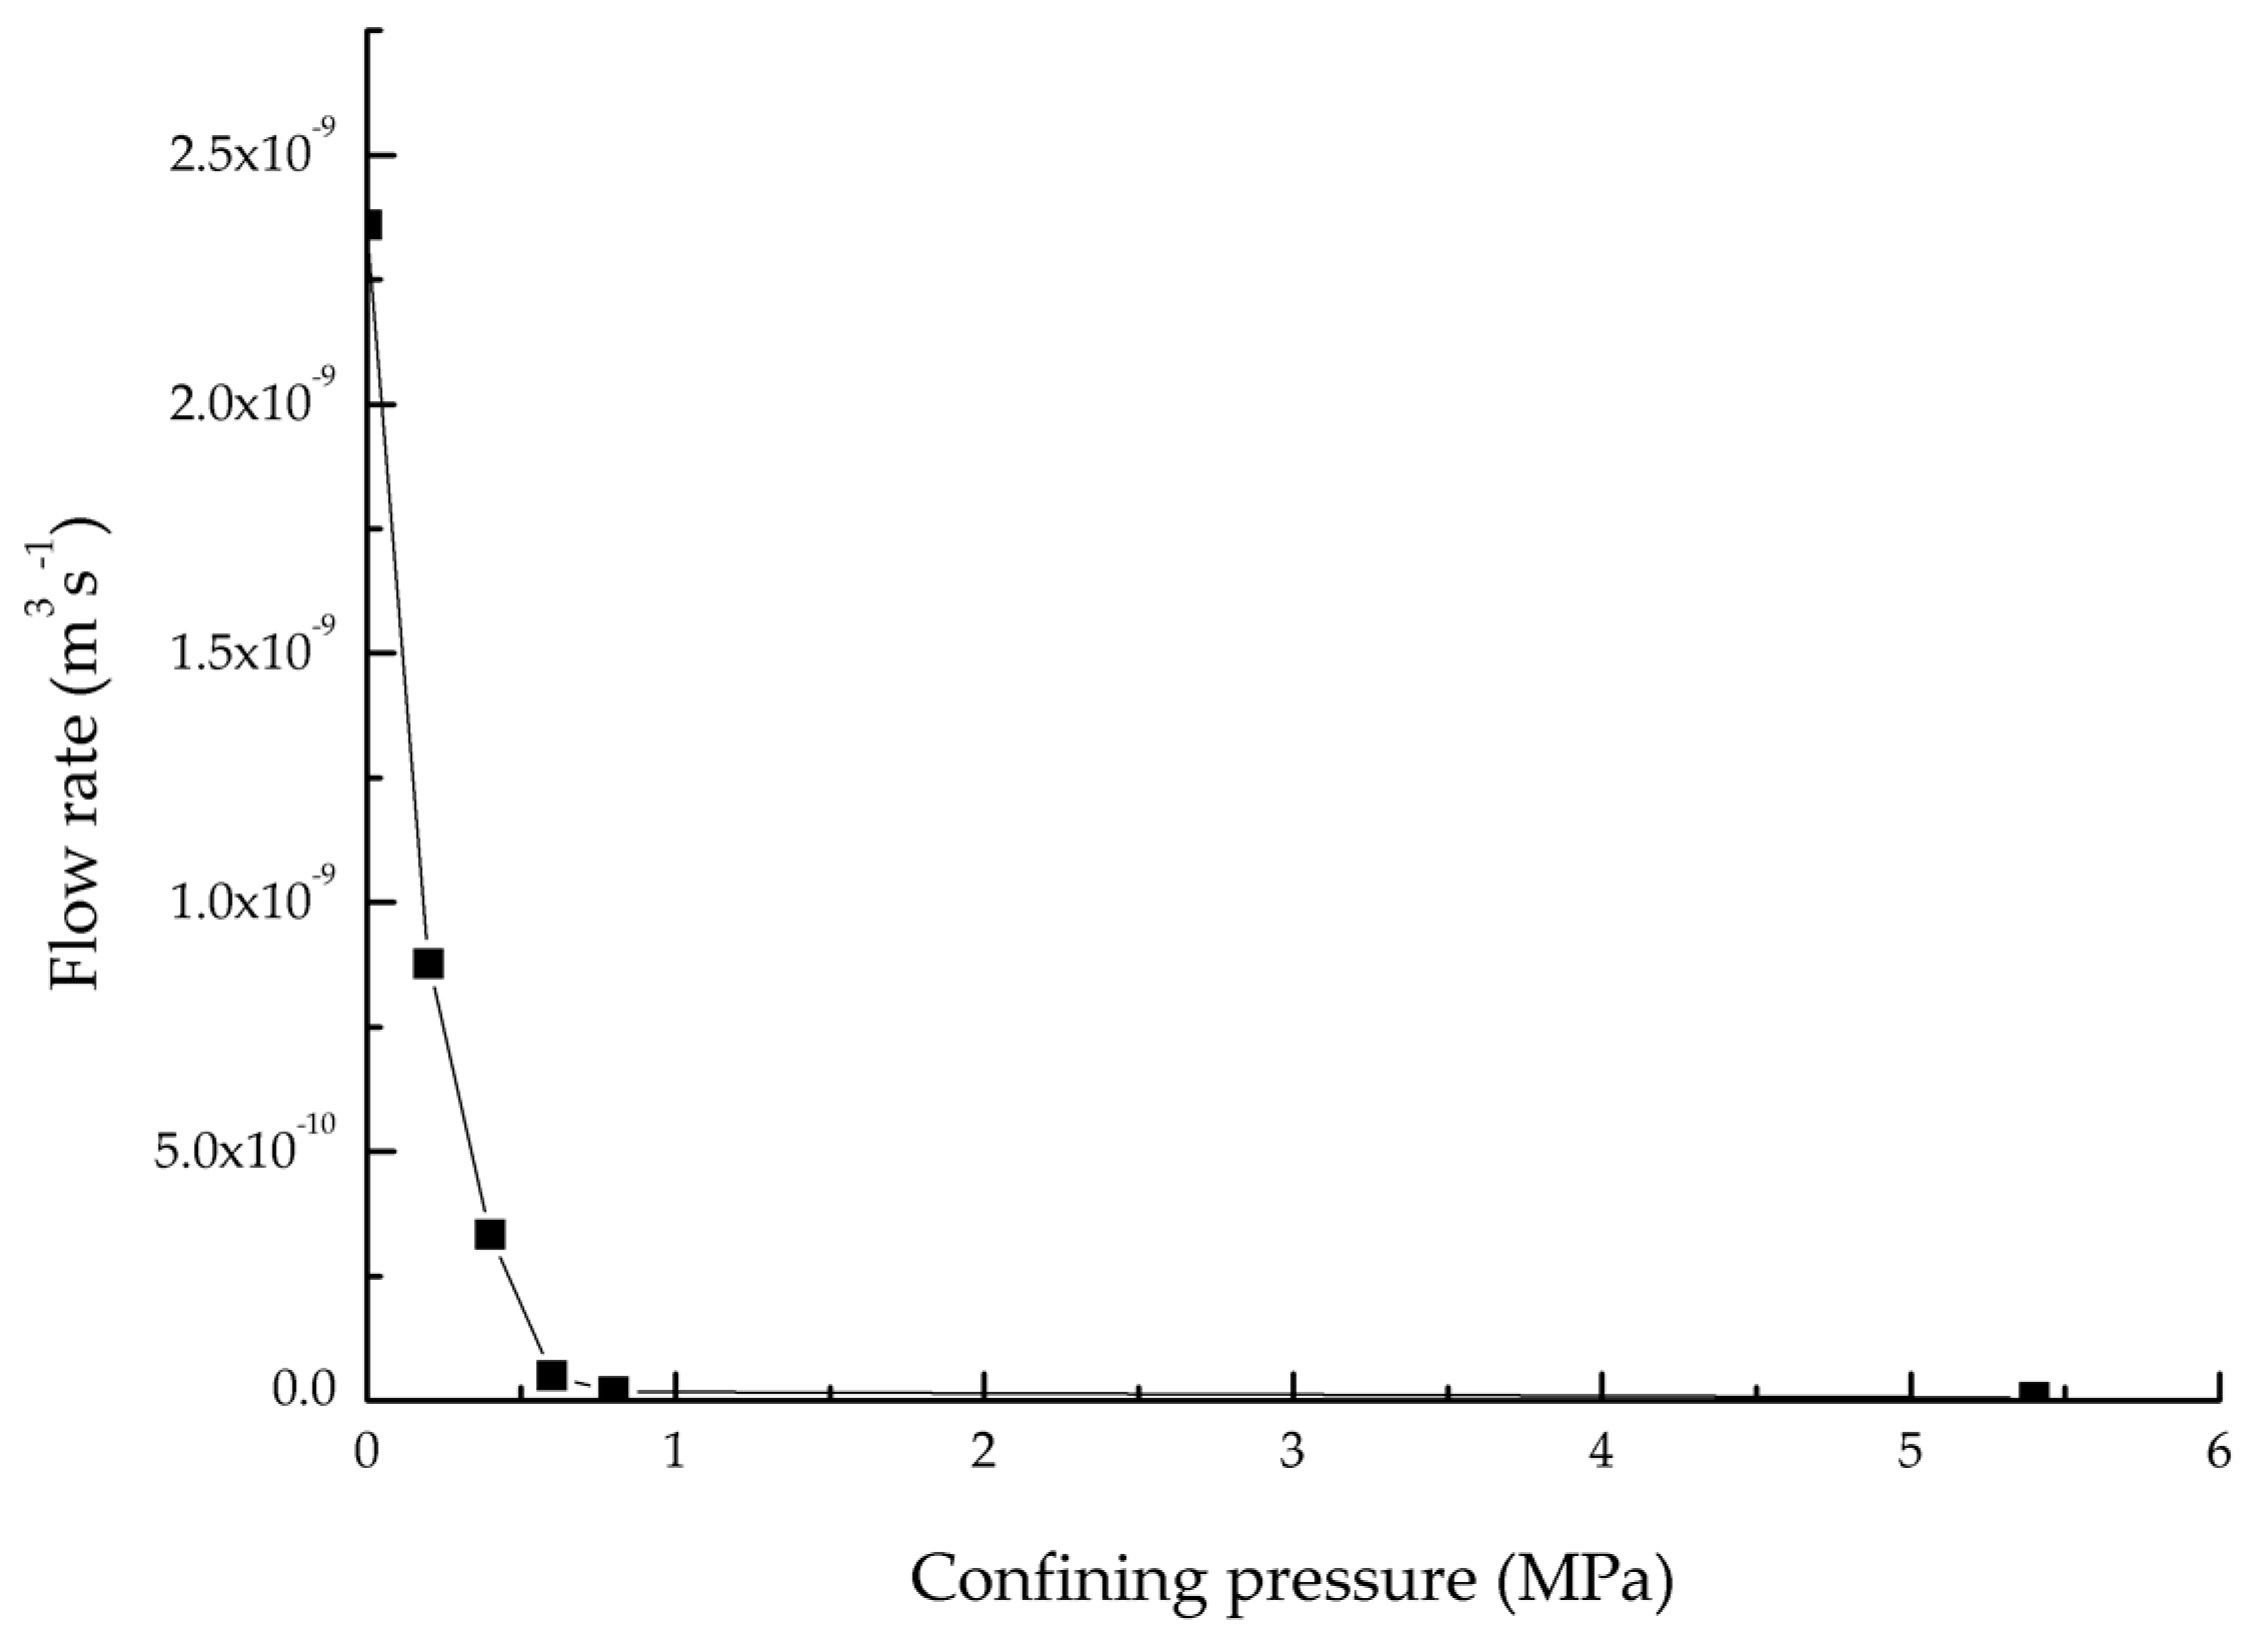
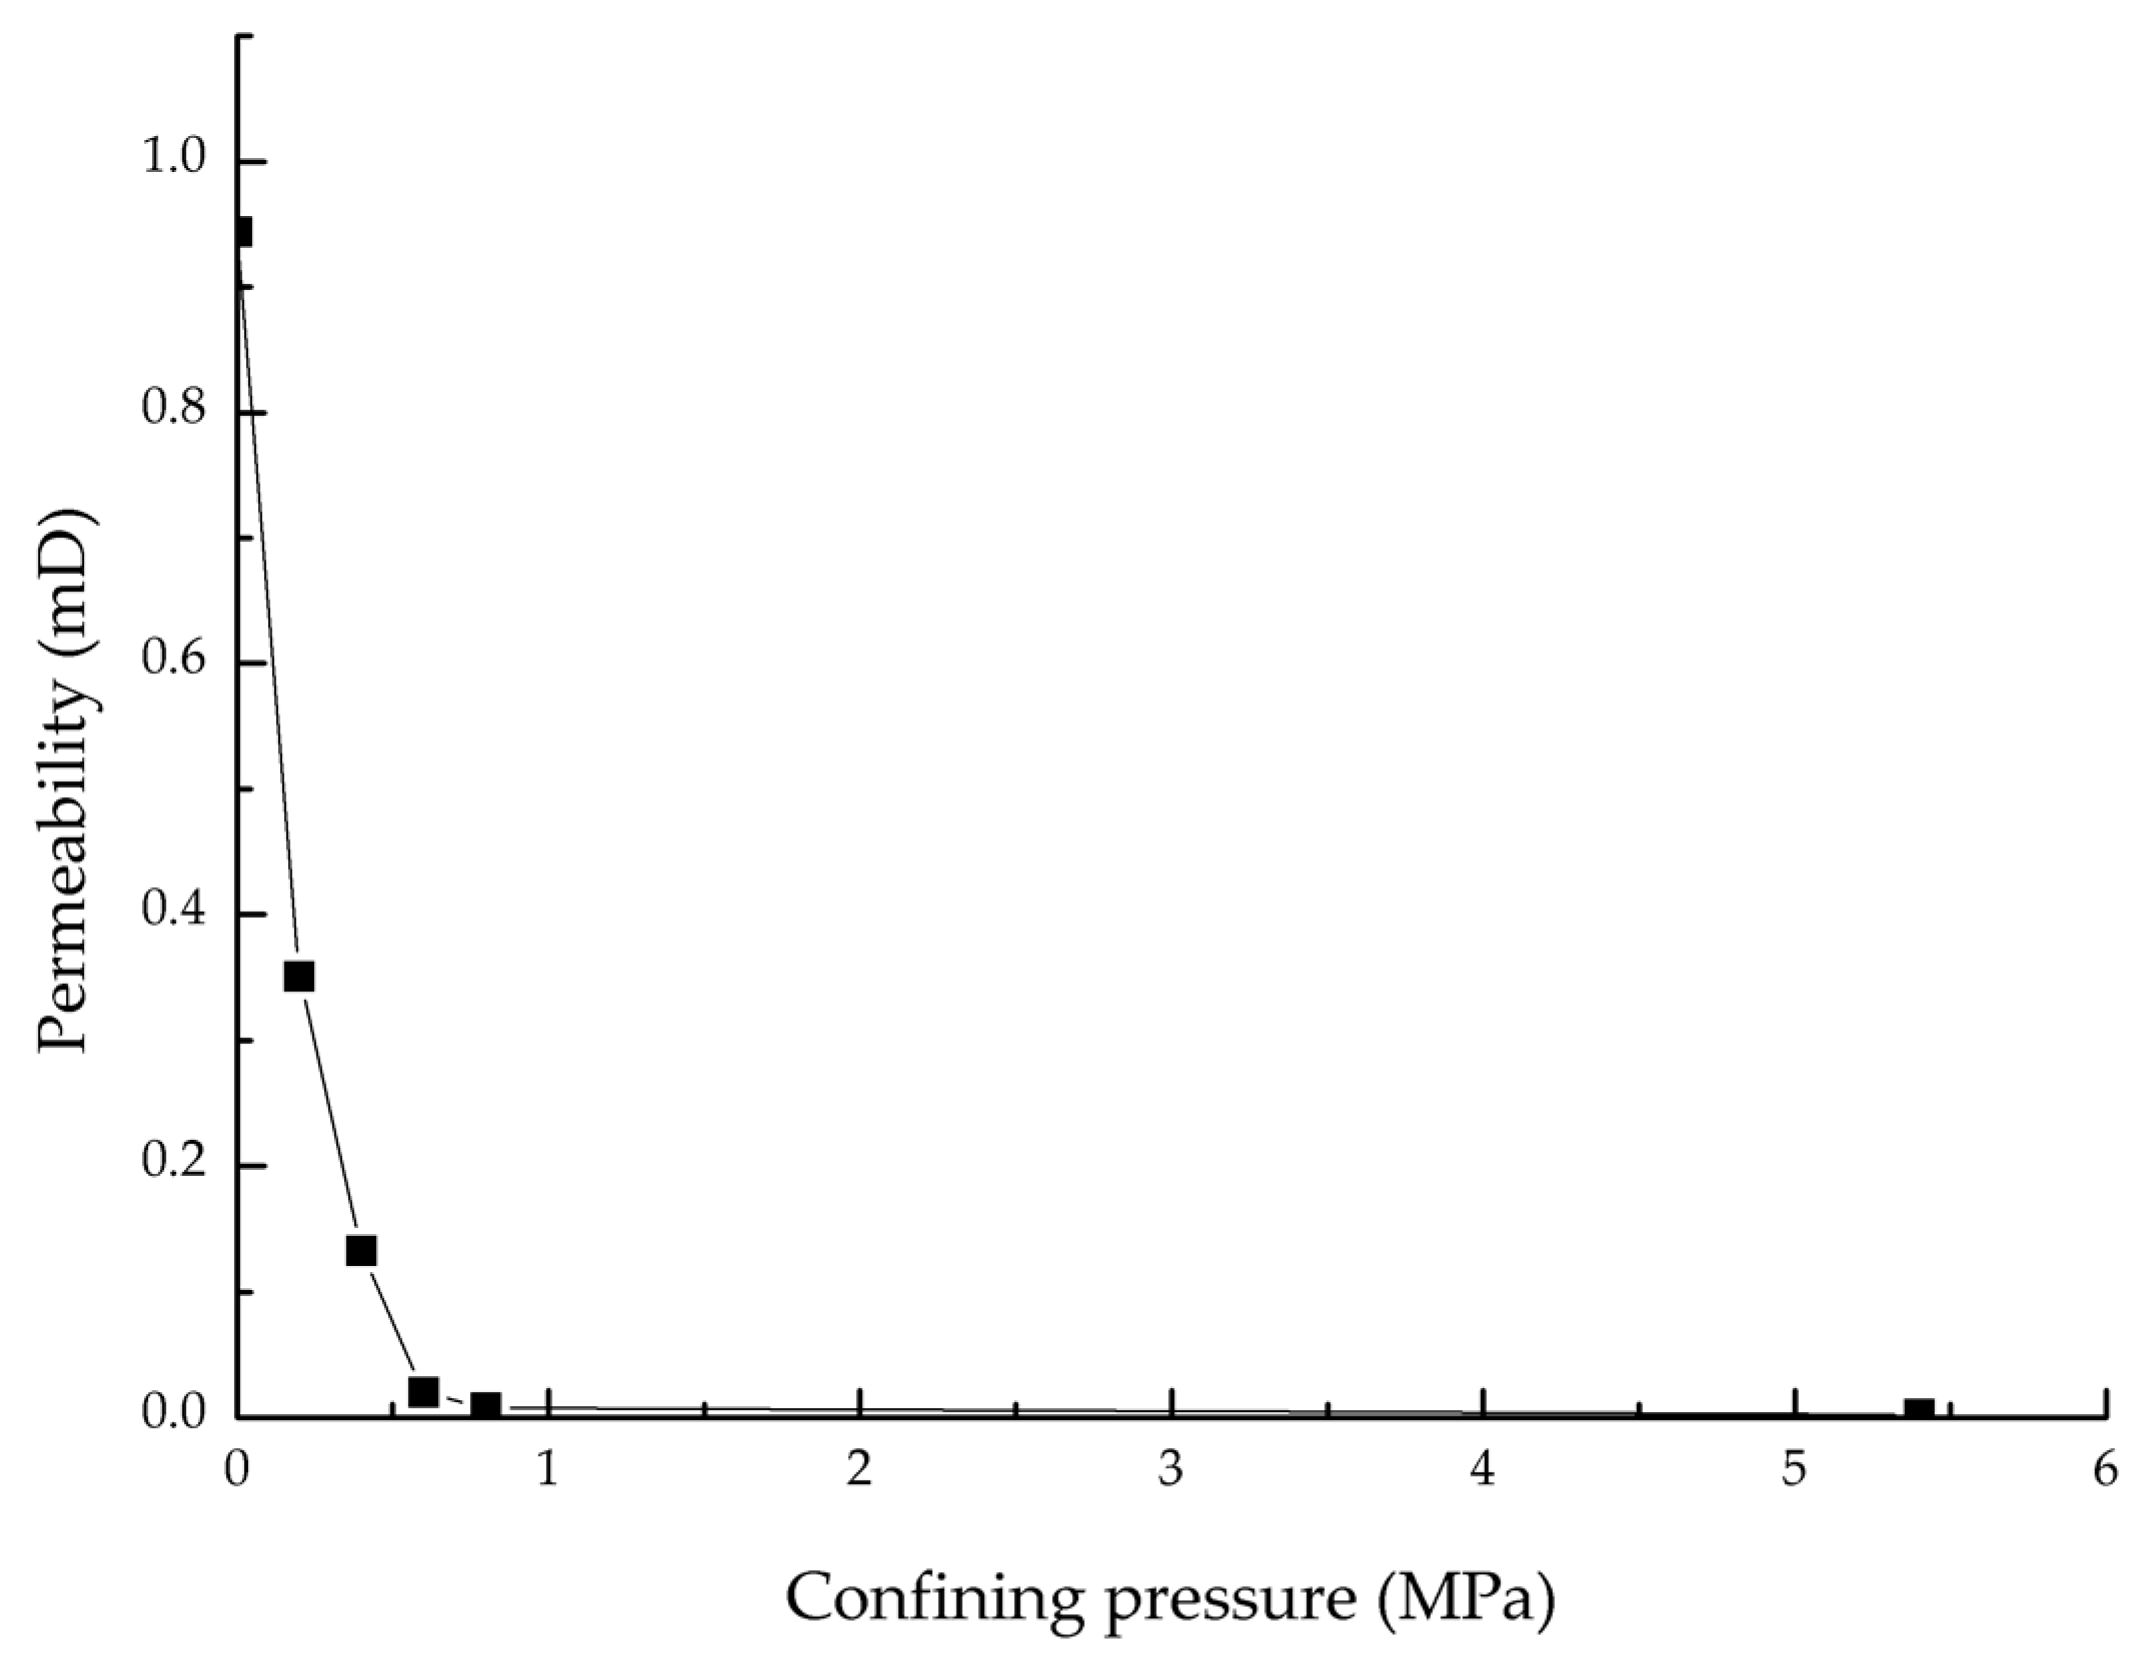
From the results of the pore-scale simulations, it was easy to see that the flow rate and permeability dropped sharply from 0 to 0.6 MPa, which meant that the rock had strong stress sensitivity at a stage of low effective stress. However, after 0.6 MPa, the variation was not obvious, which showed that at a stage of high effective stress, the stress sensitivity of the rock samples weakened tremendously. This finding was consistent with the results in the stress sensitivity experiment.
(3)
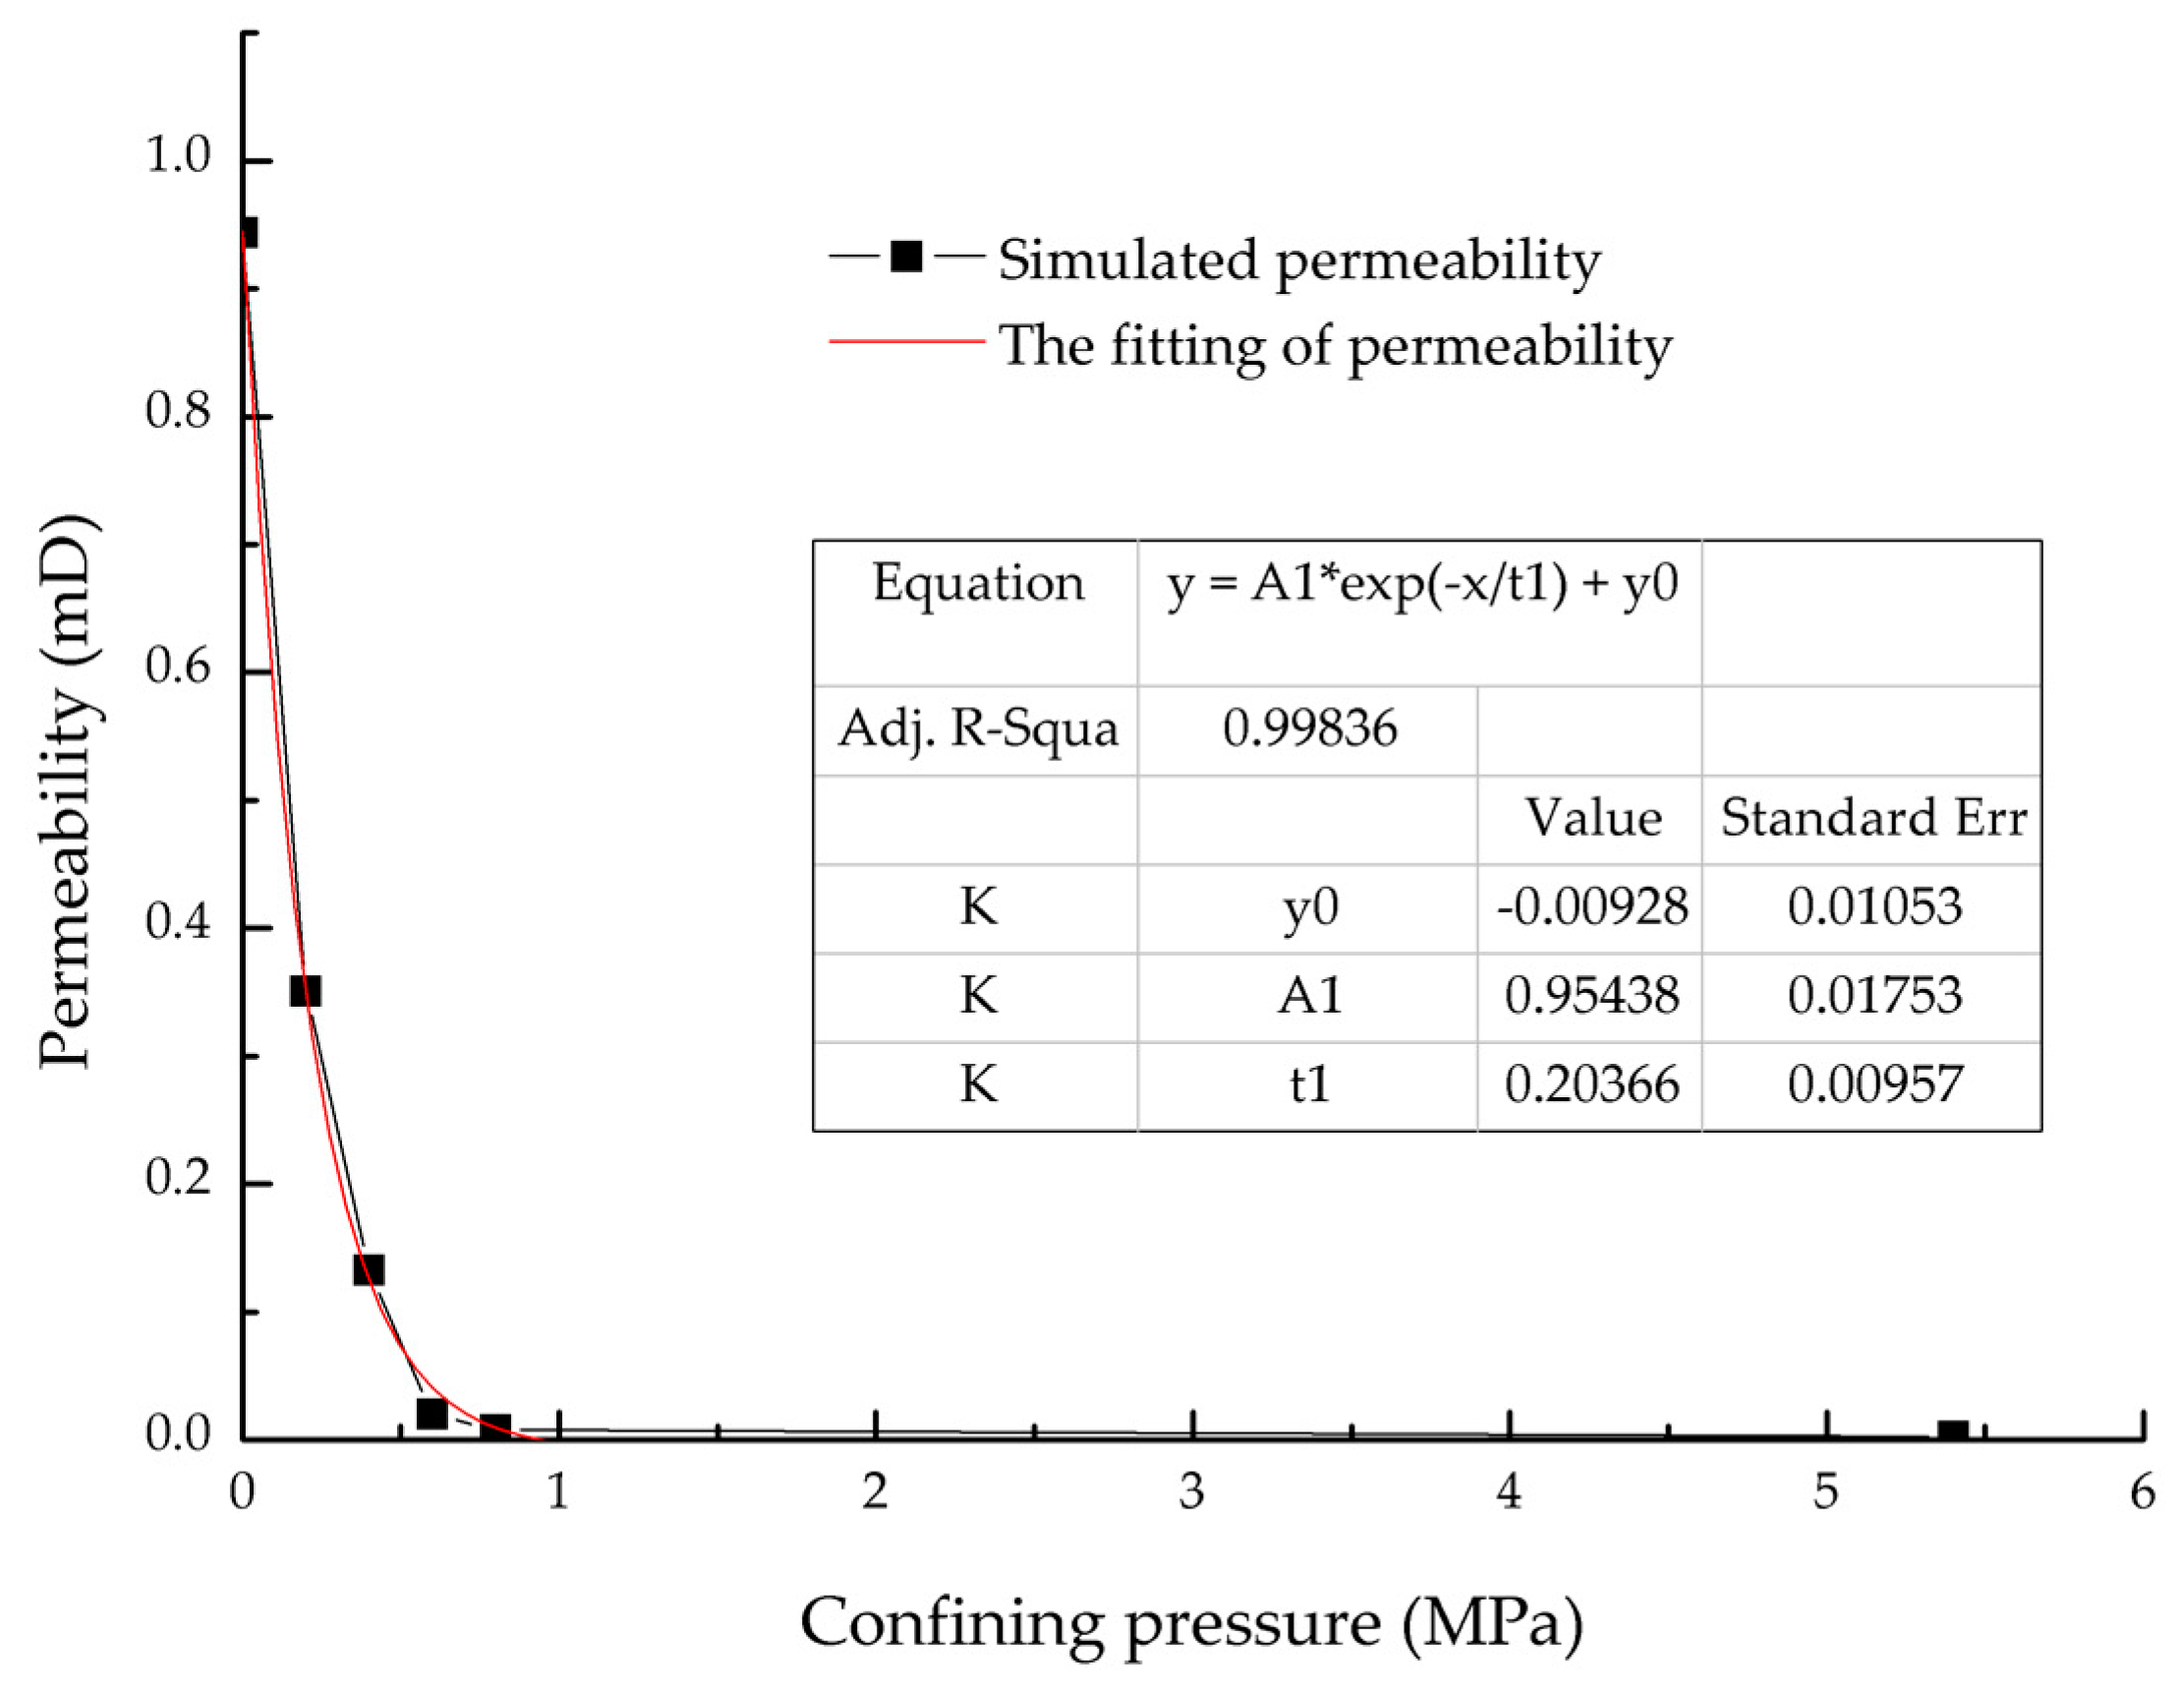
Exponential fitting was used to fit the relationship curve of k and confining pressure. We thus obtained the fitting equation: k = 0.954exp (− Δ p /0.203) − 0.009 (R² = 0.9984). The results can provide guidance for the numerical simulations and the production of oil fields of fractured reservoirs.

Acknowledgments

We would like to express appreciation to the following financial support: the National Natural Science Foundation of China (No. 51674280, 51711530131,51490654, 51234007), Applied basic research projects of Qingdao innovation plan (16-5-1-38-jch), the Fundamental Research Funds for the Central Universities (No. 17CX05003), National Science and Technology Major Project (2016ZX05010002005), Program for Changjiang Scholars and Innovative Research Team in University (IRT_16R69), Natural Science Foundation of China (Grant No. 51404291), and Introducing Talents of Discipline to Universities (B08028).

Author Contributions

Each author has made contributions to the present paper. Yongfei Yang, Zhihui Liu and Zhixue Sun conceived and designed the experiments; Senyou An, Wenjie Zhang, and Pengfei Liu performed the experiments; Yongfei Yang and Zhihui Liu processed and analyzed the experimental data; Jun Yao provided the experimental support. General supervision was provided by Jingsheng Ma. All authors have read and approved the final manuscript.

Conflicts of Interest

The authors declare no conflict of interest.

References

  1. Berkowitz, B. Characterizing flow and transport in fractured geological media: A review. Adv. Water Resour. 2002, 25, 861–884. [Google Scholar] [CrossRef]
  2. Sahimi, M. Flow and Transport in Porous Media and Fractured Rock; VCH Verlagsgesellschaft: Weinheim, Germany, 1995. [Google Scholar]
  3. Babadagli, T. Scaling of Co-Current and Counter-Current Capillary Imbibition for Surfactant and Polymer Injection in Naturally Fractured Reservoirs. In Proceedings of the SPE/AAPG Western Regional Meeting, Long Beach, CA, USA, 19–22 June 2000; Volume 6, pp. 465–478. [Google Scholar]
  4. Kantzas, A.; Pow, M.; Allsopp, K.; Marentette, D. Co-Current and Counter-Current Imbibition Analysis for Tight Fractured Carbonate Gas Reservoirs; Petroleum Society of Canada: Calgary, AB, Canada, 1997. [Google Scholar]
  5. Van Poollen, H.K.; Aguilera, R. Current Status On The Study Of Naturally Fractured Reservoirs. Log Anal. 1977, 18, 1–23. [Google Scholar]
  6. Xie, W.; Li, X. Research on Fractured Horizontal Wells Productivity and Productivity Influence in Shale Gas Reservoir. In Proceedings of the SPE/EAGE European Unconventional Resources Conference and Exhibition, Vienna, Austria, 25–27 February 2014. [Google Scholar]
  7. Meng, C.; De Pater, C.J. Acoustic Monitoring of Hydraulic Fracture Propagation in Pre-Fractured Natural Rocks. Key Eng. Mater. 2011, 452–453, 4003–4010. [Google Scholar] [CrossRef]
  8. Farquhar, R.A.; Smart, B.G.D.; Todd, A.C.; Tompkins, D.E.; Tweedie, A.J. Stress sensitivity of low-permeability sandstones from the Rotliegendes sandstone. In Proceedings of the SPE Annual Technical Conference and Exhibition, Houston, TX, USA, 3–6 October 1993. [Google Scholar]
  9. Lei, Q.; Xiong, W.; Yuang, J.; Cui, Y.; Wu, Y.-S. Analysis of stress sensitivity and its influence on oil production from tight reservoirs. In Proceedings of the Eastern Regional Meeting, Lexington, KY, USA, 17–19 October 2007. [Google Scholar]
  10. Vairogs, J.; Hearn, C.L.; Dareing, D.W.; Rhoades, V.W. Effect of Rock Stress on Gas Production From Low-Permeability Reservoirs. J. Pet. Technol. 1971, 23, 1161–1167. [Google Scholar] [CrossRef]
  11. Davies, J.P.; Davies, D.K. Stress-Dependent Permeability: Characterization and Modeling. In Proceedings of the SPE Annual Technical Conference and Exhibition, Houston, TX, USA, 3–6 October 1999; Volume 6, pp. 224–235. [Google Scholar]
  12. Geilikman, M.B.; Wong, S.-W.; Karanikas, J.M. Stress-Dependent Permeability Model of Laminated Gas Shale. In Proceedings of the 49th U.S. Rock Mechanics/Geomechanics Symposium, San Francisco, CA, USA, 28 June–1 July 2015. [Google Scholar]
  13. Fatt, I.; Davis, D.H. Reduction in Permeability With Overburden Pressure. J. Pet. Technol. 1952, 4. [Google Scholar] [CrossRef]
  14. Ali, H.S.; Al-Marhoun, M.A.; Abu-Khamsin, S.A.; Celik, M.S. The Effect of Overburden Pressure on Relative Permeability. In Proceedings of the Middle East Oil Show, Manama, Bahrain, 7–10 March 1987. [Google Scholar]
  15. Fatt, I. The Effect of Overburden Pressure on Relative Permeability. J. Pet. Technol. 1953, 5, 15–16. [Google Scholar] [CrossRef]
  16. Zhang, J.; Bai, M.; Roegiers, J.-C.; Liu, T. Determining stress-dependent permeability in the laboratory. In Proceedings of the Vail Rocks 1999, the 37th U.S. Symposium on Rock Mechanics (USRMS), Vail, CO, USA, 7–9 June 1999. [Google Scholar]
  17. Liang, B.; Jiang, H.; Li, J.; Gong, C.; Jiang, R.; Pei, Y.; Wei, S. Flow in multi-scale discrete fracture networks with stress sensitivity. J. Nat. Gas Sci. Eng. 2016, 35, 851–859. [Google Scholar] [CrossRef]
  18. Gangi, A.F. Variation of whole and fractured porous rock permeability with confining pressure. Int. J. Rock Mech. Min. Sci. Geomech. Abstr. 1978, 15, 249–257. [Google Scholar] [CrossRef]
  19. Zhang, Y.; Xu, X.; Lebedev, M.; Sarmadivaleh, M.; Barifcani, A.; lauer, S. Multi-scale X-ray computed tomography analysis of coal microstructure and permeability changes as a function of effective stress. Int. J. Coal Geol. 2016, 165, 149–156. [Google Scholar] [CrossRef]
  20. Carpenter, C. Digital Core Analysis and Pore-Network Modeling in a Mature-Field Project. J. Pet. Technol. 2015, 67, 97–99. [Google Scholar] [CrossRef]
  21. Ghous, A.; Knackstedt, M.A.; Arns, C.H.; Sheppard, A.; Kumar, M.; Sok, R.; Senden, T.; Latham, S.; Jones, A.C.; Averdunk, H.; et al. 3D imaging of reservoir core at multiple scales: Correlations to petrophysical properties and pore scale fluid distributions. In Proceedings of the International Petroleum Technology Conference, Kuala Lumpur, Malaysia, 3–5 December 2008. [Google Scholar]
  22. Ketcham, R.A.; Carlson, W.D. Acquisition, optimization and interpretation of X-ray computed tomographic imagery: Applications to the geosciences. Comput. Geosci. 2001, 27, 381–400. [Google Scholar] [CrossRef]
  23. Knackstedt, M.A.; Sok, R.; Adrian, S.; Arns, C.H. 3D Pore Scale Characterisation of Carbonate Core: Relating pore types and interconnectivity to petrophysical and multiphase flow properties. In Proceedings of the International Petroleum Technology Conference, Dubai, UAE, 4–6 December 2007. [Google Scholar]
  24. Yang, Y.; Yao, J.; Wang, C.; Gao, Y.; Zhang, Q.; An, S.; Song, W. New pore space characterization method of shale matrix formation by considering organic and inorganic pores. J. Nat. Gas Sci. Eng. 2015, 27, 496–503. [Google Scholar] [CrossRef]
  25. Dunsmuir, J.H.; Ferguson, S.R.; D’Amico, K.L.; Stokes, J.P. X-Ray Microtomography: A New Tool for the Characterization of Porous Media. In Proceedings of the SPE Annual Technical Conference and Exhibition, Dallas, TX, USA, 6–9 October 1991. [Google Scholar]
  26. Cipolla, C.L.; Lolon, E.; Mayerhofer, M.J.; Warpinski, N.R. Fracture Design Considerations in Horizontal Wells Drilled in Unconventional Gas Reservoirs. In Proceedings of the SPE Hydraulic Fracturing Technology Conference, The Woodlands, TX, USA, 19–21 January 2009. [Google Scholar]
  27. Geertsma, J.; Klerk, F.D. A rapid method of predicting width and extent of hydraulically induced fractures. J. Pet. Technol. 1969, 21, 1571–1581. [Google Scholar] [CrossRef]
  28. Yang, Y.; Zhang, W.; Gao, Y.; Wan, Y.; Su, Y.; An, S.; Sun, H.; Zhang, L.; Zhao, J.; Liu, L.; et al. Influence of stress sensitivity on microscopic pore structure and fluid flow in porous media. J. Nat. Gas Sci. Eng. 2016, 36, 20–31. [Google Scholar] [CrossRef]
  29. Montemagno, C.D.; Pyrak-Nolte, L.J. Fracture network versus single fractures: Measurement of fracture geometry with X-ray tomography. Phys. Chem. Earth Part A 1999, 24, 575–579. [Google Scholar] [CrossRef]
  30. Wolf, K.H.A.A.; van Bergen, F.; Ephraim, R.; Pagnier, H. Determination of the cleat angle distribution of the RECOPOL coal seams, using CT-scans and image analysis on drilling cuttings and coal blocks. Int. J. Coal Geol. 2008, 73, 259–272. [Google Scholar] [CrossRef]
  31. Cai, Y.; Liu, D.; Mathews, J.P.; Pan, Z.; Elsworth, D.; Yao, Y.; Li, J.; Guo, X. Permeability evolution in fractured coal—Combining triaxial confinement with X-ray computed tomography, acoustic emission and ultrasonic techniques. Int. J. Coal Geol. 2014, 122, 91–104. [Google Scholar] [CrossRef]
  32. Watanabe, N.; Hirano, N.; Tsuchiya, N. Determination of aperture structure and fluid flow in a rock fracture by high-resolution numerical modeling on the basis of a flow-through experiment under confining pressure. Water Resour. Res. 2008, 44, 6412. [Google Scholar] [CrossRef]
  33. Nemoto, K.; Watanabe, N.; Hirano, N.; Tsuchiya, N. Direct measurement of contact area and stress dependence of anisotropic flow through rock fracture with heterogeneous aperture distribution. Earth Planet. Sci. Lett. 2009, 281, 81–87. [Google Scholar] [CrossRef]
  34. Gao, Y.; Yao, J.; Yang, Y.; Zhao, J. REV identification of tight sandstone in sulige gas field in changqing oilfield china using CT based digital core technology. In Proceedings of the 2014 International Symposium of the Society of Core Analysts, Avignon, France, 8–11 September 2014. [Google Scholar]
  35. Wang, X.; Yao, J.; Yang, Y.; Wang, X. Visualization Research of the Digital Rock based on Real-time Volume Rendering Methods. Int. J. Pet. Sci. Technol. 2013, 7, 139–145. [Google Scholar]
  36. Yang, Y.; Wang, C.; Yao, J.; Gao, Y. A new voxel upscaling method based on digital rock. Int. J. Multiscale Comput. Eng. 2015, 13, 339–346. [Google Scholar] [CrossRef]
  37. Chen, X.; Zhou, Y. Applications of digital core analysis and hydraulic flow units in petrophysical characterization. Adv. Geo-Energy Res. 2017, 1, 18–30. [Google Scholar] [CrossRef]
  38. Fang, Q.; Boas, D.A. Tetrahedral mesh generation from volumetric binary and gray-scale images. In Proceedings of the IEEE International Symposium on Biomedical Imaging: From Nano to Macro, Boston, MA, USA, 28 June–1 July 2009. [Google Scholar]
  39. Lorenz, J.C.; Branagan, P.T.; Warpinski, N.R.; Sattler, A.R. Fracture characteristics and reservoir behavior of stress-sensitive fracture systems in flat-lying lenticular formations. J. Pet. Technol. 1989, 41, 615–622. [Google Scholar] [CrossRef]
  40. Yao, J.; Hu, R.; Wang, C.; Yang, Y. Multiscale Pore Structure Analysis In Carbonate Rocks. Int. J. Multiscale Comput. Eng. 2015, 13, 1–9. [Google Scholar] [CrossRef]
  41. Wilkins, S.W.; Gureyev, T.E.; Gao, D.; Pogany, A.; Stevenson, A.W. Phase-contrast imaging using polychromatic hard X-rays. Nature 1996, 384, 335–338. [Google Scholar] [CrossRef]
  42. Cnudde, V.; Boone, M.N. High-resolution X-ray computed tomography in geosciences: A review of the current technology and applications. Earth-Sci. Rev. 2013, 123, 1–17. [Google Scholar] [CrossRef]
  43. Lomize, G. Flow in Fractured Rocks; Gosenergoizdat: Moscow, Russia, 1951. [Google Scholar]
  44. Neuzil, C.E.; Tracy, J.V. Flow through fractures. Water Resour. Res. 1981, 17, 191–199. [Google Scholar] [CrossRef]
  45. Lei, G.; Dong, P.; Wu, Z.; Mo, S.; Gai, S.; Zhao, C.; Liu, Z.K. A Fractal Model for the Stress-Dependent Permeability and Relative Permeability in Tight Sandstones. J. Can. Pet. Technol. 2015, 54, 36–48. [Google Scholar] [CrossRef]
  46. Xie, S.; Cheng, Q.; Ling, Q.; Li, B.; Bao, Z.; Fan, P. Fractal and multifractal analysis of carbonate pore-scale digital images of petroleum reservoirs. Mar. Pet. Geol. 2010, 27, 476–485. [Google Scholar] [CrossRef]
  47. Zheng, Q.; Yu, B. A fractal permeability model for gas flow through dual-porosity media. J. Appl. Phys. 2012, 111, 24316. [Google Scholar] [CrossRef]
  48. Wei, W.; Cai, J.; Hu, X.; Han, Q. An electrical conductivity model for fractal porous media. Geophys. Res. Lett. 2015, 42, 4833–4840. [Google Scholar] [CrossRef]
  49. Brown, S.R. Fluid flow through rock joints: The effect of surface roughness. J. Geophys. Res. 1987, 92, 1337–1347. [Google Scholar] [CrossRef]
  50. Velde, B.; Dubois, J.; Moore, D.; Touchard, G. Fractal patterns of fractures in granites. Earth Planet. Sci. Lett. 1991, 104, 25–35. [Google Scholar] [CrossRef]
Figure 1. Reconstructed result of a standard core of 25 mm (the fracture in the picture is the target, and the resolution is 25 μm). (a) XY plane: 1 is the pore space, 2 is the mineral; (b) YZ plane; (c) XZ plane: 3 is the micro-fracture; (d) Three-dimensional (3D) displaying result. The red, green, and blue lines are used to adjust the position of the slices in the three directions (XYZ), respectively.
Energies 10 01833 g001
Figure 2. The scanning results (the resolution of the fine scan is 3.46 μm). (a) The size of the digital core sample is 3.46 mm × 3.46 mm × 3.46 mm); (b) the two-dimensional (2D) picture is a slice of the 3D core sample.
Energies 10 01833 g002
Figure 3. The extracted fracture zone (400 × 400 × 400 pixel3) and partial 3D digital core of the fracture.
Energies 10 01833 g003
Figure 4. (a) Schematic diagram of a typical lab-based micro-Computed Tomography (CT) setup with a conical X-ray beam that allows geometrical magnification; and (b) Experimental device (the core holder was specially made to match the apparatus. The most important characteristic is good X-ray permeability).
Energies 10 01833 g004
Figure 5. The measurement of the fracture width. After finding the same location of the fractures by using the white mineral as the reference in the red rectangular box, and by amplifying the 2D image, we measured the width of the fracture.
Energies 10 01833 g005
Figure 6. The 2D images of the same position in 0 MPa and 0.4 MPa (with the increase of confining pressure). (a) 0 MPa; (b) 0.4 MPa.
Energies 10 01833 g006
Figure 7. The 2D images of the same position in 5.4 MPa and 0 MPa (with the decrease of confining pressure). (a) 5.4 MPa; (b) 0 MPa.
Energies 10 01833 g007
Figure 8. Fracture width with a change in confining pressure.
Energies 10 01833 g008
Figure 9. Meshes of different confining pressures (complex structure will lead to refined meshes). The unit in the figure is pixel. (a) 0.4 MPa; (b) 0.6 MPa; (c) 0.8 MPa; and (d) 5.4 MPa.
Energies 10 01833 g009
Figure 10. The distribution of pressure fields. (a) 0.4 MPa; (b) 0.6 MPa; (c) 0.8 MPa; and (d) 5.4 MPa.
Energies 10 01833 g010
Figure 11. The distribution of velocity fields. (a) 0.4 MPa; (b) 0.6MPa; (c) 0.8 MPa; and (d) 5.4 MPa.
Energies 10 01833 g011
Figure 12. The change of flow rate with the change of confining pressure.
Energies 10 01833 g012
Figure 13. The change of permeability with the change of confining pressure.
Energies 10 01833 g013
Figure 14. The exponential fitting of permeability.
Energies 10 01833 g014
Table 1. Fracture width with an increase in confining pressure.
Confining Pressure (MPa)0.00.40.81.21.82.63.44.25.4
Fracture Width (μm)12.2110.63109.659.319.118.968.848.73
Table 2. Fracture width with a decrease in confining pressure.
Confining Pressure (MPa)5.44.03.02.01.00.0
Fracture Width (μm)8.738.838.949.19.4310.00
Table 3. The change of permeability and flow rate with the change in confining pressure.
Confining Pressure (MPa)00.20.40.60.85.4
Flow rate (m3·s−1)2.36 × 10−98.77 × 10−103.33 × 10−104.99 × 10−111.88 × 10−117.62 × 10⁻¹²
K (mD)0.944 0.351 0.133 0.020 0.008 0.003

