Repercussion of Large Scale Hydro Dam Deployment: The Case of Congo Grand Inga Hydro Project


School of Energy Systems, Lappeenranta University of Technology, Skinnarilankatu 34, 53850 Lappeenranta, Finland
*
Author to whom correspondence should be addressed.
Energies 2018, 11(4), 972; https://0-doi-org.brum.beds.ac.uk/10.3390/en11040972
Submission received: 27 February 2018
/
Revised: 29 March 2018
/
Accepted: 29 March 2018
/
Published: 18 April 2018
(This article belongs to the Special Issue Sustainable and Renewable Energy Systems)
Abstract
:The idea of damming the Congo River has persisted for decades. The Grand Inga project, of up to 42 GW power generation capacity, can only be justified as part of a regional energy master plan for Africa, to bridge the energy gap on the continent. Proponents of very large dams have often exaggerated potential multiple benefits of a mega dam, marginalise environmental concerns and neglect the true risk of such projects, in particular for the fragile economies of developing countries. Studies have reported the financial risks, cost overruns and schedule spills associated with very large dams. In addition, most of the dams in the region are poorly managed. Therefore, the type and scale of Grand Inga is not the solution for millions of not yet electrified people in Sub-Saharan Africa. In this research, scenarios are defined based on announced costs and expected costs. Cost escalations in the range from 5% to 100% for the Inga project in 2030 and 2040 are considered, as average cost overruns are typically at about 70% or higher for similar mega-dams. It was found that when the cost overrun for the Grand Inga project exceeds 35% and −5% for 2030 and 2040 assumptions, respectively, the project becomes economically non-beneficial. In all scenarios, Sub-Saharan Africa can mainly be powered by solar photovoltaics to cover the electricity demand and complemented by wind energy, supported by batteries. Hydropower and biomass-based electricity can serve as complementary resources. The grid frequency stability of the power system is analysed and discussed in the paper. Benefits of the Inga hydropower project have to be increasingly questioned, in particular due to the fast cost decline of solar photovoltaics and batteries.
1. Introduction
Energy is vital to Africa’s development [1]. Africa needs clean, consistent, and cost-effective energy supply to meet the current energy deficit and future demand. The currently insufficient generation capacity and growing demand require rapid response, and they should be managed in a sustainable way [2]. Therefore, investment in a sustainable energy infrastructure is a crucial link between economic growth, development and climate action. Renewable energy optimization will reduce the reliance on fossil fuel as the predominant energy source in the power system, and address socio-economic development needs and vulnerability to environmental alterations [3,4].
One proposed response to address the energy challenges and persistent infrastructural gaps in Africa is to significantly increase investment in large hydropower dams [5,6]. The scramble for hydropower development in the region can be best understood as electricity fits into the larger dynamics of capitalist accumulation and crisis in Africa [7]. So the question arises, are large dams the solution to energy insufficiency and should more dams be built in Africa? This is especially relevant when considering that most dams in Africa underperform due to poor maintenance [5]. Additionally, hydro-dependent power systems are susceptible to power cuts due to the exacerbating effect of droughts and water shortages [8]. These precarious situations have resulted in dwindling power availability in African countries with high dependence on hydropower, such as Zambia, Zimbabwe and Ethiopia [9]. Nevertheless, advocates of large dams are predictably over-optimistic about schedule, cost and benefits of hydropower project development; they often envisage and exaggerate on multiple public benefits [10,11], disregarding the true risks of the project to host communities and the consequence to fragile economies especially in Sub-Saharan Africa (SSA) [7,12], and often downplay environmental and social cost [9,13]. This occurs while facing the requirement of 100 bUSD, almost three times the Democratic Republic of Congo’s (DRC) estimated GDP for the year 2011 [14].
About 95% of those living without electricity reside predominantly in rural areas of SSA and developing Asia [1], in countries often hosting of large hydropower dams, showing how ineffective the “hydro dam strategy” is as an option for electrification of rural areas [7]. For instance, the power harnessed from Grand Inga is not envisioned for supplying electricity to domestic users or increase electricity access to rural areas [15]. Instead it is intended to cover points of high demand such as cities and industrial centres, or to be exported through electricity highways [14,15]. Similarly, large hydro dams such as Kariba and Cahora Bassa on the Zambezi River, have supplied electricity to urban and industrial zones, but have mostly bypassed rural needs [16]. Thus, off-grid renewable energy (RE) technologies, particularly photovoltaic (PV) based technologies (solar home systems and mini-grids) could provide a sustainable solution to energy challenges where the cost of grid extension is not economical [17,18,19]. Hence, there is an imminent need to address the delusion or false prevailing perception of large hydro dams as a solution to big energy problems [8]. In addition, decision and planning for energy development in SSA should strike a balance between energy needs for industrial purpose and human development [7].
Large scale hydroelectric developments are, largely, contentious and controversial due to their social, environmental and financial impacts [10,11]. Social impact of dams have been studied since the 1960s [20], and roughly 200 million people have been displaced due to infrastructure development. Displacement due to dam development accounts for 40% (80 million) of the total displaced population [20,21]. Additionally, profound environmental impacts are associated with development of large dams [5,10,22,23]. Adverse environmental debasement such as climate change, drought, hydrological interference and associated downstream impact have been a major problems in a number of African hydropower projects [15]. Beyond environmental and social impacts, large hydropower projects are often susceptible to substantial financial risk due to cost overruns and schedule spills [10,23,24,25,26,27,28]. Hydro dams cost a great deal of capital upfront, and funding agreements are extremely leveraged with debt, usually accounting for 70 to 80% of the overall funding [11]. Previous studies on large projects reveal that the cost escalation is traceable to various reasons; political-economic influence and optimistic bias perception are major causes of overruns [10,25,26,29]. In [26], 58 dams financed by the World Bank from 1976 to 2005 were analysed. The study reports that about 78% of dams exceeded their initial estimated cost. The authors concluded that the traditional cost-benefit approach for appraising dams might not be sufficient to evaluate the level of uncertainty associated with their construction costs, which raises question on improving assessment methodology. Recent studies have recommended using reference class forecasting to improve performance of cost escalation analysis [10,25,26]. Another study analysed 61 hydropower plants and reported that these plants exhibit an average cost escalation of 71%, while 35 wind farm projects and 39 solar plants experienced 7.7% and 1.3% average cost escalation [30]. The authors reported the impact of skewed distribution of hydropower cost on their statistical analysis. According to their analysis, dams with large reservoirs incurred the most significant cost overrun, and some individual projects such as the La Grande 2 Dam in Canada, Three Gorges Dam in China, and Sayano–Shushenskaya Dam in Russia, had between 17 and 48 billion USD in cost overruns.
Nonetheless, there is a prevalent need for expansion of power generation in SSA, due to chronic power shortage and increasing demand [11,31]. Furthermore, SSA electricity demand is expected to grow over 3 times by 2040. In this time, demand from industry will double while residential demand will grow more than five times the current level [32]. Figure 1 shows the total active installed power generation capacities at the end of 2014 in SSA, and illustrates the almost complete reliance on fossil fuels and hydropower in the region [33]. The region has a huge untapped RE resource potential, sufficient to close the energy access gap, and could be achieved by stimulating new investments in RE technologies [1].
Globally, RE technology installation capacities are growing fast due to their constantly declining costs [34]. Particularly, the price of solar PV modules has fallen by 80% since the end of 2009 [35] and continues to decline [36,37]. PV offers economic solutions in regions with already high but also low electrification rates for new capacity additions and for meeting demands on-grid and off-grid [17,35]. Recent studies have explored the possibility of 100% RE based power systems in different countries and regions [38,39,40,41]. Barasa et al. [40] described a 100% RE energy system for SSA, covering the electricity demand of the sectors power, water desalination and industrial gas. The result of the modelling of Barasa et al. determined a cost optimal mix of the various technologies for the year 2030. According to the results, the least cost energy solution for SSA will be powered mainly by solar PV and complemented by wind energy [40]. The results of Barasa et al. [40] are integrated in a global context in Breyer et al. [41]. Blechinger et al. [19] modelled two scenarios to understand the impact of future grid extension in SSA, and in both scenarios grid extension led to the highest share of electrified people followed by solar home systems and lastly mini-grids. In Africa, solar PV has transcended from the government-donor niche to a commercial based market [42].
Furthermore, in fully RE based power systems, the frequency stability (to be precise, system inertia) is regarded as one of the greatest concerns of Transmission System Operators (TSOs) around the world. The term ‘inertia’ is referred to the total amount of kinetic energy stored in the rotating mass of synchronous generators [43]. The system inertia is low with high penetration of variable RE since the rotating mass of the connected synchronous machines is reduced. The lower inertia means that connected frequency regulation reserves must be able to respond faster than currently [44,45]. In this study, rate of change of frequency (ROCOF) when only synchronous generation (hydropower, biomass power plants, and geothermal units) contributes to the frequency balancing was first calculated. Then synthetic inertia of wind turbines is included, then the synthetic inertia from solar PV plants. Finally, the synthetic inertia contribution from the battery units is included.
In this article, a 100% RE system in SSA will be analysed, based on the utilization of different RE resources, as well as storage and grid technologies. The primary focus of this study is to present an overview analysis of the impact of developing the Grand Inga project in the Democratic Republic of Congo (DRC) and SSA. Section 2 provides an overview of the Inga project’s historical development and Section 3 discusses the sustainability concerns of hydropower development on Congo River. The methodology and model used, including assumptions, construction and formulation of scenarios, are presented in Section 4 and Section 5. In Section 6, results are reported for the years 2030 and 2040. Frequency stability of the power system is analysed in Section 7. The discussion and conclusions are presented in Section 8 and Section 9, respectively.
2. Grand Inga Project: The History and Development
The Inga Rapids have been long targeted for hydropower development [46]. The idea of using the Congo River for electricity production dates back to 1885, and the site was noted in a world survey in 1921 and endorsed by the Belgian colonial authorities in the 1950s [11,46,47]. The features of the Congo River make it of special interest to hydropower development; it is the second largest river in the world in terms of water flow rate (42,000 m3/s) after the Amazon, and the second longest river in Africa after the Nile, starting from the plateaus and mounts of the Rift Valley, meandering its way around the equator, and discharging finally into the Atlantic Ocean [48]. The Inga Rapids and waterfalls give the Congo River an enormous hydropower potential, with an estimated power generating capacity of 42 GW [11]. With such a generation capacity, and if the project is ever completed, Grand Inga would emerge as the single largest source of hydropower in the world, and is intended to bridge the energy gap in Africa [11,12,49].
The details of the Grand Inga project have changed significantly over the years [50]. The project is divided into eight dams and seven phases [49]. The first two phases of the Inga electricity scheme were commissioned in 1972 and 1982, Inga 1 (351 MW) and Inga 2 (1424 MW), respectively [11,12,51]. Inga 1 and Inga 2, were built disregarding the feasibility study that found both projects to be uneconomical and far exceeded the DRC’s electricity needs at that time. Power from both dams has mainly served the Katanga valley mines and the export market. It is estimated that the cost of the Inga 1 and Inga 2 dams constitutes over half of the DRC’s current external debt [7]. The construction of the Inga-Kolwezi transmission line, a 1725 km long transmission line to the Katanga copper belt, accounted for the biggest share of the DRC’s debt problem during the 1990s. The construction cost of the transmission line quadrupled from the initial estimated cost to reach 1 bUSD [52]. In addition the Inga 1 and Inga 2 dams have operated at continuously decaying capacity during their lifetimes, as their state of operation and maintenance have deteriorated the over time since their commissioning [49,53]. As of 2002, these dams were operating at only 40% capacity due to lack of maintenance, financial mismanagement, corruption and poor governance [51,52].
The subsequent phases of the Inga scheme is the construction of Inga 3 (low-head) with an estimated capacity of 4755 MW, which is planned to be completed in 2020 [11] but not yet started. Figure 2 shows the Congo River and Inga phases. Following phases of the Inga project, maximum installed capacities and assumed years are as follow: Inga 3 high-head (2025) 3037 MW, Inga 4 (2030) 7182 MW, Inga 5 (2035) 6970 MW, Inga 6 (2040) 6684 MW, Inga 7 (2045) 6706 MW and Inga 8 (2050) 6747 MW [11]. Three consortia have expressed interest in the development of Inga 3: China Three Gorges Corporation and Sinohydro; a consortium of South Korean (Posco and Daewoo) and Canadian (SNC Lavalin) companies; and third one is composed of Spanish companies [32].
The Grand Inga project may be too costly, and it was estimated 10 years ago at over 80 bUSD, of which 12 bUSD would be for the initial Inga 3 base chute phase [53]. Projects of this scale require substantial capital, expertise and strong governance, all of which have suffered huge setbacks in SSA to varying degrees [11]. Moreover, continuing with the development of the Inga dams would be trusting capital to a government that has continuously failed to maintain and operate the already operating dams properly [7,55].
3. Energy and Environment: Hydropower Development and Congo River Sustainability Concerns
The Congo River basin is home to the second largest tropical forest and world’s largest tropical swamp, altogether about 2 million km2 [56] of area distributed over the countries of Cameroon, Congo Republic, DRC, Equatorial Guinea, Gabon and Central African Republic. This rainforest area is often referred to as “the lungs of the Earth” together with the Amazon, the only other river and tropical forest bigger than the Congo itself. The Congo River basin is the habitat of vast wildlife including 5862 species of birds, 460 species of reptiles, 552 species of mammals, including 2 species of gorillas and 2 species of chimpanzees [56], all unique to the multiple ecosystems of the Congo river basin.
Regarding vegetation, this is suspected to be the richest region of the world regarding of density of plant species per unit of area [56]. Different estimates account for as much as over 35,000 species of plants in the Congo River basin [56], of which 2427 are endemic and some of them endangered. Analysis by satellite imagery from the years 1986 to 2003 carried out by [57] shows that the deforestation rates of the Congo basin are rather small in the central region of the forest, likely due to the difficult access to the areas and low population densities. In contrast, coastal areas experience already a much higher rate of deforestation, as the jungle is vulnerable due closeness to more dense population centres and to trade routes.
Hydroelectric guiding construction protocols are lacking in some tropical developing countries, and small dams (<10 MW) are exempted in many countries from any formal decision making process [13]. In order to carry out a feasibility study and environmental and societal impact analysis of Inga 3, the World Bank approved a fund of 73 mUSD in March 2014 [58,59]. Even though the project has been in consideration for decades, this is the first time environment and societal costs were taken into consideration, and funding was dedicated to sustainability. Until now sustainability issues was disregarded by the stakeholders of the project even after the deployment of Inga 1 and Inga 2, the first two phases of the project. Already 30% of the water of the Congo River is being diverted for hydropower production at the hydropower stations Inga 1 and Inga 2 [60]. Development is greatly required in the region and development benefits are analysed and clear [61], but a more serious consideration of the ecosystem needs to be taken into account, since the organization that developed and conducts the most universally used hydropower sustainability assessment is under constant criticism for lack of transparency and deepness of the sustainability research [62].
Methane (CH4) is the second most impactful greenhouse gas (GHG) after carbon dioxide, it accounts for over 20% of alteration in the radiative forcing due to anthropogenic GHG emission to the atmosphere [63]. Hydroelectric reservoirs, particularly in tropic regions, constitute an appreciable source of CH4 to the atmosphere [64]. In some cases CH4 can reach up to 70% of the total reservoir emissions [65]. Large and deep tropical reservoirs are frequently thermally stratified, which inhibits water mixing and diffusion. This situation enhances CH4 emissions [64,65]. Global large dams have been found to release 104 ± 7.2 Tg CH4 yearly to the atmosphere via reservoir surface, turbine and spillways [63], equivalent to 1.3–1.5% of global GHG emissions from methane sources of 2010 levels, and representing 0.2% of all global GHG emissions.
While there are techniques to diminish the impact of a hydropower plants on hydrological systems and ecosystems (such as run-of-river set ups, sludge gates, fish ladders, etc.), it is not possible to entirely eliminate all effects on hydrological systems.
4. Methodology and Model Description
4.1. Model Overview
The power system used in this study was developed to match generation and power demand for every hour of the simulated year. In addition, a model was designed based on linear optimization of energy system parameters, characterised by having an objective function for cost optimization under certain constraints [66]. The model is compiled in using MATLAB (R2016a, The MathWorks, Inc., Natick, MA, USA) [67], while the optimization is carried out in MOSEK (version 8, Mosek ApS., Copenhagen, Denmark) [68]. It is composed of electricity generation technologies, storage technologies, electricity transmission technologies and finally the bridging technologies, which provide flexibility to the energy system. The hourly modelling results in a more accurate system description, highlights flexibility, and presents a synergy effect of various power generation and storage technologies required to be installed to attain a fully RE-based power system. The model has been used before to conduct studies for several different regions so far, and a detailed description can be found in [38,39,40,41]. For this analysis, the integration of desalination and non-energetic industrial gas demand was not included. Detailed model description, equations and applied constraints can be found in Bogdanov and Breyer [39]. Additional technical and financial assumptions are provided in the Supplementary Material to this paper.
The target function of the model is to optimize the system so that the total annual energy system cost is minimized. This cost is calculated as the addition of the annual costs of the installed capacities of each technology, electricity generation costs, and costs of generation ramping. In addition, the energy system takes account of the PV prosumers for residential, commercial and industrial sectors and their respective capacities of rooftop PV systems and batteries. The target function for prosumers is the minimization of the cost of consumed electricity. This cost is calculated as the sum of self-generation cost, annual cost, and cost of electricity consumed from the grid. A multi-node approach is utilised in the model, which allows for the definition of any preferred configuration. The main optimization constraint is to guarantee electricity coverage of local demand is considered on an hourly basis for the applied year, as shown in Equation (1). The model overview is shown in Figure 3.
The key constraint of the system optimization is given in Equation (1). It is well-defined as for every hour of a year in each region, electricity generation from all the technologies (Egen,t), imported electricity from the regions (Eimp,r) and electricity from storage discharge (Estor,disch) should be equal to the total demand for an hour (Edemand), electricity exported to other regions (Eexp,r), electricity for charging storage technologies (Estor,ch) and curtailed electricity (Ecurt). Other abbreviations used in this equation are: hours (h), technology (t), all technologies used in modelling (tech), sub-region (r), all sub-regions (reg). Equation (2) provides the target function for system optimization. The abbreviations used here include (CAPEXt)—capital cos of each technology, (crft)—capital recovery factor for each technology, (OPEXfixt)—fixed operational cost for each technology, (OPEXvart)—variable operational cost each technology, installed capacity in a region (instCapt,r), electricity generation by each technology (Egen,t,r), ramping cost of each technology (rampCostt) and annual total power ramping values for each technology (totRampt,r).
The technologies introduced in the LUT Energy System model used to analyse the SSA region can be categorized into four main groups: technologies for electricity generation, storage technologies, bridging technologies and electricity transmission technologies.
The electricity generation technologies introduced in the model include various PV technologies (ground-mounted fixed tilted, single-axis, and rooftop solar PV systems), hydropower (run-of-river and reservoir based), biomass plants (solid biomass and biogas), wind onshore turbines, geothermal power plants, concentrating solar thermal power (CSP) and waste-to-energy power plants. Due to the intermittency of RE and to ensure steady supply of electricity, the RE technologies are complemented by various storage technologies. These technologies are pumped hydro storage (PHS), batteries, adiabatic compressed air energy storage (A-CAES), thermal energy storage (TES) and power-to-gas (PtG). Regarding transmission of electricity, inter-regional transmission grids are modelled by applying high voltage direct current (HVDC) technology, while power distribution and transmission within the sub-regions are assumed to be based on standard alternating current (AC) grids which are not part of the model. All technologies are shown in the Figure 4.
4.2. Subdivision of the Region and Grid Structure
The subdivision and grid configurations of SSA are shown in Figure 5. Existing HVDC interconnections of SSA are shown by dashed lines. The structure of the assumed HVDC grid for the scenarios (solid lines) is based on the existing configuration of SSA power pools and the respective load centres. The overview of transmission line parameters is presented in the Supplementary Material (Table S1). The study considered 51 countries that are merged or subdivided into 16 sub-regions (Figure 5) and Supplementary Material (Table S2). The SSA regional network is based on area, population, and national grid connections.
4.3. Technical and Cost Assumptions
The financial assumptions are made for all energy system components for the years 2030 and 2040, and include operational expenditures (OPEX), capital expenditure (CAPEX), and lifetimes as tabled in the Supplementary Material (Table S3). For all scenarios, weighted average cost of capital (WACC) is set to 7%. However, WACC is set to 4% for residential PV prosumers due to lower expectations of financial return. The technical assumptions regarding energy-to-power ratios for storage technologies, efficiency numbers for generation, and power losses in HDVC power lines and converters are presented for the years 2030 and 2040 in the Supplementary Material (Tables S4–S6). Electricity prices for commercial, residential and industrial consumers for all countries in the region for the years 2030 and 2040 are derived according to Gerlach et al. [69]. Prices are presented in the Supplementary Material (Table S7). Excess electricity generated by PV prosumers is fed into the grid and is assumed to be sold for a transfer price of 0.02 €/kWh. The overview of prosumer electricity cost, installed capacity and energy utilisation for SSA in the years 2030 and 2040 is presented in the Supplementary Material (Tables S8 and S9).
The upper limits for all RE capacities were estimated according to Barasa et al. [40] and lower limits are obtained from Farfan and Breyer [33]. Upper and lower limits of installed capacities are presented in the Supplementary Material (Tables S10 and S11). It is assumed that solid biomass, waste and biogas fuels are available throughout the year evenly. A synthetic electricity demand profile is estimated using IEA data [1], based on an electricity demand increase for the years 2030 and 2040.
4.4. Potential for Renewable Energy Resources
The generation profiles for wind energy, optimally tilted PV, single-axis tracking PV and solar CSP were calculated according to Bogdanov and Breyer [39]. The hydropower feed-in profile was based on precipitation data for the year 2005 as a normalized sum of precipitation in each of the regions [70].
The biomass and waste resource potentials are obtained from the German Biomass Research Centre [71] and classified according to Bogdanov and Breyer [35]. The cost of biomass was based on data provided by International Energy Agency (IEA) [72] and Intergovernmental Panel on Climate Change (IPCC) [73]. For solid waste a 50 €/ton gate fee was assumed. Additional information on biomass and solid waste costs is provided in the Supplementary Material (Table S12).
The geothermal potentials are calculated for the sub-regions based on the available information related to heat flow rates and ambient temperature of the surface for the year 2005 [74,75]. For the sub-regions where the heat flow data was not available, extrapolation was performed to get the required data. The geothermal heat is estimated based on the available data in [76,77,78]. Regional biomass and geothermal energy potentials are presented in the Supplementary Material (Table S13).
The generation, load and grid profiles can be visualised in Supplementary Material (Figures S1 and S2). In addition, the state-of-charge of storage technologies is given in Supplementary Material (Figures S3 and S4).
5. Scenario Formulation
A range of scenarios has been formulated, in order to analyse the impact of the Grand Inga project on the SSA power system. To achieve the aim of this paper, categories of scenarios were formulated based on announced and overnight cost assumptions. The overnight cost assumption was based on the findings of Ansar et al. [10] with respect to cost overruns. The study reports that the actual cost of large hydro dam developments worldwide were on average 96% higher than the estimated cost. The authors report that the overrun cost figures exclude inflation, debt, environmental cost and social cost. The defined scenarios were based on an area-wide interconnected energy system, which assumes that all sub-regions are interconnected via HVDC lines. All scenarios will be analysed from a scope of assumptions for the years 2030 and 2040 for an evolutionary perspective. Since every subsequent stage of the Grand Inga would take years (up to over a decade) to be commissioned, a long term scope is used to compare it with more realistic market conditions of the project at the point of the start of operations.
5.1. Detailed Description of Scenarios
This section presents a conceptual description of the scenarios generated. All the generated scenarios will be compared to a reference generated and presented by Barasa et al. [40], simulated as an optimal future energy mix for the region. The difference between the reference scenario and the proposed scenarios will remain in the CAPEX assumptions for individual hydro dam and hydro run-of-river plants according to the announced numbers for the specific Grand Inga stages. The cost assumptions for all other technologies remain the same as in the reference scenario, and the capacities are then optimized by the model.
5.1.1. No Inga Scenario
The base scenario proposed in this paper does not consider any of the stages of Grand Inga deployed. This scenario assumption may appear unrealistic when considering that the first two stages of the project, Inga 1 and Inga 2, have been commissioned in the year 1972 and 1982, respectively. However, it is due to continuous mismanagement and lack of maintenance [7] that the hydropower stations have been underperforming and experienced continuous shut downs. Therefore, the scenario considers no further development of the Grand Inga and possibly, if the simulation proves it optimal, the rehabilitation of the Inga 1 and Inga 2 hydropower stations. As in every other scenario, a number of renewable and sustainable alternatives, including other smaller hydropower stations, will be considered in order to achieve an optimal mix for the energy system
5.1.2. Optional Inga 3 Scenario
Despite Grand Inga (GI) being under consideration for over 60 years, after the completion of Inga 1 and Inga 2 in 1972 and 1982, respectively, the Grand Inga project has been stuck for decades. Only in recent years the concept of the Inga 3 (I3) has been revised again, and according to the World Bank [79], from the amount granted to the DRC for feasibility studies since 2014, every quarterly report has returned with “high risk” and “highly unsatisfactory” tags. So far it seems to be socially, environmentally and economically pointless to further develop the GI project. Consequently, the second scenario proposed considers the rehabilitation of Inga 1 and Inga 2, and leaves the development of I3 open for realization. The deployment of I3 is analysed from the last CAPEX announced for the hydropower plant of 14 bUSD (10.8 b€) [80], up to the estimated cost overrun of +100% (rounded from 96% as already experienced) as it is the average cost overrun of large hydropower plants found by [8,26]. Since further stages of Grand Inga depend on the installation of Inga 3, for this particular scenario any GI deployment after Inga 3 is not considered. However, other minor hydropower plants, with an added potential of 283.2 MW estimated in [40], could still be deployed.
5.1.3. Forced Inga 3 and Grand Inga Scenario
In this scenario Inga 3 is forced into operation. Subsequent phases of the Grand Inga project with a number of steps between the last announced CAPEX for further developments of Grand Inga of 100 bUSD (76.9 b€) [81], to a maximum of up to +100% CAPEX cost overruns following the same assumption as for Inga 3 according to [10,28]. Just like in previous scenarios, all other RE and sustainable RE sources are considered, including other minor hydropower projects.
6. Results
In this section an overview of the findings of the study is presented. The least cost energy configurations were derived based on certain constraints and characterised by optimized installed capacities of RE electricity generation, storage and transmission for every technology used in the model. Consequently, respective hourly generation of electricity, charging and discharging of storage technologies, sub-regional electricity trade, and curtailment were obtained. The main financial results for all the scenarios in the years 2030 and 2040 are presented in Table 1 and Table 2, respectively, which include the following:
- Levelised cost of electricity for primary generation (LCOE primary),
- Levelised cost of storage (LCOS),
- Levelised cost of curtailment (LCOC),
- Levelised cost of transmission (LCOT),
- Levelised cost of electricity in total (total LCOE),
- Total CAPEX,
- Total annualized cost (ann. cost),
- Total RE capacity,
- Total primary generation.
The installed capacities of main storage and generation technologies are presented in Table 3. In comparison to other RE technologies the share of PV dominates in all the scenarios. The share of solar PV installed capacity is approximately 170 GW and 600 GW for the years 2030 and 2040, respectively, for all the scenarios. PV single-axis tracking dominates the share of total installed PV capacity in all scenarios for the years 2030 and 2040. PV single-axis tracking constitutes about 110 GW in 2030 and 400 GW in 2040. This leads to a capacity share of all PV capacity of 47% in 2030 and 84% in 2040, which translates into an electricity generation share of 38% in 2030 and 77% in 2040. The share of wind installed capacity decreases from about 130 GW in 2030 to 60 GW in 2040, in all the scenarios, which is a consequence of the increasing PV competitiveness. The installed capacities of RoR hydro remained constant at 6.3 GW for Inga 3 announced and expected scenarios, and reached 11.1 GW for the Grand Inga scenarios in the year 2030 and 2040. And the installed capacity of hydro dams was about 20 GW in all the scenarios. For the year 2030, the share of geothermal installed capacity dropped from 4.6 GW for Inga 3 announced and expected scenarios to about 3.3 GW in the Grand Inga scenarios. However, for the year 2040 the share of geothermal capacity remained constant at 3.0 GW for all the scenarios. The installed capacity of municipal solid waste incineration plants remained constant at 1.7 GW and 1.9 GW in the years 2030 and 2040, respectively, for all the scenarios, since it is driven by the waste resource. In 2030, the share of biogas decreased from about 16 GW for Inga 3 announced and expected scenarios to about 13 GW for the Grand Inga scenarios. Meanwhile, the share of biogas remained constant at 4.8 GW for all the scenarios in the year 2040. In 2030, the solid biomass contribution remained constant at 2.6 GW for Inga 3 scenarios, and stayed in the range of 1.0 GW to 1.8 GW for the Grand Inga scenarios. By 2040, there was no solid biomass contribution in any of the scenarios.
Regarding storage capacities, the gas storage share dominates in all the scenarios. Battery storage capacity increased from approximately 230 GWh in 2030 to 1500 GWh in 2040. PHS storage capacity remained constant at 3.2 GWhel and 1.6 GWhel for the years 2030 and 2040, respectively, in all the scenarios. The installed capacity of A-CAES declined significantly in the year 2040, when compared to the year 2030. PtG capacity is approximately 6.0 GWel in the years 2030 and 2040, for all the scenarios. However, when storage throughput is considered, battery storage has a 58% and 91% share of throughput in 2030 and 2040, respectively. The highest share of battery throughput in all scenarios considered for the years 2030 and 2040 is 77 TWh and 498 TWh, respectively. The dominance of battery storage is due to its compatibility with solar PV and fast cost decline. The overview of storage capacities, output and full cycles per year for all scenarios in 2030 and 2040 are presented in the Supplementary Material (Tables S14 and S15).
Figure 6 and Figure 7 show the total annual cost trend for the GI scenarios in 2030 and 2040, respectively. From Figure 6 it can be seen that if the cost overrun exceeds 35% (as such projects usually do at least), the cost to the system is too high compared to the reference without GI. Furthermore, Figure 7 shows that even if the cost remains as announced, the cost to the system is too high compared to the alternative without GI for 2040 assumptions. This clearly shows that with cost overrun up to around +40% and 0% for 2030 and 2040 scenarios, respectively, the project is economically beneficial (not taking into account the environmental impact). Above that limit the economic benefit disappears and turns into a burden.
Figure 8 and Figure 9 and Figures S5–S8 in the Supplementary Material, show the LCOE of all the scenarios in the years 2030 and 2040; the figures show on the left and right the absolute and relative values of the LCOE, respectively. The relative value represents the percentage difference of absolute value of the respective scenario compared to the reference scenario.
The percentage difference in the levelised cost of electricity for Inga 3 announced cost scenario is presented in Figure 8 (top right) and (bottom right), for the years 2030 and 2040, respectively. Regarding regional average LCOE, it can be deduced that the impact of Inga 3 is negligible in both 2030 and 2040 cases, and the relative percentage differences in LCOE range from −3.2% to 0.8% in 2030 and from −2.0% to 0.3% in 2040, across the regions, while the overall regional relative averages are −0.4% and −0.1%, for 2030 and 2040, respectively. The overall average LCOE is 54.1 €/MWh in 2030 and 41.7 €/MWh in 2040 as shown in Figure 8 (top left) and (bottom left), respectively. According to the 2040 scenario, DRC experienced an almost negligible decrease in LCOE of 1.3%, while neighbouring regions faced mixed effects. In the adjacent regions the highest LCOE decrease was by −1.4%, while the West North region experienced an increase of 0.8%. Somalia experiences the steepest decrease in LCOE of −3.2%, which is still almost negligible. Furthermore, for the same scenario but with 2040 assumptions, the effects on the LCOE are further reduced closer to negligible levels, being less than ±0.5% difference in the whole region with the exception of Somalia (−2%) and the Kenya-Uganda region (−0.7%).
Similarly, Figure 9 (top right) and (bottom right) shows the percentage difference in LCOE for the Inga 3 expected scenario for the years 2030 and 2040, respectively. Regarding LCOE, the regional impact of Inga 3 in these two scenarios is as well negligible, the relative percentage difference in LCOE was in the range of −3.5% to 18.4% in 2030 and from −0.7% to 11.5% in 2040. However, most of the cost burden is allocated to the DRC as LCOE increases by 18.4% and 11.5% in 2030 and 2040, respectively. The overall regional average increased by 0.2% and 0.3% in 2030 and 2040, respectively, in comparison to the Inga 3 announced cost scenario. The overall average LCOE is 54.5 €/MWh in 2030 and 41.9 €/MWh in 2040 as shown in Figure 9 (top left) and (bottom left). In this scenario, DRC experience tremendous increase in LCOE, yet the benefit impact is negligible in the whole region, again with Somalia being the country with the largest benefit, though almost negligible, of −3.5% and −2% LCOE in 2030 and 2040 scenarios, respectively.
Furthermore, the percentage difference in LCOE for Grand Inga 0% scenario (cost as announced) for the years 2030 and 2040 is shown in Supplementary Material Figure S5 (top right) and (bottom right), respectively. The relative difference in the LCOE ranges from −11% to 12.9% in 2030 and from −7.5% to 16.1% in 2040, across the regions. With respect to LCOE, the regional impact of Grand Inga remains negligible in both years. For the year 2030, in this scenario the LCOE increases by 10.9%, 10.7% and 12.9% in Central, Congo and South West regions, respectively. By 2040, the LCOE increases by 16.1% in the host country. Meanwhile, Somalia and Djibouti experience −11.7% in 2030 and −7.9% in 2040 LCOE reductions. The overall regional relative average is −0.7% and 0.1% by 2030 and 2040, respectively. Supplementary Material Figure S5 (top left) and (bottom left) presents the LCOE numbers across SSA, where the overall average LCOE decreased from 54.0 €/MWh in 2030 to 41.7 €/MWh to 2040. Supplementary Material Figure S5 shows that in this scenario the effect of installing GI is no longer negligible. The DRC and its southern and northern neighbouring regions face a steep increase of LCOE of over 10% to a maximum of +12.9%, while the only regions receiving a non-negligible benefit are Somalia (with −11.7%) and Tanzania (−6.1%) in 2030. Furthermore, for 2040 the situation becomes more dire for DRC, as developing GI would result in a very significant increase of LCOE of +16.1%, while the neighbouring regions receive only a negligible benefit of −2% at most, even for just the announced cost of GI.
Similarly, Supplementary Material Figure S6 (top right and bottom right) shows the percentage difference in LCOE for the Grand Inga +50% scenario (cost 50% higher than announced) in the years 2030 and 2040, respectively. The relative percentage of the LCOE difference to the reference ranges from −11.7% to 29.0% in 2030 and from −7.8% to 31.1% in 2040, across SSA. The overall regional relative average increased to 0.3% and 0.7%, by 2030 and 2040, respectively. Similar to the previous scenario, LCOE declined by −11.7% in 2030 and −7.7% in 2040 in Somalia and Djibouti, while in the DRC the LCOE increased by 29% and 31% in 2030 and 2040, respectively. In this scenario the LCOE is 62.0 €/MWh in 2030 and 53.7 €/MWh in 2040 in the DRC, as shown in Supplementary Material Figure S6 (top left) and (bottom left), respectively. In this scenario, DRC bears a tremendous cost burden, while the LCOE decrease in most region was minimal, except for Somalia, in both years.
The percentage difference in LCOE for the Grand Inga +100% cost scenario (cost 100% higher than announced) is shown in Supplementary Material Figure S7 (top right) and (bottom right) for the years 2030 and 2040, respectively. The relative percentage difference in LCOE ranges from 0.0% to 42.2% in 2030 and from −7.7% to 46.9% in 2040. In this scenario, the DRC will experience 42.2% and 46.9% increase in LCOE, by 2030 and 2040, respectively. While the overall regional relative LCOE average increased by 2.0% in 2030 and 1.4% in 2040. The overall average LCOE is 55.5 €/MWh in 2030 and 42.3 €/MWh in 2040, as shown in Supplementary Material Figure S7 (top left) and (bottom left). The LCOE in DRC increased to 68.4 €/MWh in 2030 and 60.2 €/MWh in 2040, as shown in Supplementary Material Figure S7 (top left) and (bottom left). Similar to the previous scenario, the benefit impact on surrounding countries is still negligible without exception, while LCOE skyrocketed in DRC to +42.2% and +16.5% in the South-West region in 2030, resulting in an overall region increase of LCOE by +2%. For 2040 the situation for DRC only gets worse, as the increase of LCOE escalates further to +46.9%.
The percentage difference in the LCOE for the Grand Inga +35% and −5% scenarios is shown in Supplementary Material Figure S8 (top right) and (bottom right), respectively. In both scenarios the overall relative LCOE average was 0.0% for the entire region. Yet, DRC LCOE increased by 24.0% and 14.7%, in Grand Inga 35% and −5%, respectively. This implies that when cost overruns of Grand Inga increases the CAPEX by 35% in 2030 and −5% by 2040, the project brings no economic benefit to the electricity cost of SSA. The overall average LCOE is 54.4 €/MWh in 2030 and 41.7 in 2040 €/MWh, as shown in Supplementary Material Figure S8 (top left and bottom left), respectively. According to this scenario, DRC still experience an increase in LCOE; however, the impact is still negligible. In the adjacent regions the highest decrease was by 4% in 2030 and 1.4% in 2040, and a similar occurrence was noticed in regions in the West and East. Conversely, for Somalia LCOE decreased by 11.5% in 2030 and 7.8% in 2040.
Further graphical results are presented in the Supplementary Material (Figures S9–S13).
7. Frequency Stability
The conventional regulation concept is based on controlling the frequency with conventional prime movers such as thermal and hydropower generation. This conventional grid is known to possess large rotating mass due to the large synchronous machines that are directly connected to the grid. These large synchronous machines react naturally to the frequency deviations and large inertia guarantees that the ROCOF will be slow enough so that power generation plants are able to react to the change in frequency, either by increasing or decreasing their powers depending whether change in frequency is negative or positive, respectively. In fully renewable energy based power systems the inertia will become low, since the rotating mass of the connected synchronous machine is reduced [44,45]. The lower inertia means that connected frequency regulation reserves must be able to respond faster than currently. Frequency control reserves include power plants that react to frequency changes in the grid. Typically the reserves are divided into three parts: primary, secondary, and tertiary reserve. In principle, primary reserve is used to make sure that the peak change in frequency (i.e., frequency nadir) remains as small as possible and that frequency is balanced. The secondary reserves correct the frequency to its nominal value, and release the primary reserves for next possible event. Tertiary control optimises the use of reserves so that it is as economical as possible [82,83].
Here, the primary reserves are the main focus. Frequency limits how primary control reserves are activated varies from area to area. Since wind energy and solar PV plants are intermittent by nature their power production is limited by the available wind and solar irradiation. However, it has been shown that wind and solar PV can also participate into frequency regulation when so called synthetic inertia functionality is applied [84,85]. Also HVDC power lines can be utilized for balancing by applying the inertia emulation feature as shown in [86]. It is claimed that a wind turbine is capable of producing additional power up to 6% of the nominal apparent power for about 10 s [85]. In [82] it is also shown that solar PV plants could participate in frequency balancing by emulating the inertial property. It is concluded in [87] that in fully renewable power grids all the power generation sources that are capable of generating synthetic inertia must be utilized in order to maintain frequency stability.
Based on hourly connected generation capacities the ROCOF for the grid can be evaluated [88]. According to European Network of Transmission System Operators for Electricity (ENTSO-E) in Europe, 2 Hz/s is the reference value that generation units must withstand in the future [89]. This value is considered also here as a limit value that should not be exceeded. It is assumed that Sub-Saharan Africa’s network is interconnected via transmission lines as shown in Figure 5. First, the ROCOF is calculated when only synchronous generation (hydropower, bioenergy plants, and geothermal units) contributes to the frequency balancing. Then synthetic inertia of the wind turbines is included, and after the synthetic inertia from solar PV plants. Finally, the synthetic inertia contribution from the battery units is included. It is assumed that in 2030, 0.1% of the connected battery capacity is available for frequency balancing services, and in 2040 the corresponding number is 0.05%. The ROCOF values are considered with 4% change in generation or load that corresponds loss of 8 GW change in 2030 and 19 GW change in 2040. For the ‘I3 Announced cost’ scenario in 2040 the hourly ROCOF values when different generation provided inertia is applied are shown in Figure 10. The corresponding minimum and maximum ROCOF values are given for different scenarios in Table 4. It can be noticed that relying only on synchronous generation’s inertia will most likely result in unstable power networks. Therefore, utilization of synthetic inertia sources becomes mandatory in fully renewable power systems. Furthermore, it can be concluded that the role of battery energy storage systems is crucial when stability of the network is considered.
8. Discussion
In the light of improving the energy outlook of SSA, several institutions have proposed a cross-border energy integration scheme as a top priority for tackling the pertinent energy situation [7]. Hydropower projects, in particular large hydro dams and long distance power grid systems, are envisioned as the cornerstone of the African power grid, and as solution to the region’s energy woes [5,7]. Advocates of large hydro dams have often exaggerated the benefits of developing the Inga project, while the true risks of the project are neglected. However, it needs to be highlighted that a project of this scale may be overwhelming for the continent, due to several requirements that need to be fulfilled in order to realise its full completion [7,14]. To achieve a regional electricity project of this dimension, it calls for a further development of the cross-border transmission network from DRC to other regions of SSA [7]. By 2040, according to the New Policies Scenario of the IEA, the annual investment in the transmission and distribution grid should increase to about nine fold the current level [1]. Recent actions on grid expansions in SSA are undermined by increasing population growth in remote areas and by poor central grid and power generation [19]. The recipients of hydropower transmitted over long distance are not the un-electrified majority, but industries and urban centres, as happened in the case of Kariba and Cahora Bassa dams on the Zambezi River [7,16]. Yet, electricity from large hydropower will likely elude the majority of Africans who live far from the power grid, due to prohibitive cost of grid expansion [7]. In addition, power from large hydro dams such as the Inga are not intended to improve rural areas in need of electricity or supply domestic users [7,13,79]. This defers from Sustainable Development Goal 7 (SDG7) and the UN’s Sustainable Energy4All initiative; to achieve universal access by 2030 [90,91]. Hence, PV-based mini-grids and stand-alone solar home system solutions are less capital intensive and can ensure electricity access to millions in SSA. More so, identifying alternative electrification options (off-grid electrification) in places of grid extension for the un-electrified people, particularly in rural areas, is pertinent [92,93,94]. However, there is need to consider economic viability, geographical potential, compatibility of (renewable) technology options, spatial factors, and techno-economic analysis in identifying least cost electrification options to end energy poverty in remote areas of SSA [94,95,96].
Furthermore, electricity expansion via grid extension has not eradicated the energy poverty in SSA. The New Policies Scenario of the IEA suggests mini-grid and stand-alone technology to account for 26 TWh and 12 TWh of energy generation, respectively, in SSA by 2040, of which solar PV contributes 37% and 47% of the technology mix, respectively [1]. According to Blechinger et al., two scenarios were modelled to understand the effects on future grid extension plans in SSA. In the first scenario based on the existing grid, 76.6 million people (12%), 290.3 million people (47%) and 252 million people (41%) can be electrified by mini-grids, grid extensions and solar home systems, respectively. The second scenario, in which modelling was based on the planned grid, 50.5 million people (8%), 381.5 million people (62%) and 187.6 million people (30%) can be electrified by mini-grids, grid extensions and solar home systems, respectively [19]. Solar PV technologies dominate the off-grid market [97]. The market for solar-powered lights, solar home systems and basic appliances has grown rapidly over the past five years, with over 24 million units sold [98]. In the past five years, Pay-as-you-go (PAYG) solar companies have raised over 360 mUSD in capital and served about 700,000 customers in East and West Africa [98]. In addition, the prominent role of PV and battery technologies, according to this current study for a RE-based power system, needs to be highlighted. Solar PV emerges as the dominating technology in all the scenarios for the years 2030 and 2040 in SSA. The highest installed capacity in all scenarios examined is 176 GW and 630.6 GW in 2030 and 2040, respectively. The increase in installed capacity of PV by 2040 can be explained by an expected ongoing steady decline in PV cost beyond the year 2030 [99]. In addition, the generation of PV for all scenarios is 364 TWh (38% of total) and 1305 TWh (78%) by 2030 and 2040, respectively. The high share of PV can be explained by the fact that PV will be the least cost RE technology in most parts of the SSA by 2030 and 2040. Also, the decreasing cost of battery storage pushes this trend. By 2040, the development becomes evident in terms of installed power capacity and electricity generation. For all scenarios considered, battery storage output reached 77 TWh and 499 TWh by 2030 and 2040, respectively. Reliance on battery storage, especially during evening and night hours, results from the use of PV. This trend is intensified from 2030 to 2040.
The total installed wind capacity has the second highest share of all power technologies in all scenarios considered. The highest capacity of wind for all the scenarios examined is 133 GW and 60 GW in 2030 and 2040, respectively. The role of wind energy is limited in SSA due to declining PV CAPEX. PV prosumers contribute with 11% in 2030 and 20% in 2040 of the total electricity generation in SSA. PV prosumers constitute 61.1 GW and 198.3 GW in 2030 and 2040, respectively, for all scenarios. In all scenarios the prosumer battery storage capacity is 72.2 GWh and 432.3 GWh by 2030 and 2040, respectively. A recent global report revealed an increase in new capacity installation of RE, from 127.5 GW in 2015 to 138.5 GW in 2016, excluding large hydro dams, which represents a 15 GW increase [98]. In the same report, solar PV and wind installations increased by 75 GW and 56 GW, respectively, more than any other technology in the same period of time [98]. Regarding land requirement, the specific capacity density derived in the LUT model is 75 MW/km2 for optimally tilted PV and 8.4 MW/km2 for onshore wind [39]. Hence, an area of 1501 and 5787 km2 is needed for solar PV in 2030 and 2040 respectively, representing 0.006% and 0.02% of SSA land area. Similarly, the wind capacities require an area of 15,905 and 7202 km2 in 2030 and 2040 respectively, representing 0.06% and 0.03% of total area of SSA. The area requirement is very small and wind energy can be even integrated in arable land.
On the other hand, the inaccurate prevalent perception is that mega dams can provide the least cost electricity to meet the energy deficits in developing countries [5,12]. Moreover, hydropower projects often do not account for social and environmental costs. Large hydropower projects are expensive: the Grand Inga project is costly, and the cost analysis of the project, carried out 10 years ago, led to estimated cost of 80 bUSD [51].Very large-scale hydropower projects are becoming more risky due to substantial cost overruns, length of construction and uncertain climate change impacts [5]. Recent studies have analysed investment risks and cost overruns among electricity generation technologies and revealed the high risks for large hydro dams, at the level of nuclear power stations. This is in contrast to a very low risk for solar and wind energy projects [10,27,28]. Hydroelectric projects exhibit an average overrun cost of 70%, and one plausible explanation for the huge costs overruns of hydro projects is the high material intensity compared to other energy sources [27]. A more recent study reported overwhelming evidence that the actual costs of large hydropower dams were on average 96% higher than initially estimated [10]. Likewise, the World Bank has noted significant cost overrun tendencies in some of their assessments of large hydropower projects [24]. In this work, categories of scenarios based on announced and expected costs were defined. Simulations have been carried out for cost escalations from 0% to 100% in 5% steps for the Grand Inga project in 2030 and 2040. An inflection point slightly over 35% was found for 2030 assumptions, i.e., the relative percent increase in LCOE was zero for the entire SSA region, meaning that a cost escalation beyond 35% for the Grand Inga project makes it economically non-beneficial. Moreover, by 2040, the inflection point dropped to below zero, with reference at −5%, i.e., by 2040, which means that even at the announced cost the Grand Inga project has a negative economic effect for the SSA region. In 2040, the result of this research reveals that solar PV dominates in terms of installed capacities, due to its fast development and continuous cost decline. The predominant role of solar PV and battery storage, due to highly favourable economics, was observed in this work. SSA can mainly be powered by solar PV and complemented by wind energy. In addition, a recent study on multi-criteria assessment for Africa demonstrates a large potential for utility-scale solar and wind energy developments [100]. Furthermore, in fully RE based power systems the inertia will become low, since the rotating mass of the connected synchronous machine is reduced. In this study, the minimum and maximum ROCOF values for all the scenarios was estimated. It was observed that relying on synchronous generation’s inertia will most likely result in unstable power network. Thus, utilization of synthetic inertia source from PV systems, wind turbines and in particular battery storage becomes essential in this analysis.
Regarding LCOE, a decline occurred in LCOE in 2040 when compared to 2030 in all the scenarios examined; for instance, the overall average LCOE decreased from 54.5 €/MWh in 2030 to 42.0 €/MWh in 2040, in the case of Grand Inga +50% cost scenario as shown in Supplementary Material Figure S6 (top left and bottom left), respectively. The plausible reason for the reduction in LCOE can be attributed to the reduction in cost of RE technology, in particular solar PV and batteries, which dominate the power system.
In addition, very large-scale hydropower projects fail to realise social benefits of meeting current unserved energy needs due to their long times of construction [5,7]. Hence, solar and wind generation are capable of addressing severe energy shortage in SSA due their fast deployment and short project periods, both on-grid and off-grid [5]. Moreover, studies modelling an optimal mix of RE revealed the possibility of meeting future energy demand through operating the existing hydropower plants, and new added wind and solar capacities [40,101]. Furthermore, from an energy security point of view, it is risky for SSA to depend on a single project or technology, as power disruption is rather likely for the countries importing electricity from such a source.
The development of the Grand Inga project has only been justified as part of a regional energy master plan, for which a single country such as DRC cannot justify the need [7]. The Inga 1 and Inga 2 hydropower plants, which have caused half of the current external debt of DRC, have not functioned in their full capacity since their commissioning due to lack of maintenance [53]. Why should a project of this dimensions be built in a nearly failed state? However, external forces from developers and South Africa are the major drivers for the development of the Grand Inga hydropower project [7]. In 2008, South Africa experienced a severe energy shortage, which led to a call for major infrastructure development. Consequently, the South African government were prompted to consider new energy projects and partners. By 2011, a partnership agreement was established between South Africa and the DRC concerning the development of Inga 3 [50]. The capacity of Inga 3 is estimated to be 4.8 GW when (and if) completed, of which 2.5 GW would be dedicated to South Africa, 1.3 GW to the mining industries in the Katanga valley and the remaining 1 GW to the Congolese state utility [5]. Between 2011 and 2014, a cooperative framework for the entire project was established. Also, a memorandum of understanding and bilateral treaty was signed by both governments and approved by their respective legislatures. The document specifies that the national utilities of both countries would primarily facilitate the funding, construction and management of Grand Inga [50]. The Republic of South Africa has shown strong interest for energy that could be produced at the Inga site [59]. In order to meet its growing electricity demand and in particular for the mining industry, one of the major contributors to the South African economy, Eskom (the South Africa national utility), sees hydropower from Inga as a means to secure uninterrupted power supply for South Africa [7,59].
Beyond the substantial financial risk associated with large dams, the environmental consequences of hydroelectric dam development, which include long-term ripple effects on biodiversity and ecosystems, are rarely considered, often underestimated or largely ignored during dam planning [13,102]. Further damming of the Congo River would affect the local environment, regional ecosystem and the global climate [46,47,48]. The ‘Congo Plume’, which represents the largest carbon sink in the world, can be disrupted by additional dams, hence contributing to climate change [48]. The Congo River has vast biodiversity, and has the second highest diversity of fish species [103,104], over 450 being endemic species. The rare species of fish, plants and animals mentioned in Section 3 are at risk of being affected, or in an extreme case might be in danger of extinction [56,98]. The overall effect of GI would be severe, changing the downstream river ecology. Furthermore, flooding of the Bundi Valley to create a reservoir can lead to huge methane emissions and disease outbreaks. The unique ecological features of the Congo River basin, would be unavoidably affected, by building more dams on the river [105,106].
Regarding GHG emissions, recent investigations reveal that large dams emit GHGs, particularly in the tropic regions [63,64,107,108,109,110,111,112,113]. Reservoirs in tropic regions can produce up to 20 times the amount of GHGs in comparison to reservoirs in boreal regions, because of the high rate of biodegradation [111]. Lifecycle GHG emissions from reservoirs are estimated to be in the range of 0.5–152 g CO2eq/kWh in boreal regions, while tropical reservoirs can produce up to 1300–3000 g CO2eq/kWh [111]. Degassing CO2 emissions from turbines and spillways account for 0–16%, and downstream emissions account for 1.6–32% of total CO2 emissions. There are four types of GHG emissions from water reservoirs, which are degassing emissions at turbines and spillways, diffuse emissions, ebullitive emissions and downstream emissions. Ebullitive emissions represent the dominant source of methane emissions from the surface of tropical reservoirs [112]. The first global assessment on GHG emissions from reservoirs emphasised the possible significance of reservoir surfaces as a GHG source, and proposed that factors such as age, water temperature and organic input could regulate fluxes. A recent study highlights the dominant role of methane in total reservoir carbon emissions, and highlights the importance of including ebullitive methane emission in modelling efforts [113]. Therefore, the reservoir required for GI would further generate CH4 emissions, resulting in substantial GHG emissions.
Further research will have to be conducted on the GI project with an energy transition model from 2015 to 2050. In this research the development phases of the GI project from Inga 3 to 8 will have to be considered in the transition model, with respect to proposed years of completion of each phase of the project. The development phases of the GI, maximum installed capacities and assumed years of commissioning are as follows: Inga 3 high-head (2025) 3037 MW, Inga 4 (2030) 7182 MW, Inga 5 (2035) 6970 MW, Inga 6 (2040) 6684 MW, Inga 7 (2045) 6706 MW and Inga 8 (2050) 6747 MW. In addition, it would be of high interest to analyse the benefits for South Africa, if any, in particular since South Africa has access to excellent domestic solar and wind resources, which can also represent respective low cost.
9. Conclusions
RE technologies, like solar PV and wind energy, have the potential to meet the energy demand sustainably and are also becoming increasingly cost-effective in SSA. In addition, this study confirms that hydropower as well as power generated from waste and biomass should serve only as gap-filling resources for an effective and stable power system in SSA. Hence, new investments in low cost solar PV and wind energy should be considered in SSA. The intermittency of RE can be circumvented with the integration of storage technologies, in particular battery storage, to store electricity during daytime that can be used at periods of highest demands and night hours. The integration of solar PV and battery storage was found to be cost effective. The LCOE obtained at the inflection point (near +35% of the announced cost for 2030 and −5% of the announced cost for 2040), the point at which the relative difference LCOE is zero for the entire region, is 54.4 €/MWh in 2030 and 41.7 €/MWh in 2040, while the LCOE obtained for 100% GI cost overrun in the DRC region is 68.4 €/MWh in 2030 and 60.4 €/MWh in 2040. These are 79.5% and 69%% higher than the reference averages, respectively. The presented detailed cost analysis for SSA clearly reveals that it is highly unlikely that future Inga hydropower capacity expansions can compete with solar PV and wind energy, in particular taking into account not just the planned, but the expected investment cost. The Grand Inga project and several other hydropower projects have been proposed with little or no regard to whether they are the best option to meet the not yet electrified population of SSA. Large scale projects, like GI, are not the kind of investment required (nor intended) to electrify the unserved 600 million SSA inhabitants. This is in contrast to small scale and distributed solar PV solutions and continuous grid extensions. Energy planners for SSA should clearly strike a balance between energy needs for industrial purpose and human development. Cross-border energy supply in SSA should incorporate diverse energy resources across the region, and not on a single point project (like GI), to ensure secure energy supply. Beyond the financial risk that can be incurred from building the GI dam, severe environment disruptions would be caused from diverting river flow to create the required reservoir. This would cause further GHG emissions (particularly methane). Furthermore, river ecosystem alteration and loss of endemic species are inevitable by further damming of the Congo River.
The results demonstrate the potential for large scale deployment of RE technologies in the SSA region. Which expresses the need for cross-border cooperation and transmission infrastructure to enhance shifting of energy from one point in time to another, enabling large scale of generation and demand balancing between the different sub-regions. A 100% RE-based system is reachable and a real policy option in SSA. Policy action that will restrict new investments in fossil power plants and facilitate RE development in long-term perspective is exigent. This study shows the important role of solar PV and wind energy in a least-cost electricity supply for SSA. Thus, energy policies in the region should place solar PV and wind energy more at its core. In addition, the current emphasis on large-scale hydropower projects in some regions of SSA should be revised, whether the same electrification targets could be achieved faster, for a substantial lower risk of time and budget overruns, less environmental impact and finally even lower total cost, if more solar PV and wind energy would be part of the energy planning.
The limitations of the research are, first, the constraints of the model. The model excludes other energy sectors than the investigated power sector, such as transportation, heating, non-energetic industrial demand and water desalination. These additional sectors would affect the distribution of installations, however it is unlikely to significantly change the outcome. Also, the model operates within the constraints of the assumptions and estimations used for the calculations, while the projections of the future may develop both in different ways and even in different directions.
Supplementary Materials
Acknowledgments
The authors gratefully acknowledge the public financing of Tekes (Finnish Funding Agency for Innovation) for the ‘Neo-Carbon Energy’ project under the number 40101/14. Ayobami Solomon Oyewo would like to thank LUT Foundation for the valuable scholarship.
Author Contributions
Ayobami Solomon Oyewo carried out main parts of the research and writing the manuscript. Javier Farfan contributed to the research development. Pasi Peltoniemi analysed the grid frequency stability of the power system. Christian Breyer framed the research questions and scope of the work, checked the results, facilitated discussions, and reviewed the manuscript.
Conflicts of Interest
The Authors declare no conflict of interest.
References
- International Energy Agency. Africa Energy Outlook. A Focus on the Energy Prospects in Sub-Saharan Africa, Paris. 2014. Available online: www.iea.org/publications/freepublications/publication/WEO2014_AfricaEnergyOutlook.pdf (accessed on 4 January 2016).
- International Renewable Energy Agency. Africa 2030: Roadmap for a Renewable Energy Future; REmap 2030 Programme. Abu Dhabi, UAE, 2015. Available online: www.irena.org/DocumentDownloads/Publications/IRENA_Africa_2030_REmap_2015_low-res.pdf (accessed on 3 May 2016).
- Intergovernmental Panel on Climate Change. Synthesis Report, Contribution of Working Groups I, II and III to the Fifth Assessment Report of the Intergovernmental Panel on Climate Change; Core writing Team, Pachauri, R.K., Meyer, L.A., Eds.; IPCC: Geneva, Switzerland, 2014; Available online: www.ipcc.ch/pdf/assessmentreport/ar5/syr/SYR_AR5_FINAL_full.pdfInternational (accessed on 6 July 2016).
- United Nations Framework Convention on Climate Change. Adoption of the Paris Agreement—Proposal by the President; UNFCCC: Paris, France, 2015; Available online: http://unfccc.int/resource/docs/2015/cop21/eng/l09.pdf (accessed on 5 July 2016).
- International Rivers. Right Priorities for Africa’s Power Sector: An Evaluation of Dams under the Programme for Infrastructure Development in Africa (PIDA). 2015. Available online: www.internationalrivers.org/files/attached-files/pida_report_for_web.pdf (accessed on 9 October 2016).
- Cole, A.M.; Elliott, J.R.R. Climate change, Hydro-Dependency, and the African Dam Boom. World Dev. 2014, 60, 84–98. [Google Scholar] [CrossRef]
- McDonald, D.A. Electricity Capitalism: Recolonizing Africa on the Power Grid; Earthscan Publication: London, UK, 2009. [Google Scholar]
- International Renewable Energy Agency. Southern African Power Pool: Planning and Prospect for Renewable Energy; International Renewable Energy Agency: Abu Dhabi, UAE, 2013; Available online: www.irena.org/documentdownloads/publications/sapp.pdf (accessed on 7 October 2016).
- Eberhard, A.; Foster, V.; Briceño-Garmendia, C.; Ouedraogo, F.; Camos, D.; Shkaratan, M. Underpowered: The State of the Power Sector in Sub-Saharan Africa; Washington, DC, USA, 2008. Available online: http://documents.worldbank.org/curated/en/142991468006934762/pdf/482140ESW0P11110Power0Sector0Review.pdf (accessed on 5 September 2016).
- Ansar, A.; Flyvbjerg, B.; Budzier, A.; Lunn, D. Should we build more large dams? The actual costs of hydropower megaproject development. Energy Policy 2014, 69, 43–56. [Google Scholar] [CrossRef] [Green Version]
- World Wildlife Fund. An Investor’s Guide to Dams, Gland 2003. Available online: https://d2ouvy59p0dg6k.cloudfront.net/downloads/investorsguidedams.pdf (accessed on 23 February 2017).
- International Rivers. Designing Low Carbon Electricity Futures for African and Other Developing Economies. 2015. Available online: www.internationalrivers.org/files/attached-files/intlrivers_low-carbon_small.pdf (accessed on 9 October 2016).
- Winemiller, K.O.; McIntyre, P.B.; Castello, L.; Fluet-Chouinard, E.; Giarrizzo, T.; Nam, S.; Baird, I.G.; Darwall, W.; Lujan, N.K.; Harrison, I.; et al. Balancing hydropower and biodiversity in the Amazon, Congo and Mekong. Science 2016, 351, 128–129. [Google Scholar] [CrossRef] [PubMed] [Green Version]
- Green, N.; Sovacool, B.K.; Hancock, K. Grand Designs: Assessing the African Energy Security Implications of the Grand Inga Dam. Afr. Stud. Rev. 2015, 58, 133–158. [Google Scholar] [CrossRef]
- Taliotis, C.; Bazilian, M.; Welsch, M.; Gielen, D.; Howells, M. Grand Inga to power Africa: Hydropower development scenarios to 2035. Energy Strategy Rev. 2014, 4, 1–10. [Google Scholar] [CrossRef]
- World Wildlife Fund. Meeting Africa’s Energy Needs: The Cost and Benefits of Hydropower; World Wildlife Fund: Zeist, The Netherlands, 2006; Available online: http://d2ouvy59p0dg6k.cloudfront.net/downloads/africahydropowerreport2006.pdf (accessed on 20 September 2016).
- Niez, A. Comparative Study on Rural Electrification Policies in Emerging Economies: Keys to Successful Policies; IEA Energy Papers, No. 2010/03; OECD Publishing: Paris, France, 2010. [Google Scholar]
- Breyer, C.; Werner, C.; Rolland, S.; Adelmann, P. Off-Grid Photovoltaic Applications in Regions of Low Electrification: High Demand, Fast Financial Amortization and Large Market Potential. In Proceedings of the 26th European Photovoltaic Solar Energy Conference (EU PVSEC), Hamburg, Germany, 5–9 September 2011. [Google Scholar]
- Blechinger, P.; Cader, C.; Oyewo, A.S.; Breyer, C.; Bertheau, P. Energy access for Sub-Saharan Africa with the focus on PV-hybrid mini-grids. In Proceedings of the 1st International Conference on Solar Technologies & Hybrid Mini Grids to Improve Energy Access Conference, Bad Hersfeld, Germany, 21–23 September 2016. [Google Scholar]
- Kirchherr, J.; Pohlner, H.; Charles, J.K. Cleaning up the big muddy: A meta-synthesis of the research on the social impacts of dams. Environ. Impact Assess. Rev. 2016, 60, 115–125. [Google Scholar] [CrossRef]
- Kirchherr, J.; Charles, K.J. The social impacts of dams: A new framework for scholarly analysis. Environ. Impact Assess. Rev. 2016, 60, 99–114. [Google Scholar] [CrossRef]
- World Commission on Dams. Dams and Development: A New Framework; Earthscan Publications Ltd.: London/Sterling, UK, 2000. [Google Scholar]
- Rosenberg, D.M.; Bodaly, R.A.; Usher, P.J. Environmental and social impact of large scale hydro-electric development: Who is listening? Glob. Environ. Chang. 1995, 5, 127–148. [Google Scholar] [CrossRef]
- Bacon, R.W.; Besant-Jones, J.E. Estimating construction costs and schedules: Experience with power generation projects in developing countries. Energy Policy 1996, 26, 317–333. [Google Scholar] [CrossRef]
- Awojobi, O.; Jenkins, G.P. Managing the Cost Overrun Risks of Hydroelectric Dams: An Application of Reference Class Forecasting Techniques. Renew. Sustain. Energy Rev. 2015, 63, 19–32. [Google Scholar] [CrossRef]
- Awojobi, O.; Jenkinsa, G.P. Were the hydro dams financed by the World Bank from 1976 to 2005 worthwhile? Energy Policy 2015, 86, 222–232. [Google Scholar] [CrossRef]
- Sovacool, B.K.; Nugent, D.; Gilbert, A. Construction cost overrun and electricity infrastructure: An unavoidable risk? Electr. J. 2014, 27, 112–120. [Google Scholar] [CrossRef]
- Sovacool, B.K.; Gilbert, A.; Nugent, D. Risk, innovation, electricity infrastructure and construction cost overruns: Testing six hypotheses. Energy 2014, 74, 906–917. [Google Scholar] [CrossRef]
- Flyvbjerg, B. Curbing optimism bias and strategic misrepresentation in planning: Reference class forecasting in practice. Eur. Plan. Stud. 2008, 16, 3–21. [Google Scholar] [CrossRef]
- Sovacool, B.K.; Nugent, D.; Gilbert, A. An International Comparative Assessment of Construction Cost Overruns for Electricity Infrastructure. Energy Res. Soc. Sci. 2014, 3, 152–160. [Google Scholar] [CrossRef]
- Eberhard, A.; Katharine, G.; Elvira, M.; Pedro, A. Independent Power Projects in Sub-Saharan Africa: Lessons from Five Key Countries; Directions in Development; World Bank: Washington, DC, USA, 2016. [Google Scholar]
- International Energy Agency. Boosting the Power Sector in Sub-Saharan Africa; International Energy Agency: Paris, France, 2016; Available online: www.iea.org/publications/freepublications/publication/Partner_Country_SeriesChinaBoosting_the_Power_Sector_in_SubSaharan_Africa_Chinas_Involvement.pdf (accessed on 20 February 2016).
- Farfan, J.; Breyer, C. Structural changes of global power generation capacity towards sustainability and the risk of stranded investments supported by a sustainability indicator. J. Clean. Prod. 2017, 141, 370–384. [Google Scholar] [CrossRef]
- International Renewable Energy Agency. The Power to Change: Solar and Wind Cost Reduction Potential to 2025; International Renewable Energy Agency: Abu Dhabi, UAE, 2016; Available online: www.irena.org/DocumentDownloads/Publications/IRENA_Power_to_Change_2016.pdf (accessed on 26 October 2017).
- International Renewable Energy Agency. Solar PV in Africa: Cost and Markets; International Renewable Energy Agency: Abu Dhabi, UAE, 2016; Available online: www.irena.org/DocumentDownloads/Publications/IRENA_Solar_PV_Costs_Africa_2016.pdf (accessed on 26 October 2016).
- European Technology and Innovation Platform—PV. The True Competitiveness of Solar PV—A European Case Study; European Technology and Innovation Platform: Brussels, Belgium, 2017; Available online: https://goo.gl/QrLtQk (accessed on 4 August 2017).
- International Technology Roadmap for Photovoltaic. International Technology Roadmap for Photovoltaic Results 2016; Frankfurt, Germany, 2017, ITRPV Eight Edition ed. Available online: https://goo.gl/v5QoRA (accessed on 4 January 2018).
- Gulagi, A.; Bogdanov, D.; Breyer, C. Southeast Asia and the Pacific Rim Super Grid for 100% Renewable Energy Power Supply. Energies 2017, 10, 583. [Google Scholar]
- Bogdanov, D.; Breyer, C. North-East Asian Super Grid for 100% Renewable Energy supply: Optimal mix of energy technologies for electricity, gas and heat supply options. Energy Convers. Manag. 2016, 112, 176–190. [Google Scholar] [CrossRef]
- Barasa, M.; Bogdanov, D.; Oyewo, A.S.; Breyer, C. A Cost Optimal Resolution for Sub-Saharan Africa powered by 100% Renewable for year 2030 Assumptions. In Proceedings of the 32nd European Photovoltaic Solar Energy Conference, Munich, Germany, 20–24 June 2016. [Google Scholar]
- Breyer, C.; Bogdanov, D.; Gulagi, A.; Aghahosseini, A.; Barbosa, L.S.N.S.; Koskinen, O.; Barasa, M.; Caldera, U.; Afanasyeva, S.; Child, M.; et al. On the Role of Solar Photovoltaics in Global Energy Transition Scenarios. Prog. Photovolt. Res. Appl. 2017, 25, 727–745. [Google Scholar] [CrossRef]
- Hansen, U.E.; Pedersen, M.B.; Nygaard, I. Review of Solar PV Market Development in East Africa; UNEP Risø Centre, Technical University of Denmark 2014; UNEP Risø Centre Working Paper Series; No. 12; DTU Library: Copenhagen, Denmark, 2014. [Google Scholar]
- Department of Energy. Integrated Resource Plan Update Assumptions, Base Case Results and Observations Revision 1; Department of Energy: Pretoria, South Africa, 2016; Available online: http://www.energy.gov.za/IRP/2016/Draft-IRP-2016-Assumptions-Base-Case-and-Observations-Revision1.pdf (accessed on 4 January 2018).
- Chamorro, O.H.R.; Ghandhari, M.; Eriksson, R. Wind Power Impact on Power System Frequency Response. In Proceedings of the 2013 North American Power Symposium (NAPS), Manhattan, KS, USA, 22–24 September 2013; pp. 1–6. [Google Scholar]
- Seyedi, M.; Bollen, M. The Utilization of synthetic Inertia from Wind Farms and its Impact on Existing Speed Governors and System Performance; Part 2 Report of Vindforsk Project V-369; Elforsk Rapport 13:02; Elforsk Publication: Stockholm, Sweden, 2013. [Google Scholar]
- Showers, K.B. Congo River’s Grand Inga hydroelectricity scheme: Linking environmental history, policy and impact. Water Hist. 2009, 1, 31–58. [Google Scholar] [CrossRef]
- Showers, K.B. Electrifying Africa: An environmental history with policy implications. Geografiska Annaler: Series B. Hum. Geogr. 2011, 93, 193–221. [Google Scholar]
- Showers, K.B. Beyond Mega on a Mega Continent: Grand Inga on Central Africa’s Congo River. Eng. Earth 2010, 1651–1679. [Google Scholar]
- Scholvin, S. A New Scramble for Africa? The Rush for Energy Resources in Sub-Saharan Africa; Routledge Publishing Ltd.: New York, NY, USA, 2015. [Google Scholar]
- Maupin, A. Energetic Dialogues in South Africa: The Inga example. Global powers and African programme. Policy Insights 2015, 16, 1–12. [Google Scholar]
- Netherlands Commission for Environment Assessment. Advice on the Adequacy of the Information Underlying Decision Making on the Inga Base Chute and Mid-Size Hydropower Development Technical Assistance Project. 2014. Available online: http://api.commissiemer.nl/docs/os/i71/i7120/su15-43_inga_basse_chute_ms_hydropower_dev_ta_proj.pdf (accessed on 15 November 2016).
- Goodland, R.; Hayes, R.; Blackwelder, B. Towards a World Bank Group Policy on the Social and Environmental Impacts of Dams, Reservoirs and Hydroelectricity Projects; World Bank: Washington, DC, USA, 2013; Available online: www.fdnearth.org/files/2015/01/Hydro-Policy-WBG-Aug2313-Final.pdf (accessed on 17 January 2017).
- Sanyanga, R.A. Too big to build? ESI Afr. 2015, 1, 72–74. [Google Scholar]
- Hydropolitic Academy. Construction of World’s Largest Dam in DR Congo Could Begin within Months. 2016. Available online: http://www.hidropolitikakademi.org/en/construction-of-worlds-largest-dam-in-dr-congo-could-begin-within-months.html#attachment%20wp-att-13859/0/ (accessed on 18 March 2018).
- International Rivers. Corruption and Infrastructure Megaproject in the DR Congo. 2013. Available online: http://www.internationalrivers.org/sites/default/files/attached-files/corruption_in_the_drc_.pdf (accessed on 23 August 2016).
- European Union. The Forests of the Congo Basin—State of the Forest 2010; de Wasseige, C., de Marcken, P., Bayol, N., Hiol Hiol, F., Mayaux, P., Desclée, B., Nasi, R., Billand, A., Defourny, P., Eba’a Atyi, R., Eds.; Publications Office of the European Union: Luxembourg, 2012; pp. 63–94. ISBN 978-92-79-22716-5. Available online: http://publications.jrc.ec.europa.eu/repository/bitstream/JRC69263/lbna25161enc_002.pdf (accessed on 1 January 2017). [CrossRef]
- Hansen, M.C.; Roy, D.P.; Lindquist, E.; Adusei, B.; Justice, C.O.; Altstatt, A. A method for integrating MODIS and Landsat data for systematic monitoring of forest cover and change in the Congo Basin. Remote Sens. Environ. 2008, 112, 2495–2513. [Google Scholar] [CrossRef]
- Reuters. World Bank Approves Funds to Study Congo’s Inga Dam; News Article. New York, NY, USA, 2012. Available online: www.reuters.com/article/us-congodemocratic-worldbank-idUSBREA2J1Y220140320 (accessed on 12 April 2016).
- World Bank. Project Appraisal for Inga 3 Base Chute and Mid-Size Hydropower Development Technical Assistance Project; World Bank: Washington DC, USA, 2014; Available online: http://documents.worldbank.org/curated/en/817971468245430631/pdf/774200REPLACEM0140Box382121B00OUO90.pdf (accessed on 13 July 2017).
- Grand Inga Hydroelectric Project: An Overview. Available online: www.internationalrivers.org/resources/grand-inga-hydroelectric-project-an-overview-3356 (accessed on 22 April 2016).
- Hammons, T.J.; Naidoo, P.; Musaba, L. Strategies for Harvesting Large Scale Bulk Energy from the Congo River without a Conventional Dam. In Proceedings of the 45th Universities Power Engineering Conference, Cardiff, Wales, 31 August–3 September 2010. [Google Scholar]
- International Rivers. Greenwashing Dams: A Critique of the Hydropower Sustainability Assessment Protocol (HSAP). 2013. Available online: www.internationalrivers.org/files/attached-files/hsapfactsheet2013.pdf (accessed on 22 April 2016).
- Lima, I.B.T.; Ramos, F.M.; Bambace, L.A.W.; Rosa, R.R. Methane Emissions from Large Dams as Renewable Energy Resources: A Developing Nation Perspective. Mitig. Adapt. Strateg. Glob.Chang. 2008, 13, 193–206. [Google Scholar]
- Fearnside, P.M. Greenhouse gas emissions from Brazil’s Amazonian hydroelectric dams. Environ. Res. Lett. 2016, 11, 1–3. [Google Scholar] [CrossRef]
- Bambace, L.A.W.; Ramos, F.M.; Lima, I.B.T.; Rosa, R.R. Mitigation and recovery of methane emissions from tropical hydroelectric dams. Energy 2007, 32, 1038–1046. [Google Scholar] [CrossRef]
- Lund, H.; Arler, F.; Østergaard, P.A.; Hvelplund, F.; Connolly, D.; Mathiesen, B.V.; Karnøe, P. Simulation versus Optimisation: Theoretical Positions in Energy System Modelling. Energies 2017, 10, 840. [Google Scholar] [CrossRef]
- The MathWorks, Inc. MATLAB R2016a; The MathWorks, Inc.: Natick, MA, USA, 2016; Available online: http://allpcworld.com/matlab-free-download/ (accessed on 2 July 2017).
- Mosek ApS. MOSEK Version 8; Mosek ApS: Copenhagen, Denmark, 2017; Available online: https://www.mosek.com/downloads/ (accessed on 2 July 2017).
- Gerlach, A.; Werner, C.; Breyer, C. Impact of Financing Cost on Global Grid-Parity Dynamics till 2030. In Proceedings of the 29th European Photovoltaic Solar Energy Conference and Exhibition (EU PVSEC), Amsterdam, The Netherlands, 22–26 September 2014. [Google Scholar]
- Verzano, K. Climate Change Impacts on Flood Related Hydrological Processes: Further Development and Application of a Global Scale Hydrological Model. Reports on Earth System Science, 71, Max-Planck-Institut für Meteorologie, Hamburg, Germany. Ph.D. Thesis, Faculty of Electrical Engineering and Computer Science, University of Kassel, Kassel, Germany, 2009. [Google Scholar]
- Deutsches Biomasse Forschungs Zentrum. Endbericht Globale und Regionale Räumliche Verteilung von Biomassepotenzialen; Thrän, D., Bunzel, K., Seyfert, U., Zeller, V., Müller, K., Matzdorf, B., Weimar, H., Eds.; D-04347; Leipzig, Germany, 2010; Available online: http://literatur.ti.bund.de/digbib_extern/dn047244.pdf (accessed on 15 September 2016).
- International Energy Agency. Technology Roadmap—Bioenergy for Heat and Power; IEA Publications: Paris, France, 2012. [Google Scholar]
- Intergovernmental Panel on Climate Change. Special Report on RE Sources and CC Mitigation; Intergovernmental Panel on Climate Change: Geneva, Switzerland, 2011; Available online: www.ipcc.ch/pdf/specialreports/srren/SRREN_FD_SPM_final.pdf (accessed on 23 November 2016).
- International Association of Seismology and Physics of the Earth’s Interior; IHFC Database; The International Heat Flow Commission. 2015. Available online: www.heatflow.und.edu/index2.html (accessed on 24 February 2017).
- Global Heat Flow Database. American Association of Petroleum Geologists; Tulsa, OK, USA, 2015. Available online: www.datapages.com/gis-map-publishing-program/gis-open-files/global-framework/global-heat-flow-database (accessed on 24 February 2017).
- Chamorro, C.R.; García-Cuesta, J.L.; Mondéjar, M.E.; Pérez-Madrazo, A. An estimation of the enhanced geothermal systems potential for the Iberian Peninsula. Renew. Energy 2014, 66, 1–14. [Google Scholar] [CrossRef]
- Chamorro, C.R.; García-Cuesta, J.L.; Mondéjar, M.E.; Pérez-Madrazo, A. Enhanced geothermal systems in Europe: An estimation and comparison of the technical and sustainable potentials. Energy 2014, 65, 250–263. [Google Scholar] [CrossRef]
- Huenges, E. Geothermal Energy Systems, Exploration, Development and Utilization, 2nd ed.; Wiley-VCH: Weinheim, Germany, 2012. [Google Scholar]
- World Bank. Democratic Republic of Congo Inga 3 and Mid-Size Hydropower Development Technical Assistance Project; World Bank: Washington DC, USA, 2017; Available online: http://projects.bancomundial.org/P131027/inga-3-development-ta?lang=en (accessed on 20 January 2017).
- International Rivers. The Inga 3 Hydropower Project. 2014. Available online: www.internationalrivers.org/campaigns/the-inga-3-hydropower-project (accessed on 23 January 2017).
- Mail & Guardian Africa. DR Congo Moves to Build $100 Billion Grand Inga Dam, to Pick Phase-1 Contractor by August. 2016. Available online: http://mgafrica.com/article/2016-05-07-dr-congo-moves-to-build-100-billion-grand-inga-dam-to-pick-phase-1-contractor-by-august (accessed on 20 November 2016).
- Waffenschmidt, E.; Hui, R.S.Y. Virtual inertia with PV inverters using DC-link capacitors. In Proceedings of the 18th European Conference on Power Electronics and Applications (EPE ‘16 ECCE Europe), Karlsruhe, Germany, 5–9 September 2016. [Google Scholar]
- GE Energy. Modeling of GE Wind Turbine-Generators for Grid Studies; Version 4.3; General Electric International, Inc.: Schenectady, NY, USA, 2009. [Google Scholar]
- Fischer, M.; Engelken, S.; Mihov, N.; Mendonca, A. Operational experiences with inertial response provided by type 4 wind turbines. IET Renew. Power Gener. 2016, 10, 17–24. [Google Scholar] [CrossRef]
- Asmine, M.; Langlois, C.É. Field measurements for the assessment of inertial response for wind power plants based on Hydro-Quebec TransEnergie requirements. IET Renew. Power Gener. 2016, 10, 25–32. [Google Scholar] [CrossRef]
- Zhu, J.; Booth, C.D.; Adam, G.P.; Roscoe, A.J.; Bright, C.G. Inertia Emulation Control Strategy for VSC-HVDC Transmission Systems. IEEE Trans. Power Syst. 2013, 28, 1277–1287. [Google Scholar] [CrossRef] [Green Version]
- Enercon Magazine for Wind Energy 3/2010. Available online: http://www.enercon.de/fileadmin/Redakteur/Medien-Portal/windblatt/pdf/en/Windblatt_0310_engl.pdf (accessed on 27 November 2017).
- Peltoniemi, P. Compensating the rotating mass kinetic energy in grids including high shares of renewable. In Proceedings of the 19th European Conference on Power Electronics and Applications (EPE’17 ECCE Europe), Warsaw, Poland, 11–14 September 2017. [Google Scholar]
- European Network of Transmission System Operators for Electricity. Frequency Stability Evaluation Criteria for the Synchronous Zone of Continental Europe, Requirements and Impacting Factors; Brussels, Belgium, 2016. Available online: https://www.entsoe.eu/Documents/SOC%20documents/RGCE_SPD_frequency_stability_criteria_v10.pdf (accessed on 27 December 2017).
- Perera, N.; Boyd, E.; Wilkins, G.; Itty, R.P. Literature Review on Energy Access and Adaptation to Climate Change. EOD—Evidence on Demand; UK Department for International Development (DFID), 2015. Available online: https://assets.publishing.service.gov.uk/media/57a0896b40f0b652dd0001fe/LitRev-EnergyAccessandAdaptation-Final-2.pdf (accessed on 23 February 2017).
- Willcox, M.; Pueyo, A.; Waters, L.; Hanna, R.; Wanjiru, H.; Palit, D.; Sharma, K.R. Utilising Electricity Access for Poverty Reduction; Practical Action Consulting (PAC); Institution of Development Studies (IDS); The Energy and Research Institute (TERI): London, UK, 2015; Available online: www.ids.ac.uk/files/dmfile/UtilisingElectricityAccessforPovertyReduction-MainReport.pdf (accessed on 23 February 2017).
- Bhattacharyya, S.C. Review of alternative methodologies for analysing off-grid electricity supply. Renew. Sustain. Energy Rev. 2012, 16, 677–694. [Google Scholar] [CrossRef]
- Mandelli, S.; Barbieri, J.; Mereu, R.; Colombo, E. Off-grid systems for rural electrification in developing countries: Definitions, classification and a comprehensive literature review. Renew. Sustain. Energy Rev. 2016, 58, 1621–1646. [Google Scholar] [CrossRef]
- Szabó, S.; Moner-Girona, M.; Kougias, I.; Bailis, R.; Bódis, K. Identification of advantageous electricity generation options in Sub-Saharan Africa integrating existing resources. Nat. Energy 2016, 16140, 1–8. [Google Scholar] [CrossRef]
- Szabó, S.; Bódis, K.; Huld, T.; Moner-Girona, M. Energy solutions in rural Africa and mapping electrification costs of distributed solar and diesel. Environ. Res. Lett. 2011, 6, 1–9. [Google Scholar] [CrossRef]
- Szabó, S.; Bódis, K.; Huld, T.; Moner-Girona, M. Sustainable energy planning: Leapfrogging the energy poverty gap in Africa. Renew. Sustain. Energy Rev. 2013, 28, 500–509. [Google Scholar] [CrossRef]
- Lightning Africa. Global Solar Off-Grid Semi-Annual Market Report; London, UK, 2016. Available online: www.gogla.org/sites/www.gogla.org/files/recource_docs/glb_solar_og_market_report_h22015_public_web.pdf (accessed on 8 January 2016).
- United Nation Environmental Programme. Global Trends in Renewable Energy Investment 2017; Frankfurt School-UNEP Centre/BNEF: Frankfurt, Germany, 2017; Available online: http://fs-unep-centre.org/sites/default/files/publications/globaltrendsinrenewableenergyinvestment2017.pdf (accessed on 15 April 2017).
- Castellano, A.; Kendall, A.; Nikomarov, M.; Swemmer, T. Brighter Africa: The Growth Potential of the Sub-Saharan Electricity Sector; McKinsey Co.: New York, NY, USA, 2015; Available online: www.mckinsey.com/industries/electric-power-andnatural-gas/our-insights/powering-africa (accessed on 15 July 2016).
- Wu, G.C.; Deshmukh, R.; Nghlukula, K.; Radojicic, T.; Reilly-Moman, J.; Phadke, A.; Kammen, D.M.; Callaway, D.S. Strategic siting and regional grid interconnections key to low-carbon futures in Africa countries. Proc. Natl. Acad. Sci. USA 2017, 114, 1–9. [Google Scholar] [CrossRef] [PubMed]
- Oyewo, A.S.; Aghahosseini, A.; Breyer, C. Assessment of energy storage technologies in transition to a 100% renewable energy system for Nigeria. In Proceedings of the 11th International Renewable Energy Storage Conference (IRES 2017), Düsseldorf, Germany, 14–16 March 2017. [Google Scholar]
- Botelho, A.; Ferreira, P.; Lima, F.; Costa Pinto, L.M.; Sousa, S. Assessment of the environmental impacts associated with hydropower. Renew. Sustain. Energy Rev. 2017, 70, 896–904. [Google Scholar] [CrossRef]
- Bosshard, P. World’s Largest Hydropower Project Unravels. 2016. Available online: www.internationalrivers.org/blogs/227/world%E2%80%99s-largest-hydropower-project-unravels (accessed on 15 April 2017).
- Shumway, C.; Musibono, D.; Ifuta, S.; Sullivan, J.; Schelly, R.; Punga, J.; Palata, J.C.; Puema, V. Biodiversity Survey: Systematics, Ecology, and Conservation along the Congo River; Congo River Environment and Development Project (CREDP); New England Aquarium: Boston, MA, USA, 2003; Available online: http://africhthy.org/sites/africhthy.org/files/CREDP_Report_Shumway.pdf (accessed on 13 April 2017).
- International Rivers. Grand Inga Dam, DR Congo. 2011. Available online: www.internationalrivers.org/campaigns/grand-inga-dam-dr-congo (accessed on 13 April 2017).
- Brooks, E.G.E.; Allen, D.J.; Darwall, W.R.T. The Status and Distribution of Freshwater Biodiversity in Central Africa; IUCN: Gland, Switzerland; Cambridge, UK, 2011; Available online: https://portals.iucn.org/library/efiles/documents/RL-67-001.pdf (accessed on 13 April 2017).
- Scherer, L.; Pfister, S. Hydropower’s biogenic carbon footprint. PLoS ONE 2016, 11, 1–11. [Google Scholar] [CrossRef] [PubMed]
- Demarty, M.; Bastein, J. GHG emissions from hydroelectricity in the tropical and equatorial regions: Review of 20 years of CH4 emission measurements. Energy Policy 2011, 39, 419–4206. [Google Scholar] [CrossRef]
- Barros, N.; Cole, J.J.; Tranvik, L.J.; Prairie, Y.T.; Bastviken, D.; Huszar, V.L.M.; del Giorgio, P.; Roland, F. Carbon emission from hydroelectric reservoirs linked to reservoir age and latitude. Nat. Geosci. 2011, 4, 593–596. [Google Scholar] [CrossRef]
- St. Louis, V.; Kelly, C.A.; Duchemin, E.; Rudd, J.W.M.; Rosenberg, D.M. Reservoir surfaces as sources of greenhouse gases to the atmosphere: A global estimate. BioScience 2000, 50, 766–775. [Google Scholar] [CrossRef]
- Steinhurst, W.; Knight, P.; Schultz, M. Hydropower Greenhouse Gas Emissions; Synapse Energy Economic: Cambridge, MA, USA, 2012; Available online: www.clf.org/wp-content/uploads/2012/02/Hydropower-GHG-Emissions-Feb.-14-2012.pdf (accessed on 13 April 2017).
- Yang, L.; Lu, F.; Zhou, X.; Wang, X.; Duan, X.; Sun, B. Progress in the studies on the greenhouse gas emission from reservoirs. Acta Ecol. Sin. 2014, 34, 202–212. [Google Scholar] [CrossRef]
- Deemer, B.R.; Harrison, J.A.; Li, S.; Beaulieu, J.J.; Del-Sesontro, T.; Barros, N.; Bezerra-Neto, J.F.; Powers, S.M.; Dos Santos, M.A.; Arie Vonk, J. Greenhouse gas emissions from reservoir water surface: A new global synthesis. BioScience 2016, 66, 949–964. [Google Scholar] [CrossRef]
- Pleßmann, G.; Erdmann, M.; Hlusiak, M.; Breyer, C. Global Energy Storage Demand for a 100% Renewable Electricity Supply. Energy Procedia 2014, 46, 22–31. [Google Scholar] [CrossRef]
- Hoffmann, W. Importance and evidence for cost effective electricity storage. In Proceedings of the 29th European Photovoltaic Solar Energy Conference and Exhibition (EU PVSEC), Amsterdam, The Netherlands, 22–26 September 2014. [Google Scholar]
- Komoto, K.; Ito, M.; Van der Vleuten, P.; Faiman, D.; Kurokawa, K. (Eds.) Energy from the Desert: Very Large Scale Photovoltaic Systems: Socio-Economic, Financial, Technical and Environmental Aspects; Earthscan: London, UK, 2009. [Google Scholar]
- European Commission. Energy Technology Reference Indicator Projections for 2010–2050; EC Joint Research Centre Institute for Energy and Transport: Petten, The Netherlands, 2014. [Google Scholar]
- Vartiainen, E.; Masson, G.; Breyer, C. PV LCOE in Europe 2015–2050. In Proceedings of the 31st European Photovoltaic Solar Energy Conference, Hamburg, Germany, 14–18 September 2015. [Google Scholar]
- Agora Energiewende. Stromspeicher in der Energiewende; Berlin, Germany, September 2014. Available online: www.agora-energiewende.de/fileadmin/Projekte/2013/speicher-in-der-energiewende/Agora_Speicherstudie_Web.pdf (accessed on 4 July 2016).
- Urban, W.; Lohmann, H.; Girod, K. Abschlussbericht für das BMBF-Verbundprojekt Biogaseinspeisung; Fraunhofer UMSICHT: Oberhausen, Germany, 2009. [Google Scholar]
- Dii. 2050 Desert Power: Perspectives on a Sustainable Power System for EUMENA; Munich, Germany, 2012. Available online: www.trec-uk.org.uk/reports/D /DPP_2050_Study.pdf (accessed on 4 July 2016).
Figure 1.
Total installed capacities by the end of 2014 in SSA [33].
Figure 1.
Total installed capacities by the end of 2014 in SSA [33].

Figure 2.
Congo River and all Inga plans (existing and planned phases of Inga dams) [54].
Figure 2.
Congo River and all Inga plans (existing and planned phases of Inga dams) [54].

Figure 3.
Main inputs and outputs of the LUT Energy System model [39].
Figure 3.
Main inputs and outputs of the LUT Energy System model [39].

Figure 4.
Block diagram of the energy system model for SSA.

Figure 5.
Sub-Saharan African sub-regions and HVDC transmission lines configuration.

Figure 6.
Total annual cost in [b€] for GI 2030 Scenario.

Figure 7.
Total annual cost in [b€] for GI 2040 Scenario.

Figure 8.
Scenario I3 announced cost in absolute total LCOE (left) and relative difference to the reference scenario (right) for the years 2030 (top) and 2040 (bottom).
Figure 8.
Scenario I3 announced cost in absolute total LCOE (left) and relative difference to the reference scenario (right) for the years 2030 (top) and 2040 (bottom).

Figure 9.
Scenario I3 Expected cost in absolute total LCOE (left) and relative difference to the reference scenario (right) for the years 2030 (top) and 2040 (bottom).
Figure 9.
Scenario I3 Expected cost in absolute total LCOE (left) and relative difference to the reference scenario (right) for the years 2030 (top) and 2040 (bottom).

Figure 10.
Hourly ROCOF values for ‘I3 Announced cost’ scenario 2040 for different generation technologies inertia contribution is considered. Highest ROCOF values are obtained when only synchronous inertia is utilised. Then by adding first synthetic inertia from wind then from solar PV and finally from battery the ROCOF value can be reduced to suitable levels.


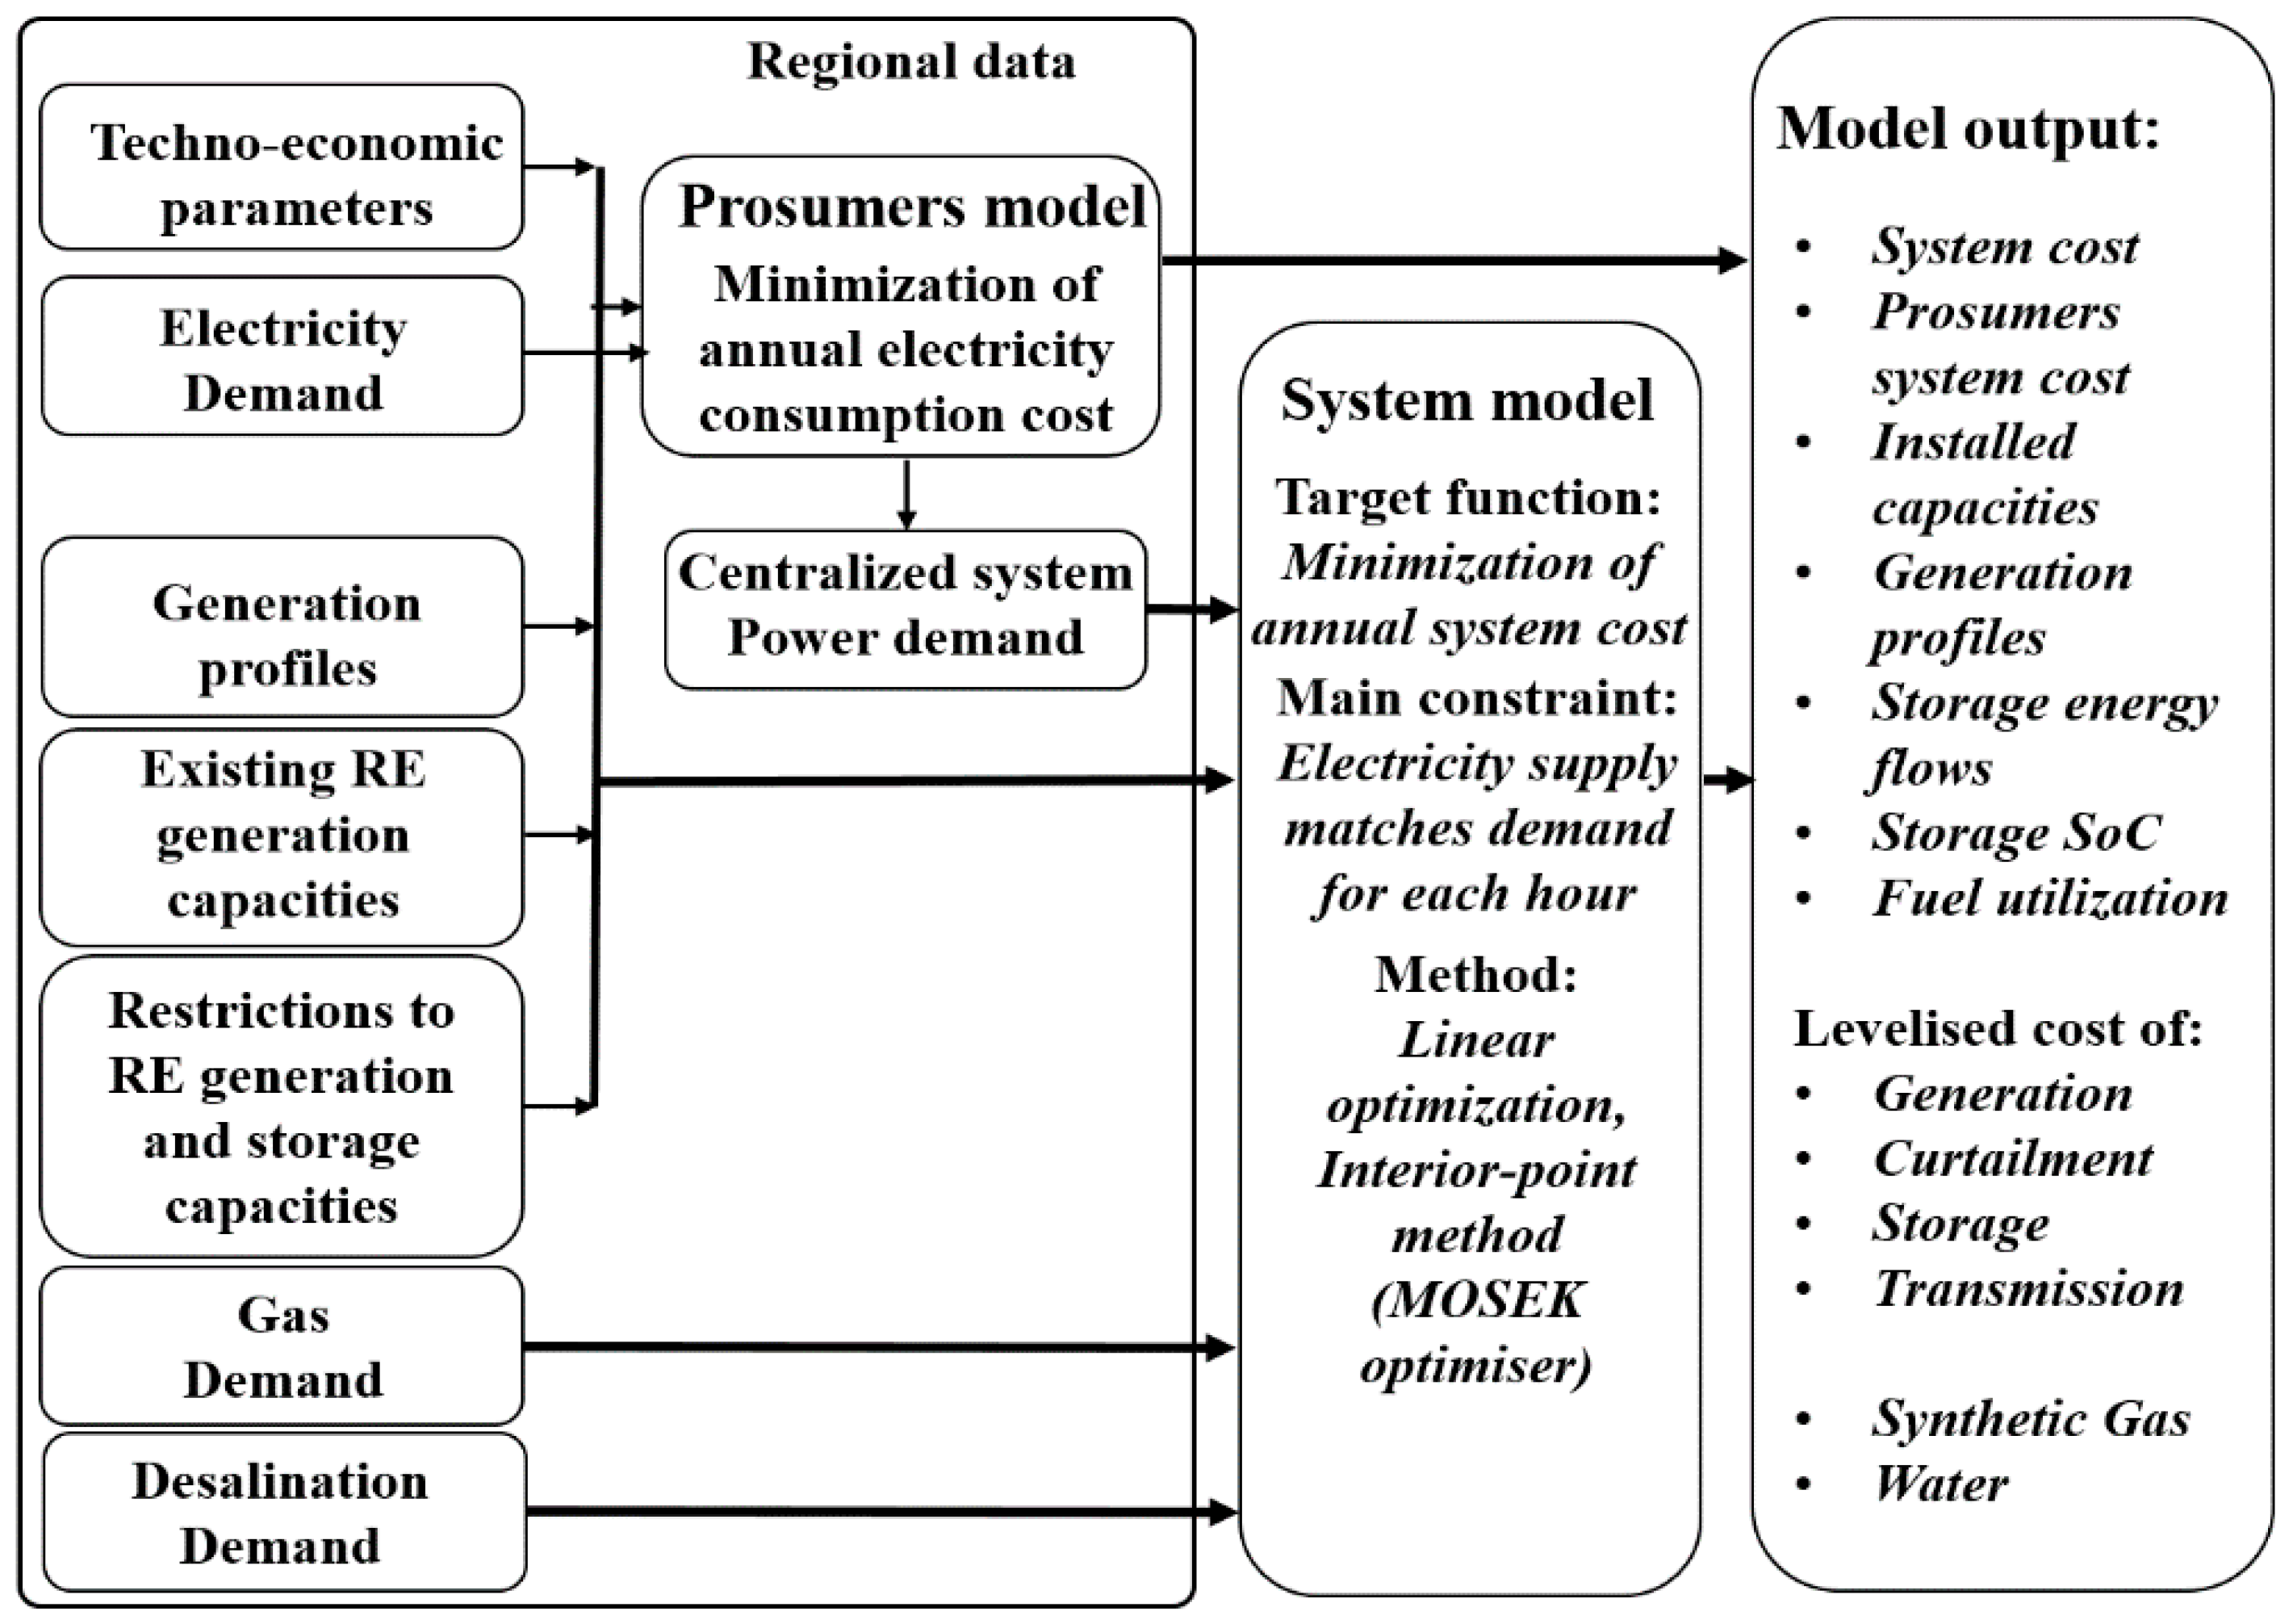
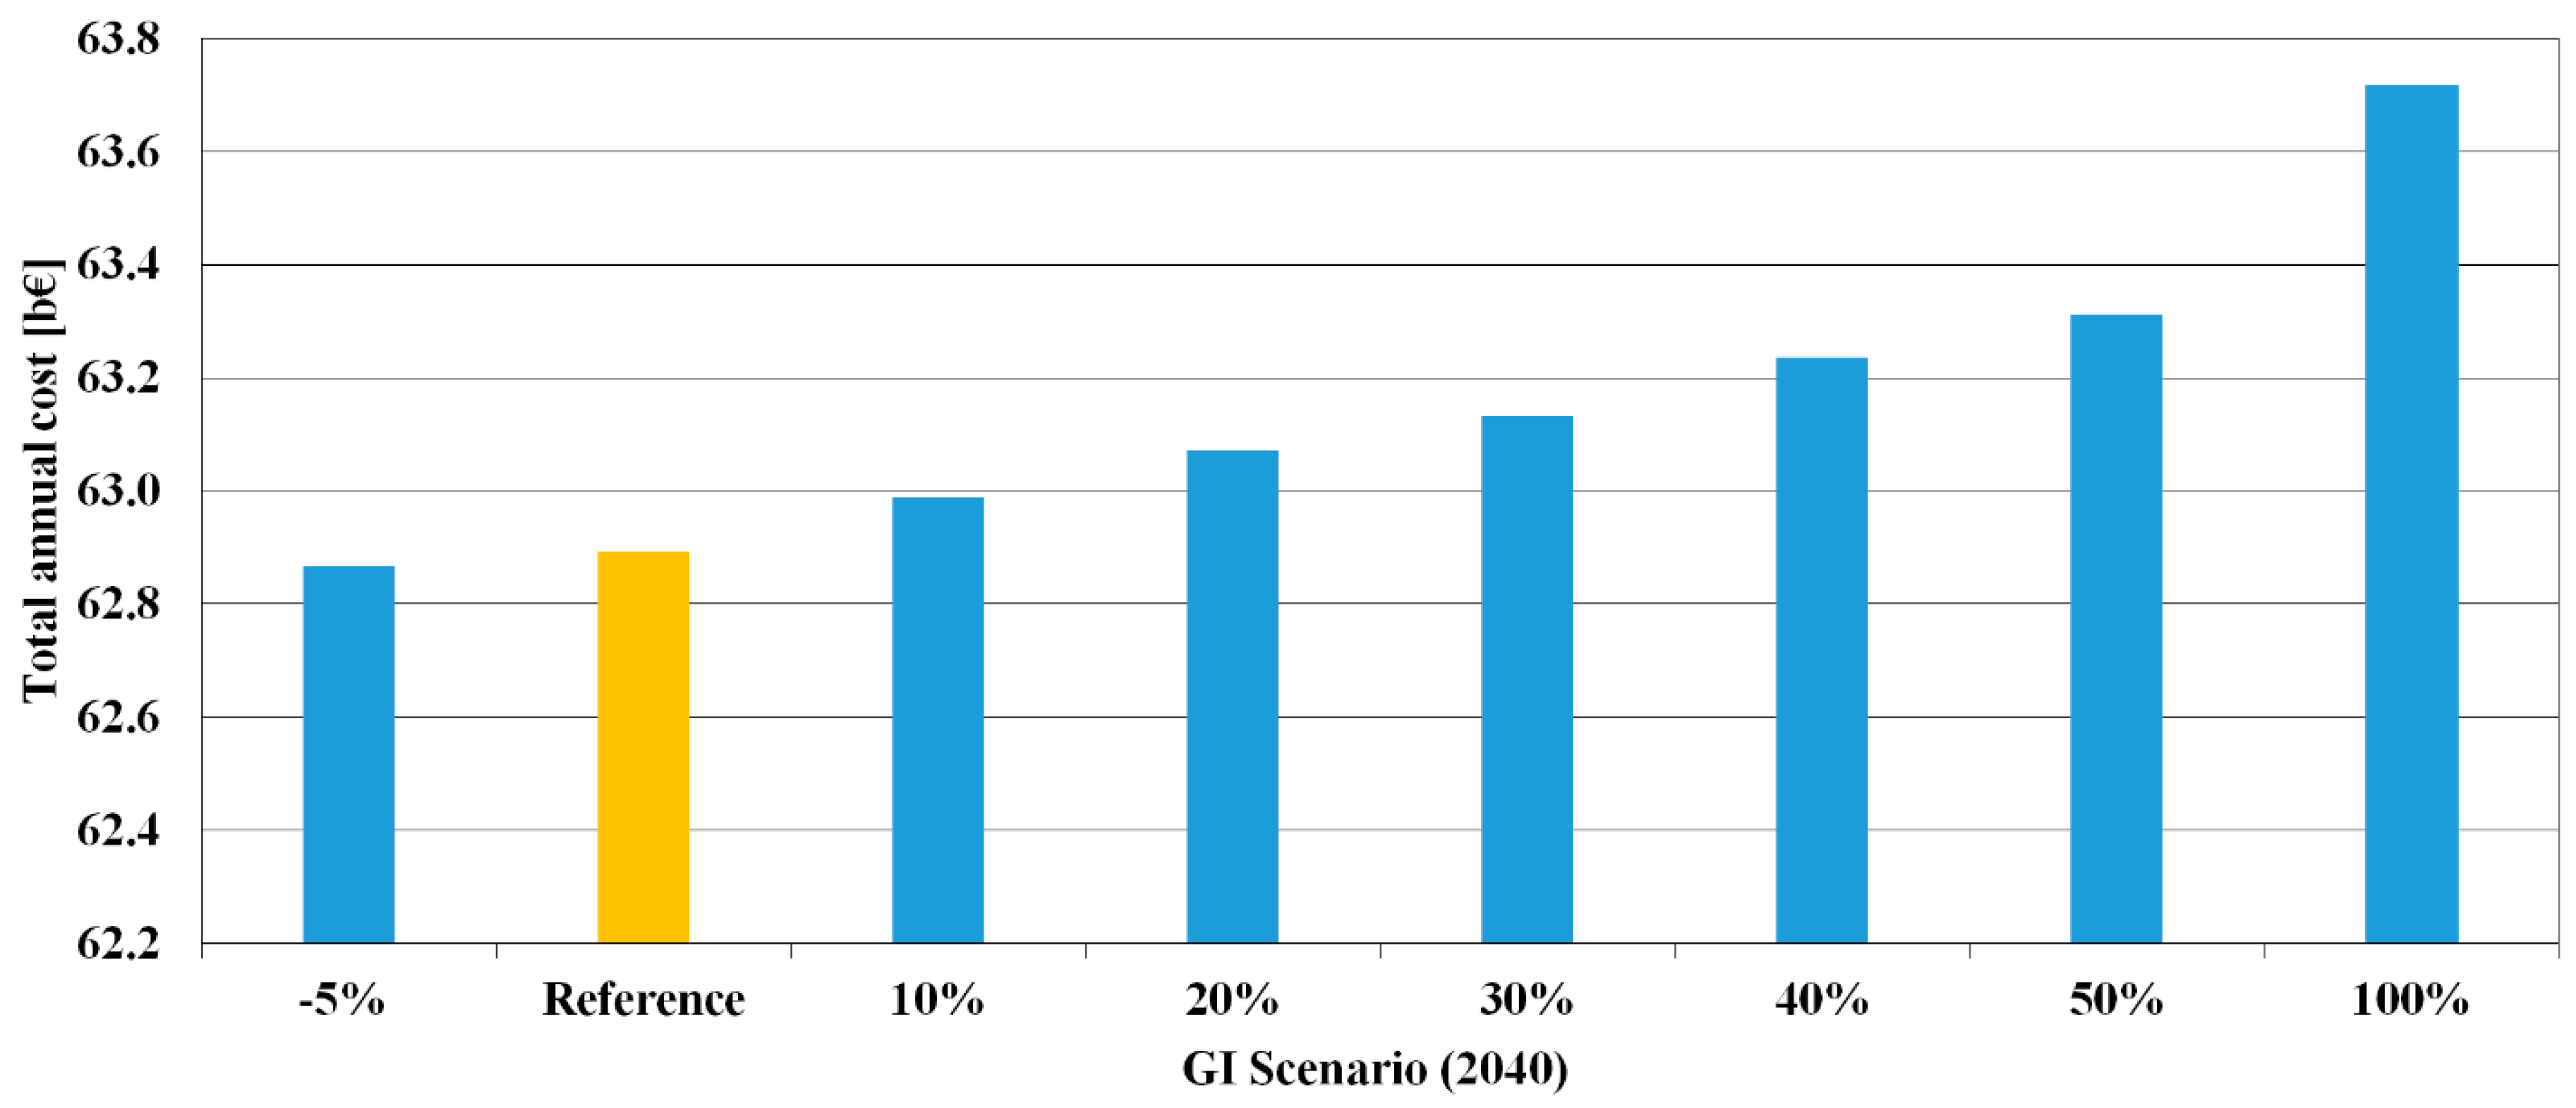
Table 1.
Financial results for the scenarios applied in SSA by 2030. Abbreviations: Inga 3 (I3) and Grand Inga (GI).
Table 1.
Financial results for the scenarios applied in SSA by 2030. Abbreviations: Inga 3 (I3) and Grand Inga (GI).
| 2030 | ||||||||||
|---|---|---|---|---|---|---|---|---|---|---|
| Scenario | Total LCOE (€/MWh) | LCOE Primary (€/MWh) | LCOC (€/MWh) | LCOS (€/MWh) | LCOT (€/MWh) | Total Ann. Cost (b€) | ∆ in Cost (%) | Total CAPEX (b€) | RE Capacities (GW) | Generated Electricity (TWh) |
| Reference | 54.36 | 36.36 | 1.67 | 14.76 | 1.56 | 47.09 | - | 414.35 | 377.89 | 957.75 |
| I3 announced cost | 54.13 | 36.22 | 1.68 | 14.66 | 1.58 | 46.90 | −0.4% | 412.28 | 374.77 | 959.71 |
| I3 expected cost | 54.44 | 36.53 | 1.68 | 14.65 | 1.58 | 47.16 | 0.1% | 416.09 | 374.74 | 959.86 |
| GI 0% | 53.95 | 35.79 | 1.77 | 14.37 | 2.02 | 46.68 | −0.9% | 411.80 | 371.90 | 970.27 |
| GI 35% | 54.36 | 36.24 | 1.78 | 14.41 | 1.93 | 47.04 | 0% | 416.14 | 372.62 | 969.89 |
| GI 50% | 54.54 | 36.4 | 1.78 | 14.41 | 1.93 | 47.19 | 0.2% | 417.96 | 372.46 | 969.27 |
| GI 100% | 55.46 | 37.16 | 1.82 | 14.54 | 1.96 | 48.01 | 2.0% | 426.43 | 372.16 | 962.03 |
Table 2.
Financial results for the scenarios applied in SSA by 2040. Abbreviations: Inga 3 (I3) and Grand Inga (GI).
Table 2.
Financial results for the scenarios applied in SSA by 2040. Abbreviations: Inga 3 (I3) and Grand Inga (GI).
| 2040 | ||||||||||
|---|---|---|---|---|---|---|---|---|---|---|
| Scenario | Total LCOE (€/MWh) | LCOE Primary (€/MWh) | LCOC (€/MWh) | LCOS (€/MWh) | LCOT (€/MWh) | Total Ann. Cost (b€) | ∆ in Cost (%) | Total CAPEX (b€) | RE Capacities (GW) | Generated Electricity (TWh) |
| Reference | 41.72 | 24.07 | 1.42 | 15.73 | 0.50 | 62.89 | - | 625.28 | 745.21 | 1662.38 |
| I3 Announced cost | 41.67 | 24.14 | 1.42 | 15.61 | 0.50 | 62.82 | −0.1% | 624.20 | 742.23 | 1663.51 |
| I3 Expected cost | 41.85 | 24.31 | 1.42 | 15.61 | 0.50 | 63.08 | 0.3% | 627.81 | 742.22 | 1663.49 |
| GI 0% | 41.74 | 24.58 | 1.42 | 15.13 | 0.60 | 62.90 | 0.02% | 624.91 | 730.93 | 1666.36 |
| GI −5% | 41.72 | 24.57 | 1.41 | 15.14 | 0.60 | 62.87 | −0.03% | 624.45 | 731.40 | 1667.70 |
| GI 50% | 42.02 | 24.83 | 1.43 | 15.14 | 0.61 | 63.31 | +0.7% | 630.40 | 730.86 | 1665.96 |
| GI 100% | 42.29 | 25.09 | 1.44 | 15.15 | 0.61 | 63.72 | +1.3% | 635.92 | 731.36 | 1667.53 |
Table 3.
Overview on installed capacities of generation and storage technologies for each scenario.
| 2030 | 2040 | ||||||||
|---|---|---|---|---|---|---|---|---|---|
| Technology | Unit | Reference Scenario | I3 Announced Cost | GI 0% | GI 100% | Reference Scenario | I3 Announced Cost | GI 0% | GI 100% |
| PV prosumer | (GW) | 61.3 | 61.3 | 61.3 | 61.3 | 198.3 | 198.3 | 198.3 | 198.3 |
| PV optimally tilted | (GW) | 1.4 | 1.4 | 1.4 | 1.4 | 1.4 | 1.4 | 1.4 | 1.4 |
| PV single-axis tracking | (GW) | 112.6 | 112.0 | 113.0 | 110.2 | 434.0 | 430.9 | 416.9 | 417.3 |
| PV total | (GW) | 175.3 | 174.7 | 175.7 | 173.0 | 633.7 | 630.6 | 616.5 | 616.9 |
| CSP | (GW) | 0.0 | 0.0 | 0.0 | 0.0 | 0.0 | 0.0 | 0.0 | 0.0 |
| Wind energy | (GW) | 133.6 | 133.2 | 130.1 | 130.1 | 60.5 | 60.1 | 60.3 | 60.4 |
| Biogas power plant | (GW) | 19.2 | 16.3 | 13.2 | 16.3 | 4.9 | 4.8 | 4.8 | 4.8 |
| Biomass power plant | (GW) | 2.7 | 2.6 | 1.0 | 1.8 | 0.0 | 0.0 | 0.0 | 0.0 |
| MSW incinerator | (GW) | 1.7 | 1.7 | 1.7 | 1.7 | 1.9 | 1.9 | 1.9 | 1.9 |
| Geothermal energy | (GW) | 4.9 | 4.6 | 3.3 | 3.7 | 3.0 | 3.0 | 3.0 | 3.0 |
| Hydro Run-of-River | (GW) | 5.2 | 6.3 | 11.1 | 11.1 | 5.2 | 6.3 | 11.1 | 11.1 |
| Hydro dams | (GW) | 20.4 | 20.5 | 22.0 | 20.9 | 20.3 | 20.4 | 20.1 | 20.2 |
| Battery prosumer | (GWh) | 72.2 | 72.2 | 72.2 | 72.2 | 432.3 | 432.3 | 432.3 | 1432.3 |
| Battery total | (GWh) | 242.6 | 239.7 | 231.1 | 237.1 | 1599.1 | 1587.4 | 1539.4 | 1538.8 |
| PHS | (GWh) | 3.16 | 3.2 | 3.2 | 3.2 | 1.6 | 1.6 | 1.6 | 1.6 |
| A-CAES | (GWh) | 426.2 | 418.4 | 405.4 | 416.3 | 0.11 | 0.2 | 1.5 | 1.6 |
| Gas storage | (GWh) | 18,361.6 | 18,476.7 | 18,601.6 | 18,732.0 | 29,330.2 | 29,189.8 | 28,194.3 | 28,162.6 |
| PtG electrolysers | (GWel) | 6.2 | 6.2 | 6.0 | 6.2 | 6.9 | 6.8 | 6.3 | 6.3 |
| CCGT | (GW) | 13.1 | 13.1 | 12.6 | 13.2 | 12.4 | 12.4 | 11.3 | 11.2 |
| OCGT | (GW) | 9.8 | 9.7 | 7.9 | 9.5 | 13.5 | 12.6 | 10.9 | 10.8 |
Table 4.
Synthetic inertia analysis and Rate-of-Change-of-Frequency (Hz/s) in Sub-Saharan Africa power system with different scenarios. Possible inertia of HVDC power lines, PtG units and demand response is not calculated, but would further improve the energy system stability in reality.
Table 4.
Synthetic inertia analysis and Rate-of-Change-of-Frequency (Hz/s) in Sub-Saharan Africa power system with different scenarios. Possible inertia of HVDC power lines, PtG units and demand response is not calculated, but would further improve the energy system stability in reality.
| 2030 | 2040 | ||||||||
|---|---|---|---|---|---|---|---|---|---|
| Contributing Generation | Reference Scenario | I3 Announced Cost | GI 0% | GI 100% | Reference Scenario | I3 Announced Cost | GI 0% | GI 100% | |
| Only synchronous units | Max | 4.71 | 4.50 | 3.69 | 3.77 | 12.97 | 12.34 | 10.41 | 10.35 |
| Min | 0.69 | 0.67 | 0.58 | 0.59 | 0.45 | 0.44 | 0.42 | 0.42 | |
| +Wind inertia | Max | 3.10 | 3.00 | 2.62 | 2.65 | 10.97 | 10.52 | 9.04 | 9.00 |
| Min | 0.55 | 0.54 | 0.49 | 0.49 | 0.40 | 0.40 | 0.38 | 0.38 | |
| +PV inertia | Max | 2.76 | 2.68 | 2.37 | 2.40 | 7.19 | 7.00 | 6.32 | 6.30 |
| Min | 0.55 | 0.54 | 0.49 | 0.49 | 0.40 | 0.40 | 0.38 | 0.38 | |
| +Battery inertia | Max | 0.20 | 0.20 | 0.21 | 0.21 | 0.16 | 0.16 | 0.17 | 0.17 |
| Min | 0.03 | 0.04 | 0.04 | 0.04 | 0.01 | 0.01 | 0.01 | 0.01 | |
| +HVDC inertia | Max | ||||||||
| Min | |||||||||
| +PtG inertia | Max | ||||||||
| Min | |||||||||
| +Demand response | Max | ||||||||
| Min | |||||||||
© 2018 by the authors. Licensee MDPI, Basel, Switzerland. This article is an open access article distributed under the terms and conditions of the Creative Commons Attribution (CC BY) license (http://creativecommons.org/licenses/by/4.0/).
Share and Cite
MDPI and ACS Style
Oyewo, A.S.; Farfan, J.; Peltoniemi, P.; Breyer, C. Repercussion of Large Scale Hydro Dam Deployment: The Case of Congo Grand Inga Hydro Project. Energies 2018, 11, 972. https://0-doi-org.brum.beds.ac.uk/10.3390/en11040972
AMA Style
Oyewo AS, Farfan J, Peltoniemi P, Breyer C. Repercussion of Large Scale Hydro Dam Deployment: The Case of Congo Grand Inga Hydro Project. Energies. 2018; 11(4):972. https://0-doi-org.brum.beds.ac.uk/10.3390/en11040972
Chicago/Turabian StyleOyewo, Ayobami Solomon, Javier Farfan, Pasi Peltoniemi, and Christian Breyer. 2018. "Repercussion of Large Scale Hydro Dam Deployment: The Case of Congo Grand Inga Hydro Project" Energies 11, no. 4: 972. https://0-doi-org.brum.beds.ac.uk/10.3390/en11040972
Note that from the first issue of 2016, this journal uses article numbers instead of page numbers. See further details here.