Article

Economic Performance and Emission Reduction of Supply Chains in Different Power Structures: Perspective of Sustainable Investment

1
School of Economics and Management, Nanjing University of Science and Technology, Nanjing 210094, China
2
School of Business Administration/MBA School, Zhongnan University of Economics and Law, Wuhan 430073, China
*
Author to whom correspondence should be addressed.
Submission received: 28 March 2018 / Revised: 13 April 2018 / Accepted: 15 April 2018 / Published: 18 April 2018
(This article belongs to the Special Issue Energy Economy, Sustainable Energy and Energy Saving)

Abstract

:
Environmental issues have increasingly received attention in both industry and academia. Many firms have started to make sustainable investments, such as adopting the pollution-abatement technologies, to reduce carbon emissions. To investigate the impacts of the sustainable investment on firms’ profit and emission reduction, we consider supply chains with uncertain demand in different power structures. Specifically, we examine the sustainable investment problem in three supply chain power structures, i.e., manufacturer Stackelberg (MS) power structure, vertical Nash (VN) power structure and retailer Stackelberg (RS) power structure. We first derive the optimal decisions for both the retailer and manufacturer in each power structure. Then, by comparing the results in the three power structures, we find that the manufacturer gets benefits from making the sustainable investment, especially in unequal power structures. When the average market size is large (small) enough, both of the supply chain members obtain more profits in the MS (RS) power structure. From an environmental perspective, we find that the emission reduction is more significant in sequential games (i.e., MS and RS power structures) than that in a simultaneous game (i.e., VN power structure). In addition, we conduct some numerical studies and discuss more managerial insights in the paper.

1. Introduction

Facing environmental issues, many firms have adopted some pollution-abatement technologies to reduce carbon emissions and essentially keep biological systems remaining diverse and productive, indefinitely. These actions and related environmental issues are so called sustainability issues, which are increasingly significant for firms nowadays. Note that the adoption of sustainable technologies requires substantial investments and it usually cannot be evaluated by purely economic indicators. Observed from industry and academia, environmental policies and market response motivate firms to invest in sustainable technologies [1]. Regarding the environmental policies, the environmental tax credit is often utilized as an efficient incentive for firms to invest in sustainable effort to control the emissions [1,2,3]. For example, the solar Investment Tax Credit (ITC) benefits and supports firms that adopt the solar energy deployment in the United States [4]. Focused on the market side, the sustainable investment has positive effects on the demands of the eco-friendly products, as shown in both research papers and industry reports [4,5,6]. It implies that some customers are environmental aware. They accordingly have preferences for the products that have high sustainable levels. From the above observations, we find that firms need to consider the trade-off between sustainable investment in pollution-abatement technologies and its incentives, such as the environmental tax credit and the benefits from incremental demands. Thus, it is significant to analyze the firms’ sustainable investment from both economic and environmental perspectives.
In addition, it is also interesting to investigate that how a manufacturer’s dominant position affects the sustainable investment in supply chains. Acting as a core enterprise in supply chains, Apple has issued a $ 1.5 billion green bond for environmental and sustainable projects since 2011. As a result, it addressed its significant environmental responsibility by showing the result that the comprehensive carbon footprint was reduced by 8.9 million metric tons in 2016 [7]. On the other hand, some large retailers also involve in their supply chain partners’ sustainable projects. For instance, Marks&Spencer, the largest retail group in the UK, orders from its supplier only when the upstream strictly follows the Supplier Code of Conduct. As a result, it is shown that 42 % of the cotton materials that are offered by M&S’s qualified suppliers came from sustainable sources in 2016 ( 32 % in 2015) [4,8]. However, after participating in supply chain leaders’ sustainable projects, whether the followers with less power will get hurt and the impact of their sustainable effort on environmental performance are still unknown. We attempt to investigate whether the manufacturers with dominant positions have more incentive to make sustainable investment than other supply chain members with less power. In addition, we will examine whose sustainable investments, the leader’s or the follower’s, has more significant impact on the emission reduction. We are also interested in how the factors such as average market size, consumer environmental awareness, sustainable investment cost and tax credits affect the supply chains’ economic and environmental performances in different power structures?
In the existing literature, the issue of sustainable investment in a supply chain with the consideration of power structure is rarely studied, except Chen et al. [9] and Shi et al. [4], who, however, did not take demand uncertainty into account in their studies. In our paper, the joint effect of power structures and sustainable investment in the economic and environmental performance, such as emission reduction of the supply chain, has been investigated. We consider a two-echelon supply chain where the manufacturer has options to make sustainable investment, while the retailer makes ordering decisions. Following the industrial applications, we assume that the sustainable investment brings about tax credit and demand increases. The sustainable investment and ordering decisions are analyzed in three power structures, i.e., manufacturer Stackelberg (MS) power structure, vertical Nash (VN) power structure and retailer Stackelberg (RS) power structure, respectively. By comparing the results in the three power structures, we derive some significant managerial insights. To the best of our knowledge, it is the first paper that studies the joint effect of sustainable investment and different supply chain power structures with stochastic demand settings. We find that the manufacturer gets benefits from making the sustainable investment, especially in cases with unequal supply chain power. When the average market size is large (small) enough, both the manufacturer and retailer gain more profits and the emission reduction is the most notable in the MS (RS) power structure, which is equivalent to a sequential game. Then, from an environmental perspective, we can state that the emission reduction is more significant in sequential games than that in a simultaneous game (i.e., VN power structure).
The paper is organized as follows. In Section 2, we review the related literature. Section 3 introduces the three models in different supply chain power structures. In Section 4, we analyze the manufacturer’s optimal sustainable investment and the retailer’s operations decisions. In Section 5, all the optimal decisions are compared and the managerial insights are derived. We compare the related economic and environmental performance in the same section. More insights are provided with numerical analysis. Section 6 concludes the paper. All of the technical proofs are relegated to the Appendix A.

2. Literature Review

Our paper is related to two streams of research in the literature. The first stream is the supply chain management with sustainability issues, and the second one is the impact of different power structures in supply chains.
Sustainability issues have gained extensive attention in the supply chain management literature, and there is an increasing consensus that these issues should be incorporated into operations decisions [5,6]. Some papers have investigated the carbon emission with supply chain aspects, e.g., production/inventory decisions, sourcing problems, return polices and supplier evaluation [10]. Choi [11] investigates how a carbon footprint taxation scheme could be imposed on a fashion quick response system by discussing the ordering and inventory decisions. Rosič and Jammernegg [12] analyze the impact of the environmental regulations on a dual sourcing problem. Niu et al. [13] study the economic and environmental sustainability conflicts in a supply chain under direct sourcing and sub-sourcing. It is shown that subsidizing regulation may achieve both the economic and environmental goals while punishing may not. Shen and Li [14] analyze the effects of the return policies, which bring about leftovers on the sustainability of a fashion supply chain. Guo et al. [15] adopt a fuzzy multi-criteria decision-making approach to evaluate the green supplier. Based on a case study in China, He et al. [16] discuss the development of low-carbon logistics. Cheng et al. [10] address the fact that one of the critical elements for integrating the carbon reduction and energy savings into supply chain management is sustainable investment, which is necessary for sustainable adoption such as pollution-abatement technologies and deployment of new energy. However, the investment in sustainability is not considered by the majority of the above literature.
Considering the sustainable investment, Benjaafar et al. [17] investigate the integration of carbon mission concerns and production/inventory decisions. Drake et al. [3] investigate the sustainable investment with comparison of different emission regulations such as emission tax and cap-and-trade regulations. After analyzing the joint decisions of replenishment and sustainable investment under cap-and-trade and emission tax policies, Toptal et al. [18] show that sustainable investment may reduce both the carbon emission and cost. Acting as effective promotion of sustainable investment, consumer environmental awareness and tax credits have been widely studied recently. Two early papers, Yalabik and Fairchild [19] and Liu et al. [20], address consumer environmental awareness being an incentive for the firm’s sustainable investment. Jaber et al. [21], Zhang et al. [22], Du et al. [23], Li and Shen [24], and Dong et al. [6] discuss the supply chain coordination with consideration of incentives such as consumer environmental awareness and/or emissions reduction. Drake et al. [3] analyze the impact of emission trading and tax regulation on the green technology selection and capacity decisions.
Considering consumer environmental awareness, tax credits and investment in technologies of emissions reduction/clean energy development, the effect of supply chain power structure is also investigated in our paper. Under this framework, different supply chain power structures are often modeled with respect to the sequential actions of the manufacturer and retailer. Anupindi and Bassok [25] model the interaction between a manufacturer and two retailers as manufacturer Stackelberg games where the manufacturer makes channel strategies. The interaction can also be modeled as a vertical Nash game in which firms make their decisions simultaneously [26]. To model the situation with a power retailer, Dukes et al. [27] consider a retailer Stackelberg game. Unlike the above papers that concentrate on one specific game, existing literature also studies and compares decisions/performances in different power structures. Choi [28] investigates the pricing decision of a supply chain consisting of two competing manufacturers and a common retailer. Three non-cooperative games of different power structures are analyzed: manufacturer Stackelberg, vertical Nash and retailer Stackelberg. Ertek and Griffin [29] explore the effects of power structure on price decisions, sensitivity of average market price, and related profits. Chen and Wang [30] study the impacts of power structure on the channel selection between the free and bundled channels. Luo et al. [31] examine the impact of different power structures on the prices and profits of both the manufacturers’ and retailers’ sides. There is some literature that considers the consumer environmental awareness with other supply chain respects, e.g., different power structures, supply chain performance valuation and business modes selection. Specifically, Chen et al. [9] compare the equilibrium solutions in three supply chain power structures to analyze the effects of power relationships on sustainability performance of the manufacturer who is the only one creating sustainable investment. Shi et al. [4] further investigate the joint effect of different power structures and sustainable investment on the economic and environmental performance in a supply chain, and consider investment as an option for both the manufacturer and retailer. However, these studies do not taken the demand uncertainty into consideration.
The impacts of demand models on firms’ operational decisions have been widely considered. Studying the sustainable issues with the consideration of consumer environmental awareness and information updating, Cheng et al. [10] consider a newsvendor problem with sustainable investment. They find that the manufacturer’s optimal sustainable investment when the retailer adopts the big data technology depends on the service level on the retailer side. Shi et al. [32] examine how the impacts of supply chain power structure depend on different stochastic demand models. They show that the impact of power structure on supply chain efficiency depends on the models of both expected demand and demand shock. Our study is similar to these two studies by considering similar settings for the demands; however, we focus on examining the joint effect of the sustainable investment and power structure with stochastic demands, which significantly affect the environmental performance.
Table 1 shows the positioning of our paper in the literature.
As shown in Table 1, this is the first paper that studies the joint effect of sustainable investment and supply chain power structure with the consideration of stochastic demand. In addition, this paper is consistent with the industrial practice by considering carbon emission reduction, consumer environmental awareness, and tax credits as incentives of sustainable investment. These incentives are investigated in different streams of studies and eventually epitomized in this paper.

3. Modelling Framework

Consider a manufacturer (he) sellng a single type product at a unit wholesale price w to a retailer (she), who fulfills the stochastic demand at a unit retail price p. The unit production cost of the manufacturer is c. Since the demand is stochastic, some leftovers exist at the end of the selling period. Denote v as the unit salvage value of the unsold products. Clearly, we have p > w > c > v .
Following the literature and industrial practice, we consider that the manufacturer has an option to invest in improving the product functionality to a higher eco-friendly level [4]. Define e as the increment of sustainable level, which represents the increase of eco-friendly degree after investment. Note that this parameter represents the carbon emission reduction per unit product due to sustainable investment. Since it highly depends on the amount of sustainable investment, we refer to e as sustainable investment level for short. Let D denote the stochastic demand of the products. Consistent with the literature (see e.g., Dong et al. [6] and Cheng et al. [10]), the demand function can be expressed as follows:
D = x + β e ,
where β > 0 represents the degree of consumers’ environmental awareness, and x 0 is the demand base. Assume that x is irrelevant to the sustainable level and normally distributed with mean μ and variance σ 2 , i.e., x N ( μ , σ 2 ) . We refer to μ as the average market size. Let Φ ( . ) and ϕ ( . ) represent the cumulative distribution function and probability density function of the standard normal distribution, respectively. In addition, let Φ 1 ( . ) denote the inverse function of Φ ( . ) and let Q denote the retailer’s ordering quantity. To avoid the trivial outcomes, we assume that Q β e .
One of the primary incentives of sustainable investment is environmental taxation/tax credits [6]. Therefore, we assume that the increment of sustainable level (i.e., e) benefits the manufacturer from environmental tax reduction or brings about tax credit, which is presented as follows:
T ( e ) = t e ,
where t > 0 is the environmental tax reduction/tax credit parameter. Note that it is determined by the per unit emission reduction equivalent and tax rate/credit.
The manufacturer’s sustainable effort brings about the sustainable investment cost to him. We model the following investment cost function:
I ( e ) = λ 2 e 2 .
It indicates that the total sustainable investment cost is increasingly convex in e. This assumption is wildly used in the literature (see, e.g., Dong et al. [6] and Cheng et al. [10]).
The retailer’s decision is order quantity (i.e., Q), and the manufacturer decides the increment of sustainable level (i.e., e), which represents the amount of sustainable investment, essentially. Based on the above settings, we next present three supply chain power structures, i.e., (1) the manufacturer Stackelberg (MS) power structure, (2) the vertical Nash (VN) power structure, and (3) the retailer Stackelberg (RS) power structure. Both firms’ objectives are to maximize their profits. Define Π r i and Π m i as the retailer’s and manufacturer’s optimal expected profits, where i = m , n , r denotes the MS, VN and RS power structures, respectively. Let x + = max ( x , 0 ) ; then, the optimal expected profits are expressed as:
Π r i = max Q E D [ p min { D , Q } w Q + v ( Q D ) + ] ,
Π m i = max e { ( w c + T ( e ) ) Q I ( e ) } .
The manufacturer and retailer make sequential decisions in the MS power structure. Based on the expectation of retailer’s response, the manufacturer decides the optimal sustainable investment level (i.e., e) first. Then, the retailer determines the ordering quantity in response to the sustainable investment level.
In the VN power structure, the two firms make decisions simultaneously. The retailer decides the ordering quantity of the product and the manufacturer decides the sustainable investment level to maximize profits.
In the RS power structure, the two decision-makers move in sequence. By taking the manufacturer’s possible response function into consideration, the retailer decides the optimal order quantity. Then, the manufacturer decides the sustainable investment level in response to the given order quantity.

4. Analysis of Different Power Structures

First, we consider the MS power structure. The retailer’s optimal order quantity is denoted as Q m , and the manufacturer’s optimal sustainable investment level is denoted as e m . We have the following lemma:
Lemma 1.
In the MS structure, the retailer’s optimal order quantity and the manufacturer’s optimal sustainable investment level are as follows:
Q m = ( λ β t ) ( μ + k σ ) + β 2 ( w c ) λ 2 β t ,
e m = ( μ + k σ ) t + β ( w c ) λ 2 β t ,
where k = Φ 1 ( p w p v ) .
After substituting the optimal decisions into Equations (1) and (2), then the optimal expected profits can be expressed as follows:
Π r m = ( p w ) ( μ + β e m ) ( p v ) ϕ ( k ) σ ,
Π m m = ( w c + t e m ) Q m λ 2 e m 2 .
Next, we analyze the optimal decisions in the VN power structure. The retailer’s optimal order quantity is denoted as Q n , and the manufacturer’s optimal sustainable investment level is denoted as e n . We have the following lemma:
Lemma 2.
In the VN power structure, the retailer’s optimal order quantity and the manufacturer’s optimal sustainable investment level are as follows:
Q n = λ ( μ + k σ ) λ β t ,
e n = ( μ + k σ ) t λ β t .
After substituting the optimal decisions into Equations (1) and (2), then the optimal expected profits are expressed as follows:
Π r n = ( p w ) ( μ + β e n ) ( p v ) ϕ ( k ) σ ,
Π m n = ( w c + t e n ) Q n λ 2 e n 2 .
In the RS power structure, the retailer’s optimal order quantity is denoted as Q r , and the manufacturer’s optimal sustainable investment level is denoted as e r . We have the following lemma:
Lemma 3.
In the RS power structure, the retailer’s optimal order quantity and the manufacturer’s optimal sustainable investment level are as follows:
Q r = λ ( μ + k σ ) λ β t ,
e r = ( μ + k σ ) t λ β t ,
where k = Φ 1 p w ( p v ) ( 1 β t λ ) .
After substituting the optimal decisions into Equations (1) and (2), the optimal expected profits are expressed as follows:
Π r r = ( p w ) ( μ + β e r ) ( p v ) ϕ ( k ) σ ,
Π m r = ( w c + t e r ) Q r λ 2 e r 2 .

5. Comparison

5.1. Analytical Comparison of the Decisions and Performance

We investigate the impact of power structure on the optimal decisions, emission reduction and profits in this section. Based on the results of comparison, we investigate the incentive of sustainable investment, the environmental performance and the retailer’s role in sustainability issues.
For the effect of power structure on the manufacturer’s optimal sustainable investment level (i.e., e), we obtain the following proposition:
Proposition 1.
e m > e n and e r > e n . If μ μ ˜ , then e m e r ; otherwise, e m < e r , where:
μ ˜ = [ k ( λ 2 β t ) k ( λ β t ) ] t σ ( w c ) β ( λ β t ) β t 2 .
Note that the condition μ μ ˜ always holds when k ( λ 2 β t ) k ( λ β t ) . Proposition 1 indicates that the sustainable effort as a function of the supply chain member’s power is U-shaped. This result implies that when either of the firms becomes the leader, the manufacturer will make more sustainable investment. Since the amount of sustainable investment is the only decision made by the manufacturer, he has to raise it towards a higher level in a sequential game than he does in a simultaneous game. This result is different from that with deterministic demand setting (see e.g., Shi et al. [4]). In addition, when the average market size is large enough (i.e., μ μ ˜ ), the manufacturer makes the most sustainable investment when he becomes the leader of the supply chain. This is because the effect of sustainable efforts on demand incentive and environmental tax reduction dominates the sustainable investment cost when the demand is large. This result is consistent with the observation in industry that sustainable practices are well observed from manufacturers with large market size (e.g., H&M and Zara), while they are seldom advocated by a manufacturer who focuses on a niche market.
Next, we discuss how the retailer’s optimal decision varies in different power structures. To highlight the impact of sustainable investment on ordering decisions, we first consider a case that the manufacturer makes no sustainable investment as a benchmark. The order quantity in the benchmark is denoted as Q 0 . Solving our problem by letting e = 0 , we derive that Q 0 = μ + k σ . For the effect of power structure on the retailer’s optimal ordering quantity (i.e., Q), we obtain the following proposition:
Proposition 2.
Q m > Q n > Q 0 and Q r > Q n > Q 0 . If μ μ ^ , then Q m Q r ; otherwise, Q m < Q r , where:
μ ^ = [ k λ ( λ 2 β t ) k ( λ β t ) 2 ] σ ( w c ) β 2 ( λ β t ) β 2 t 2 .
Proposition 2 shows that the order quantity as a function of the retailer’s power is U-shaped. It implies that when either of the firms becomes the leader, the retailer will order more products. Combining this result with the relationships of the manufacturer’s sustainable investment in Proposition 1, we further demonstrate how a retailer could contribute to sustainable development. In sequential games, the retailer is able to utilize a higher order quantity to attract the manufacturer’s sustainable investment (i.e., Q i > Q n and e i > e n , i = m , r ). In addition, the retailer orders more in the VN power structure than that in the benchmark (i.e., Q n > Q 0 ). It also implies that the retailer’s increasing orders boost the manufacturer’s sustainable investment in simultaneous games. In order to further analyze the manufacturer’s and retailer’s optimal decisions in sequential games, we compare the threshold value of average market size and obtain the following corollary.
Corollary 1.
Because μ ^ > μ ˜ , then e m e r > e n and Q r Q m > Q n when μ [ μ ˜ , μ ^ ] . In addition, e m e r > e n and Q m Q r > Q n , when μ > μ ^ . If μ < μ ˜ , then e r e m > e n and Q r Q m > Q n .
This corollary shows that, when the average market size is medium, the retailer has an opportunity to make the manufacturer invest at the highest level (i.e., e m > e r ) with less order quantity (i.e., Q m < Q r ), when the manufacturer plays a leading role in the supply chain. In addition, when the average market size is large enough (i.e., μ > μ ^ ), the retailer enlarges the ordering quantity to allow the manufacturer to keep making the highest sustainable investment with his leadership. When the average market size is relatively small (i.e., μ < μ ˜ ), the retailer orders more than other cases when she is the leader. As a result, the manufacturer has to make the highest sustainable investment.
In addition, we study the environmental performance in different power structures. We define E R i = Q i e i as the total emission reduction by sustainable investment. Comparing the total emission reductions in each power structure, the following proposition shows the environmental performance in different power structures.
Proposition 3.
The total emission reduction as a function of the retailer’s power is U-shaped, i.e., E R m > E R n , and E R r > E R n . In addition, if μ > μ ^ , then E R m > E R r ; and if μ < μ ˜ , then E R m < E R r .
This proposition shows that it is beneficial for the environment when a dominator exists in a two-echelon supply chain. Since the emission reduction is determined by the sustainable effort and ordering quantity, combining the results in Proposition 1 and 2, the gap between emission reductions in different power structures is enlarged. In addition, when the average market size is large enough (i.e., μ > μ ^ ), the highest sustainable investment is made in the MS power structure. Acting as a follower, the retailer orders more than she does in any other power structures. In addition, the emission reduction is then amplified. On the other hand, when the average market size is small enough (i.e., μ < μ ˜ ), the retailer utilizes her power to order in the RS power structure the most. Then, the manufacturer has an incentive to make the most sustainable investment in this case. As a result, the emission reduction is the most notable in the RS power structure, when the average market size is small.
The above propositions imply that unequal supply chain power structures are more advantageous than equal ones from environmental and consumers’ perspectives because of the higher emission reduction and more fulfillment of demands. It is suggested that the regulator may adopt policies such as providing subsidies to disequilibrate the simultaneous game in a supply chain with equal power structure. Similarly, these observations also show that it is more beneficial for both the environment and consumers in the MS (RS) power structure when the average market is large (small) enough.
Next, we analyze the economic performance by demonstrating the retailer’s and manufacturer’s profits in each power structure. Their profits for the benchmark that no one makes sustainable investment are denoted as Π r 0 and Π m 0 , respectively. In order to obtain neat results, we assume a high inventory service level (e.g., Φ ( k ) > 0.5 ), which is a common practice in industry (see e.g., Iyer and Bergen [35] and Choi [11]). Accordingly, ϕ ( k ) decreases in k. Later, we will release this assumption with numerical analysis. For the effect of power structure on the retailer’s optimal profit (i.e., Π r ), we obtain the following proposition:
Proposition 4.
Π r m > Π r n > Π r 0 and Π r r > Π r n > Π r 0 . If μ μ , then Π r m Π r r ; otherwise, Π r m < Π r r , where:
μ = ( p v ) ( λ 2 β t ) ( λ β t ) [ ϕ ( k ) ϕ ( k ) ] σ + ( p w ) β { [ k ( λ 2 β t ) k ( λ β t ) ] σ ( w c ) β ( λ β t ) } ( p w ) β 2 t 2 .
Interestingly, Proposition 4 also indicates that the retailer’s expected profit as a function of the retailer’s power is U-shaped. In addition, it is possible for the retailer to get a lower profit when she is the leader than in the case when she is a follower. Moreover, the manufacturer’s sustainable investment benefits the retailer by the profit improvement from the demand incentive. We further investigate the retailer’s profits in different power structures by considering a low service level (e.g., Φ ( k ) < 0.5 ) through numerical analysis. For the values of parameters, we set β = 3 , t = 2.5 , λ = 25 , w = 60 , v = 30 and c = 50 . In addition, we set p = 70 in a low service level case, and consider a high service level case to compare with by setting p = 100 . We change μ from 20 to 100.
Figure 1 (left) shows that when the service level is relatively low, the retailer’s profit decreases in her power. This observation is different from results in Proposition 4. Acting as a leader in the supply chain, the retailer’s profit becomes the lowest in the RS power structure with low service level. When the service level is lower than 0.5 , the safety factor becomes negative and ϕ ( k ) < ϕ ( k ) . Accordingly, the retailer’s profit in the RS power structure is lower than any other power structures. In addition, Figure 1 (right) confirms our analytical results in Proposition 4.
For the effect of power structure on the manufacturer’s optimal profit (i.e., Π m ), we have the following proposition:
Proposition 5.
Π m m > Π m n > Π m 0 and Π m r > Π m n > Π m 0 .
This proposition indicates that the manufacturer has an incentive to make sustainable investment through profit improvement (i.e., Π m i > Π m 0 , i = m , n , r ). In addition, we find that the manufacturer’s expected profit is a U-shaped function of the manufacturer’s power. This result is consist with our previous findings. In that case, it is possible to simultaneously achieve the economical and environmental optimality when either firm is the leader of the supply chain (i.e., Π i j > Π i n > Π i 0 and E R j > E R n , i = r , m and j = r , m ).

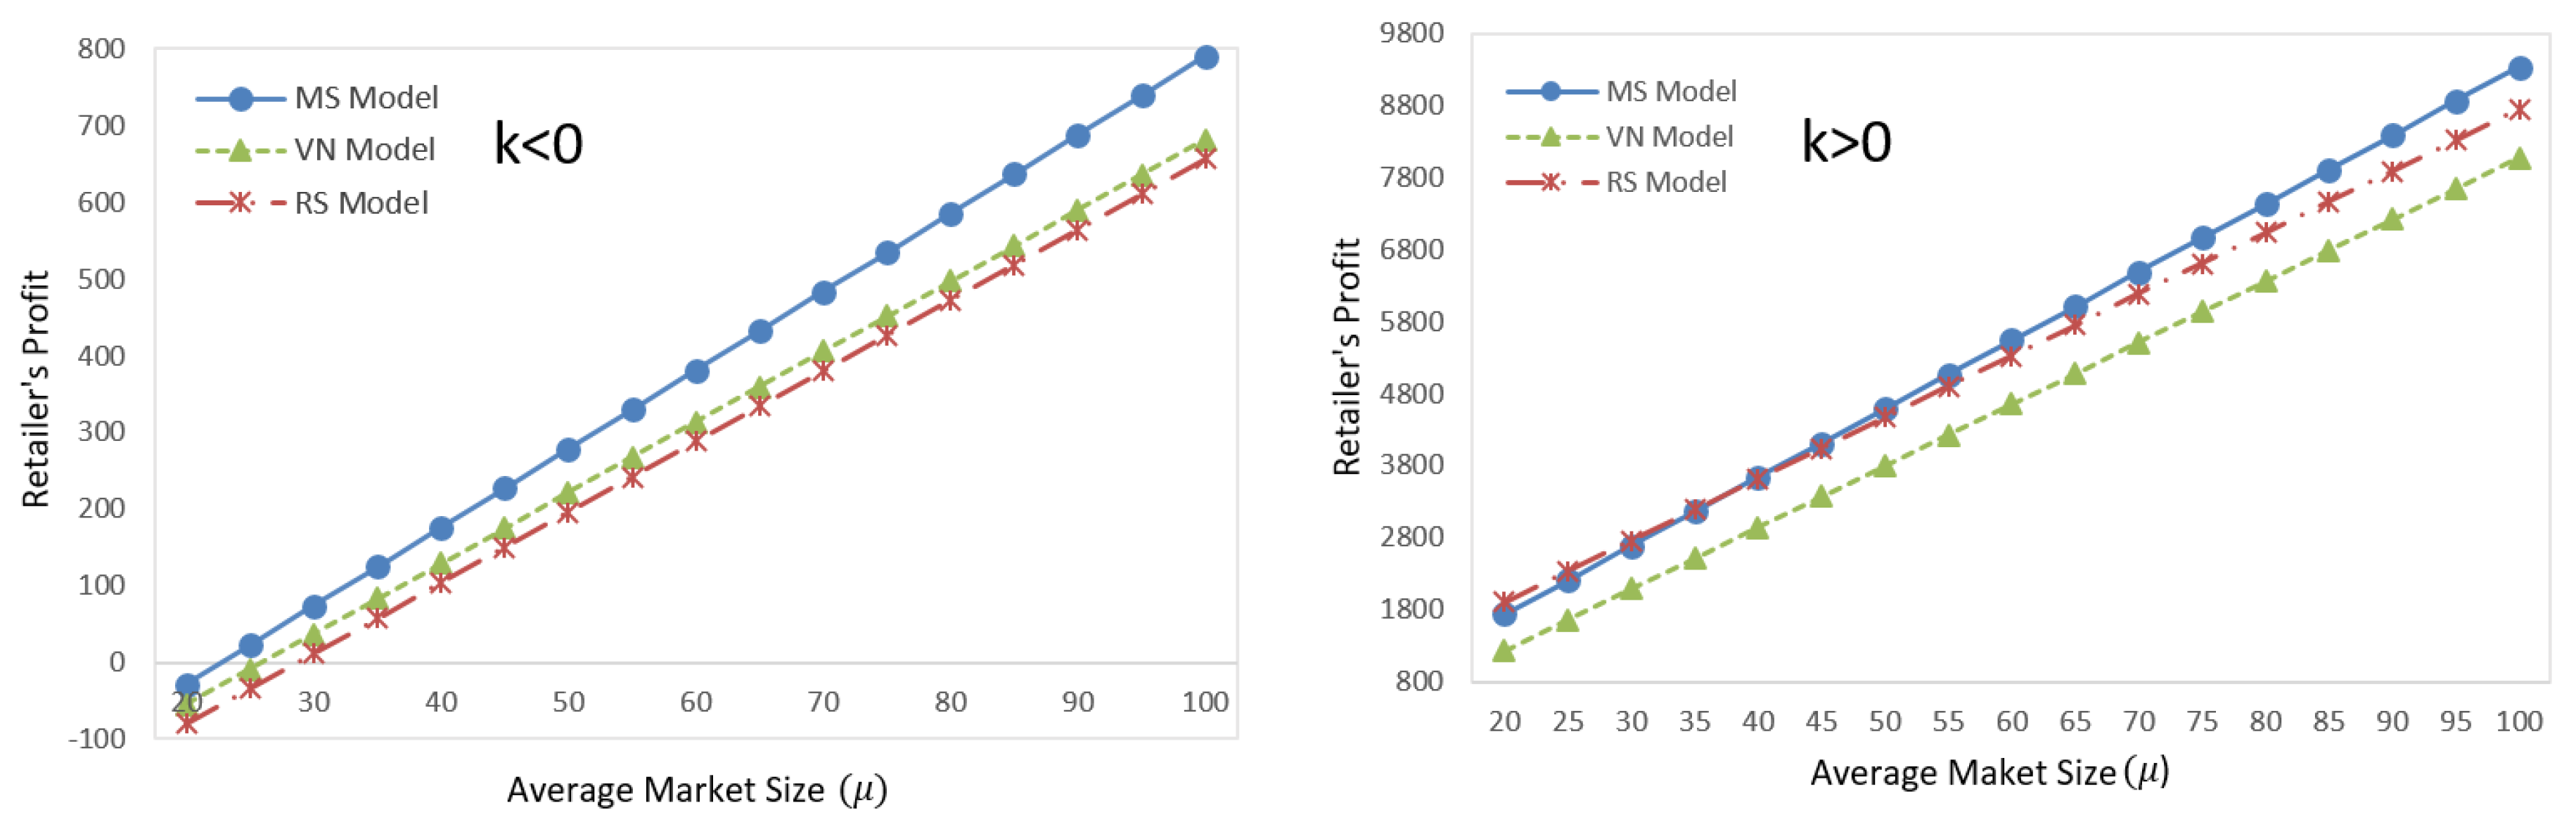
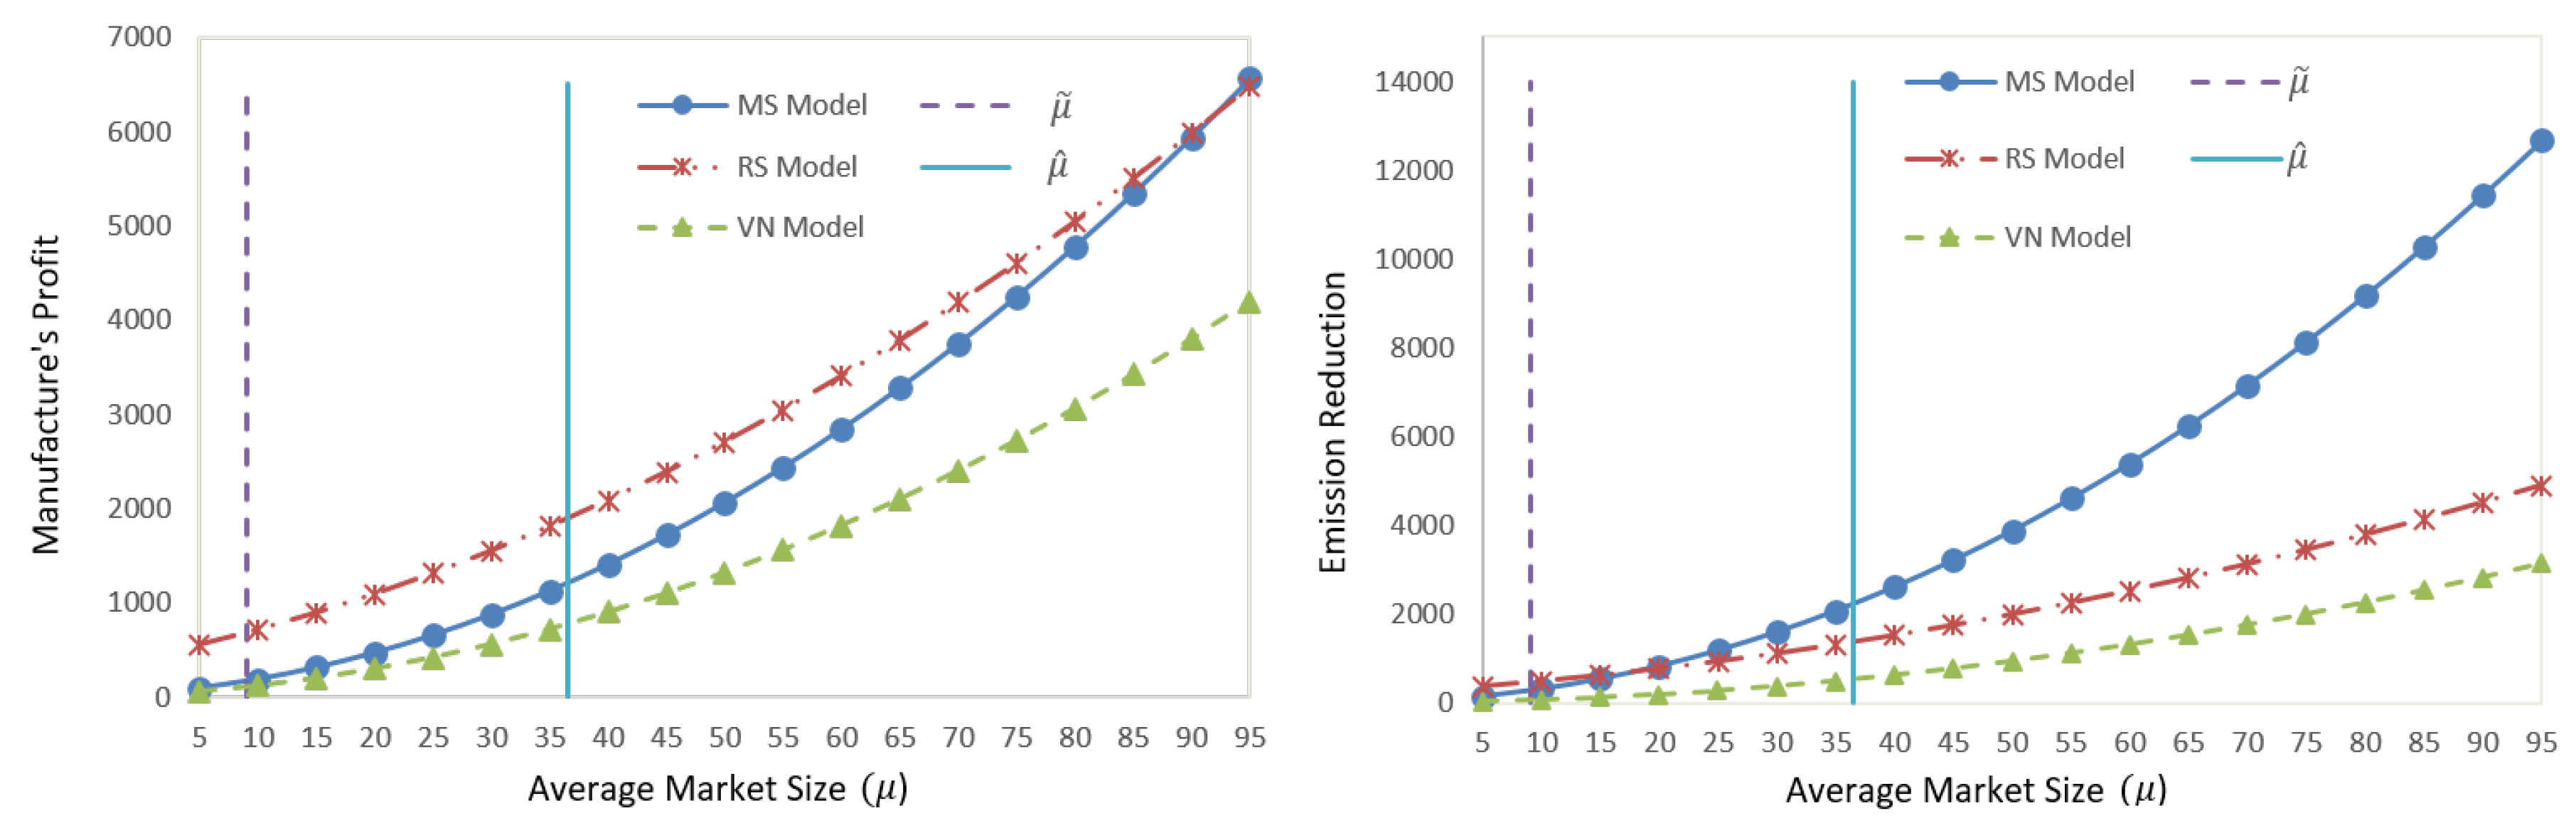
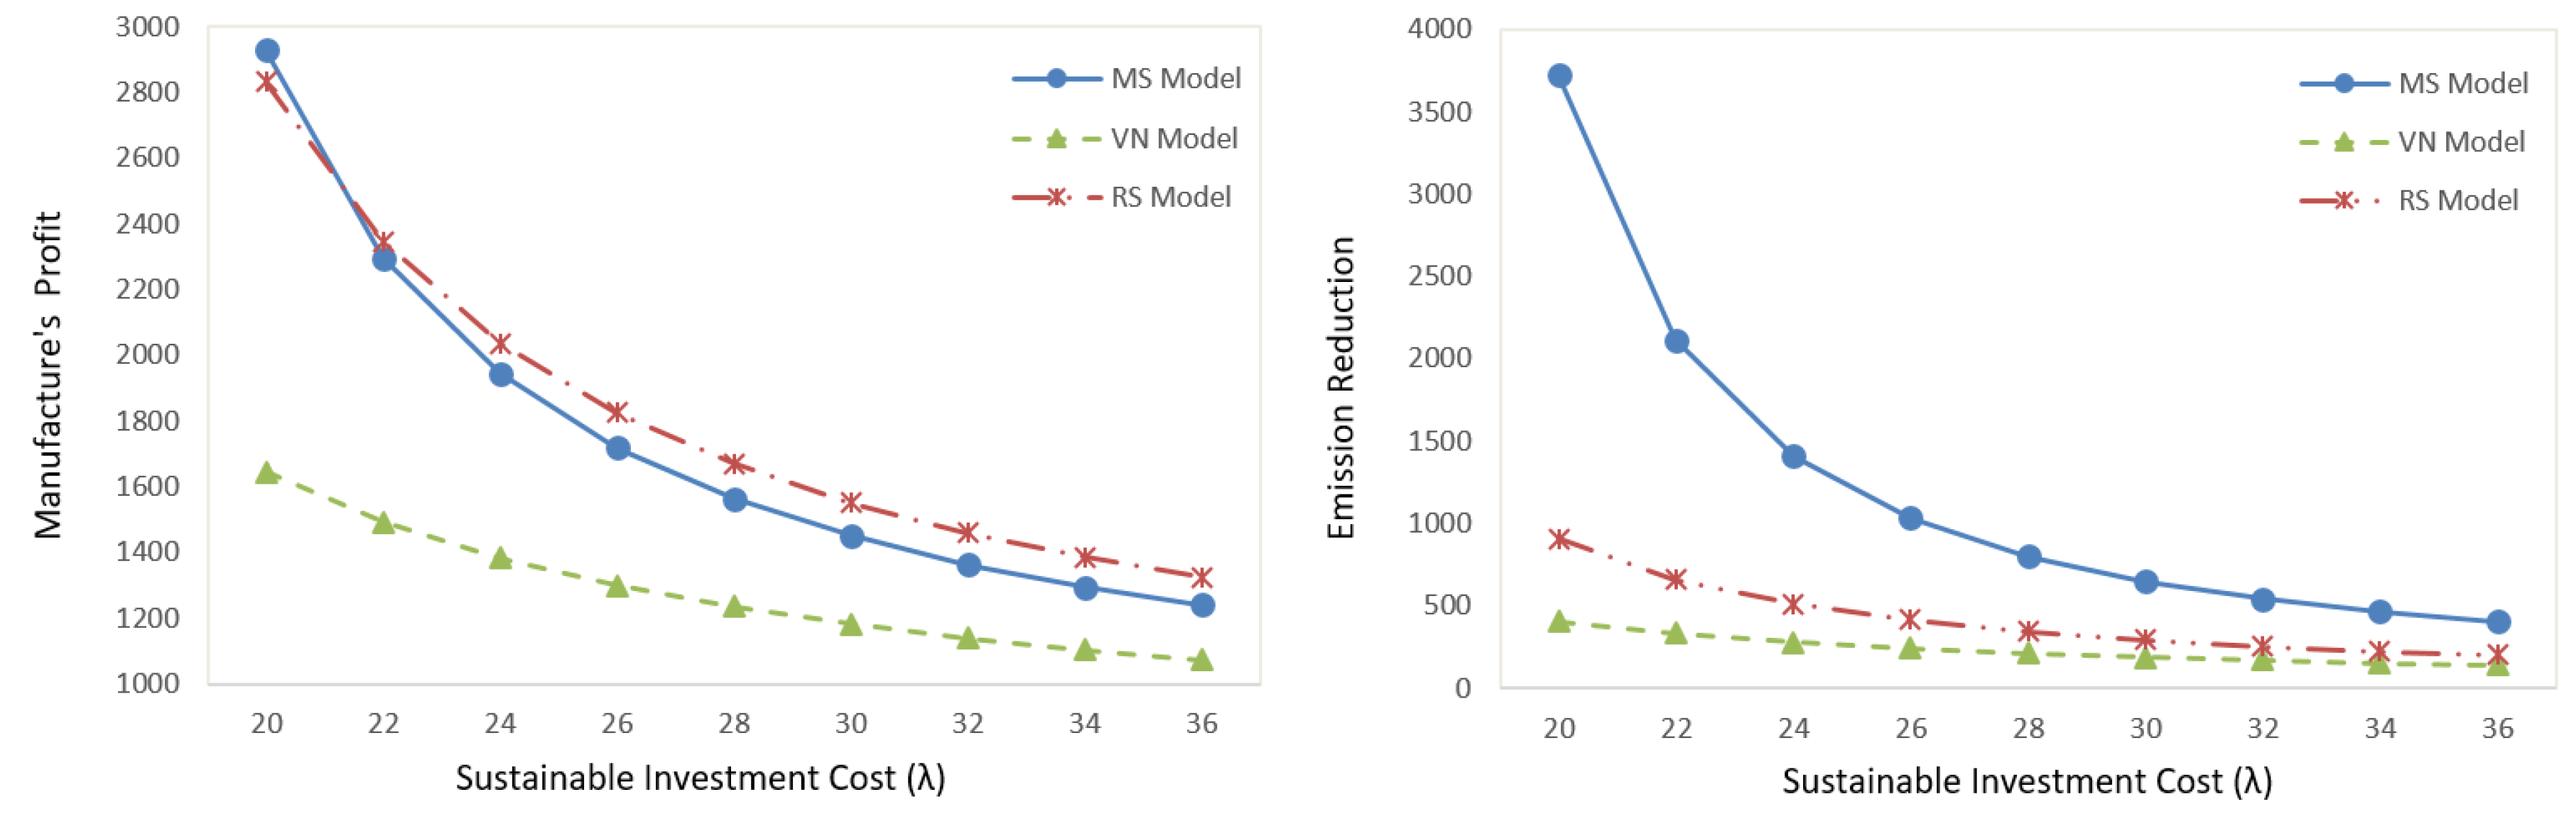
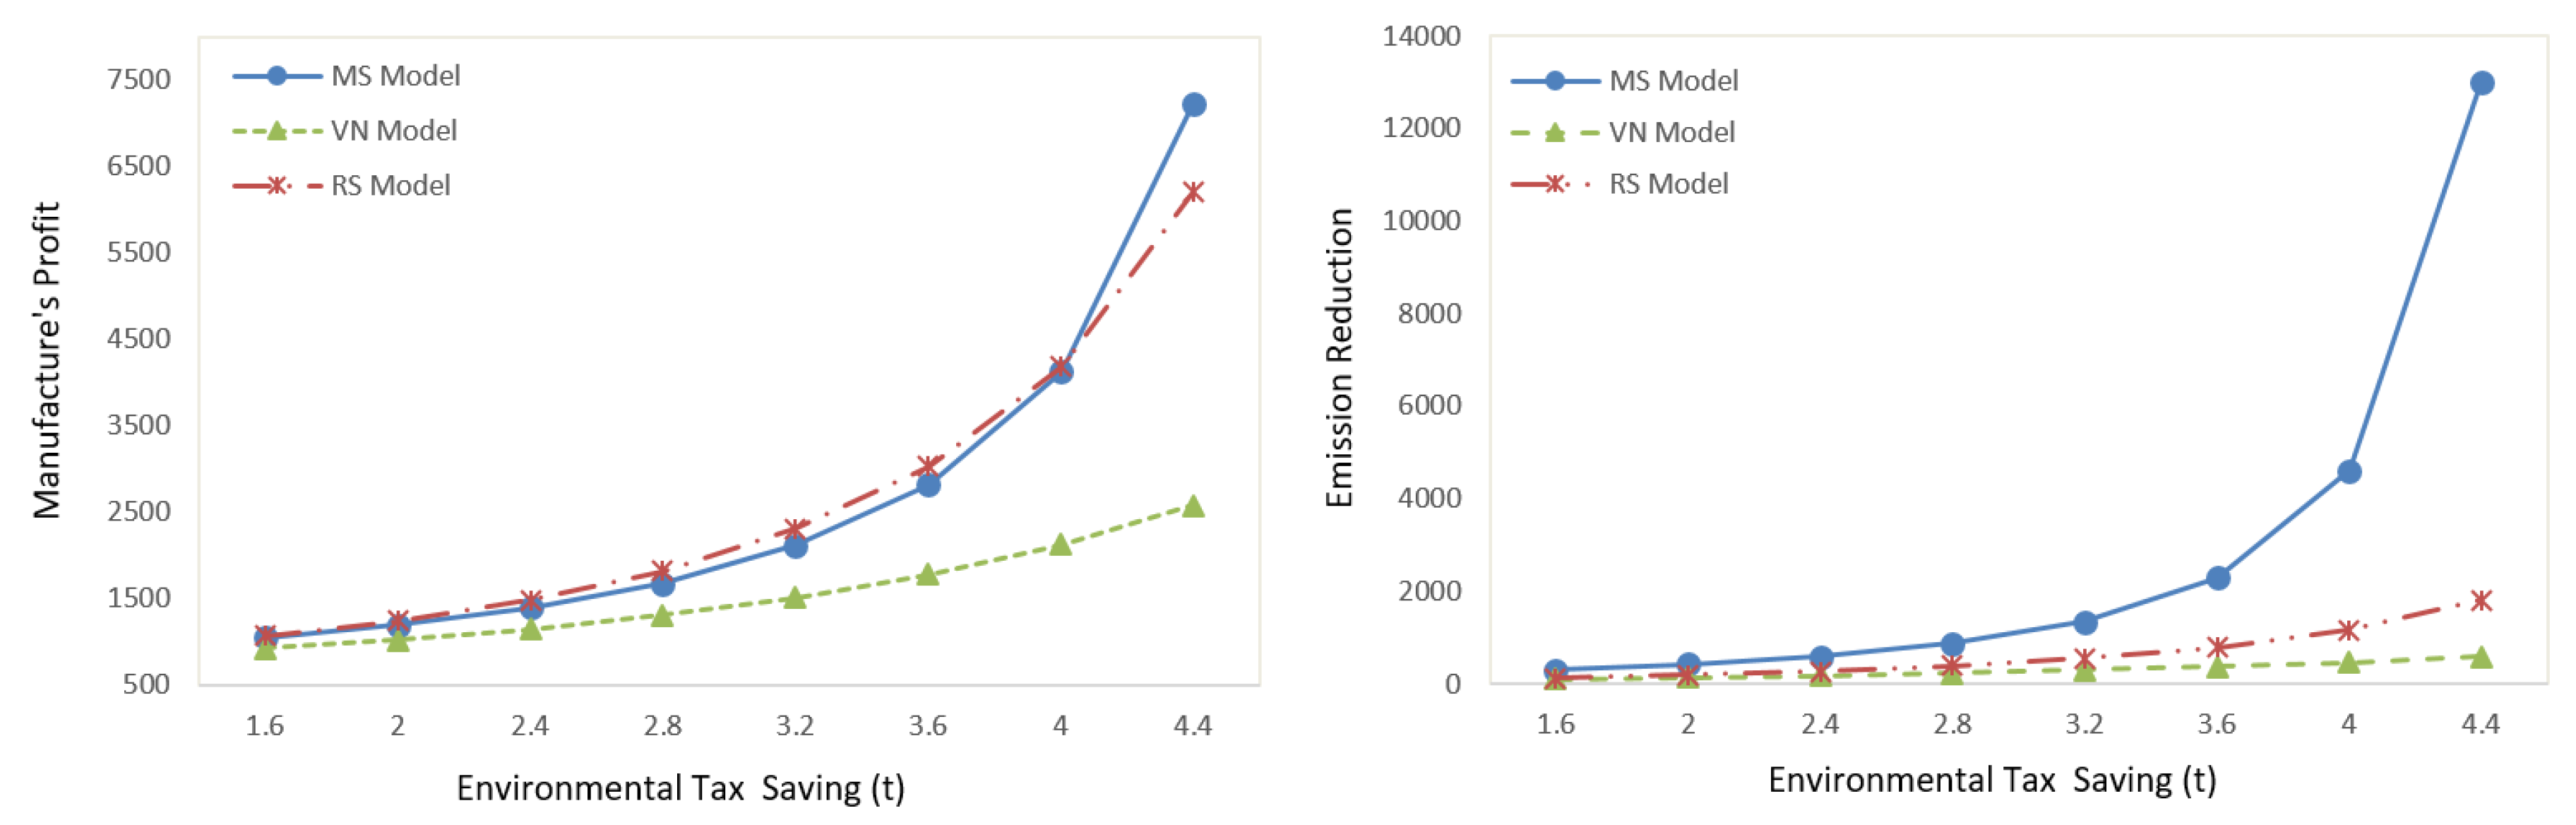
5.2. Numerical Studies

Analytical comparison of the emission reduction and manufacturer’s profits between the two sequential games is unfortunately intractable. To further investigate the manufacturer’s sustainable investment motivation and the performance of emission reduction from the environmental perspective, we compare the manufacturer’s profit and emission reduction in various power structures with numerical studies. Consistent with analytical results, we discuss the impact of average market size on the manufacturer’s profits and total emission reduction. For the values of parameters, we set β = 3 , t = 2.5 , λ = 20 , σ = 20 , p = 12 , w = 7 , v = 3 and c = 5 , and change μ from 5 to 95.
From Figure 2 (left), we observe that there exists a threshold above which it is more profitable for the manufacturer in the MS power structure than in other power structures. In addition, it is larger than the thresholds of sustainable effort (i.e., μ ˜ ) and order quantity (i.e., μ ^ ). Figure 2 (right) shows that the emission reduction is more significant in the MS power structure when the average market size exceeds a threshold. Combining the results in Figure 2 and Propositions 3, 4 and 5, we find that the economic and environmental optimality are simultaneously achieved in the MS (RS) power structure, when the average market size is large (small) enough. It implies that the retailer may utilize her power to make the manufacturer invest more than in other cases and both of them achieve optimality of profits in the RS power structure when the demand is small (i.e., μ 20 ). On the other hand, if the average market size is large (i.e., μ 90 ) enough, the manufacturer is willing to make the most sustainable investment in the MS structure. As a result, both the manufacturer’s and retailer’s profits are the highest in MS structure when the average demand size is large, due to the notable increase of environmental awareness demand.
Next, we set the average market size as μ = 35 . To further present the sensitive analysis, we show how the consumer environmental awareness (i.e., β) affects the manufacturer’s profit and emission reduction. We change β from 0.8 to 4 and present the results in Figure 3.
Consistent with intuition, Figure 3 shows that both the manufacturer’s profit and the emission reduction increase in the degree of consumers’ environmental awareness. When β is small enough (i.e., β < 3.6 ), the manufacturer’s profit is the highest in the RS power structure, while the emission reduction is the most notable in the MS power structure. Interestingly, when the degree of consumers’ environmental awareness exceeds a threshold (i.e., β > 3.6 ), it is possible to achieve the economic and environmental optimality simultaneously in the MS power structure, from the manufacturer’s perspective.
Next, we show the impact of sustainable investment cost (i.e., λ) on the manufacturer’s profit and emission reduction, by changing λ from 20 to 36.
From Figure 4, we can observe that the manufacturer achieves the economic and environmental optimality in the MS power structure when the sustainable investment cost is relatively low. With low sustainable investment cost, the gap of investments between the MS and RS power structures is quite significant, which brings about more tax savings and orders at the same time. However, when the sustainable investment cost is high enough, his profit is highest in the RS power structure, while he makes the most sustainable investment in the MS power structure. The results are quite illuminating for the regulators. In practice, subsidies that will reduce the sustainable investment cost are often offered to firms investing in sustainable efforts. It is suggested that the subsidy is the most efficient in MS structure as it enlarges the emission reduction gap, as shown in Figure 4.
By changing tax credit t from 1.6 to 4.4 , we demonstrate the impacts of the unit environmental tax savings (i.e., t) on the manufacturer’s profit and emission reduction, respectively.
Figure 5 shows that, when the unit environmental tax savings are significantly high, its effect on the emission reduction is extremely notable in the MS power structure. As a result, it brings about the highest profit in the MS power structure, when the tax savings are quite significant. When the tax credit is relatively low, the manufacturer’s profit in the MS power structure is lower than that in the RS power structure, though the emissions reduction is most notable in the MS power structure. From the regulator’s perspective, it is the most efficient to utilize the environmental tax in order to induce the manufacturer’s sustainable investment in the MS power structure.

6. Conclusions

This paper studies a two-echelon sustainable supply chain consisting of a single retailer and a single manufacturer, in three different power structures. Following industrial practice and the literature, the manufacturer has incentives, such as environmental tax reduction and attracting emission sensitive demand, to make sustainable investment. The retailer utilizes her order quantity to affect the manufacturer’s sustainable investment decision. We investigate and compare the optimal decisions and performance from both economic and environmental perspectives in three power structures. The main findings are as follows.
(1) The retailer’s perspective. Both the profit and order quantity of the retailer are the lowest in the VN power structure. There is a threshold of average market size μ ^ ( μ ), under which the retailer’s order quantity (profit) is high in the MS structure. In addition, the retailer’s order quantity and related profit in each case will increase if the manufacturer makes the sustainable investment. Thus, we address the fact that the retailer is able to utilize a higher order quantity to attract the manufacturer’s sustainable investment.
(2) The manufacturer’s perspective. The manufacturer has incentive to make the sustainable investment due to the profit improvement in each structure. Either the profit or sustainable investment of the manufacturer is as a U-shaped function of the manufacturer’s power. The numerical analysis shows that with a relatively small average market size, consumer environmental awareness, high sustainable investment or low tax savings per unit sustainable effort, the manufacturer’s profit is highest when the retailer is the leader of the supply chain.
(3) The environmental perspective. The emission reduction is more notable in sequential games than that in simultaneous games. When the average market size exceeds a certain threshold, the manufacturer’s sustainable investment is the highest in the MS structure. Accordingly, the total emission reduction is the most significant in the MS power structure. On the other hand, a relative small average market size benefits the environment in the RS power structure, by bringing about the highest sustainable investment and the most notable emission reduction.
(4) The consumers’ and regulator’s perspectives. More consumers can be served in sequential games than that in simultaneous games. It is the most efficient for the regulator to utilize subsidy and environmental tax to induce the manufacturer’s sustainable investment in the MS power structure.
This paper is one of the earliest attempts to explore the economic and environmental performance of sustainable investment in three power structures with stochastic demand. In order to obtain the tractable and elegant analytical results, we assume that both the wholesale and retail prices are pre-determined. It may be interesting to set the wholesale price as a decision or to investigate the supply chain coordination with different contracts. In addition, we may consider the multi-retailer setting, and explore how the retail pricing competition and spillover effect influence the sustainable investment and emission reduction. Moreover, we may consider that both supply chain members have an option to make sustainable investment. Eventually, we may extend our model to consider multiple types of sustainable products in a more complex setting with multi-retailers and multi-manufacturers.

Acknowledgments

The authors thank the editors and two anonymous reviewers for their constructive comments. This research was supported in part by the National Science Foundation of China (71501097, 71601187 and 71372008) and the Student Research Training Program of Nanjing University of Science and Technology.

Author Contributions

Xiutian Shi, Xiaoli Zhang, Ciwei Dong and Subin Wen developed the model, conducted the analysis and wrote the paper together.

Conflicts of Interest

The authors declare no conflict of interest.

Appendix A

Proof of Lemma 1.
From Equation (1), given e, we can derive the retailer’s optimal order quantity Q m = μ + k σ + β e by solving the newsvendor problem when D = x + β e , where x is irrelevant to the sustainable level and x N ( μ , σ 2 ) . Substituting Q m = μ + k σ + β e into Equation (2), we get:
Π m m = ( w c + t e ) ( μ + k σ + β e ) λ 2 e 2 .
Because 2 Π m m 2 e = 2 β t λ < 0 , Π m m is concave in e. Then, the optimal sustainable effort can be obtained by solving the first order condition:
Π m m e = ( w c + t e ) β + ( μ + k σ + β e ) t λ e = 0 .
After solving the first order condition, we have e m = ( μ + k σ ) t + β ( w c ) λ 2 β t . Then, substituting e m into Q m , we get Q m = ( λ β t ) ( μ + k σ ) + β 2 ( w c ) λ 2 β t . ☐
Proof of Lemma 2.
From Equation (1), given e, we can derive the optimal order quantity Q n = μ + k σ + β e by solving the newsvendor problem. From Equation (2), we get 2 Π n m 2 e = λ < 0 , which indicates that π m m is concave in e. Hence, the optimal sustainable investment can be obtained by solving the following first order condition:
Π n m e = t Q λ e = 0 .
After solving the above equation, we have e n = t Q λ . Then, substituting e n into Q n , we have Q n = λ ( μ + k σ ) λ β t , e n = ( μ + k σ ) t λ β t . ☐
Proof of Lemma 3.
From Equation (2), we get 2 Π r m 2 e = λ < 0 , so π m m is concave in e. Then, the optimal sustainable effort can be obtained by solving the first order condition:
Π r m e = t Q λ e = 0 .
After solving the above equation, we have e r = t Q λ . Given e r , we get D = x + β t Q λ , where x is irrelevant to the sustainable level. Then, from Equation (1), by solving the newsvendor problem when D = x + β t Q λ , we can derive Q r = λ ( μ + k σ ) λ β t . Substituting Q r into e r , we have e r = ( μ + k σ ) t λ β t . ☐
Proof of Proposition 1.
(1) From ( μ + k σ ) t + β ( w c ) > ( μ + k σ ) t and λ 2 β t < λ β t , we have e m > e n .
(2) From Equations (8) and (12), we have e r e n = t σ ( k k ) λ β t . In addition, k > k , hence, e r > e n .
(3) From Equations (4) and (12), we have e m e r = β t 2 μ + [ ( λ β t ) k ( λ 2 β t ) k ] t σ + ( λ β t ) β ( w c ) ( λ β t ) ( λ 2 β t ) . Note that e m e r increases in μ. Therefore, threshold μ ^ exists and solves e m = e r . If μ μ ˜ , e m e r ; otherwise, e m < e r , where μ ^ = [ k ( λ 2 β t ) k ( λ β t ) ] t σ ( w c ) β ( λ β t ) β t 2 .
Proof of Proposition 2.
(1) From Equations (3) and (7), we have Q m Q n = β 2 t 2 ( μ + k σ ) + ( λ β t ) β 2 ( w c ) ( λ β t ) ( λ 2 β t ) > 0 because of the assumption λ > 2 β t . Then, Q m > Q n . In addition, because λ > β t , we have Q n > Q 0 .
(2) From Equations (8) and (11), we have Q r Q n = λ σ ( k k ) ( λ β t ) > 0 because k > k . Hence, Q r > Q n .
(3) From Equations (3) and (11), we have Q m Q r = β 2 t 2 μ + [ ( λ β t ) 2 k λ ( ( λ 2 β t ) k ) ] σ + ( λ β t ) β 2 ( w c ) ( λ β t ) ( λ 2 β t ) . Note that Q m Q r increases in μ. By letting Q m = Q r , we obtain the threshold μ ^ = [ k λ ( λ 2 β t ) k ( λ β t ) 2 ] σ ( w c ) β 2 ( λ β t ) β 2 t 2 . If μ μ ^ , Q m Q r ; otherwise, Q m < Q r . ☐
Proof of Proposition 3.
(1) We have Q m e m Q n e n = [ β 2 ( w c ) + λ ( μ + k σ ) ] β ( w c ) ( λ β t ) 2 + β t 2 ( λ 2 λ β t β 2 t 2 ) ( μ + k σ ) 2 ( λ β t ) 2 ( λ 2 β t ) 2 > 0 , that is Q m e m > Q n e n .
(2) Because k > k , we have Q r e r Q n e n = λ t [ ( μ + k σ ) 2 ( μ + k σ ) 2 ] ( λ β t ) 2 > 0 . Then, Q r e r > Q n e n . Because e m e r and Q m Q r , when μ > μ ^ . Then, E R m > E R r , if μ > μ ^ . Moreover, e r e m > e n and Q r Q m > Q n , when μ < μ ˜ . Hence, E R m < E R r , if μ < μ ˜ holds. ☐
Proof of Proposition 4.
(1) It is clear that Π r n > Π r 0 because β > 0 .
(2) Because e m > e n , we easily get Π r m Π r n = β ( p w ) ( e m e n ) > 0 , which means Π r m > Π r n .
(3) From Equations (9) and (13), we have Π r r Π r n = ( p w ) ( e r e n ) + ( p s ) ( ϕ ( k ) ϕ ( k ) ) . Based on our assumption, Φ ( k ) > 0.5 and ϕ ( k ) decreases in k. Then, Π r r > Π r n holds because k > k and e r > e n .
(4) From Equations (5) and (13), we have
Π r m Π r r = ( p w ) β { β t 2 μ + [ ( λ β t ) k ( λ 2 β t ) k ] t σ + ( λ β t ) β ( w c ) } ( λ β t ) ( λ 2 β t ) ( p v ) ( ϕ ( k ) ϕ ( k ) ) σ .
Note that Π r m Π r r increases in μ. By letting Π r m = Π r r , we obtain the threshold value μ = ( p v ) ( λ 2 β t ) ( λ β t ) [ ϕ ( k ) ϕ ( k ) ] σ + ( p w ) β { [ k ( λ 2 β t ) k ( λ β t ) ] σ ( w c ) β ( λ β t ) } ( p w ) β 2 t 2 . If μ μ , Π r m Π r r ; otherwise, Π r m < Π r r . ☐
Proof of Proposition 5.
(1) Compare Π m m and Π m n , we have:
Π m m Π m n = ( w c ) ( Q m Q n ) + t ( e m Q m e n Q n ) λ 2 ( e m + e n ) ( e m e n ) = ( w c ) 2 β 2 2 ( λ 2 β t ) + β 2 t 2 ( μ + k σ ) ( w c ) ( λ 2 β t ) ( λ β t ) + β t 3 ( λ β t β 2 t 2 ) ( μ + k σ ) 2 2 ( λ β t ) 2 ( λ 2 β t ) > 0 .
The above inequality holds due to the assumption that λ > 2 β t .
(2) Compare Π m r and Π m n , we have:
Π m r Π m n = ( w c ) ( Q r Q n ) + t ( e r Q r e n Q n ) λ 2 ( e r + e n ) ( e r e n ) = λ t 2 2 ( λ β t ) 2 [ ( 2 μ + k σ + k σ ) ( k k ) ] σ + ( w c ) λ σ ( k k ) λ β t > 0 .
The above inequality holds due to the assumption that λ > β t and k k .
(3) Compare Π m n and Π m 0 , we have:
Π m n Π m 0 = ( w c ) ( Q n Q 0 ) + e n ( t Q n λ 2 e n ) = ( w c ) ( μ + k σ ) [ λ λ β t 1 ] + e n λ t ( μ + k σ ) 2 ( λ β t ) > 0 .
The above inequality holds because λ > β t . ☐

References

  1. Krass, D.; Nedorezov, T.; Ovchinnikov, A. Environmental taxes and the choice of green technology. Prod. Oper. Manag. 2013, 22, 1035–1055. [Google Scholar] [CrossRef]
  2. Atasu, A.; Özdemir, Ö.; Van Wassenhove, L.N. Stakeholder perspectives under EWaste Take-Back legislation. Prod. Oper. Manag. 2013, 22, 382–396. [Google Scholar] [CrossRef]
  3. Drake, D.F.; Kleindorfer, P.R.; Van Wassenhove, L.N. Technology choice and capacity portfolios under emissions regulation. Prod. Oper. Manag. 2015, 25, 1006–1025. [Google Scholar] [CrossRef]
  4. Shi, X.; Qian, Y.; Dong, C. Economic and environmental performance of fashion supply chain: The Joint effect of power structure and sustainable investment. Sustainability 2017, 9, 961. [Google Scholar] [CrossRef]
  5. Shen, B. Sustainable fashion supply chain: Lessons from H&M. Sustainability 2014, 6, 6236–6249. [Google Scholar] [CrossRef]
  6. Dong, C.; Shen, B.; Chow, P.S.; Yang, L.; Ng, C.T. Sustainability investment under cap-and-trade regulation. Ann. Oper. Res. 2016, 240, 509–531. [Google Scholar] [CrossRef]
  7. Apple Environmental Responsibility Report 2017. Available online: https://images.apple.com/environment/pdf/Apple_Environmental_Responsibility_Report_2017.pdf (accessed on 20 April 2017).
  8. Marks&Spencer Plan A Report 2016. Available online: http://planareport.marksandspencer.com/M&S_PlanA_Report_2016.pdf (accessed on 15 June 2016).
  9. Chen, X.; Wang, X.; Chan, H. Manufacturer and retailer coordination for environmental and economic competitiveness: A power perspective. Transp. Res. Part E Logist. Transp. Rev. 2017, 97, 268–281. [Google Scholar] [CrossRef]
  10. Cheng, Y.; Kuang, Y.; Shi, X.; Dong, C. Sustainable investment in a supply chain in the big data era: An information updating approach. Sustainability 2018, 10, 403. [Google Scholar] [CrossRef]
  11. Choi, T.M. Local sourcing and fashion quick response system: The impacts of carbon footprint tax. Transp. Res. Part E Logist. Transp. Rev. 2013, 55, 43–54. [Google Scholar] [CrossRef]
  12. Rosič, H.; Jammernegg, W. The economic and environmental performance of dual sourcing: A newsvendor approach. Int. J. Prod. Econ. 2013, 143, 109–119. [Google Scholar] [Green Version]
  13. Niu, B.; Chen, L.; Zhang, J. Punishing or subsidizing? Regulation analysis of sustainable fashion procurement strategies. Transp. Res. Part E Logist. Transp. Rev. 2017, 107, 81–96. [Google Scholar] [CrossRef]
  14. Shen, B.; Li, Q. Impacts of returning unsold products in retail outsourcing fashion supply chain: A sustainability analysis. Sustainability 2015, 7, 1172–1185. [Google Scholar] [CrossRef]
  15. Guo, Z.; Liu, H.; Zhang, D.; Yang, J. Green supplier evaluation and selection in apparel manufacturing using a fuzzy multi-criteria decision-making approach. Sustainability 2017, 9, 650. [Google Scholar] [CrossRef]
  16. He, Z.; Chen, P.; Liu, H.; Guo, Z. Performance measurement system and strategies for developing low-carbon logistics: A case study in China. J. Clean. Prod. 2017, 156, 395–405. [Google Scholar] [CrossRef]
  17. Benjaafar, S.; Li, Y.; Daskin, M. Carbon footprint and the management of supply chains: Insights from simple models. IEEE Trans. Autom. Sci. Eng. 2013, 10, 99–116. [Google Scholar] [CrossRef]
  18. Toptal, A.; Özlü, H.; Konur, D. Joint decisions on inventory replenishment and emission reduction investment under different emission regulations. Int. J. Prod. Res. 2014, 52, 243–269. [Google Scholar] [CrossRef] [Green Version]
  19. Yalabik, B.; Fairchild, R.J. Customer, regulatory, and competitive pressure as drivers of environmental innovation. Int. J. Prod. Econ. 2011, 131, 519–527. [Google Scholar] [CrossRef]
  20. Liu, Z.L.; Anderson, T.D.; Cruz, J.M. Consumer environmental awareness and competition in two-stage supply chains. Eur. J. Oper. Res. 2012, 218, 602–613. [Google Scholar] [CrossRef]
  21. Jaber, M.Y.; Glock, C.H.; El Saadany, A.M. Supply chain coordination with emissions reduction incentives. Int. J. Prod. Res. 2013, 51, 69–82. [Google Scholar] [CrossRef]
  22. Zhang, L.; Wang, J.; You, J. Consumer environmental awareness and channel coordination with two substitutable products. Eur. J. Oper. Res. 2015, 241, 63–73. [Google Scholar] [CrossRef]
  23. Du, S.; Zhu, J.; Jiao, H.; Ye, W. Game-theoretical analysis for supply chain with consumer preference to low carbon. Int. J. Prod. Res. 2015, 53, 3753–3768. [Google Scholar] [CrossRef]
  24. Li, Q.; Shen, B. Sustainable design operations in the supply chain: Non-profit manufacturer vs. for-profit manufacturer. Sustainability 2016, 8, 639. [Google Scholar] [CrossRef]
  25. Anupindi, R.; Bassok, Y. Centralization of stocks: Retailers vs. manufacturer. Manag. Sci. 1999, 45, 178–191. [Google Scholar] [CrossRef]
  26. Iyer, G.; Villas-Boas, J.M. A bargaining theory of distribution channels. J. Mark. Res. 2003, 40, 80–100. [Google Scholar] [CrossRef]
  27. Dukes, A.J.; Geylani, T.; Srinivasan, K. Strategic assortment reduction by a dominant retailer. Mark. Sci. 2009, 28, 309–319. [Google Scholar] [CrossRef]
  28. Choi, S.C. Price competition in a channel structure with a common retailer. Mark. Sci. 1991, 10, 271–296. [Google Scholar] [CrossRef]
  29. Ertek, G.; Griffin, P.M. Supplier-and buyer-driven channels in a two-stage supply chain. IIE Trans. 2002, 34, 691–700. [Google Scholar] [CrossRef]
  30. Chen, X.; Wang, X. Free or bundled: Channel selection decisions under different power structures. Omega 2015, 53, 11–20. [Google Scholar] [CrossRef]
  31. Luo, Z.; Chen, X.; Chen, J.; Wang, X. Optimal pricing policies for differentiated brands under different supply chain power structures. Eur. J. Oper. Res. 2017, 259, 437–451. [Google Scholar] [CrossRef]
  32. Shi, R.; Zhang, J.; Ru, J. Impacts of power structure on supply chains with uncertain demand. Prod. Oper. Manag. 2013, 22, 1232–1249. [Google Scholar] [CrossRef]
  33. Shen, B.; Choi, T.M.; Chan, H.L. Selling green first or not? A Bayesian analysis with service levels and environmental impact considerations in the Big Data Era. Technol. Forecast. Soc. Chang. 2017. [Google Scholar] [CrossRef]
  34. Chan, H.L.; Shen, B.; Cai, Y. Quick response strategy with cleaner technology in a supply chain: Coordination and win-win situation analysis. Int. J. Prod. Res. 2017, 1–12. [Google Scholar] [CrossRef]
  35. Iyer, A.V.; Bergen, M.E. Quick response in manufacturer-retailer channels. Manag. Sci. 1997, 43, 559–570. [Google Scholar] [CrossRef]
Figure 1. Retailer’s profit when the service level is (left) low and (right) high.
Energies 11 00983 g001
Figure 2. Impact of the average market size on the (left) manufacturer’s profits and (right) emission reduction in different power structures.
Energies 11 00983 g002
Figure 3. Impact of the consumer environmental awareness on the (left) manufacturer’s profits and (right) emission reduction in different power structures.
Energies 11 00983 g003
Figure 4. Impact of the sustainable investment cost on the (left) manufacturer’s profits and (right) emission reduction in different power structures.
Energies 11 00983 g004
Figure 5. Impact of the environmental tax savings on the (left) manufacturer’s profits and (right) emission reduction in different power structures.
Energies 11 00983 g005
Table 1. Positioning of this paper in the literature.
PapersCarbon EmissionSustainable Investment DecisionConsumer Environmental AwarenessPower StructureStochastic Demand
Choi [11], Shen and Li [14], Shen et al. [33]
Chan et al. [34]
Li and Shen [24], Du et al. [23]
Zhang et al. [22]
Cheng et al. [10], Dong et al. [6]
Choi [28], Ertek and Griffin [29], Chen and Wang [30]
Shi et al. [32]
Chen et al. [9], Shi et al. [4]
This paper

