1. Introduction
Synchronous machines are a common machine type with numerous industrial applications, especially in power generation. It is still considered the universal machine for electric power generation including diesel/gas/steam turbines in heat power plants [
1], large hydro-machines in hydro plants [
2], and wind turbines in wind farms [
3]. The wind turbine is typically assisted by gearboxes or power converters to operate in a variable-speed mode in contrast to its normal constant-speed operation.
Even though permanent magnet synchronous machines are becoming popular in recent decades due to their high-power density, wound rotor synchronous machines are still irreplaceable due to their high reliability in harsh operational environments. One major issue with the manufacture of wound rotor synchronous machines is their rotor winding process, which is considered to be quite laborious as the windings are not pre-designed and need to be wrapped around the rotor pole.
Two alternative methods have been proposed in industrial fields to simplify the manufacturing process, however, they both have their drawbacks. A pre-manufactured rotor winding that is installed directly on the rotor tips separating it from the rotor pole. However, this would definitely affect the subsequent integration of the rotor. On the other hand, the introduction of extra winding machines can simplify the winding process. The rotor will be placed on a winding machine and automatically wound with the rotation of the winding machine, but the economic cost of the winding machine would increase with the size of the rotor.
A new winding method is helpful not only for the new machines but also for rewound machines. When synchronous machines fail in the field and a rewinding is generally required [
4], broken windings should be uninstalled in a way that is opposite to the installation [
5]. A new rotor structure is proposed in a previous article [
6], which modifies the geometry shape of the rotor to accommodate the excitation windings. The result shows that an asymmetrical rotor design suffers from a distributed waveform and low efficiency. Therefore, the optimization plan of the rotor is carried out to offset the possible reduction in magnetic flux.
2. Original Design Analysis
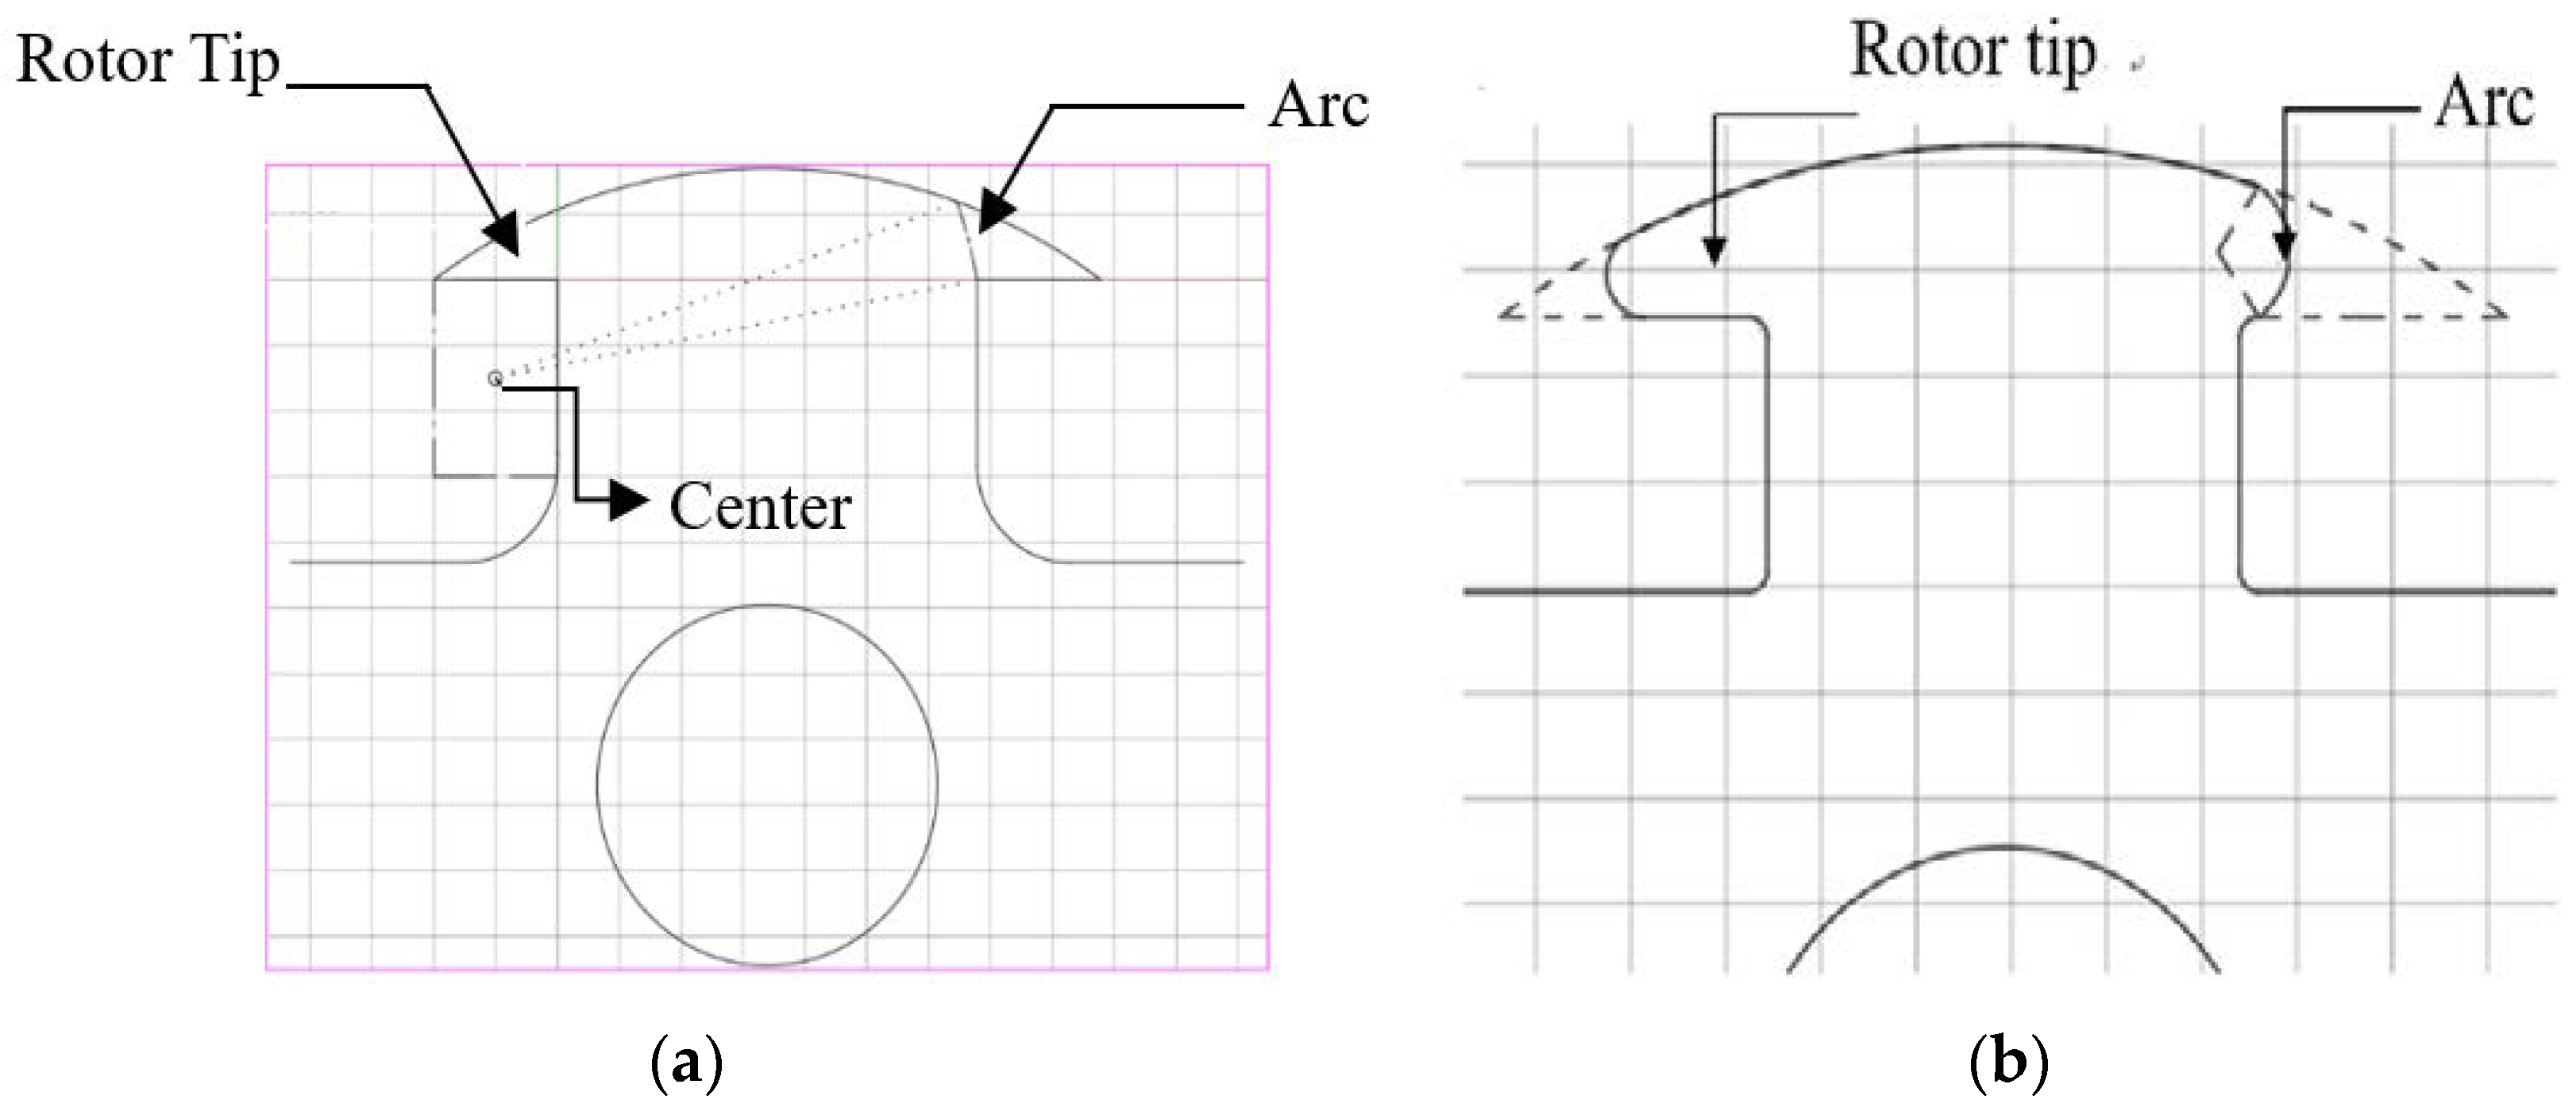
The aim of this design is to change the shape of the rotor in a manner which allows the excitation coils to be easily installed directly onto the rotor pole. Therefore, part of the rotor tip is cut so that the excitation coil can be wound separately and slid through the tip of the rotor onto the rotor pole, which is then fixed in position by a non-magnetic shield to offset the centrifugal force.
Two four-pole machine numerical models are built in Magnet. The stator of both models come from a standard 27.5 kVA alternator from the previous work [
6]. The new rotor is used as an alternative to compare with the traditional design. As discussed in the previous work [
6], the machine operation is similar to that of a traditional synchronous machine, as well as its induced electromagnetic motive force (EMF) and flux linkage. One unique feature of this machine is the unbalance flux distribution caused by the asymmetrical pole shape. Due to the absence of the rotor tip, the flux path of the machine will be shifted away from the geometrical center. This feature is further examined as an increase of the high order harmonics. Also, due to the flux shift, the flux tends to concentrate on the salient side of the rotor. Thus, an asymmetrical machine reaches saturation earlier than the symmetrical machine as the excitation magnetic motive force (MMF) increase.
3. Rotor Optimization
According to the fast Fourier transformation (FFT) results of the initial asymmetrical rotor, there exists a distributed wave which needs to be corrected. Therefore, the influence of both the stator and the rotor are examined in detail.
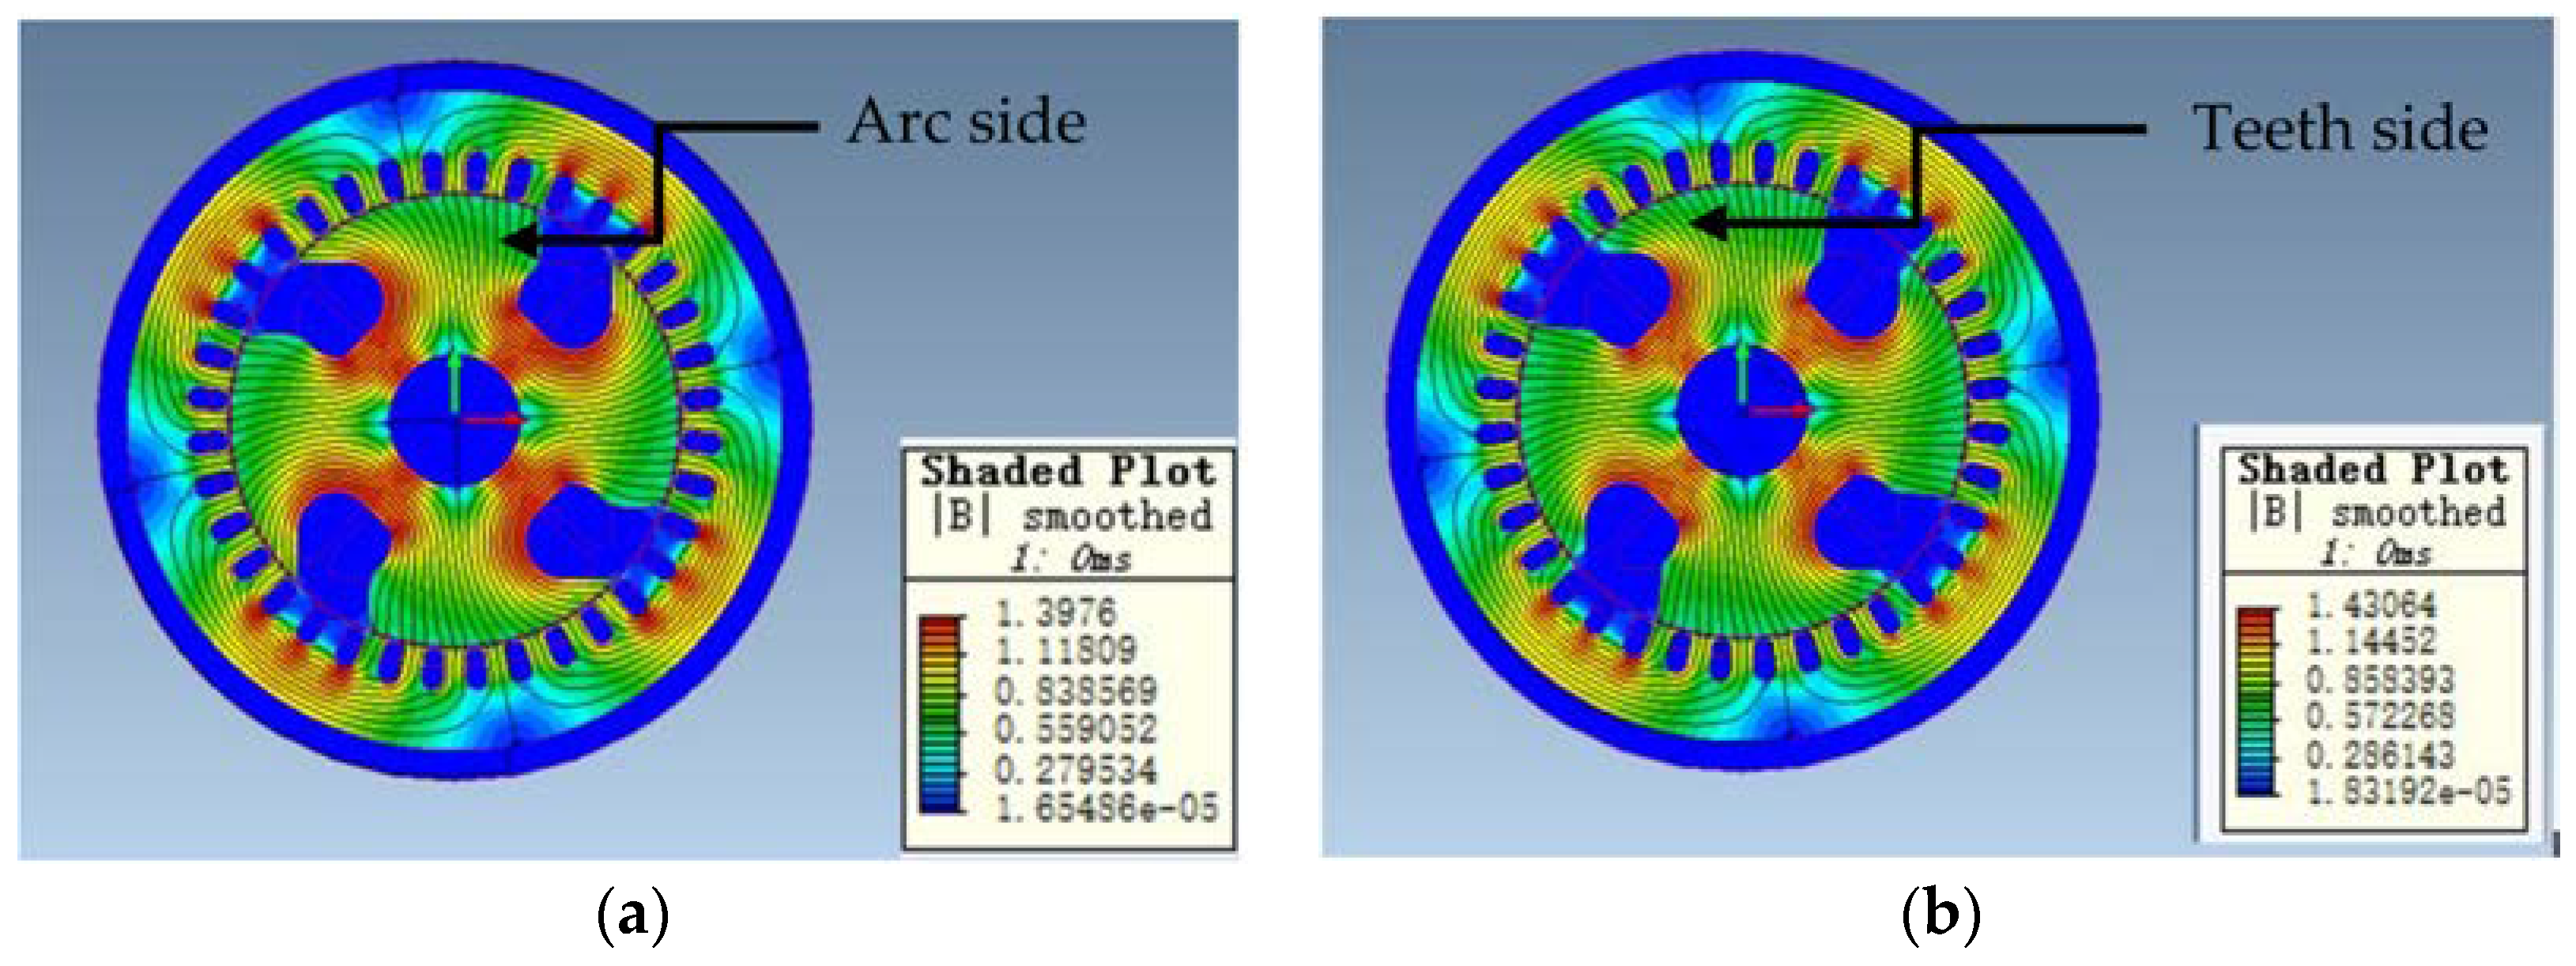
3.1. Research on Rotor Shape
The asymmetrical rotor can be divided into two sides: the one with teeth (teeth side) and the one without teeth (arc side). Adjustment on the teeth side will change the flow of the flux, shifting the flux away from the center. On the other hand, changing the arc side would guide the flux back to the center. However, it will also weaken the air-gap flux density. These changes both have an influence on the harmonics, as well as efficiency. Therefore, the shape of the rotor is a relative complex multi-input multi-output (MIMO) optimization problem. Flux distributions of both changes are shown in
Figure 1.
3.2. Optimization Plans
The rotor shape of the original design is for easy insertion of the excitation coil. However, as shown in the finite element analysis (FEA), as well as the experiment test, the majority of the flux in the original rotor has been concentrated on the tips of the rotor due to the edge effect wherein the magnetic flux is directed to follow the path of the least magnetic reluctance.
In this case, the tips of the rotor should be reshaped, avoiding the rectangular edge (i.e., creating an even flux path) whilst creating an even air-gap distance around the edge of the rotor. Two design plans have been proposed and simulated as shown in
Figure 2.
Since the aim of this project is to develop a rotor structure for easy installation of the excitation winding, one side of the rotor tip has to be removed in order to slide the excitation windings onto the rotor pole. New rotors are optimized based on the rotor of one commercial synchronous machine.
4. Surrogate Optimization Method
Traditional rotor design includes both analytical and empirical methods. However, in this optimization, the complexity of the rotor geometry makes it very difficult to be deduced analytically. On the other hand, typical empirical solutions are overly simplified and often neglect nonlinearity in the rotor electromagnetics.
Numerical methods, such as the finite element method (FEM), account for the complex topology of the electrical machine, as well as its multi-physical characteristics [
7]. It has proven to be able to predict the machine performance very accurately. However, it is also considered to be time-consuming and computationally expensive, due to the objective function needing to be evaluated for each set of structural parameters. Overall, a new optimization solution is required in this process.
The surrogate modelling technique is an effective tool for the analysis and optimization of computationally expensive models [
8,
9,
10]. It provides a compromise between the high-fidelity low-speed calculations and high-speed low-accuracy simplified analytical methods.
A surrogate model is constructed by using the data obtained from high-fidelity models (in this design, FEM models), and it provides rapid approximations of objectives and constraints at new design points so that optimization studies are feasible [
11].
The accuracy of surrogate models is evaluated by an error analysis. Once the surrogate model is proved to be accurate in predicting the output, a search algorithm could be applied to the surrogate model.
Design 1 attempts to cut the right side of the rotor tip with an arc. The arc directly connects the rotor pole with the outside arc, which allows a smooth path for the flux. The rotor is assessed based on two aspects: that with the rotor tip (referred to as the tip side) and that without the rotor tip (referred to as the arc side). The flux of the rotor can be modified by changing the direction of the arc. Therefore, the edge effect can be reduced.
4.1. Problem Definition
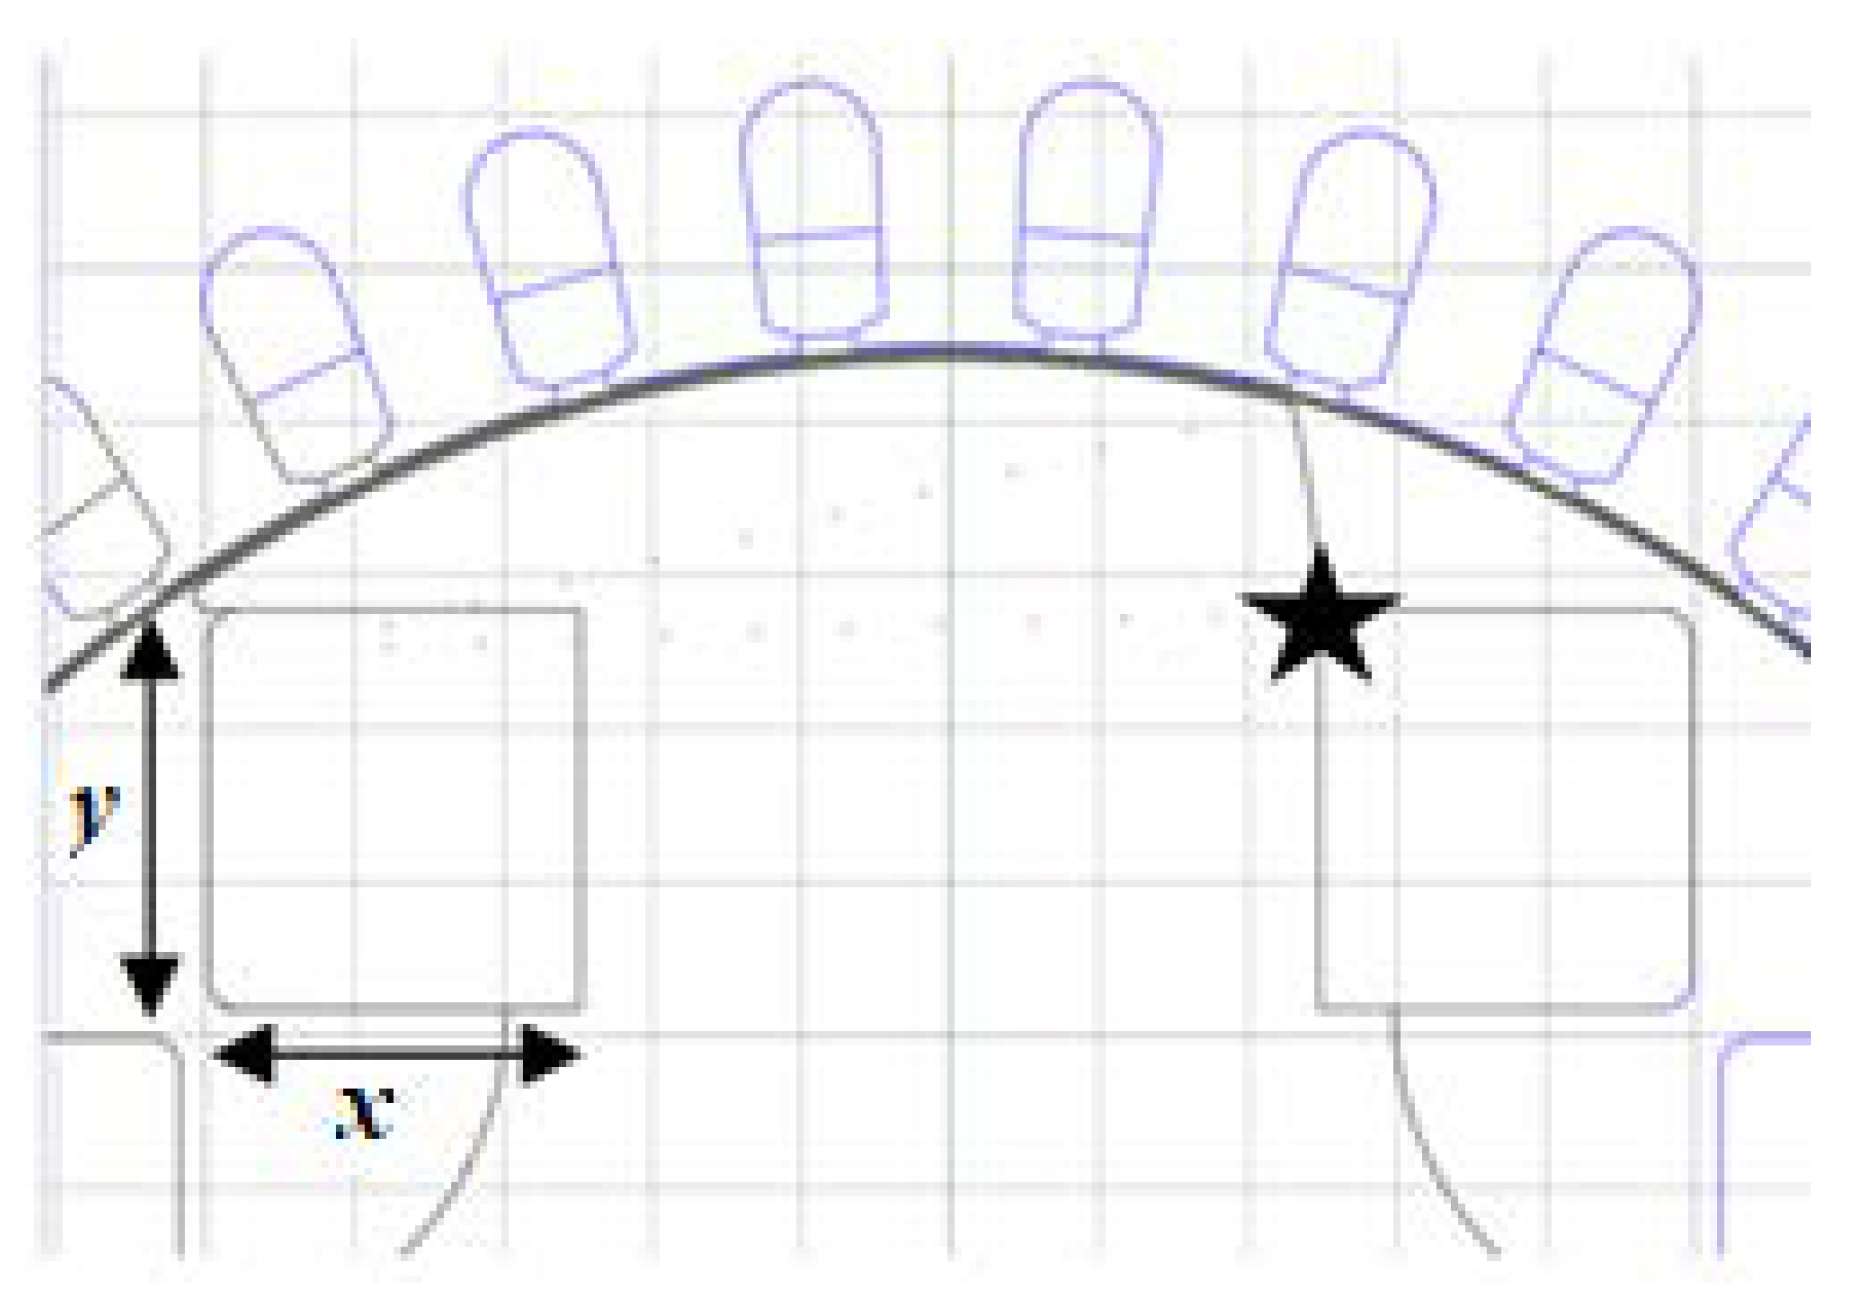
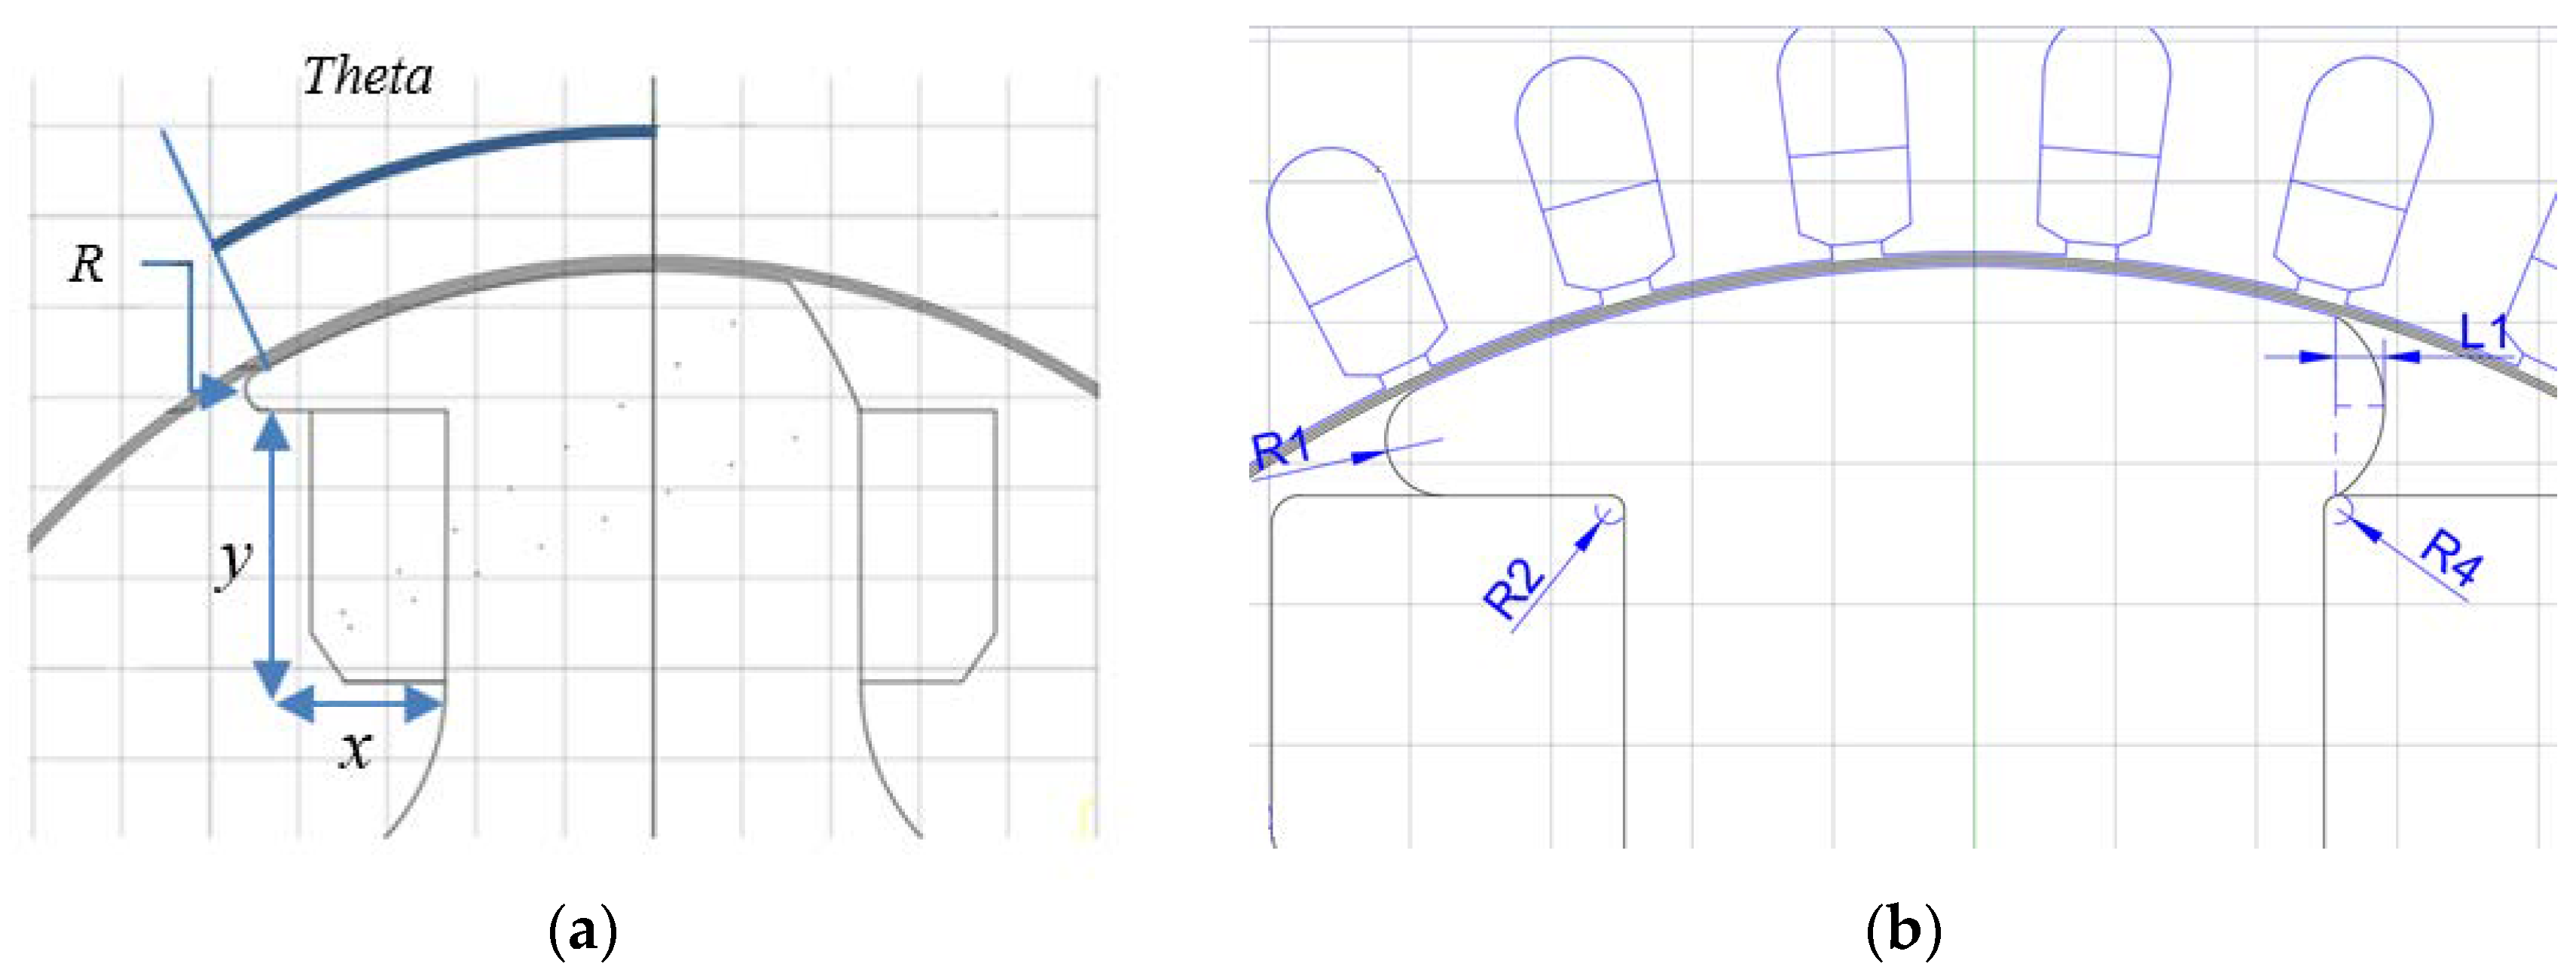
The first step of this optimization is to determine the shape with variables. Problem definition A of Design 1 is shown in
Figure 3. The principle of the design is simple since the joint point between the rotor pole and rotor body (star marker in
Figure 3) is fixed. An arc can be easily defined by its arc center (
x,
y) which connects the point with a star mark to the outside arc. In this case, the optimization is clearly a two-variable optimization (
x and
y). The optimization plan is defined as
Maximize: Power output
Minimize: Power Loss
This optimization is defined to locate the best performance of the machine, which means maximum torque should be achieved with minimum loss.
4.2. Simplified Analytical Method
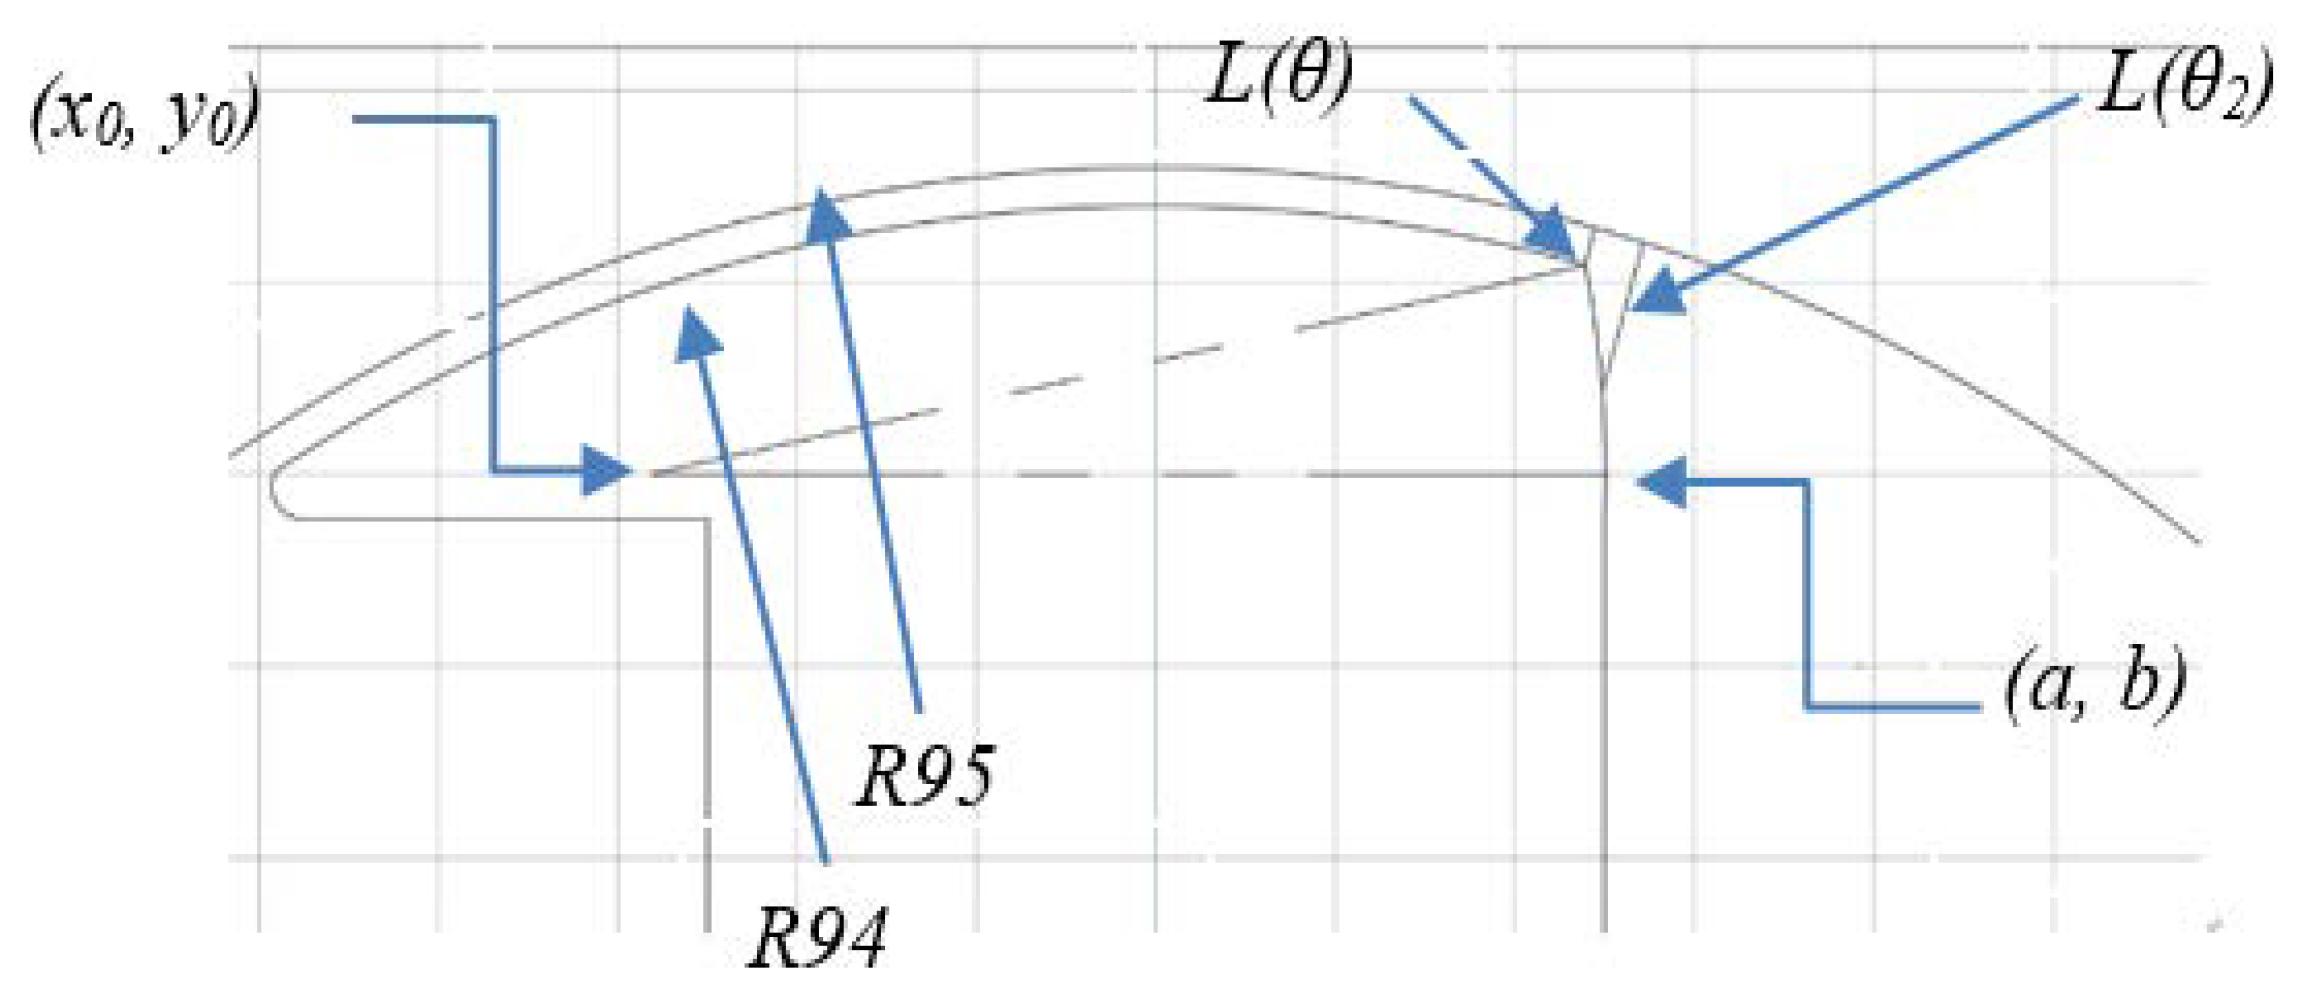
Based on the problem definition, the air-gap flux density of this rotor is obviously altered due to the variation of the air-gap length. Therefore, the effect of this rotor shape is analytically computed in this section.
In order to estimate the average air-gap length, the main geometry should be converted into a polar form, as shown in
Figure 4.
The air-gap length could be calculated using
where
θrs is the start angle of the rotor teeth,
θ1 is the angle of the connection point between the outer rotor radius and the additional arc, and
θ2 is the angle of the connection point between the additional arc and the pole arm.
The average air-gap distance over one rotor pole pitch (out of four in a four-pole rotor) is calculated as
If the saturation and flux leakage are neglected, the average flux density could be calculated using
The peak-to-peak open-circuit flux linkage is given by
The back EMF can be expressed as
The torque is given by
where
a,
b,
x0, and
y0 are the coordinates of the points shown in
Figure 4.
According to the calculations, the average torque depends on the average air-gap flux density, which is influenced by the corresponding constants. Since the coordinates a and b are fixed based on the prototype, the two variables influencing the torque performance are x0 and y0, i.e., the coordinates of the center.
However, this calculation is relatively low-accurate due to the high-level of saturation on the rotor iron and the irregular flux path in this design. Therefore, the surrogate method is applied in this design.
4.3 Design of Experiments
The design of the experiment is aimed to collect the maximum amount of information using the minimum number of sampling points in the design spaces [
12,
13,
14]. It is designed to reduce the random error and bias error in the sampling process and to make the surrogate model more accurate.
Latin hypercube sampling (LHS) [
15] is a typical type of modern Design of Experiment (DoE) technology widely used in computations. Two characteristics of LHS show its advantage over the other methods. Firstly, LHS can provide a more accurate estimation of the mean value. Secondly, it is not restricted by the size of the sampling points. Therefore, it would allow the user to control the complexity and computation cost of the sampling.
The design spaces of LHS are divided into several sections with the same probabilities. The generation of sampling points is based on two principles. (1) The generation of each sampling points is independent and randomly selected. (2) Only one point is allowed in each section.
A simple mathematical equation for generating LHS sampling points is
for 1 ≤
j ≤
n and 1 ≤
i ≤
k, where
k is the number of samples, n is the number of design variables,
U is a uniform value between [0, 1], and
π is an independent random permutation of the sequence of integer 0, 1, …,
k − 1. Subscript
j denotes the dimension number and superscript
i denotes the sample number.
As an improvement over the unrestricted stratified sampling method, LHS can be applied to design variables that have abnormal probability distribution, as well as correlations among the variables [
16]. Therefore, it is adopted as the preferred DoE technique in this work.
4.4. Construction of Surrogate Models
Following an appropriate generation of sampling points, a suitable approximation approach is chosen in the next step. The Kriging model has become the most popular surrogate model construction method in recent years. The mathematical function of the Kriging model is composed of two components: a polynomial model and an isolated symmetrical component. There is an assumption that these fluctuations are correlated only with the distance between the locations under consideration [
11,
17]. That is, a zero-mean second-order stationary process is expressed by the following equations
where
β is a constant value and fundamental function
z(
t) is the Gaussian distribution with error. The residual error is considered to be either independent, identically distributed, or normal random variables with zero mean and variance. Similar to the previous model, the estimated model for
y(
t) can be expressed by
where
R is the correlation matrix,
r is the correlation vector,
y is the ns observed data vector, and
q is the unit vector. The correlation matrix and vector are
where
i and
j are independent indices from No. 1 to No. ns (number of sample points).
The parameters θ1 to θn should be calculated then solved by applying the optimization algorithm in the cost function.
In the literature, a number of studies have been conducted to compare the precision of the estimated models, and the Kriging method is considered to be reasonably accurate in predicting non-linear and real-world complex systems. Therefore, the Kriging model is employed in the surrogate modelling of this work.
4.5. Heuristic Search Method
After the construction model, the search method should be applied to locate the local best performance. Compared to other computational intelligence-based techniques, particle swarm optimization has its advantages in easy implementation, having a more effective memory capability, and being more efficient in maintaining the diversity of the swarm [
18]. Therefore, it is selected to be used in the optimization.
5. Optimization Results
Two optimization plans with different problem definitions are shown in this section.
5.1. Results and Analysis of Preliminary Surrogate Models
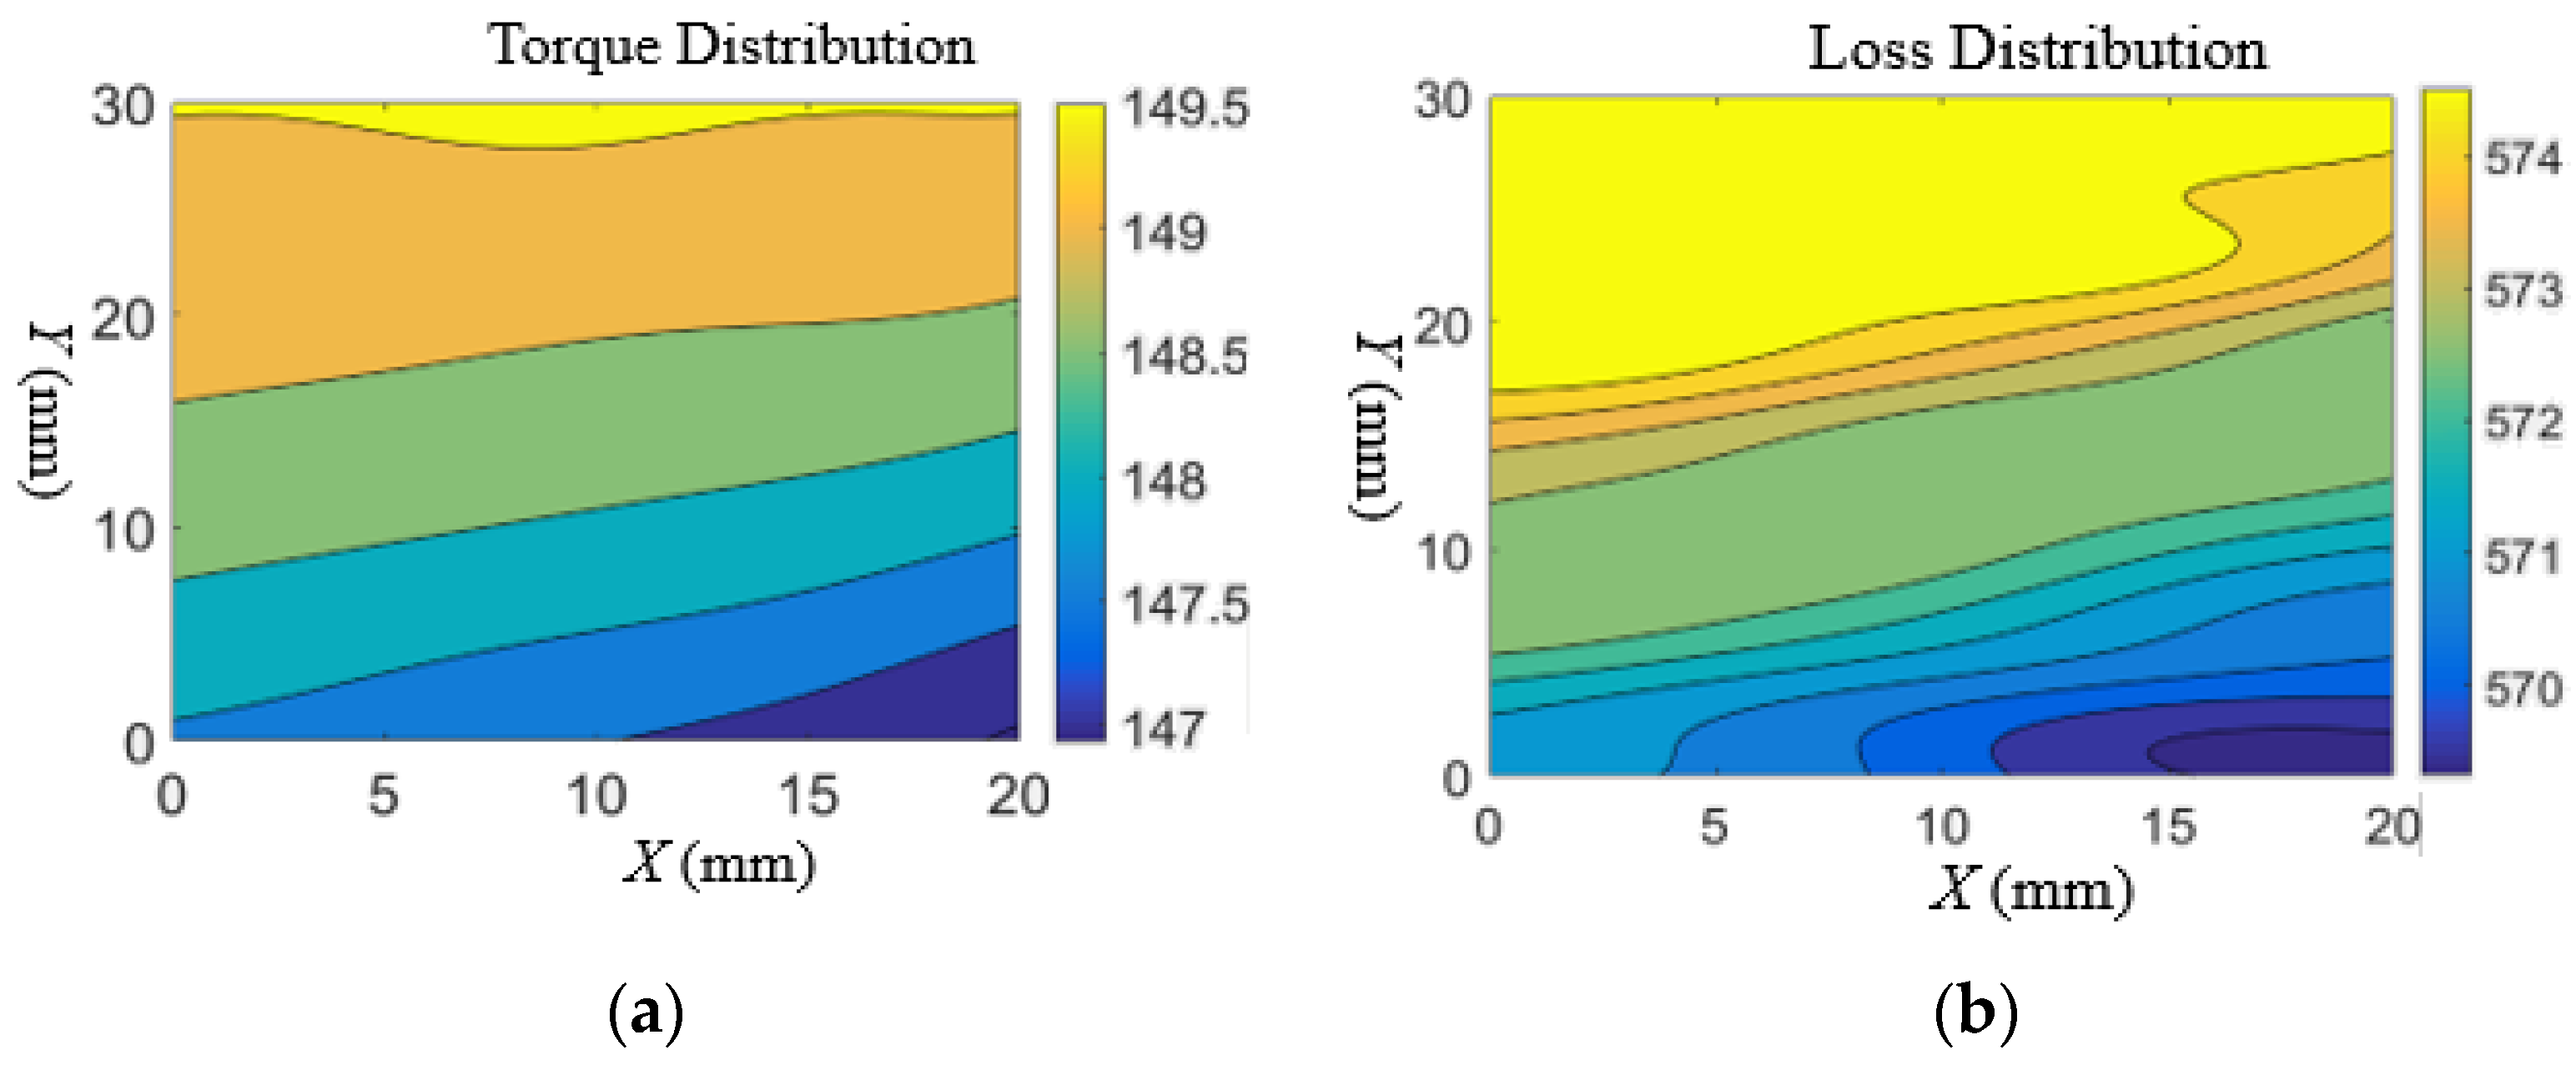
This surrogate optimization uses 50 training points. After training, the surrogate model is shown in
Figure 5. The surrogate model shows that the torque is distributed linearly. Higher torque is always achieved in the top right corner of the design region. However, the loss is quite non-linear and distributed unequally around the whole design region.
By using a particle swarm optimization (PSO) search algorithm, the surrogate optimization gives its estimation. The optimal point is set at [15.55, 17.94], where the estimated torque is 173 Nm and the estimated loss is 374.99 W.
In conclusion, these simulations show that by changing two variables, the performance will not be improved significantly. The torque improvement is less than 1% and loss is reduced by less than 10 W. Thus, more variables should be used in order to design a rotor shape which has a significant influence on machine performance.
5.2. Results and Analysis of Advanced Surrogate Models
The problem definition B of Design 1 is shown in
Figure 6a. The principle of the design is an extended version of problem definition A, which adds two more variables into the design spaces.
These added variables are used to cut the tip-side of the rotor in order to balance the flux distribution. The aim of the optimization stays the same.
The problem definition C of Design 2 is shown in
Figure 6b. This version is a little more complex compared to problem definition B. In order to balance the flux distribution, the arc side of the rotor tip is not completely removed. In addition to that, the left side of the rotor is also cut with a circle. Two additional round circles are added to guide the flux into the rotor to avoid rectangular contact. As a result, this design is a four-variable optimization plan similar to Design B. The optimization goal is shown
As shown in
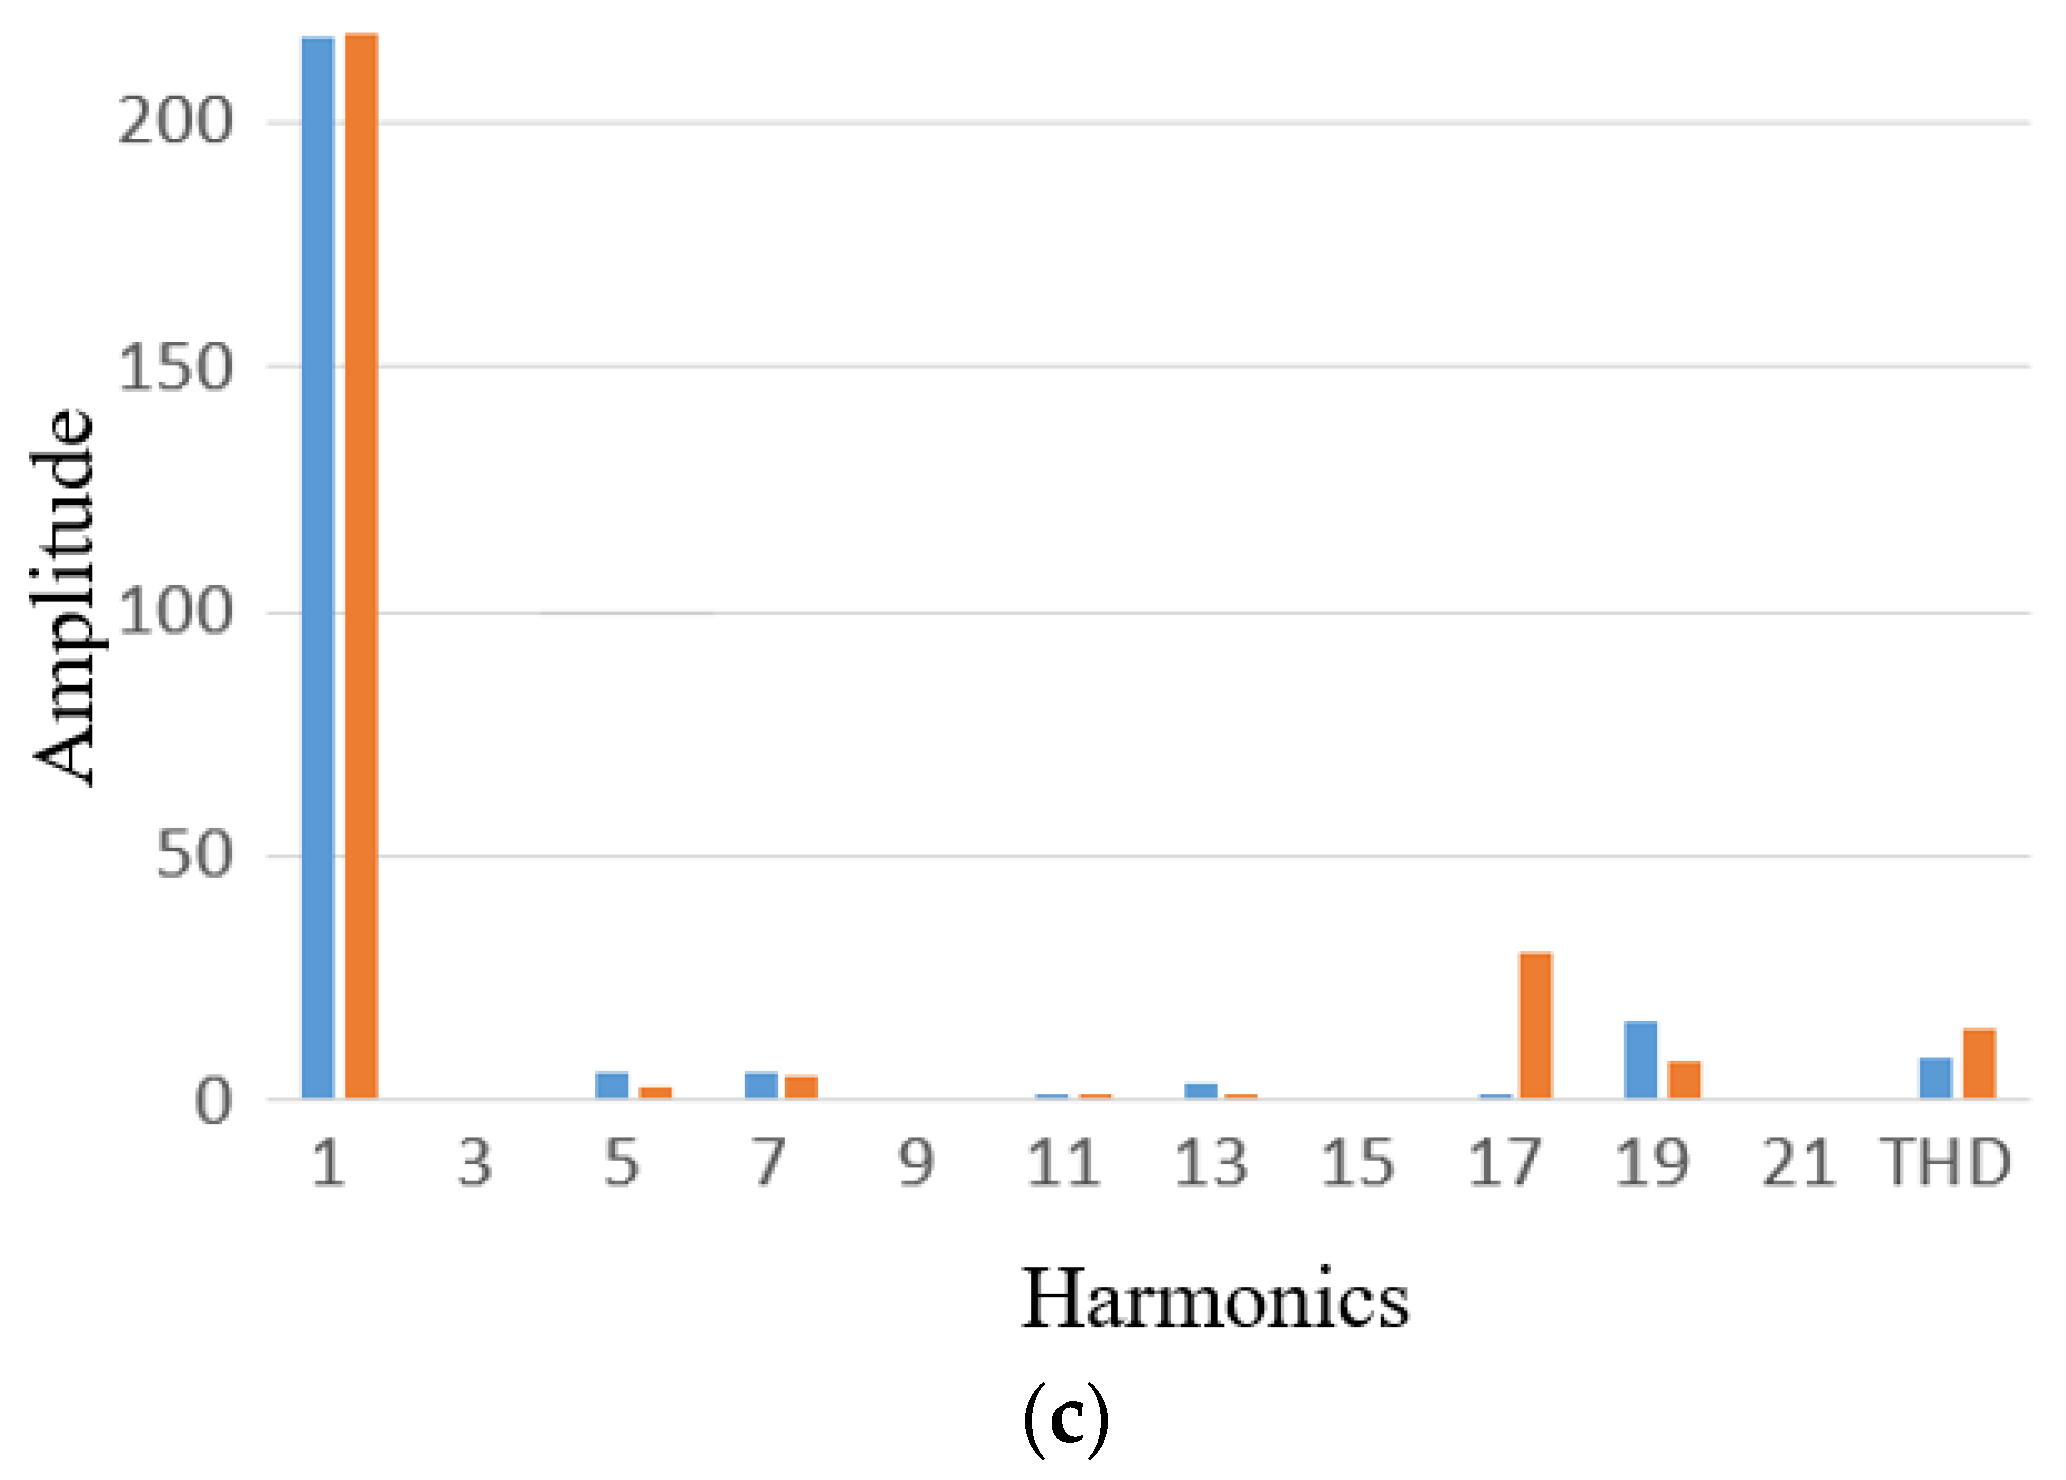
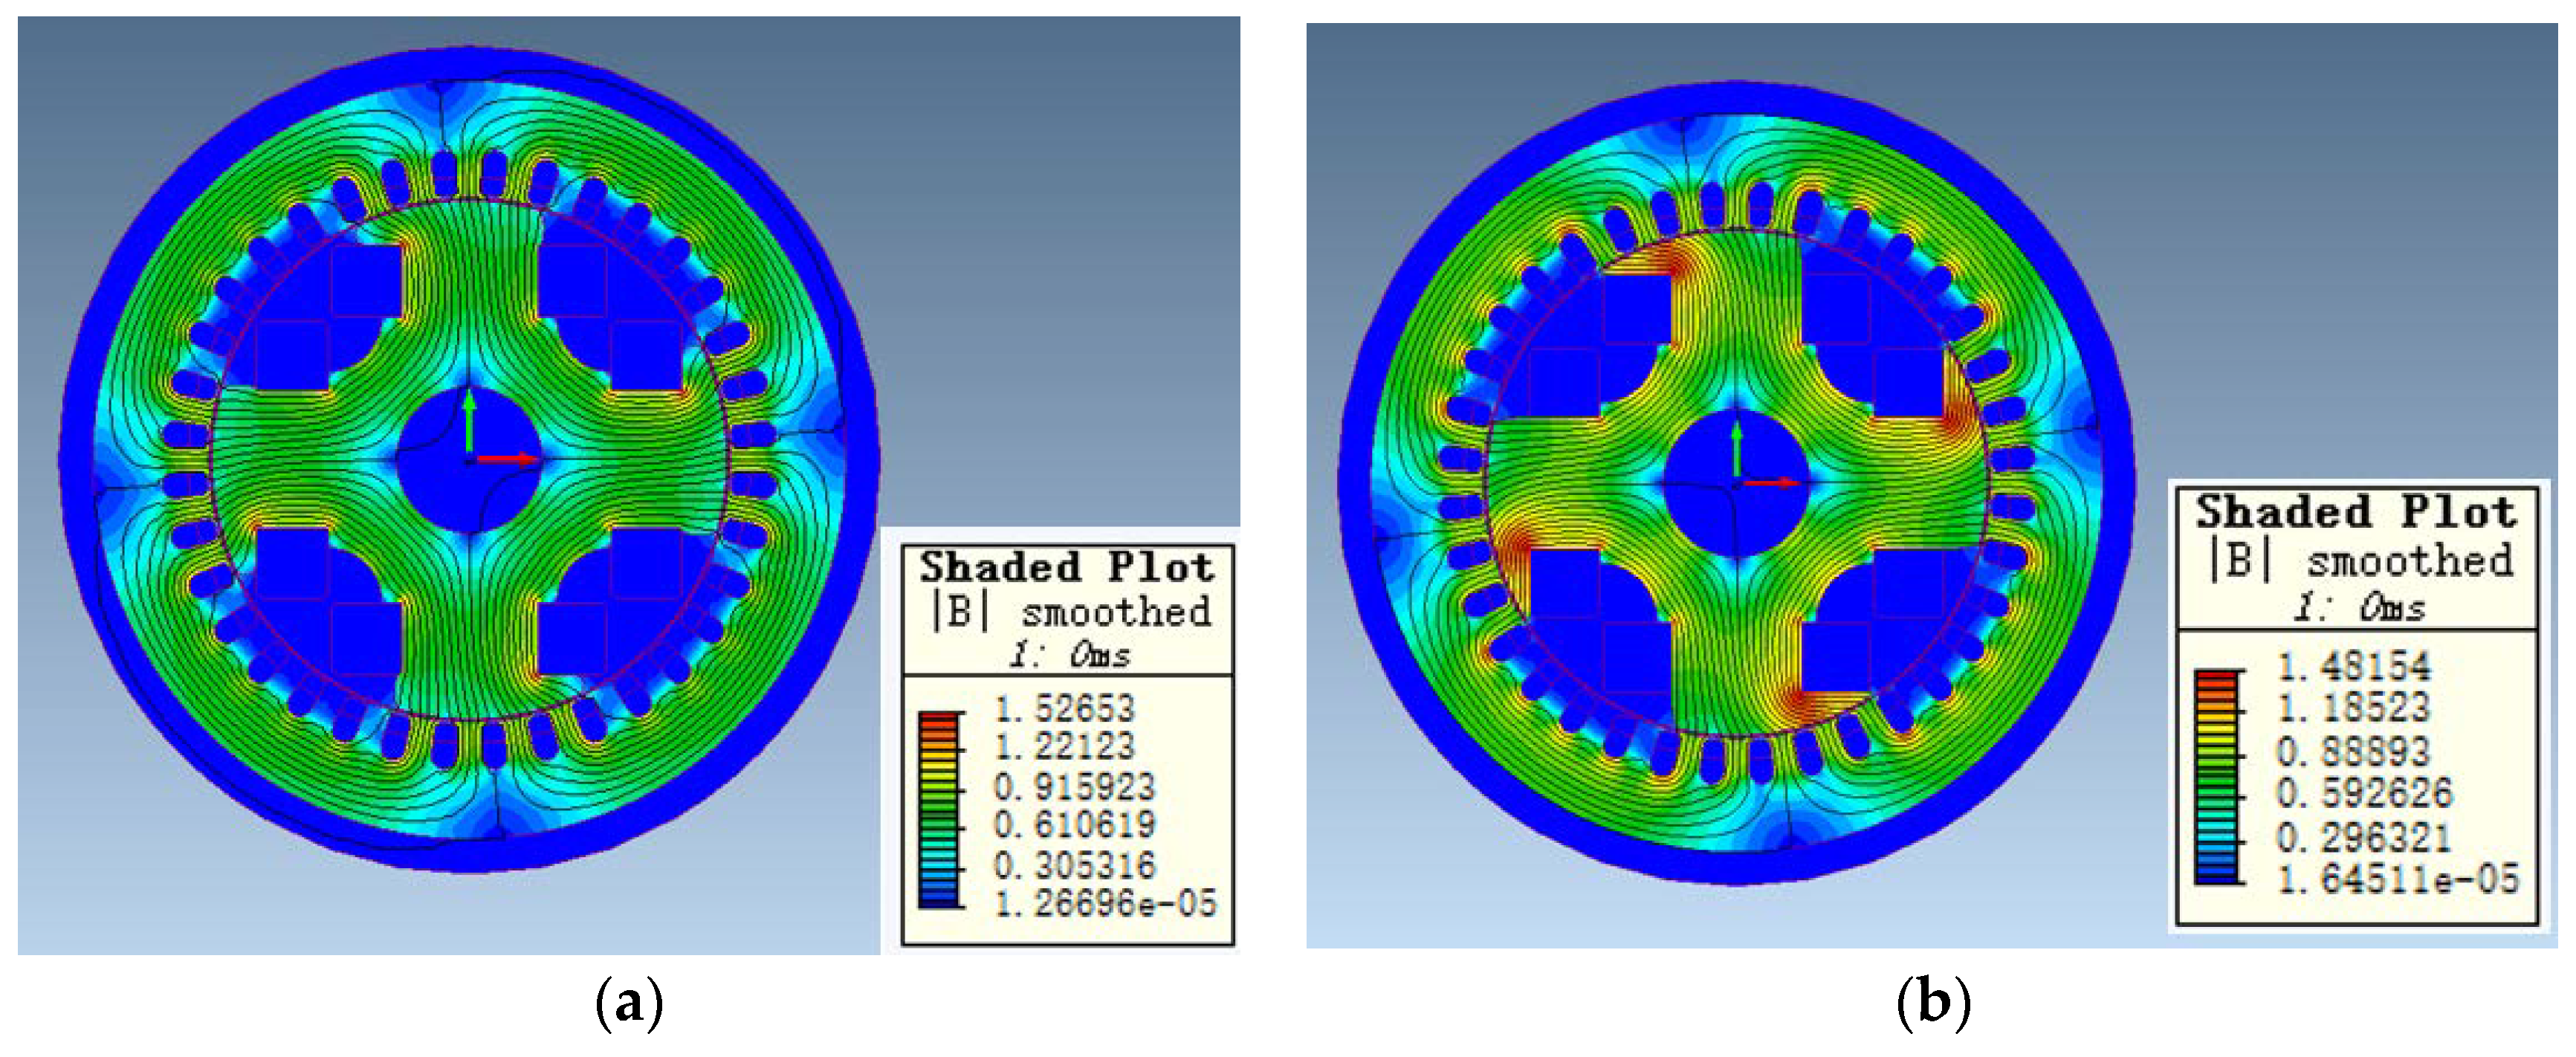
Figure 7, the flux paths of both designs are shifted towards the tip side of the rotor due to the absence of a rotor tip. However, it is clear that Design 2 provides a better flux distribution. The flux concentration on the rotor tip is reduced by providing an extra flux path on the arc side. This has a clear influence on the induced EMF of the two designs.
According to the FFT results in
Table 1 and
Figure 8a, it is noticed that induced EMF is significantly distorted in Design 1. This is a clear reflection of the unbalanced flux path. However, in the second design, because the flux is distributed evenly on both sides, total harmonic distortion remains at an acceptable level.
Another interesting aspect of the two designs is the saturation level. As stated in the previous design, the saturation level should be carefully examined due to the high flux concentration on the rotor tip.
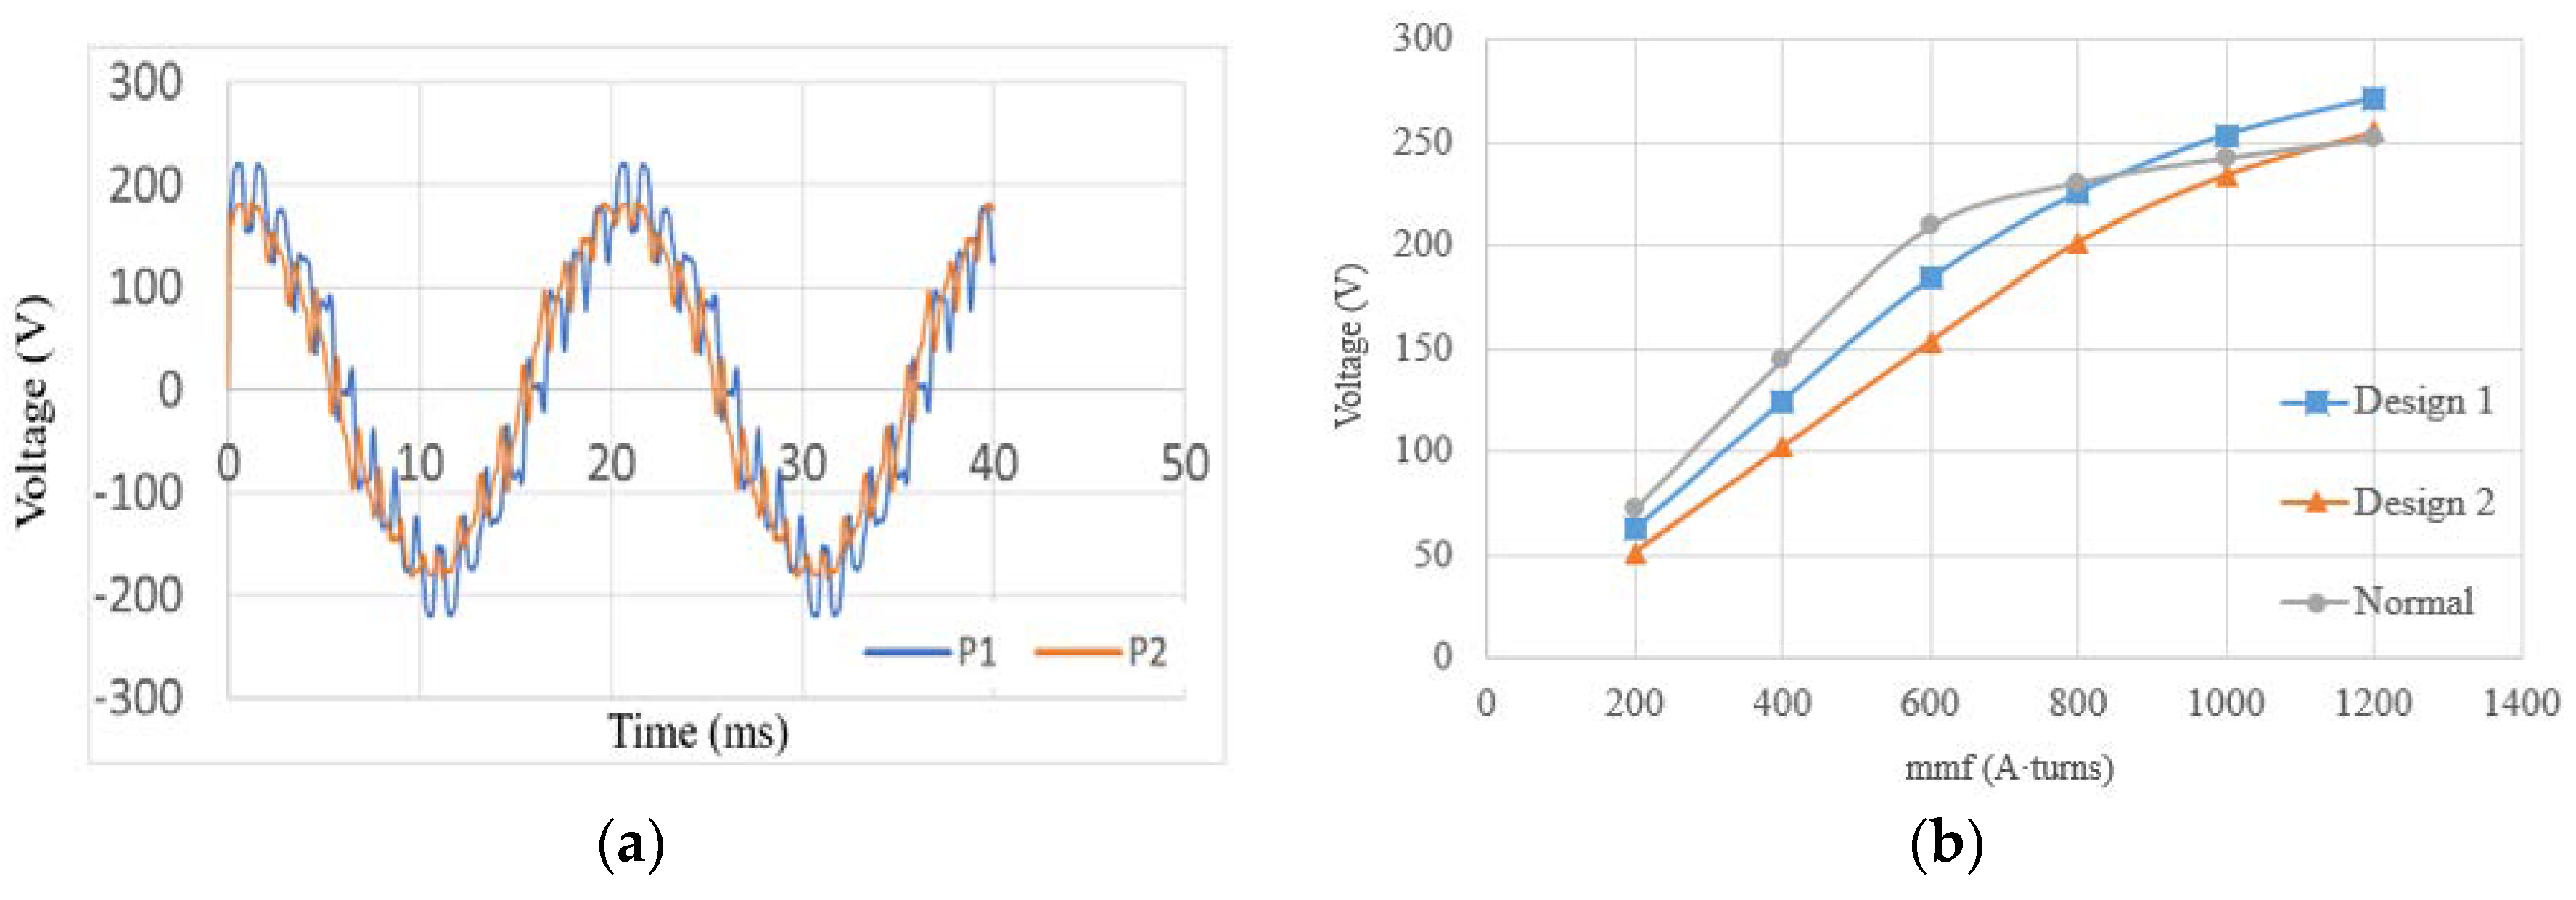
Figure 8 shows a comparison of EMF among the two designs and the original rotor design.
The no-load characteristic shows that both Designs 1 and 2 are not less likely to saturate. However, it also shows they would have a relatively low voltage in the given excitation level. This can be expressed by the reduction of the flux paths due to the removal of the rotor tip. However, it is worthy of note that both designs achieve higher voltages at the expense of higher excitation levels.
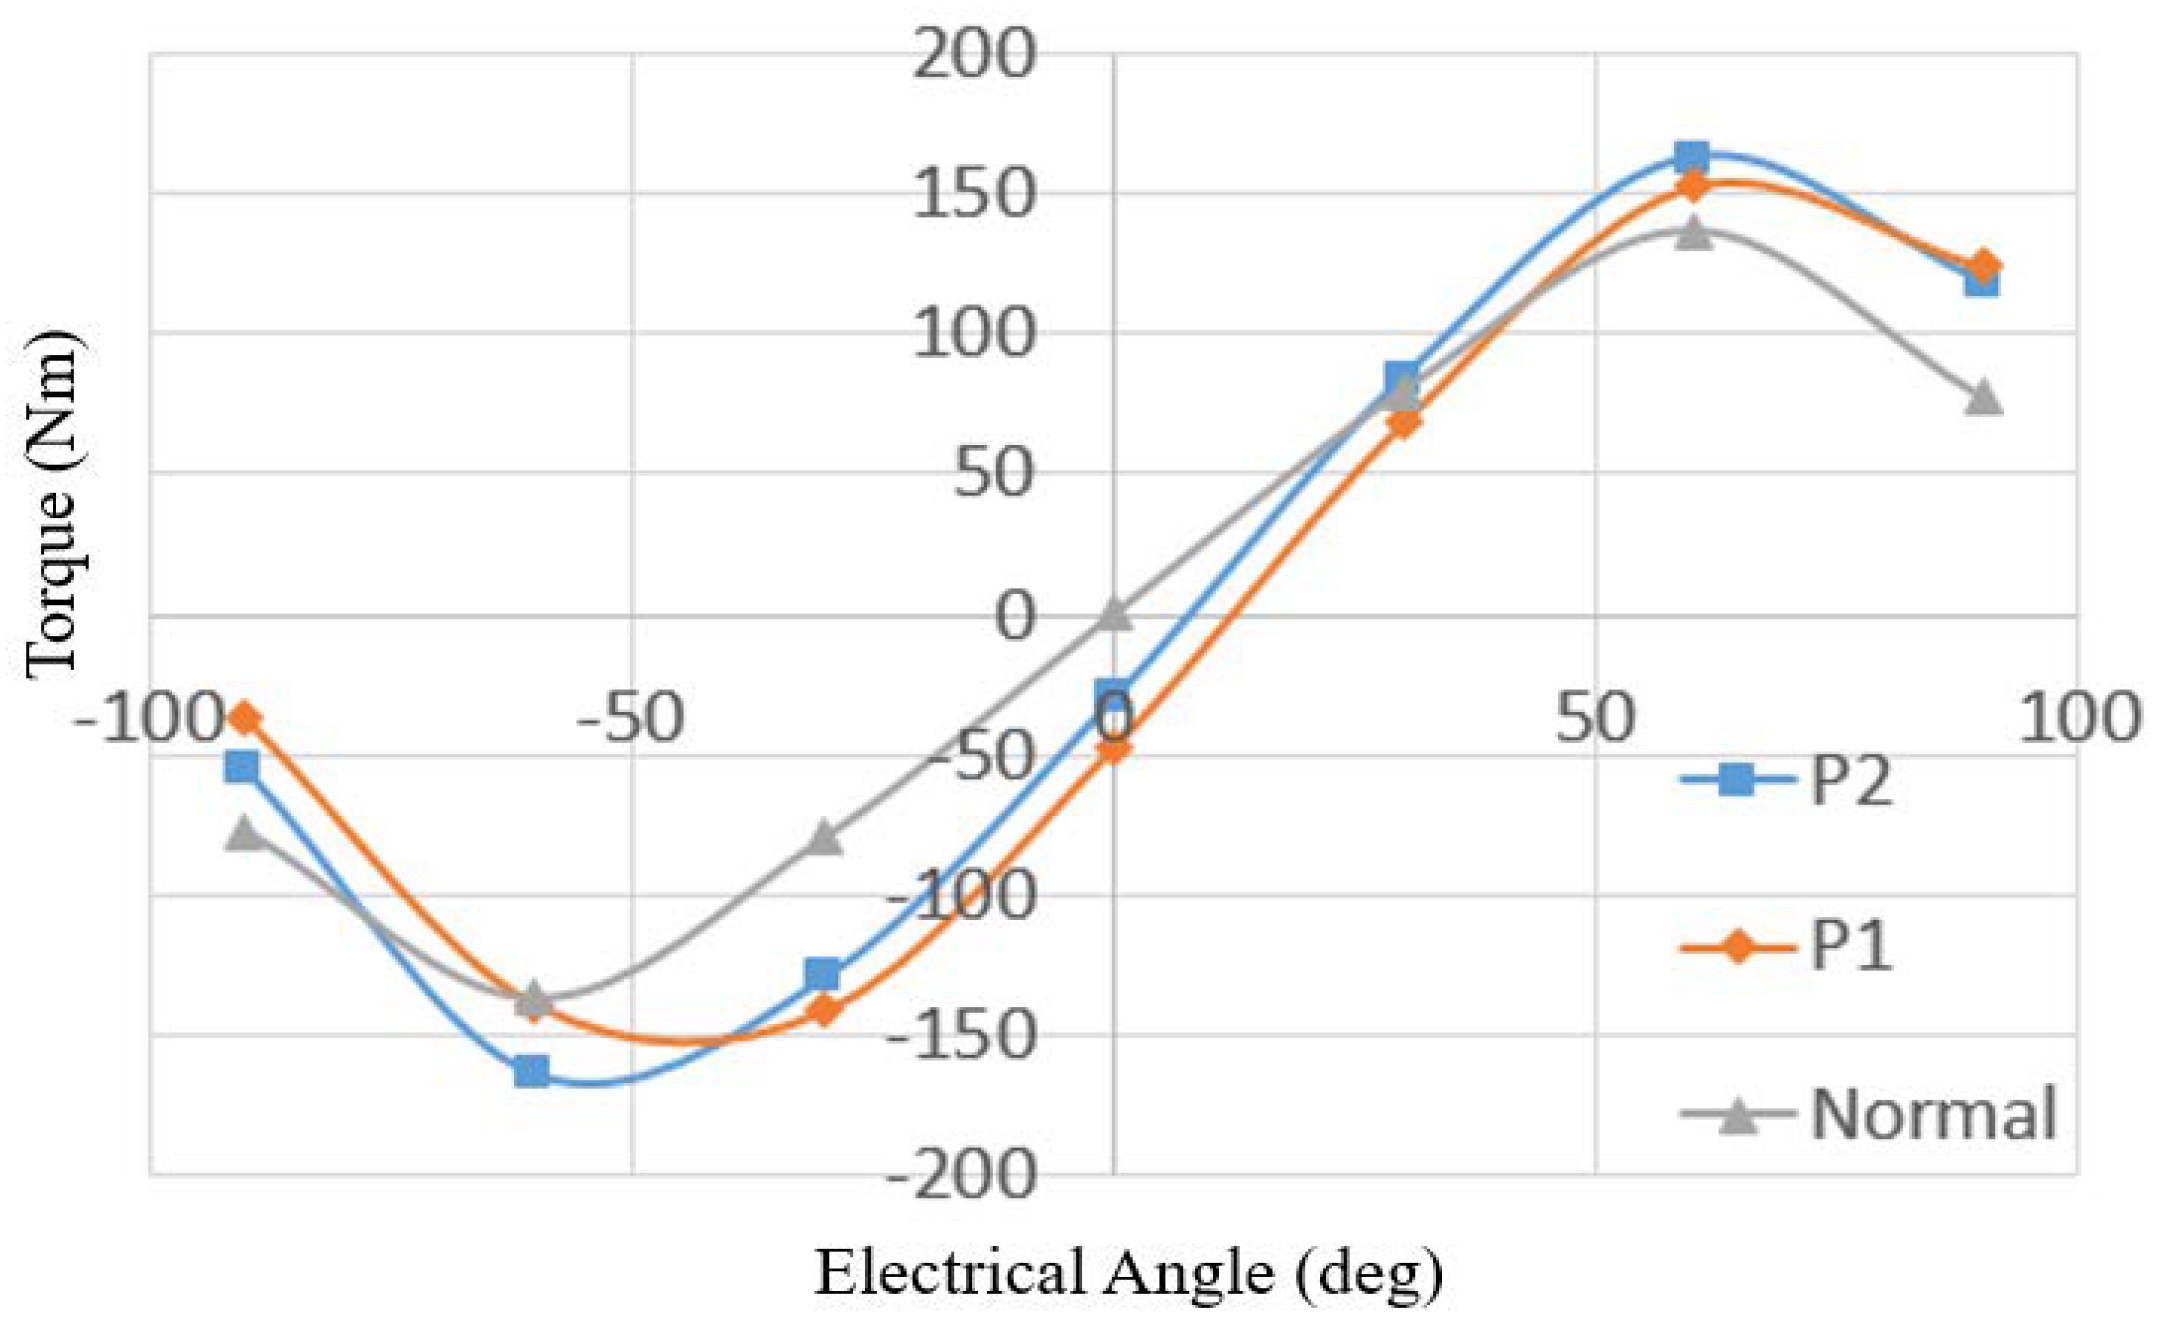
In general, the two designs operate similarly to the normal symmetrical rotor. The maximum power generated by the two designs are higher than the traditional symmetrical rotor. An interesting factor is the maximum power angle. As shown in
Figure 9, the maximum power angle is quite different in the two designs. This is as a result of the unique shape of the rotor and its flux path.
As described above, both design plans show different characteristics and each should have its own merits and drawbacks. Therefore, it is very hard to decide which one should be applied. Optimization should be carried out in order to find the best performance of the two different designs.
Since the advanced optimization plans are a four-variable optimization case, the results cannot be visualized as in the previous 2-D figure. Following the same pattern, details of optimization results are shown in
Table 2.
The accuracy of the surrogate model is confirmed by the FEA simulation. According to the results, both designs have similar iron losses. Both designs also perform better in reducing iron loss compared to the original asymmetrical design. However, compared to the original design, the torque provided by Design 1 has been decreased significantly. Therefore, it is not ideal for our optimization goal. As a result, Design 2 is selected for the experiment prototype validation. Detail simulation results with experimental validation are discussed in the next section.
6. Experiment Validation
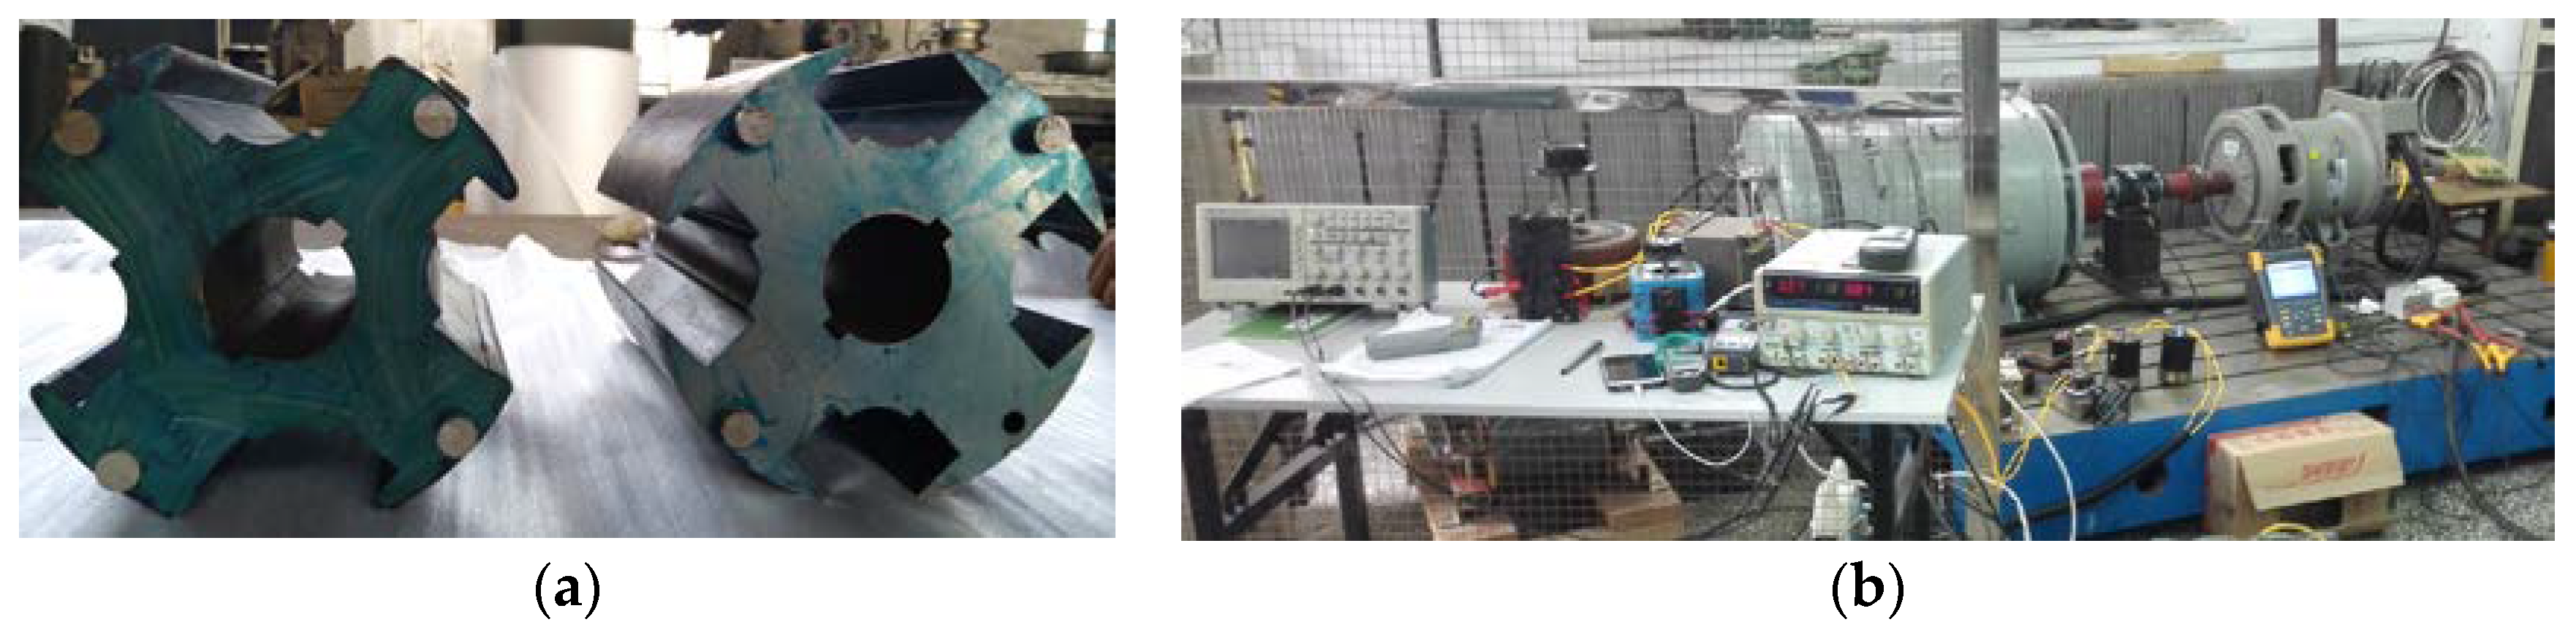
After a round of optimizing the rotor design and analyzing the machine performance, the rotor design is finalized, and the rotors are prototyped, as shown in
Figure 10. Specifications of the prototype are given in
Table 3.
The stator of the machine is a duplicate of a standard Cummins PI-144F machine. In order to reduce the major influence of the manufacturing process, two rotors are made by the same manufacturer. For stator windings, they are 2/3 short-pitched double-layer star connected windings with a slot area of 144 mm2 for each layer. For the rotor winding, 76 turns of a copper coil (2.3 mm radius) are used.
6.1. Constant Speed-Variable Test
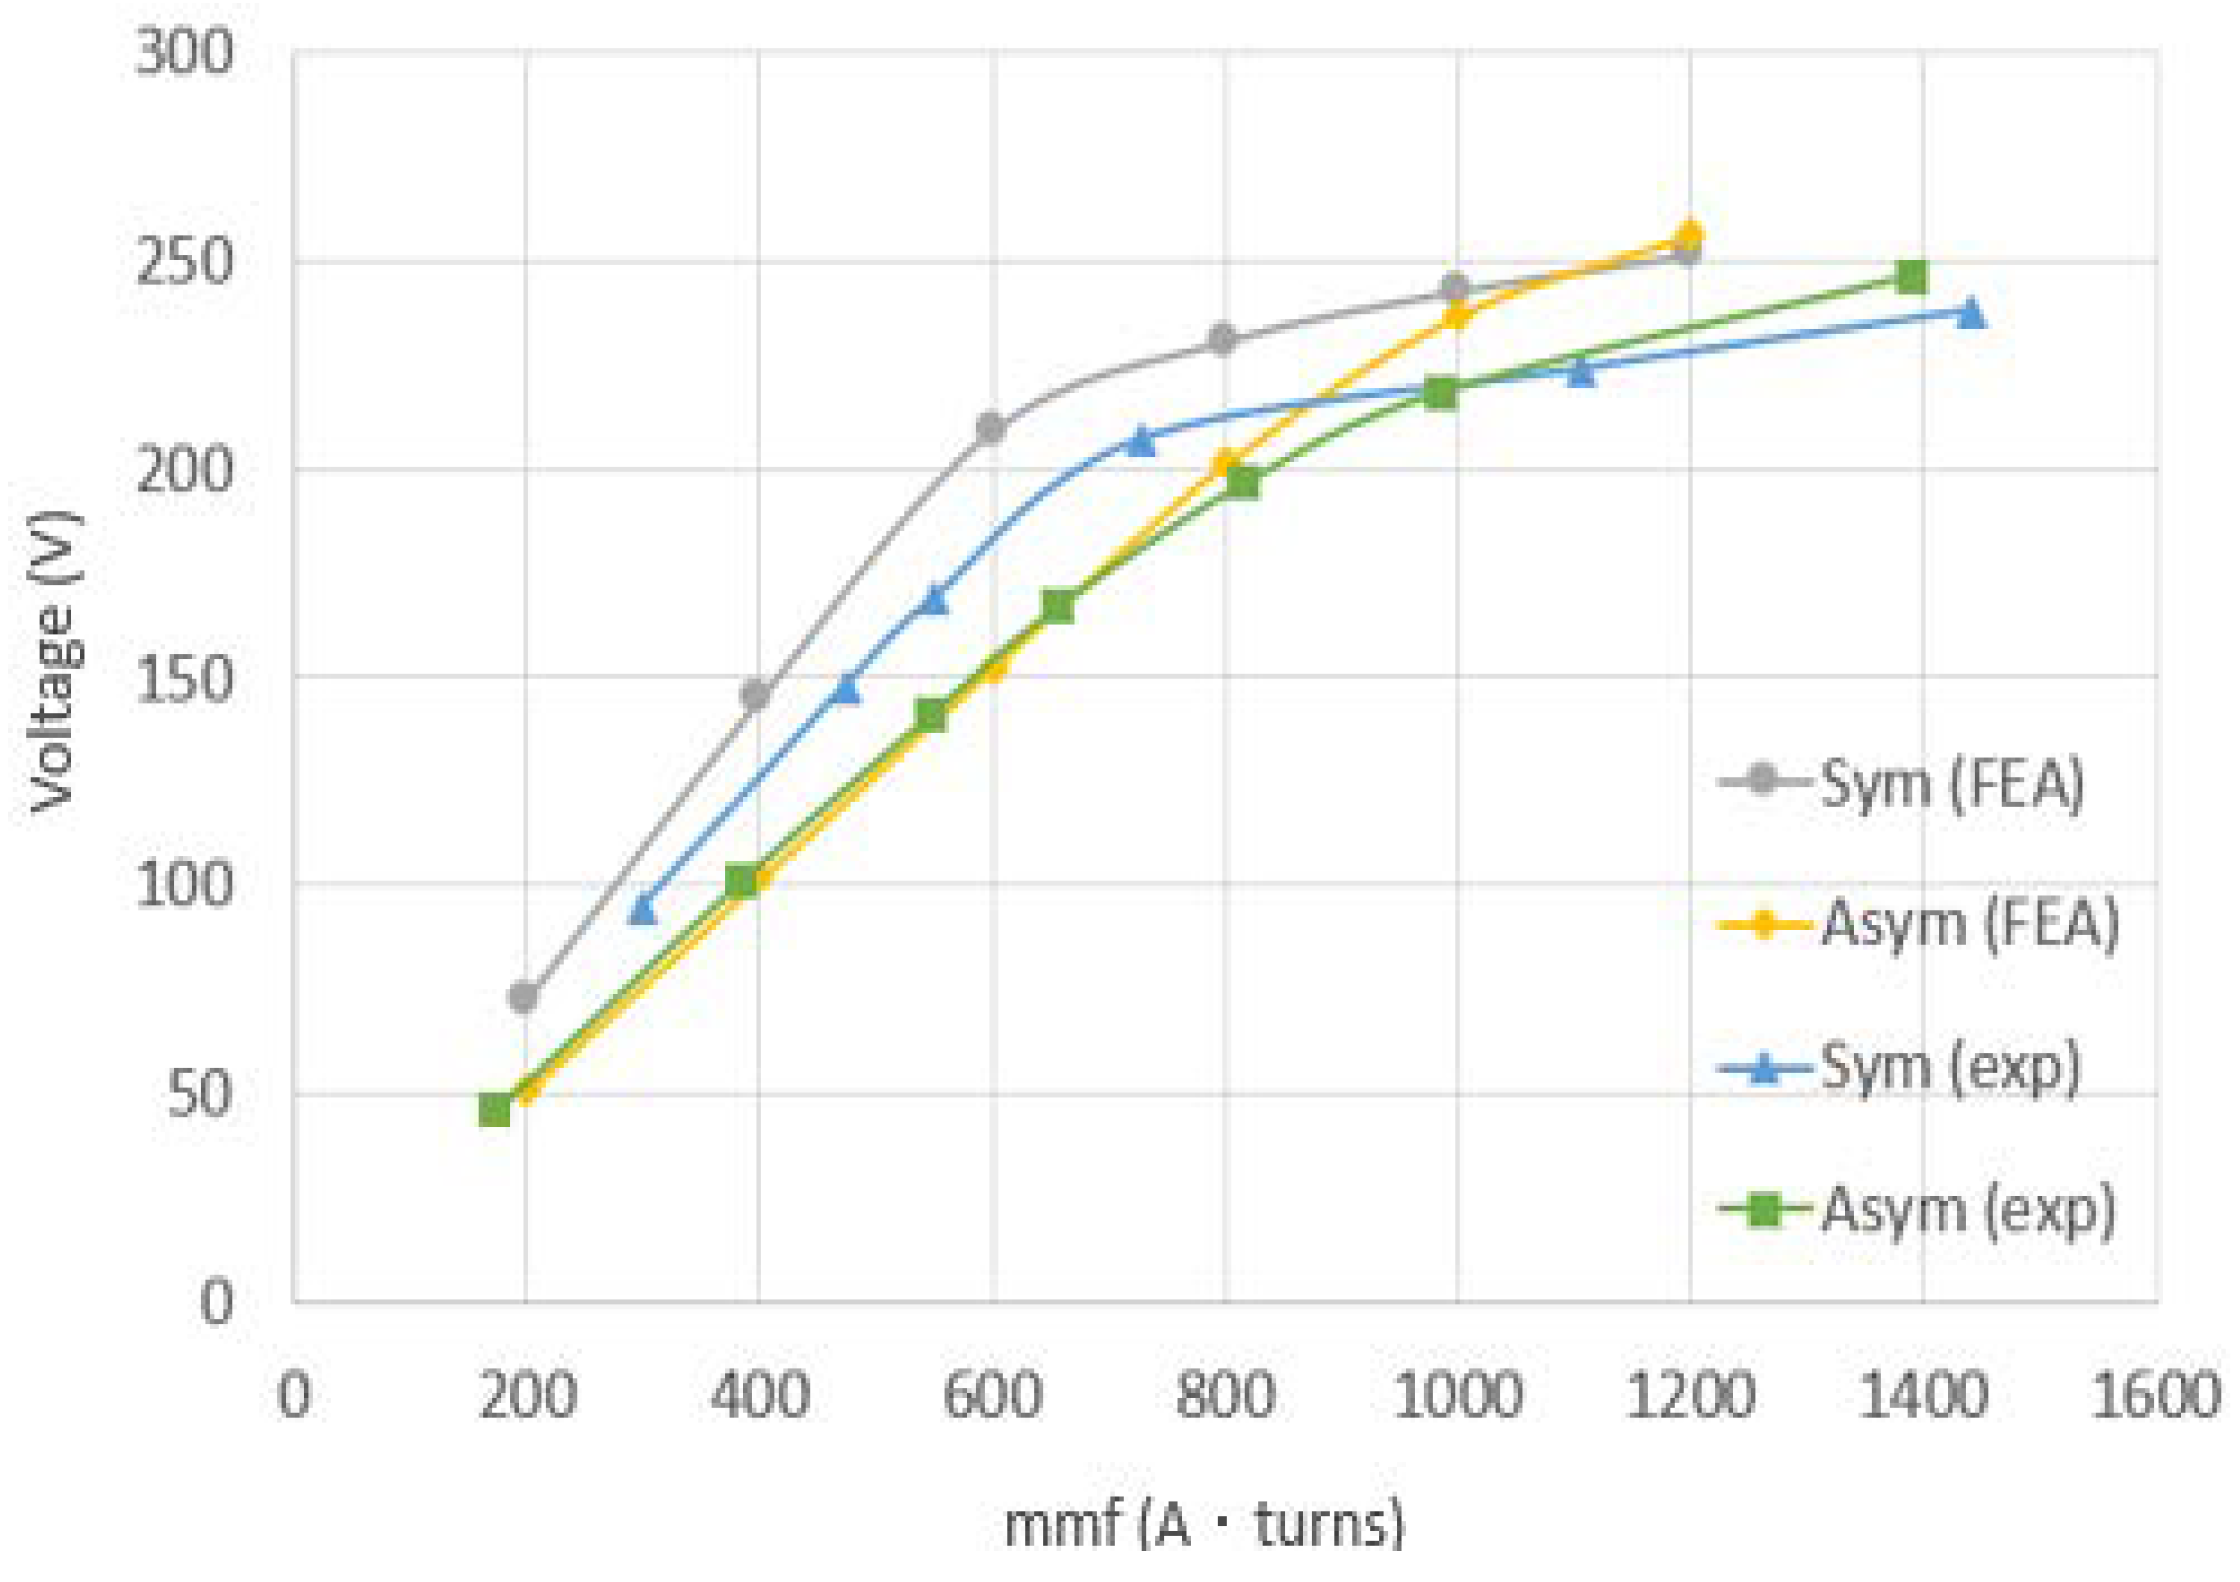
A constant speed-variable excitation test is conducted by coupling the test machine with a DC drive motor. The machine is driven by the DC motor to the synchronous speed under an open circuit and underrated excitation conditions. The test results of both rotors are shown in
Figure 11. For the symmetrical rotor, the predicted voltage by the FEA is lower than the measured results from the experiments by approximately 10%. On the contrary, the predicted voltage for the asymmetrical rotor is quite close to the measurement in lower excitation levels. However, the measured voltage gets saturated faster than the predicted one. However, these no-load test results show that the asymmetrical rotor could perform similarly to the symmetrical rotor at the expense of a higher excitation level.
6.2. Analysis of Experiment Results
As stated in [
19], for each of the values of voltage 50% or less in the constant speed-variable excitation test, a curve of constant losses against the open circuit voltage U02 is developed and extrapolated on a straight line until reaching zero voltage. The intercept with the zero-voltage axis is the windage and friction losses (
Pfw). The iron loss of the machine can be obtained by taking off
Pfw in the constant power loss
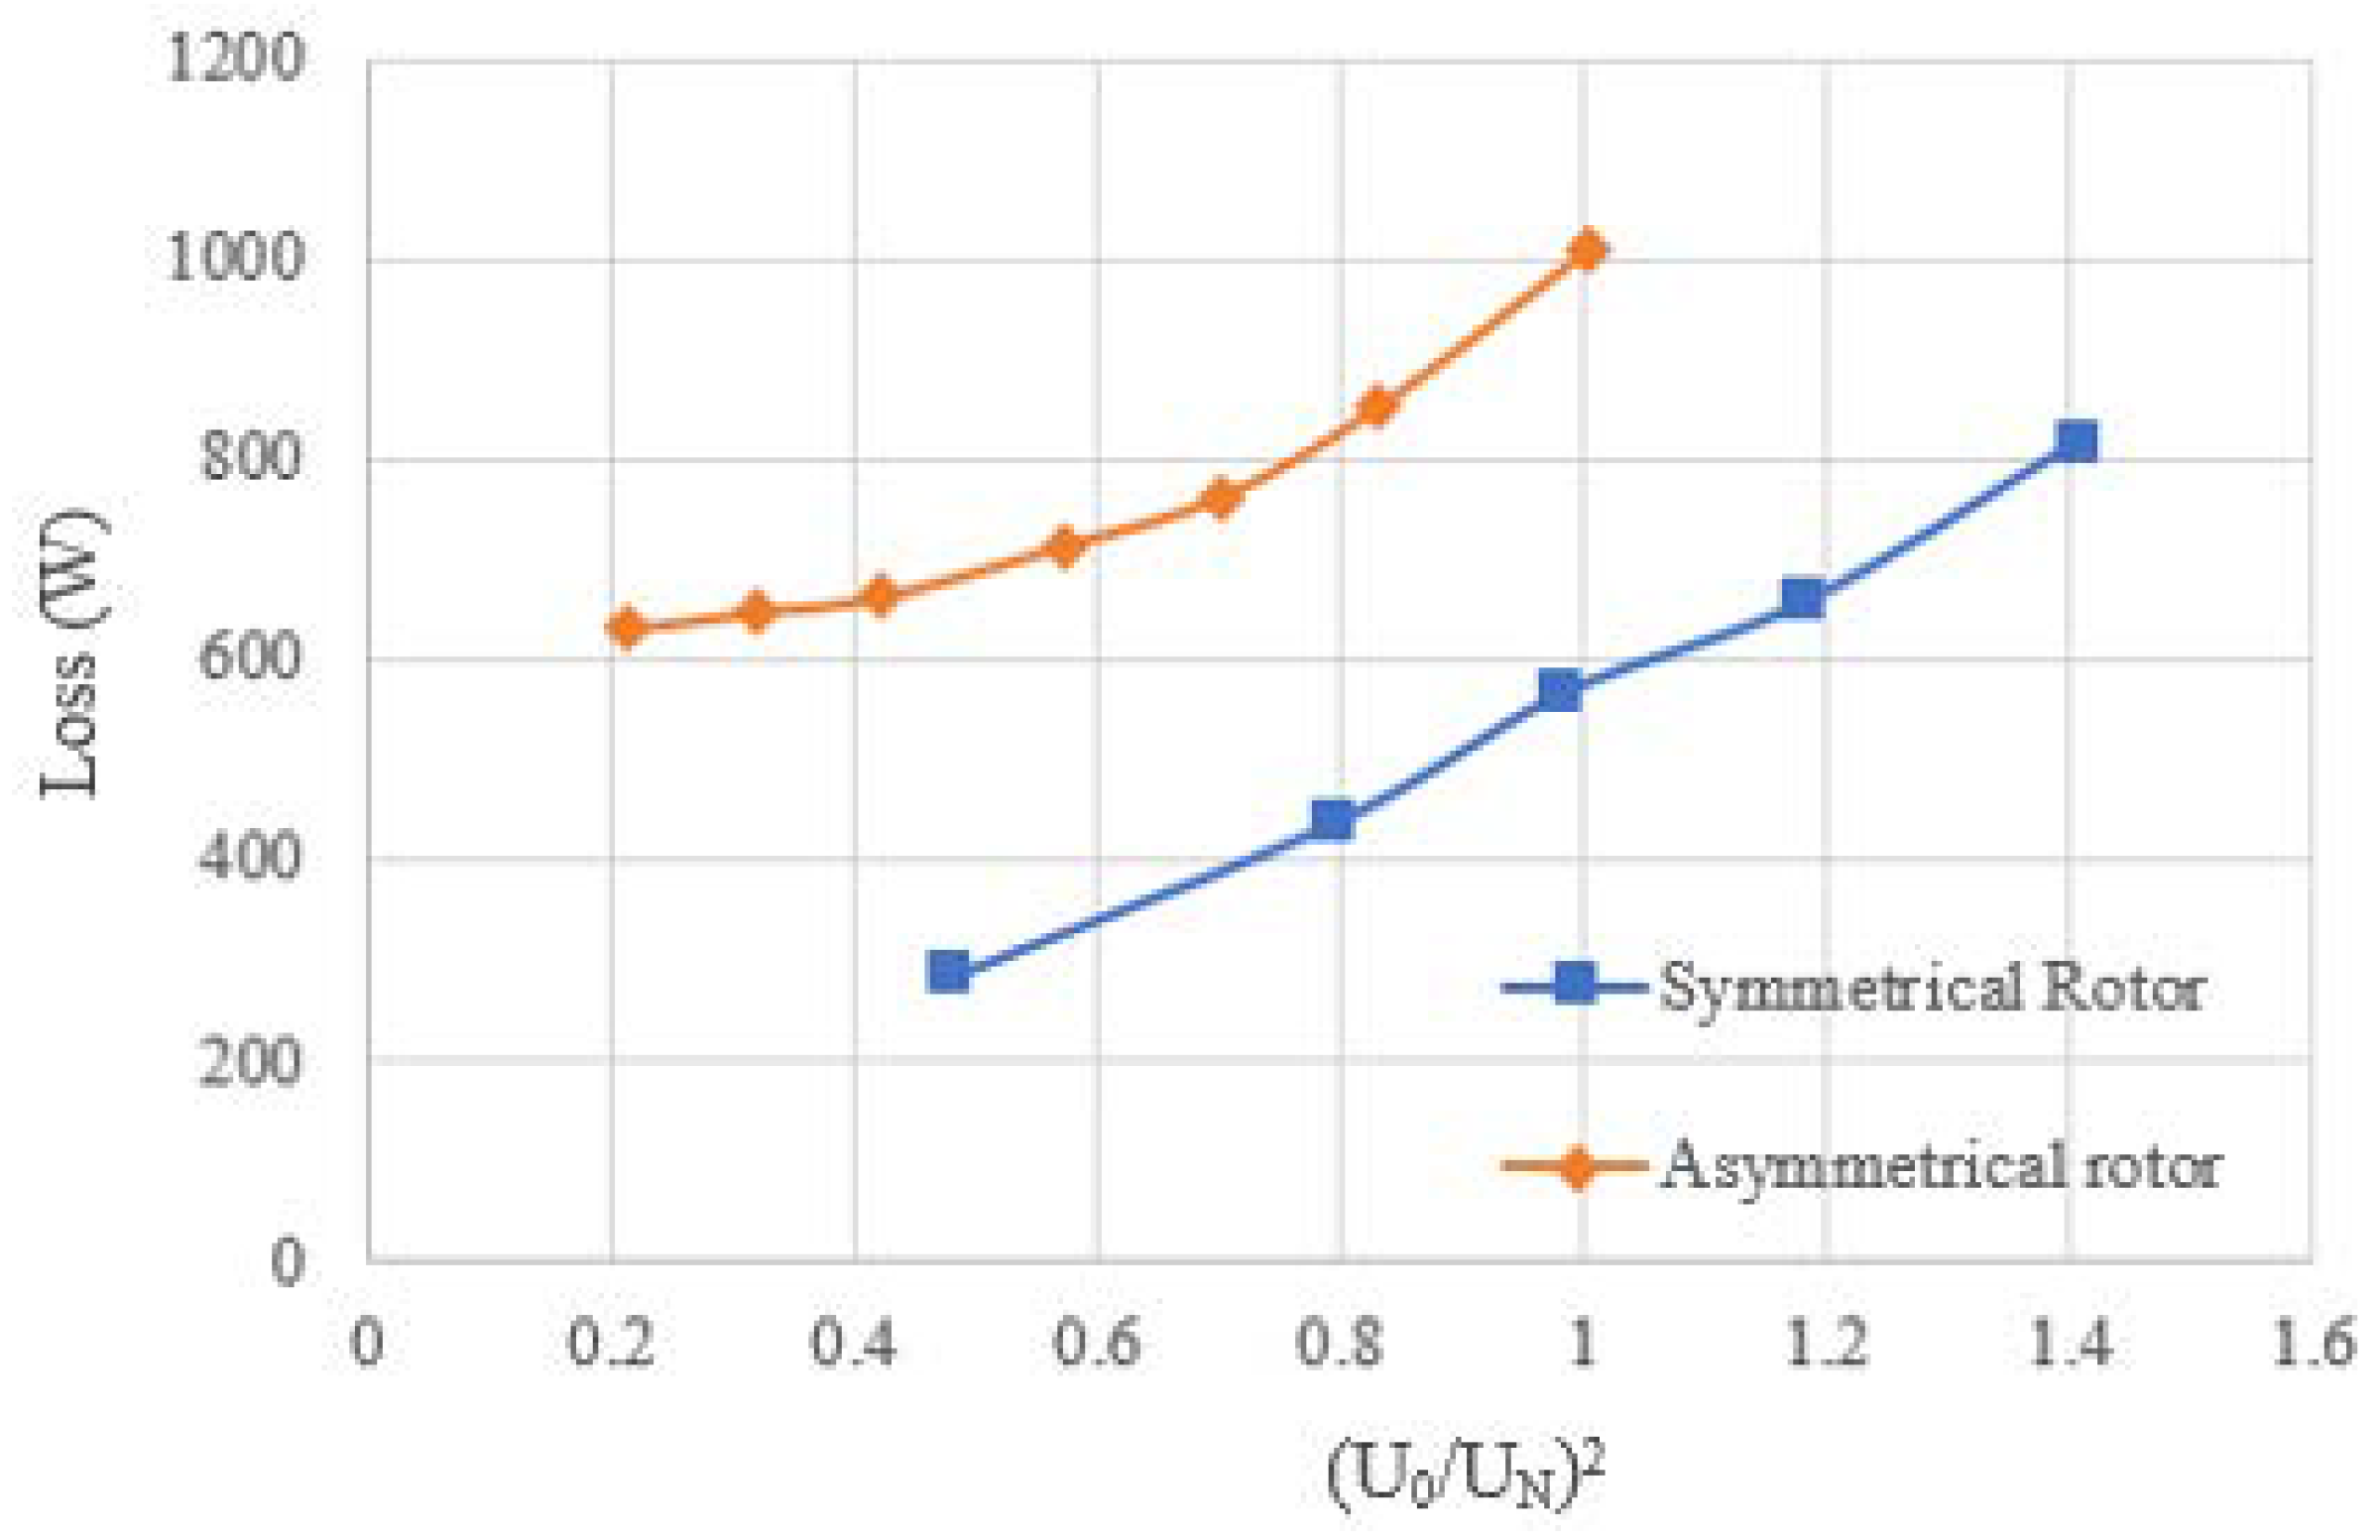
PK. The power curve is shown in
Figure 12 and calculation results are tabulated in
Table 4.
It is noticed that experimental results are slightly lower than anticipated from the FEA. This is partly due to the fact that material characteristics for the simulation are inaccurate compared to the actual material used in the experiments. However, it still confirmed that the loss in an asymmetrical rotor can reach the same level as in a symmetrical rotor, and it is significantly better than that in the initial design.
Attention should be paid to the friction and windage losses of the asymmetrical rotor, which is larger than that of the symmetrical rotor. The unbalanced shape of the asymmetrical rotor makes a larger vibration, increasing the mechanical loss of the machine, similar to the studies on asymmetrical Permanent magnet synchronous machine (PMSM) in [
20]. Therefore, the alignment of the shaft and the fixing of the frame should be specially designed.
6.3. Low-Slip Test
This saliency caused by the rotor shape has its impact on the torque output of the alternator. According to the equations in [
21], the output torque at any speed can be derived as
where
Xd and
Xad are the per unit direct axis synchronous and magnetizing reactance per each unit of speed, respectively;
Xq is the per unit quadrature axis reactance per one unit speed; and Is denotes the phase current.
In (17), the first component of the equation represents the torque generated by the round rotor, and the second part is the reluctance torque caused by the saliency of the rotor. The reluctance torque is influenced by the asymmetrical rotor structure in the optimization and, thus, the total power is increased.
The measurement of the direct-axis reactance and quadrant-axis reactance is performed using a low-slip test following the standard method [
19]. A comparison of the FEA simulation and experiment results are presented in
Table 5.
7. Conclusions
This paper has presented a new asymmetrical rotor topology which can shift the magnetic path and, thus, alter the cross-sectional area of saliency. The machine assembly and repair process is significantly simplified by this modification. The new rotor optimization focuses on presenting the critical curvature of the rotor geometry by varying parameters, investigating the influence of the rotor shaping methods by surrogate models, and optimizing the rotor pole shape for high-efficiency outputs. Through the geometry boundary design, the machine is optimized to achieve high-efficiency whilst still maintaining the easy installation feature. The effectiveness of altering the rotor geometry is proven by FEA numerical and experimental tests. Test results indicate that the new rotor shape after optimization enables the synchronous generator to achieve a similar performance to the traditional rotor design. An added benefit is that the DC field coil can be easily installed onto the rotor so as to reduce the assembly and repair costs of the machine.
Author Contributions
Developing the simulation models, T.Y.; Conducting the FEM design and experiments, N.Y.; Developing the control strategy, W.Z.; Developing the work and writing the paper, W.C.; Developing the Matlab modelling, N.X; Writing the optimization scheme, Z.T.; Setting up the test rig and experiment instrumentation, G.L.
Funding
This study was funded by National Key Research and Development Plan of China (2017YFB0903500), the Fundamental Research Funds for the Central Universities (DUT18RC(3)014) and Key Research Project of State Grid Corporation of China (5230HQ16016U).
Acknowledgments
This study is supported by the Royal Society and GoldWind Ltd.
Conflicts of Interest
The authors declare no conflict of interest.
References
- Setiyoso, A.; Purwadi, A.; Halimi, B.; Rizqiawan, A. Design of synchronous machine 10625kVA for small power-plant in Indonesia. In Proceedings of the 3rd Conference on Power Engineering and Renewable Energy (ICPERE), Yogyakarta, Indonesia, 29–30 November 2016; pp. 81–86. [Google Scholar]
- Dietz, A.; Groeger, A.; Klingler, C. Efficiency improvement of small hydroelectric power stations with a permanent-magnet synchronous generator. In Proceedings of the 1st International Electric Drives Production Conference, Nuremberg, Germany, 27–30 September 2011; pp. 93–100. [Google Scholar]
- Grabic, S.; Celanovic, N.; Katic, V.A. Permanent magnet synchronous generator cascade for wind turbine application. IEEE Trans. Power Electron. 2008, 23, 1136–1142. [Google Scholar] [CrossRef]
- Stone, G.C.; Culbert, I.; Boulter, E.A.; Dhirani, H. Salient Pole Rotor Winding Failure Mechanisms and Repair. Electrical Insulation for Rotating Machines: Design, Evaluation, Aging, Testing, and Repair, 1st ed.; Wiley: Hoboken, NJ, USA, 2014; pp. 253–263. [Google Scholar]
- Yang, N.; Cao, W.; Liu, Z.; Tan, Z.; Zhang, Y.; Yu, S.; Morrow, J. Novel asymmetrical rotor design for easy assembly and repair of rotor windings in synchronous generators. In Proceedings of the IEEE International Magnetics Conference (INTERMAG), Beijing, China, 11–15 May 2015. [Google Scholar]
- Yang, N.; Cao, W.; Tan, Z.; Song, X.; Littler, T.; Morrow, J. Asymmetrical rotor design for a synchronous machine based on surrogate optimisation algorithm. In Proceedings of the 8th IET International Conference on Power Electronics, Machines and Drives, Glasgow, UK, 19–21 April 2016; pp. 1–6. [Google Scholar]
- Preston, T.W.; Sturgess, J.P. Implementation of the finite-element method into machine design procedures. In Proceedings of the Sixth International Conference on Electrical Machines and Drives, Oxford, UK, 8–10 September 1993; IET: Stevenage, UK, 1993; pp. 312–317. [Google Scholar]
- Duan, Y.; Ionel, D.M. A Review of Recent Developments in Electrical Machine Design Optimization Methods with a Permanent-Magnet Synchronous Motor Benchmark Study. IEEE Trans. Ind. Appl. 2013, 49, 1268–1275. [Google Scholar] [CrossRef]
- Song, X.; Lv, L.; Li, J.; Sun, W.; Zhang, J. An Advanced and Robust Ensemble Surrogate Model: Extended Adaptive Hybrid Functions. J. Mech. Des. 2018, 140. [Google Scholar] [CrossRef]
- Song, X.; Zhang, J.; Kang, S.; Ma, M.; Ji, B.; Cao, W.; Pickert, V. Surrogate-Based Analysis and Optimization for the Design of Heat Sinks with Jet Impingement. IEEE Trans. Compon. Packag. Manuf. Technol. 2014, 4, 429–437. [Google Scholar] [CrossRef]
- Queipo, N.V.; Haftka, R.T.; Shyy, W.; Goel, T.; Vaidyanathan, R.; Tucker, K.P. Surrogate-based analysis and optimization. Prog. Aerosp. Sci. 2005, 41, 1–28. [Google Scholar] [CrossRef]
- Giunta, A.A.; Wojtkiewicz, S.F.; Eldred, M.S. Overview of modern design of experiments methods for computational simulations. In Proceedings of the 41st Aerospace Sciences Meeting and Exhibit, Reno, NV, USA, 6–9 January 2003. [Google Scholar]
- Santner, T.J.; Williams, B.J.; Notz, W.I. The Design and Analysis of Computer Experiments; Springer: Heidelberg, Germany, 2003. [Google Scholar]
- Koehler, J.R.; Owen, A.B. Computer experiments. In Handbook of Statistics; Ghosh, S., Rao, C.R., Eds.; Elsevier: Amsterdam, The Netherlands, 1996; Volume 13, pp. 261–308. [Google Scholar]
- McKay, M.D.; Beckman, R.J.; Conover, W.J. Comparison of three methods for selecting values of input variables in the analysis of output from a computer code. Technometrics 1979, 21, 239–245. [Google Scholar]
- Stein, M. Large sample properties of simulations using Latin hypercube sampling. Technometrics 1987, 29, 143–151. [Google Scholar] [CrossRef]
- Sasena, M.J. Flexibility and Efficiency Enhancements for Constrained Global Design Optimization with Kriging Approximations. Ph.D. Thesis, University of Michigan, Ann Arbor, MI, USA, 2002. [Google Scholar]
- Engelbrecht, A.P. Particle swarm optimization: Where does it belong? Presented at IEEE Swarm Intelligence Symposium, Indianapolis, IN, USA, 12–14 May 2006; pp. 48–54. [Google Scholar]
- British Standards Institution. Rotating Electrical Machines—Part 4: Methods for Determining Synchronous Machine Quantities from Tests; BSI British Standards BS EN 60034-4; BSI: London, UK, 2008. [Google Scholar]
- Ortega, A.J.P.; Xu, L. Investigation of effects of asymmetries on the performance of permanent magnet synchronous machines. IEEE Trans. Energy Convers. 2017, 32, 1002–1011. [Google Scholar] [CrossRef]
- Liu, W.; Lipo, T.A. On saliency enhancement of salient pole wound field synchronous machines. In Proceedings of the Energy Conversion Congress and Exposition (ECCE), Milwaukee, WI, USA, 18–22 September 2016; IEEE: Piscataway, NJ, USA, 2016. [Google Scholar]
© 2018 by the authors. Licensee MDPI, Basel, Switzerland. This article is an open access article distributed under the terms and conditions of the Creative Commons Attribution (CC BY) license (http://creativecommons.org/licenses/by/4.0/).


