Piling up or Packaging Policies? An Ex-Post Analysis of Modal Shift in Four Cities


1
International Center for Integrated Assessment and Sustainable Development (ICIS), Maastricht University, 6200 MD Maastricht, The Netherlands
2
Transport Research Unit, Department of Geography and the Human Environment, Tel Aviv University, Tel Aviv 6997801, Israel
*
Authors to whom correspondence should be addressed.
Energies 2018, 11(6), 1400; https://0-doi-org.brum.beds.ac.uk/10.3390/en11061400
Submission received: 31 March 2018
/
Revised: 20 May 2018
/
Accepted: 21 May 2018
/
Published: 30 May 2018
(This article belongs to the Special Issue The Governance of Sustainable Cities and Innovative Transport)
Abstract
:Recently, there has been wider acknowledgement that sustainable urban mobility will not be triggered by one ‘silver bullet’ policy, or by piling up various policies, but requires a deliberate package of policies. Until recently, studies on policy instrument (or measure) interaction have been primarily ex-ante studies, estimating interactions in the future. However, from an evidence-based policy-making perspective, ex-ante evaluations need to use knowledge gained through ex-post evaluations, a crucial link in the policy cycle. To contribute to the strengthening of this poor link, this paper provides an ex-post analysis of instrument interaction in four northwest European, medium-sized cities: Bruges, Ghent, Jena & Erfurt. By exposing the relationships between the range of mobility policies implemented in relation to modal shift achieved, we offer insight into the crucial difference between ‘piling up policies’ and deliberate policy packages. As such, the paper offers evidence to inform ex-ante analysis for urban mobility policy-making and contributes to policy learning as part of effective governance.
1. Introduction
In the last decade in Europe, urban policy makers have implemented a range of policies to promote or facilitate car alternatives, in what is generally referred to as the Sustainable Mobility paradigm [1]. All in all, this has led to a mix of urban transport policies consisting of policies on car transport, public transport, and non-motorised transport, in which the overall consistency of the mix remained underexposed, and did not get enough attention. In some cities the modal share of cars has decreased somewhat, although car mobility often continues to dominate, and the question of how these trends relate to the implemented policy mix has remained understudied. This paper seeks to advance the understanding of this relationship by answering the question: How does the composition of the policy mix relate to the trends in modal shares in urban transport? To answer this question, two Belgian and German medium-sized cities are examined.
Evaluation in the field of transport has traditionally been reserved to specific and large (‘mega’) projects, in most cases applying Cost-Benefit Analysis (CBA) tools ex-ante. In recent years the need to also evaluate ex-post has been acknowledged and researched [2]. Attention to evaluation of specific policy has no real tradition in the field of transport, unless these policies are viewed as a project, and a CBA approach is then applied. The limitations of such an approach, especially the limitations of CBA, resulted in increased use of Multi-Criteria Analysis (MCA) [3], but also this has been largely applied to ‘projects’ and not policies. When attention to policy and projects is given in transport evaluation, it is usually to one specific (‘major’) policy, or ‘policy measure’, to use the term applied here. Congestion Charging is probably one of the most researched examples. Also in this area, the majority of studies have been ex-ante and not ex-post (see [4] for an exception).
To change travel behaviour, and to facilitate a change in mobility practices towards low carbon mobility [5] a host of policy measures need to be considered and implemented. These also require some form of evaluation, both ex-ante and ex-post, as these policies together require a vast amount of resources, and not only financial ones. From an evidence-based policy-making perspective, the use of knowledge gained through ex-post evaluations in ex-ante evaluations is a crucial link in the policy cycle, as such evidence informs policy-making and contributes to policy learning as part of effective governance [6]. In practice however, such a combined evaluation is hardly performed. Instead of evaluating policies, in many cases ‘copying’ transport policies has become widespread. The problems and shortcomings of this approach, especially in transport are now better understood [7].
A few scholars have started to address the need for a systematic assessment of policies, ex-post, with respect to cycling (see [8] in particular), public transport and model shift more generally [9]. These have focused more on the national level and the larger cities, where data is more readily available and there is a longer tradition of deliberate transport planning processes. In this paper we intentionally focusing on medium-size European cities where the context for policy making and research is different.
Recently, there has been a wider acknowledgement that a modal shift will not be triggered by one ‘silver bullet’ policy, or by piling up various policies, but requires a deliberate integration, i.e., a packaging of policies. Both policy packages and mixes (we will use both terms interchangeably) have received increasing attention over the last five years, albeit in different scientific fields. Policy packages are a notion developed in the field transport studies [10,11,12] and recently adopted in land use policy [13,14], whereas analysis of policy mixes emerged in innovation and policy studies [15,16,17,18]. The concept and methodology of “policy packaging” has so far been applied ex-ante. Yet, it is critical, as noted above, to apply it ex-post to inform of not only the policy content, including the actual mix of policies, but also the further development of the methodology.
As we will discuss in Section 3, policy measure interaction (or (policy) instrument interaction, which we will use interchangeably in this paper) is a key element of the policy mix concept that to date has received little or no attention in both ex-ante and ex-post analysis (none to our knowledge in the latter). Based mainly on an analysis of policy reports, we describe for each of the four examined cities the changes in the policy mix over a certain period of time and the changes that took place in modal shares in that city in order to try and find evidence for a link between the two. In the analysis we pay particular emphasis to the “package” characteristics of the policies implemented in each city and the importance of these in the observed modal share changes.
The paper is structured as follows. After introducing our conceptualisation of urban transport practice and policy in Section 2, we describe our method of policy package analysis in Section 3. Section 4 offers an overview and identification of the policies in the four cities, while Section 5 analyses the policy changes from a policy package perspective. Section 6 concludes and notes policy implications.
2. Urban Mobility and Transport Policy
Urban residents, commuters and visitors engage in a range of mobility practices, requiring different means and forms of transport, such as by car, by public transport, by bike or by foot. In terms of sustainability, car mobility is generally seen as less sustainable than walking, cycling and high occupancy public transport (including trains, buses, trams, metro systems), with regard to the emission of local air pollutants and CO2, the use of scarce urban space, congestion issues, etc. [19].
After 2000, attention focused on climate change has affected mobility policies, which often adopted sustainable development as a guiding principle, but have been ambiguous and inconsistent in terms of implementation and effects [20]. Many urban areas in Europe on the one hand show the introduction of mobility management initiatives such as Park and Ride (henceforth P + R) facilities to stimulate car drivers to switch to public transport, but on the other hand also show the improvement of parking infrastructures in city centres, which enabled car mobility to remain the most attractive option in many cases [21]. In recent years, the health implications of sedentary lifestyle, very much associated with high car reliance, even dependency, became apparent and a has become concern for policy makers [22].
Individual travel behaviour is the result of a complex interaction between a myriad of factors that has attracted a vast amount of research within mobility and transport studies. Travel behaviour is the outcome of multiple different decisions on ‘if to travel’, ‘where to travel’ and ‘how much to travel’. From a sustainability perspective, especially that of sustainable urban transport, the most important decision is likely the choice of mode of transport. Recent literature reviews on the subject reveal how complex these decisions could be. Hoffmann et al. [23] for example identifies 26 cognitive mechanisms (and over 205 size effects) that have been related to car use and the use of alternative transport modes, where each could be potentially modifiable. McCarthy et al. [24] review how decisions on travel mode choice are different, and likely more ‘complex’ when travelling as a family rather than as individuals. Technological developments, such as the use of Information and Communication Technologies (e.g., Mobile phones) also affect travel behaviour and the mode of transport choice by making the trips themselves more ‘informal’, as defined and examined by Salomon and Singer [25]. Yet, travel behaviour research has also demonstrated that the main factor determining behaviour, such as the daily choice of mode, is the previous decision made on that matter. In other words, habit has been recognised as a powerful travel behaviour factor [26], which means that once people lock into a certain behaviour, such as relying on the private car, it is difficult to change this practice.
‘Policy’ or ‘Policy making’ are terms used to denote organised, purposeful actions intended to change behavior and they themselves are known to be complex processes requiring and involving a range of stakeholders over, usually, a relatively long period of time (see for example [27,28]. Policy is one of the main forms of governance, which is conceptualised by Hill and Hupe [29] through authority, transaction and persuasion.
To advance towards a (more) sustainable urban transport and mobility, travel behavior must change, in particular the choice of mode of transportation. At the city level, a change in the share of trips made by car compared to the combined trips made by walking, cycling and public transport is needed, in particular by decreasing the use of the car [5]. Transport policy and policy making is the key mechanism through which such a change is facilitated by transport’s governing institutions.
Urban transport policy should and usually does consist of a complex mix of policies. These single policy actions (that we term ‘policy measures’) are typically directed at (changing) one particular element of the (mobility and transport) system. A distinction can be made between policy measures that are directed at the use (or non-use) of particular mode of transport
- -
- on car transport; this may involve the creation of car free areas or low speed zones, building a new road, or extend underground parking, etc.
- -
- policies on public transport, which may consist of the extension of bus or tram lines, and
- -
- policies on non-motorised transport, such as the creation of separate cycling lanes, or prioritising pedestrians at road crossings.
Apart from grouping policy measures according to the mode of transport, they can also be grouped according to type of power applied. As discussed in Givoni et al. [10] (p. 6) Etzioni [30] (p. 5) argues that “authoritative power may take three distinct forms: (1) coercive power, resting on the application of physical sanctions, or threat thereof; (2) remunerative power, resting on the control of resource allocation; and (3) normative power, reliant on persuasion, manipulation and suggestion. Depending on the corresponding power underlying their function, Vedung [31] classified measures as regulatory measures (coercive), economic measures (remunerative) and informative measures (normative)”.
From the perspective of modal shift (with decreasing share of car mobility) another important distinction can be made: Between push- and pull effect of policy measures. Along these lines we refer to a push effect of policies simply as: Policies that ‘push’ travellers away from car use (such as higher parking tariffs). While we refer to a pull effect of policies as: Policies that ‘pull’ travellers to car alternatives (such as those improving public transport and non-motorised modes).
3. Methodology
3.1. From Single Policy to Policy Package Analysis
From the perspective of modal shift, the combination of push and pull effects is relevant for understanding how the number of car kilometres in the city is reduced and whether people opted for more sustainable means of transport, such as public transport, cycling and walking.
We hypothesise that the more these mixes represent a consistent policy package, rather than just a list of measures, the stronger their effect on modal shift. With a ‘consistent policy package’ we mean a package in which instruments interact primarily in a synergetic or facilitative way whilst contradictory effects are minimal. More specifically, this paper hypothesises that the more these mixes are consistently combining car constraining (‘push’) measures with (‘pull’) policies that promote car alternatives, the more the modal share will shift away from car mobility. Similarly, we expect that the more there is a combination of policy measures of Regulatory, Economic and Informative natures, the larger the mode shift would be. To test these hypotheses, the composition of the urban mobility policy mixes is evaluated first against the criteria for a list of policy measures to be considered a ‘package’. This composition is then qualitatively correlated or associated with data of modal shares in the cities examined.
Much of the early energy and transport literature on climate change focused on discussions about specific instruments suitable for internalising negative externalities arising from greenhouse gas emissions, but increasingly it has been recognised that a multiplicity of instruments is needed to foster successful transitions [18].
The rationale for a policy package or mix perspective is that policies do not work in isolation, i.e., their performance depends on the situation at implementation (‘policy context’), their interaction with existing measures, and with measures implemented simultaneously or at a later time. From this perspective, significant attention is placed on relations between policies to understand the effect of the overall mix. As Rogge & Reichardt [17] observe, “at the heart of the concept of instrument mixes are interactions between the instruments, which signify that the influence of one policy instrument is modified by the co-existence of other (instruments) [32]. This influence originates from the direct or indirect effect that the operation or outcomes of instruments have on each other [33,34]. Clearly, these interdependencies of instruments largely influence the combined effect of the instrument mix and thus the achievement of policy objectives [15]”. Therefore, interactions of policy instruments are a central element of any policy mix concept.
Thus far, interactions have been predominantly dealt with in the field of transport studies [10,11,12], and in the environmental domain, particularly on climate and energy issues [34,35,36]. More recently, innovation studies have also started to highlight interactions [15,32,37]. These studies acknowledge the need to avoid negative interactions and to strive for positive or complementary interaction outcomes. Nevertheless, recent empirical studies on interactions are primarily ex-ante studies [38,39,40,41], about possible and expected interactions and related design issues, but hardly ex-post evaluations. This paper seeks to contribute to this body of research with an ex-post evaluation by highlighting the interactions between a range of policy instruments related to urban car mobility.
We use the types of policy interactions of Givoni et al. [10] and Taeihagh et al. [11] to analyse the interaction effects of policy instruments in the four cities to draw recommendations about effective policy mixes to decrease car mobility. These authors identify five different ways how policy measures can interact with each other in a policy mix. On opposing ends are synergies and contradictions. In the latter, policy measures work against each other, nullifying their effect or even leading to an outcome worse than the situation before the implementation of the measures. The opposite occurs with a synergy: two or more measures positively influence and reinforce each other, resulting in a situation which is an improvement to the original situation, and leading to continued improvement. In the case of a neutral relationship policies do not affect each other to a significant degree. The other two types are preconditions and facilitating measures. In the first, the functioning of one measure fully depends on the implementation of another measure. In case of facilitating measures, both will work regardless of implementation of the other, but at least one will work better with the implementation of the other (ibid.).
Assessing the effectiveness of policy (instrument or mix) assumes an objective policy goal, but as our study shows, the four cities did not have explicit target modal shares, but a set of fragmented goals (e.g., improve public transport, decrease congestion problems, etc.). Therefore, our indication of policy effectiveness in the four cities takes a relative approach, taking the modal share of car transport as the benchmark, and, hence, it does not necessarily indicate the effectiveness of a particular urban government (in sense of their performance).
3.2. Ex-Post Empirical Analysis
The method for our analysis consists of three main steps. Based on an analysis of policy reports from each of the four city governments, we describe the mix of policies implemented during or before the period 2000–2010. In this first step of policy report analysis, we answer the question: what are the types of policies that directly affect urban transport mode choice and share? As we will show below, this analysis delivered the following grouping of these policies:
- -
- Car policies
- -
- Public transport (PT) policies
- -
- Policies on non-motorised transport
It is important to note that unlike with ex-ante policy analysis, where specific measures can be defined and selected for analysis, with ex-post it is very difficult to determine when a policy measure has been fully implemented and to precisely define its nature (spatial scale, intensity, and change over time).
Second, we analyse the composition of policies, or policy measures, including (1) push vs. pull measures and their intensiveness; (2) the type of measure and whether of Regulatory, Economic or Informative nature; and (3) the type of relationship between them (i.e., synergetic, contradictory, facilitative, pre-conditional or neutral).
Third, by associating this with the modal share data, we seek to understand how the policies introduced in the 2000–2010 period affect the modal share and subsequently draw conclusions on what is an effective policy mix for triggering modal shift towards car alternatives. To reinforce our analysis, we have asked local civil servants in the four cities to reflect on it. We did this by contacting the head of the mobility department by telephone and email, who then forwarded the request to the suitable person (i.e., one knowledgeable on the period of study) who then contacted us (also in association with the head of the department).
Although we do not perform quantitative effect & efficiency analysis in a statistical sense, we believe that the qualitative analysis combined with reflections of civil servants add a different kind of soundness to the study. As Kivimaa et al. [42] note: quantitative evaluations on policy mixes are typically unable to capture policy mixes involving non-economic instruments and, thus, the potential or actual effects of policy mixes on transitions comprehensively. Thus, they conclude, there is a need to explore methods to evaluate broader policy mixes that can better capture the interactive effects that characterise complex policy systems. Our qualitative approach follows this suggestion, although, it should also be noted that our conclusions must be read in view of the high complexity of the mobility context in which these policies operate.
3.3. Four Cities
We selected the four European cities based on a number of criteria. First, we chose medium-sized cities, because a large number of European citizens live in medium-sized cities [43]. Europe is characterized by a less concentrated urban structure compared to, for instance, the United States or China. In the EU, there are only 23 cities of more than 1 million inhabitants but 345 cities of more than 100,000 inhabitants. A large part of the urban population lives in medium-sized cities spread across the continent (see [43]) and most of the attention of research and practice is often devoted to the larger cities (e.g., [9]). With all four situated within the EU, we ensured that, although national context may differ, similar supranational policy pressures are placed upon them. Second, we chose cities that managed to achieve a modal shift towards car alternatives, because from these cities there are the most lessons to learn in terms of governance towards sustainable cities and innovative transport (which is the topic of this Special Issue). A third more practical criteria was that policy reports would be available in languages understandable to the authors, and that the four cities all had data on modal share changes. The fact that we’re limited to German and Belgium cities means that conclusions are especially valid for a northwestern European context. Still, we would argue that the essence of our argument holds beyond this particular area.
4. Modal Share and Policy Measures Implemented in the Four Cities
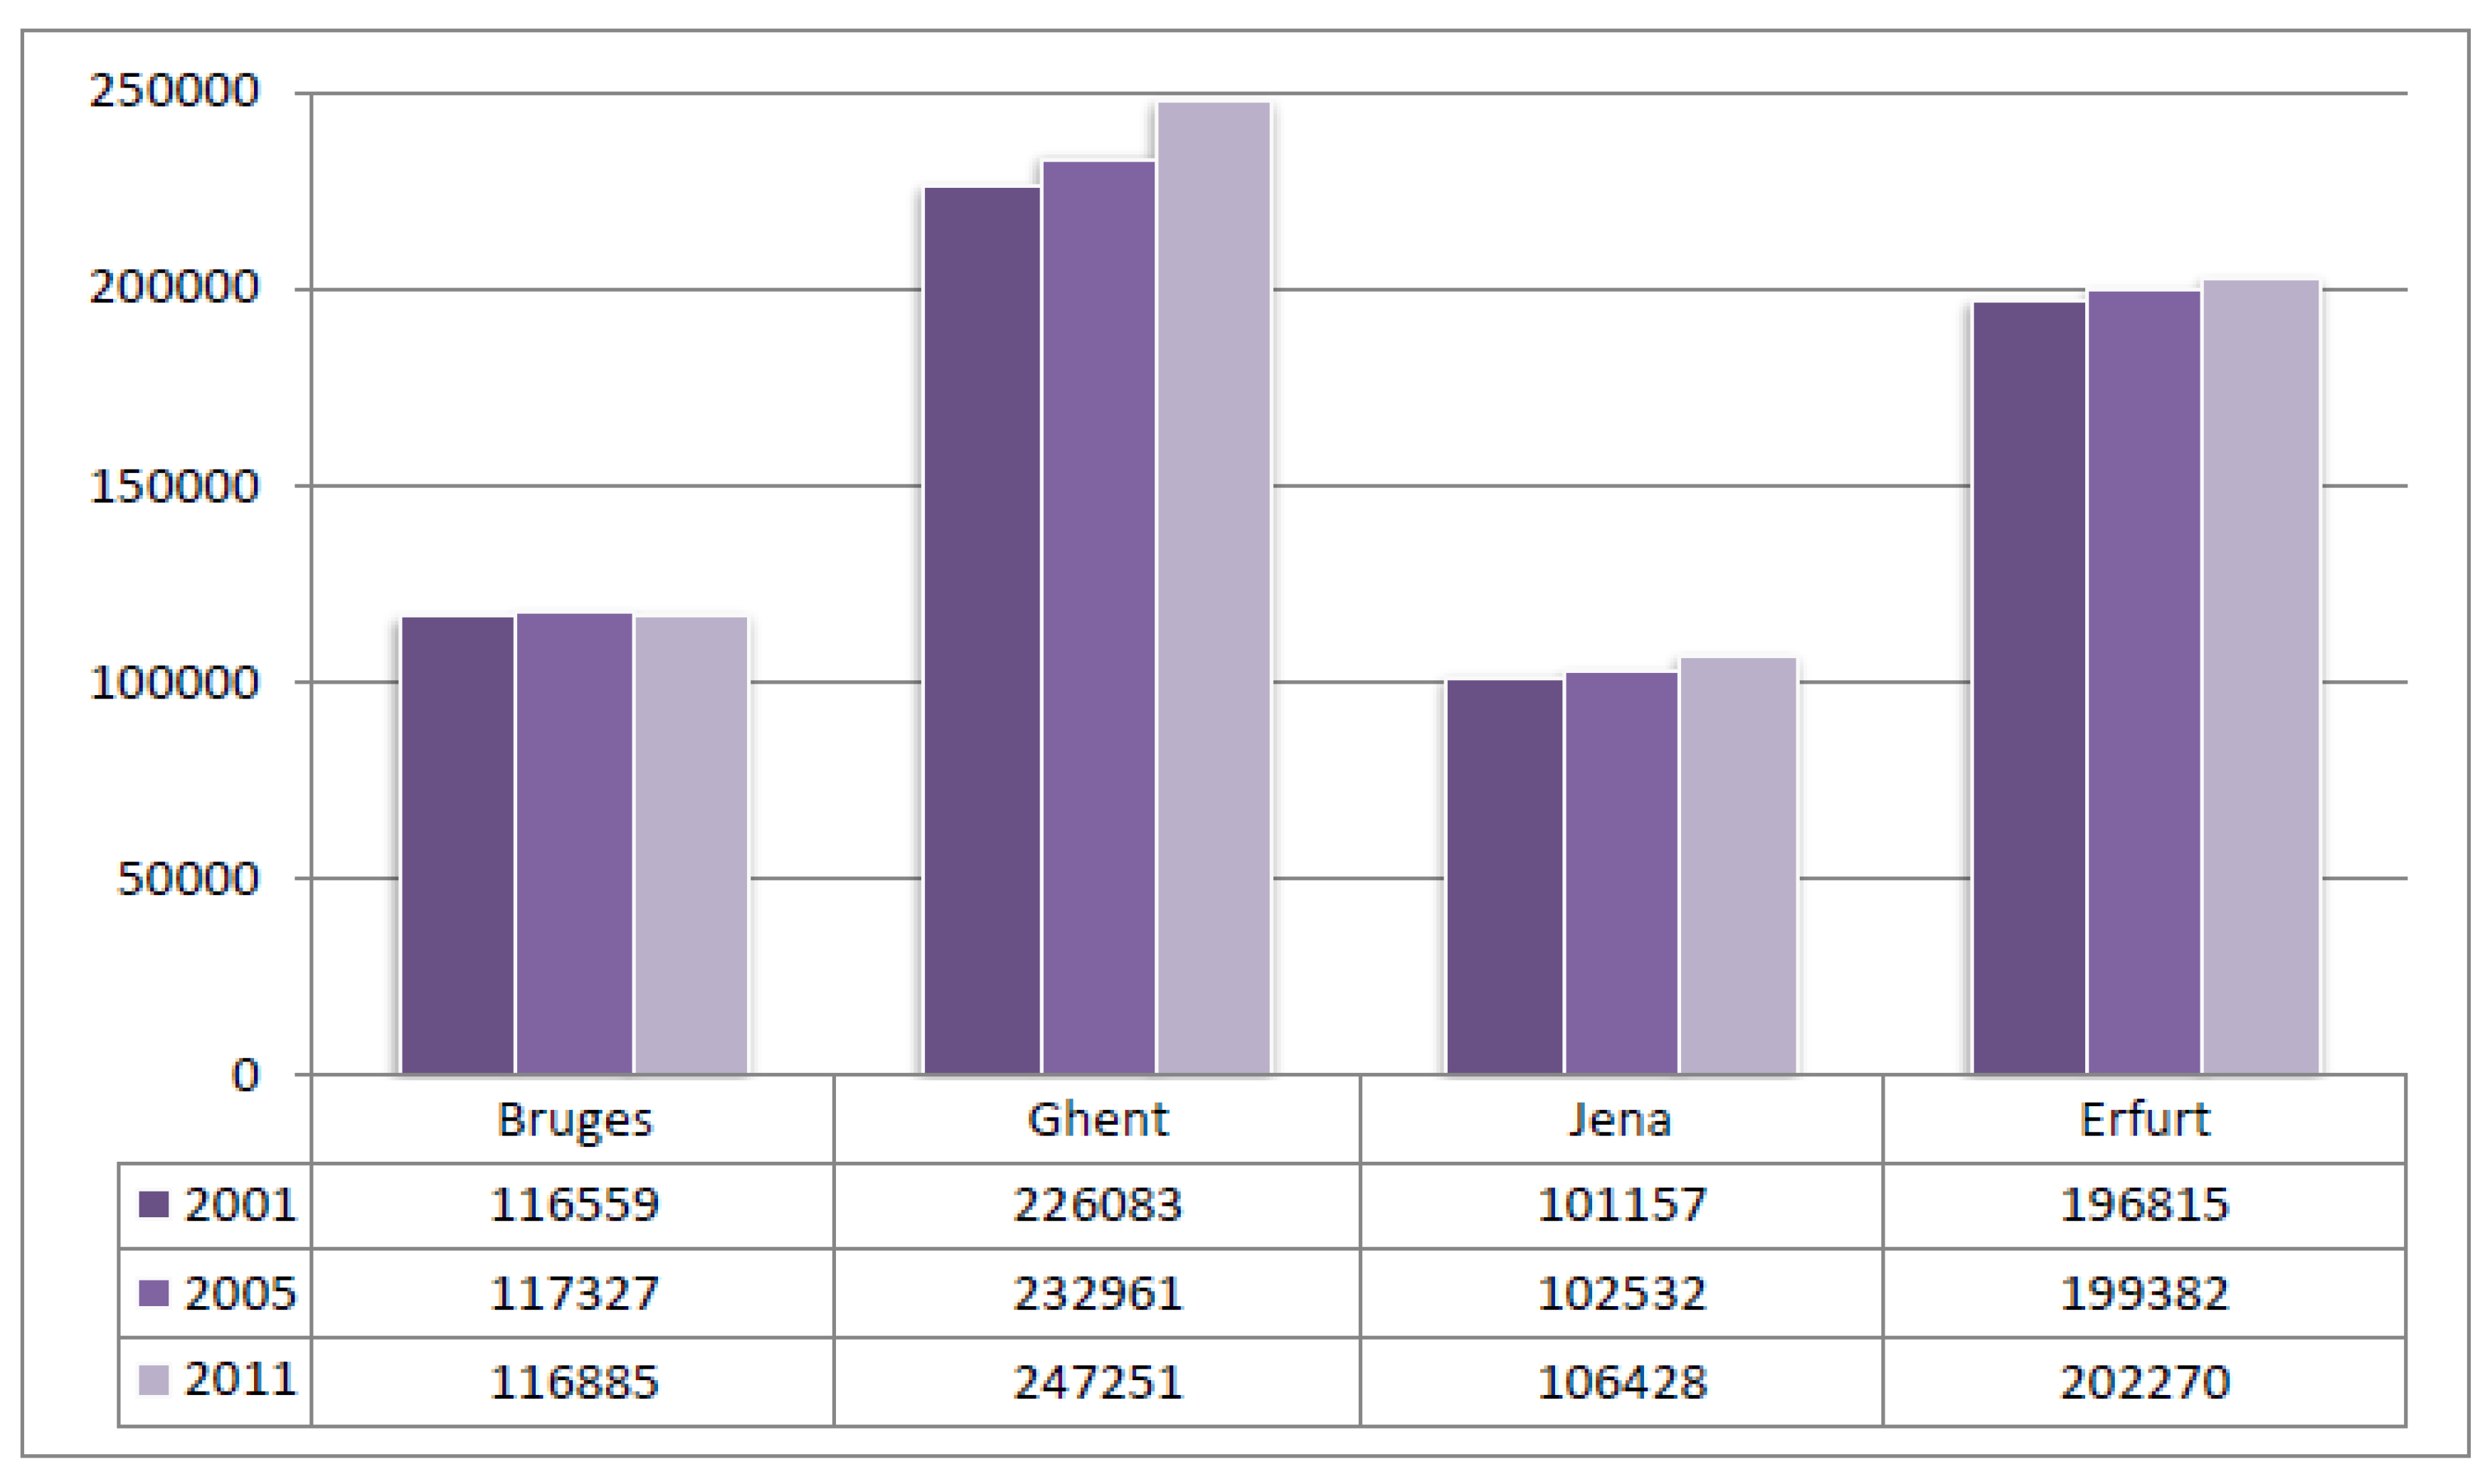
The four cities are all medium-sized cities with populations between 100,000 and 250,000, see Figure 1, and their population size was roughly stable in the period of examination. Ghent and Erfurt are roughly of the same size, as are Bruges and Jena.
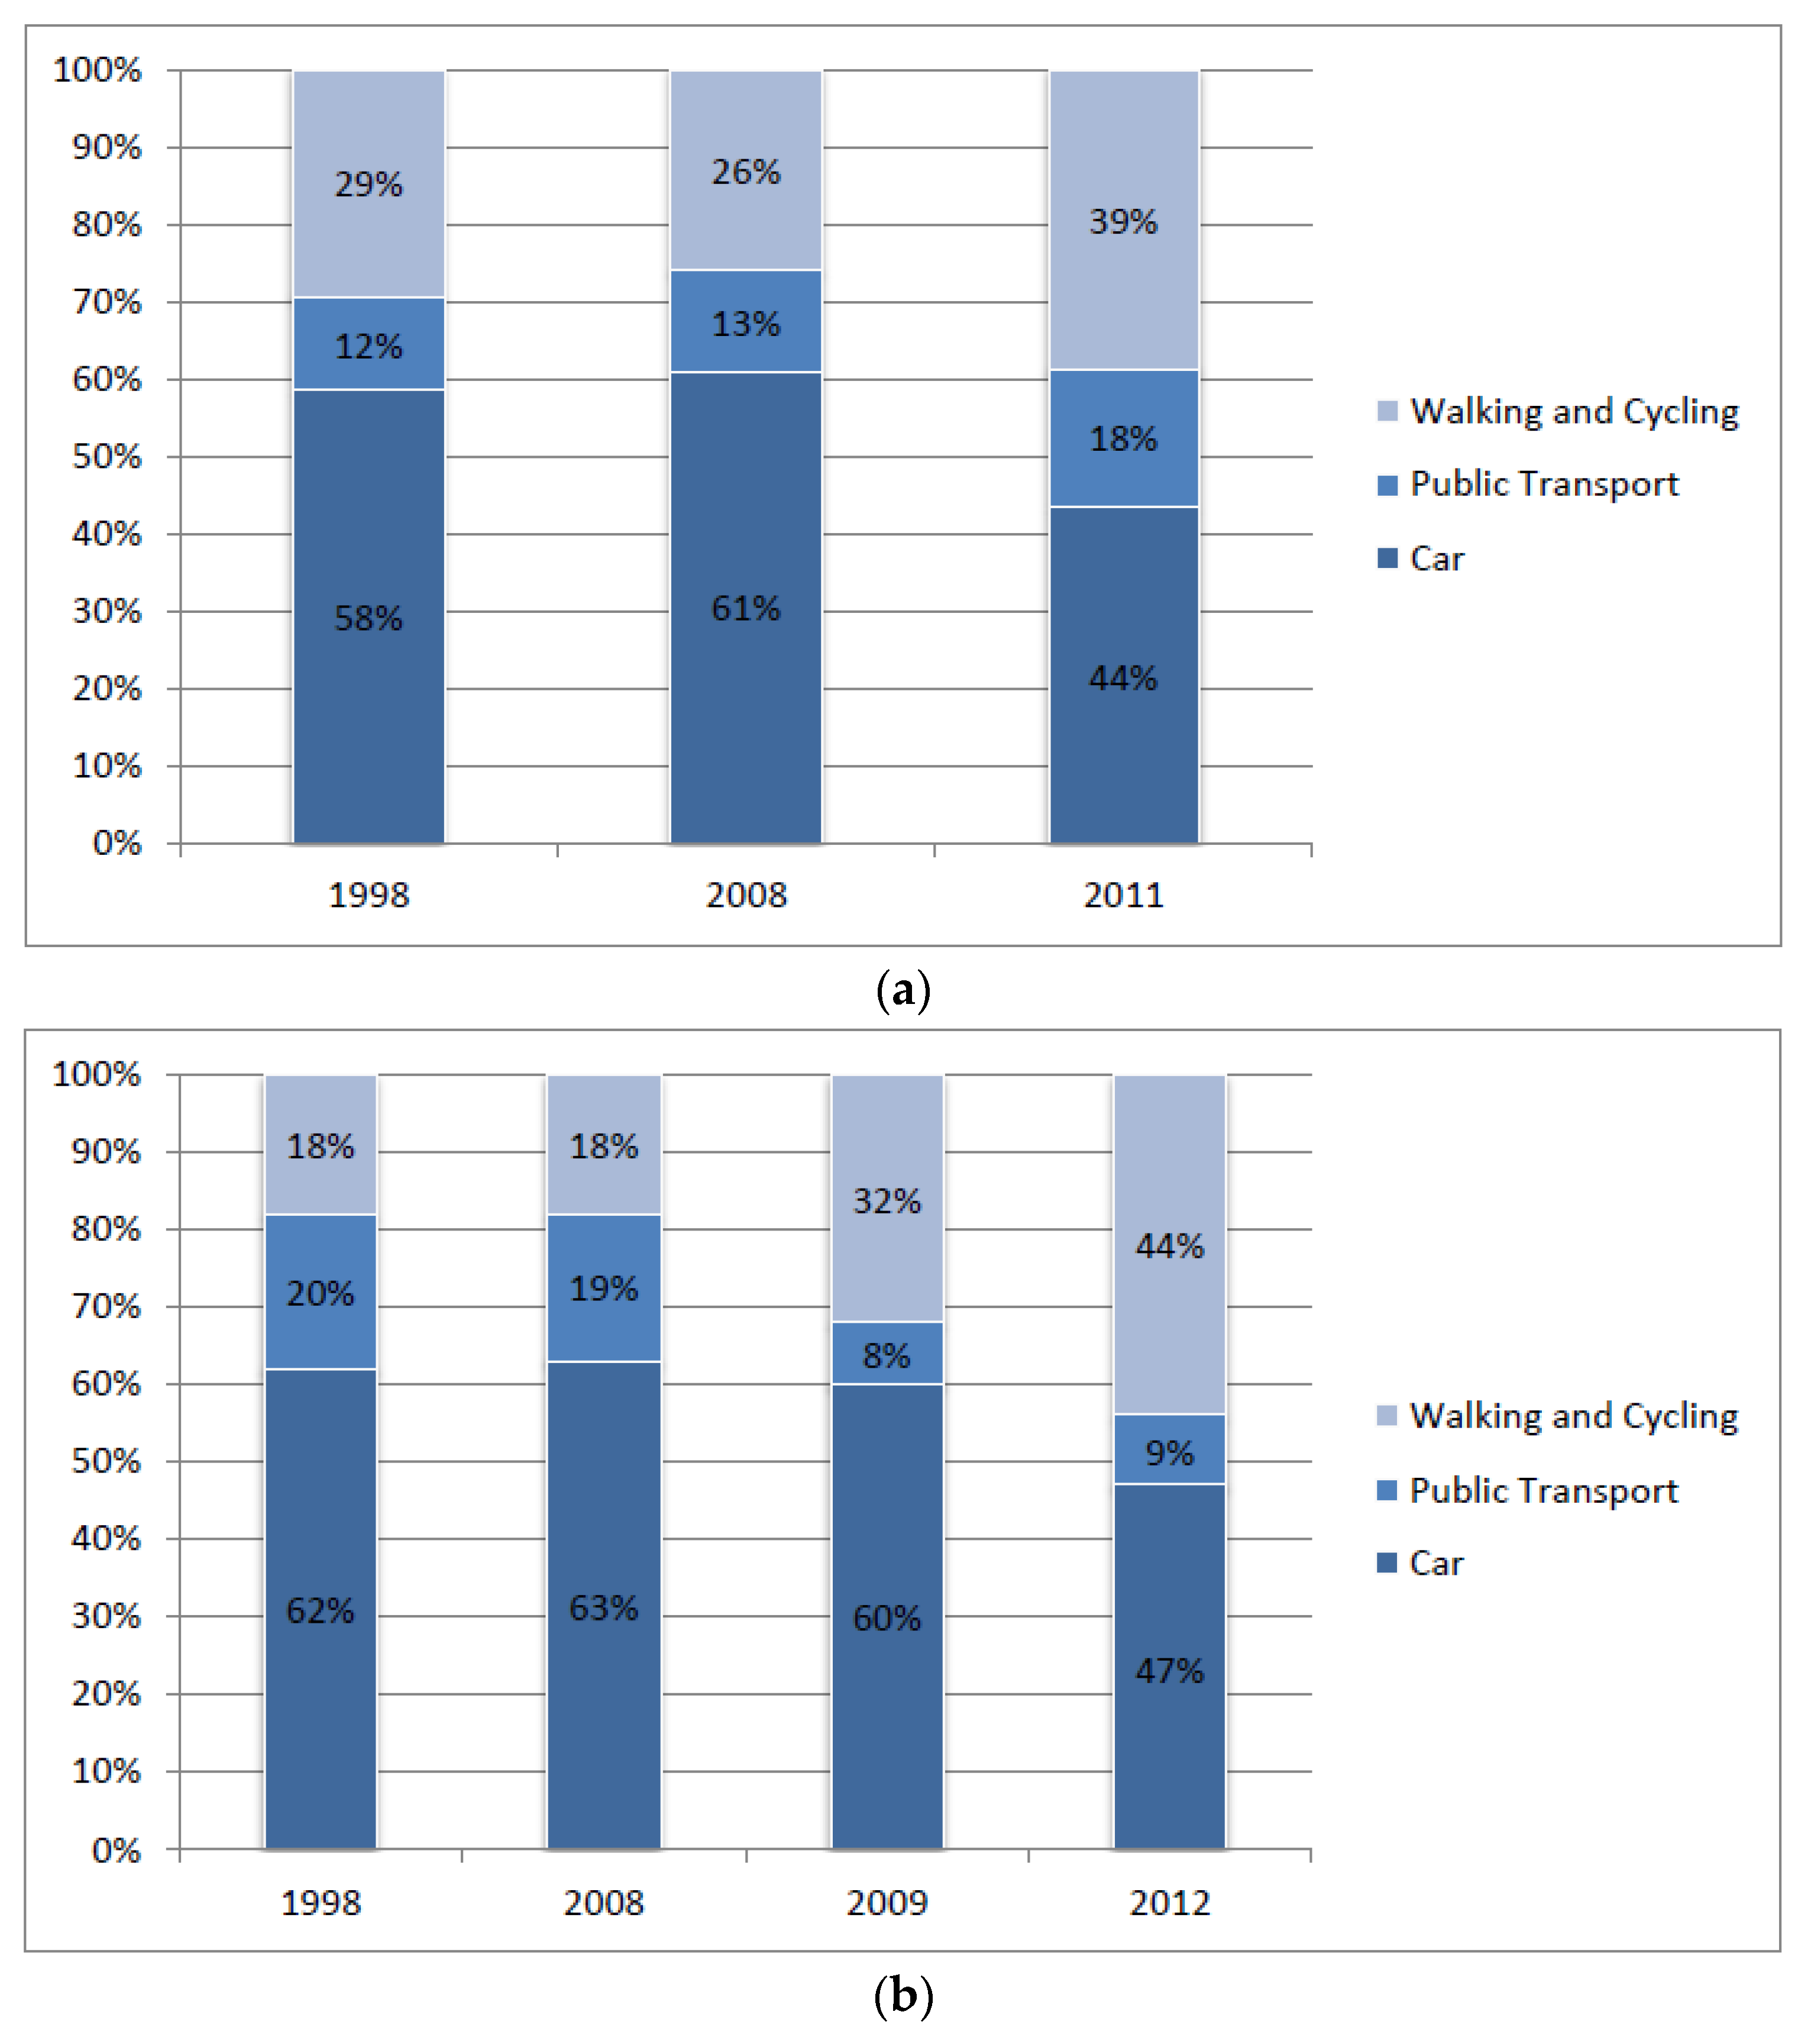
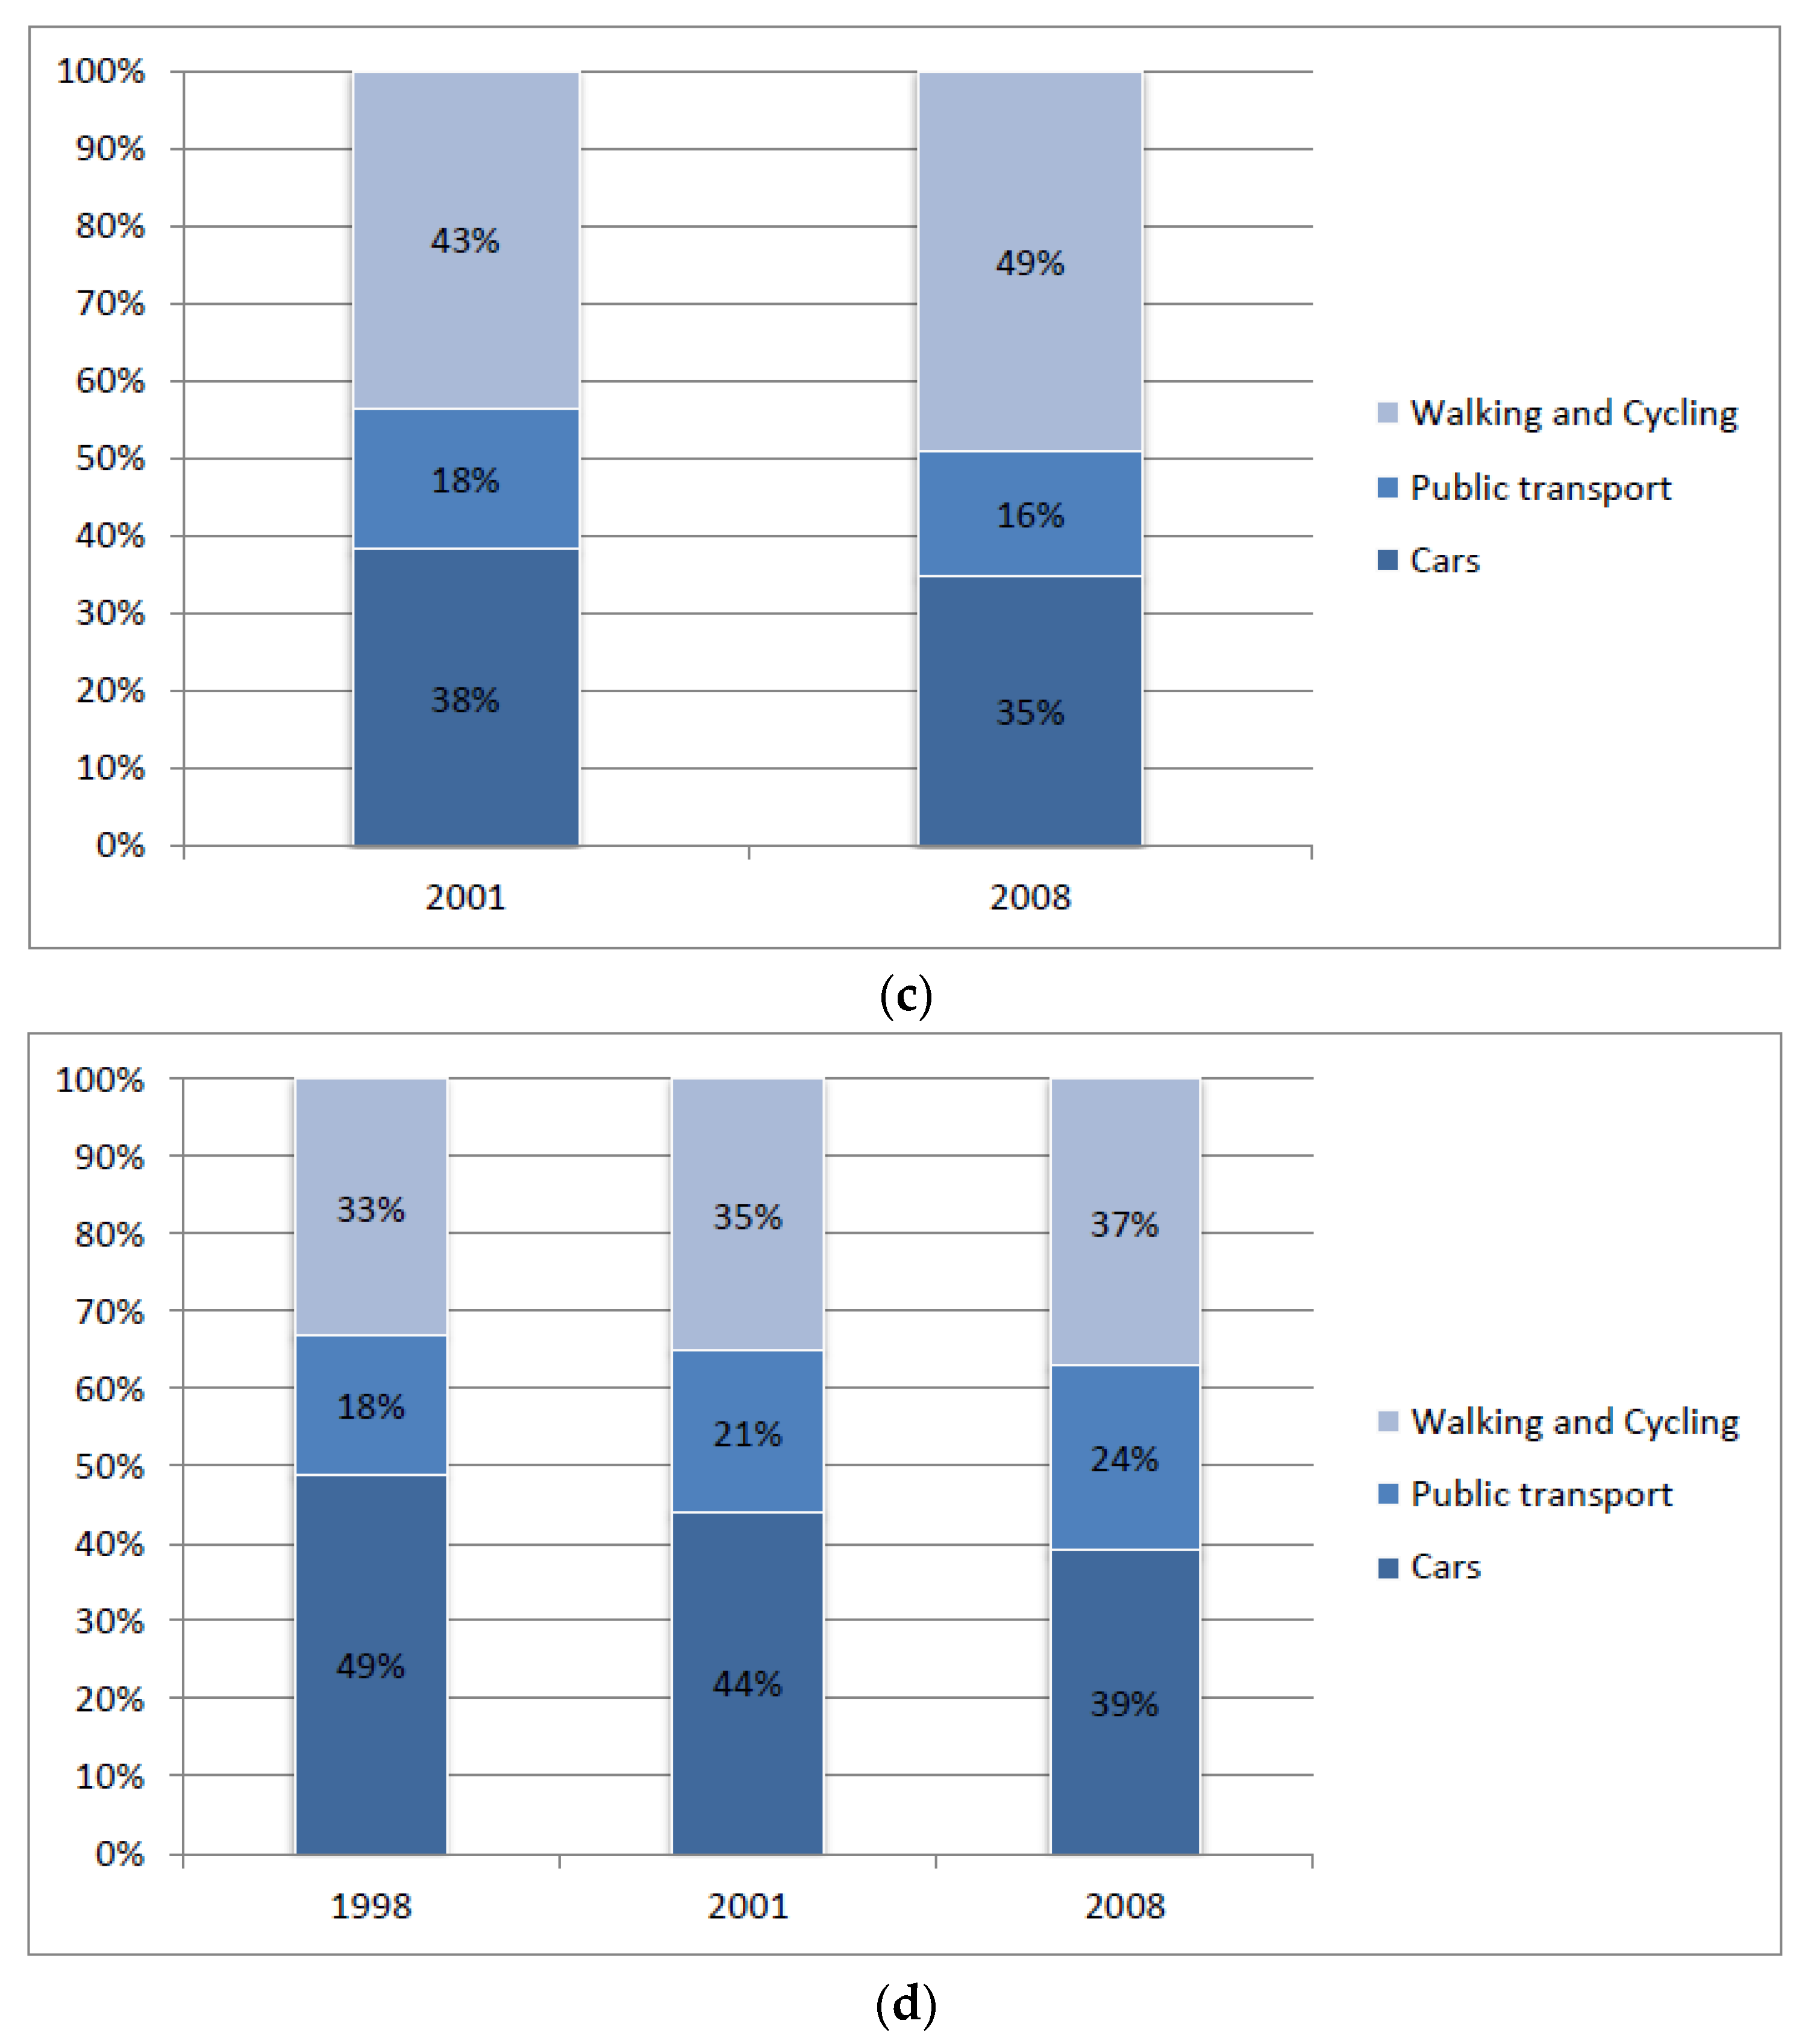
The modal split data for the four cities in the period of examination is showed in Figure 2a–d. In a European perspective, it should be noted that, with respect to the level of car reliance, the cities are about or slightly below average, yet still requiring change given the recognition of the adverse effects of car dependency and sedentary lifestyles (e.g., [20]). In the UK, which is considered a car dependent country, the share of car trips in urban areas outside London stood at 59% in 2006, while that of public transport and walking & cycling stood at 12% and 29% respectively [49]. In contrast, in some ‘leading’ European cities the share of car trips was significantly smaller. It was 42% in Hamburg (2008), 33% in Munich (2011), 30% in both Berlin (2013) and Zurich (2010) and as low as 27% in Vienna (2012), with the share of public transport trips in these cities ranging between 18% in Hamburg (2008) and 39% in Vienna (2012) [9].
Over the period examined, all cities have succeeded in reducing the share of car trips made, albeit in Jena this should be considered as only marginal. At the same time, the share of public transport and non-motorised transport has increased. In both Bruges and Ghent, the reduction in the share of car trips has been substantial but with a marked difference. In Bruges, both the share of active modes and public transport increased while in Ghent a marked increase in walking and cycling of 26% has been observed, partially the result of an 11% reduction in the share of public transport. In Erfurt the same picture as in Bruges is observed, but the changes are relatively minor in comparison (6% and 4% increase in the share of public transport and walking & cycling trips respectively). In Jena, the pattern of change resembles that of Ghent, but it is very small—6% increase in walking & cycling alongside 2% and 3% reductions in public transport and car trips respectively (subject to rounding). Yet, this has happened over a much shorter period of time (2001–2008 only). It should also be noted that while the Belgian cities achieved a greater change over time, the modal share of car mobility in absolute terms is lower in both of the German cities.
We turn now to describe the list of policy measures implemented at the time the changes in modal shift noted above took place. Table 1 summarises the policy measures enacted in each of the cities and provides a categorisation of the measures in terms of the mode they target, the division between pull/push measures, and whether the measures are of regulatory, economic or inventory type.
Overall, it is clear that there are relatively small differences between the cities in terms of the implemented policies. It can be assumed that all cities considered, and to a large extent implemented, what might be expected at the time and considered to contribute to sustainable transport. It is important to note that as such none of the cities declared a clear (numerical) policy objective in the form of achieving a pre-defined change in modal share. We return to this point in the conclusions.
The same 12 measures, overall, were implemented in all of the cities, with an additional 5 measures implemented in at least three of the four cities. Excluding ‘Park and Walk’, which was only implemented in Bruges and might be considered a parking measure, only three measures might be considered ‘unique’ as they were implemented in only two of the four cities, each measure targeting a different mode (namely: ring road, bus lane, and non-physical cycling support). A relatively similar mix between car, public transport and walking & cycling measures can be noticed in all cities. Jena stands out as a city that was active in implementing car policies, but was less so when it came to public transport and walking & cycling.
With respect to the measure characteristic, a balance is seen between Economic measures that provide resources to support a certain travel behaviour, like cycling in the case of ‘cycling lanes’ and Regulatory measures that aim to restrict or force certain behaviour. A notable absent is that of Informative measures that simply aim to encourage change in travel behaviour, for example, by announcing the measures implemented and the benefits of changing behaviour.
Implementing new policy measures is not the only action policy makers can take. An important policy tool is also to remove policies that were implemented in the past and/or to change policy measures that were already implemented. Table 2 takes stock of the changes made to policy measures that were implemented over the period of examination.
5. Analysis of the Policy Changes
Before analysing the implemented policies from a policy package perspective, we contacted the heads of the mobility departments in the four cities to confirm that we had indeed identified all implemented policy measures through our analysis of policy documents. From the list of 21 policy measures in Table 1, Bruges confirmed our list was complete, while the other three pointed at two corrections each, which we processed in Table 1. This was a way of validating our data.
5.1. Policy Packaging Characteristics
Despite the relatively large similarities in the list of policy measures that were implemented in each city, there are differences in the level of modal shifts that took place over the period examined across the cities. While it is not possible to show a clear link between the adjustments of policies and the change in mode shares in terms of sheer causality, it is possible to comment on the likely relation and examine this from a ‘policy package’ perspective.
There is a balanced share of Economic and Regulatory measures in each city, and of push and pull measures. Yet, it is clear that no use has been recorded of using informative measures (The Parking information system (PRIS) measure, indicating the number of free spaces in the garages to motorist driving at the ring roads, is a very specific Informative measure). Since this applies to all cities it is not possible to comment on the effect informative measures could have had on modal share changes. Usually, these measures, while not having a large effect on their own, are considered to exert large effects overall through their facilitation of other (Economic and Regulatory) measures.
Based on the push/pull effect identified for the individual measures (see Table 1: 7 × push & 3 × pull for car transport measures; 5 × pull for walking & cycling measures; and 3 × pull & 1 × push for public transport measures), we can also qualify the relations between types of policies according to targeted mode:
- -
- Between car transport policies and walking & cycling policies: This is primarily synergetic because 12 of the 15 measures (80%) help each other to constrain car use and promote walking and cycling (These numbers are of course based on a simple counting of measures (i.e., the 7 pushing from car transport with the 5 pulling to W & C, add to 12 on a total of 15 of the two groups. Clearly, this does not necessarily reflect the impact or intensity of the measure (which will be addressed in Section 5.2)). For instance, in all cities there were many streets with only one-way driving allowed and with limits on the maximum speed, while allowing cycling to go both ways on those streets. There is also a small contradictory effect because 3 of 15 measures promote car use. Providing underground parking and on street parking contradicts all the other measures aimed at pushing travellers away from car travel and those measures aiming at pulling them to walking and cycling. Similarly, a ring road around the city, which was likely designed to ‘take’ traffic away from the city, is likely resulted at the end in encouraging car travel (the measure ‘inner ring road’ is different due to the speed restriction).
- -
- Between car transport policies (7 × push; 3 × pull) and public transport (PT) policy (3 × pull; 1 × push): this is primarily synergetic, because 10 of 14 measures (70%) help each other to constrain car use and promote PT. There are also some contradictory effects because 4 of 14 measures promote car use and constraint PT.
- -
- Between public transport policy and walking & cycling policies: Ironically, these policies are contradictory, since each type mainly ‘pulls’ to its mode (8 of 9 measures). An attractive cycling network will reduce the effectiveness of an attractive PT network (because a share of travellers will cycle and not use PT). Nevertheless, a safe pedestrian network does facilitate the effectiveness of public transport policies, with regard to the last part of the PT journey typically involving some walking.
The subsequent question is to what extent these characteristics changed by adding, removing or adjusting measures, and this is what we turn to discuss now.
5.2. Changing Policy Measure Intensity
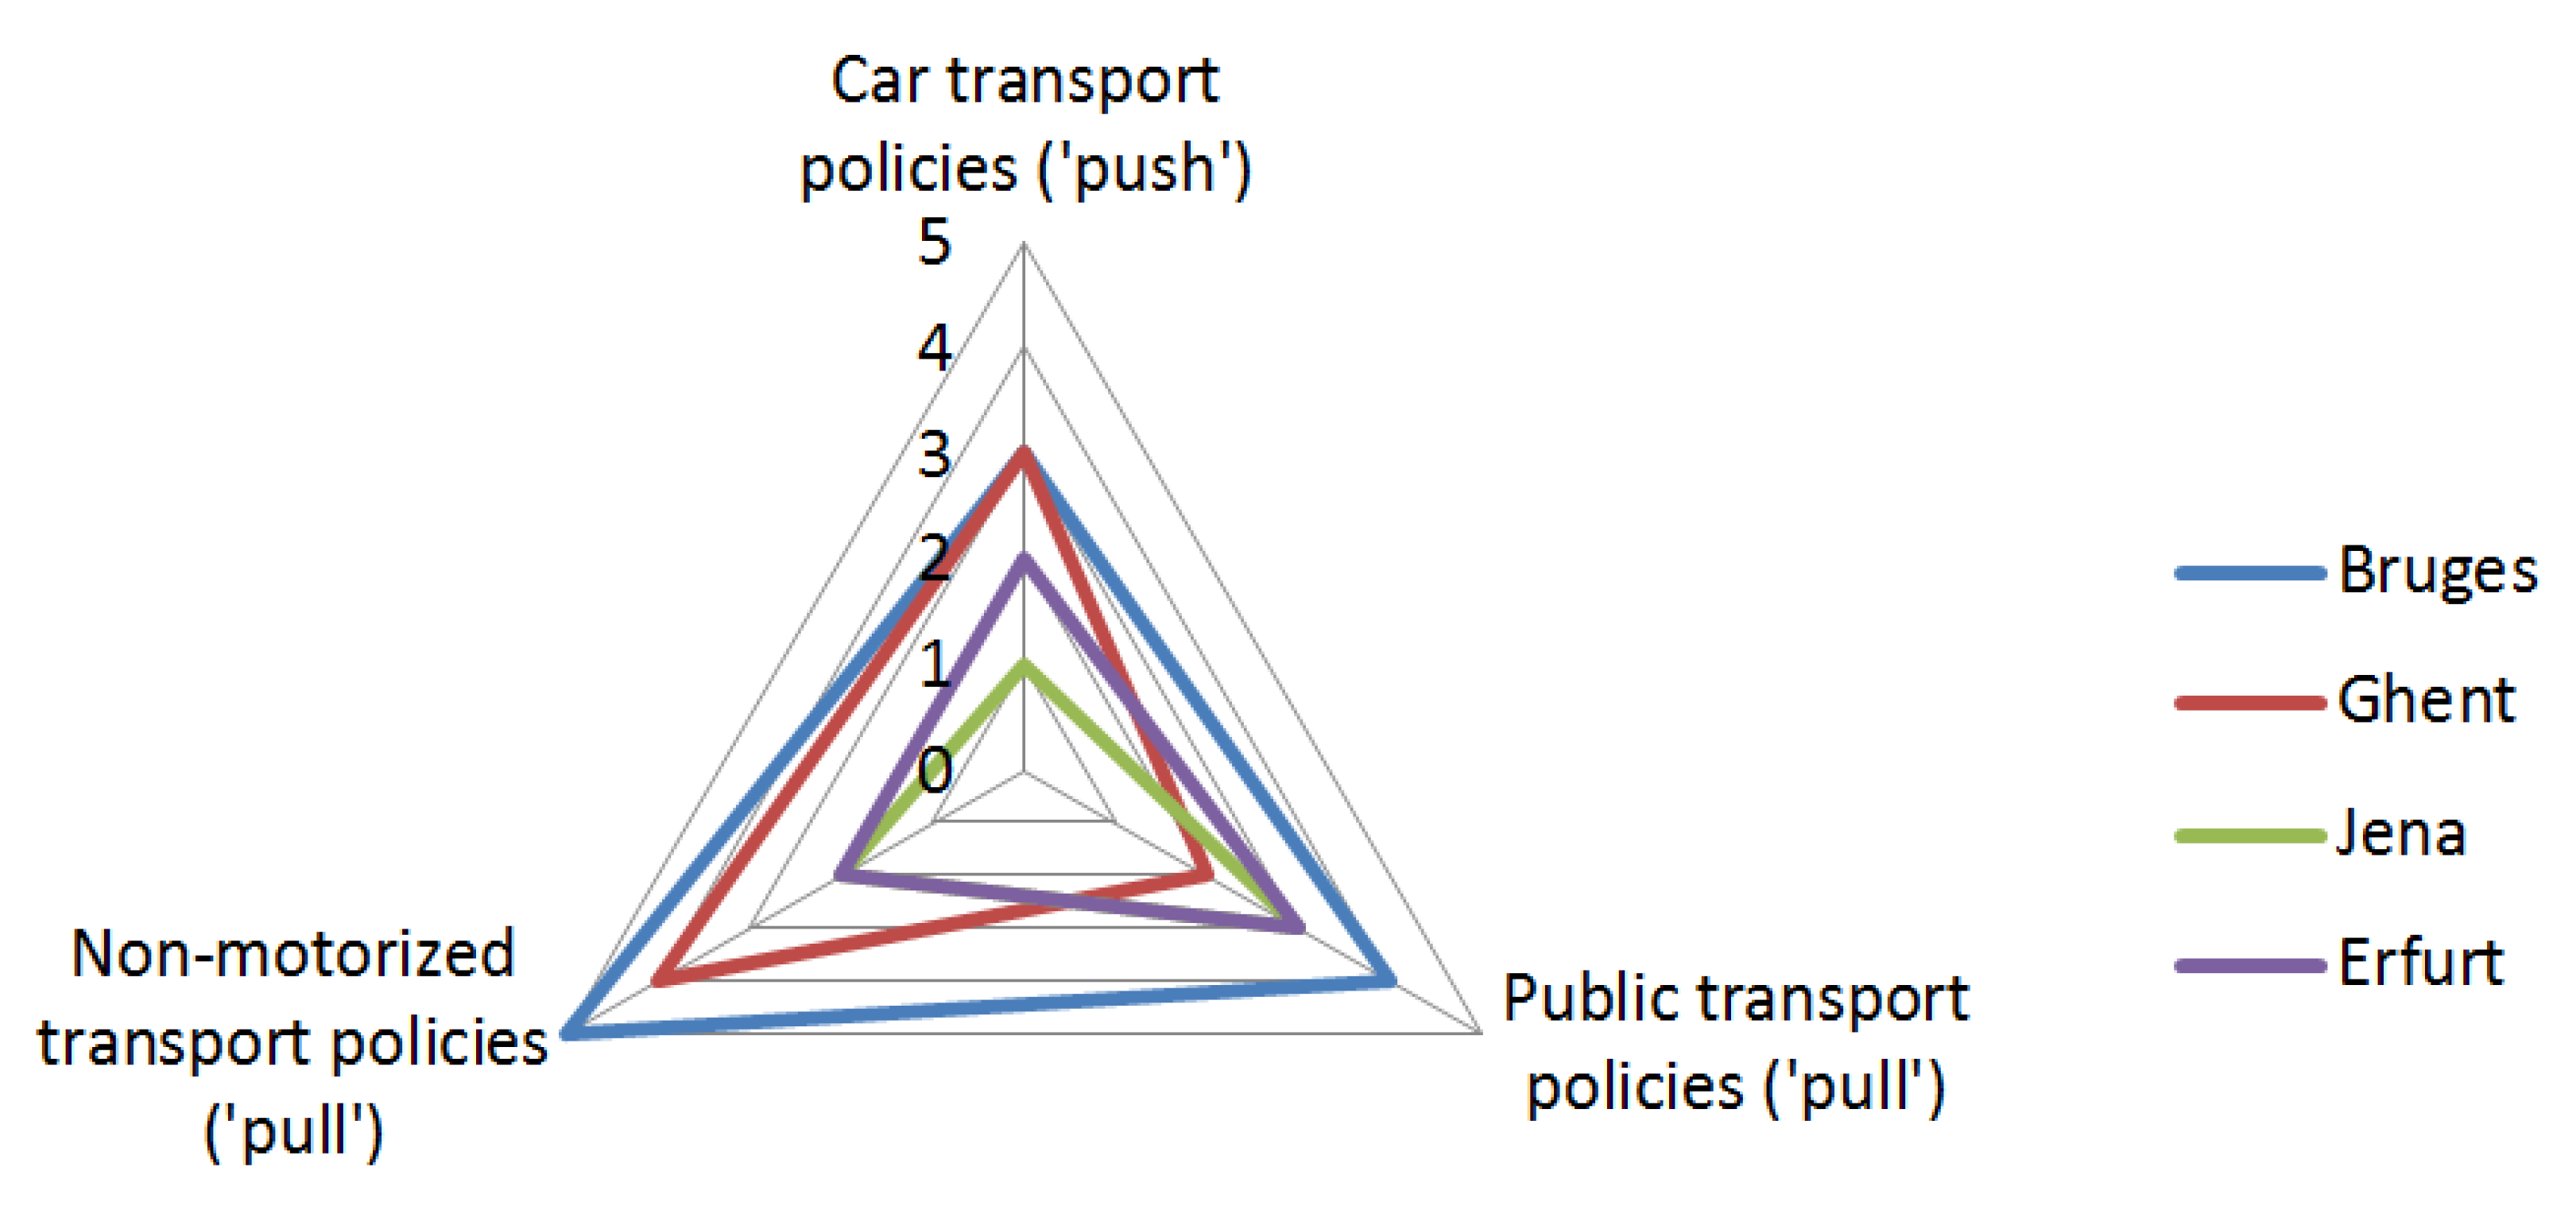
While Table 2 provided an overview of changes of policy measures in the 2000–2010 period for each city (grouped as car transport policies, public transport policies and non-motorised transport policies), we can use the same set of policy reports to score these as changing intensity of these groups, see Figure 3. We refer to policy intensity as the amount of resources, effort and political activity that is invested in or allocated to the policy to either ‘push’ travellers from car use or ‘pull’ travellers to car alternatives. This strength ranges from 1 (very weak) to 5 (very strong), and are relative to the policies at the start of the period of study in each city. As can be seen, each city reshaped their policy mix in a different way.
5.2.1. Car Transport Policies
The change of car policies was scored from a weak to medium level ‘push’, with Bruges and Ghent scoring medium, followed by Erfurt and then Jena (see Figure 3). In all cities, stringent measures restricting car access to the inner city (whether through zoning or parking policy) were not implemented. In Bruges and Ghent, a rise in parking prices combined with fewer available parking spaces had some effect in stimulating people to park elsewhere and/or undertake a multi-modal journey. The same effect is visible in Erfurt, but because both prices and capacity have been respectively increased and reduced less, the effect is less pronounced. In Jena these changes hardly occurred. In addition, in most cities the P + R sites face several issues, such as lack of attractiveness (all), being considered a last parking resort (all; Jena lacks a regular P + R), insufficient capacity (Bruges, Ghent, Erfurt), or lack the necessary infrastructure to connect them to core areas (Ghent). Jena, missing a P + R except for special events, instead encourages people to park as closely to their destination as possible. It should, however, be noted that all four cities have detailed strategic plans on how to tackle problems associated with competition over parking spaces, congestion, and large numbers of visitors. Also, in all cities a hierarchy has emerged, such as the STOP-principle (i.e., a modal hierarchy with pedestrians at the top, followed by cyclists, then public transport, and finally other motorised forms of traffic) in Bruges and Ghent, and the prioritisation of public transport over other motorised traffic in Jena and Erfurt.
5.2.2. Public Transport Policies
The change of policies on public transport was scored from weak to strong levels of ‘push’, with Bruges scoring strong, Jena and Erfurt scoring medium, and Ghent weak (Figure 3). During the period of our analysis (2000–2010), Bruges has shown itself to be clear about its intention of aiding public transport to become a substitute for the car, and hence focuses on improving the current situation by ensuring that all citizens have access to public transport (e.g., nearby stops; this is already the situation for nearly all of Bruges), improve connections to/from public transport to reduce car use, at least maintain the quality of P + R lines, focus on regional transport so that commuting to/from nearby settlements becomes more advantageous by public transport than by car, and work closely with transport operator De Lijn to ensure that the city’s wishes are taken up.
Jena’s policies led to a strengthening of local and regional networks (aided by an increasing orientation on the tram) and has come to implement the prioritisation of public transport, at the expense of private motorised transport. In the late 2000s the focus was also increasingly on improving public transport facilities (e.g., stops, stations). Jena’s efforts, however, did not result in solving the problems of missing links and inconvenient transfers despite its ambitions in providing better access to public transport and expanding on its tram network.
Erfurt’s actions have resulted in an extensive local and regional network and a more sophisticated digital guidance system, a step towards meeting the city’s goal of enabling public transport to become an alternative to the car. Whereas one study shows that the quality of Erfurt’s public transport is very good, another demonstrates that the average score (although still above average) sits halfway between neutral and good [83], showing the need for further improvement. The policy is hence scored as medium: the city has clearly made progress but is being held back by its conviction that the quality is high enough to not warrant extensive action.
The weakest policies on public transport are adopted by Ghent. Although the hierarchical structure was implemented to improve this mode, in practice some areas of Ghent (mainly those served by regional transport) lack sufficient access to the network, sometimes large detours and additional transfers are inevitable, and the networks contain some missing links. In addition, public transport is hindered by congestion on the R40 and the P + Rs overall lack adequate servicing. Ghent has recognised these issues and plans to address them, however, this occurs after the period discussed in this paper. Nevertheless, for a large group of citizens, the system does work.
5.2.3. Non-Motorised Transport Policies
For the period of our analysis (2000–2010), we scored the changes in non-motorised transport policies with Bruges scoring the strongest ‘pull’ (very strong), followed by Ghent (strong) and then Jena and Erfurt (both weak) (Figure 3). Both Bruges and Ghent adopted the STOP-principle. Both cities promote multi-modal journeys (combinations of non-motorised with public transport, arguing that this combination is sufficiently strong to offer an alternative to car journeys) and actively stimulate non-motorised modes as a means to complete short-distance journeys, for instance through campaigns. Priority areas include: reducing journey length (direct and alternate routes), expanding existing networks, improving safety of bicycle lanes and sidewalks, and increasing the capacity of bicycle parking. The difference between the two cities is that Bruges focuses more efforts on its plans to separate cyclists from motorised traffic outside low-speed zones (and adapting sidewalks for similar reasons) than Ghent. In addition, in the car-free zone in Ghent’s inner-city conflicts often arise between pedestrians and cyclists, and whereas the city (like Bruges) wants to remove any unnecessary hindrances for cyclists, it is more willing to accept these for pedestrians to not inhibit traffic flow.
The networks for pedestrians and cyclists in both Jena and Erfurt contain missing links and their integration in motorised networks is inadequately done, leading to detours and to safety issues. For example, separation between modes (pedestrians and cyclists; cyclists and motorised traffic) is sometimes non-existent outside low-speed zones, and both pedestrians and cyclists often face long waiting times at crossings, both with and without traffic lights. In addition, both cities are faced with a shortage of bicycle parking and a limited success of promotion activities.
5.3. Interaction Analysis of Measures’ Types
How did the changing policy measures affect interactions between them? Here we discuss the changing interactions between each of the three types of policies separately.
5.3.1. Policies on Car Transport and Public Transport
For the period of our analysis (2000–2010) the relationship between policies on private motorised transport and on public transport, on average, became more synergic for Bruges, Ghent and Erfurt, whilst not significantly changing for Jena. Bruges and Ghent, and Erfurt to a smaller degree, have imposed measures to reduce car use, whilst improving policies for public transport. This is even true for Ghent. Although the city’s policies are rated as weak, still, the state of the public transportation network does allow a large group of people to reach their destination without too many hindrances (a weak pull, but still a pull). For Jena the situation is different because policies on private motorised transport are very weak and hence did not provide a real push.
5.3.2. Policies on Public Transport and Non-Motorised Transport
More differences can be seen in the changing relationship between policies on public and non-motorised transport. For Bruges there is a combination of stronger synergetic but also some contradictory effects. The promotion of multi-modal journeys (PT for the longer leg, walking or cycling for the last urban leg) improved the attractiveness of both. Ironically, the promotion of cycling may to some extent draw people from PT. In Ghent these same effects occur, but to a lesser extent. In Erfurt and Jena there is no strong change of relationship, with both policies changing only to some extent (medium and weak, respectively). The relationship remains primarily facilitative, with infrastructure for walking facilitating the way to and from PT, but there is no mutual reinforcement. The role of cycling is also limited.
5.3.3. Policies on Private Motorised Transport and Non-Motorised Transport
The relationship between policies on private motorised transport and non-motorised modes hardly change in the German cities, and somewhat in the Belgium ones. For Jena and Erfurt, with both policies changes ranging from very weak to medium, it is clear that the mutual impact does not substantially change. Here, the different modes are often used for different purposes, depending on several factors such as journey length and convenience (e.g., needing to transport something big or heavy). For the Belgium cities the picture is more nuanced, because of the role of cycling. Although policies on private motorised transport are a stronger ‘push’, they are not strong enough to restrict access to core areas by car (one can still come close enough to only have to walk a couple of minutes to one’s destination), thereby not necessarily pushing people towards another travelling mode. Nevertheless, the stronger car restraining policies, pushes a share of the residents to opt for the bicycle over the car, so there is some synergetic effect here as well.
5.4. Reflections
We asked civil servants in each of cities to reflect on our analysis of interactions as a way of corroborating our findings. The responses showed that in practice the consideration of instrument interaction effects is not common. Jena and Ghent found it too hard to say something about the interaction effects, and Jena stated that they do prioritise the modes (from first walking & cycling, to PT, to car transport) and further simply ‘act within the scope of existing opportunities and political majorities’. Erfurt considered that ‘because of the construction of the outer ring further measures for traffic calming and traffic reduction could be implemented in the inner city’, without mentioning the effect that the outer ring also attracts car transport. Both Erfurt & Bruges refer to car straining policies (traffic calming measures and stricter parking measures respectively) as the key reason of reduction of car use, with only Erfurt also referring to the combination with attractive public transport. Therefore, we can conclude that thinking in terms of the overall policy package, in the sense of considering the relationships between the measures in the package, is immature in these four cities.
We also asked about other factors influencing modal shift, that is: apart from the traffic policies and infrastructural adjustments. Bruges and Erfurt mention the ‘zeitgeist of environmental interest (ecological visions, work locally)’, and Bruges also ‘efforts of businesses (bicycle bonus, public transport subscriptions)’. Erfurt also mentions the ‘strengthening of the city centre as a residential location, reurbanisation’.
5.5. Linking the Changes in Policy and Modal Shift
Although the complex nature of urban mobility does not allow conclusions in terms of sheer causalities, we can draw a few conclusions from our analysis. The modal share data shows the reduction in the share of car trips for each city (see Table 1 and Figure 2). Jena has achieved the lowest reduction (by just 3%, from 38% in 2001 and 35% in 2008). The largest reduction has been achieved by Ghent (a reduction of 15–47% in 2012, compared to 1998), closely followed by Bruges (a reduction of 14–44% in 2011, compared to 1998). Erfurt has managed a reduction of 10% to a modal share of 39% in 2008, compared to 1998. Qualitatively correlating these reductions with the changing measures and associated changing interactions in the policy mix, the differences in reduction might be explained as follows. In Bruges and Ghent, performing the highest reductions, the policy mix became more synergetic. Also, the lowest reduction in Jena can be explained by the absence of more synergetic relationships. Erfurt holds an intermediate position with one slightly more synergetic relationship in combination with a medium level reduction of car use. In other words, the stronger the extent of consistent ‘packaging’ in a city, the stronger the reduction of car use share.
Based on these four cases we conclude that our hypothesis that ‘the more these mixes are consistently combining car constraining (‘push’) measures with (‘pull’) policies that promote car alternatives, the more the modal share will shift away from car mobility’, is confirmed. (To discuss the confirmation or rejection of this hypothesis in a statistical sense, a much greater number of cases would be needed. Nevertheless, based on our limited analysis of four cities, we can say that the null-hypothesis should be rejected and discuss the (qualitative) evidence we found for its confirmation). Hence, more than just piling up and mixing policy measures in an urban area, there is a need for a strategic combination of policy measures and that requires an explicit attention to the relations between policy measures. Synergetic relationships are to be maximised and contradictory relations to be avoided. Overall, it is clear that a mix of policies has been implemented in each of the cities and that mix included many measures that are internationally regarded as ‘best practices’. At the same time, despite the ‘sustainable mobility’ rhetoric that the policy documents express, there is no clear evidence suggesting that a concentrated effort of a strategic nature was made to align all these policies with each other and, importantly, with a pre-defined and clear policy objective. In other words, no real evidence at “policy packaging” is observed. We assume that a more careful consideration of “policy packaging” principles, would have resulted in even better results for each of the cities examined.
6. Conclusions & Policy Implications
Overall, the main lessons from the above analysis for other cities that wish to facilitate a significant modal shift to walking, cycling and public transport are the following. First, transferring ‘best practice’ policy measures from other cities, copying policies in other words, cannot guarantee the desired effect, because the implementation and effectiveness of different policy measures must be considered in, i.e., tuned to, the local context. After all, the four cities we examined had broadly the same policy measures in place, but with distinct effects. Second, careful consideration of each measure in itself is critical, but not sufficient. Each measure must also be examined against other (proposed and existing) measures to avoid contradictions and capitalise on synergies. This requires that time and resources will be devoted in the policy process to assess those interactions (i.e., relations), which is the third lesson. After all, because of such interactions, a policy measure may be hardly effective in one place, but successful in another. As reported by the officials of the case study cities, such resources were not devoted there. Fourth, and a critical element of the policy packaging methodology, although it has not been emphasised or reported in research to date, a monitoring mechanism of the effect of the ‘package’ with respect to the goal set, must be in place. This mechanism should also consider and introduce adaptation to the package along the principles of change, add and/or remove individual policy measures. It is also important to note, and derived from the above, that cities should have a good record of the policies that are already ‘in place’.
Ex-ante evaluations need to use knowledge gained through ex-post evaluations, a crucial link in the policy cycle. However, in transport agencies, ex ante analyses, aimed at finding optimally efficient future solutions, generally lack knowledge about policy outcomes observed through retrospective analysis [84]. The application-oriented, ex-post analysis offered in this paper, has sought to address this gap by describing the impact of implemented transport policies on modal shift in four cities and identify policy levers that can potentially achieve the specific objective of modal shift toward decreasing car transport share.
Our study shows that the four cities did not have explicit target modal shares, but a set of fragmented goals (e.g., improve public transport, decrease congestion problems, etc.). (This means that our indication of effectiveness takes a relative approach, taking the modal share of car transport as the benchmark, and, hence, it does not necessarily indicate the effectiveness of a particular urban government (in sense of their performance)). Other studies also observed that legislators often formulate problems and policy goals in general terms in order to gain acceptance, forestall opposition, and maintain political flexibility [84]. For cities that pursue urban mobility transition towards low car use levels, setting such a goal explicitly seems the first step, because a clear discussion on what an effective policy package is can then follow, and subsequently, the specific objective of modal shift can be monitored and evaluated to evaluate the success of policies. In turn, this requires data at least for the situation just before the policy (package) was implemented and then continually after. Thus, data collection is also an integral part of the policy packaging ex-ante and ex-post process.
Ex-post analysis has thus important benefits. It places primary emphasis on the results of observed outcomes of action—that is, what has actually worked or not—and is not content with speculations about expected policy outcomes. They may offer new frameworks for understanding policymaking, challenging conventional wisdom, challenging social and economic myths, and shaping the climate of opinion [84]. Our primarily qualitative ex-post, policy package analysis focused on the effect of policies on the share of car transport, and we first identified the push/pull effects of individual measures affecting car transport and its alternatives (public transport, walking & cycling). Based on that, we estimated the consistency of the policy package by appraising the type of relationship between the three groups of measures (i.e., grouped according to the transport mode they target: car-, public- or non-motorised transport). These included synergetic, contradictory, facilitative, pre-conditional or neutral relationships. Further, the push/pull intensities of the three groups of measures were estimated. Subsequently, for our study period from 2000 to 2010, we appraised the changes in the consistencies of the policy mixes (i.e., changes in the relationships between the three groups, because of adjustments in the policies), which we associated with the modal shift. Regarding our methodology, we find that this was very instrumental to highlight and integrate the multiple policy effects on the changing share of car transport.
But we also found ex-post analysis has important challenges. Our association of changing (consistency of) policy packages with modal shares remained qualitative and is difficult to validate other than by asking practitioners to reflect on them. These observations and lessons shift the focus to future research and we recommend developing ex-post evaluation frameworks further and exploring which elements are key in a such a procedure and how conclusions can be further corroborated. A combination of quantitative analysis of some relationships (i.e., consistencies) and intensities of policies and qualitative analysis may increase the validation of the analysis and should be explored. Also, future research should examine in much more detail the policy making and decision-making processes and mechanisms in each city, as well as examining the institutional settings of ‘policy making’ more generally to try and assess the effect of these on the changes in the level of modal share observed in each of the cities. In addition, the recognition of the need for and advantage of ‘policy packaging’ requires further development of the policy packaging methodology and a set of tools to assist in it.
As for the policy practice, we strongly argue for the institutionalisation of ex-post analysis in any planning and policy organisations, to become an equal part of the planning process alongside ex-ante analysis. These processes should include at their core the policy packaging ‘thinking’. Thus, relations between policy measures ought to be assessed before and after implementation in order to establish a learning mechanism. At present the learning mechanism relies too much on what others (cities) are doing or have done. Instead, the learning process has to be a city-specific one, place specific and chronological, i.e., every ex-post analysis feeds into the next ex-ante analysis in a non-stop continues manner.
Author Contributions
Conflicts of Interest
The authors declare no conflict of interest.
References
- Banister, D. The Sustainable Mobility paradigm. Transp. Policy 2008, 15, 73–80. [Google Scholar] [CrossRef]
- Flyvbjerg, B. (Ed.) The Oxford Handbook of Megaproject Management; Oxford University Press: Oxford, UK, 2017. [Google Scholar]
- Hickman, R.; Dean, M. Incomplete cost—Incomplete benefit analysis in transport appraisal. Transp. Rev. 2017. [Google Scholar] [CrossRef]
- Givoni, M. Re-assessing the Results of the London Congestion Charging Scheme. Urban Stud. 2012, 49, 1089–1105. [Google Scholar] [CrossRef]
- Givoni, M.; Banister, D. Moving Towards Low Carbon Mobility; Edward-Elgar: Cheltenham Glos, UK, 2013. [Google Scholar]
- Sanderson, I. Evaluation, policy learning and evidence-based policy making. Public Adm. 2002, 80, 1–22. [Google Scholar] [CrossRef]
- Marsden, G.; Stead, D. Policy transfer and learning in the field of transport: A review of concepts and evidence. Transp. Policy 2011, 18, 492–500. [Google Scholar] [CrossRef]
- Pucher, J.; Buehler, R. Making cycling irresistible: Lessons from The Netherlands, Denmark, and Germany. Transp. Rev. 2008, 28, 495–528. [Google Scholar] [CrossRef]
- Buehler, R.; Pucher, J.; Gerike, R.; Götschi, T. Reducing car dependence in the heart of Europe: Lessons from Germany, Austria, and Switzerland. Transp. Rev. 2017, 37, 4–28. [Google Scholar] [CrossRef]
- Givoni, M.; Macmillen, J.; Banister, D.; Feitelson, E. From policy measures to policy packages. Transp. Rev. 2013, 33, 1–20. [Google Scholar] [CrossRef]
- Taeihagh, A.; Givoni, M.; Bañares-Alcántara, R. Which policy first? A network-centric approach for the analysis and ranking of policy measures. Environ. Plan. B 2013, 40, 595–616. [Google Scholar] [CrossRef]
- Givoni, M. Addressing transport policy challenges through Policy-Packaging. Transp. Res. A Policy Pract. 2014, 60, 1–8. [Google Scholar] [CrossRef]
- Segal, E.; Negev, M.; Feitelson, E.; Zaychik, D. Devising ‘policy packages’ for seismic retrofitting of residences. Nat. Hazards 2017, 89, 497–519. [Google Scholar] [CrossRef]
- Pereira, Á.; Carballo-Penela, A.; Guerra, A.; Vence, X. Designing a policy package for the promotion of servicising: A case study of vineyard crop protection in Galicia (Spain). J. Environ. Plan. Manag. 2017, 61, 348–369. [Google Scholar] [CrossRef]
- Flanagan, K.; Uyarra, E.; Laranja, M. Reconceptualising the ‘policy mix’ forinnovation. Res. Policy 2011, 40, 702–713. [Google Scholar] [CrossRef] [Green Version]
- Veugelers, R. Which policy instruments to induce clean innovating? Res. Policy 2012, 41, 1770–1778. [Google Scholar] [CrossRef]
- Rogge, K.S.; Reichardt, K. Policy Mixes for Sustainability Transitions: An extended concept and framework for analysis. Res. Policy 2016, 45, 1620–1635. [Google Scholar] [CrossRef]
- Rogge, K.S.; Kern, F.; Howlett, M. Conceptual and empirical advances in analyzing policy mixes for energy transitions. Energy Res. Soc. Sci. 2017, 33, 1–10. [Google Scholar] [CrossRef]
- Banister, D. Unsustainable Transport: City Transport in the New Century; Routledge: New York, NY, USA, 2005. [Google Scholar]
- Banister, D.; Anderton, K.; Bonilla, D.; Givoni, M.; Schwanen, T. Transportation and the environment. Ann. Rev. Environ. Resour. 2011, 36, 247–270. [Google Scholar] [CrossRef]
- Dijk, M.; Parkhurst, G. Understanding the mobility-transformative qualities of urban park and ride polices in the UK and the Netherlands. Int. J. Automot. Technol. Manag. 2014, 14, 246–270. [Google Scholar] [CrossRef]
- Woodcock, J.; Givoni, M.; Morgan, A.S. Health Impact Modelling of Active Travel Visions for England and Wales using an Integrated Transport and Health Impact Modelling tool (ITHIM). PLoS ONE 2013, 8, e51462. [Google Scholar] [CrossRef] [PubMed]
- Hoffmann, C.; Abraham, C.; White, M.P.; Ball, S.; Skippon, S.M. What cognitive mechanisms predict travel mode choice? A systematic review with meta-analysis. Transp. Rev. 2017, 37, 631–652. [Google Scholar] [CrossRef]
- McCarthy, L.; Delbosc, A.; Currie, G.; Molloy, A. Factors influencing travel mode choice among families with young children (aged 0–4): A review of the literature. Transp. Rev. 2017, 37, 767–781. [Google Scholar] [CrossRef]
- Salomon, I.; Singer, M.E. ‘Informal Travel’: A new conceptualization of travel patterns? Transp. Rev. 2014, 35, 562–582. [Google Scholar] [CrossRef]
- Schwanen, T.; Banister, D.; Anable, J. Rethinking habits and their role in behavior change: The case of low-carbon mobility. J. Transp. Geogr. 2012, 24, 522–532. [Google Scholar] [CrossRef]
- Hill, M. The Public Policy Process; Longman: Harlow, UK, 2009. [Google Scholar]
- Howlett, M.; Ramesh, M.; Perl, A. Studying Public Policy: Policy Cycles and Policy Subsystems, 2nd ed.; Oxford University Press: Oxford, UK, 2009. [Google Scholar]
- Hill, M.; Hupe, P. Implementing Public Policy; Sage: London, UK, 2002. [Google Scholar]
- Etzioni, A. A Comparative Analysis of Complex Organizations: On Power, Involvement, and Their Correlates; Free Press: New York, NY, USA, 1975. [Google Scholar]
- Vedung, E. Policy instruments: Typologies and theories. In Carrots, Sticks and Sermons: Policy Instruments and Their Evaluation; Bemelmans-Videc, M.L., Rist, R.C., Vedung, E., Eds.; Transaction: New Brunswick, NJ, USA, 1998; pp. 21–58. [Google Scholar]
- Nauwelaers, C.; Boekholt, P.; Mostert, B.; Cunningham, P.; Guy, K.; Hofer, R.; Rammer, C. Policy Mixes for R & D in Europe; UNU-MERIT, University of Maastricht and United Nations University: Maastricht, The Netherlands, 2009. [Google Scholar]
- Oikonomou, V.; Jepma, C. A framework on interactions of climate and energy policy instruments. Mitig. Adapt. Strateg. Glob. Chang. 2008, 13, 131–156. [Google Scholar] [CrossRef]
- Sorrell, S.; Smith, A.; Betz, R.; Walz, R.; Boemare, C.; Quirion, P.; Sijm, J.; Konidari, D.M.P.; Vassos, S.; Haralampopoulos, D.; et al. Interaction in EU Climate Policy: Final Report; Science Policy Research Unit (SPRU): Brighton, UK, 2003. [Google Scholar]
- Del Río, P. Interactions between climate and energy policies: The case of Spain. Clim. Policy 2009, 9, 119–138. [Google Scholar]
- Gunningham, N.; Grabosky, P.N.; Sinclair, D. Smart Regulation: Designing Environmental Policy; Oxford University Press: Oxford, UK, 1998. [Google Scholar]
- Guerzoni, M.; Raiteri, E. Demand-side vs. supply-side technology policies: Hidden treatment and new empirical evidence on the policy mix. Res. Policy 2015, 44, 726–747. [Google Scholar] [CrossRef]
- Del Río González, P. The interaction between emissions trading and renewable electricity support schemes: An overview of the literature. Mitig. Adapt. Strateg. Glob. Chang. 2006, 12, 1363–1390. [Google Scholar] [CrossRef]
- Antonioli, D.; Borghesi, S.; D’Amato, A.; Gilli, M.; Mazzanti, M.; Nicolli, F. Analysing the interactions of energy and climate policies in a broad policy ‘optimality’ framework: The Italian case study. J. Integr. Environ. Sci. 2014, 11, 205–224. [Google Scholar] [CrossRef]
- International Energy Agency (IEA). Interactions of Policies for Renewable Energy and Climate; International Energy Agency (IEA): Paris, France, 2011. [Google Scholar]
- Palmer, K.; Paul, A.; Woerman, M.; Steinberg, D. Federal policies for renewable electricity: Impacts and interactions. Energy Policy 2011, 39, 3975–3991. [Google Scholar] [CrossRef]
- Kivimaa, P.; Kangas, H.-L.; Lazarevic, D. Client-oriented Evaluation of ‘Creative Destruction’ in Policy Mixes: Finnish Policies on Building Energy Efficiency Transition. Energy Res. Soc. Sci. 2017, 33, 115–127. [Google Scholar] [CrossRef]
- European Commission, Directorate General for Regional Policy. Cities of Tomorrow: Challenges, Visions, Ways Forward; Publications Office of the European Union: Luxembourg, Luxembourg, 2011. [Google Scholar]
- Stad Gent. Bevolkingscijfers over Gent. 2016. Available online: https://stad.gent/over-gent-en-het-stadsbestuur/pers-en-publicaties/publicaties-van-en-ism-stad-gent/onderzoeks-en-cijferrapporten/demografie/bevolkingscijfers-over-gent (accessed on 28 May 2017).
- AD Statistiek. Bevolking—Cijfers Bevolking 1990–2011. Residerende Wettelijke Bevolking op 1 Januari, 1990–2011. 2012. Available online: http://statbel.fgov.be/nl/modules/publications/statistiques/bevolking/cijfers_bevolking_1_1_2009.jsp (accessed on 28 May 2017).
- Erfurt. Bevölkerungsprognose bis 2040. Die Erfurter Bevölkerung Entwicklung bis 2014 und Prognose bis 2040; Erfurt: Landeshauptstadt, Erfurt, Germany, 2015; Available online: http://www.erfurt.de/mam/ef/service/mediathek/publikationen/2015/heft_93.pdf (accessed on 28 May 2017).
- Provincie West-Vlaanderen (n.d.). Gemeentelijke Steekkaarten. Brugge. Demografie 2014. Available online: https://www.west-vlaanderen.be/kwaliteit/welzijn_/wegwijzerennetwerking/steunpuntsocialeplanning/Paginas/gemeentelijkesteekkaarten.aspx (accessed on 28 May 2017).
- Statista. Entwicklung der Einwohnerzahl in Jena (kreisfreie Stadt) von 1995 bis 2015. Available online: https://de.statista.com/statistik/daten/studie/375009/umfrage/entwicklung-der-gesamtbevoelkerung-in-jena/ (accessed on 28 May 2017).
- Tight, M.; Timms, P.; Banister, D.; Bowmaker, J.; Copas, J.; Day, A.; Drinkwater, D.; Givoni, M.; Gühnemann, A.; Lawler, M.; et al. Visions for a walking and cycling focussed urban transport system. J. Transp. Geogr. 2011, 19, 1580–1589. [Google Scholar] [CrossRef]
- Litman, T. Mobility as A Positional Good. Implications for Transport. Policy and Planning; Victoria Transport Policy Institute: Victoria, BC, Canada, 2011; Available online: https://pdfs.semanticscholar.org/bfda/19dad38913f6c4bb20489c884eb32b2885b4.pdf (accessed on 28 May 2017).
- EPOMM. TEMS—The EPOMM Modal Split Tool. Brugge. Available online: http://www.epomm.eu/tems/result_city.phtml?city=548&map=1 (accessed on 28 May 2017).
- EPOMM. TEMS—The EPOMM Modal Split Tool. Ghent. Available online: http://www.epomm.eu/tems/result_city.phtml?city=163 (accessed on 28 May 2017).
- EPOMM. TEMS—The EPOMM Modal Split Tool. Jena. Available online: http://www.epomm.eu/tems/result_city.phtml?city=20&map=1 (accessed on 28 May 2017).
- EPOMM. TEMS—The EPOMM Modal Split Tool. Erfurt. Available online: http://www.epomm.eu/tems/result_city.phtml?city=13 (accessed on 28 May 2017).
- Erfurt. Verkehrsentwicklungsplan; Erfurt: Landeshauptstadt, Erfurt, Germany, 1994; Available online: http://www.erfurt.de/mam/ef/leben/verkehrsplanung/vep/gesamtkonzept_vep_innenstadt.pdf (accessed on 28 May 2017).
- Erfurt. Nahverkehrsplan 2002–2006; Erfurt: Landeshauptstadt, Erfurt, Germany, 2011; Available online: http://www.ikpv.de/wp-content/uploads/2012/07/NVP2002.pdf (accessed on 28 May 2017).
- Erfurt. Nahverkehrsplan 2008–2012; Erfurt: Landeshauptstadt, Erfurt, Germany, 2007; Available online: https://ksj.jena.de/fm/41/beschlossene%20Endfassung%20NVP%20Jena%202007-12-05-k.102659.pdf (accessed on 28 May 2017).
- Erfurt. Klimaschutz in Erfurt. Leitbild, Ziele und Handlungskonzept; Erfurt: Landeshauptstadt, Erfurt, Germany, 2012; Available online: http://www.erfurt.de/mam/ef/leben/oekologie_und_umwelt/klimaschutz/handlungskonzept_klimaschutz_2012-03-29.pdf (accessed on 28 May 2017).
- Erfurt. Verkehrsentwicklungsplan Erfurt. Teil Innenstadt—mit Wirtschaftsverkehr. Beiträge zur Stadtentwicklung; Erfurt: Landeshauptstadt, Erfurt, Germany, 2012; Available online: http://www.erfurt.de/mam/ef/leben/verkehrsplanung/vep/gesamtkonzept_vep_innenstadt.pdf (accessed on 28 May 2017).
- Erfurt. Nahverkehrsplan 2014 bis 2018; Erfurt: Landeshauptstadt, Erfurt, Germany, 2013; Available online: http://www.erfurt.de/mam/ef/leben/verkehrsplanung/vep/nahverkehrsplan_2014_bis_2018.pdf (accessed on 28 May 2017).
- Erfurt. Verkehrsentwicklungsplan Erfurt. Parkraumkonzeption Innenstadt. Beitrage zur Stadtentwicklung; Erfurt: Landeshauptstadt, Erfurt, Germany, 2014; Available online: http://www.erfurt.de/mam/ef/leben/verkehrsplanung/vep/parkraumkonzeption_erfurt.pdf (accessed on 28 May 2017).
- Erfurt. Verkehrsentwicklungsplan Erfurt. Radverkehrskonzept. 3 Beiträge zur Stadtentwicklung; Erfurt: Landeshauptstadt, Erfurt, Germany, 2015; Available online: http://www.erfurt.de/mam/ef/leben/verkehrsplanung/vep/rvk_kurzfassung.pdf (accessed on 28 May 2017).
- Erfurt. Umweltzone. Maßnahme des Luftreinhalteplanes. 2016. Available online: http://www.erfurt.de/ef/de/leben/verkehr/mobil/auto/umweltzone/index.html (accessed on 28 May 2017).
- Erfurt (n.d.). Gewerbegebiete der Stadt Erfurt. 14 erschlossene Gewerbegebiete. Available online: http://www.erfurt.de/ef/de/wirtschaft/gewerbestandorte/gebiete/index.html (accessed on 28 May 2017).
- Mobiliteitsbedrijf Stad Gent. Met de auto. Gent: slim op weg. Mobiliteit in Gent. Available online: https://mobiliteit.stad.gent/met-de-auto (accessed on 28 May 2017).
- Mobiliteitsbedrijf Stad Gent. Ondergrondse parkings. Gent: slim op weg. Mobiliteit in Gent. Available online: https://mobiliteit.stad.gent/met-de-auto/ondergrondse-parkings (accessed on 28 May 2017).
- Groep Planning. Gemeente Oosterzele Mobiliteitsplan; Stad Brugge Mobiliteitsplan: Brugge, Belgium, 2001; Available online: https://www.oosterzele.be/Portals/0/Documenten/Infrastructuur/Mobiliteit/mobiliteitsplan%202001.pdf (accessed on 28 May 2017).
- SumResearch. Beleidsplan; Stad Brugge Mobiliteitsplan: Brugge, Belgium, 2008; Available online: https://www.brugge.be/files/uploads/document/mobiliteitsplan-brugge-definitief-vastgesteld.pdf (accessed on 28 May 2017).
- Stad Brugge. Parkeerzones; Stad Brugge Mobiliteitsplan: Brugge, Belgium, 2010; Available online: http://docplayer.nl/36766926-Brugge-bruges-v-parkeerzones-en-tarieven-zones-de-stationnement-et-tarifs-parking-zones-and-rates.html (accessed on 28 May 2017).
- Stad Brugge. Evaluatie Mobiliteitsplan 2011; Stad Brugge Mobiliteitsplan: Brugge, Belgium, 2011; Available online: http://mobiliteit.brugge.be/website_brugge/evaluatie_mobiliteitsplan_2011.pdf (accessed on 28 May 2017).
- Mobiliteitsplan Gent. Ruimtelijk Structuurplan Gent; Mobiliteitsplan Gent: Stad Gent, Belgium, 2003; Available online: https://stad.gent/mobiliteitsplan (accessed on 28 May 2017).
- Mobiliteitsplan Gent. Ruimtelijk Structuurplan Gent. Richtinggevend gedeelte; Mobiliteitsplan Gent: Stad Gent, Belgium, 2003; Available online: https://stad.gent/mobiliteitsplan (accessed on 28 May 2017).
- Mobiliteitsplan Gent. Tariefzones; Mobiliteitsplan Gent: Stad Gent, Belgium, 2010; Available online: https://stad.gent/mobiliteitsplan (accessed on 28 May 2017).
- Mobiliteitsplan Gent. Strategische Mobiliteitsvisie. Mobiliteit Als Motor Voor Een Duurzame en Bereikbare Stad; Mobiliteitsplan Gent: Stad Gent, Belgium, 2014; Available online: http://www.epomm.eu/newsletter/v2/content/2017/0217/doc/MobiliteitsplanGent_StrategischeMobiliteitsvisie.pdf (accessed on 28 May 2017).
- Mobiliteitsplan Gent. Wat doet de overheid voor propere lucht? Wat doen Europa, Vlaanderen, de Provincie en de Stad voor een goede luchtkwaliteit? Mobiliteitsplan Gent: Stad Gent, Belgium, 2016; Available online: https://stad.gent/natuur-milieu/u-houdt-van-gent/meet-de-lucht-je-straat/wat-doet-de-overheid-voor-propere-lucht (accessed on 28 May 2017).
- Stadt Jena (2002a), Nahverkehrsplan 2002–2006, Gekürzte Version. Available online: http://www.ikpv.de/wp-content/uploads/2012/07/NVP2002.pdf (accessed on 28 May 2017).
- Stadt Jena (2002b), Verkehrsentwicklungsplan 2002. Available online: https://www.jena.de/sixcms/media.php/2178/VEP%202002%20Kurzfassung.pdf (accessed on 28 May 2017).
- Stadt Jena (2007), Fortschreibung des Nahverkehrsplanes der Stadt Jena 2008–2012. Available online: https://ksj.jena.de/fm/41/beschlossene%20Endfassung%20NVP%20Jena%202007-12-05-k.102659.pdf (accessed on 28 May 2017).
- Stadt Jena (2010), Leitfaden Gesamtstädtische Parkraumkonzeption, Fortschreibung des Parkraumkonzepts Innenstadt und Leitlinien zum Umgang mit dem ruhenden Verkehr im gesamtstädtischen Zusammenhang. Aachen: BSV Büro für Stadt- und Verkehrsplanung, Dr.-Ing. Reinhold Baier GMBH. Available online: https://www.jena.de/fm/1727/beschlossene%20Fassung%20Leitfaden.pdf (accessed on 28 May 2017).
- Stadt Jena (2012a), Radverkehrskonzept Jena. Fortschreibung 2012. Available online: https://www.jena.de/sixcms/media.php/2178/Endfassung%20RVK-2012.pdf (accessed on 28 May 2017).
- Stadt Jena (2012b), Umweltbericht der Stadt Jena. Available online: https://www.schritt-fuer-schritt.net/sixcms/media.php/2178/Umweltbericht2012.pdf (accessed on 28 May 2017).
- Stadt Jena (n.d.), Umwelt. Available online: http://www.jena.de/de/leben/umwelt/250246 (accessed on 28 May 2017).
- Stadtwerke Erfurt (2017), Parkhäuser. Available online: https://www.stadtwerke-erfurt.de/pb/swe/produkte+_+leistungen/parken/parkhaeuser# (accessed on 28 May 2017).
- Dunn, W. Public Policy Analysis: An Integrated Approach; Routledge: New York, NY, USA; London, UK, 2017. [Google Scholar]
Figure 1.
Population size of Bruges, Ghent, Jena and Erfurt in 2001, 2005 and 2011. Adapted from [44,45,46,47,48].

Figure 2.
Modal split in (a) Bruges; (b) Ghent; (c) Jena and (d) Erfurt. Sources: (a) Adapted from [50] and from the European Platform on Mobility Management [51]; (b) Adapted from [52] and [50]; (c) Adapted from [53]; (d) Adapted from [54].


Figure 3.
Policy intensities for a modal shift to car alternatives in Bruges, Ghent, Jena and Erfurt in the period 2000–2010. Intensity ranges from 1 (very weak) to 5 (very strong).
Figure 3.
Policy intensities for a modal shift to car alternatives in Bruges, Ghent, Jena and Erfurt in the period 2000–2010. Intensity ranges from 1 (very weak) to 5 (very strong).


Table 1.
Overview of the policies implemented before or in the period of our analysis (broadly 2000–2010). Sources: [55,56,57,58,59,60,61,62,63,64,65,66,67,68,69,70,71,72,73,74,75,76,77,78,79,80,81,82].
| Measure Description | Targeted Mode | Pull/Push? | Type of Influence | Bruges | Ghent | Jena | Erfurt |
|---|---|---|---|---|---|---|---|
| 1998–2011 | 1998–2012 | 2001–2008 | 1998–2008 | ||||
| One-way streets in city centre | Car | Push | Regulatory | 1 | 1 | 1 | 1 |
| Low-speed zones (often 30 km/h) | Car | Push | Regulatory | 1 | 1 | 1 | 1 |
| (small) car free area | Car | Push | Regulatory | 1 | 1 | 1 | 1 |
| Paid parking (not all areas of city) | Car | Push | Regulatory | 1 | 1 | 1 | 1 |
| Residential parking permits (not all areas of city) | Car | Push | Regulatory | 1 | 1 | 1 | 1 |
| Time limited parking | Car | Push | Regulatory | 1 | 1 | 1 | 1 |
| Underground parking (in centre) | Car | Pull | Economic | 1 | 1 | 1 | 1 |
| Parking lots (on street) | Car | Pull | Economic | 1 | 1 | 1 | 1 |
| Park and Ride (P + R) | Public Transport | Pull | Economic | 1 | 1 | 0 | 1 |
| Park + walk | Car/W & C | Pull | Economic | 1 | 0 | 0 | 0 |
| PRIS (Parking Information System) | Car | Pull | Informative | 0 | 1 | 1 | 1 |
| Ring road around inner centre (speed limit 50–70 km/h) | Car | Push | Economic | 1 | 1 | 1 | 1 |
| Ring road around city | Car | Pull | Economic | 0 | 1 | 0 | 1 |
| Public Transport tariffs’ increase | Public Transport | Push | Regulatory | 1 | 1 | 1 | 1 |
| Bus &/or tram network | Public Transport | Pull | Economic | 1 | 1 | 1 | 1 |
| Bus lanes | Public Transport | Pull | Regulatory | 1 | 1 | 0 | 0 |
| Safe pedestrian network | W & C | Pull | Economic | 1 | 1 | 1 | 1 |
| Cycling lanes | W & C | Pull | Economic | 1 | 1 | 0 | 1 |
| Non-physical Cycling supportive measures | W & C | Pull | Economic | 0 | 1 | 0 | 1 |
| Cycling allowed 2-ways in 1-way roads | W & C | Pull | Economic | 1 | 1 | 1 | 0 |
| Bicycle parking capacity | W & C | Pull | Economic | 1 | 1 | 0 | 1 |
| Total no. of policy measures implemented | - | - | - | 18 | 20 | 14 | 18 |
| Share of Car trips change | - | - | - | −14% | −15% | −3% | −10% |
| Share of Public Transport Trips change | - | - | - | 6% | −11% | −2% | 6% |
| Share of Cycling & Walking trips change | - | - | - | 10% | 26% | 6% | −10% |
Table 2.
Changes to policy measures over the period of examination. Source: see source of Table 1.
Table 2.
Changes to policy measures over the period of examination. Source: see source of Table 1.
| Policies | Bruges 1998–2011 | Ghent 1998–2012 | Jena 2001–2008 | Erfurt 1998–2008 | |
|---|---|---|---|---|---|
| Car transport policies | Paid parking (not all areas of city) | (1) Moderate price increase; and (2) Area extended | Slight to moderate price increase | Prices stayed the same | Slight increase of prices |
| Other details | Price hierarchy: free at P + R & P + W; moderate at underground; most expensive on street | Price hierarchy: more central = higher tariff | Two tariffs: inner city and rest | Two tariffs: inner city and rest | |
| Residential parking permits (not all areas of city) | Area extended (so less spaces for non-residents) | - | - | - | |
| Time limited parking | Allowed time shortened | - | - | - | |
| Underground parking (in centre) | - | Slightly extended around 2010 | - | - | |
| P + R | Parking = Free of charge | (1) Parking = Free of charge; and (2) Low frequency transfers only | Parking = Free of charge | ||
| Park + walk | Parking = Free of charge | - | - | - | |
| Public transport policy | Public Transport tariffs | Slight increase | Slight increase | Slight increase | Slight increase |
| Bus &/or tram network | - | Network expanded | Network slightly expanded | Some network innovations | |
| Non-motorised transport policy | Bicycle parking capacity | Expanded | Expanded | - | Expanded |
© 2018 by the authors. Licensee MDPI, Basel, Switzerland. This article is an open access article distributed under the terms and conditions of the Creative Commons Attribution (CC BY) license (http://creativecommons.org/licenses/by/4.0/).
Share and Cite
MDPI and ACS Style
Dijk, M.; Givoni, M.; Diederiks, K. Piling up or Packaging Policies? An Ex-Post Analysis of Modal Shift in Four Cities. Energies 2018, 11, 1400. https://0-doi-org.brum.beds.ac.uk/10.3390/en11061400
AMA Style
Dijk M, Givoni M, Diederiks K. Piling up or Packaging Policies? An Ex-Post Analysis of Modal Shift in Four Cities. Energies. 2018; 11(6):1400. https://0-doi-org.brum.beds.ac.uk/10.3390/en11061400
Chicago/Turabian StyleDijk, Marc, Moshe Givoni, and Karen Diederiks. 2018. "Piling up or Packaging Policies? An Ex-Post Analysis of Modal Shift in Four Cities" Energies 11, no. 6: 1400. https://0-doi-org.brum.beds.ac.uk/10.3390/en11061400
Note that from the first issue of 2016, this journal uses article numbers instead of page numbers. See further details here.