1. Introduction
The most important factor affecting measurements of wind turbine experiments in bounded wind tunnels (WT) is the existence of the bounding walls, which cause the change in the actual flow velocity entering the rotor of the wind turbine and the generation of non-uniform flows in the span-wise and vertical direction due to the production of secondary recirculations inside the test chamber. There is a difference between the flow field in the wind tunnel and one that occurs in the free field under the same operation condition because of the wind tunnel interference on the air flow, which leads to solid and wake blockage effects [
1]. As a wind turbine is placed in a bounded domain, such as a wind tunnel, the velocity and pressure fields confined within the stream-tube entering the rotor change compared to the far upstream: the stream-tube upstream of the rotor turns out to be contracted with respect to the free field case, which leads to increasing the working mass flow rate and a higher aerodynamic efficiency that can be higher than the Betz limit for wind turbines [
2]. Furthermore, the wake behind the wind turbine is not allowed to expand as it would do in free field conditions. Therefore, it is usually required to correct measurements for blockage [
3,
4].
Many investigations dealing with the study of the performance and aerodynamics of wind turbines were performed with no blockage correction, as reported for instance in [
5,
6]. These authors measured the performance of wind turbines in a wind tunnel with a blockage ratio of about 10%, where the wind tunnel blockage was defined as the ratio of the wind turbine swept area with respect to the wind tunnel cross-section area.
Most of the papers concerning this topic in the literature, however, took into account the blockage effects, and different approaches have been proposed to deal with this issue. Both experimental and numerical approaches exist, which are usually based on the comparison of the behavior of the turbine in bounded and free conditions.
As far as the numerical approaches are concerned, these are mainly based on CFD calculations or momentum blade theory, adopting the actuator disk or the actuator line to represent the wind turbine effects. The work in [
7], for example, proposed a correction model for the impact of the blockage in the German-Dutch Wind Tunnel (DNW), which is an open section wind tunnel, using the one-dimensional momentum approach. Numerous computational fluid dynamics (CFD) simulations were performed to validate the model, using the Navier–Stokes/Euler actuator disc (AD/NS) approach. The results showed a good agreement between computations and the outcomes from the corrected model. The work in [
8,
9] simulated a turbine/propeller using the actuator-disk modeling technique to account for blockage. They assumed the disk to be porous and inviscid, in order to evaluate the blockage effects through the momentum theory. Furthermore, the velocity and pressure of the flow were assumed to be homogeneous throughout the cross-sectional streamtube containing the working fluid, and the analysis was restricted to rotors with an infinite number of blades. The work in [
10] performed experimental and numerical work to study the blockage effect of Perugia University’s wind tunnel. That experimental work was carried out in the same closed circuit open test section wind tunnel that has been used for the present study. During numerical calculation, they designed the computational domain to match exactly the wind tunnel in order to account for the proper blockage effect, and they used an AD model to represent the wind turbine. The work in [
11] performed numerical simulations to study the effects of channel blockage on the performance of vertical and horizontal flow turbines. They also studied different channel areas, keeping the same blockage ratio, by varying the vertical and horizontal boundaries. The results showed that a blockage correction based on a simple momentum actuator disc approach is appropriate for both axial and low solidity cross-flows. Moreover, the performance of horizontal and vertical flow turbines depends mainly on the corresponding value of the blockage ratio unless symmetry differences greater than three would occur. The work in [
12] studied the effects of the wind tunnel interference on the characteristics of the wake shape and the power of a HAWT using the large eddy simulation (LES) approach and an actuator line model. Numerical calculations were carried out at different blockage ratios of 0.2, 0.09, 0.05, and 0.02 and for TSR values varying from 1–12. These results showed that, for TSR values lower than the optimal ones, the blockage effects were negligible on the power and thrust coefficients, as well as on the wake properties. On the contrary, for high TSR values close to the optimum ones, blockage ratios larger than 0.05 affect the power and thrust coefficients considerably.
Many papers assumed an experimental or mixed numerical-experimental approach to this issue. Some of them related to marine turbines as well. The work in [
13] carried out some experimental tests of the power and thrust of a marine turbine. The experiments were performed in a cavitation tunnel using a towing tank and an 0.8 m-diameter turbine. They corrected their measurements using the blockage model proposed by [
14], which is based on the actuator disc model as well. The work in [
15] investigated the effects of the channel shape on the tidal turbines’ performance, using CFD incompressible Reynolds-averaged Navier–Stokes (RANS) calculations. They utilized the actuator disc to represent the turbines and presented a new approach to take into account the turbulence generated by these turbines themselves.
Other studies have focused on the effect of tunnel blockage on the performance of vertical-axis wind turbines. The work in [
16], for instance, carried out an experiment to study the effect of the blockage ratio on the performance of a small-scale vertical axis Savonius wind turbine. They measured the static pressure along the side walls to derive the velocity increment in the test section under different inlet velocities and RPMs. Three identical models with different size scales corresponding to a blockage ratio of 2%, 3.5%, and 8% were investigated in two different wind tunnels to obtain a database for pressure signature. The work in [
17] performed some experimental tests to investigate the effects of the blockage ratio on the performance of the small-scale vertical axis Darrieus wind turbine. They used a single wind turbine in three differently-sized wind tunnels with a corresponding tunnel blockage ratio of 3.5%, 13.4%, and 24.7%. The experimental measurements were conducted at inlet velocities of 4, 5, 6, and 7 m/s. The results indicated that the power coefficients measured with blockage ratios of 13.4% and 24.7% were 1.3- and two-times higher than that with a blockage ratio of 3.4%. Furthermore, they recommended for the reference wind speed to be measured at a distance of 3.5-times or more than the turbine diameter. Furthermore, they proposed a new correction method based on measured drag coefficients to correct their power coefficient and TSR. The corrected power coefficient was validated through the comparison with the power coefficients obtained using different correction methods.
The work in [
18] investigated the effect of tunnel blockage on the performance of a HAWT. Experiments were performed using an open circuit wind tunnel with a closed test section of 1.69 m
(i.e., 1.3 m × 1.3 m). They used turbine blades with a radius of 30, 24, and 14.5 cm, corresponding to tunnel blockage ratios of 28.3%, 20.2%, and 10.2%, respectively. The results showed that the blockage effect was strongly affected by the tip speed ratio (TSR), blockage ratio
, and rotor pitch angle
. They demonstrated that the blockage effect was smaller at higher TSR and
values. In addition, the correction for blockage was less than 5%, when
was about 10% and the TSR less than 1.5. They also corrected their results according to [
13]. The work in [
19] performed some experimental tests to study the effect of blockage on small-scale wind turbines using wind tunnels both with closed and open circuit. The wind turbine was tested under the same operating conditions (rotating speed, rotor torque, speed of wind tunnel, advance ratio) for both wind tunnels. The experiments were carried out at blockage ratios corresponding to 48%, 18%, and 8%. The correction model proposed by [
3] was used for comparison with the experiments of the two wind tunnels. The results showed that Glauert’s method works well for all the conditions with low thrust. The work in [
20] analyzed the blockage effects of large-scale wind turbines in wind tunnel experiments. They tested two different circular wind tunnels: firstly, the radius was selected to maintain the same cross-section area as the real wind tunnel, and secondly, the radius was forced to be half of the smallest cross-sectional dimension. The results showed that there was not a unique equivalent section that allowed matching both the global coefficients and local flow characteristics.
Finally, Ref. [
21] presented an experimental and numerical study focusing on the effect of blockage on the wake expansion. The experimental measurements were conducted on a two-bladed rotor in an open jet wind tunnel by means of stereo particle image velocimetry (SPIV). The wind turbine rotor had a 1-m radius. 2D actuator disc and 3D wind rotor simulations were carried out. The numerical simulations were performed using the shear stress transport (SST)
k-
turbulence model. They simulated the wind turbine rotor by using an actuator disc model, which was 1 m in radius. The results showed that the flow field around the actuator model was affected by the geometry of the wind tunnel; therefore, the flow field is a different case of the wind tunnel and free field. The results from the wind tunnel and free stream were very close at a low thrust coefficient, while at a higher value of thrust, the wind tunnel results were higher. The work in [
22] also studied the effects of blockage on the wake evolution and expansion behind a wind turbine using dye visualization to analyze the propagation of tip vortices in a closed-section wind tunnel.
Many researchers have focused on the study of the effects of interference in open test section wind tunnels, which generate a certain degree of blockage. According to the analysis proposed in [
23], the sources of blockage in an open jet test section result from: nozzle blockage, jet deflection blockage, and collector blockage. The work in [
24,
25] performed some experimental works to study the aerodynamics and performance of a vertical axis wind turbine in a closed (10% blockage ratio) and open test wind tunnel. They found that the maximum power coefficient exceeded 0.35 in the closed wind tunnel, while it remained below 0.3 in the open test section. Furthermore, they concluded that a blockage correction method must be considered for a 10% blockage ratio.
The aim of the present study was to examine the role of wind tunnel blockage on the performances of small-scale wind turbines with different rotor configurations, namely three and five blades, as well as to understand the effect of the turbine rotor’s speed on the blockage itself. The experimentally-measured power coefficients and TSRs were corrected using two correction methods for comparison, i.e., the correction method presented in [
11] for closed test sections and the one reported by [
23] for open test sections. The corrected power coefficients were then compared to free field conditions using CFD calculations in order to show how the different corrections perform. It was confirmed that a specific correction for open-test section wind tunnels was required to reproduce properly the free field conditions, and it was found that the method proposed by [
23], already tested by [
24,
25] on vertical axis wind turbines, was suitable for horizontal axis wind turbines as well.
2. Experimental Setup
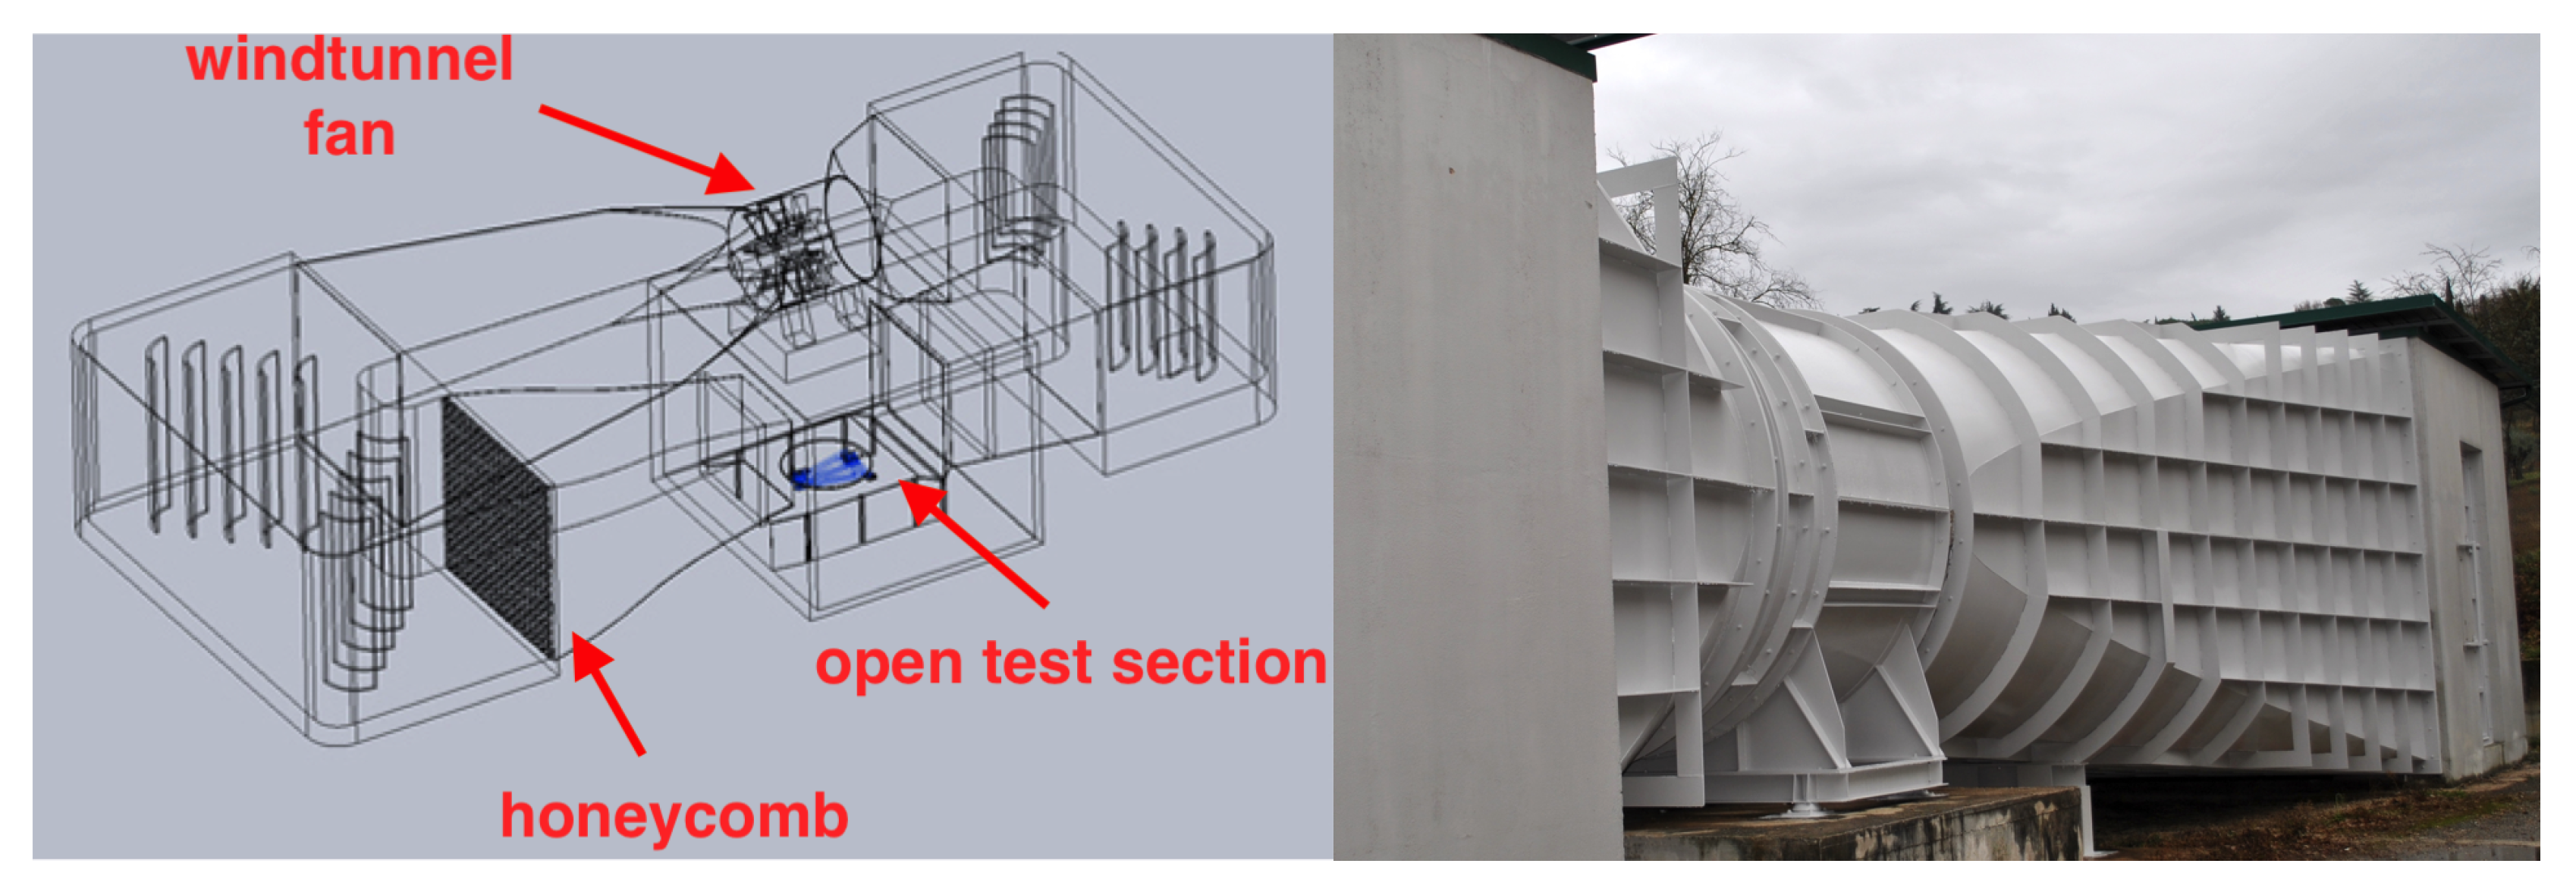
The experimental setup was designed to study the wind tunnel blockage and clearly understand the aerodynamic behavior of an horizontal axis wind turbine (HAWT). The experimental work was carried out in a closed-loop open test section of the University of Perugia (Italy). The experimental measurements were performed on a wind turbine using different numbers of blades, namely three and five, at different TSR. The rotor diameter was 2 m, and the turbine blades were jointed to a hub whose diameter was 26 cm. The blades had a constant pitch angle with varying rotational speed from 100–800 RPM, and the maximum power production was 2.8 kW. This wind tunnel was a closed-loop wind tunnel, driven by a 375-kW electric motor. The wind speed in the wind tunnel can be increased up to a maximum speed of 47 m/s. The schematic representation of this wind tunnel is shown in
Figure 1.
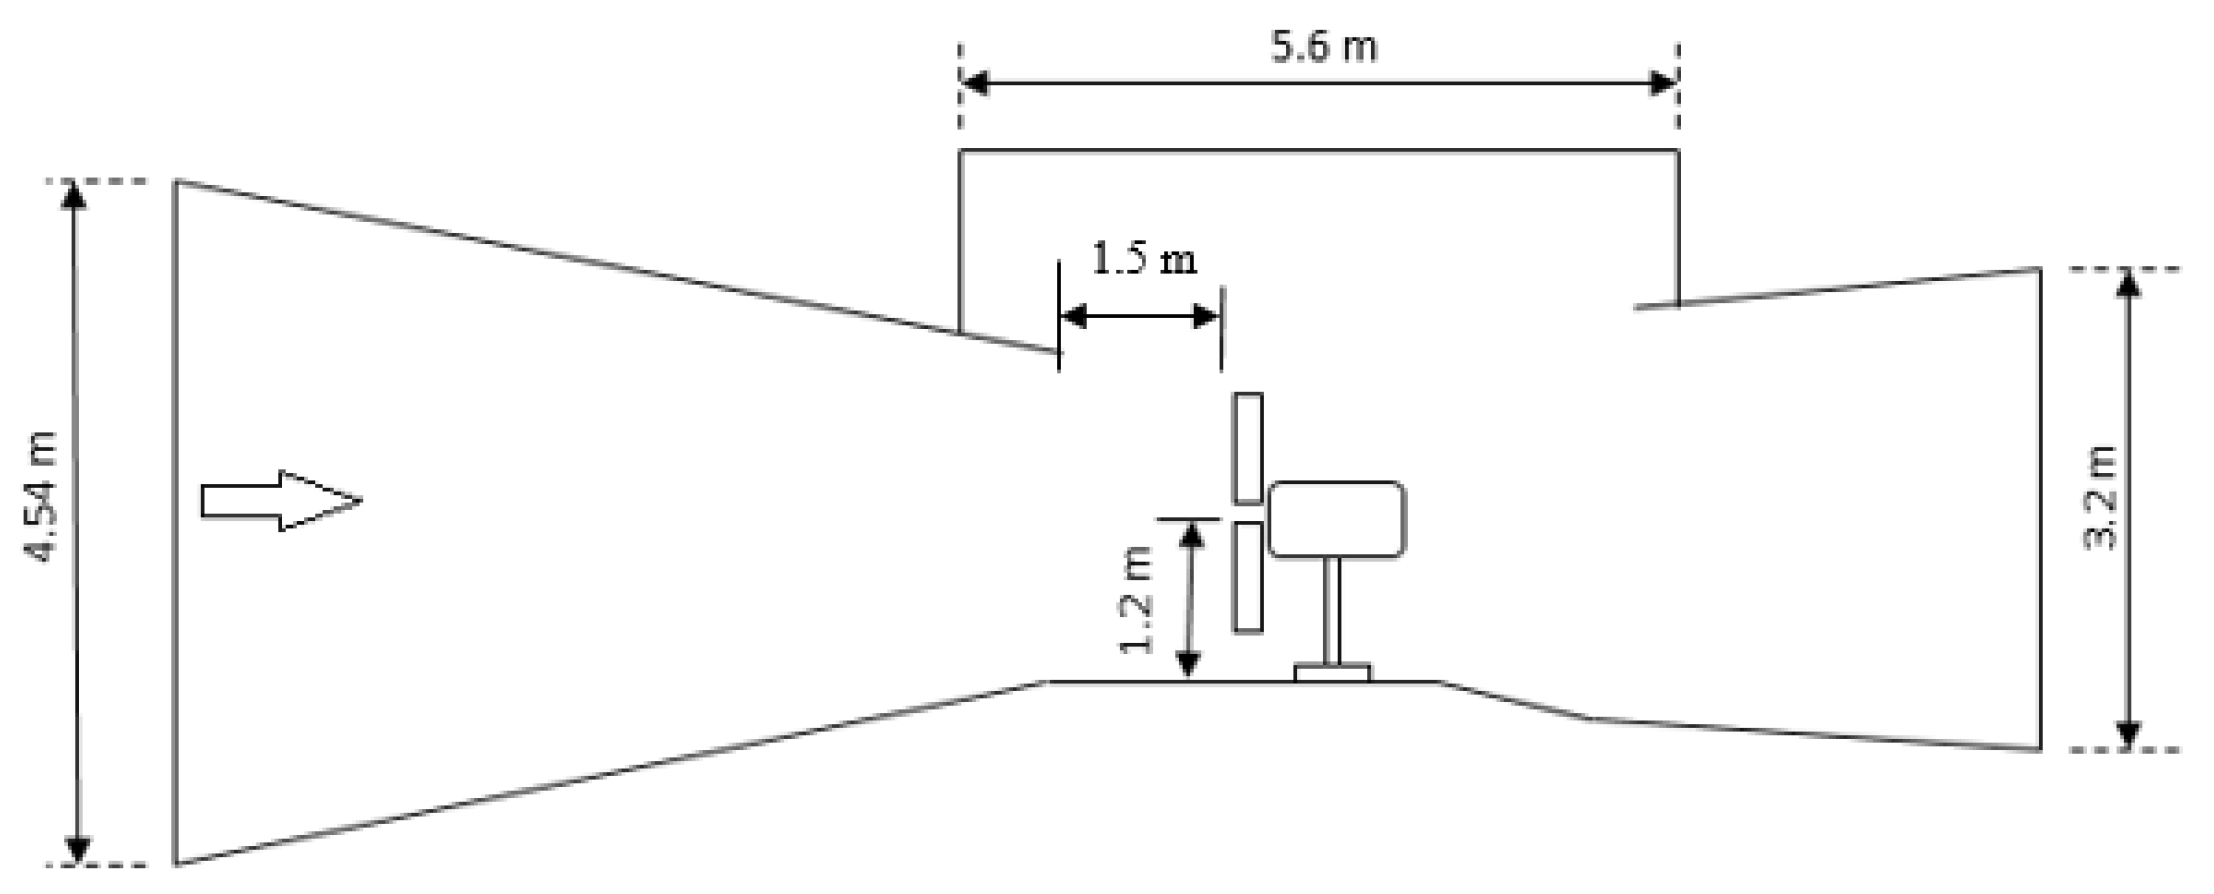
The inlet section of the closed test chamber had an area of 5 m, whereas the recovery section was 7 m. The inflow conditions in the inlet section were measured with two Pitot-static tubes and a cup anemometer placed near the minimum section of the converging section, upstream of the test section. All the atmospheric parameters (static air pressure, temperature, and relative humidity) were collected on a station point in the testing room. A honeycomb upstream the test section kept the turbulence level below 0.4%. Because of the wind turbine, a blockage ratio of 0.145 occurred in the test section.
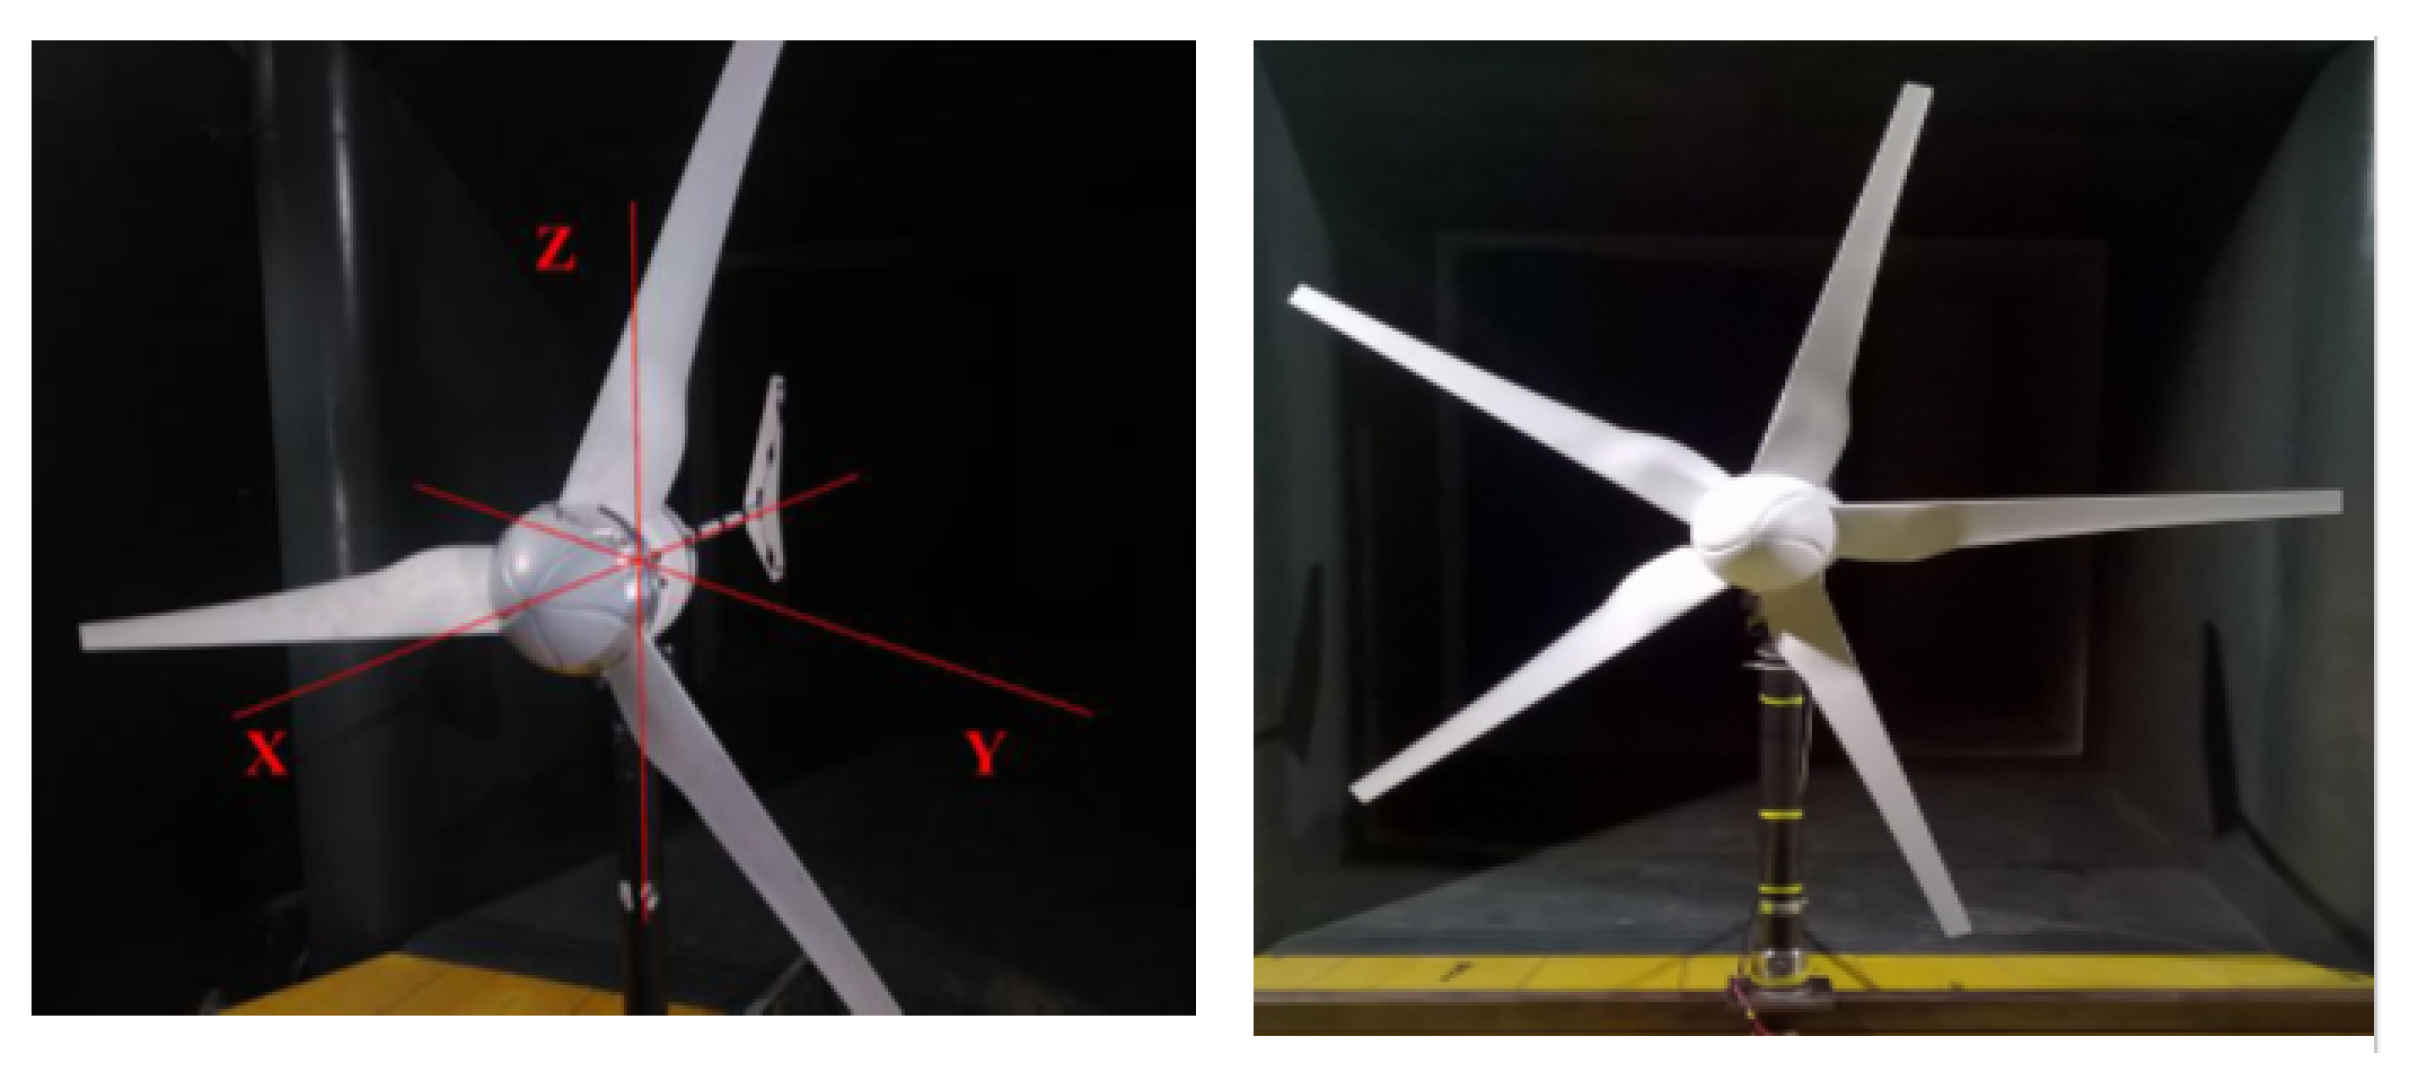
Figure 2 shows the three- and five-blade HAWT that have been used in this study. The turbine was located 1.5 m down exit convergence, and the hub height was 1.2 m from the floor of the test chamber (see
Figure 3). Blades had a constant pitch angle with varying rotational speed from 100–700 RPM (see [
26,
27,
28]). This study investigated different inlet velocities of 6, 7, and 8 m/s. During each test, the velocity was measured with and without the wind turbine rotor in the wind tunnel. The power coefficient in the wind tunnel condition was obtained from the measured data using the following relation:
where
P is the generated power, Uis the wind speed in the wind tunnel with rotor,
is the air density, and
R the rotor radius. In the present paper, the measured power coefficient was corrected using the equations for blockage correction reported in [
23]. The overall open test section blockage correction can be calculated as:
where
U is the free stream wind speed in the wind tunnel with rotor,
is the corrected upstream wind velocity,
is the correction velocity due to jet expansion,
is the correction velocity due to nozzle blockage, and
is the correction velocity due to collector blockage. For the current wind tunnel, the non-dimensional parameters in Equation (
1) were calculated using the equations reported in [
23] and turned out to be
= −0.0137,
= 0.001217, and
= 0.1275, yielding overall
equal to 0.896.
In addition, the correction method for closed tunnels proposed by [
11] is also presented for comparison, which is mainly based on the definition of the so-called blockage factor (BF), which turns out to be as follows:
where BF is the ratio between the free stream wind speed in the wind tunnel with rotor,
U, and the freestream wind speed in the wind tunnel without rotor,
.
Accordingly, the power coefficient
, as well as the tip speed ratio (TSR’), considering the blockage induced by the presence of the rotor, can be defined as a function of the scale parameter BF as follows:
where
and TSR’ are the corrections of the non-dimensional power coefficient and tip speed ratio to make them equivalent to free stream conditions.
3. Numerical Calculations
Numerical calculations have been carried out using the commercial CFD package Ansys Fluent to study the effect of tunnel blockage on the power coefficient of HAWT. The flow characteristics were obtained by solving the governing equations, i.e., the continuity and momentum conservation equations, and turbulence closure. The flow was considered three-dimensional, steady, and incompressible. The numerical simulations were performed using a steady-RANS method with the SST
k-
turbulence model. The work in [
29] compared the performance of different turbulence models: they found that the SST
k-
turbulence model was able to predict flows with separation properly where adverse pressure gradients occur. The SST
k-
model is an empirical model based on transport equations for the turbulence kinetic energy
k and the specific dissipation rate
[
30]. The work in [
31] performed experimental and numerical work to study the aerodynamic of two types of HAWT. One was the non-twisted blade with constant chord length, and the other one was designed by blade element momentum theory (BEMT). They used the Spalart–Allmaras and SST
k-
turbulence models to solve (RANS) equations. They obtained an excellent agreement between experimental measurement and from simulation with SST
k-
. The work in [
32] performed extensive experimental and numerical work to investigate the aerodynamic and flow field for three different HAWT with the same diameter of 0.72 m and the same NACA4418 airfoil profile. The first one was designed using BEMT, the second blade was untapered and twisted; and the third blade was untwisted with constant chord length. The numerical calculation was performed using the SST
k-
turbulence model. They obtained good agreement between measured and calculated power coefficients for all studied turbine blades. Finally, Ref. [
33] studied the effects of stators on a vertical axis wind turbine through experimental wind tunnel tests and investigated the effect of the blockage in the wind tunnel through steady RANS simulations.
The moving reference frame (MRF) strategy was used to model the rotating wind turbine. In this model, the equations governing the motion were modified to take into account the additional source terms that occur due to the transformation from the stationary to the moving reference frame. The flow around the moving parts was modeled by solving these equations in a steady-state framework. The fluid surrounding the rotor was considered to be rotating with the blades, and an absolute velocity formulation approach was chosen. When this kind of formulation is used, the governing equations are written with respect to the reference frame of the computational domain. Velocities, however, are stored in an absolute frame.
3.1. Computational Domain
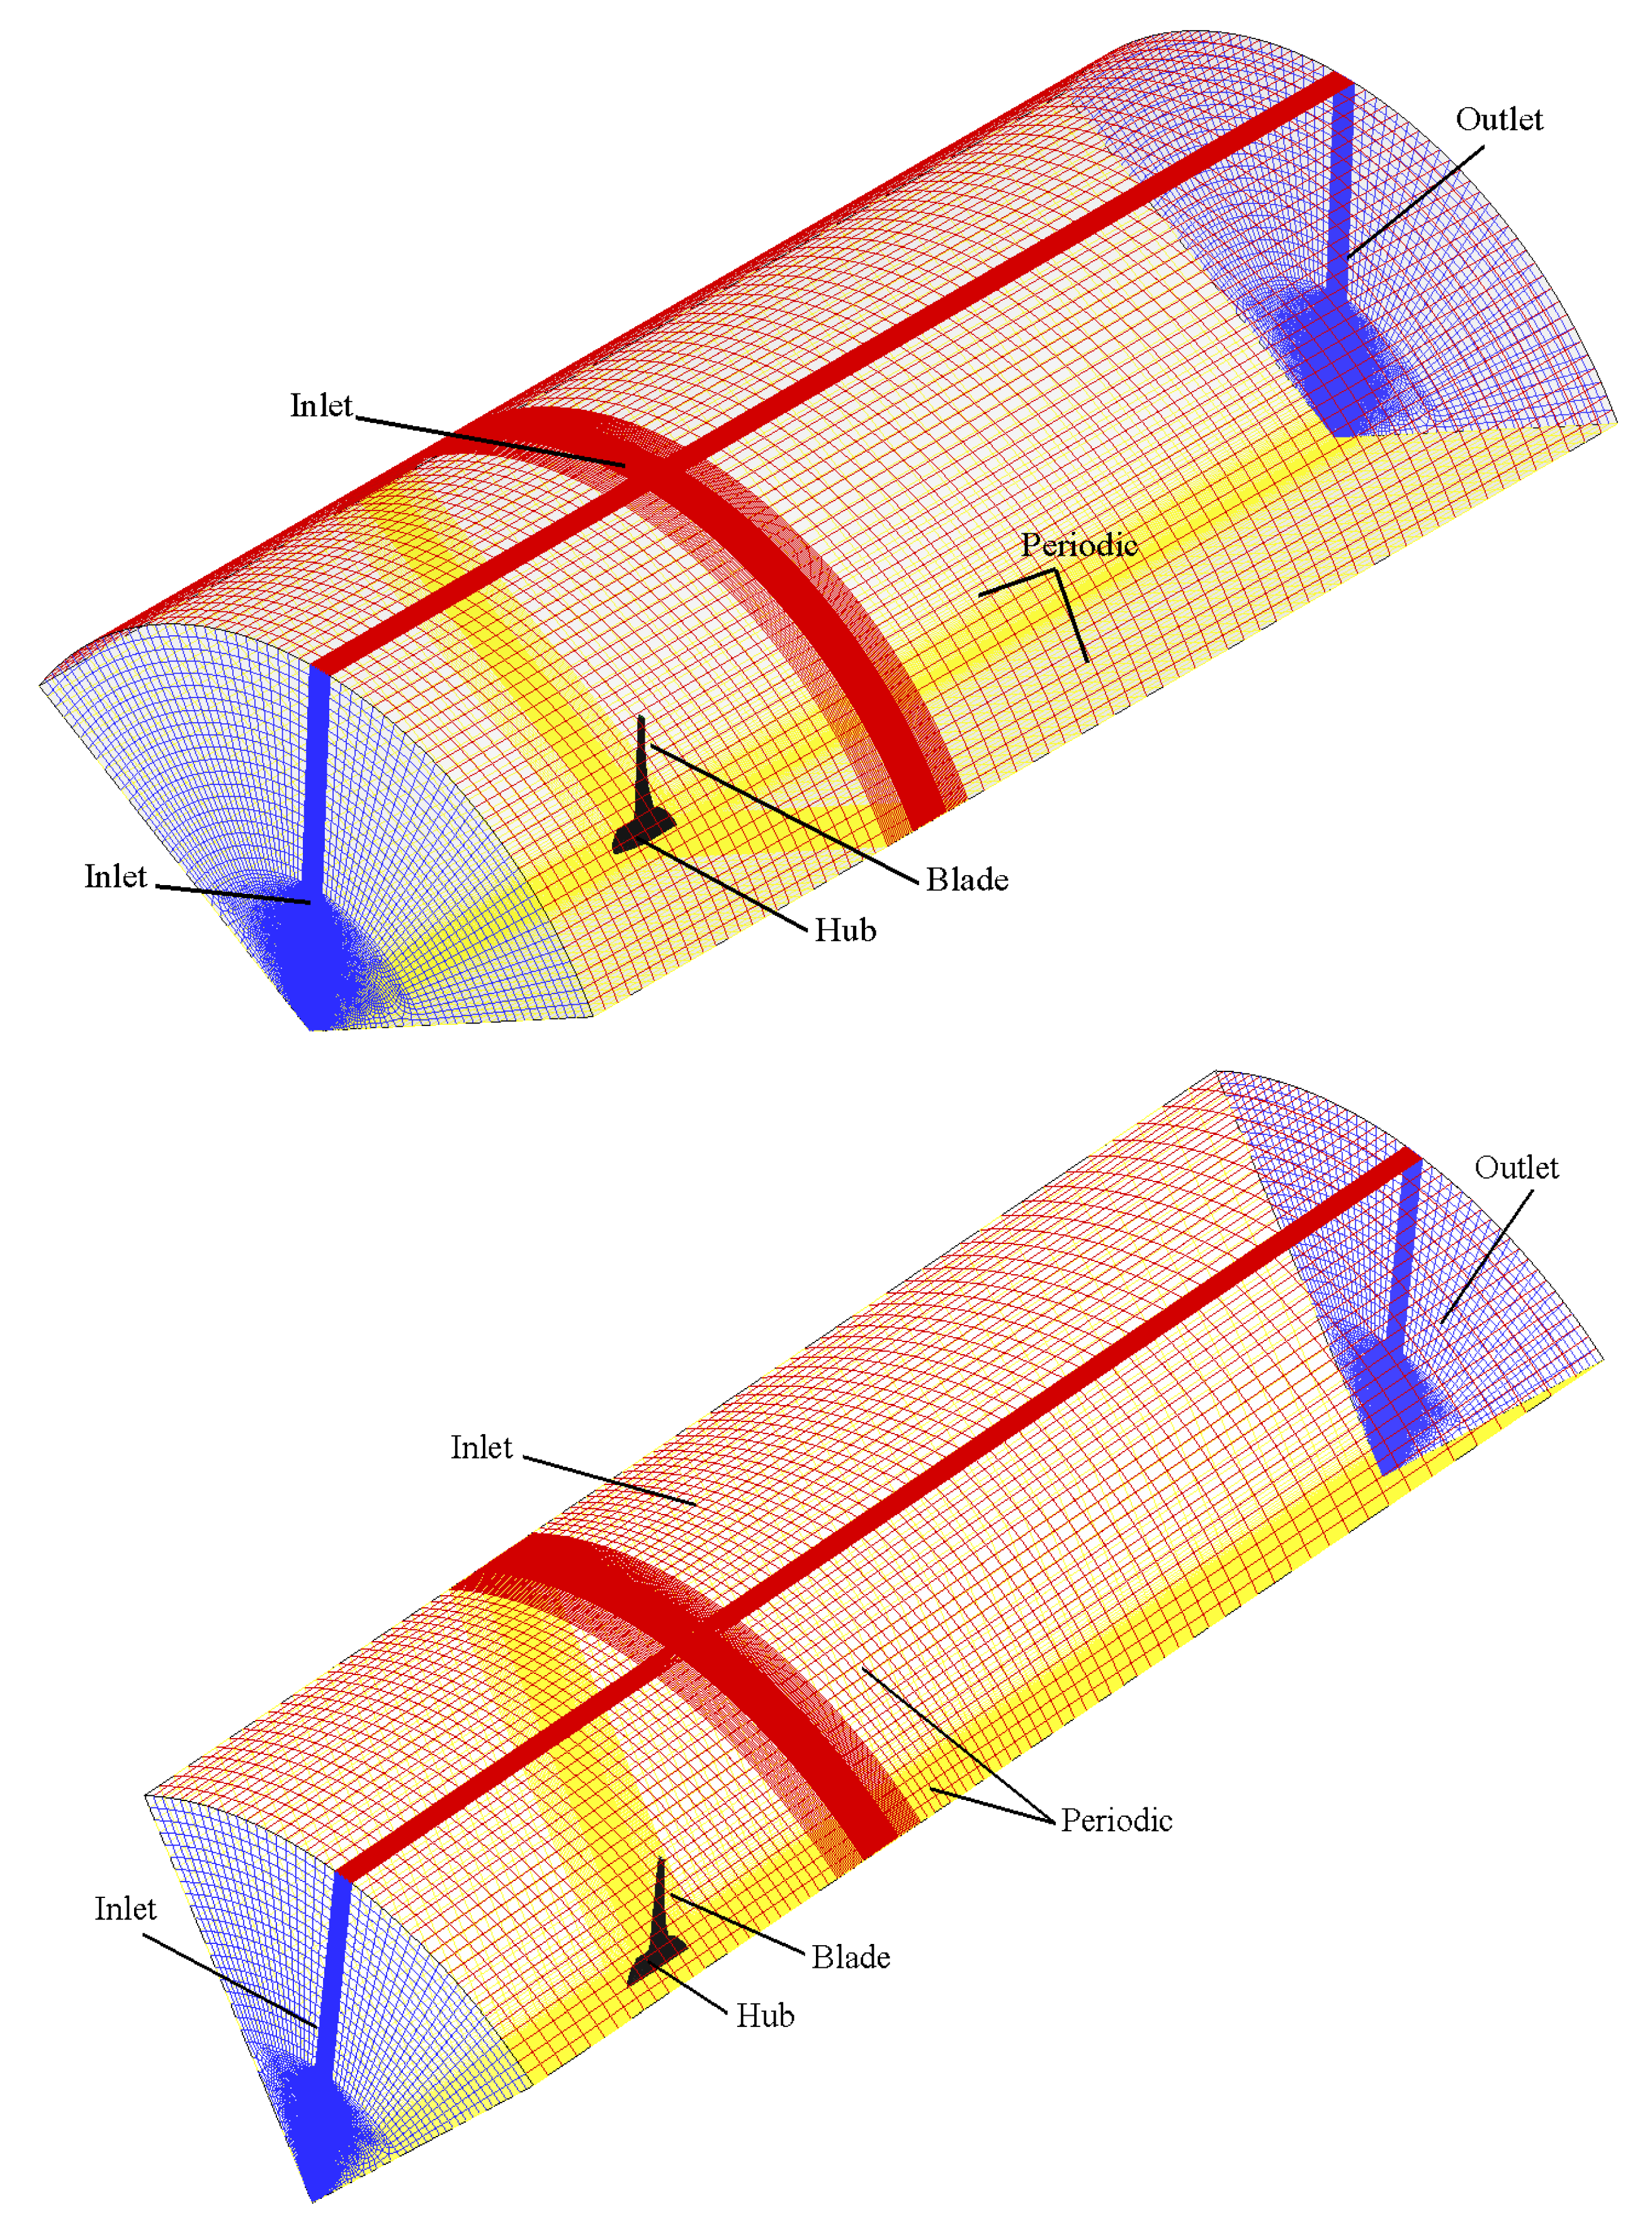
The preprocessor ANSYS ICEM 14 was used to generate the computational domain and mesh for the three- and five-blade HAWT, shown in
Figure 4. The turbine rotor and hub were the only parts simulated, whereas the other parts of the wind turbine such as nacelle and tower were not included. As far as the dimensions of the computational domain are concerned, the work in [
31] used a length of 1.5 and 10-blade radius upstream and downstream the turbine, respectively, whereas [
34] used a downstream length of six-blade radius. According to these authors, in this paper, the computational domain extended three times the rotor radius in the upstream and radial direction and seven times the radius downstream of the rotor. The turbine symmetry allowed simulating only 120 and 72 degrees of the whole rotor for the three- and five-blade wind turbine case, respectively, in order to save computational time, adopting periodic boundary conditions in the circumferential direction.
3.2. Grid Generation
The complexity of the shape of the blades, which were twisted with respect to their longitudinal axis, made the grid generation particularly difficult, so that a multi-block topology with hybrid types of cells had to be adopted.
The domain was divided into 72 blocks for three- and five-blade wind turbines, and the grid was generated in each block individually. The work in [
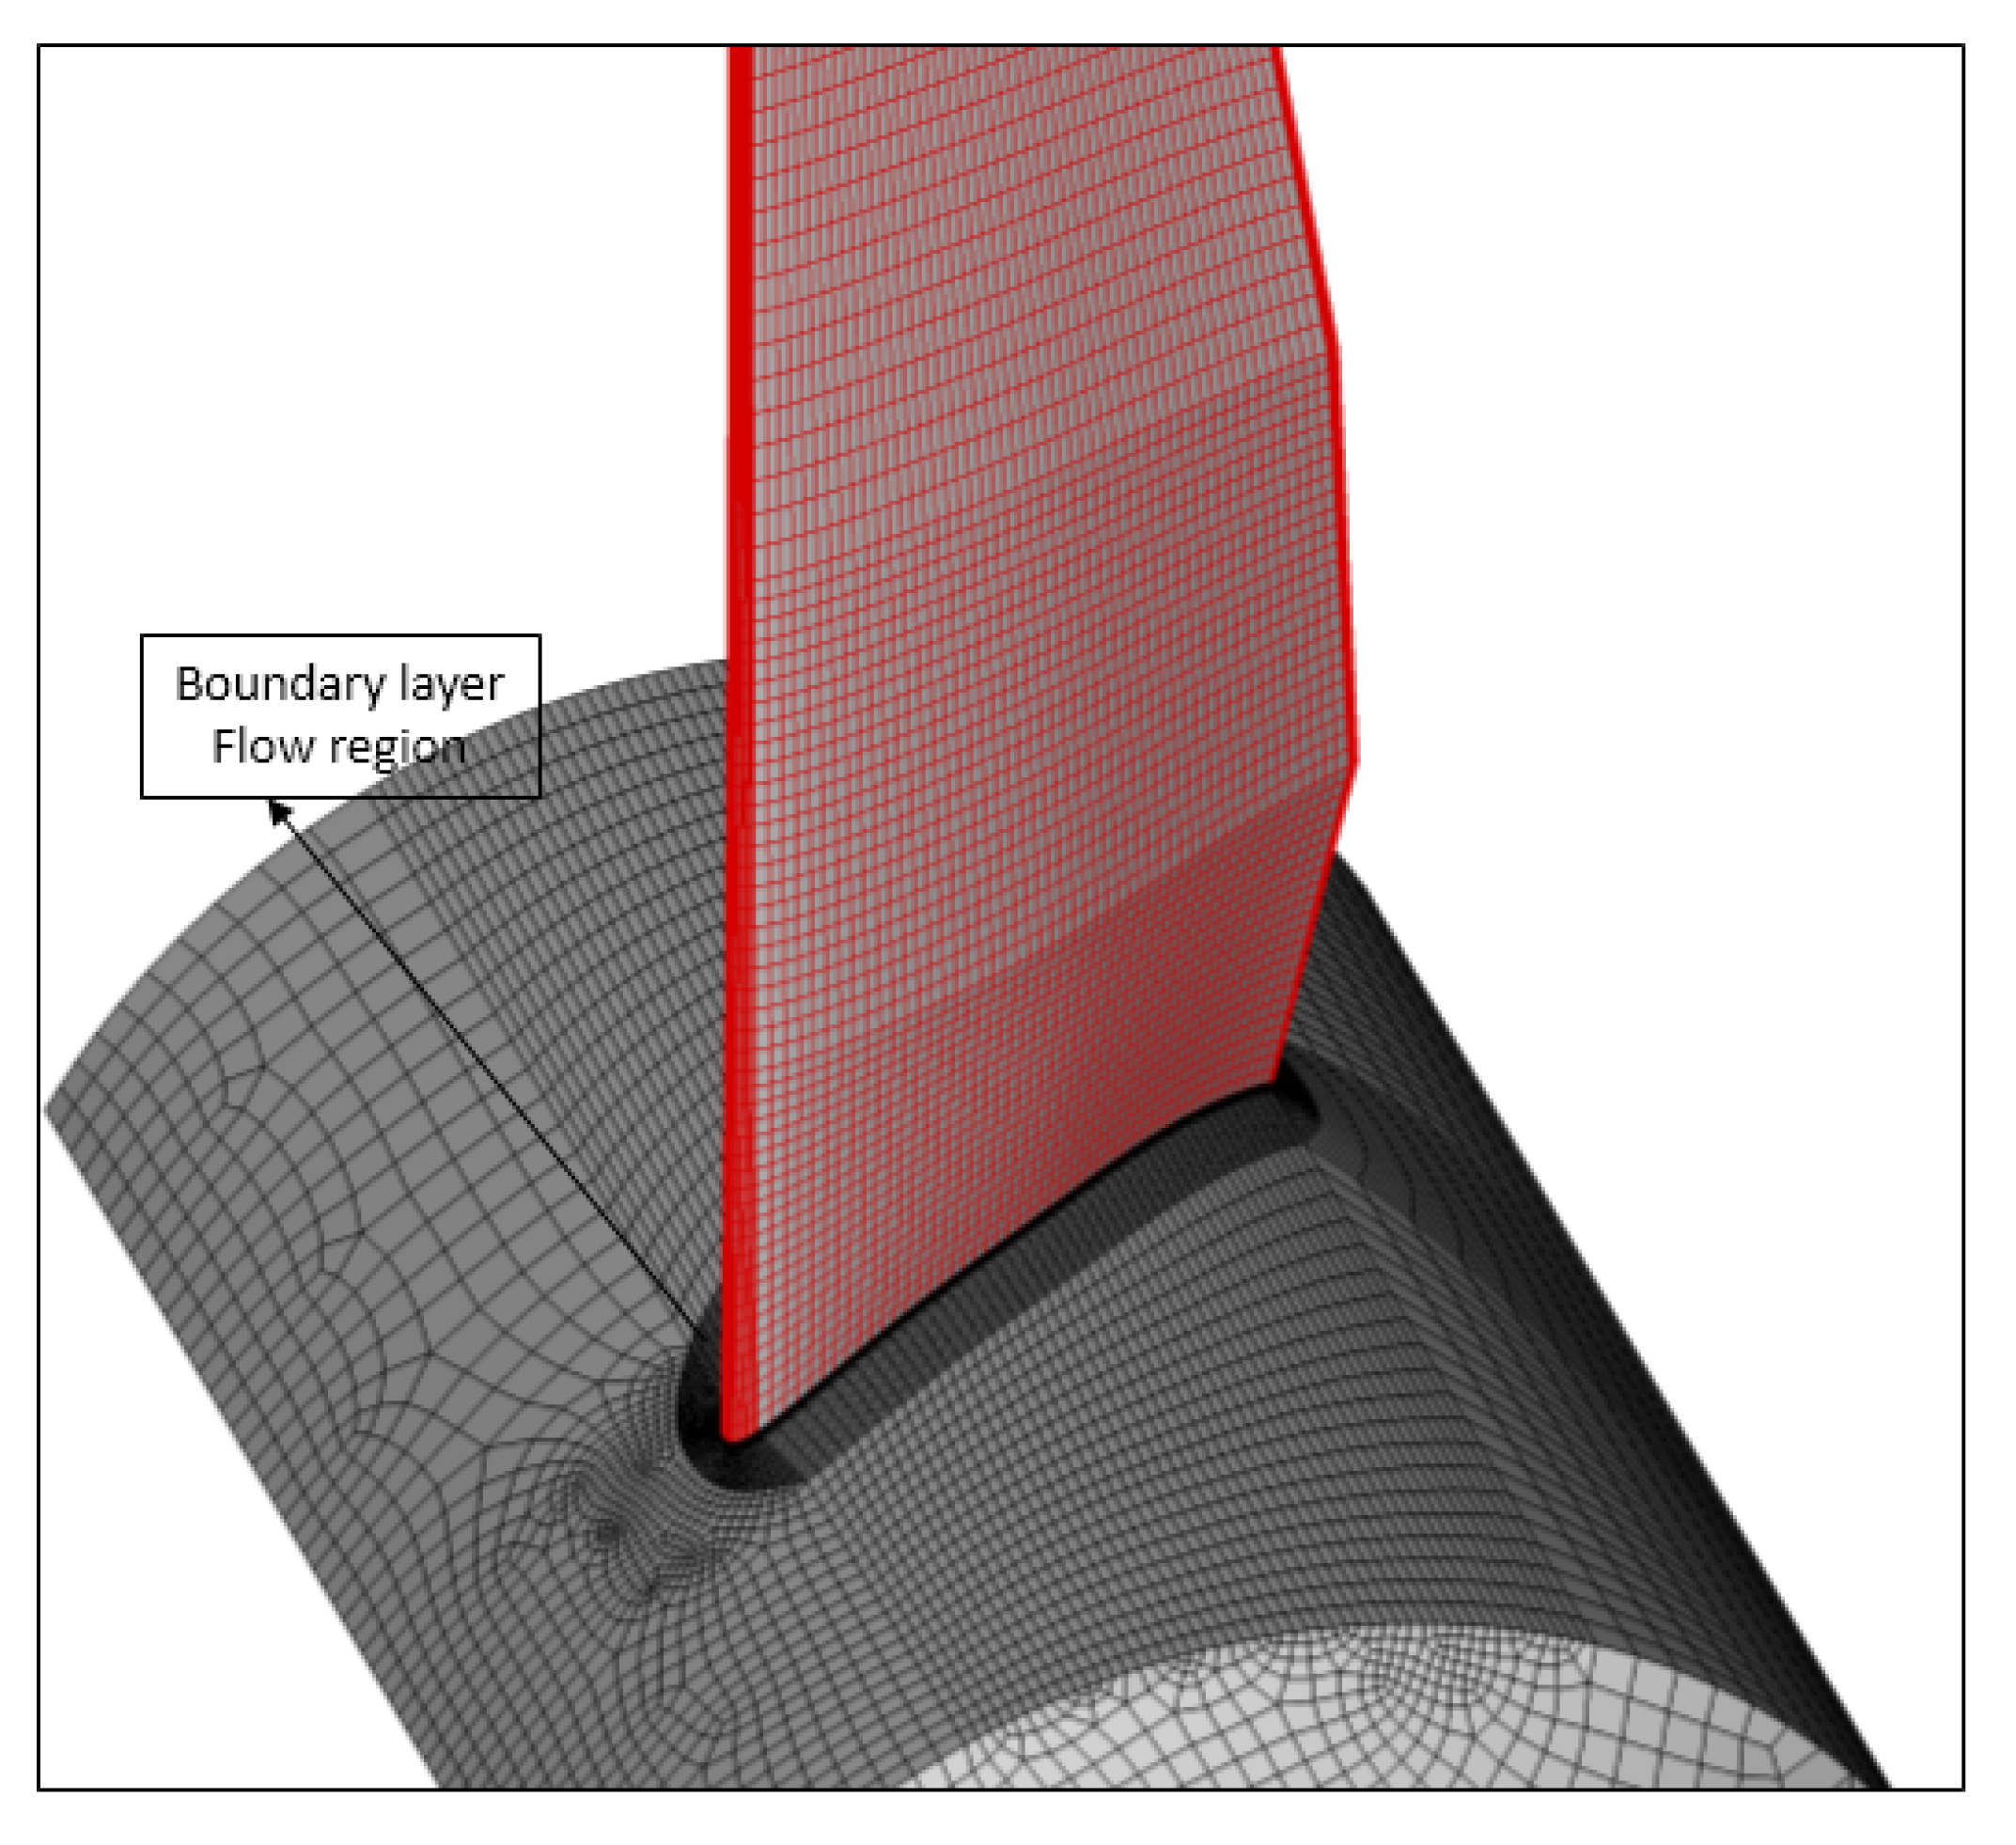
35] studied different near-wall grid spacing on the performance of National Renewable Energy Laboratory (NREL) Phase VI HAWT. They concluded that 12–20 nodes were required inside the boundary layer for safe results, and a value below 12 nodes led to inaccurate results. In addition, 100 nodes/m for chord-wise direction can be acceptable. The blocks close to the blade were generated using an O-grid to allow higher resolutions near the solid walls to solve the flow in the boundary layer near the blade, as shown in
Figure 5.
The mesh for the blocks representing inlet and outlet regions was a structured one, except for the blocks near the hub region, where an unstructured mesh was adopted. The surface of the rotor was structurally meshed with 150 cells in the chord-wise direction, and the cells were more concentrated at the leading and trailing edges. One hundred fifty four cells were used in the span-wise direction. A finer mesh in the normal direction was created for the expected thin boundary layers on the blade surface. The boundary layer mesh had 14 rows, with the height of the first row around 0.003 mm from the wall, and it had a maximum y+ of two. The normal spacing had a growth factor of 1.3. The final meshes contained about 4.3 and 3.8 million cells for the three- and five-blade wind turbine, respectively.
The velocity of the incoming flow was measured experimentally and then applied at the inlet and outer boundaries. To simulate the free field condition, the wind tunnel walls were not considered in the calculations, and accordingly, there were no walls that prevented the streamlines from expanding freely. In the present study, the performances of the two wind turbines were investigated for inlet velocities of 6, 7, and 8 m/s. No-slip boundary conditions and rotation were specified at the walls on the blades. The flow was considered fully developed at the outlet boundary, and the measured static atmospheric pressure was applied there.
4. Results
Figure 6a,b shows the relationships between experimental measurements of the tunnel blockage factor (BF) and TSR and the relationships between BF and thrust coefficient (CT), respectively, at different inlet free stream wind speeds of 6, 7, and 8 m/s, for the case of the turbine with three blades. It can be seen that the wind speed had a small effect on the blockage factor BF, as all the curves almost overlapped one another, especially at high values of TSR (or CT). For all the studied wind speeds, the blockage factor decreased with increasing the tip speed ratio, except for the lowest wind speed, i.e., 6 m/s, where the BF slightly increased up to TSR = 2 and then decreased. When TSR was larger than eight, all the BFs asymptotically became constant, reaching a lower-bounded value of approximately 0.88. This behavior was due to the fact that, while at low tip speed ratios, the mass flow rate through the rotor was quite high, at larger TSR values, the turbine blades rotated so fast as to act like a solid disc. Therefore, the thrust coefficient CT increased, and the air was more and more forced to flow around the rotor. In principle, this effect should be reduced in an open test chamber wind tunnel with respect to a closed one, but in fact, it was only reduced because some secondary recirculation vortices occurred at the corners of the test section that limited the stream tube widening (see [
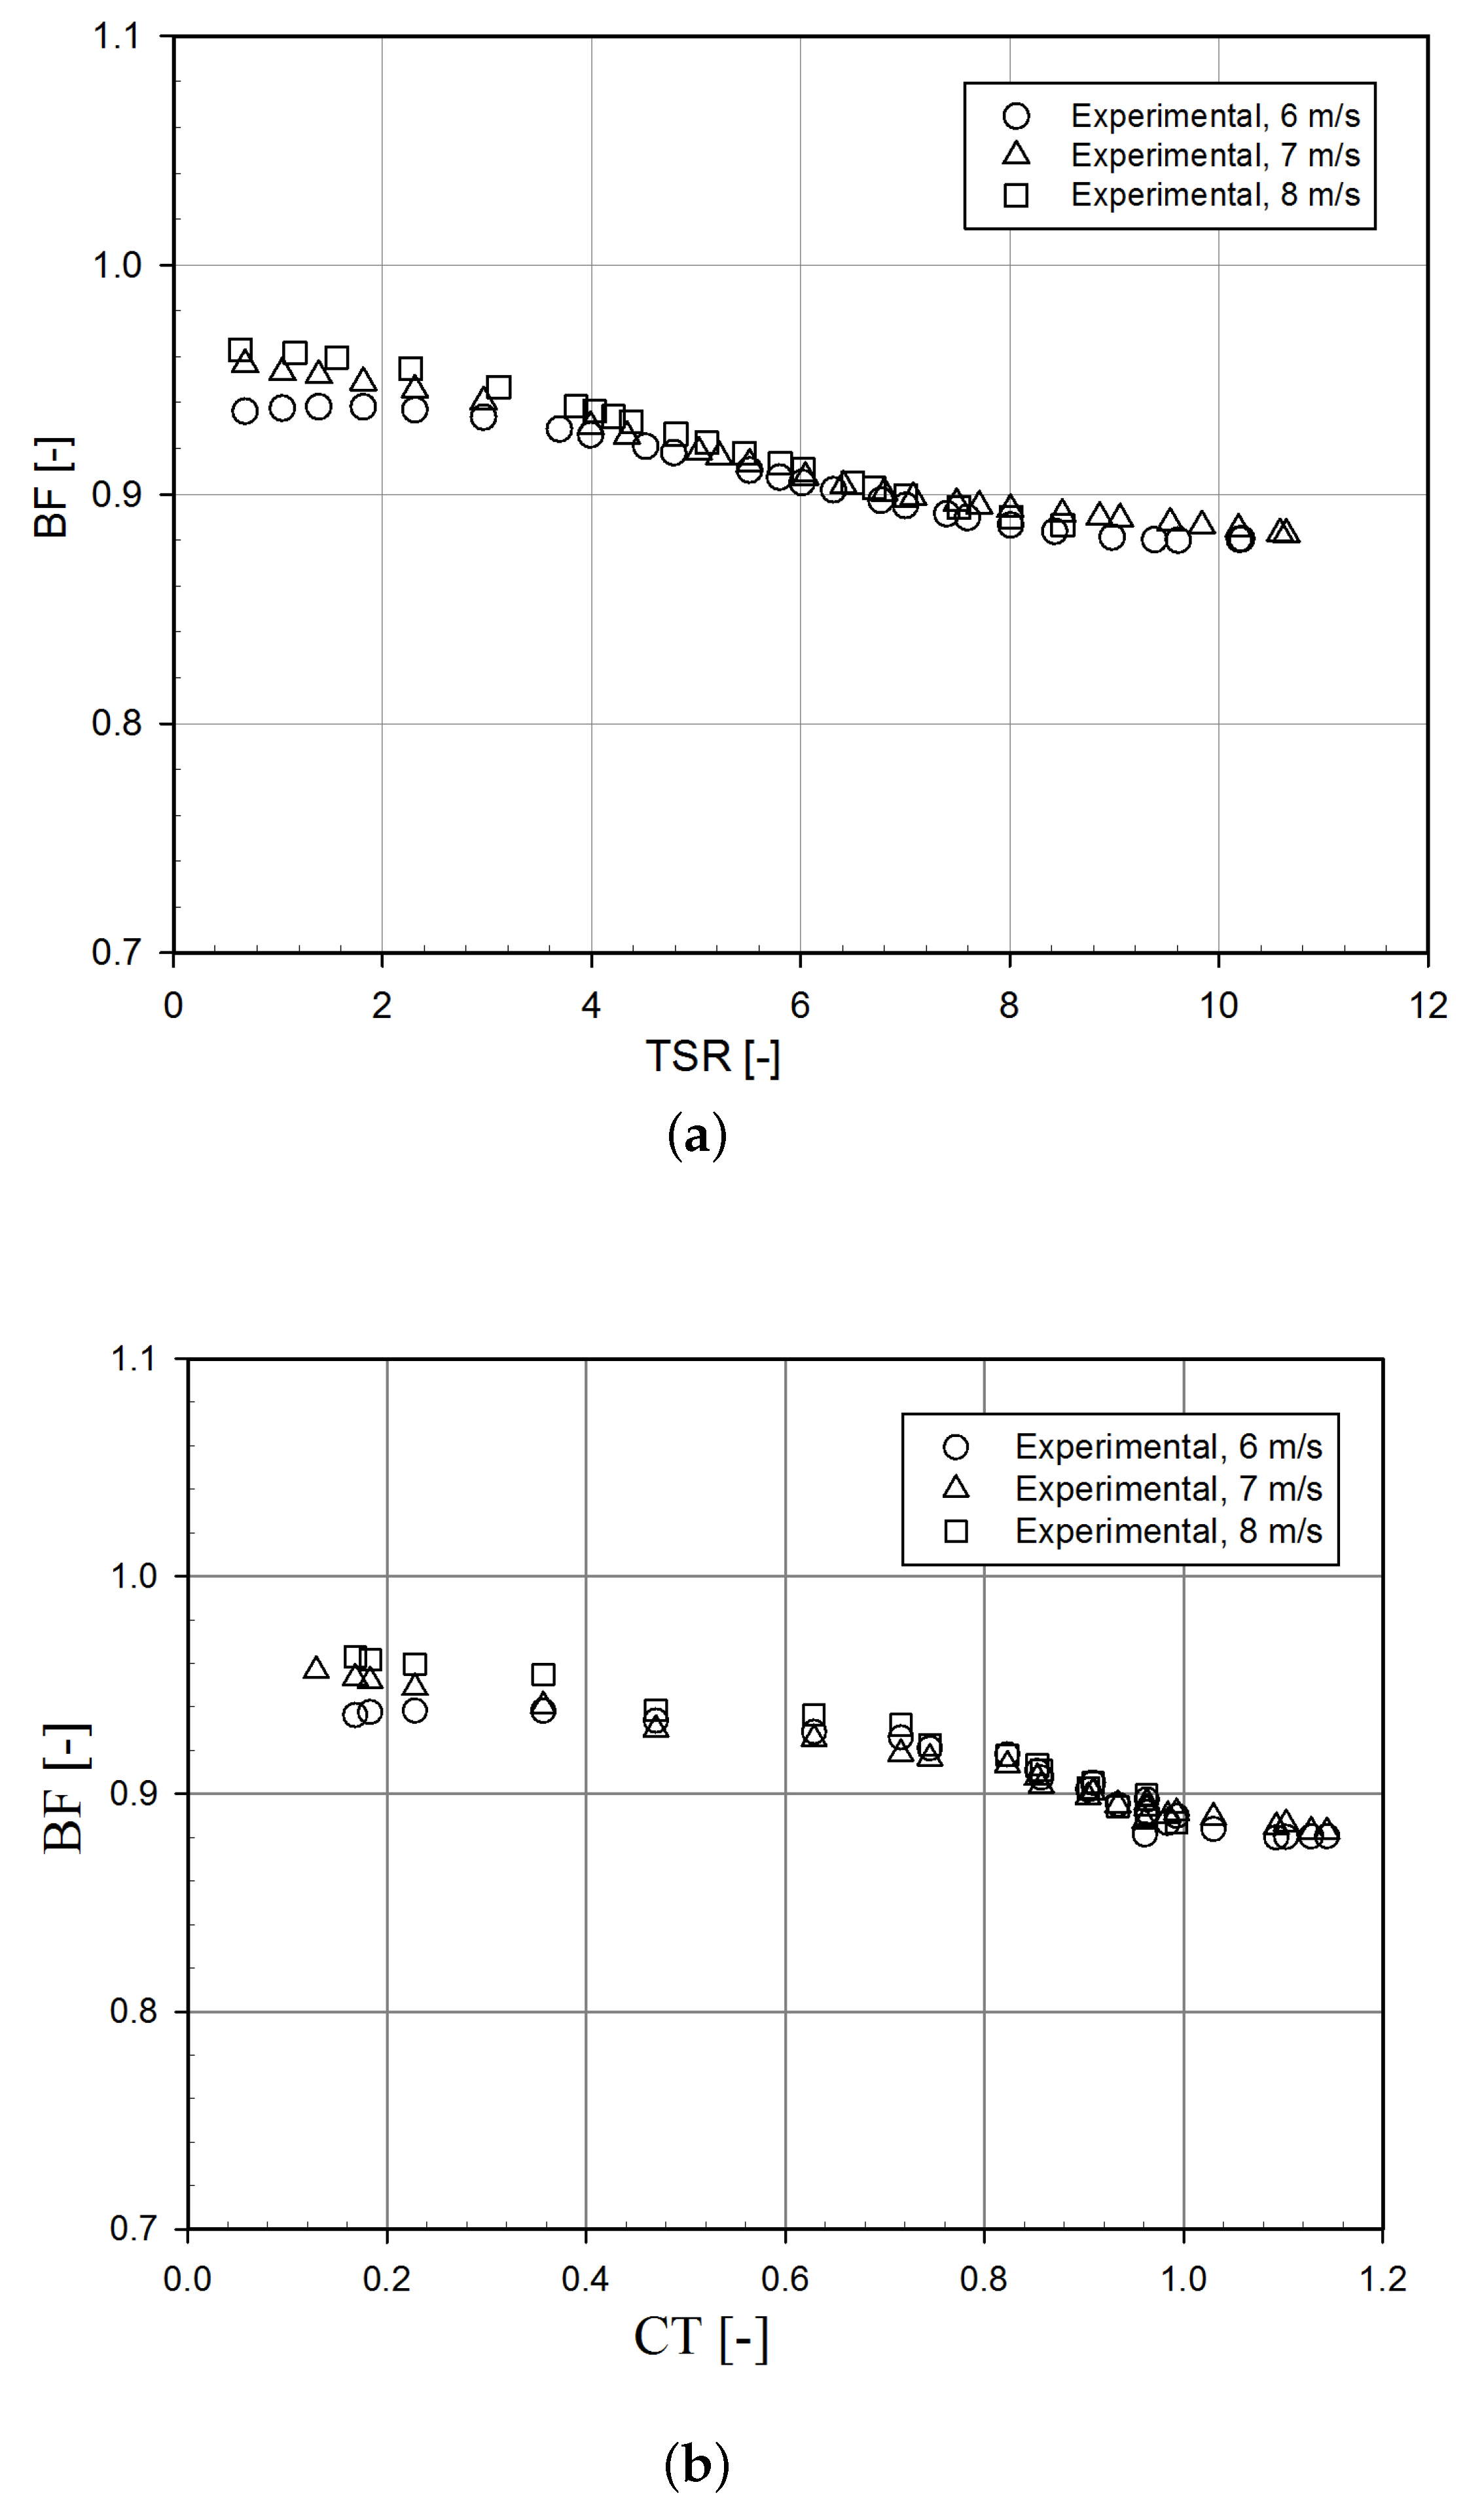
10]). When the wind turbine rotational speed increased, the effect of the rotation reduced the size of such large recirculations and decreased the boundary layer thickness along the walls, thus reducing the overall surface drag in the chamber, until the asymptote was reached. After this point, an equilibrium was reached between all the terms mentioned above, which was independent of the inlet wind speed.
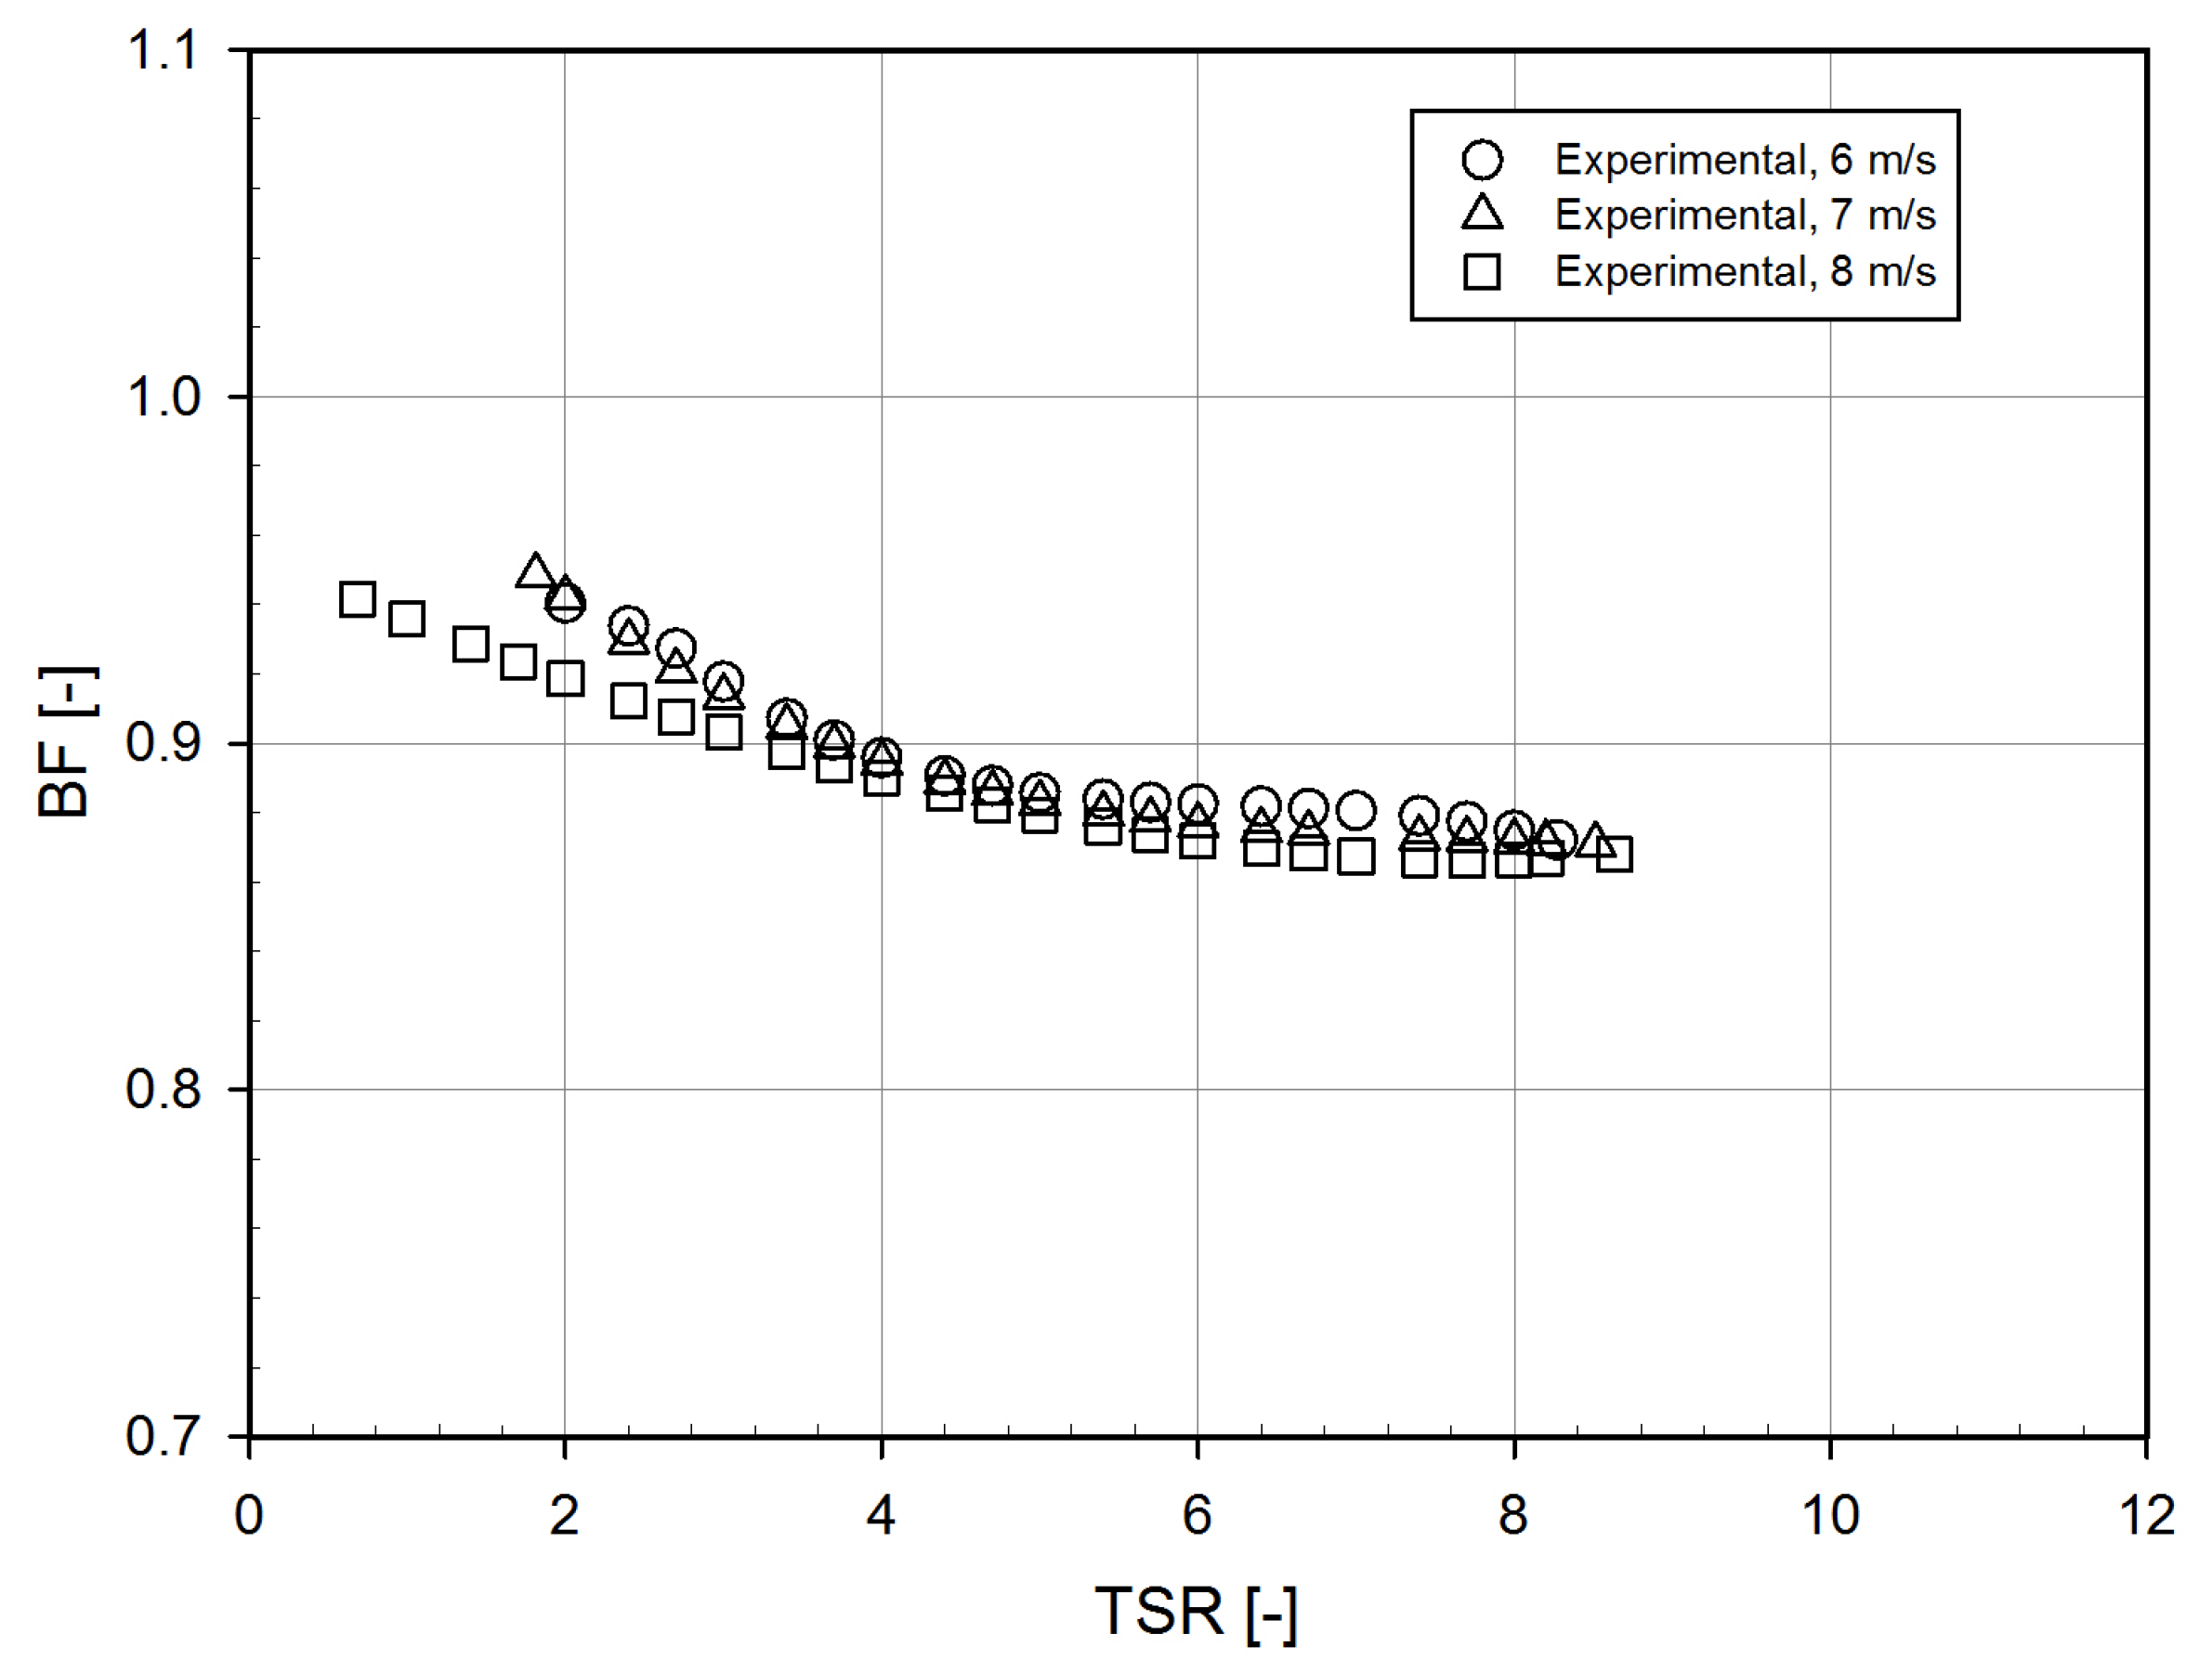
Figure 7 illustrates the experimental measurements of the tunnel BF at different inlet free stream wind speeds of 6, 7, and 8 m/s, as a function of the TSR for the HAWT with five blades. The trend of BF for the five-blade wind turbine was not completely similar to that for the case with three blades. The rotation effect described above was observed here with a stronger impact. For all cases, the blockage factor decreased with increasing the tip speed ratio, and the BFs were still very similar for different inlet wind speeds. However, the effect of rotation was stronger in the present case than in the case with three blades, which made the BF reach the asymptotic behavior approximately after TSR equal to six, instead of eight. Furthermore, the value of the asymptote was slightly lower than the three-blade case, which could be due to an increase of the swirling effects of the blade tips on the wind flow that contributed to reducing the boundary layer thickness at the walls and the recirculation vortices at the chamber’s corners.
In order to study the effect of tunnel blockage on the HAWT performance, it is necessary to compare the corrected measured power coefficient to the calculated one under free field conditions. The tunnel blockage led to an increase in the wind velocity approaching the turbine rotor, which in turn led to an increase of the produced power with respect to that produced in the field for the same wind speed. In the numerical calculation, the inlet velocity was taken from the measurements without blocking, which was lower than the wind speed entering the turbine in the wind tunnel when blockage effects occurred. In addition, the air flow entering the rotor was much higher than the mean velocity because of the thick boundary layer that developed along the wind tunnel walls. It can be expected that the presence of the tunnel walls affected the stream tube entering the rotor as a shroud would do, increasing the flow rate entering the rotor itself.
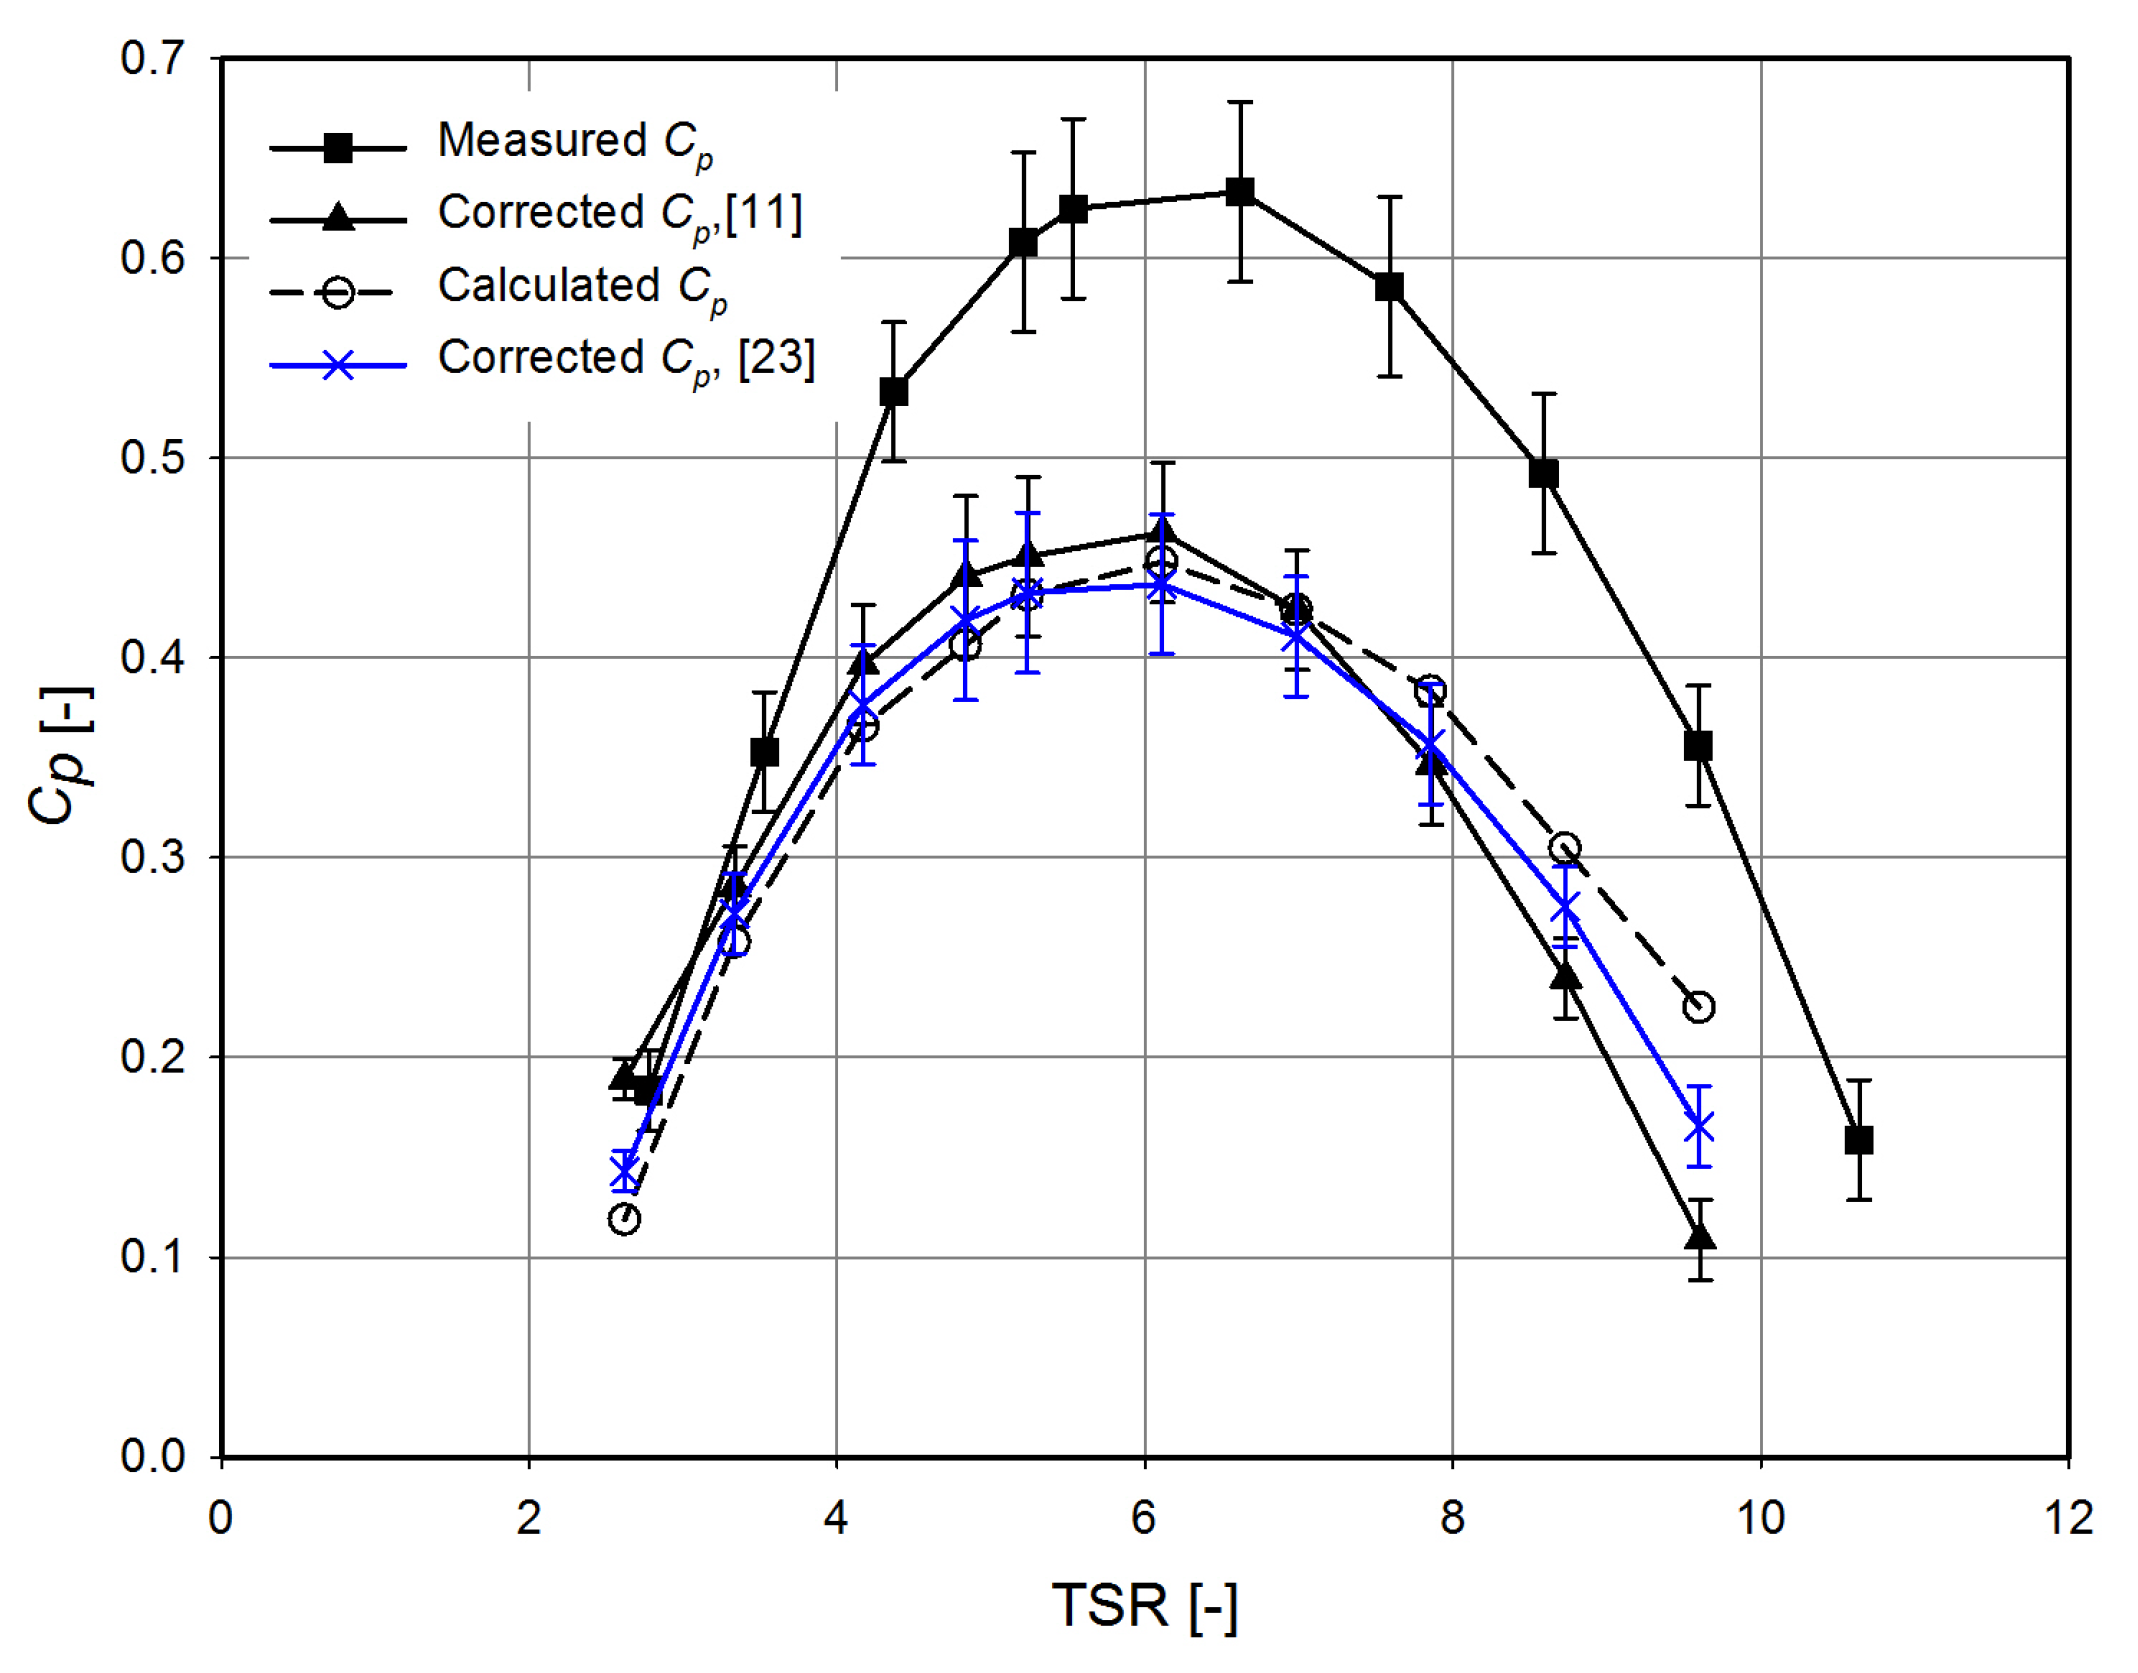
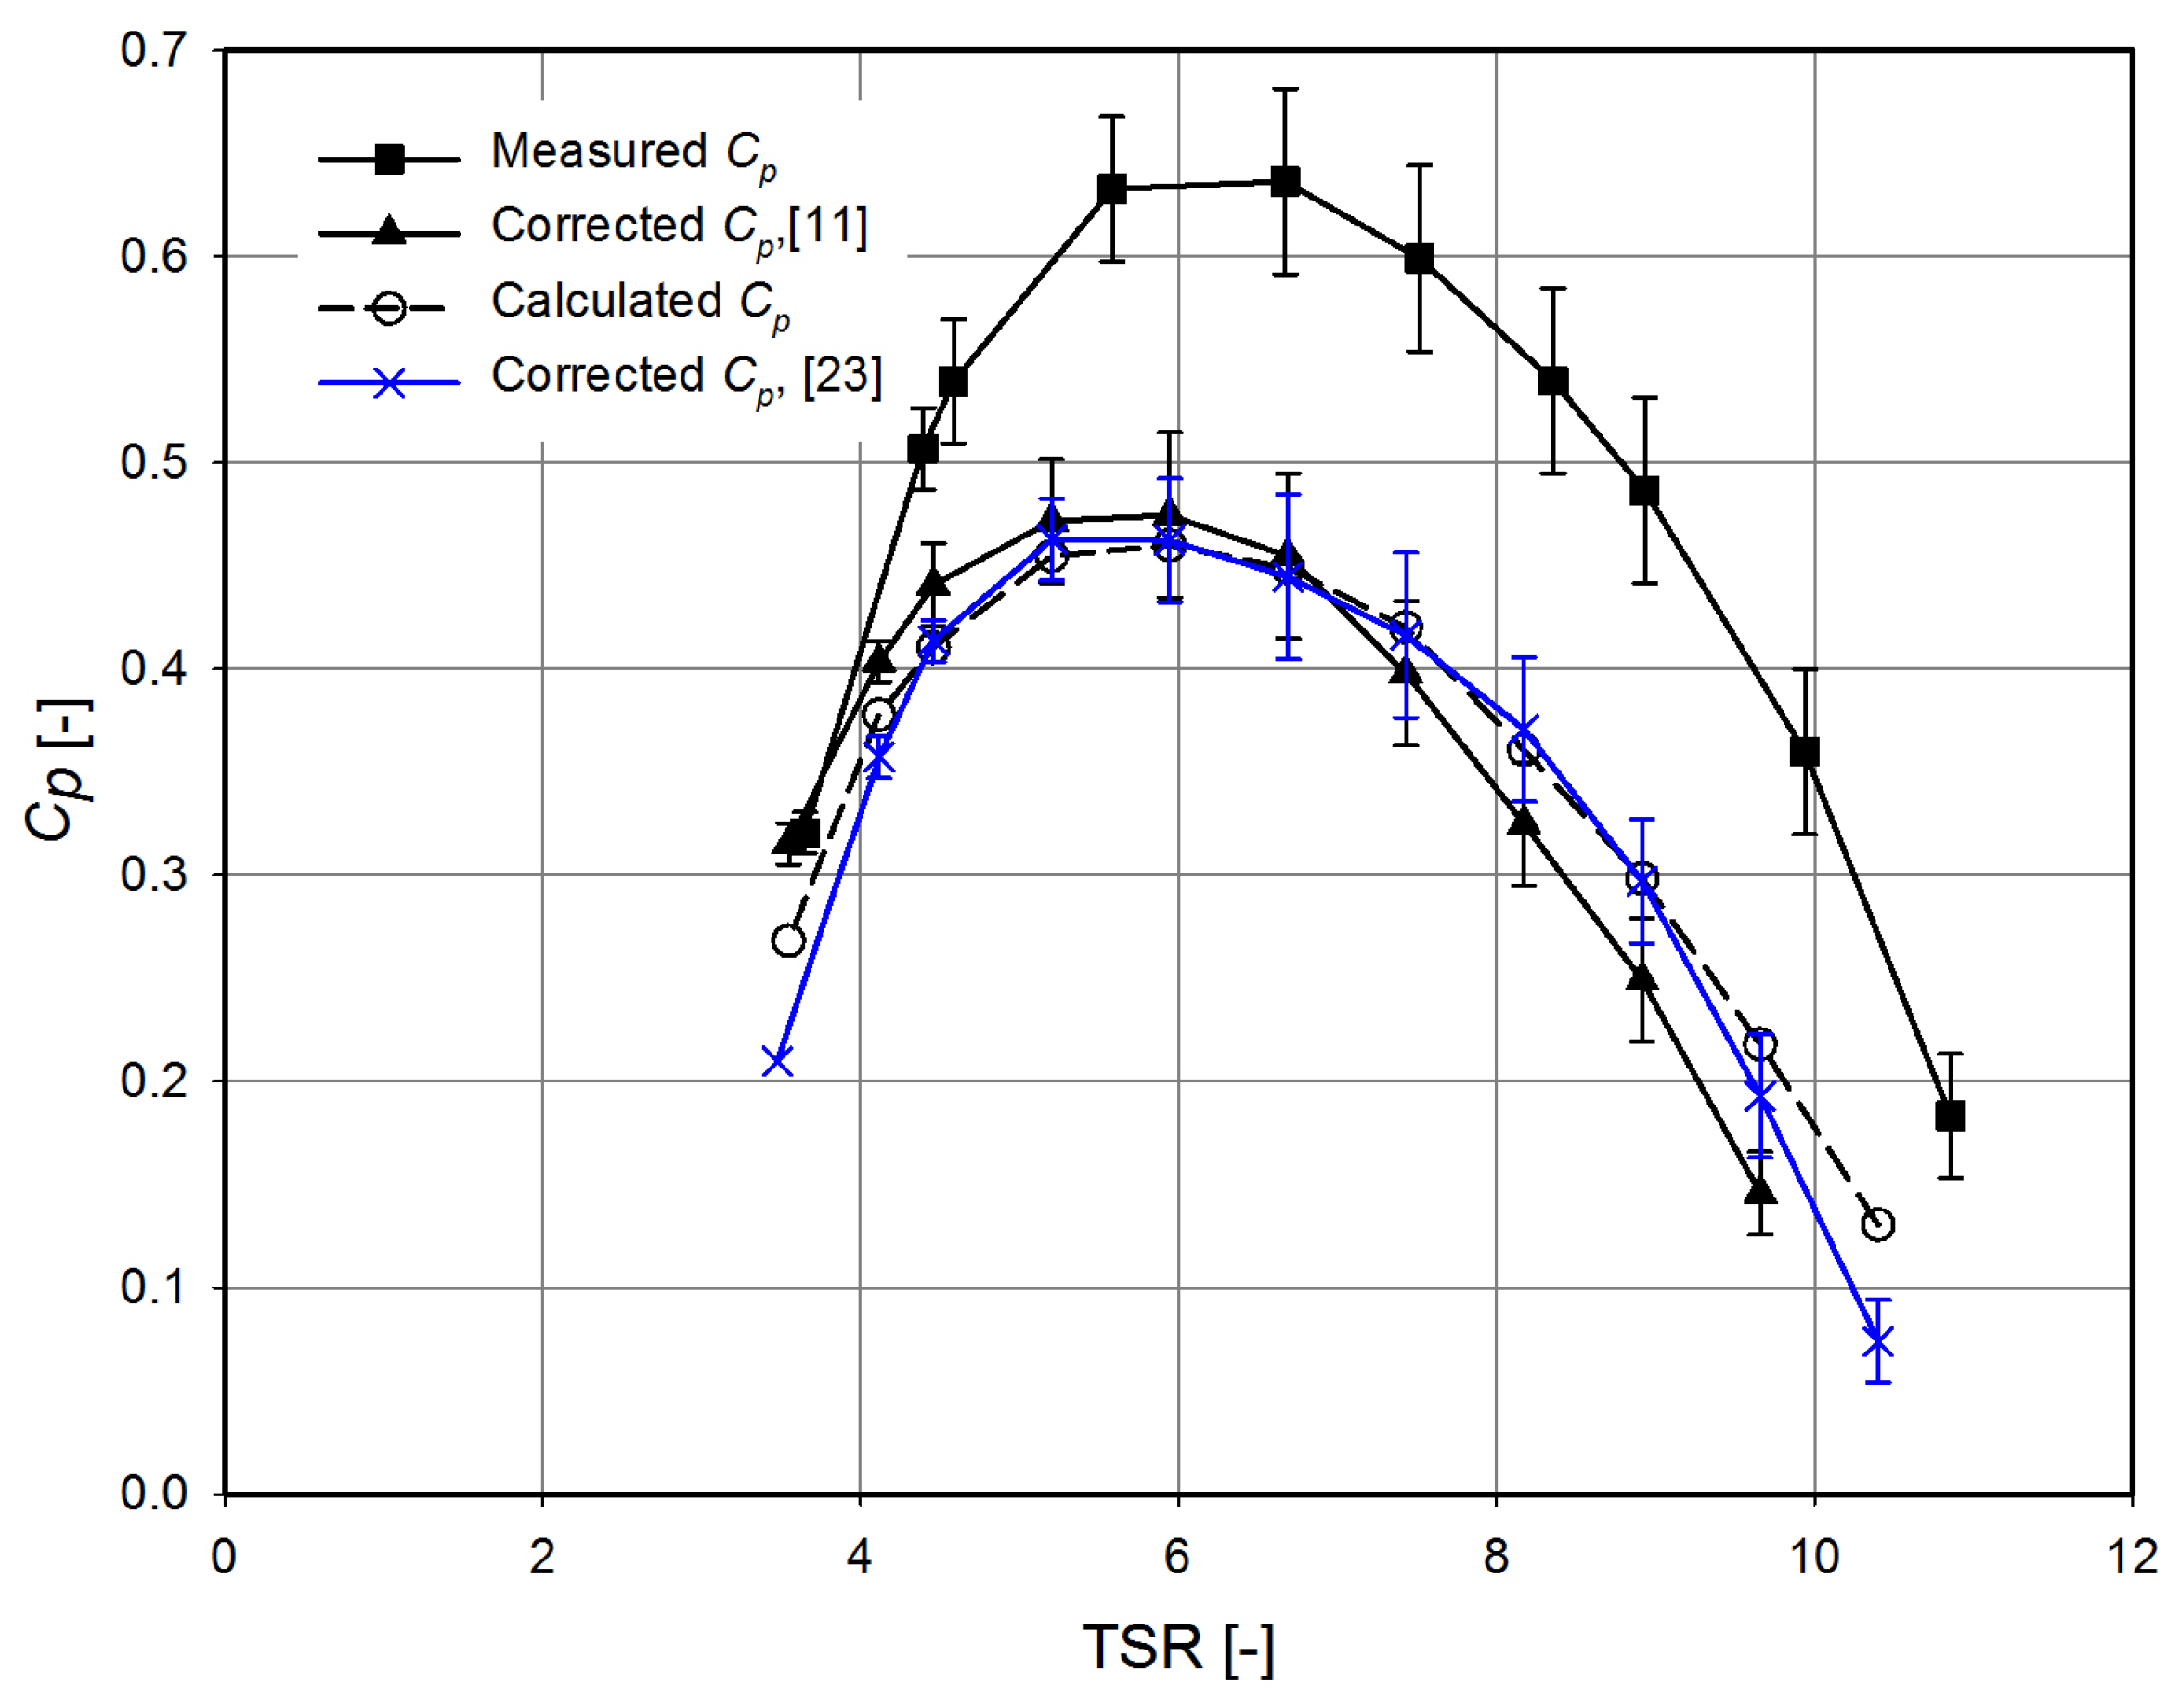
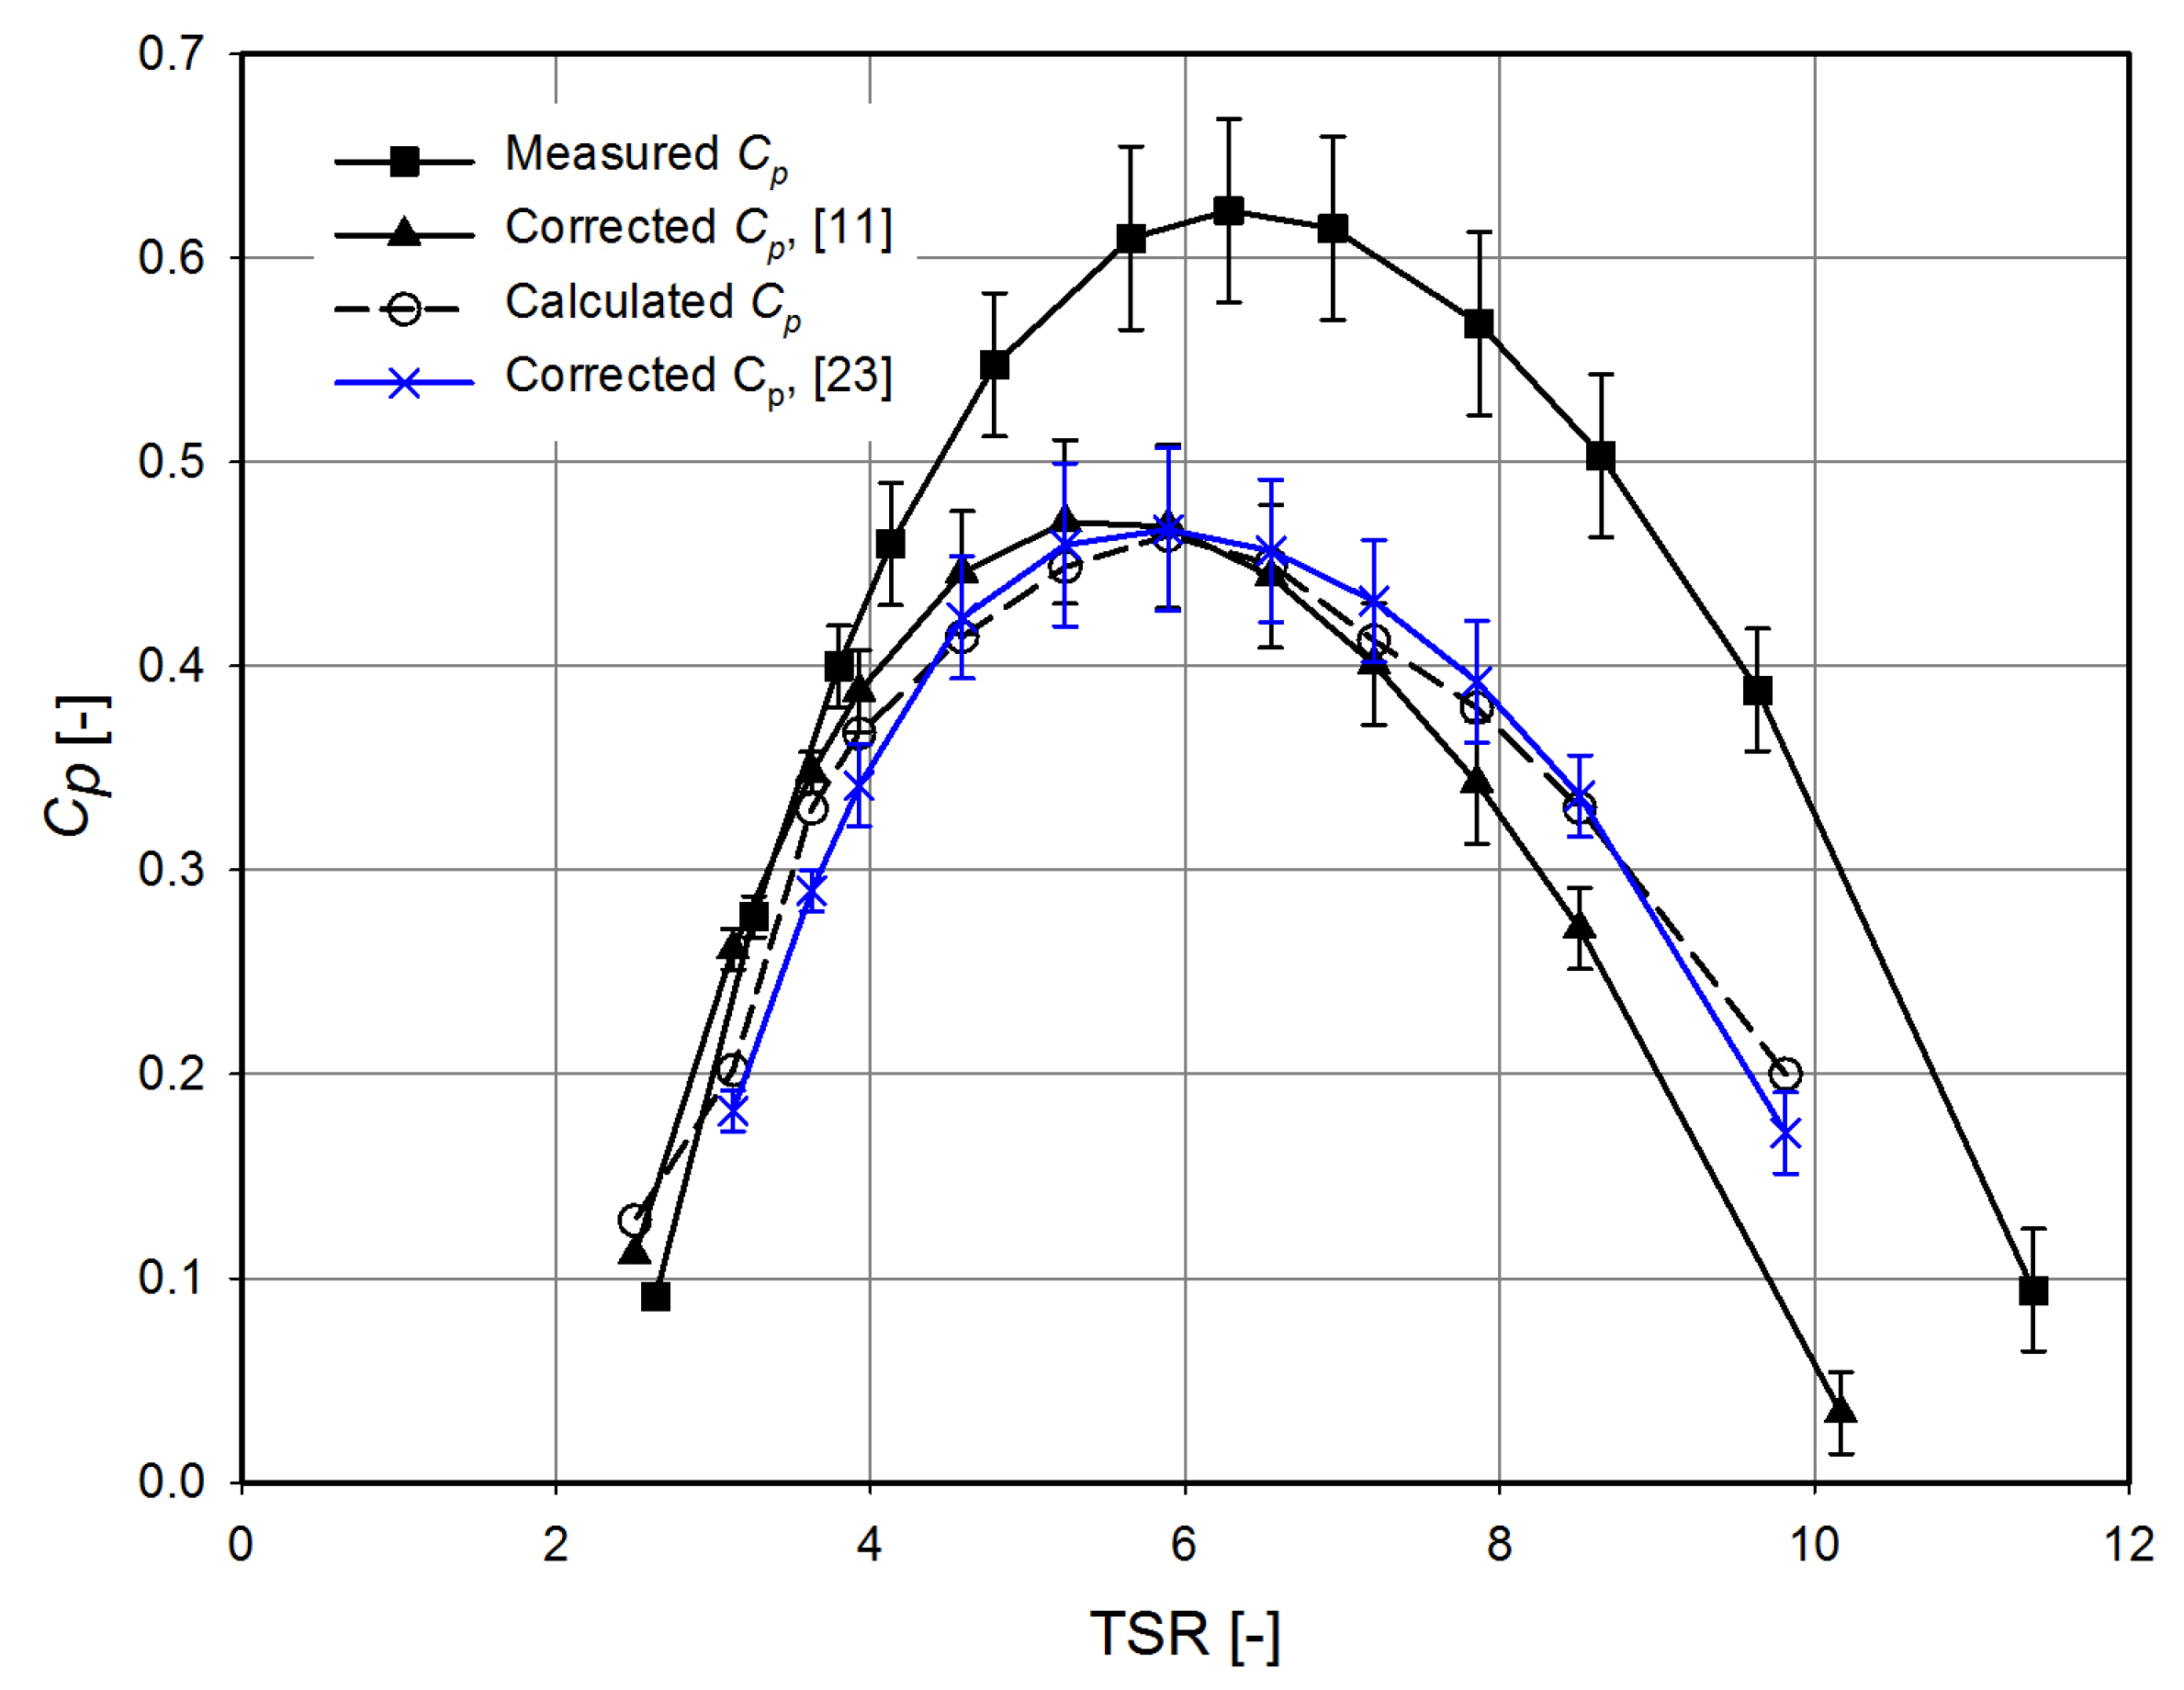
Figure 8,
Figure 9 and
Figure 10 show the experimental measurements and the numerical calculations of the power coefficient at various TSR for the three blade configuration, also including the measurement uncertainty, which was around 6% of the measured power coefficient. The measured power coefficients and TSRs were corrected using Equations (2)–(4) proposed for closed test section tunnels by [
11] and with Equation (
1) proposed by [
23] for open test sections. With blockage, because of the higher inlet velocity in the evaluation of measured power coefficients and tip speed ratios, the
values for the three wind speeds in these figures approached the Betz limit, which is theoretically impossible without blockage effects. The presence of the tunnel walls, especially the ground wall, which was very close to the tip of rotor, forced the air to enter the rotor, and the extracted power was then higher compared to the free conditions. This effect can give unexpectedly high power coefficient values that are largely overestimated.
The blockage correction of the measured power coefficient brought the characteristic curve to almost the same level of the calculated one, which is obviously more realistic. There was a power loss when the mechanical power was transformed into generated power, which was measured by [
36], who tested the Permanent Magnet Generator (PMG) that was used in the current measurements and found that the generator efficiency was about 85%. Therefore, all measured power coefficients were calculated using a generator efficiency of 85% in order to be compared with the numerical results. For all TSRs, there was a very good agreement between the calculated and corrected power coefficient using [
23], whereas the results obtained by means of correction [
11] for closed test sections were over-predicted, especially in the region of low TSRs.
Despite it being expected to have the same dimensionless characteristic curves for the three wind speeds in the three
Figure 8,
Figure 9 and
Figure 10, some differences arose. These differences can be attributed to some Reynolds-number effects that occurred case by case. The optimum power coefficient lied, however, at the same TSR value in all three cases, and the change in curvature width and magnitude can be attributed to the variability of the angle of attack of the streamlines at different Reynolds numbers.
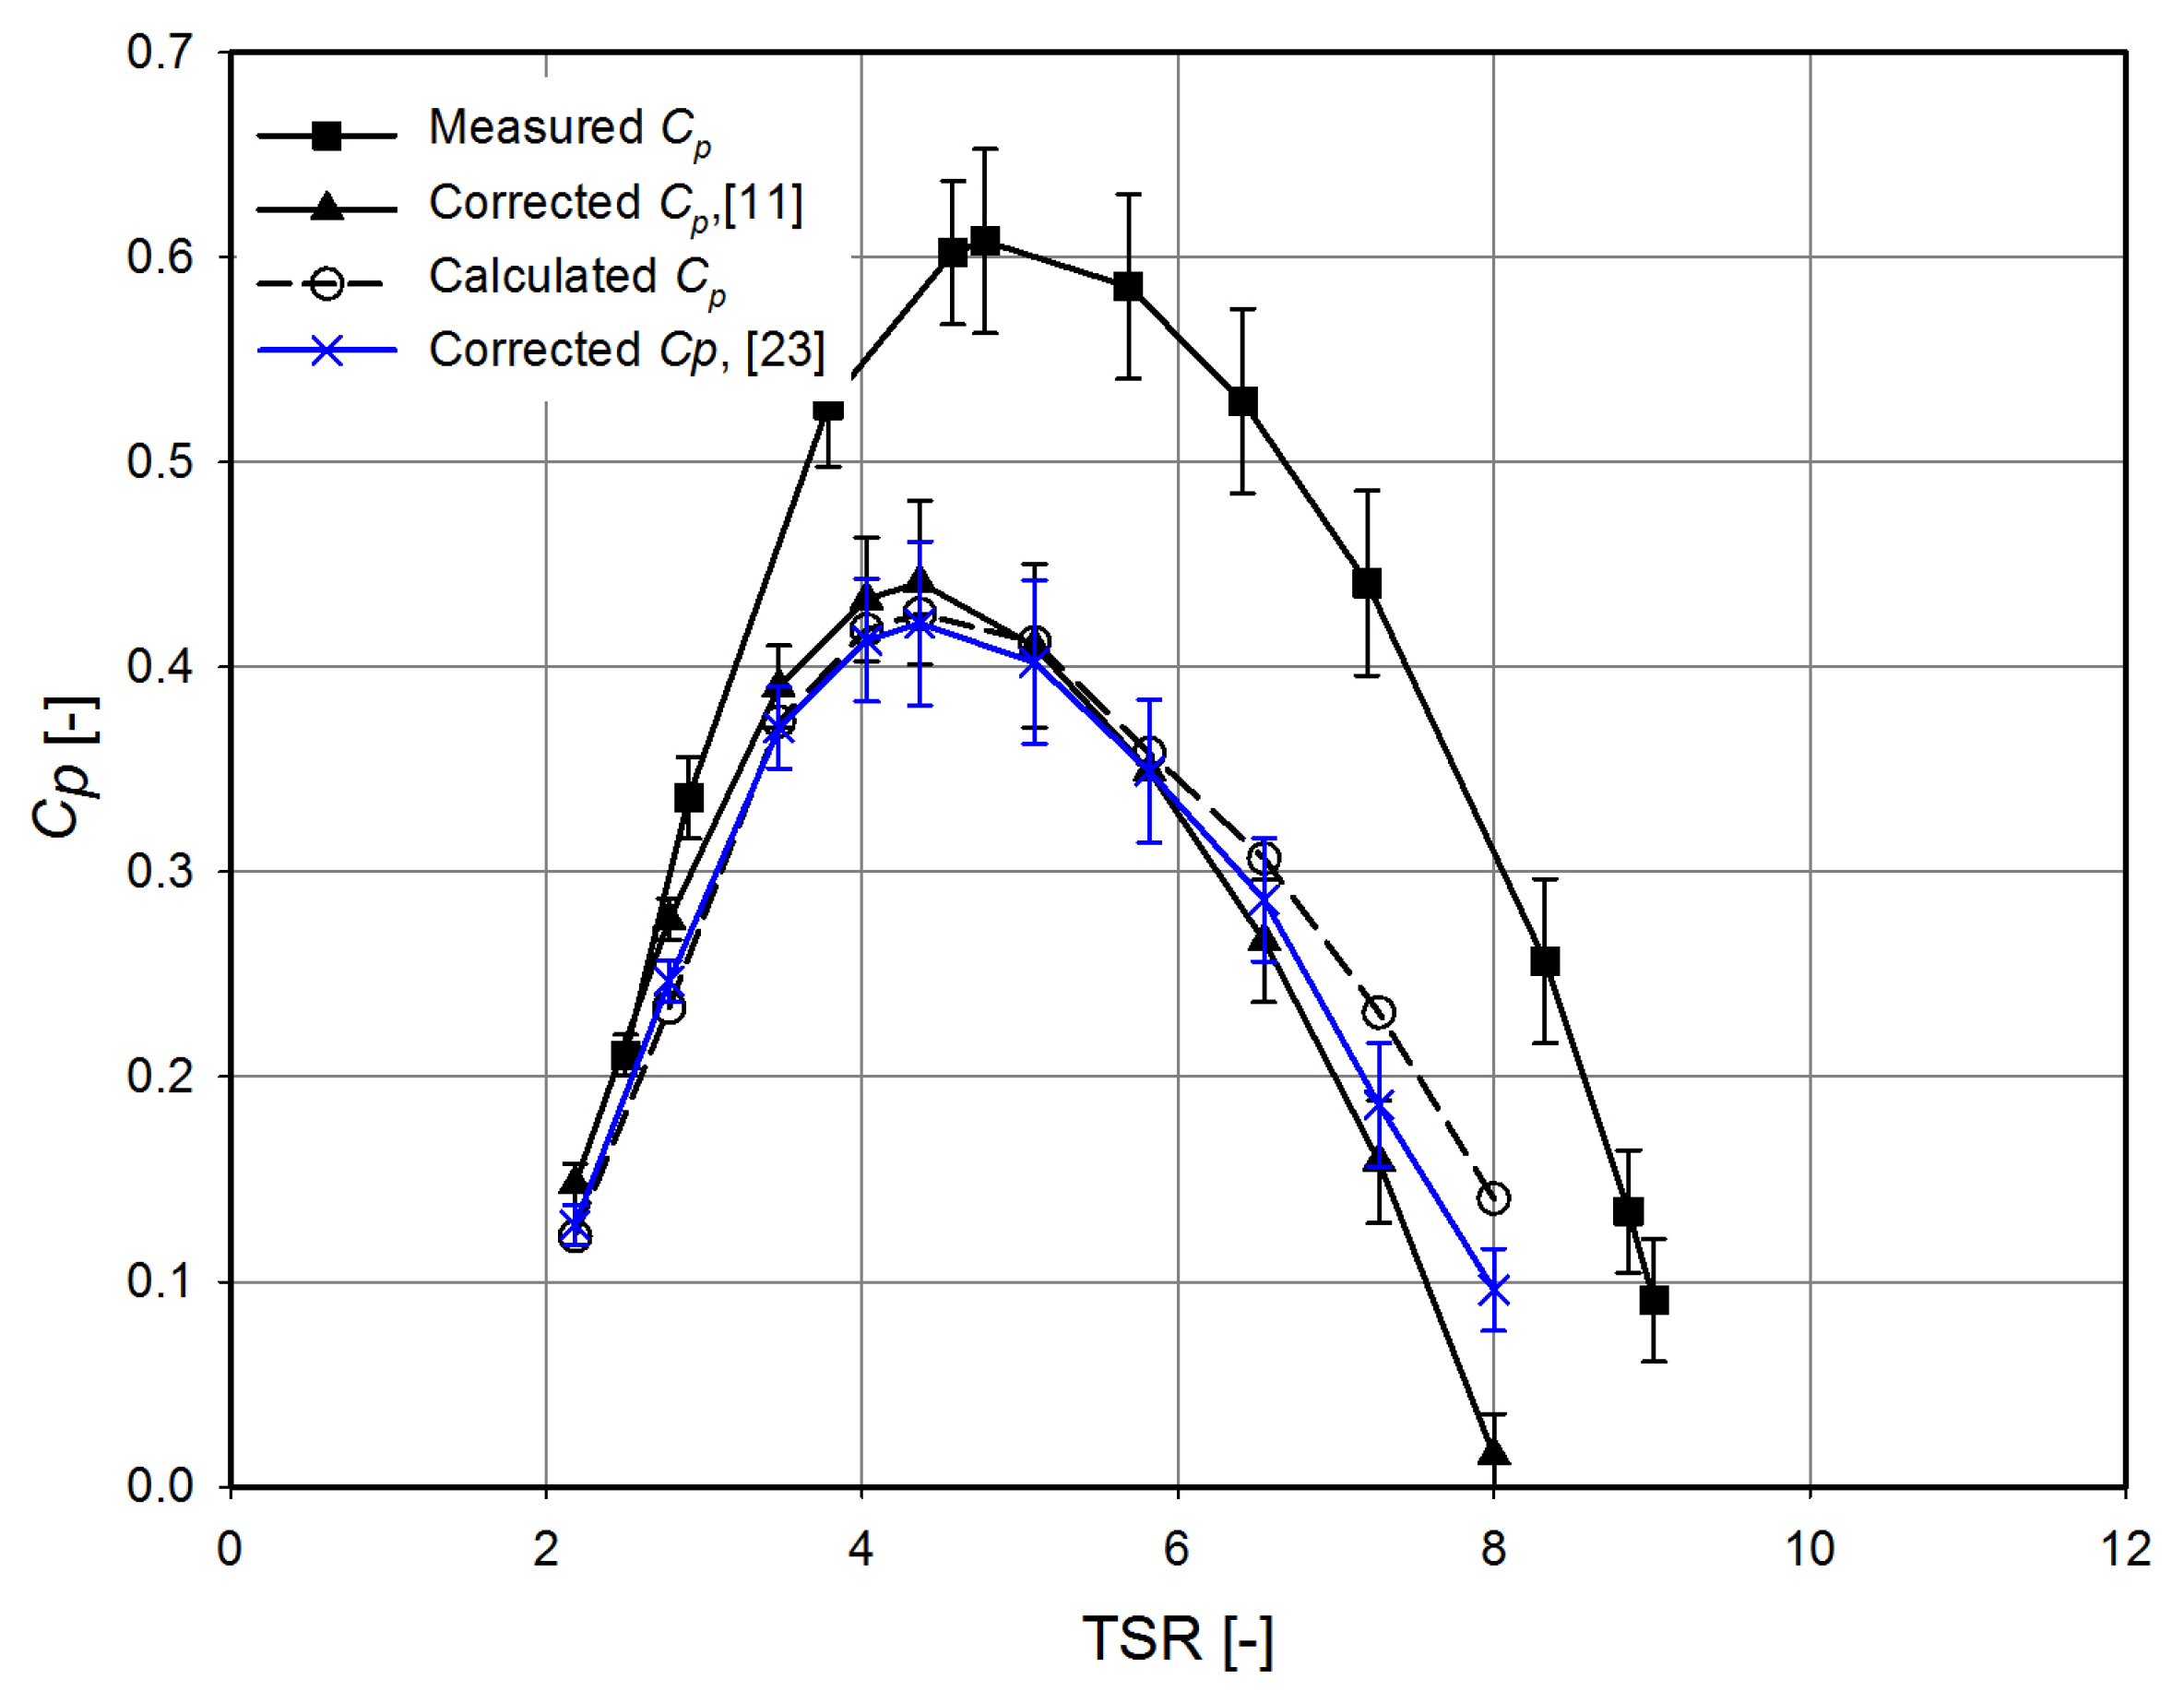
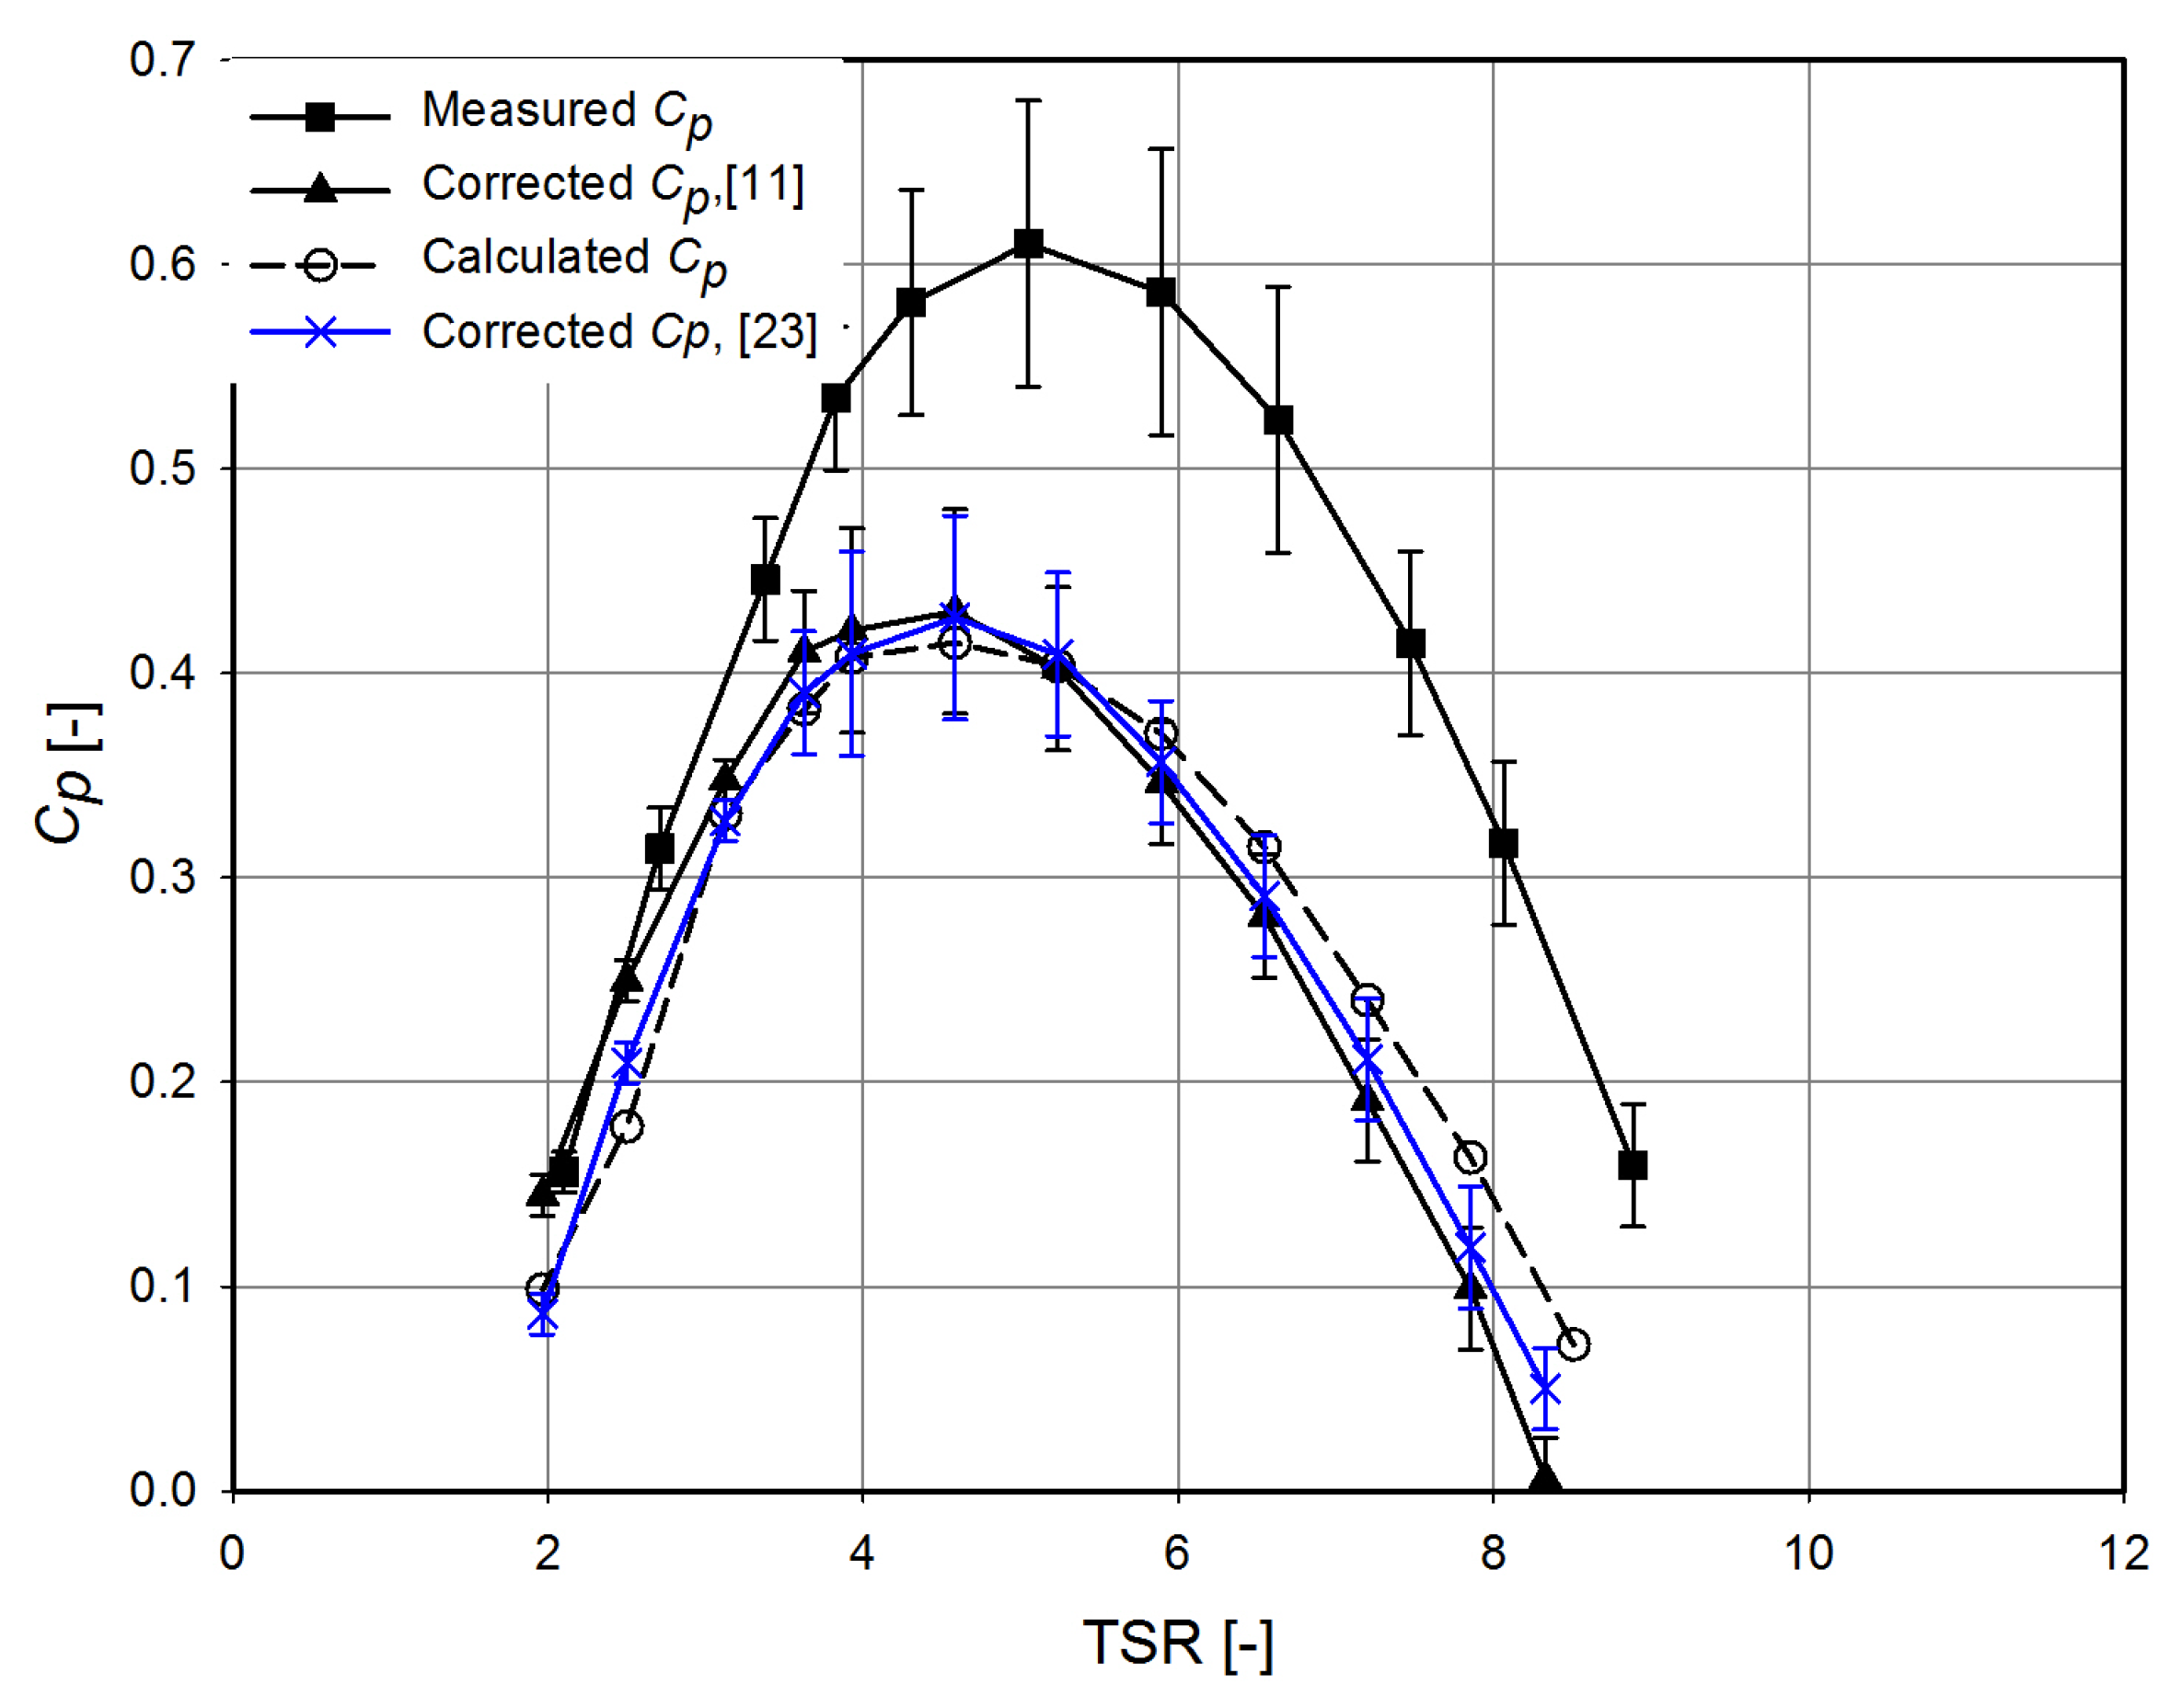
Figure 11 and
Figure 12 present the measured, corrected, and calculated power coefficients at different tip speed ratios for the wind turbine with five blades. Analogously to the three-blade case, the walls’ interference led to an increase of the power coefficients, and the corrected power coefficient values were lower than the calculated ones due to mechanical losses.
It was observed that the dimensionless characteristic curves for the five-blade wind turbine cases were almost similar for wind speeds of 7 and 8 m/s. This means that increasing the blade number makes the case less sensitive to Reynolds number changes.


 ,
, 


