Article

An Energy Potential Estimation Methodology and Novel Prototype Design for Building-Integrated Wind Turbines

by
Oscar Garcia
1,
Alain Ulazia
2,*,
Mario del Rio
1,
Sheila Carreno-Madinabeitia
3 and
Andoni Gonzalez-Arceo
1
1
ROSEO start-up, University of the Basque Country (UPV/EHU), Alda. Urkijo, 48013 Bilbao, Spain
2
Department of NE and Fluid Mechanics, University of the Basque Country (UPV/EHU), Otaola 29, 20600 Eibar, Spain
3
Meteorology Area, Energy and Environment Division, TECNALIA R&I, 01001 Vitoria-Gasteiz, Spain
*
Author to whom correspondence should be addressed.
Submission received: 13 April 2019 / Revised: 11 May 2019 / Accepted: 23 May 2019 / Published: 27 May 2019
(This article belongs to the Special Issue Alternative Energy Systems in Buildings)

Abstract

:
ROSEO-BIWT is a new Building-Integrated Wind Turbine (BIWT) intended for installation on the edge of buildings. It consists of a Savonius wind turbine and guiding vanes to accelerate the usual horizontal wind, together with the vertical upward air stream on the wall. This edge effect improves the performance of the wind turbine, and its architectural integration is also beneficial. The hypothetical performance and design configuration were studied for a university building in Eibar city using wind data from the ERA5 reanalysis (European Centre for Medium-Range Weather Forecasts’ reanalysis), an anemometer to calibrate the data, and the actual small-scale behavior in a wind tunnel. The data acquired by the anemometer show high correlations with the ERA5 data in the direction parallel to the valley, and the calibration is therefore valid. According to the results, a wind speed augmentation factor of three due to the edge effect and concentration vanes would lead to a increase in working hours at the rated power, resulting annually in more than 2000 h.

1. Introduction

In general terms, the market for small wind turbines is currently growing, although the sector of small wind turbines intended for installation in buildings is increasing at a lower rate. According to the World Wind Energy Association (WWEA) [1], the installation of small wind turbines will increase by around 12% annually in the 2015–2020 period. The good economic profitability of small wind turbines and the consistency of technological advancement are determinant factors that explain the growth of the small wind turbine market. On the other hand, in the last several years, research is increasingly being focused on the development of different technologies that help minimize the energy consumption of buildings. This philosophy is known as nZEB (nearly Zero-Energy Building) [2], and it is included in the EU 2010/31/CE directive related to the energy efficiency of buildings. After 2018, every new public building should be constructed in accord with this regulation and, after 2020, every new building should be compliant.
The goal is to maximize energy efficiency and reduce the use of primary energy derived from fossil resources so that the required energy demand can be met by renewable sources. In this sense, mini wind technology, which involves generating energy with wind turbines of 100 kW or less to cover an area smaller than 200 m 2 , can play a very important role. However, some technological challenges, such as the vibrations, the generated noise levels, and the device’s aesthetic and architectonic integration, are yet to be fully solved.
Nevertheless, these devices have many advantages:
  • They can work as standalone devices, so they can provide energy in isolated locations without a connection to the electric grid.
  • They work in distributed micro-generation mode, thus minimizing energy losses due to transport and distribution. These devices generate energy at a site that is close to the final user, thus dramatically reducing the need for electric infrastructures.
  • Furthermore, it can be combined with photovoltaic energy in hybrid installations to enable the optimal use and management of shared electric accumulators.
The recent developments in wind energy for urban environments have inspired different types of Building-Integrated Wind Turbine (BIWT) projects. For example, in London, Strata SE1 is a tall building with 43 floors that will include three wind turbines with diameters of 9 m on the roof of the structure. These wind turbines will be used to meet the building’s lighting demand [3].
On a smaller scale, there are a lot of projects that include Horizontal-Axis Wind Turbines (HAWTs) integrated with buildings, as well as Vertical-Axis Wind Turbines (VAWTs). These projects are focused on integrating wind turbines with existing buildings. Thus, these buildings were not previously designed to accelerate air streams, unlike the World Trade Center of Baharein [4] or the mentioned Strata SE1 building. According to this post-integration trend, building-integrated wind turbines are being implemented in strategic locations to capture the acceleration of air streams that are produced because of different geometries. In this sense, the most interesting locations are the upper and lateral edges of a building, especially the former because it is at a reasonable distance from homes.
Nowadays, there are several ongoing projects working to develop an optimal system that harnesses wind energy in urban environments. Most of them have concluded that wind turbines located in obstacle-free environments are not adequate for urban environments because of the urban turbulent flow, which can present a relevant turbulence intensity on the superior edges of the buildings [5,6]. For that reason, HAWT devices, which usually exhibit good performances with laminar flows, perform poorly in urban environments, in addition to their generation of noise as high as 200 dB within a radius of 500 m [7]. Conversely, VAWTs play an essential role in generating wind energy in urban areas since their performance is not much affected by turbulent flows, and they tend to be noiseless [8]. Additionally, the VAWT has a lower cut-in speed than HAWT and a larger or even unlimited cut-off speed, ensuring longer operating times [9,10,11]. Although the power coefficient is lower, the design is simpler and the manufacturing process is easier to carry out.
Along these lines, the existing urban wind energy potential has encouraged researchers to develop a proper methodology for wind energy estimation in urban environments [12]. The use of anemometers at specific locations can be combined with advanced computational simulations of buildings situated in complex urban terrains using CFD (Computational Fluid Dynamics). In this way, wind energy potential estimation using reanalysis and meteorological mesoscale models, which is a well-known offshore and onshore method and also developed by the authors [13,14], can be complemented with different back-end tools.
In this work, the authors present the design of a Savonius drag-driven turbine that is intended for integration into buildings. The proposed turbine is called ROSEO-BIWT, which has been specially designed to work in urban environments. The wind in urban areas is characterized by its turbulence, thus it is important to take advantage of low-speed air streams. The germinal project of ROSEO won the first award in the EDP-RENEWABLE UNIVERSITY CHALLENGE 2017 [15], and the members of the project have now created a university start-up called ROSEO. Although it is typically used as a vertical-axis turbine, ROSEO-BIWT is formed by a Savonius turbine in a horizontal position and concentration vanes that accelerate the air streams by the Venturi effect (see Section 2.2). These types of vanes are usually called PAGVs (Power Augmentation Guiding Vanes) [16,17,18]. The proposed turbine was also designed to be easily architectonically integrated. This was the case for the design proposed by Park et al. [19], in which several Savonius turbines were incorporated into the facade of a building at different heights to take advantage of the vertical currents created by the wind on the walls of the building.
The Savonius wind turbine is a drag-based device, unlike the majority of turbines, which are lift-based. This particular aspect allows for low noise levels and few vibrations, and these factors are very important in building installations [20,21]. The PAGV increases the wind speed as the catching area grows, resulting in a system that is able to start at wind speeds of about 1 m/s, thus ensuring a great number of energy-producing hours. Furthermore, energy generation continues no matter how high the wind speed is.
This paper proceeds as follows: a possible location for the installation, which was established using ERA5 data, is presented. ERA5 is a powerful tool for global atmospheric analysis that is updated in real time (see Section 2.1). The authors also installed an anemometer on the roof of their university to calibrate the wind data for a period of eight months against ERA5 (Section 2.1.2). In this way, an empirical method for the estimation of wind energy potential on buildings with a low computational cost will be developed in subsequent work, as discussed in Section 3.5. Finally, a preliminary small-scale experiment was developed for a wind tunnel with a small Savonius and different configurations of the PAGV (Section 2.2 and Section 2.3). The authors finish this work with some relevant conclusions and a future outlook of possible research directions. The qualitative methodology used here can be considered within the scope of analogical reasoning and model construction [22].

2. Data and Methodology

2.1. Data and Location

2.1.1. Anemometers and ERA5

The university building of Eibar (Engineering School of Gipuzkoa) was selected (longitude: 2.946 W; latitude: 43.258 N) to demonstrate a method for formulating a preliminary estimation of energy production using quantile-matching calibration versus a cup anemometer installed on the roof. Figure 1 shows a satellite view of the engineering school and the position of two anemometers installed on two buildings. After eight months of data acquisition, Anemometer 1 showed the best correlations with the ERA5 reanalysis, and its dataset was used for the calibration and energy estimation procedure.
The ERA5 reanalysis, ECMWF’s most recent atmospheric reanalysis, covers the second half of the 20th century and this century [23]. For this study and the calibration, 40 years of data were used (from 1979 to 2018), because the complete reanalysis is not yet available. The correlation between ERA5 and the anemometers was computed within their period of intersection (from June 2018 to February 2019). These data include atmospheric and oceanic variables, and are an appropriate tool for estimating wind energy potential [24] offshore and onshore. In this study, ERA5 hourly data with a resolution of 0.3 × 0.3 was used.

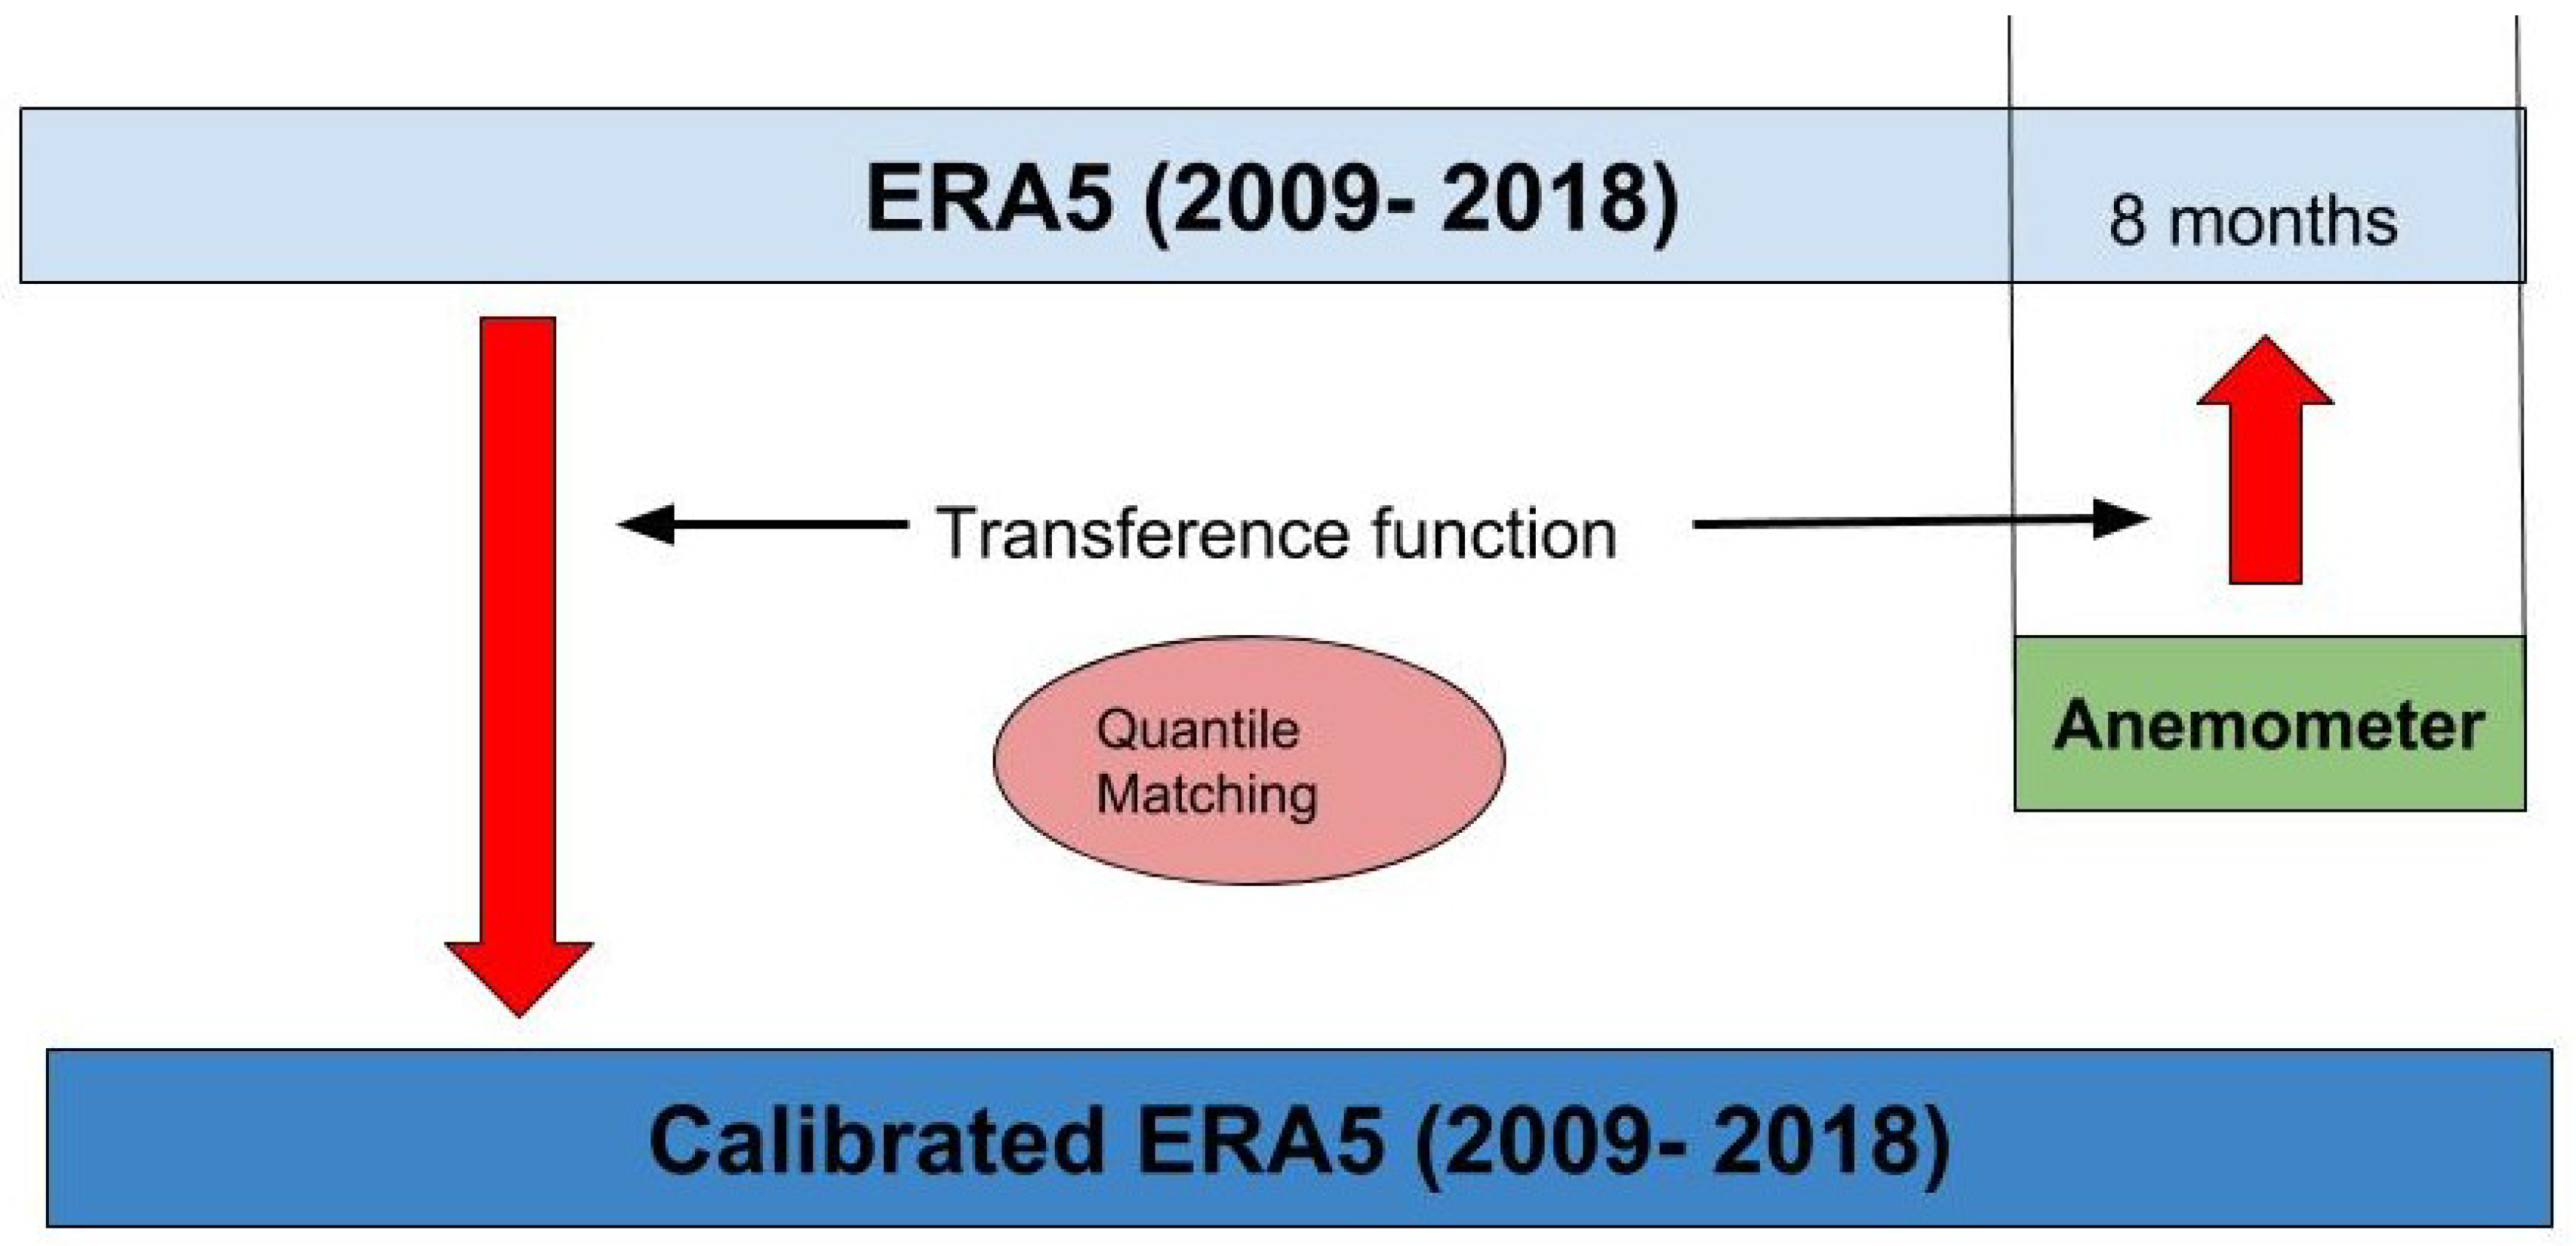
2.1.2. Quantile-Mapping Calibration

The cup anemometers installed on the buildings of the University of Basque Country in Eibar enabled the development of a preliminary calibration methodology based on quantile-matching techniques that were used previously by the authors for wind energy and wave energy [25,26,27]. In the scientific literature, different calibration or bias correction techniques have been developed and compared for the analysis of several parameters, such as temperature and precipitation (see [28,29,30]). Data from models and reanalysis are compared with observations. In the present study, a simple but effective statistical procedure based on quantile mapping was used.
For this approach, several other terms can be found in the literature: “probability mapping” [31], “quantile-quantile mapping” [32,33], “statistical downscaling” [34], and “histogram equalization” [35]. With this general approach, empirical quantile-mapping bias correction was applied to calibrate ERA5 versus an anemometer in the building. In [36], the same procedure was used for estimating wind energy trends. To summarize, this method of calibration or bias correction is fundamentally statistical, and the idea is to match values with the same quantile in two empirical probability distributions: the one to be calibrated (ERA5), and the one that is the basis for the calibration (anemometer). Figure 2 illustrates the main aspects of this calibration procedure, including the intersection periods and the concept of applying the transference function.
For this paper, the authors obtained an eight-month, 10-min data series, which was filtered every 6 h to match the ERA5 reanalysis for a 10-year period (1-h time resolution, in this case). Thus, there were around 34,500 cases in the anemometer time series and around 87,600 cases in the ERA5 series. Taking 1-h data for both series in the intersection period resulted in 5390 cases, from which the correlation was measured and the subsequent calibration transference function was generated.
Having determined the average wind speed U ¯ after calibration on the corresponding facade and considering the typical shape parameter of the Weibull distribution (Rayleigh distribution, k = 2), the corresponding scale parameter can be obtained:
c = U ¯ / Γ ( 1 + 1 / k ) .
Then, the cumulative distribution function and the fraction of time between two wind speeds are determined:
F ( U ) = 1 e x p ( ( U / c ) k )
and the augmentation factor A F of the PAGV (the ratio between the outlet and inlet free wind speed) can be incorporated into the c parameter [9] because it is proportional to the average wind speed U ¯ .
The value of A F can only be based on a virtual definition of the outlet velocity of the flux, since the complex interaction between the diffusive flux in the exterior part of the vanes and the motion of the rotor do not permit a simplistic application of the Venturi effect according to the relation between the capture width of the free wind U and the outlet width. However, the optimum tip speed ratio ( T S R o p t ) at which the power coefficient C p is maximized is directly related to the outlet effective velocity ( U o u t ), because it is well known that T S R o p t 0 1 / 3 for a drag turbine without augmentation techniques [9]. Due to the Magnus and lift effects in the Savonius rotor, this value can reach 0.4–0.5. Therefore, the augment of T S R o p t should be similar to A F considering an effective U o u t at the position of the rotor in relation to the blade tip speed V t i p . Being V t i p A the tip speed in the augmented rotor and T S R A the tip speed ratio in the augmented rotor, the hypothesis is that the T S R should be the same for the conventional Savonius and for the augmentation technique if the outlet velocity A F · U is the reference wind speed:
T S R = V t i p U = V t i p A A F · U V t i p A = A F · V t i p
However, the T S R with augmentation T S R A should be defined with respect to the free wind speed: V t i p A U . Therefore,
T S R A = A F · T S R A F = T S R A T S R
Consequently, A F can be also computed using the ratio of the T S R with augmentation versus the T S R without augmentation.
On the other hand, experiment using nozzles by Shika et al. [37] have shown that A F can be 4 or even 5 measuring directly U o u t at the position of the rotor for U between 0.6 and 0.9 m/s. This relevant increment for low free wind speed is very interesting for our purpose, since reducing significantly the cut-in speed of the rotor. Furthermore, these A F s ensure a great quantity of working hours at rated power, as shown below.

2.2. ROSEO-BIWT Design

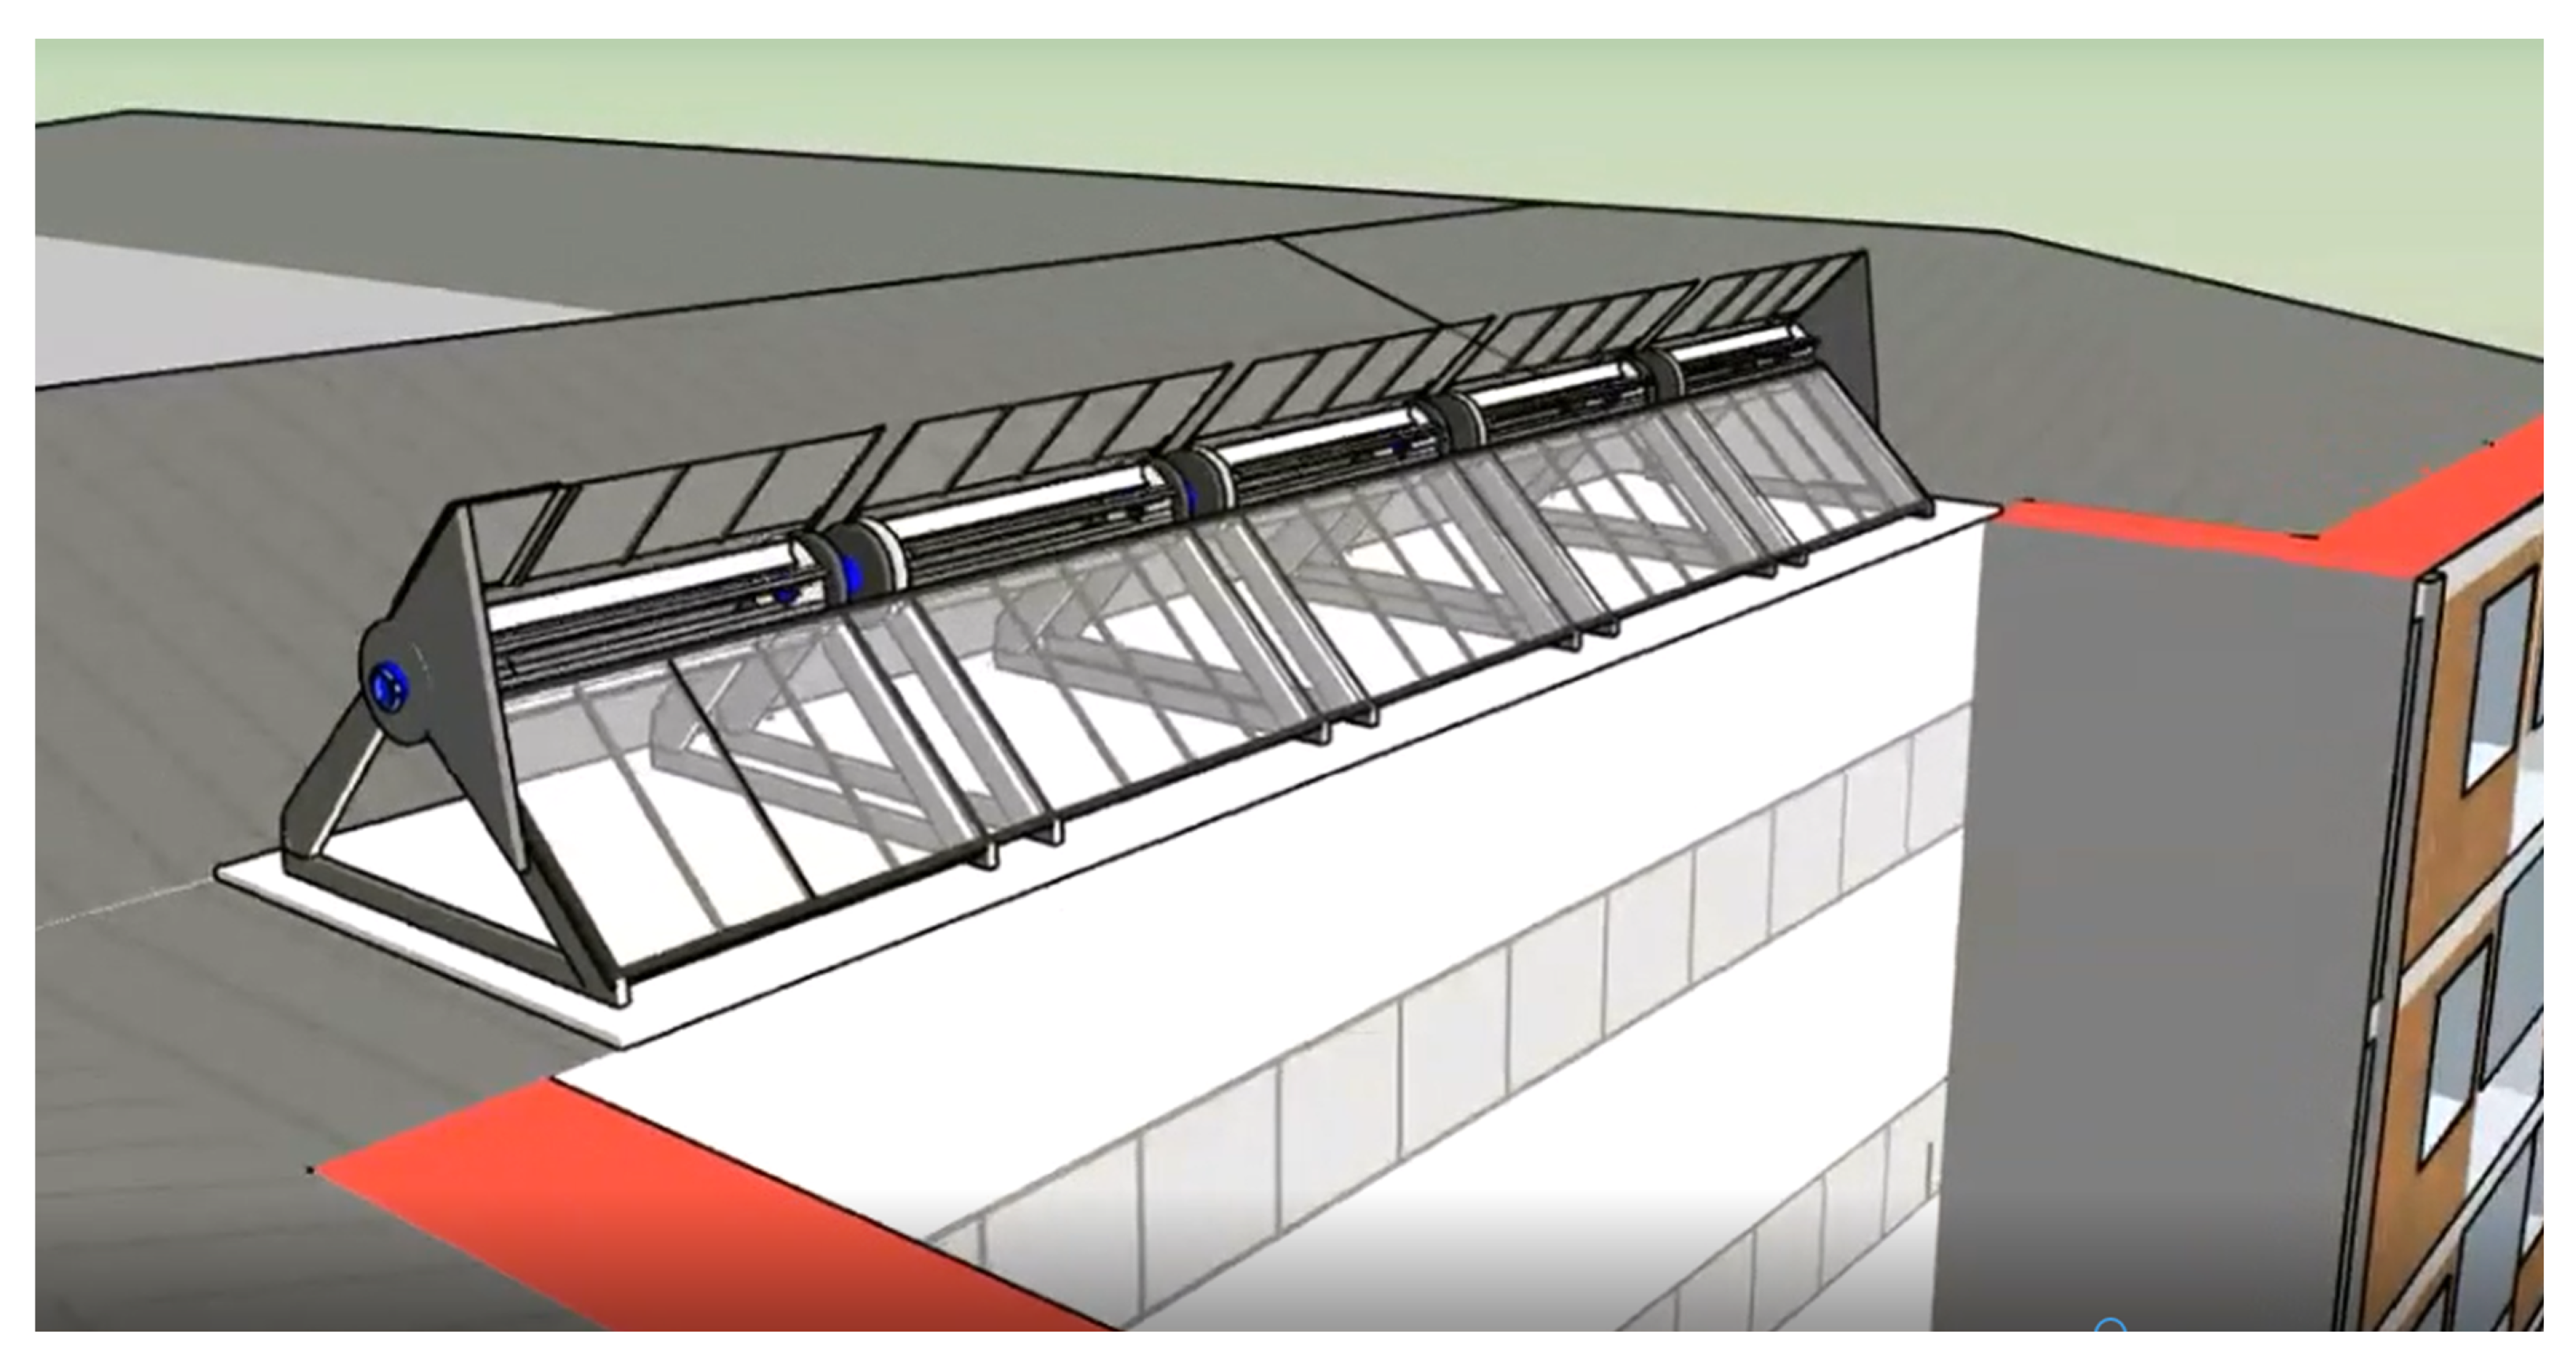
2.2.1. The Location on the Upper Edge of the Building

The effect of wind against buildings has been largely studied by the architectural sector for the purpose of studying the dynamic loads generated by air streams. Because of their work, there is considerable knowledge about the behavior of wind in urban environments. Much of the information has been obtained through experiments with scale models and CFD simulations, similar to the depiction generated by the authors in Figure 3, which was re-created based on the CFD simulation in [38].
Most of the studies that have analyzed the behavior of air streams around buildings agree that the upper edge of the windward face of a building has great wind energy potential. This is because the wind has to surround an object. The effect is even more intense when the building is taller and when the wind direction is perpendicular to the building facade. For example, in a five-story building, the wind velocity increases by 1.2 times at the windward edge [38].
According to the CFD simulations of Balduzzi et al. [5,6], the wind speed increment at the edge can be between 10% and 30%, but the turbulence intensity increases considerable. This is not the worst inconvenience for Savonius turbines, since it is demonstrated that, when turbulence increases, the separation of boundary layer takes place on the lower side of returning blade of the rotor reducing the negative torque [39,40].
Areas of high turbulent intensity create more frequent and stronger gusts [9], but the inertia of a relatively long Savonius rotor (high aspect ratio between the length of the axis and the diameter) can keep the rotation of the turbine without relevant variations. Additionally, it is demonstrated that, as a consequence of blade tips, aerodynamic losses are reduced in Savonius turbines with high aspect ratios [41].

2.2.2. Savonius Turbine

Because of the above-discussed wind behavior, our ROSEO-BIWT’s Savonius axis is positioned horizontally along the superior edge of the building. There have been several recent studies on the performance of the Savonius turbine. Mohamed et al. [42] improved the performance using plates to eliminate the negative torque in the returning blade. They carried out tests for a two-bladed and a three-bladed wind turbine, and, in both cases, they improved the power coefficient ( C p ) of the wind turbine by up to 27%, with 15% being the typical value.
Apart from these intrinsic improvements, some engineers have developed the mentioned PAGV systems to accelerate air streams. Shikha et al. [43] increased the wind speed by 3.7 times in an experiment using a specific well-studied nozzle. Additionally, Altan et al. [44] studied the influence of the inclination angle of the plates as well as their length. In these experiments, they found that, when the longitude of the PAGV increased, the power also increased. Thus, the important consideration in their study was the relationship between the diameter of the rotor and the length of the PAGV. They even obtained a C p of 38.5%. Other types of PAGVs, referred to as omnidirectional, reached a C p of 48%, implying an increase of 240% relative to a Savonius rotor without a PAGV system.
In terms of longitude and diameter, the Savonius rotor studied in [45] performed best with an aspect ratio of 6:1. Similarly, Park et al. [19] tested different kinds of Savonius rotors, and they discovered that the best design was a six-bladed rotor. Therefore, for our purpose, a similar rotor with these proportions was chosen for the initial test period.

2.2.3. The Final Design

Park et al. [19] developed the idea of using a larger facade surface to generate energy by installing a lot of Savonius rotors at different heights while also using PAGVs to improve the performance of the wind turbines. The system that they proposed is similar to a ventilated facade. It is important to emphasize that they wanted to capture the vertical air streams that are generated on the windward side of the building, as in our case. However, they used parallel vanes in the facade with a small concentration angle; in our case, the upper edge is used to augment the concentration angle and capture not only the vertical stream on the facade but also the horizontal component of the wind. Furthermore, the background of the Savonius rotor is free on the edge of the building: this is an important aspect that is not encountered in turbines installed in the facade. Although the influence of this aspect is out of the scope of this study, it is an obvious aerodynamic advantage.
Another innovation is that the proposed turbine can be installed in existing buildings: it is not a design intended only for new buildings. To summarize, ROSEO-BIWT shows good architectural integration in existing buildings and high economic viability due to the simplicity of the design.
Figure 4 shows the ROSEO-BIWT design. This is a schematic perspective that does not take into account the influence of the angle between the two PAGVs; the angle can be adapted for other positions of the vanes.
The PAGV areal ratio between the entrance and exit of the air is 4:1, and a similar A F is expected to result from a first simplistic calculus due to the Venturi effect. In any case, as mentioned, the complex interaction between the outlet wind speed and the rotor motion deviates this a priori value of A F = 4 .
In their seminal work about a curtain design to increase the performance of a Savonius turbine, Altan et al. [46] determined that the best angles for the capture of wind in their curtain design are 15 for the superior vane and 45 for the inferior one that obstructs the negative torque. The authors corroborated the same influence of the inferior vane in the laboratory (see Section 3.1). Figure 5 shows the dimensions for this optimum design with curtains. It is considered a unit of capture width at the inlet, and a geometrical relation of 4:1 for the inlet width (0.25, therefore diameter of 0.50) versus the outlet width. The aspect ratio is six considering the results of Roy and Saha [45]: 3 = 0.5 × 6 . These proportions can be established between a capture width of one and two meter; within this size, ROSEO device is manipulable for a worker on the roof in the implementation process and for O&M issues, without the need of a crane.

2.3. Experiments in the Wind Tunnel

Although there are results provided by previous studies, in the following sections, the authors describe the general experimental methodology that is being developed. The experimental model construction is proposed by referencing previous findings and design procedures [22]. These are the main steps:
  • First, according to the literature, the augmentation factor of the wind speed on the edge of the buildings is around 1.2. Wind speed augmentation is the result of the union between the usual horizontal component and the vertical component.
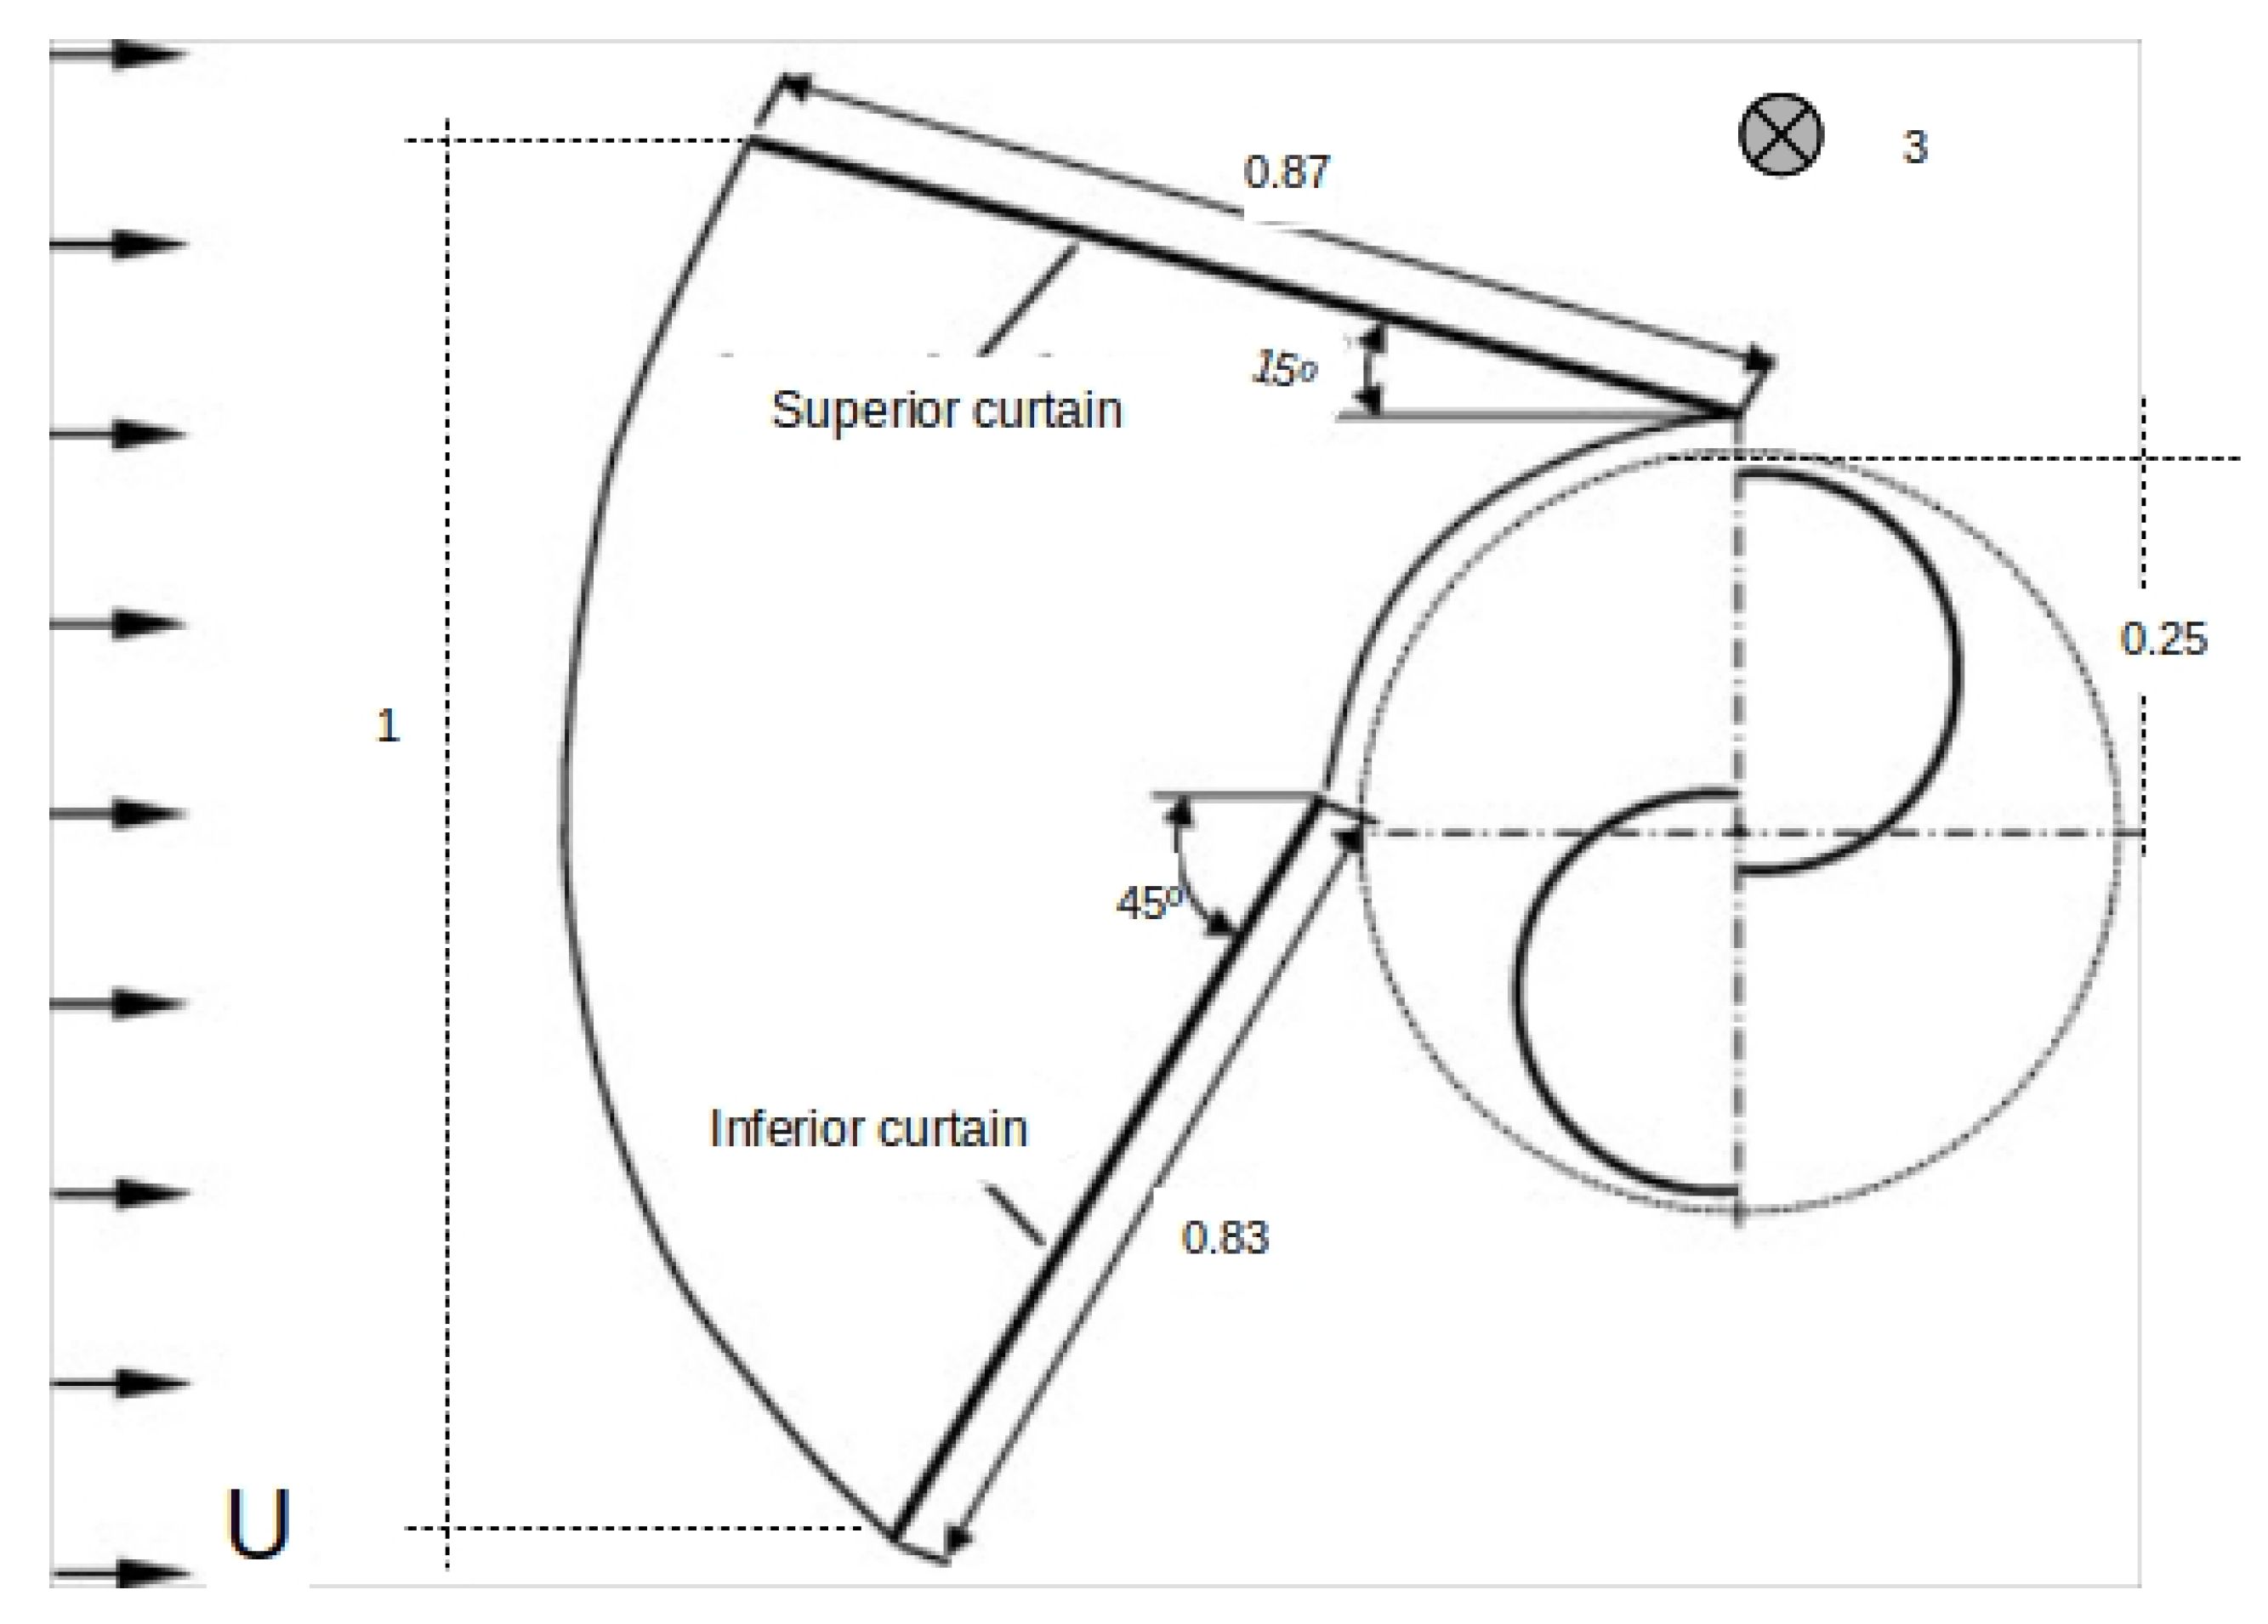
  • Then, the previous augmentation factor should be multiplied by the new increment A F provided by the vanes. These factors will be measured for different wind speeds in the wind tunnel of the university using a small-scale model of a building with curtain-type vanes (see Figure 5) and a rotor or 2 cm diameter.
  • A similar experiment will be performed for a real Savonius with one inferior vane and will be critically compared with other studies.
  • Finally, the Weibull distribution at the location obtained by the previously described calibration methodology will be applied to the measured power curve that includes A F . Thus, the amount of hours at rated power due to this augmentation will be an interesting parameter about energy production.
Table 1 describes the main characteristics of the above-mentioned wind tunnel. Figure 6 shows the wind tunnel and the installation of a PAGV and a real Savonius rotor. It should be mentioned that the disposition of the vane below the limit of the rotor’s horizontal axis obstructs the negative torque and, simultaneously, accelerates the stream in the opened drag side above the axis. As mentioned, this aerodynamic effect has been properly documented in previous reviews about the performance of the Savonius rotor [39,41,47].
The augmentation may be even higher because of the corner effect of our design. However, until now, these preliminary measurements have only been performed with low values of steady wind speed without considering some important effects, such as the blockage ratio of the tunnel [49,50]. However, the the influence of A F is important at these low wind speeds below the rated power, because it can ensure a sufficient wind speed above the rated wind speed at the outlet of the concentration vanes.
On the other hand, Figure 7 shows the small-building, the guiding vanes with 3:1 inlet/outlet relation, and the six-bladed rotor of 2 cm diameter. Here, the objective is to create an anemometer that is able to capture the wind on the entire outlet area of the vanes. According to our previous experiments, measurements with Pitot tubes result in great fluctuations due to small displacements or inclination deviation in such a narrow area. In this case, the electrical motor is a maxon DCX06M EB KL 6V of 0.529 W. The speed constant is of 3060 min 1 V 1 having a direct way to compute the angular velocity in function of the voltage. Additionally, there is also a constant speed–torque relation of 36,600 min 1 mNm 1 . This characteristic is important because it allows computing the increment of the torque due to the increment of the speed.

3. Results

3.1. Effect of the PAGV in the Real Savonius

A F of around 2 has been corroborated in the experiments of the wind tunnel. This obviously depends on the angle and the length of the vanes and the exact position of the Pitot tube, but this value of A F can be obtained with a suitable disposition of the vanes. However, this measurement is strongly influenced by the exact position and size of the Pitot tube, and future works should study the behavior of A F for higher and more turbulent wind speeds.
Although a maximum outlet/inlet width ratio of 1.4 can be obtained due to the lack of space in the tunnel with the Savonius rotor in the center, the instantaneous power measured for different wind speeds and different angles of the vane in Figure 6 gives a coherent result for this augmentation and subsequent power. Figure 8 shows this behavior with the vane at 30 , 45 and 70 with respect to the horizontal. The pilot test was developed without the vane and the negative-torque wall (NT wall) was applied with the vane in vertical position, obstructing the negative torque’s drag. It should be noted that, removing the negative torque, the power is doubled and the other cases (30 , 45 and 70 ) also remove the negative drag.
The results in the curves of Figure 8 show the best working condition for the vane at 45 , in which the captured power almost triples the pilot test power at each wind speed. Being the geometrical augment relation of 1.4, and 1 . 4 3 3 , the power also keeps the typical proportionality relation with U 3 for A F , and, again, a constant A F equal to the geometrical relation is deduced. This fact establishes an important particular case for an hypothetical law that should be demonstrated: for the adequate vane angles, the estimation of power production can be performed using A F × U as the input wind speed for any free wind speed U.
The behavior of C p vs. T S R was also studied and is presented in Table 2 for the optima with which A F can be estimated. The presence of the vane increments T S R o p t from 0.5 to around 1 with A F 2 . The best case in power augmentation (almost three times) for A F = 2.2 is measured for the vane at 45 . These results are totally coherent with previous works using different augmentation techniques that obtain T S R o p t 1 compared to a value of 0.5 for a conventional Savonius. In these cases, C p , m a x is also two or even three times higher thanks to the vanes, deflectors, curtains or other kinds of concentration configurations [44,51]. Additionally, as mentioned above, Altan et al. also already showed for their curtain type augmentation technique that the inferior vane should be at 45 to optimize the energy capture [52].

3.2. Augmentation Factor in the Small-Scale Building Model

In this case, T S R for each wind speed is measured instead of the T S R o p t . Consequently, the ratio of the T S R s with ( T S R v ) and without ( T S R 0 ) the vane should be corrected according to the rotor speed, since the torque is incremented with the speed. Figure 9 shows these results: both TSRs, their ratio, and the corrected ratio that equals A F . This correction factor is established by the increment relation between U and the cut-in wind speed for the pilot experiment (5 m/s). A logical step in the procedure considering the constant speed–torque relation of the DC generator, since both TSRs (therefore, the rotor speeds) are practically linear with respect to U and also fulfill the same increment relation. Thus, A F is between 2.5 and 3, a very relevant result given the fact that the inlet–outlet width relation is 3:1. The 4:1 relation of the initial configuration could not be installed yet, due to the sensible construction details of the small model. Because of this delicate structure, the fabrication process of which has been very laborious, the free wind speed range in the tunnel has been kept below 10 m/s.

3.3. Wind Rose around the Building

The ERA5 grid around Eibar city is shown in Figure 10 with the ERA5 points in blue. The building on which the anemometer is located is marked in red. The nearest grid point, at a distance of 2.48 km, was chosen to perform the calibration.
With the wind rose representing the nearest ERA5 grid point and the anemometer (see Figure 11), it is easy to realize that the ERA5 data have to be calibrated to make an appropriate estimation. ERA5’s wind rose shows a strong predominant direction toward the northwest, as it is well-known that the climate of the Basque Country is highly related to the behavior of geostrophic winds [14]. This predominant direction is perpendicular to the valley in Eibar, and it is clearly diminished by the roughness of the terrain and the obstacle of the mountains in the anemometer’s data. In fact, Eibar is an industrial city with a population of 20,000 in a deep valley surrounded by mountains that are around 600 m from where the River Deba opens toward the northeast direction.
Thus, this big difference could be explained by the shape and direction of the valley in which Eibar is located. It shows the need for field measurements and indicates that a good calibration methodology must use atmospheric reanalysis to study wind potential in places such as cities and deep valleys, which have high surface roughness. Furthermore, the valley direction determines not only the calibration direction for energy estimation purposes, but it also defines which of the facades of the building should be selected for the implementation of the BIWT.

3.4. Comparison between ERA5 and the Anemometer

These data should be established at a referential height using the log law and the roughness of urban environments [9]. The ERA5 grid-point height is 411 m, thus both datasets should be established at the same height, which is the anemometer’s height in this case, since it is the observation.
According to usual considerations in the wind energy sector, the roughness ( z 0 ) of the urban terrain is around 1–10 m. Roughness is used to apply the logarithmic law of vertical wind shear,
U ( z ) U ( z r ) = L n ( z / z 0 ) L n ( z r / z 0 ) ,
which results in a correction factor between 0.86 and 0.77 for a wind speed at a height of 178 m in ERA5. In terms of the speed of reference at its original height, the authors calculated the following:
U ( 178 ) = L n ( 178 / 1 ) L n ( 411 / 1 ) U ( 411 ) = 0.86 × U ( 411 ) ; L n ( 178 / 10 ) L n ( 411 / 10 ) U ( 411 ) = 0.77 × U ( 411 )
A correction factor of 0.86 was used prior to the calibration method, which is based on quantile mapping. However, first, the correlation between ERA5 and the anemometer had to be directionally studied, mainly in the direction of the valley line. Furthermore, anemometer data had been previously filtered using advanced filters in meteorology, such as temporal checks, persistence tests, and climate-based range tests [53], which were implemented in the R programming language by the authors [54].
Figure 12 shows a time series of a week in June 2018 when the Pearson’s correlation between ERA5 and the anemometer was very high (around 0.95); the wind direction vectors are illustrated above each time point that shows a strong westerly component. The parallel patterns shown by the wind speed series are obvious in the graph. These examples verify the quality of the anemometer’s data since their results are comparable to the reliable ERA5 data in the predominant direction line established by the valley (southwest–northeast). In the first days of this week, a cut-off low occurred in the Bay of Biscay, and it caused strong wind and a large amount of precipitation in that area. During the following days, without the influence of the cut-off low, wind moving in the north direction was observed. This is a global-scale synoptic situation that is easier to detect by the ERA5 model than local setups. Therefore, a high correlation between the observed data and ERA5 data was confirmed.
Additionally, the approximation to observation of the corrected ERA5 signal resulting from the application of the log law is clear in the time series using the 0.86 factor, but it is not enough to totally correct the general overestimation presented by ERA5. Although an extreme correction for a high roughness z 0 = 10 m with a factor of 0.77 would strongly reduce this overestimation (Equation (6)), the usual roughness values for urban environments are kept in this graph.
This example is an extraordinary case, but, if all the cases of wind between the south and east were selected during the study period, a good correlation of 0.70 would finally be obtained. This validation was therefore enough to justify the calibration in this directional range, from which the corresponding building facade will be selected for capturing wind energy.

3.5. Estimation of the Energy Potential

On the basis of the resource assessment results of the wind potential in buildings and the described wind tunnel experiments, a general methodology is presented that also references previous results from the scientific literature to estimate the annual energy production ( A E P ) of ROSEO-BIWT:
  • According to Mertens [38] and the initial experiments with our small-scale building in the wind tunnel, the wind increases its velocity by 20% at the upper edge of a typical building.
  • The simplest PAGVs have increased the wind speed by four times, with a corresponding increase in C p to a value as high as 0.37 [47]. Although higher values can be obtained with wider entrances, the authors will use an A F of 4 for the estimation, although there is also a 20% augmentation due to the additional architectonic acceleration at the upper edge.
  • Taking into account the wind rose in Figure 11, the authors only considered the wind data of ERA5 for the valley direction and for our turbine on the corresponding facade.
  • A F 3 has been corroborated by our small-scale building with PAGVs for different wind speed values in the wind tunnel. Although the optimum vane angle experiment has not yet been developed, the first test results are consistent with values reported in the literature.
  • A F 2 has been corroborated by the real Savonius with the inferior vane.
  • The analyses of the wind resource in the open direction of the valley and the corresponding facade yield a wind speed histogram or Weibull distribution that can be applied to the power curve of the turbine with A F .
  • For the first estimation presented here, the working time at rated power due to the increment of wind speed using PAGVs has been computed.
Although the results of the comparison and the calibration of data are very relevant, the objective of this paper is mainly methodological, and a preliminary estimation of AEP should be made using a well-known device. Thus, for the estimation of generated power, a commercial Savonius model (SeaHawk-PACWIND) was used: the rated power is of 1.1 kW, the rated wind speed is 17.9 m/s, the cut-in wind speed is 3.1 m/s, the cut-off without a given limit is a drag device, and the swept area is 0.92 m 2 [55].
When the pure ERA5 wind speed distribution was considered for the best facade, after the quantile-matching calibration using the anemometer data, these are the preliminary results:
  • The average wind speed is 4.2 m/s, and the shape factor k is around 2, depending on the angle range in the predominant direction, i.e., southwest (see Equations (2) and (1)).
  • The turbine’s working hours per year in the interval of rated wind speed (above 17.9 m/s) can be computed if the cumulative density function F ( U ) (Equation (2)) is applied to c, which results in the following working hours:
    1 F ( 17.9 ) × 365.25 × 24 = 160
  • Therefore, AEP is 160 × 1.1 = 170 kWh at the rated power; it is a very small value since the working hours of a profitable turbine should be around 2000 h per year.
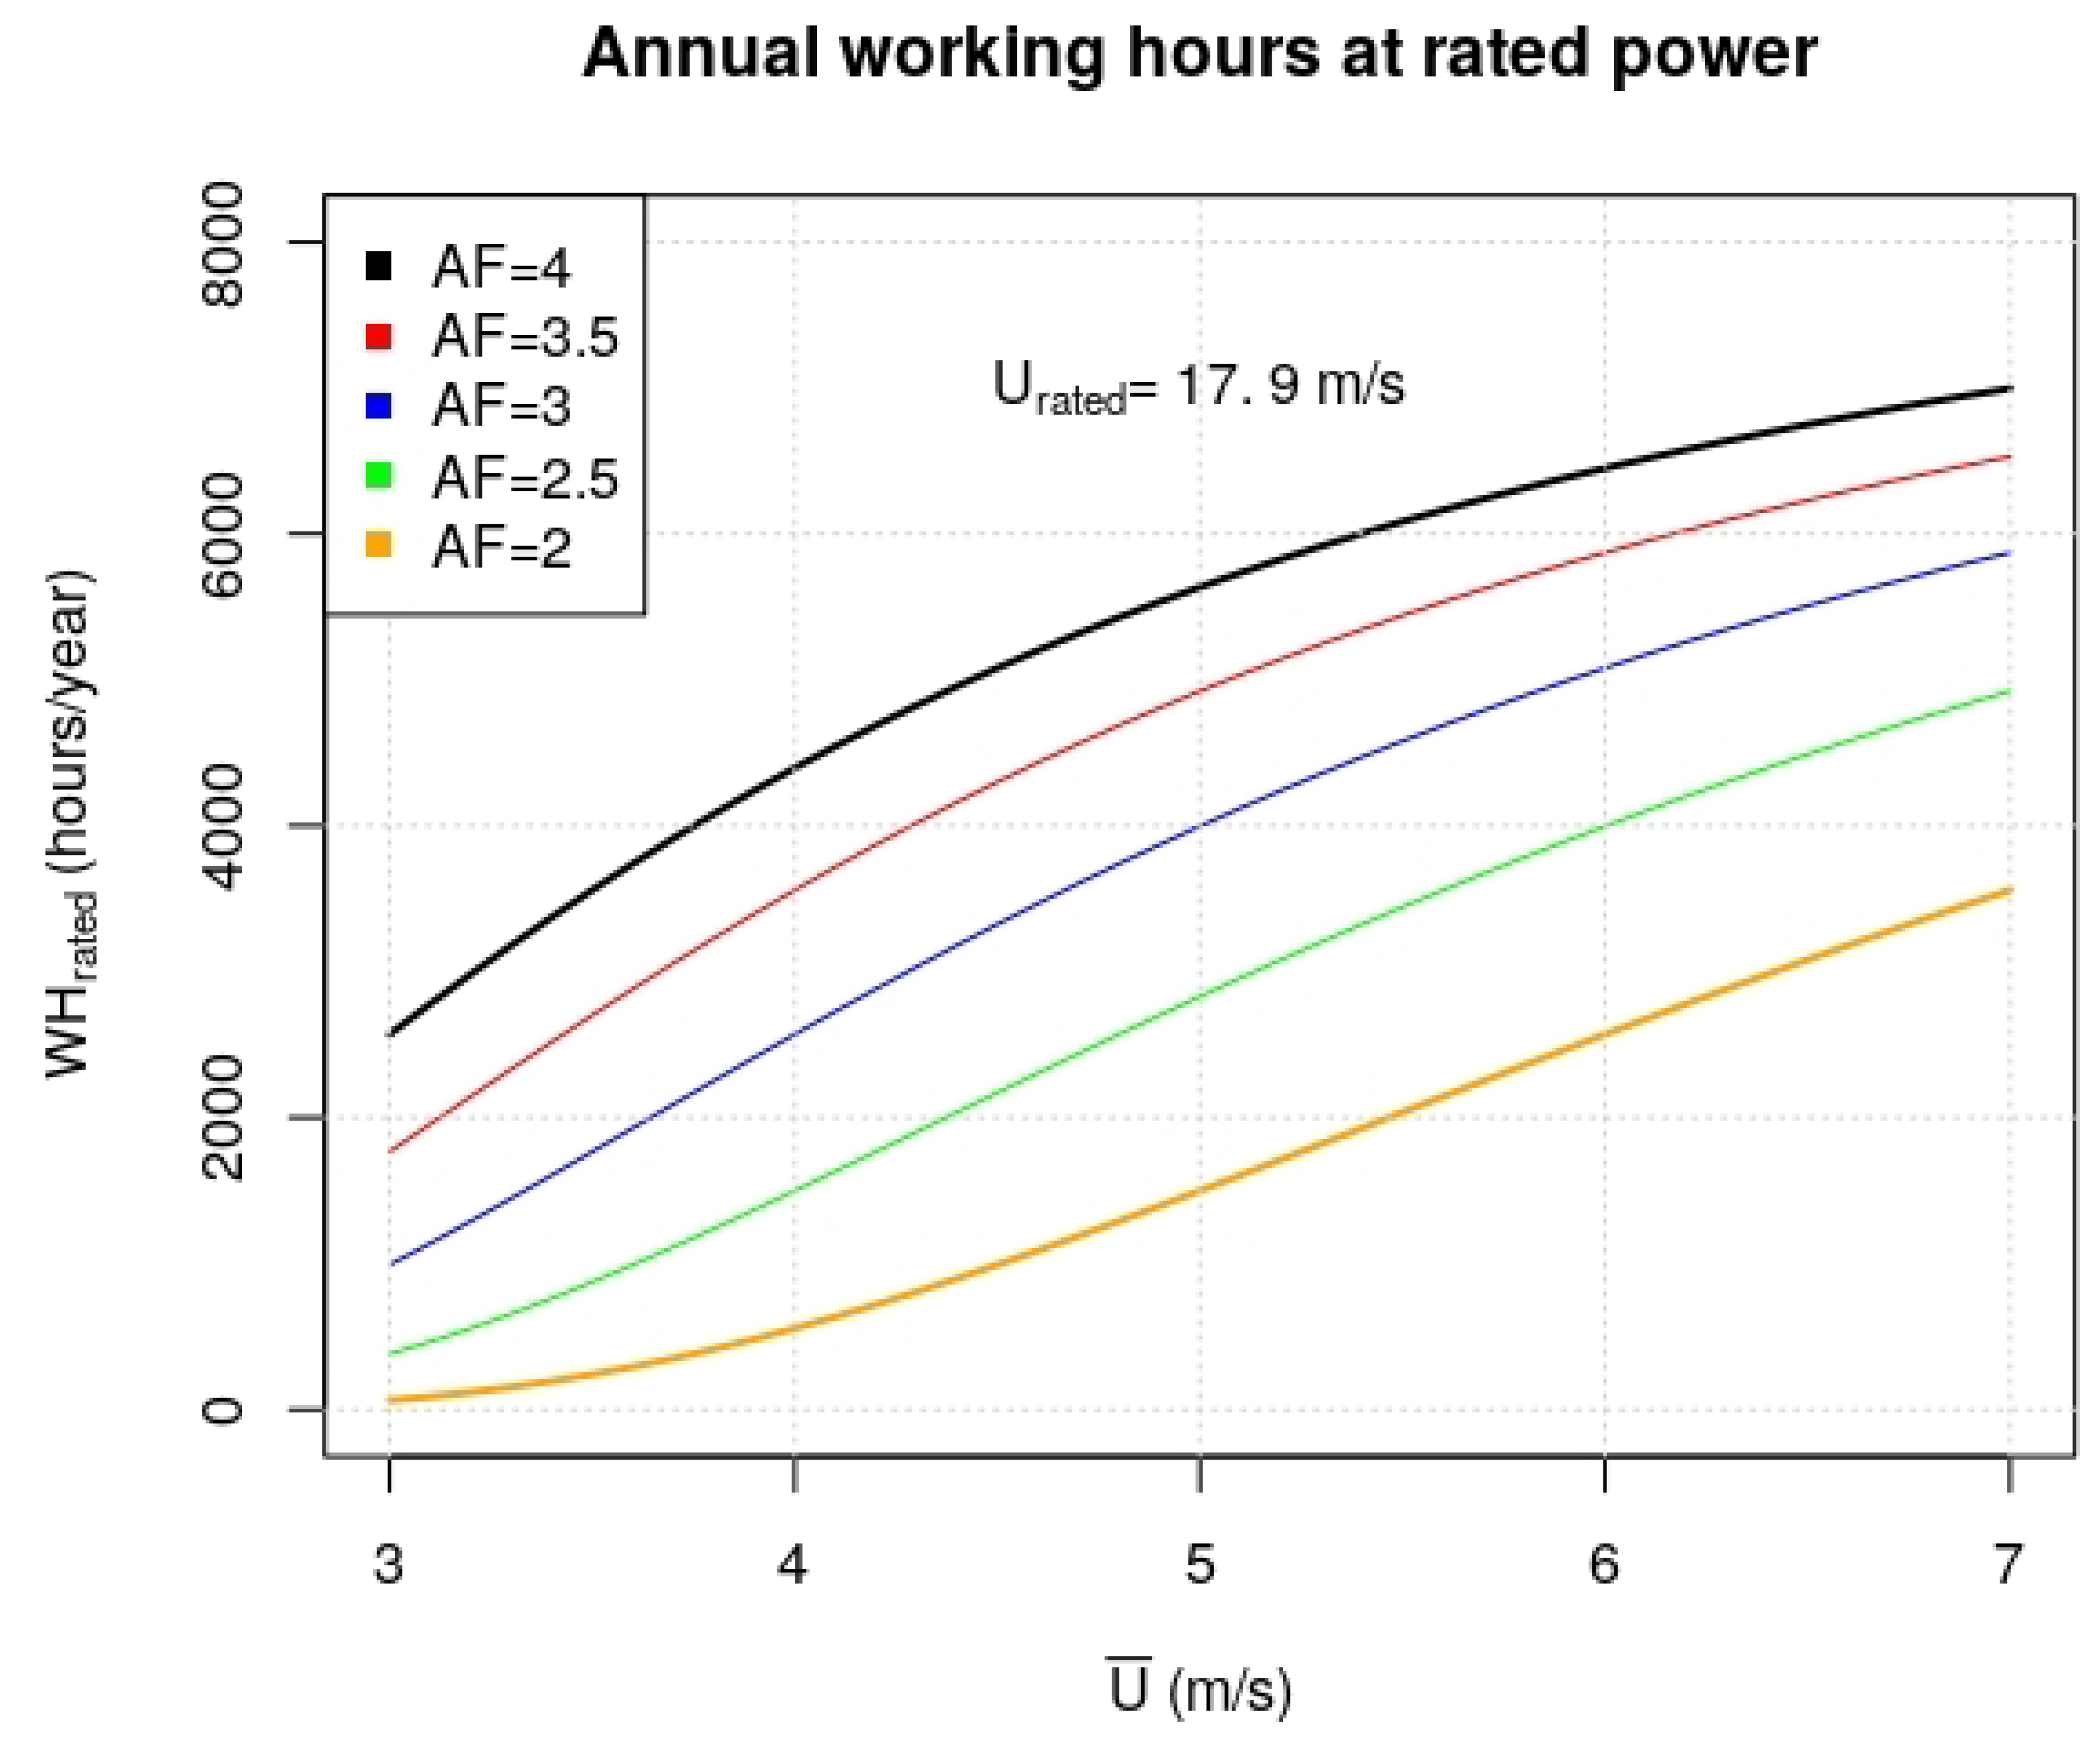
  • However, multiplying the scale parameter c by values between 2 and 4 ( A F = 2 is the value obtained in the laboratory using only one inferior vane and 4 the maximum expected value according to the mentioned literature) and keeping the typical value of k = 2 , the total augmentation factor A F from the PAGVs and the edge effect increases the AEP and working hours. Figure 13 shows the annual working hours ( W H h o u r s ) at rated power in function of the average wind speed U ¯ of the site for different factors: A F = 2 ; 2.5 ; 3 ; 3.5 ; 4 .
    At low annual average wind speed of 3 m/s, the maximum A F = 4 can produce 2000 h at rated power. At U ¯ = 4 m/s, A F between 2.5 and 3 is necessary to ensure the 2000 h. At U ¯ = 5 m/s, the minimum A F = 2 obtained with only the inferior vane (Figure 5) is almost sufficient. At high U ¯ s, an A F = 3.5 or 4 implies 75% of the time at rated power.
Given the strong directionality presented by the anemometer’s wind rose (Figure 11), two ROSEO-BIWTs installed in opposite facades of the building that are perpendicular to the valley would capture almost all of the mentioned hours because winds that are perpendicular to the valley are infrequent.

4. Conclusions and Future Outlook

An integral methodology with preliminary results is presented for a new type of BIWT. The preliminary results include the energy potential estimation, measurements of small-scale building aerodynamic effects, and the influence of PAGVs. In the future, an AEP increase of 20% via PAGVs at the edge of the buildings must be demonstrated using a real prototype of ROSEO-BIWT at the edge of the building in Eibar. For that, the building in the city of Eibar will be used in the Bizia Lab project of the University of Basque Country, together with the previous wind tunnel experiments for the mentioned small-scale building with PAGVs and short Savonius prototype.
The anemometer was installed on the roof; with the new data provided by ERA5 for the nearest grid point, the identification of the best facade and the corresponding wind distribution were obtained following the methodology described in this paper applied to a longer period. This methodology will be relevant when the one-year period has elapsed. These preliminary results and the methodological discussion developed to date encourage us to implement future refinements of ROSEO-BIWT and the related wind energy estimation methodology.
If the building edge effect and the PAGVs produce a wind speed augmentation of A F , our general mathematical proof for working hours at the rated power shows that the hours without the augmentation can be considerably incremented. This is a very important general rule for turbines with vanes, as shown in Figure 13. Furthermore, the values of A F between two and four are coherent with the literature and the experimental results, even under-valued, since the augment of the free wind in the edge of the building is not considered. The edge effect augment factor of 1.2 documented by the literature and the higher inlet-outlet width relationship other type of PAGVs could increase the overall A F .
Additionally, a novel validation method for anemometers developed by the authors in a recent study for wind farms [56] will be very beneficial since it enables the comparison and combination of data from more than one anemometer installed on the roof of the building. This allows us to consider both the zonal and meridional components in a single comparison score.
Future experiments in the wind tunnel with a small-scale building and the PAGVs will be carried out to obtain the optimum value of the angle between the vanes and the augmentation factor for different wind speeds within the operating range of the turbine. The augmentation factors measured with an interval of 0.5 m/s within this range, together with the measurement of the power curve of the longitudinal profile of the Savonius with the same step, will allow us to apply the corresponding histogram distribution of the corrected and calibrated wind to the augmented power curve. However, it is expected that future energy production results will be similar to the values presented here.
Finally, it should be emphasized that lacking the ability to change the viscosity of the air in the tunnel is an important inconvenience for small-scale building experiments. In the future, a more advanced tunnel with the ability to change the pressure and temperature is necessary, together with a parallel validation of the results using CFD simulations of the edge effect of the building with PAGVs.

Author Contributions

Conceptualization, A.U., O.G., and M.d.R.; Methodology, A.U., O.G., and M.d.R.; Software, A.U., O.G., M.d.R., S.C.-M., and A.G.-A.; Validation, O.G.; Investigation, A.U., O.G., and A.G.-A.; Writing—Original Draft Preparation, A.U. and O.G.; Writing—Review and Editing, all authors; Supervision, all authors; Project Administration, A.U.; and Funding Acquisition, A.U.

Funding

The research leading to these results was carried out in the framework of the Programme Campus Bizia Lab EHU (Campus Living Lab) with a financial grant from the Office of Sustainability of the Vice-Chancellorship for Innovation, Social Outreach and Cultural Activities of the University of the Basque Country (UPV/EHU). This programme is supported by the Basque Government. We acknowledge also the availability given by the School of Engineering of Gipuzkoa-Eibar in the University of Basque Country, the EDP-Renewable awards in which we obtained the main award in September 2017, the Youth Enterprise Grant of UPV/EHU, and the project GIU17/02 of EHU/UPV. All computations and representations of this work were developed using the programming language R [54].

Conflicts of Interest

The authors declare no conflict of interest.

Abbreviations

The following abbreviations are used in this manuscript:
CFDComputational Fluid Dynamics
BIWTBuilding-Integrated Wind turbine
O&MOperation and maintenance
PAGVPower Augment Guiding Vane
PDFProbability Density Function
A E P Annual Energy Production
A F Augmentation factor
cWeibull’s scale parameter
C p Power Coefficient
C p , m a x Maximum Power Coefficient
kWeibull’s shape parameter
T S R Tip Speed Ratio
T S R o p t Optimum TSR where C p is maximum
T S R o p t A Optimum TSR with augmentation techniques
U ¯ Average wind Speed
U p Wind speed in the prototype
U m Wind speed in the model
U r a t e d Rated wind speed
V t i p Blade tip speed
W T r a t e d Annual working hours at rated power
z 0 Roughness of the Terrain
z r Reference height

References

  1. WWEA. WWEA Released Latest Global Small Wind Statistics; WWEA: Bonn, Germany, 2018. [Google Scholar]
  2. Chastas, P.; Theodosiou, T.; Bikas, D.; Kontoleon, K. Embodied energy and nearly zero energy buildings: A review in residential buildings. Procedia Environ. Sci. 2017, 38, 554–561. [Google Scholar] [CrossRef]
  3. Bogle, I. Integrating wind turbines in tall buildings. CTBUH J. 2011, 4, 30–33. [Google Scholar]
  4. Smith, R.F.; Killa, S. Bahrain World Trade Center (BWTC): The first large-scale integration of wind turbines in a building. Struct. Des. Tall Spec. Build. 2007, 16, 429–439. [Google Scholar] [CrossRef]
  5. Balduzzi, F.; Bianchini, A.; Ferrari, L. Microeolic turbines in the built environment: Influence of the installation site on the potential energy yield. Renew. Energy 2012, 45, 163–174. [Google Scholar] [CrossRef]
  6. Balduzzi, F.; Bianchini, A.; Gentiluomo, D.; Ferrara, G.; Ferrari, L. Rooftop siting of a small wind turbine using a hybrid BEM-CFD model. In Research and Innovation on Wind Energy on Exploitation in Urban Environment Colloquium; Springer: Riva del Garda, Italy, 2017; pp. 91–112. [Google Scholar]
  7. Oerlemans, S.; Sijtsma, P.; López, B.M. Location and quantification of noise sources on a wind turbine. J. Sound Vib. 2007, 299, 869–883. [Google Scholar] [CrossRef]
  8. Toja-Silva, F.; Lopez-Garcia, O.; Peralta, C.; Navarro, J.; Cruz, I. An empirical–heuristic optimization of the building-roof geometry for urban wind energy exploitation on high-rise buildings. Appl. Energy 2016, 164, 769–794. [Google Scholar] [CrossRef]
  9. Manwell, J.F.; McGowan, J.G.; Rogers, A.L. Wind Energy Explained: Theory, Design and Application; John Wiley & Sons: Chichester, UK, 2010. [Google Scholar]
  10. Dilimulati, A.; Stathopoulos, T.; Paraschivoiu, M. Wind turbine designs for urban applications: A case study of shrouded diffuser casing for turbines. J. Wind Eng. Ind. Aerodyn. 2018, 175, 179–192. [Google Scholar] [CrossRef] [Green Version]
  11. Hyams, M. 20-Wind energy in the built environment. In Metropolitan Sustainability; Zeman, F., Ed.; Woodhead Publishing Series in Energy; Woodhead Publishing: Cambridge, UK, 2012; pp. 457–499. [Google Scholar]
  12. Arteaga-López, E.; Ángeles-Camacho, C.; Bañuelos-Ruedas, F. Advanced methodology for feasibility studies on building-mounted wind turbines installation in urban environment: Applying CFD analysis. Energy 2019, 167, 181–188. [Google Scholar] [CrossRef]
  13. Ulazia, A.; Sáenz, J.; Ibarra-Berastegui, G.; González-Rojí, S.J.; Carreno-Madinabeitia, S. Using 3DVAR data assimilation to measure offshore wind energy potential at different turbine heights in the West Mediterranean. Appl. Energy 2017, 208, 1232–1245. [Google Scholar] [CrossRef] [Green Version]
  14. Ulazia, A.; Saenz, J.; Ibarra-Berastegui, G. Sensitivity to the use of 3DVAR data assimilation in a mesoscale model for estimating offshore wind energy potential. A case study of the Iberian northern coastline. Appl. Energy 2016, 180, 617–627. [Google Scholar] [CrossRef]
  15. Edp-Renewable University Challenge Awards. Available online: https://www.edpr.com/en/news/2017/09/28/edpr-celebrates-ninth-edition-university-challenge-awards-spain (accessed on 28 September 2017).
  16. Chong, W.; Pan, K.; Poh, S.; Fazlizan, A.; Oon, C.; Badarudin, A.; Nik-Ghazali, N. Performance investigation of a power augmented vertical axis wind turbine for urban high-rise application. Renew. Energy 2013, 51, 388–397. [Google Scholar] [CrossRef]
  17. Chong, W.; Naghavi, M.; Poh, S.; Mahlia, T.; Pan, K. Techno-economic analysis of a wind–solar hybrid renewable energy system with rainwater collection feature for urban high-rise application. Appl. Energy 2011, 88, 4067–4077. [Google Scholar] [CrossRef]
  18. Tong, C.W.; Zainon, M.; Chew, P.S.; Kui, S.C.; Keong, W.S.; Chen, P.K. Innovative Power-Augmentation-Guide-Vane Design of Wind-Solar Hybrid Renewable Energy Harvester for Urban High Rise Application. In Proceedings of the 2010 Physics Education Research Conference, Portland, OR, USA, 21–22 July 2010; Volume 1225, pp. 507–521. [Google Scholar]
  19. Park, J.; Jung, H.J.; Lee, S.W.; Park, J. A new building-integrated wind turbine system utilizing the building. Energies 2015, 8, 11846–11870. [Google Scholar] [CrossRef]
  20. Zemamou, M.; Aggour, M.; Toumi, A. Review of savonius wind turbine design and performance. Energy Procedia 2017, 141, 383–388. [Google Scholar] [CrossRef]
  21. Kim, S.; Cheong, C. Development of low-noise drag-type vertical wind turbines. Renew. Energy 2015, 79, 199–208. [Google Scholar] [CrossRef]
  22. Ulazia, A. Multiple roles for analogies in the genesis of fluid mechanics: How analogies can cooperate with other heuristic strategies. Found. Sci. 2016, 21, 543–565. [Google Scholar] [CrossRef]
  23. Hersbach, H. The ERA5 Atmospheric Reanalysis; AGU Fall Meeting Abstracts: San Francisco, CA, USA, 2016. [Google Scholar]
  24. Olauson, J. ERA5: The new champion of wind power modelling? Renew. Energy 2018, 126, 322–331. [Google Scholar] [CrossRef] [Green Version]
  25. Ulazia, A.; Penalba, M.; Ibarra-Berastegui, G.; Ringwood, J.; Saénz, J. Wave energy trends over the Bay of Biscay and the consequences for wave energy converters. Energy 2017, 141, 624–634. [Google Scholar] [CrossRef]
  26. Penalba, M.; Ulazia, A.; Ibarra-Berastegui, G.; Ringwood, J.; Sáenz, J. Wave energy resource variation off the west coast of Ireland and its impact on realistic wave energy converters’ power absorption. Appl. Energy 2018, 224, 205–219. [Google Scholar] [CrossRef]
  27. Ulazia, A.; Penalba, M.; Rabanal, A.; Ibarra-Berastegi, G.; Ringwood, J.; Sáenz, J. Historical Evolution of the Wave Resource and Energy Production off the Chilean Coast over the 20th Century. Energies 2018, 11, 2289. [Google Scholar] [CrossRef]
  28. Teutschbein, C.; Seibert, J. Bias correction of regional climate model simulations for hydrological climate-change impact studies: Review and evaluation of different methods. J. Hydrol. 2012, 456, 12–29. [Google Scholar] [CrossRef]
  29. Watanabe, S.; Kanae, S.; Seto, S.; Yeh, P.J.F.; Hirabayashi, Y.; Oki, T. Intercomparison of bias-correction methods for monthly temperature and precipitation simulated by multiple climate models. J. Geophys. Res. Atmos. 2012, 117. [Google Scholar] [CrossRef] [Green Version]
  30. Lafon, T.; Dadson, S.; Buys, G.; Prudhomme, C. Bias correction of daily precipitation simulated by a regional climate model: A comparison of methods. Int. J. Climatol. 2013, 33, 1367–1381. [Google Scholar] [CrossRef]
  31. Block, P.; Souza Filho, F.; Sun, L.; Kwon, H.H. A streamflow forecasting framework using multiple climate and hydrological models. J. Am. Water Resour. Assoc. 2009, 45, 828–843. [Google Scholar] [CrossRef]
  32. Boé, J.; Terray, L.; Habets, F.; Martin, E. Statistical and dynamical downscaling of the Seine basin climate for hydro-meteorological studies. Int. J. Climatol. 2007, 27, 1643–1655. [Google Scholar] [CrossRef]
  33. Sun, F.; Roderick, M.L.; Lim, W.H.; Farquhar, G.D. Hydroclimatic projections for the Murray-Darling Basin based on an ensemble derived from Intergovernmental Panel on Climate Change AR4 climate models. Water Resour. Res. 2011, 47, W00G02. [Google Scholar] [CrossRef]
  34. Piani, C.; Haerter, J.O.; Coppola, E. Statistical bias correction for daily precipitation in regional climate models over Europe. Theor. Appl. Climatol. 2010, 99, 187–192. [Google Scholar] [CrossRef]
  35. Rojas, R.; Feyen, L.; Dosio, A.; Bavera, D. Improving pan-European hydrological simulation of extreme events through statistical bias correction of RCM-driven climate simulations. Hydrol. Earth Syst. Sci. 2011, 15, 2599–2620. [Google Scholar] [CrossRef] [Green Version]
  36. Bett, P.E.; Thornton, H.E.; Clark, R.T. Using the Twentieth Century Reanalysis to assess climate variability for the European wind industry. Theor. Appl. Climatol. 2015, 127, 1–20. [Google Scholar] [CrossRef]
  37. Shikha; Bhatti, T.; Kothari, D. Wind energy conversion systems as a distributed source of generation. J. Energy Eng. 2003, 129, 69–80. [Google Scholar] [CrossRef]
  38. Mertens, S. Wind Energy in the Built Environment: Concentrator Effects of Buildings. Doctoral Thesis, Delf University (TUDelf), Delft, The Netherlands, 2006. [Google Scholar]
  39. Akwa, J.V.; Vielmo, H.A.; Petry, A.P. A review on the performance of Savonius wind turbines. Renew. Sustain. Energy Rev. 2012, 16, 3054–3064. [Google Scholar] [CrossRef]
  40. Alom, N.; Saha, U.K. Four decades of research into the augmentation techniques of Savonius wind turbine rotor. J. Energy Resour. Technol. 2018, 140, 050801. [Google Scholar] [CrossRef]
  41. El-Askary, W.; Nasef, M.; Abdel-Hamid, A.; Gad, H. Harvesting wind energy for improving performance of Savonius rotor. J. Wind Eng. Ind. Aerodyn. 2015, 139, 8–15. [Google Scholar] [CrossRef]
  42. Mohamed, M.; Janiga, G.; Pap, E.; Thévenin, D. Optimization of Savonius turbines using an obstacle shielding the returning blade. Renew. Energy 2010, 35, 2618–2626. [Google Scholar] [CrossRef]
  43. Bhatti, T.; Kothari, D. A new vertical axis wind rotor using convergent nozzles. In Proceedings of the Large Engineering Systems Conference on Power Engineering, Montreal, QC, Canada, 7–9 May 2003; pp. 177–181. [Google Scholar]
  44. Altan, B.D.; Atılgan, M. A study on increasing the performance of Savonius wind rotors. J. Mech. Sci. Technol. 2012, 26, 1493–1499. [Google Scholar] [CrossRef]
  45. Roy, S.; Saha, U.K. Review on the numerical investigations into the design and development of Savonius wind rotors. Renew. Sustain. Energy Rev. 2013, 24, 73–83. [Google Scholar] [CrossRef]
  46. Altan, B.D.; Atılgan, M. The use of a curtain design to increase the performance level of a Savonius wind rotors. Renew. Energy 2010, 35, 821–829. [Google Scholar] [CrossRef]
  47. Wong, K.H.; Chong, W.T.; Sukiman, N.L.; Poh, S.C.; Shiah, Y.C.; Wang, C.T. Performance enhancements on vertical axis wind turbines using flow augmentation systems: A review. Renew. Sustain. Energy Rev. 2017, 73, 904–921. [Google Scholar] [CrossRef]
  48. Maxon Motor. Available online: https://www.maxonmotor.com (accessed on 15 March 2019).
  49. Usman, M.; Hanif, A.; Kim, I.H.; Jung, H.J. Experimental validation of a novel piezoelectric energy harvesting system employing wake galloping phenomenon for a broad wind spectrum. Energy 2018, 153, 882–889. [Google Scholar] [CrossRef]
  50. Choi, C.K.; Kwon, D.K. Wind tunnel blockage effects on aerodynamic behavior of bluff body. Wind Struct. Int. J. 1998, 1, 351–364. [Google Scholar] [CrossRef]
  51. Emmanuel, B.; Jun, W. Numerical study of a six-bladed Savonius wind turbine. J. Sol. Energy Eng. 2011, 133, 044503. [Google Scholar] [CrossRef]
  52. Altan, B.D.; Atılgan, M. An experimental and numerical study on the improvement of the performance of Savonius wind rotor. Energy Conv. Manag. 2008, 49, 3425–3432. [Google Scholar] [CrossRef]
  53. Fiebrich, C.A.; Morgan, C.R.; McCombs, A.G.; Hall, P.K., Jr.; McPherson, R.A. Quality assurance procedures for mesoscale meteorological data. J. Atmos. Ocean. Technol. 2010, 27, 1565–1582. [Google Scholar] [CrossRef]
  54. Venables, W.N.; Smith, D.M.; Team, R.C. An introduction to R-Notes on R: A programming environment for data analysis and graphics. 2018. Available online: https://cran.r-project.org/doc/manuals/r-release/R-intro.pdf (accessed on 15 March 2019).
  55. SeaHawk. SeaHawk-Desert Power Savonius Turbine; Desert Power: Palm Desert, CA, USA, 2017. [Google Scholar]
  56. Rabanal, A.; Ulazia, A.; Ibarra-Berastegi, G.; Sáenz, J.; Elosegui, U. MIDAS: A Benchmarking Multi-Criteria Method for the Identification of Defective Anemometers in Wind Farms. Energies 2018, 12, 28. [Google Scholar] [CrossRef]
Figure 1. Selected buildings and anemometers 1 and 2 on the roof.
Energies 12 02027 g001
Figure 2. Calibration procedure and periods of the ERA5 and anemometer data.
Energies 12 02027 g002
Figure 3. Re-creation on the basis of Mertens [38] for wind acceleration over the windward upper edge of a building.
Energies 12 02027 g003
Figure 4. ROSEO-BIWT design.
Energies 12 02027 g004
Figure 5. Adapted figure of the optimum design using curtain vanes [46].
Energies 12 02027 g005
Figure 6. The Savonius turbine inside the wind tunnel with the inferior vane.
Energies 12 02027 g006
Figure 7. The small building model (a) without the vanes; and (b) with the vanes.
Energies 12 02027 g007
Figure 8. Power production versus wind speed for different positions of the vane and the pilot test without the vane.
Energies 12 02027 g008
Figure 9. TSRs, the ratio, and the corrected ratio for the rotor speed with and without the vane.
Energies 12 02027 g009
Figure 10. Nearest ERA5 grid points (blue) around the study point (red).
Energies 12 02027 g010
Figure 11. Details of the location of the anemometer and the nearest ERA5 grid point (left). Representation of the corresponding wind roses of ERA5 and anemometer data (right).
Energies 12 02027 g011
Figure 12. Wind speed of nearest ERA5 grid point (blue) and anemometer (red) during a week of June. In addition, wind direction vectors are represented in the graph.
Energies 12 02027 g012
Figure 13. Annual working hours at rated power versus U ¯ for different A F values.
Energies 12 02027 g013
Table 1. Characteristics of the wind tunnel.
Length; diameter2 m; 630 mm
Measuring systemPitot tubes, an ultrasonic anemometer, and air pressure transducers
Range of wind speed0–13 m/s
MaterialsStructure of aluminum and dome of polycarbonate
Control panelPotentiometer for the regulation of wind speed, rpm, and torque
Generatormaxon RE motor 65 mm, Graphite Brushes, 250 Watt [48]
Data acquisitionVariable resistor with measurement of voltage, intensity, and power
Table 2. Optimum C p , and corresponding T S R , A F and power increment for the Savonius turbine in the wind tunnel for the pilot text, negative torque vertical wall, and different angles of the vane.
Experiment C p , max ( % ) TSR opt AF
PAGV3017.11.012.0
PAGV4519.21.102.2
PAGV7016.10.941.9
NT Wall11.60.681.4
Pilot test6.50.50-

