Experimental Investigation on Thermal Performance of a PV/T-PCM (Photovoltaic/Thermal) System Cooling with a PCM and Nanofluid

 ,
,  ,
,  , and
, and
Abstract
:
1. Introduction
2. Experimental
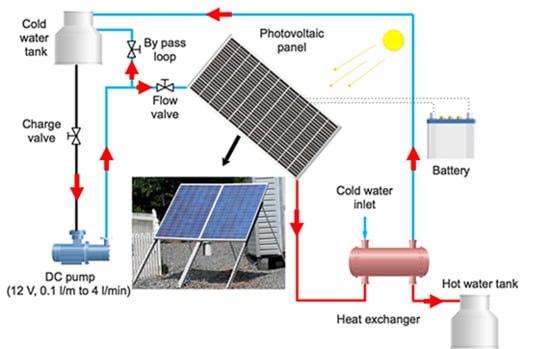
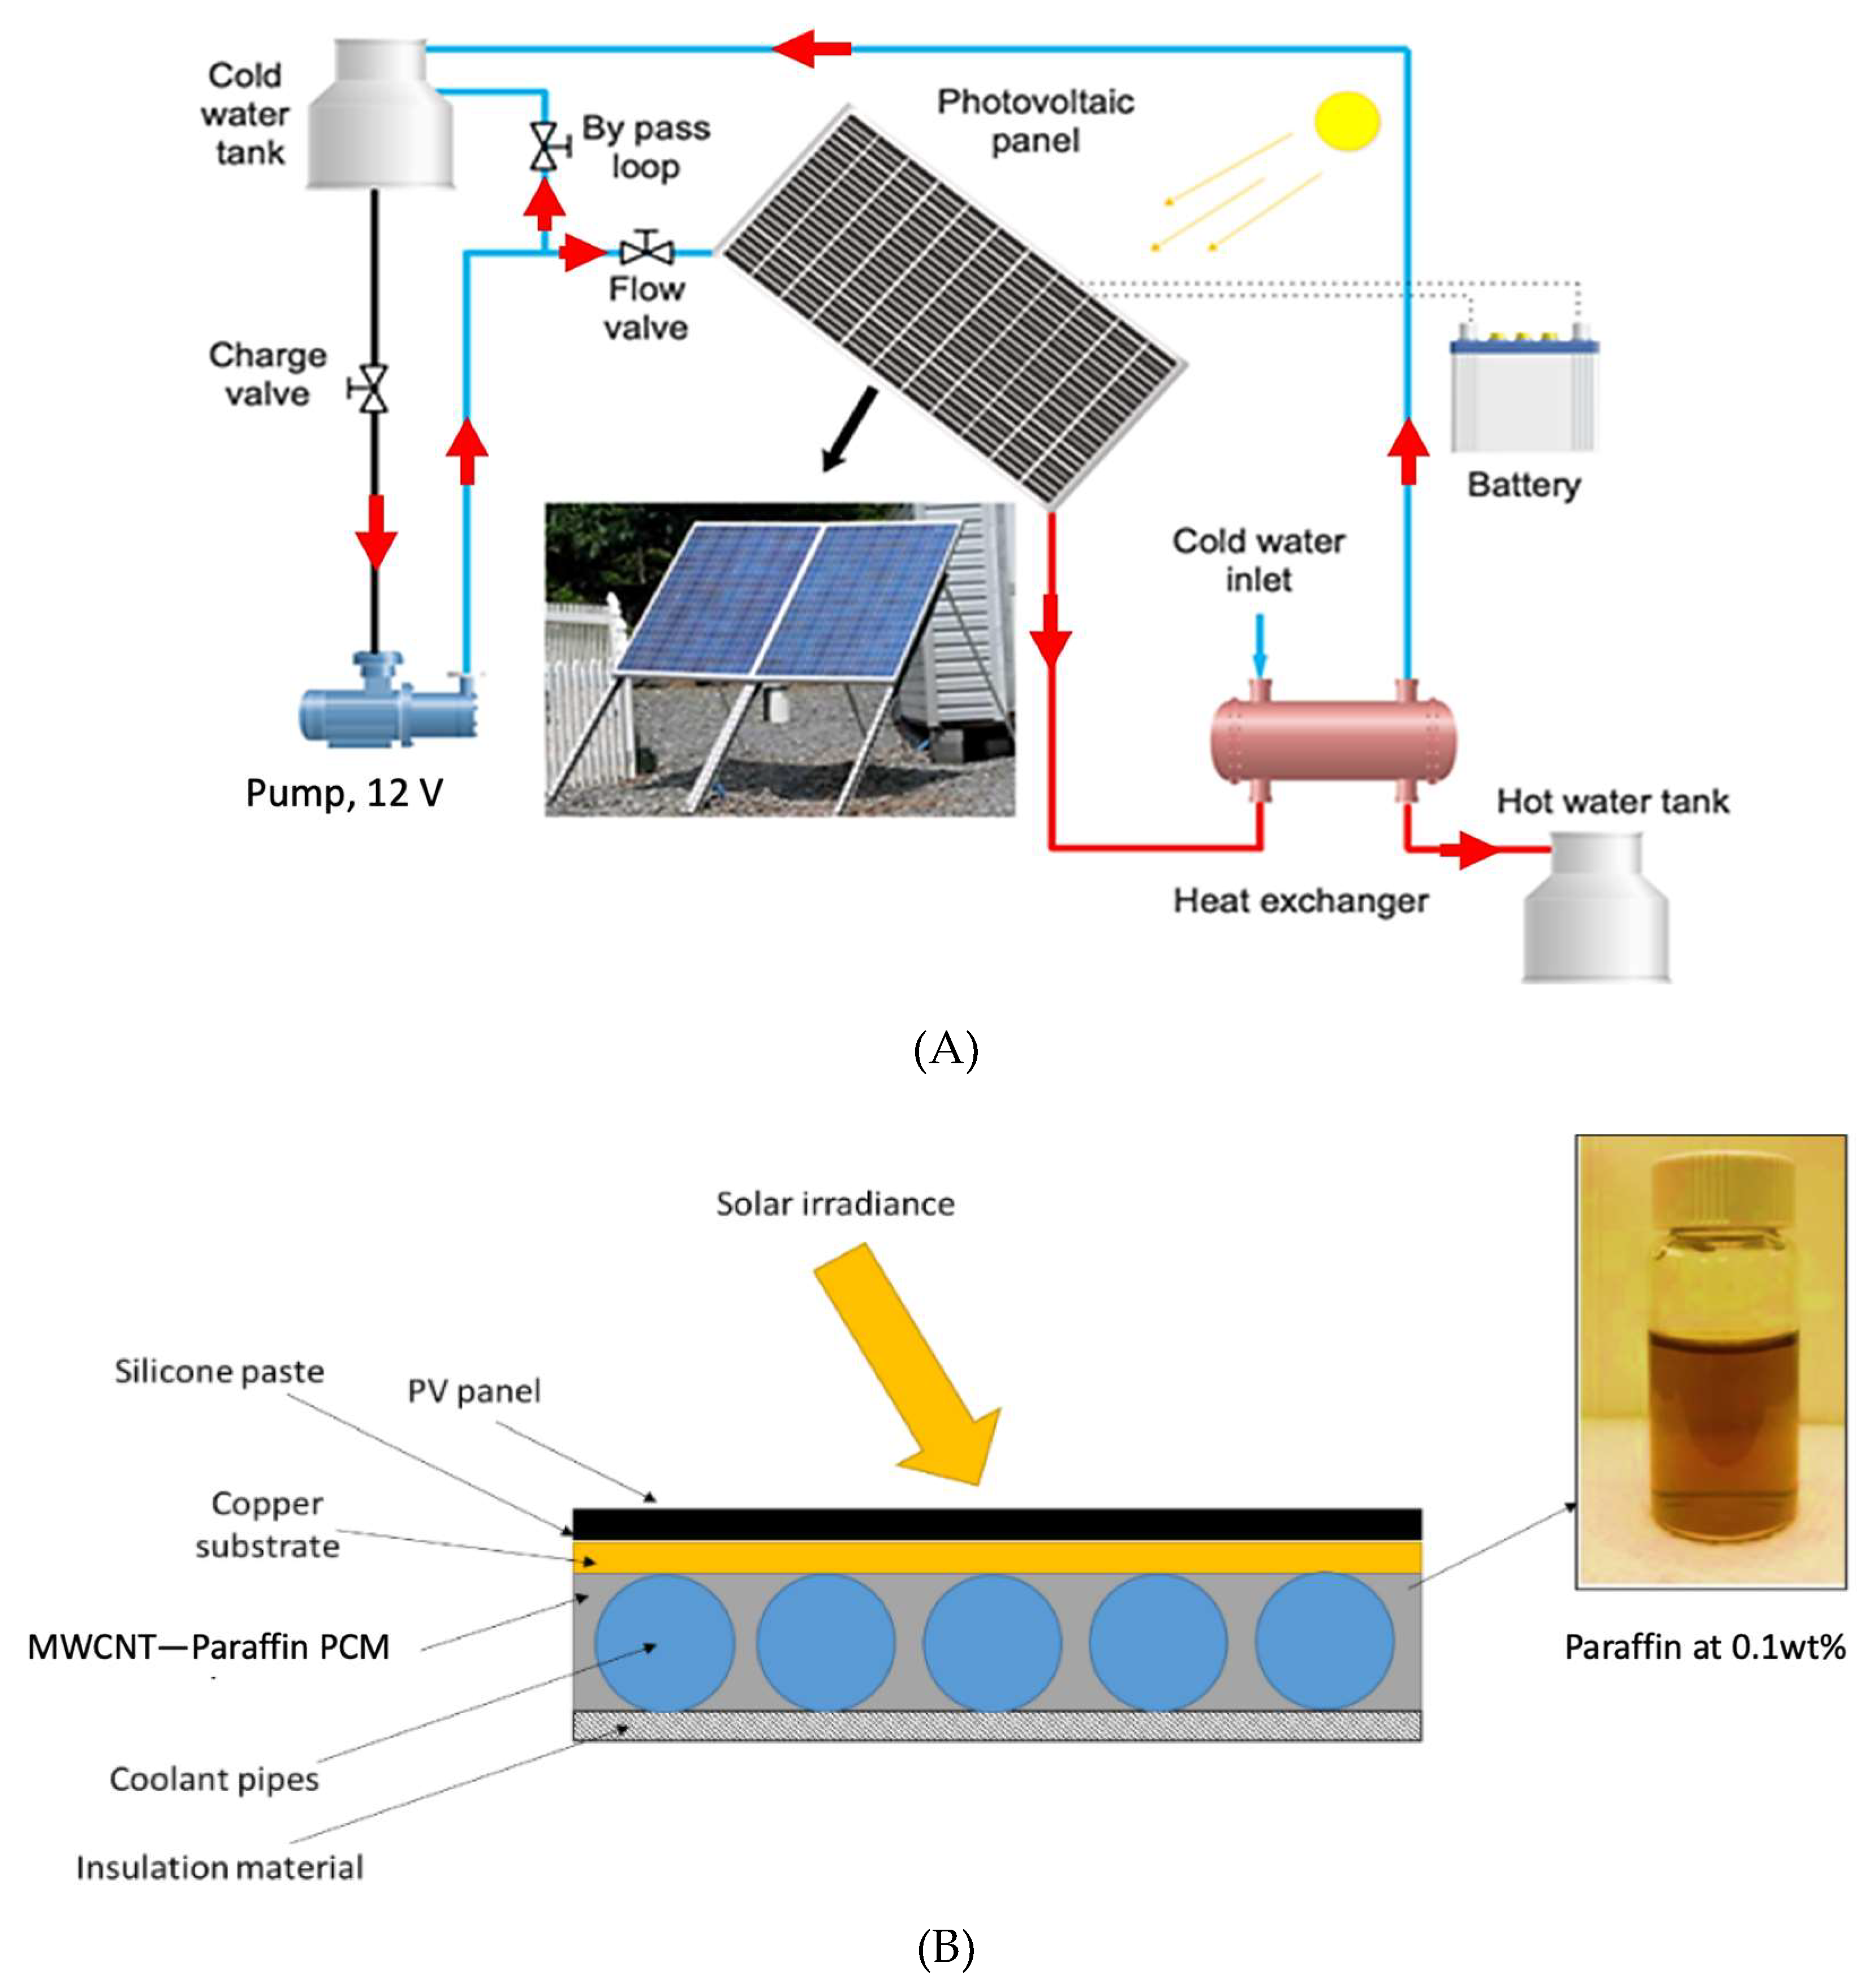
2.1. Test Rig
2.2. Preparation and Characterization of the Nanofluid
- 1-
- The desired mass of multiwalled carbon nanotube was dispersed in water/ethylene glycol 50:50 (by volume). To quantify the mass of the nanoparticles, a balancer with an accuracy of 0.0001 g was employed.
- 2-
- An ultrasonic homogenizer was employed to uniformly disperse the MWCNTs within water/ethylene glycol (50:50) nano-suspension (WEG 50). The frequency, timer, and power throughput of the device were set to 20 kHz, 10 min and 30 Watt to ensure that the base fluid would not evaporate and the structure of the carbon nanotube would not be affected by ultrasonic waves.
- 3-
- Nonylphenol ethoxylates at 0.1vol% was used to further increase the stability of the nanofluid by decreasing the surface tension and the attractive forces within the bulk of the nanofluid.
2.3. Data Reduction and Uncertainty Analysis
3. Results
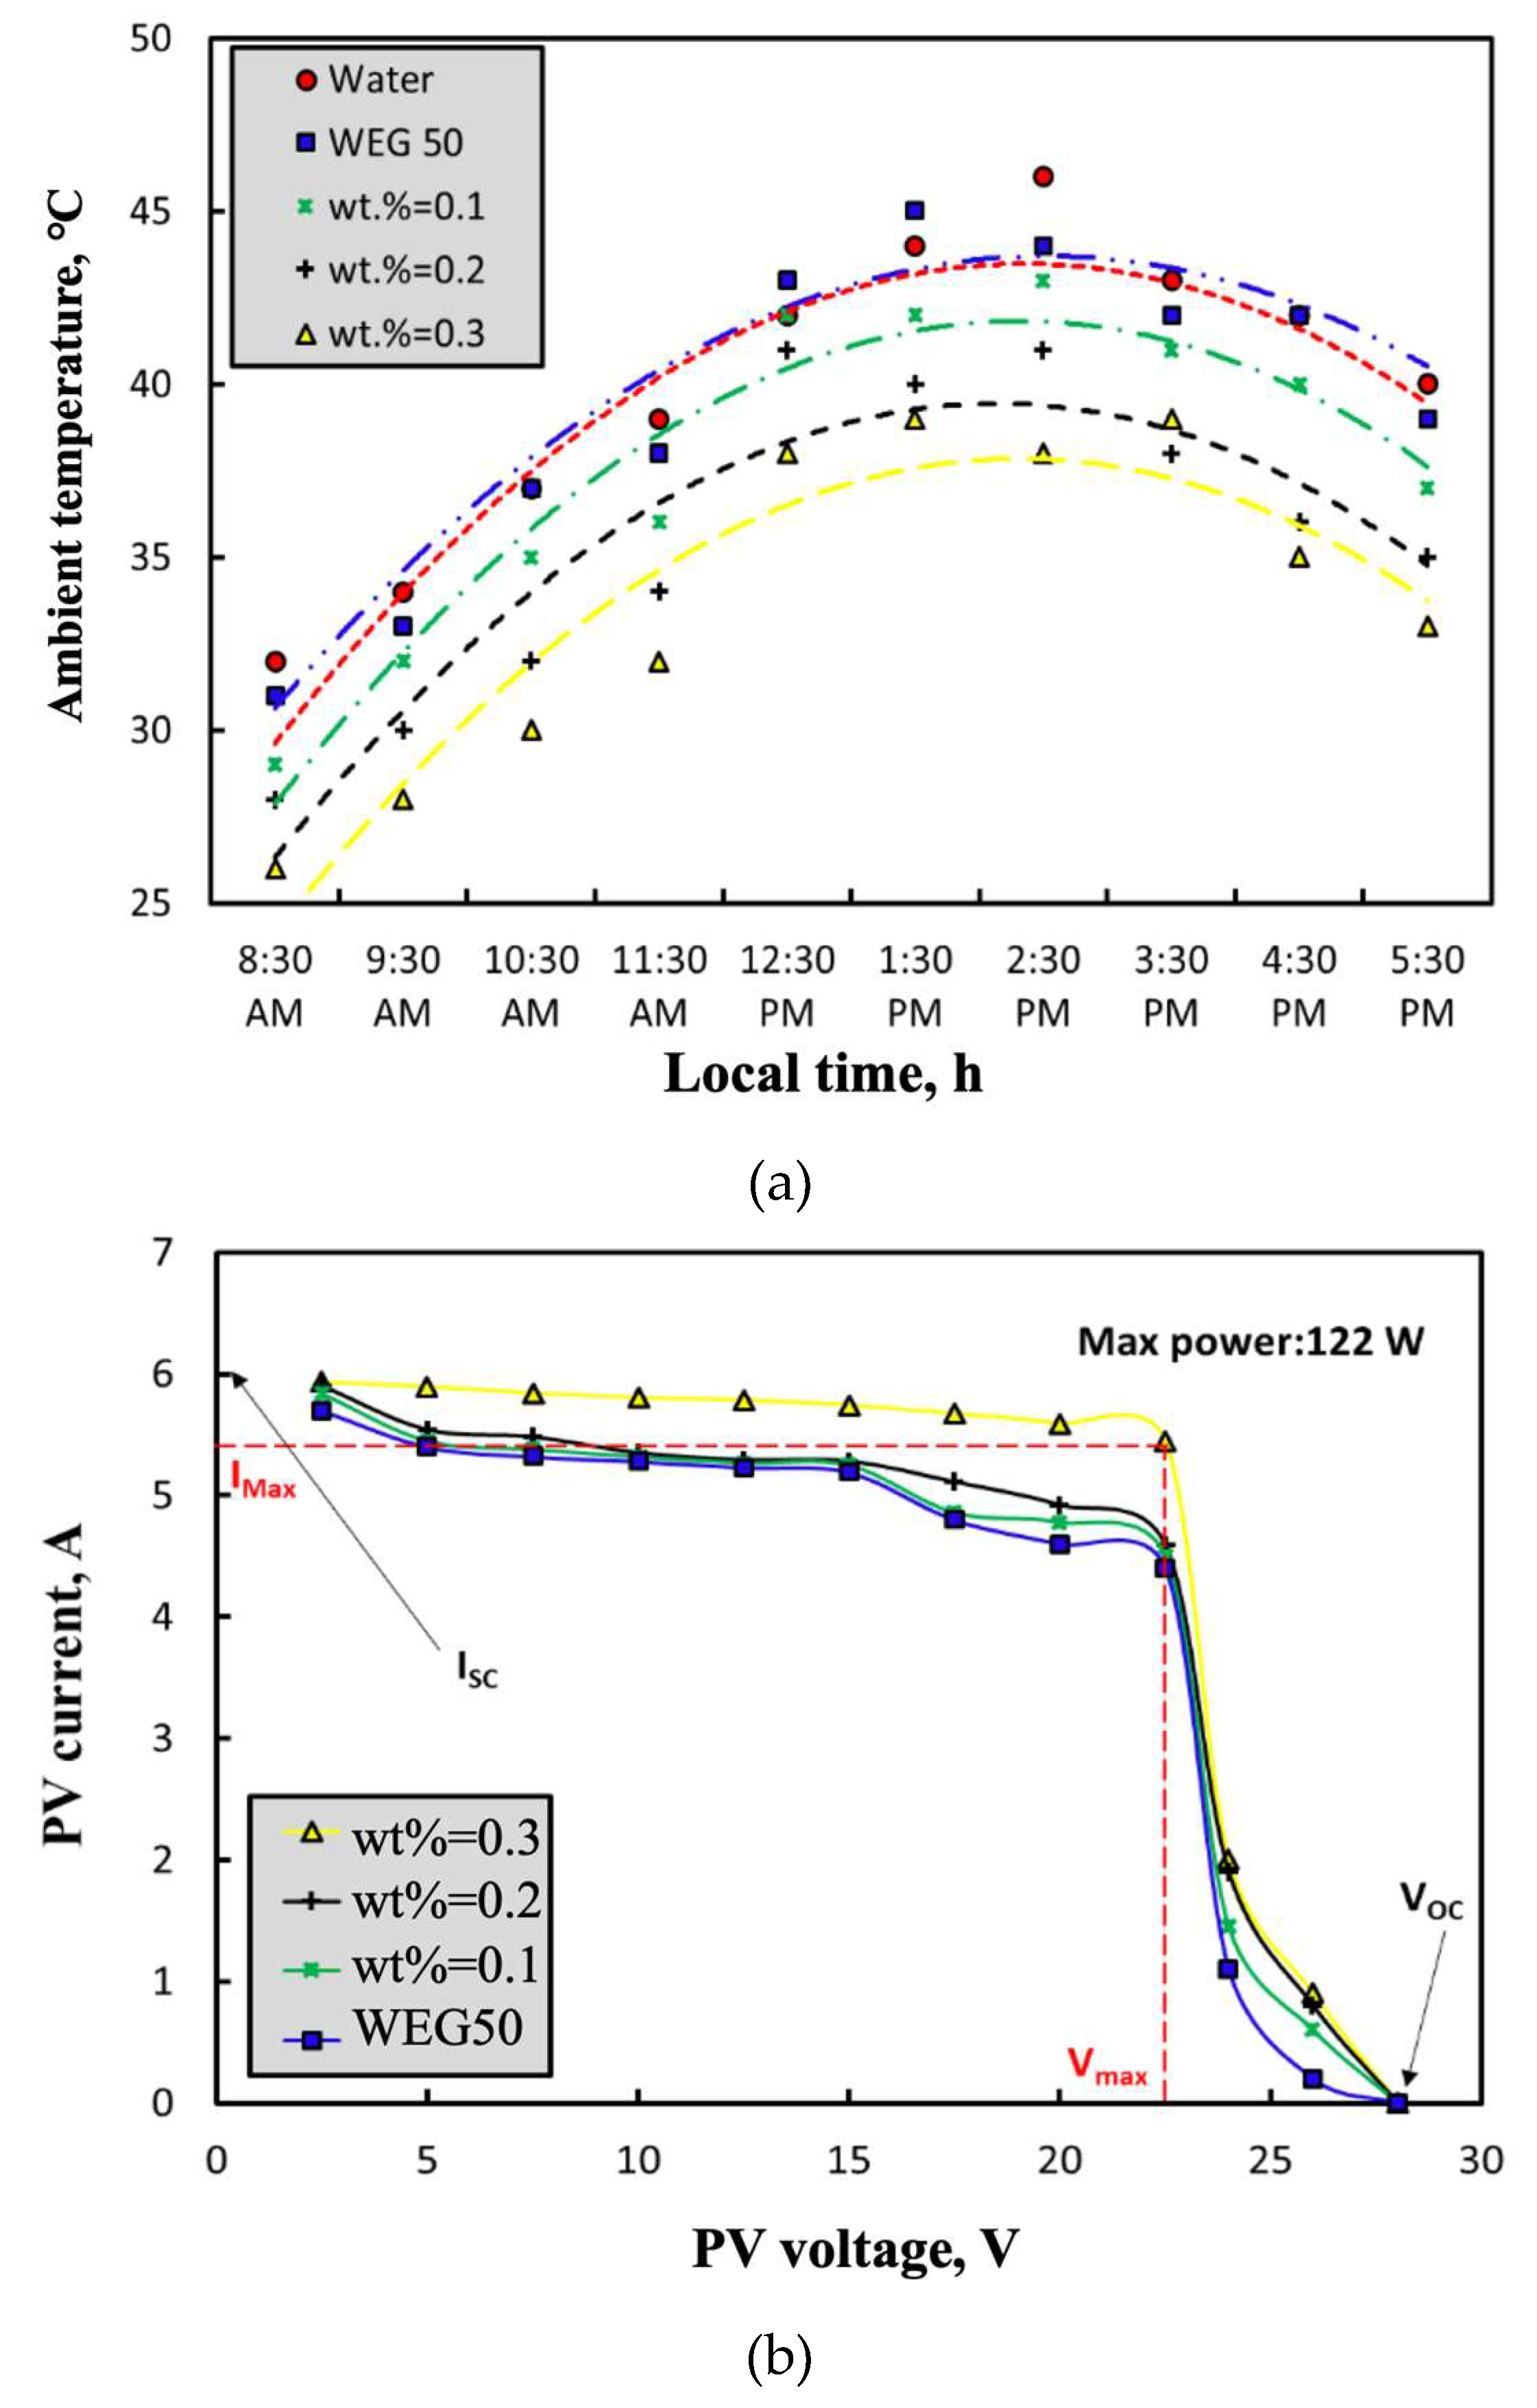
3.1. Solar Irradiance and Ambient Temperature
3.2. Surface Temperature of the PV Panel
3.3. Flow Rate of Cooling Loop
3.4. Electricity Production
3.5. Thermal Power Production
3.6. Electrical–Thermal Equivalent Power
5. Conclusions
Author Contributions
Funding
Acknowledgments
Conflicts of Interest
References
- Kampa, M.; Castanas, E. Human health effects of air pollution. Environ. Pollut. 2008, 151, 362–367. [Google Scholar] [CrossRef] [PubMed]
- Solangi, K.; Islam, M.; Saidur, R.; Rahim, N.; Fayaz, H. A review on global solar energy policy. Renew. Sustain. Energy Rev. 2011, 15, 2149–2163. [Google Scholar] [CrossRef]
- Kalogirou, S. The potential of solar industrial process heat applications. Appl. Energy 2003, 76, 337–361. [Google Scholar] [CrossRef]
- Valencia, G.; Benavides, A.; Cárdenas, Y. Economic and environmental multiobjective optimization of a wind–solar–fuel cell hybrid energy system in the colombian caribbean region. Energies 2019, 12, 2119. [Google Scholar] [CrossRef]
- Szokolay, S.V. Solar Energy and Building; Halsted Press Division, Wiley: New York, NY, USA, 1975. [Google Scholar]
- Liu, X.; Wang, Y. Reconfiguration method to extract more power from partially shaded photovoltaic arrays with series-parallel topology. Energies 2019, 12, 1439. [Google Scholar] [CrossRef]
- Kharseh, M.; Wallbaum, H. How adding a battery to a grid-connected photovoltaic system can increase its economic performance: A comparison of different scenarios. Energies 2019, 12, 30. [Google Scholar] [CrossRef]
- Chandel, S.; Naik, M.N.; Chandel, R. Review of solar photovoltaic water pumping system technology for irrigation and community drinking water supplies. Renew. Sustain. Energy Rev. 2015, 49, 1084–1099. [Google Scholar] [CrossRef]
- Chow, T.; Hand, J.; Strachan, P. Building-integrated photovoltaic and thermal applications in a subtropical hotel building. Appl. Therm. Eng. 2003, 23, 2035–2049. [Google Scholar] [CrossRef]
- Prakash, J. Transient analysis of a photovoltaic-thermal solar collector for co-generation of electricity and hot air/water. Energy Convers. Manag. 1994, 35, 967–972. [Google Scholar] [CrossRef]
- Alshayeb, M.; Chang, J. Variations of pv panel performance installed over a vegetated roof and a conventional black roof. Energies 2018, 11, 1110. [Google Scholar] [CrossRef]
- Mani, M.; Pillai, R. Impact of dust on solar photovoltaic (pv) performance: Research status, challenges and recommendations. Renew. Sustain. Energy Rev. 2010, 14, 3124–3131. [Google Scholar] [CrossRef]
- Al Dakheel, J.; Tabet Aoul, K. Building applications, opportunities and challenges of active shading systems: A state-of-the-art review. Energies 2017, 10, 1672. [Google Scholar] [CrossRef]
- Erdil, E.; Ilkan, M.; Egelioglu, F. An experimental study on energy generation with a photovoltaic (pv)–solar thermal hybrid system. Energy 2008, 33, 1241–1245. [Google Scholar] [CrossRef]
- Odeh, S. Thermal performance of dwellings with rooftop pv panels and pv/thermal collectors. Energies 2018, 11, 1879. [Google Scholar] [CrossRef]
- Abdollahi-Moghaddam, M.; Rejvani, M.; Alamdari, P. Determining optimal formulations and operating conditions for al2o3/water nanofluid flowing through a microchannel heat sink for cooling system purposes using statistical and optimization tools. Therm. Sci. Eng. Prog. 2018, 8, 517–524. [Google Scholar] [CrossRef]
- Safaei, M.; Ahmadi, G.; Goodarzi, M.; Safdari Shadloo, M.; Goshayeshi, H.; Dahari, M. Heat transfer and pressure drop in fully developed turbulent flows of graphene nanoplatelets–silver/water nanofluids. Fluids 2016, 1, 20. [Google Scholar] [CrossRef]
- Moghaddam, M.A.; Motahari, K. Experimental investigation, sensitivity analysis and modeling of rheological behavior of mwcnt-cuo (30–70)/sae40 hybrid nano-lubricant. Appl. Therm. Eng. 2017, 123, 1419–1433. [Google Scholar] [CrossRef]
- Farshad, S.A.; Sheikholeslami, M. Nanofluid flow inside a solar collector utilizing twisted tape considering exergy and entropy analysis. Renew. Energy 2019, 141, 246–258. [Google Scholar] [CrossRef]
- Yazdanifard, F.; Ameri, M.; Ebrahimnia-Bajestan, E. Performance of nanofluid-based photovoltaic/thermal systems: A review. Renew. Sustain. Energy Rev. 2017, 76, 323–352. [Google Scholar] [CrossRef]
- Sahota, L.; Tiwari, G. Analytical characteristic equation of nanofluid loaded active double slope solar still coupled with helically coiled heat exchanger. Energy Convers. Manag. 2017, 135, 308–326. [Google Scholar] [CrossRef]
- Al-Waeli, A.H.; Sopian, K.; Kazem, H.A.; Chaichan, M.T. Photovoltaic solar thermal (pv/t) collectors past, present and future: A. Int. J. Appl. Eng. Res. 2016, 11, 10757–10765. [Google Scholar]
- Hasan, A.; Alnoman, H.; Shah, A. Energy efficiency enhancement of photovoltaics by phase change materials through thermal energy recovery. Energies 2016, 9, 782. [Google Scholar] [CrossRef]
- Safaei, M.R.; Goshayeshi, H.R.; Chaer, I. Solar still efficiency enhancement by using graphene oxide/paraffin nano-pcm. Energies 2019, 12, 2002. [Google Scholar] [CrossRef]
- Kazanci, O.B.; Skrupskelis, M.; Sevela, P.; Pavlov, G.K.; Olesen, B.W. Sustainable heating, cooling and ventilation of a plus-energy house via photovoltaic/thermal panels. Energy Build. 2014, 83, 122–129. [Google Scholar] [CrossRef]
- Al-Waeli, A.H.; Sopian, K.; Chaichan, M.T.; Kazem, H.A.; Ibrahim, A.; Mat, S.; Ruslan, M.H. Evaluation of the nanofluid and nano-pcm based photovoltaic thermal (pvt) system: An experimental study. Energy Convers. Manag. 2017, 151, 693–708. [Google Scholar] [CrossRef]
- Sardarabadi, M.; Passandideh-Fard, M.; Maghrebi, M.-J.; Ghazikhani, M. Experimental study of using both zno/water nanofluid and phase change material (pcm) in photovoltaic thermal systems. Sol. Energy Mater. Sol. Cells 2017, 161, 62–69. [Google Scholar] [CrossRef]
- Al-Waeli, A.H.; Kazem, H.A.; Chaichan, M.T.; Sopian, K. Experimental investigation of using nano-pcm/nanofluid on a photovoltaic thermal system (pvt): Technical and economic study. Therm. Sci. Eng. Prog. 2019, 11, 213–230. [Google Scholar] [CrossRef]
- Hosseinzadeh, M.; Sardarabadi, M.; Passandideh-Fard, M. Energy and exergy analysis of nanofluid based photovoltaic thermal system integrated with phase change material. Energy 2018, 147, 636–647. [Google Scholar] [CrossRef]
- Al-Waeli, A.H.; Chaichan, M.T.; Sopian, K.; Kazem, H.A.; Mahood, H.B.; Khadom, A.A. Modeling and experimental validation of a pvt system using nanofluid coolant and nano-pcm. Sol. Energy 2019, 177, 178–191. [Google Scholar] [CrossRef]
- Hasan, H.A.; Sopian, K.; Jaaz, A.H.; Al-Shamani, A.N. Experimental investigation of jet array nanofluids impingement in photovoltaic/thermal collector. Sol. Energy 2017, 144, 321–334. [Google Scholar] [CrossRef]
- Al-Shamani, A.N.; Sopian, K.; Mat, S.; Hasan, H.A.; Abed, A.M.; Ruslan, M.H. Experimental studies of rectangular tube absorber photovoltaic thermal collector with various types of nanofluids under the tropical climate conditions. Energy Convers. Manag. 2016, 124, 528–542. [Google Scholar] [CrossRef]
- Hussain, M.I.; Kim, J.-H.; Kim, J.-T. Nanofluid-powered dual-fluid photovoltaic/thermal (pv/t) system: Comparative numerical study. Energies 2019, 12, 775. [Google Scholar] [CrossRef]
- Al-Waeli, A.H.; Chaichan, M.T.; Kazem, H.A.; Sopian, K. Comparative study to use nano-(al2o3, cuo, and sic) with water to enhance photovoltaic thermal pv/t collectors. Energy Convers. Manag. 2017, 148, 963–973. [Google Scholar] [CrossRef]
- Al-Waeli, A.H.; Chaichan, M.T.; Kazem, H.A.; Sopian, K.; Safaei, J. Numerical study on the effect of operating nanofluids of photovoltaic thermal system (pv/t) on the convective heat transfer. Case Stud. Therm. Eng. 2018, 12, 405–413. [Google Scholar] [CrossRef]
- Aberoumand, S.; Ghamari, S.; Shabani, B. Energy and exergy analysis of a photovoltaic thermal (pv/t) system using nanofluids: An experimental study. Sol. Energy 2018, 165, 167–177. [Google Scholar] [CrossRef]
- Lari, M.O.; Sahin, A.Z. Effect of retrofitting a silver/water nanofluid-based photovoltaic/thermal (pv/t) system with a pcm-thermal battery for residential applications. Renew. Energy 2018, 122, 98–107. [Google Scholar] [CrossRef]
- Al-Waeli, A.H.; Sopian, K.; Kazem, H.A.; Yousif, J.H.; Chaichan, M.T.; Ibrahim, A.; Mat, S.; Ruslan, M.H. Comparison of prediction methods of pv/t nanofluid and nano-pcm system using a measured dataset and artificial neural network. Sol. Energy 2018, 162, 378–396. [Google Scholar] [CrossRef]
- Abdallah, S.R.; Saidani-Scott, H.; Abdellatif, O.E. Performance analysis for hybrid pv/t system using low concentration mwcnt (water-based) nanofluid. Sol. Energy 2019, 181, 108–115. [Google Scholar] [CrossRef]
- Al-Waeli, A.H.A.; Sopian, K.; Yousif, J.H.; Kazem, H.A.; Boland, J.; Chaichan, M.T. Artificial neural network modeling and analysis of photovoltaic/thermal system based on the experimental study. Energy Convers. Manag. 2019, 186, 368–379. [Google Scholar] [CrossRef]
- Salem, M.R.; Elsayed, M.M.; Abd-Elaziz, A.A.; Elshazly, K.M. Performance enhancement of the photovoltaic cells using al2o3/pcm mixture and/or water cooling-techniques. Renew. Energy 2019, 138, 876–890. [Google Scholar] [CrossRef]
- Fayaz, H.; Rahim, N.A.; Hasanuzzaman, M.; Nasrin, R.; Rivai, A. Numerical and experimental investigation of the effect of operating conditions on performance of pvt and pvt-pcm. Renew. Energy 2019, 143, 827–841. [Google Scholar] [CrossRef]
- Fayaz, H.; Rahim, N.A.; Hasanuzzaman, M.; Rivai, A.; Nasrin, R. Numerical and outdoor real time experimental investigation of performance of pcm based pvt system. Sol. Energy 2019, 179, 135–150. [Google Scholar] [CrossRef]
- Kline, S.J. Describing uncertainty in single sample experiments. Mech. Eng. 1953, 75, 3–8. [Google Scholar]
- Arya, A.; Sarafraz, M.; Shahmiri, S.; Madani, S.; Nikkhah, V.; Nakhjavani, S. Thermal performance analysis of a flat heat pipe working with carbon nanotube-water nanofluid for cooling of a high heat flux heater. Heat Mass Transf. 2018, 54, 985–997. [Google Scholar] [CrossRef]
- Salari, E.; Peyghambarzadeh, M.; Sarafraz, M.M.; Hormozi, F. Boiling heat transfer of alumina nano-fluids: Role of nanoparticle deposition on the boiling heat transfer coefficient. Period. Polytech. Chem. Eng. 2016, 60, 252–258. [Google Scholar] [CrossRef]
- Salari, E.; Peyghambarzadeh, S.; Sarafraz, M.; Hormozi, F.; Nikkhah, V. Thermal behavior of aqueous iron oxide nano-fluid as a coolant on a flat disc heater under the pool boiling condition. Heat Mass Transf. 2017, 53, 265–275. [Google Scholar] [CrossRef]
- Sarafraz, M.; Arjomandi, M. Demonstration of plausible application of gallium nano-suspension in microchannel solar thermal receiver: Experimental assessment of thermo-hydraulic performance of microchannel. Int. Commun. Heat Mass Transf. 2018, 94, 39–46. [Google Scholar] [CrossRef]
- Sarafraz, M.; Arya, A.; Nikkhah, V.; Hormozi, F. Thermal performance and viscosity of biologically produced silver/coconut oil nanofluids. Chem. Biochem. Eng. Q. 2017, 30, 489–500. [Google Scholar] [CrossRef]
- Sarafraz, M.; Arjomandi, M. Thermal performance analysis of a microchannel heat sink cooling with copper oxide-indium (cuo/in) nano-suspensions at high-temperatures. Appl. Therm. Eng. 2018, 137, 700–709. [Google Scholar] [CrossRef]
- Sarafraz, M. Experimental investigation on pool boiling heat transfer to formic acid, propanol and 2-butanol pure liquids under the atmospheric pressure. J. Appl. Fluid Mech. 2013, 6, 73–79. [Google Scholar]
- Sarafraz, S.; Peyghambarzadeh, M.; Vaeli, N. Subcooled flow boiling heat transfer of ethanol aqueous solutions in vertical annulus space. Chem. Ind. Chem. Eng. Q. CICEQ 2012, 18, 315–327. [Google Scholar] [CrossRef]


| Author (s) | Type of Study | Nanofluid and/or PCM Materials | Concentration of Nanofluid | Achievements |
|---|---|---|---|---|
| Hosseinzadeh et al. [29] | Numerical | ZnO/water Paraffin wax | 0.2wt% | Improvement of thermal energy: 79.36% Electrical efficiency: 13.36% |
| Al-Waeli et al. [30] | Experimental and mathematical | SiC/water | 3wt% | Electrical efficiency (experimental): 13.7% Thermal efficiency (experimental): 72% Electrical efficiency (mathematical): 13.2% Thermal efficiency (mathematical): 71.3% |
| Nano-PCM | 0.1%, 0.5%, 1%, 2%, and 3% | |||
| Hassan et al. [31] | Experimental | SiO2, SiC, TiO2 in water | 1wt% | SiC had the highest efficiency; Electrical efficiency: 12.75% Thermal efficiency: 85% Overall efficiency: 97.75% |
| Al-Shamani et al. [32] | Experimental | SiO2, SiC, TiO2 in water | 0wt%–2wt% | SiC had highest efficiency; Electrical efficiency: 13.52% Thermal efficiency: 81.73% |
| Imtiaz Hussain et al. [33] | Numerical | CuO, Al2O3, SiO2 in water | 0vol%–0.75vol% | SiC had the highest efficiency; Total equivalent efficiency: 90.3% |
| Al-Waeli et al. [34] | Experimental | CuO, Al2O3, SiC in water | 0.5vol%, 1vol%, 2vol%, 3vol%, and 4vol% | SiC had the highest efficiency; Total equivalent efficiency: 16.8% Thermal efficiency: 50% |
| Al-Waeli et al. [35] | Numerical | CuO, Al2O3, SiC in water, glycerin, and ethylene glycol | 4wt% | SiC had the highest convective heat transfer and glycerin had maximum pressure drop. SiC nanoparticles had 1.21% and 2.15% higher Nusselt number compared to CuO and Al2O3 nanoparticles, respectively. |
| Aberoumand et al. [36] | Experimental | Ag/water | 2wt% and 4wt% | Power output enhancement: 35% Exergy efficiency: 50% |
| Lari et al. [37] | Numerical | Ag/water Paraffin wax | 0.5vol% Added surfactant: 1wt% | Electrical efficiency: 11.7% Thermal efficiency: 11.7% |
| Al-Waeli et al. [38] | Experimental and ANN modeling | SiC/water SiC nano-paraffin wax | Nanofluid: 0–4 wt% | Electrical efficiency enhanced from 8.07% to 13.32 than to the simple PV. |
| Abdallah et al. [39] | Experimental | MWCNT/water | 0–0.3 vol% | Overall efficiency: 83.26% |
| Al-Waeli et al. [40] | ANN modeling | SiC/water SiC nano-paraffin wax | 0–4% both nanofluid and nano-PCM | Thermal efficiency: 72% |
| Salem et al. [41] | Experimental | water and/or Al2O3/PCM mixture | 0–1 wt% | Highest efficiency was achieved for pure PCM/water |
| Fayaz et al. [42] | Experimental and numerical | Paraffin wax | PVT electrical efficiency (experimental): 12.28% PVT electrical efficiency (Numerical): 12.4% PVT-PCM electrical efficiency (experimental): 12.59% PVT-PCM electrical efficiency (numerical): 12.75% PVT electrical performance (experimental): 9.2% PVT electrical performance (Numerical): 10.13% PVT-PCM electrical efficiency (experimental): 12.75% PVT-PCM electrical efficiency (numerical): 12.91% | |
| Fayaz et al. [43] | Experimental and numerical | Paraffin wax | Electrical efficiency of PV/T-PCM (experimental): 13.87% Electrical efficiency of PV/T-PCM (numerical): 13.98% Electrical performance of PV/T-PCM (experimental): 7.6% and electrical efficiency of PV/T-PCM (numerical): 7.2% |
| Parameter | Instrument | Manufacturer | Accuracy/Uncertainty |
|---|---|---|---|
| Solar irradiance | Omni | ±1% of reading value | |
| Temperature of PV panel | k-type thermocouple | Omega | 0.5 °C |
| Temperature of HTF | RTD | Omega | 0.5 °C |
| Fluid flow | Ultrasonic flow meter | Flownetix | ±1% of reading value |
| Voltage and current | Digital multi-meter | Omega | ±1% of reading value |
| Parameters | |||
| Electrical power | - | - | ±1.5% |
| Thermal power | - | - | ±2.1% including heat loss |
| Equivalent thermal–electrical power | - | - | ±1.5% |
© 2019 by the authors. Licensee MDPI, Basel, Switzerland. This article is an open access article distributed under the terms and conditions of the Creative Commons Attribution (CC BY) license (http://creativecommons.org/licenses/by/4.0/).
Share and Cite
Sarafraz, M.M.; Safaei, M.R.; Leon, A.S.; Tlili, I.; Alkanhal, T.A.; Tian, Z.; Goodarzi, M.; Arjomandi, M. Experimental Investigation on Thermal Performance of a PV/T-PCM (Photovoltaic/Thermal) System Cooling with a PCM and Nanofluid. Energies 2019, 12, 2572. https://0-doi-org.brum.beds.ac.uk/10.3390/en12132572
Sarafraz MM, Safaei MR, Leon AS, Tlili I, Alkanhal TA, Tian Z, Goodarzi M, Arjomandi M. Experimental Investigation on Thermal Performance of a PV/T-PCM (Photovoltaic/Thermal) System Cooling with a PCM and Nanofluid. Energies. 2019; 12(13):2572. https://0-doi-org.brum.beds.ac.uk/10.3390/en12132572
Chicago/Turabian StyleSarafraz, M. M., Mohammad Reza Safaei, Arturo S. Leon, Iskander Tlili, Tawfeeq Abdullah Alkanhal, Zhe Tian, Marjan Goodarzi, and M. Arjomandi. 2019. "Experimental Investigation on Thermal Performance of a PV/T-PCM (Photovoltaic/Thermal) System Cooling with a PCM and Nanofluid" Energies 12, no. 13: 2572. https://0-doi-org.brum.beds.ac.uk/10.3390/en12132572