Article

Thermodynamic Analysis of the Air-Cooled Transcritical Rankine Cycle Using CO2/R161 Mixture Based on Natural Draft Dry Cooling Towers

1
College of Computer Science, Sichuan University, Chengdu 610065, China
2
Key Laboratory of Low-grade Energy Utilization Technologies & Systems, Ministry of Education, College of Energy and Power Engineering, Chongqing University, Chongqing 400044, China
3
College of Aerospace Engineering, Chongqing University, Chongqing 400044, China,
4
CNNC Key Laboratory on Nuclear Reactor Thermal Hydraulics Technology, NPIC, Chengdu 610213, China
*
Author to whom correspondence should be addressed.
Submission received: 6 July 2019 / Revised: 19 August 2019 / Accepted: 29 August 2019 / Published: 29 August 2019
(This article belongs to the Special Issue Improvements on CO2 Vapour Compression Cycles)

Abstract

:
Heat rejection in the hot-arid area is of concern to power cycles, especially for the transcritical Rankine cycle using CO2 as the working fluid in harvesting the low-grade energy. Usually, water is employed as the cooling substance in Rankine cycles. In this paper, the transcritical Rankine cycle with CO2/R161 mixture and dry air cooling systems had been proposed to be used in arid areas with water shortage. A design and rating model for mixture-air cooling process were developed based on small-scale natural draft dry cooling towers. The influence of key parameters on the system’s thermodynamic performance was tested. The results suggested that the thermal efficiency of the proposed system was decreased with the increases in the turbine inlet pressure and the ambient temperature, with the given thermal power as the heat source. Additionally, the cooling performance of natural draft dry cooling tower was found to be affected by the ambient temperature and the turbine exhaust temperature.

1. Introduction

The energy crisis and environmental pollution have become barriers for the sustainable development of the human society, which can be ascribed to the massive consumption of fossil fuels since the industrial revolution [1]. Scientists and technicians worldwide have employed a variety of methods to deal with these issues. Typically, harvesting the low-grade energies, such as solar energy, geothermal energy, and industrial waste heat, has been recognized as one of the effective approaches to alleviate the energy and environmental issues [2,3,4].
Generally, thermodynamic cycles, including the organic Rankine cycle (ORC) [5,6], Kalina cycle [7,8], and transcritical Rankine cycle (TRC) [9], which have used the low-boiling-point working fluid, are adopted to recover the low-grade energy. Of them, the TRC, which adopts the natural non-flammable and non-toxic CO2 as the working fluid (hereinafter referred as “tCO2”) [10,11,12], has more compact equipment than the Kalina cycle, and it can lead to a higher output power than ORC, thus displaying great application prospects in the field of low-grade energy utilization. However, the normal operation pressure of the tCO2 system is about 10 MPa due to the high critical pressure of CO2 (about 7.38 MPa), which will give rise to safety concerns. Another challenge is CO2 condensation in the tCO2 system as a result of the low critical temperature of CO2 (about 304 K) [13]. It is difficult to use tCO2 in areas with high surrounding temperature, especially, in arid areas with water shortage.
Consequently, CO2 mixed with other fluids has been proposed as the working fluid to expand the application of tCO2 [14]. Notably, the CO2-based mixtures can integrate the advantages of each individual pure fluid and exhibit environmental properties as well as efficiency, which have thereby attracted increasing attention in recent years [15,16]. Furthermore, applying CO2 mixtures in TRC can also lead to superior temperature matching with heat source over that of the CO2 Brayton cycle. At present, the reported working fluids of CO2 mixtures are mainly CO2 blends with hydrocarbons, hydrofluorocarbons, and hydrofluoroolefins [17]. For instance, Dai et al. [18] investigated the thermodynamic performance of TRC using the zeotropic mixtures of CO2 mixed with seven working fluids possessing low global warming potentials (GWP). Their results denoted that the thermal efficiency of the TRC was enhanced by the zeotropic mixtures; besides, the operation pressure of the investigated TRC was decreased. Moreover, Yang [19] examined the improvements of the economic performance of TRC with CO2 mixtures, and discovered that, the TRC with CO2/fluoroethane (R161) mixtures displayed better economic performance than those in other TRCs with CO2/difluoromethane, CO2/tetrafluoropropene, CO2/tetrafluoroethane, CO2/propane, and pure CO2. Moreover, Shu et al. [20] explored the improvements in the thermodynamic and economic performance of TRC using a CO2-based mixture to recover the engine waste heat. Their findings suggested that TRCs with CO2/R152a, CO2/R161, and CO2/R32 mixtures could achieve the optimal performances, along with a low operation pressure and the optimal total heat transfer area. Thus, TRC with CO2/R161 mixture is promising to be used to recover the low-grade energy.
The CO2/R161 mixture is associated with the superiorities of fine thermostability, as well as optimal thermodynamic and economic performances in TRC, which can thereby be utilized for low-grade energy recovery at a high ambient temperature. Nonetheless, few existing studies [13,14,15,16,17,18,19,20] have examined the cooling process of TRC with CO2/R161 mixture. Usually, water cooling is employed for analysis, but the water resource issue [21] has drawn growing attention, since water is a kind of valuable natural resource. On this account, the direct air cooling technique will be an ideal approach for thermodynamic cycles in arid areas with water shortage.
Consequently, the TRC using CO2/R161 mixture with the direct air cooling system had been proposed and investigated in this paper. Firstly, the thermodynamic model of the TRC system was constructed and verified. Subsequently, the natural draft dry cooling tower (NDDCT) model was established based on the experimental data from Li et al. [22]. Afterward, the performance of the NDDCT was analyzed under different ambient temperatures and thermal loads of turbine exhaust. Moreover, this work was expected to shed valuable light on the mixture working fluids [23,24,25] and ORC using the direct air cooling system [26].

2. Model and Considerations

The schematic diagram of the power plant is presented in Figure 1. As can be observed, the power plant consisted of four basic components, including the heater, the turbine, the cooling tower, and the pump. Moreover, there were four processes regarding the thermodynamic cycle of the working fluid in the system, among which, in process 1–2, the condensed fluid was pumped into the high pressure state; in process 2–3, the working fluid experienced phase transition and changed into the high temperature and high pressure supercritical state in the heater; in process 3–4, the supercritical fluid was expanded to produce power in the turbine; and in process 4–1, the working fluid was cooled in the cooling tower. Here, the NDDCT was selected as the condenser, which could cool the working fluid with no water loss and almost no parasitic power consumption [27].
Additionally, the temperature–entropy (T–s) diagram of the corresponding power plant system using CO2/R161 (50/50 wt.%) is plotted in Figure 2. Noteworthily, the working fluid had experienced the single- and two-phase condensation processes in the NDDCT, during which temperature glide had occurred.
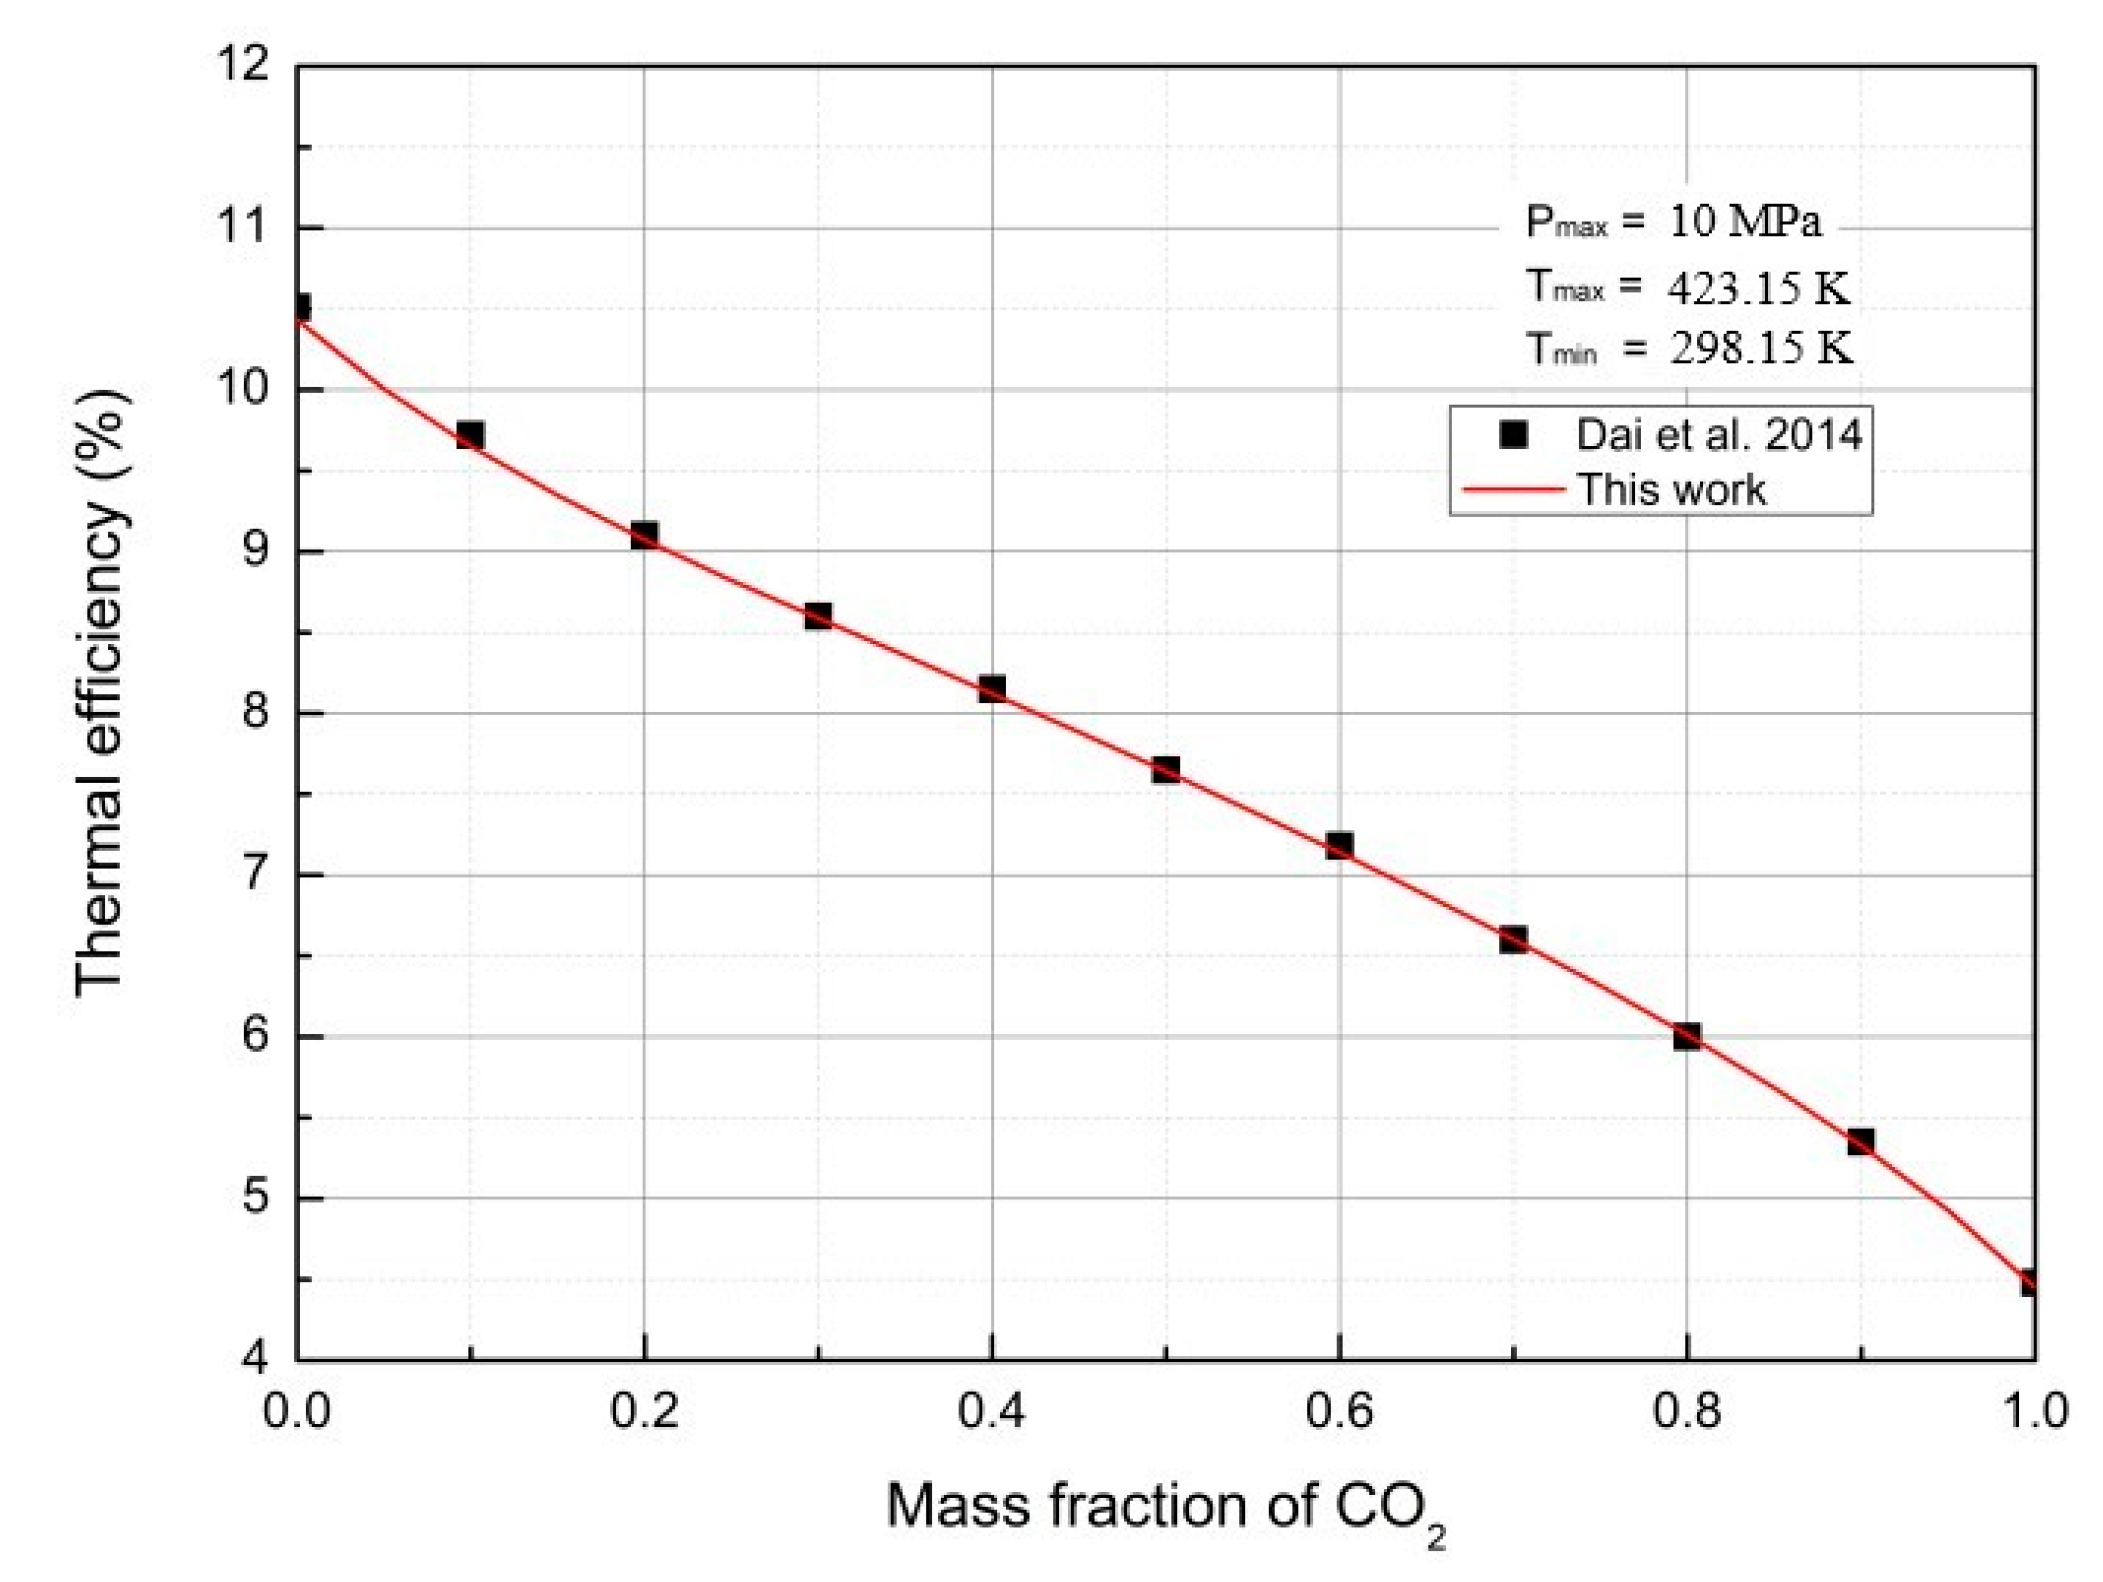
Figure 3 presents the critical pressure and critical temperature for the CO2/R161 mixtures with various mass fractions [28]. Clearly, the critical temperature of the mixtures was increased with the increase in the mass fraction of R161. Meanwhile, the critical pressure of the mixtures was decreased, which rendered a lower TRC operation pressure than that of tCO2, and laid the foundation for the practical application of TRC using CO2 mixtures.

2.1. Calculation Assumptions

The assumptions of the power plant system are exhibited in Table 1. Typically, the heat source of the system could be solar energy, geothermal energy, or waste heat. Therefore, the thermal power of 500.00 kW was given as the heat source for the universality of the system, while the range of the turbine inlet temperature was 423.15–473.15 K. In addition, the mass flow of the working fluid was calculated according to the heat balance equation. The annual average air temperature was 298.15 K, and, in this paper, the air temperature fluctuated within the range of 293.15–303.15 K. Furthermore, there was no pressure loss in the pipeline and heat exchanger, and the whole power plant system operated at the steady state.

2.2. Mathematical Model

The equations for the system components were based on the first law of thermodynamics. The National Institute of Standards and Technology (NIST) REFPROP program [29] was used for physical properties of CO2/R161 mixture.
As for the turbine:
W t = m a s s · ( h 3 h 4 ) .
For the pump:
W p = m a s s · ( h 2 h 1 ) .
For the heater:
Q i n = m a s s · ( h 3 h 2 ) .
For cooling tower:
Q c o o l = m a s s · ( h 4 h 1 ) .
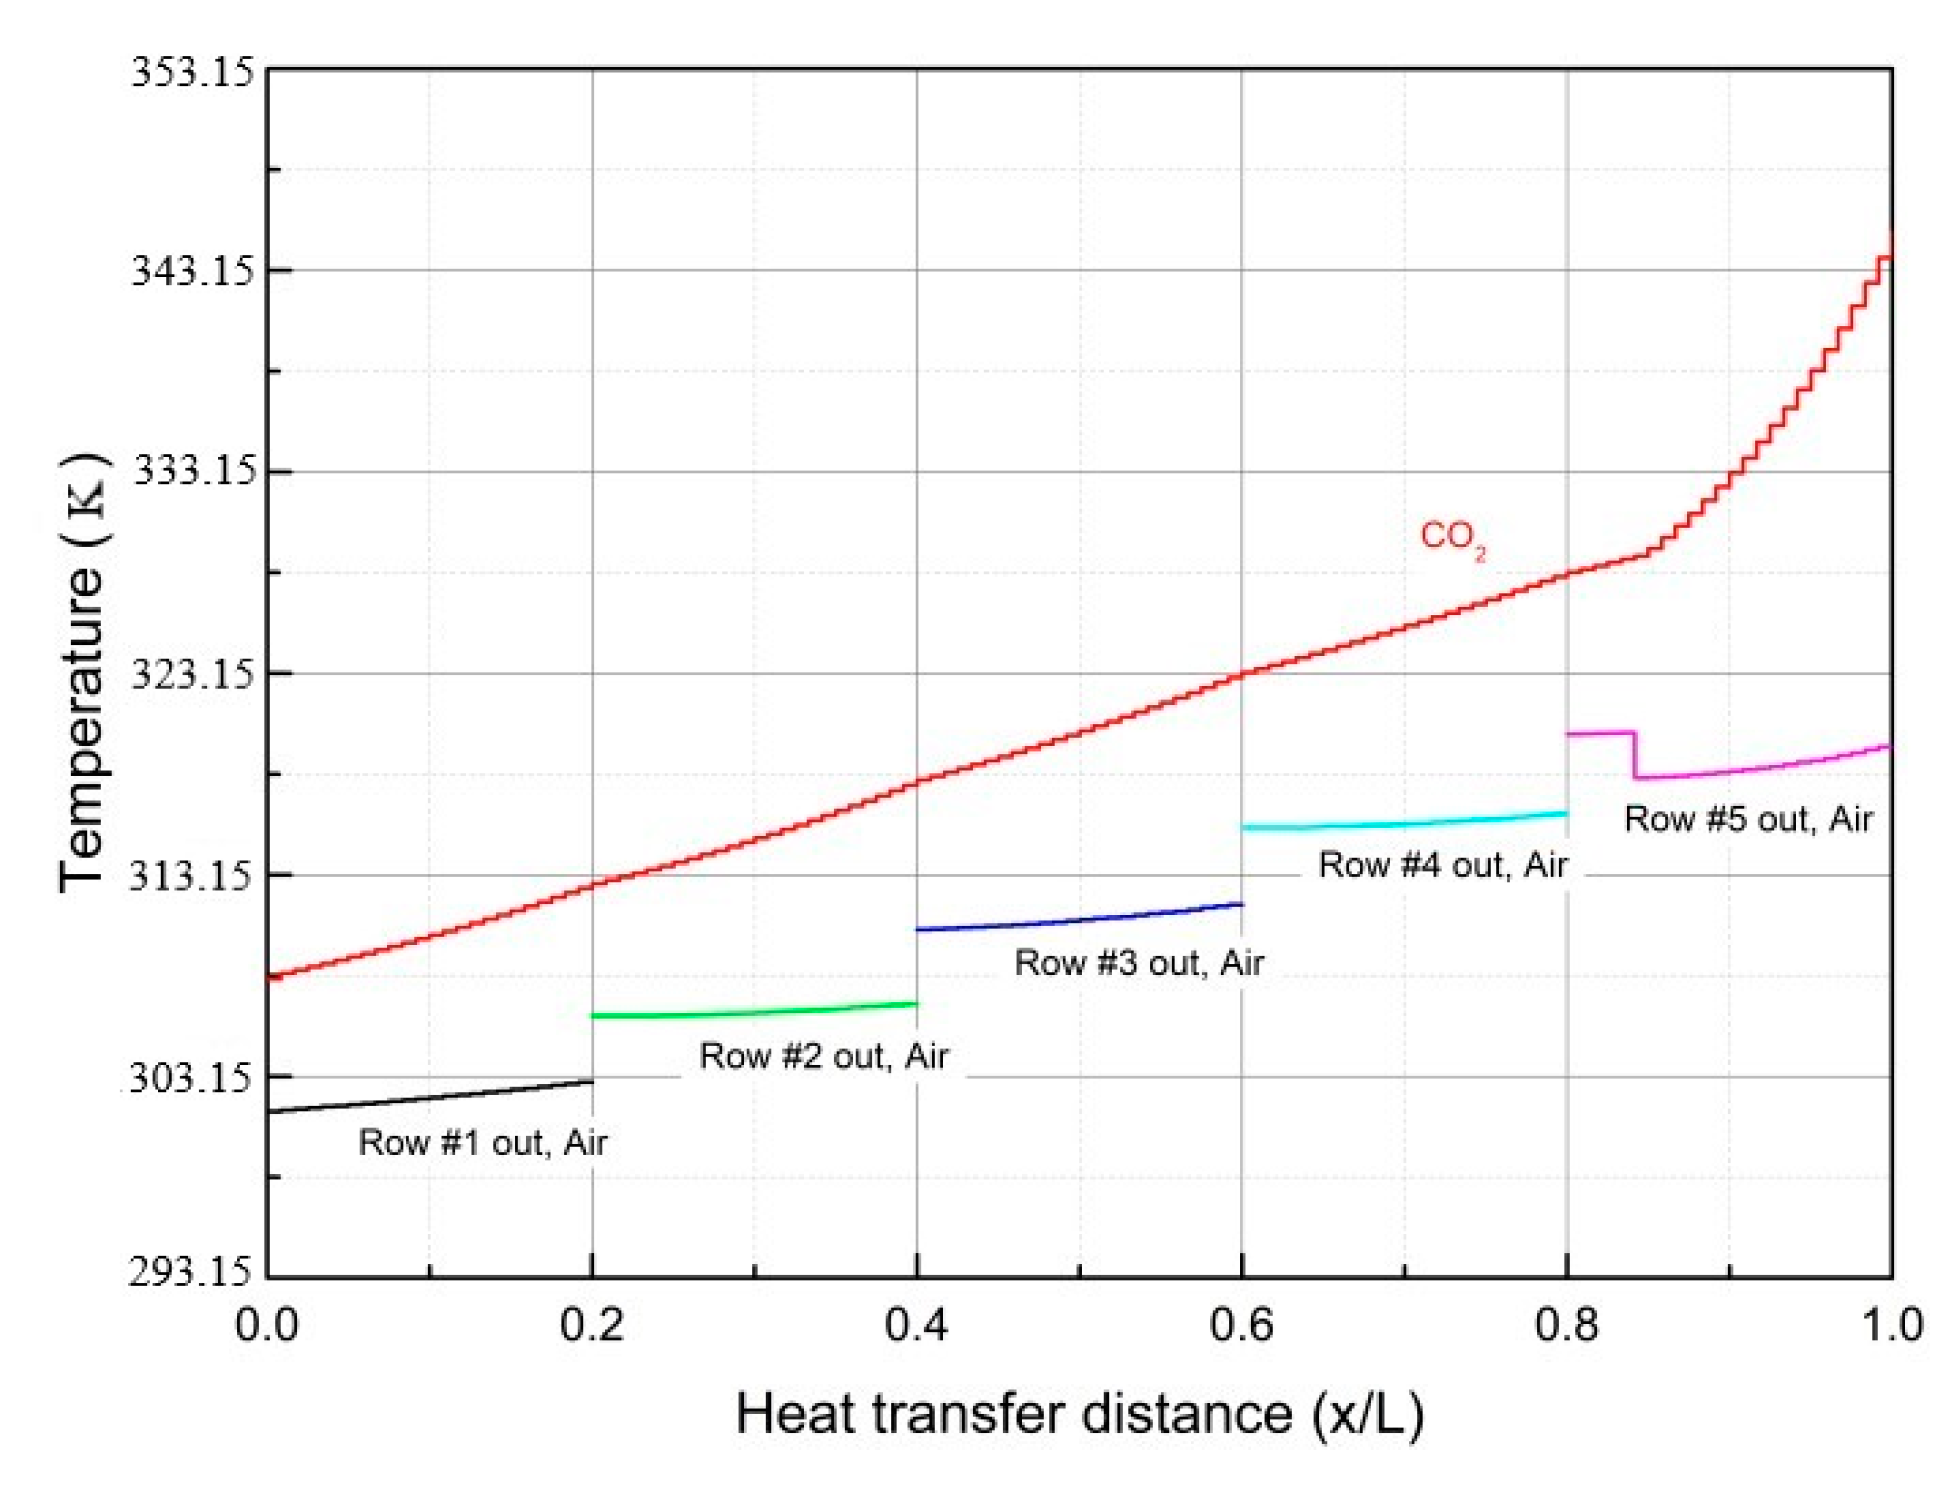
The heat exchanger in the cooling tower was made up of bundles with the same structural and functional characteristics. It can be seen in Figure 4 that each bundle was composed of 10 finned tubes arranged in five rows. Meanwhile, the working fluid would enter the bundle through the left side of the fifth row in the finned tubes and leave the bundle at the right side of the first row in the finned tubes. Then, the air would cool the working fluid by flowing from the bottom to the top of the bundle. The calculation for the heat exchanger model is also presented in Figure 4. Generally, the traditional method of heat exchanger modeling is only valid for a working fluid with constant properties. In this study, the nodal approach was adopted in designing the heat exchanger, in which each row of the heat exchanger bundles was divided into 24 sections, as if a number of small heat exchangers were connected in series.
The heat balance equation between CO2 mixture and air was as follows,
Q c t = m CO 2 · ( h CO 2 , i h CO 2 , o ) = m a i r · c p , a i r · ( T a i r , i T a i r , o ) ,
where QCt is the heat emission of the cooling tower (W), hCO2 represents the enthalpy of CO2 (J·kg−1), while i and o stand for the inlet and outlet of the working fluid, respectively, and Cp,air indicates the average heat capacity of air (J·kg−1·K−1).
Additionally, the product of the heat transfer area and the overall heat transfer coefficient (UA) of the heat exchanger could be obtained through the logarithmic mean temperature difference (LMTD), as displayed below.
Q = U · A · F T · Δ T L M T D ,
where U is the thermal conductivity of the system (W·m−2·K−1), A stands for the area of heat transfer (m2), FT indicates the correction factor of LMTD (which amends the counter current flow as the cross-flow), and Δ T L M T D represents the logarithmic mean temperature (K), which can be calculated as follows,
Δ T L M T D = ( Δ T 1 Δ T 2 ) / ln ( Δ T 1 / Δ T 2 )
when the working fluid experienced counter current flow in the heat exchanger, Δ T 1 = T CO 2 , o T a i r , i , Δ T 2 = T CO 2 , i T a i r , o .
On the other hand, the condenser could be divided into the superheated single-phase region and the two-phase region based on the working fluid state at the turbine outlet. For the single-phase region of the CO2 mixture, the Krasnoshchekov–Petukhov correlation [30,31] was employed,
N u 0 = ( f / 8 ) Re D Pr 1.07 + 12.7 ( f / 8 ) 1 / 2 ( Pr 2 / 3 1 ) ,
U = k D N u 0 ( μ b μ w ) 0.11 ( k b k w ) 0.33 ( c p c p b ) 0.35 ,
f = ( 0.790 lnRe D 1.64 ) 2 ,
where U represents the heat transfer coefficient and D suggests the inner diameter of the tube.
The following correlation [32] was used for the two-phase region of the CO2 mixture.
N u = 0.729 [ g ρ f ( ρ f ρ g ) D o 3 i f g μ f k r ( T s a t T w a l l ) ] 1 / 4 ,
where g represents acceleration due to gravity, ρ f and ρ g are the densities of liquid and vapor working fluid, and i f g is the modified latent heat of vaporization.
The heat transfer coefficient at the air side [22] was calculated as follows,
h a A a = 0.0143 Re a 2 + 83.2 Re a + 22210 ,
where ha is the air side heat transfer coefficient, Aa stands for the air side heat transfer area, and Rea indicates the Reynolds number of air. Moreover, the characteristic length of Rea was deemed as the equivalent circular diameter of the air flow passage, which was 1.7 × 10⁻² m for this particular heat exchanger.
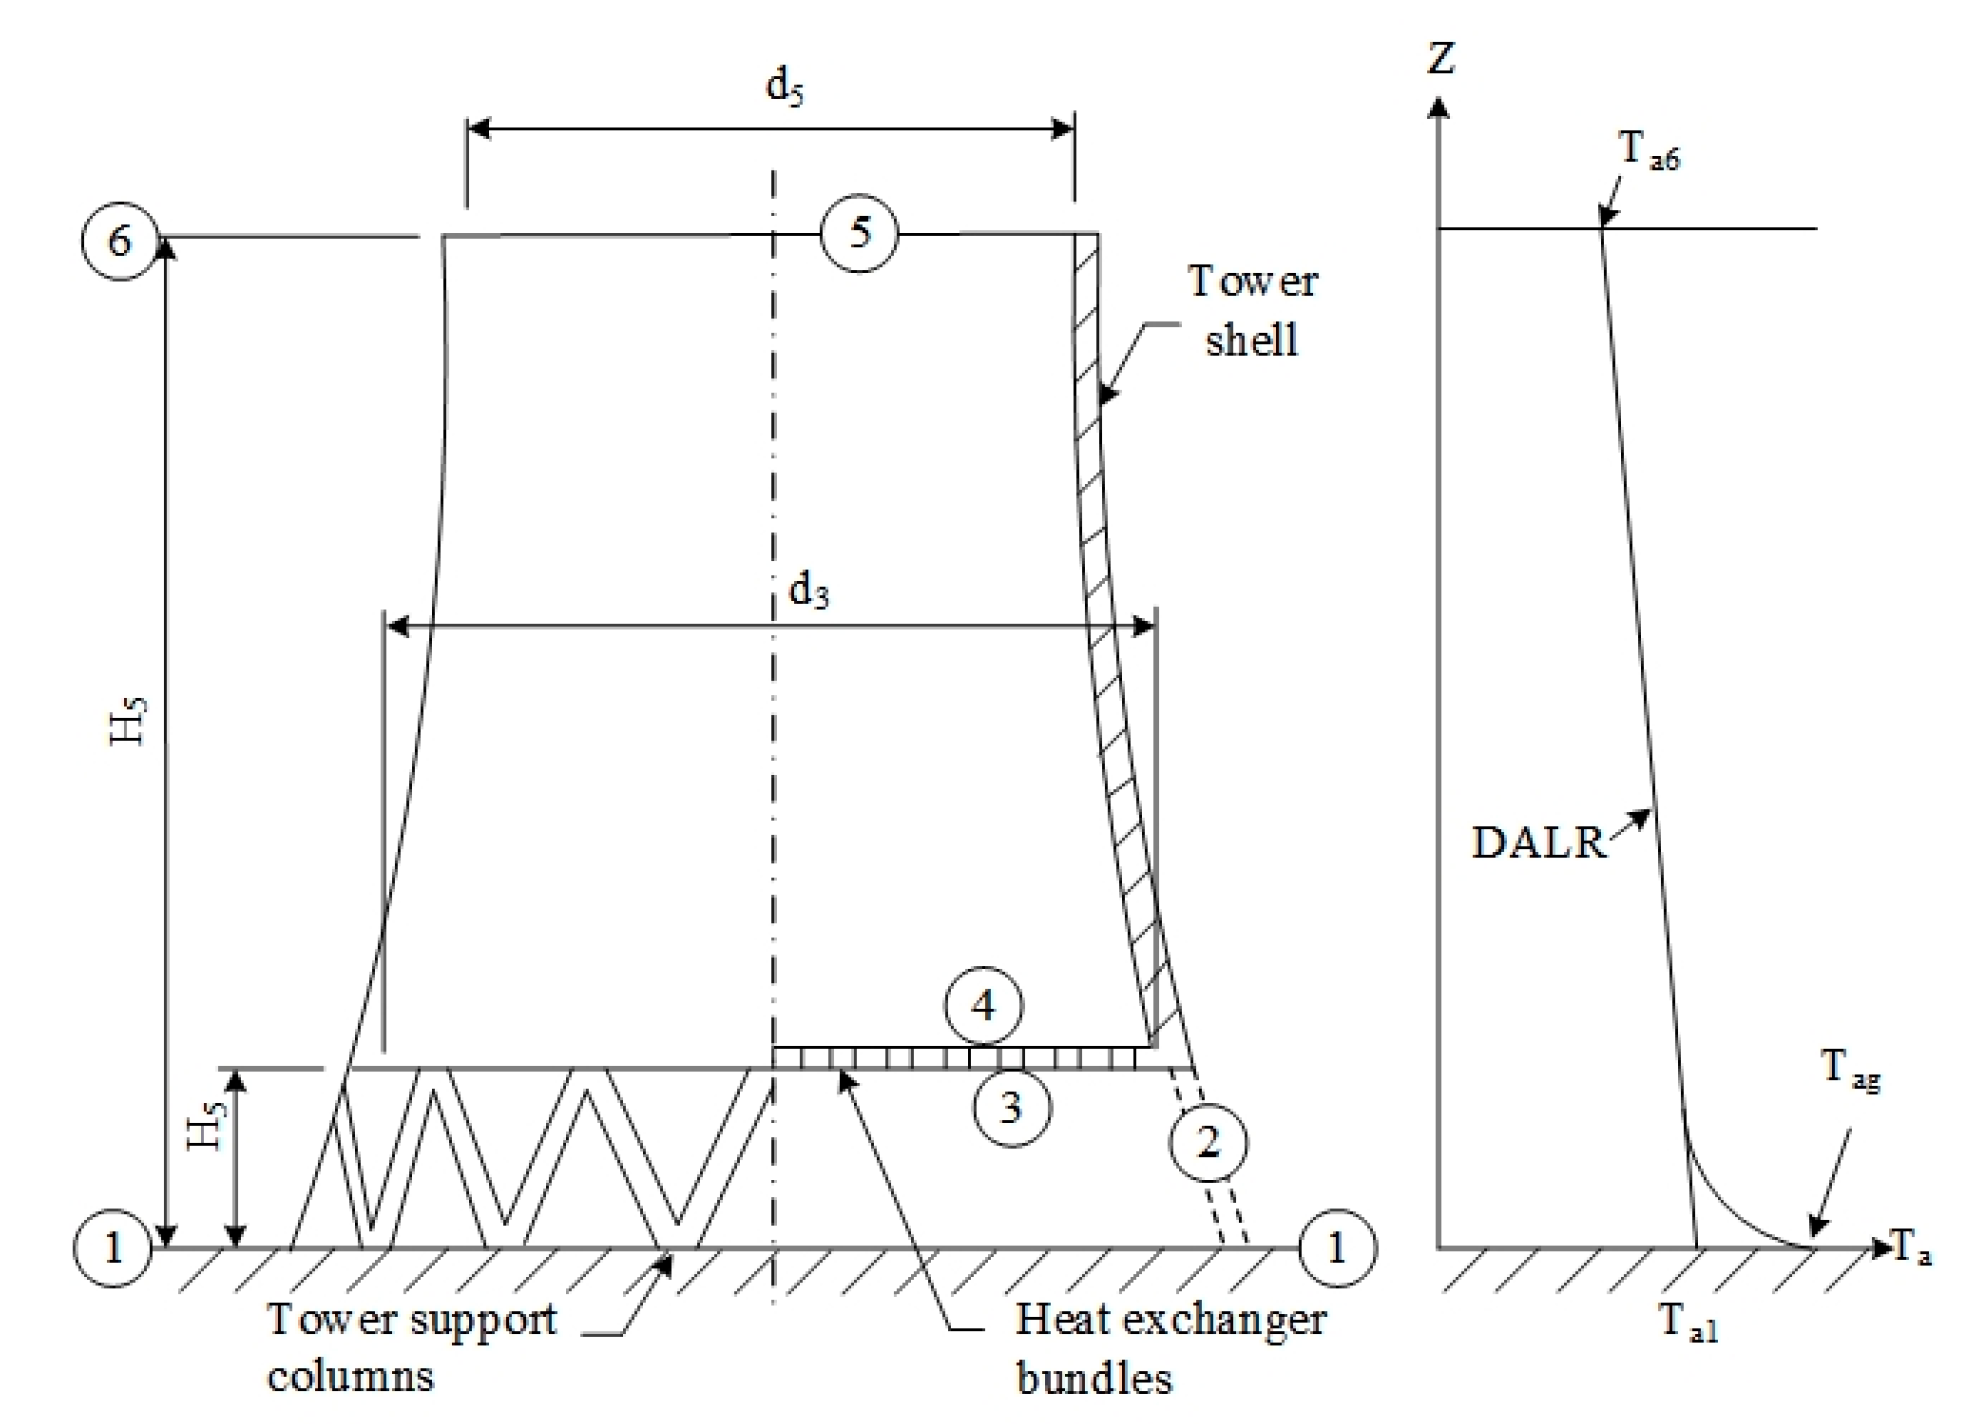
The structure chart of the NDDCT and the distribution diagram of air side resistance are displayed in Figure 5 and Figure 6, respectively. Clearly, the NDDCT consisted of the tower support columns, the heat exchanger bundles, the hyperbolic-type tower shell, and the sensors.
The ventilation equation represents the balance equation between the buoyancy with the result of air heating and the air pressure loss in the NDDCT, as shown below:
p a 1 [ { 1 0.00975 ( H 3 + H 4 ) / ( 2 T a 1 ) ] } 3.5 × { 1 0.00975 ( H 5 H 3 / 2 H 4 / 2 ) / T a 4 } 3.5 ( 1 0.00975 H 5 / T a 1 ) 3.5 ] = ( K t s + K c t + K h e s + K c t c + K h e + K c t e ) h e ( m a / A f r ) 2 / ( 2 ρ a 34 ) × [ 1 0.00975 ( H 5 H 3 / 2 H 4 / 2 ) / T a 4 ] 3.5 + ( 1 + K t o ) ( m a / A 5 ) 2 ( 2 ρ a 5 )
where p a 1 is the air pressure at state 1 in Figure 1 (Pa), T a 1 suggests the air temperature at state 1 (K), H3 represents the distance between the heat exchanger bundles bottom and the ground (m), H4 indicates the distance between the top of the heat exchanger bundles and the ground (m), H5 is the distance between the tower outlet and the ground (m), T a 4 stands for the air temperature at state 4 (K), ma is indicative of the air flow (kg·s−1), A f r is the face area of the heat exchanger bundle bottom (m2), ρ a 34 signifies the average air density of the heat exchanger bundles (kg·m−3), A5 denotes the outlet area of the cooling tower (m2), ρ a 5 represents the outlet air density of cooling tower (kg·m−3), and K indicates the coefficients of air loss in the NDDCT. More details are presented in Table 2.
The specified parameters for the design of the NDDCT are listed in Table 3. The design flow of the NDDCT was built on the parameter iteration according to the energy conservation equation and the ventilation equation. Typically, the minimum Δ T L M T D was 5.00 K. The detailed data for the heat exchanger are listed in Table 4.

3. Results and Discussion

3.1. Thermodynamic Analysis

Firstly, the calculated thermal efficiency of CO2/R161 TRC was compared with that of Dai et al. [18]. As shown in Figure 7, the simulation results were consistent with those previously reported, which verified the correctness of our calculation. Moreover, those results also suggested that the thermal efficiency of CO2/R161 TRC was enhanced with the decrease in the CO2 mass fraction in CO2/R161 mixtures.
On the other hand, Figure 8 plots the changes in thermal efficiency depending on the variation of turbine inlet pressure at various turbine inlet temperatures using CO2/R161 (mass fraction of 0.5/0.5). As can be observed, the thermal efficiency was first increased and then decreased as the turbine inlet pressure was elevated. In other words, there was an optimal turbine inlet pressure to obtain the maximal thermal efficiency of the system. In addition, the optimal turbine inlet pressure was boosted with the increase in turbine inlet temperature. In our study, the optimal turbine inlet pressure was determined to be about 8.00 MPa at the turbine inlet temperature of 373.15 K, which was changed to about 18.00 MPa at the turbine inlet temperature of 473.15 K.
The evolution of the thermal efficiency with the variations in mass fraction and turbine inlet pressure at different minimum circulation temperatures is exhibited in Figure 9. Obviously, the thermal efficiency increased with the increase in turbine inlet pressure in the presence of low R161 mass fraction. In the meantime, the maximum thermal efficiency appear as the R161 mass fraction was increased. However, the thermal efficiency was gradually decreased with the increase in turbine inlet pressure at the high R161 mass fraction. Besides, the minimum circulation temperature would also affect the thermal efficiency of the system.
Table 5 lists the optimal operation parameters of CO2/R161 TRC at the condensing temperature of 308.15 K and the turbine inlet temperature of 423.15 K. As can be seen, the optimal thermal efficiency was about 7.40%, the optimal output work was about 37.00 kW, the optimal working medium flow was 1.60 kg/s, and the heat rejection of the condenser was about 463.00 kW.

3.2. Design Parameters and Performance Analysis of Cooling Tower

Notably, the as-prepared TRC with CO2 blends was more sensitive to the environment temperature, since the CO2 mixtures could directly exchange heat with air in the NDDCT, which was different from the conventional indirect cooling system. Therefore, the effects of the environment temperature and temperature variation of CO2 mixtures on the system were also investigated.
The design parameters of the NDDCT at the condenser heat rejection of about 463.00 kW (as discussed in Table 5) are listed in Table 6. As can be seen, the height of the cooling tower was 10.00 m; the diameters of the inlet and the outlet of the cooling tower were 7.14 and 5 m, respectively; the number of heat exchanger bundles was seven; the working fluid outlet temperature was 307.98 K; and the air mean outlet temperature was about 318.85 K.
The temperature profiles of CO2 mixture and air in the cooling tower are presented in Figure 10. As can be figured out, the CO2 mixture had experienced transition from the single-phase vapor state to the vapor–liquid two-phase state in the fifth row of the finned tubes. Afterward, the CO2 mixture was slowly condensed into the saturated liquid during cooling from the fourth to the first row of the finned tubes. It is noted that the air temperature was plotted between every layer of finned tubes in the air-cooled heat exchangers. The discontinuity in the air temperature trends during phase change of the CO2/R161 mixture is due to an abrupt decrease in mixture heat transfer coefficient, which results in a high temperature difference in the vapor phase. However, the smaller rejection heat in the vapor phase reduced the air temperature difference. Moreover, the air temperature through the overall length of the cooling tower is shown in Appendix Figure A1. The heat transfer coefficient of CO2 mixture variation in the heat exchanger is presented in Figure 11. Clearly, the heat transfer coefficient of the CO2 mixture was about 200 W/m2·K at the single-phase vapor state, while that was increased to 3000 W/m2·K at the vapor–liquid two-phase state. The temperature difference in each row was about 3.00 K, and the outlet temperature of air at the fifth row of the finned tubes was about 318.15–320.15 K.
The air velocity through the heat exchanger bundles is calculated and presented in Figure 12. It is noted that the discontinuity in the air velocity trend is due to data selection, which are ones between every layer of finned tubes. Actually, air flows across tubes with a continuous velocity. The air velocity through the overall length of the cooling tower is shown in Appendix Figure A2. As can be seen, the air velocity was about 0.63 m/s at the first row of finned tubes, which was increased to 0.67 m/s at the fifth row of finned tubes. This was because air heating would result in a decrease in density and an increase in buoyancy, thus, giving rise to the increased air velocity through the heat exchanger bundles.
The effects of ambient temperature on the CO2 outlet temperature in the condenser, the heat rejection of cooling tower, and the mass flow rate of air through the cooling tower are calculated, as presented in Figure 13, Figure 14 and Figure 15, respectively. Specifically, the increase in ambient temperature would reduce the mass flow rate of air and decrease the heat rejection of the NDDCT, thus, deteriorating the cooling of CO2 mixtures. For instance, the turbine exhaust temperature of the CO2 mixture was 345.00 K, the heat rejection of the cooling tower was 450.00 kW, and the outlet temperature of CO2 in the condenser was 312.15 K at the ambient temperature of 303.15 K. Importantly, the performance of the NDDCT was enhanced with the increases in ambient temperature and the heat rejection of cooling tower coupled with the decrease in CO2 outlet temperature in the condenser. Noteworthily, the pressure of the CO2 mixture was changed with the alteration in the condensation temperature of CO2 mixture.
In addition, as presented in Figure 14, the heat rejection of cooling tower was increased as the turbine exhaust temperature was elevated (Figure 13) at the same ambient temperature, while the CO2 outlet temperature in the condenser remained largely unchanged. Typically, the driving force of air flow in the NDDCT was the density difference between the hot air in the cooling tower and the cool air out of the cooling tower. Additionally, the heat exchange was driven by the temperature difference between the air and the CO2 mixture. Thus, the density difference between air in and out of the cooling tower was enlarged as the turbine exhaust temperature was elevated, which would result in the increased mass flow rate of air and air velocity, finally boosting the heat rejection of the cooling tower.

4. Conclusions

A transcritical Rankine cycle system with natural draft dry cooling tower using CO2/R161 blends has been established in this paper. The thermodynamic performance and optimal operation parameters of the system, together with the cooling performance of natural draft dry cooling tower, are discussed. In addition, the design procedures of the natural draft dry cooling tower in a transcritical Rankine cycle using a CO2/R161 mixture are provided. The conclusions can be drawn that the CO2/R161 mixture has the potential to be used in arid areas, using dry air cooling methods with great thermodynamic performance. The decrease in ambient temperature will lead to the increase in the mass flow rate of air and the heat rejection of cooling tower, which will result in the lower inlet temperature of CO2/mixture in the pump. Moreover, the thermal efficiency of transcritical Rankine cycle using CO2/R161 is decreased with increases in the turbine inlet pressure and ambient temperature, with thermal power being used as the heat source.

Author Contributions

Conceptualization, C.Z. and Q.L.; methodology, Y.Z., J.T., and C.Z.; software, Y.Z.; validation, J.T.; writing—original draft preparation, Y.Z., J.T., C.Z., and Q.L.; writing—review and editing, Y.Z., J.T., C.Z., and Q.L.; project administration, Q.L.; funding acquisition, Q.L.

Funding

This work is supported by the National Natural Science Foundation of China (no. 51876015) and Fundamental Research Funds for the Central Universities (no. 2018CDXYDL0001).

Acknowledgments

The authors would like to acknowledge their colleagues from the Key Laboratory of Low-Grade Energy Utilization Technologies and Systems, Ministry of Education for their perspectives and suggestions related to data collection and statistical analysis.

Conflicts of Interest

The authors declare no conflict of interest.

Nomenclature

henthalpy (kJ/kg)
Qheat transfer rate (kW)
mmass flow rate (kg/s)
Uheat transfer coefficient (W·m−2·K−1)
cpspecific heat capacity (kJ/kg·K)
Ttemperature (K)
Aheat exchanger area (m2)
Dinner diameter (m)
Kcoefficient of loss of air
Hheight (m)
Llength (m)
Greek symbols
Δ T temperature difference (K)
ρ density (kg/m3)
Acronyms
ORCorganic Rankine cycle
TRCtranscritical Rankine cycle
LMTDlogarithmic mean temperature difference
NDDCTnatural draft dry cooling tower
Subscripts
ppump
tturbine
coolcool water
aair
iinlet
ooutlet

Appendix A

Figure A1. The air temperature through the overall length of the cooling tower.
Energies 12 03342 g0a1
Figure A2. The air velocity through the overall length of the cooling tower.
Energies 12 03342 g0a2

References

  1. Vélez, F.; Segovia, J.J.; Martín, M.C.; Antolín, G.; Chejne, F.; Quijano, A. A technical, economical and market review of organic Rankine cycles for the conversion of low-grade heat for power generation. Renew. Sustain. Energy Rev. 2012, 16, 4175–4189. [Google Scholar]
  2. Yamamoto, T.; Furuhata, T.; Arai, N.; Mori, K. Design and testing of the Organic Rankine Cycle. Energy 2001, 26, 239–251. [Google Scholar] [CrossRef]
  3. Wang, S.; Liu, C.; Zhang, C.; Xu, X.; Li, Q. Thermo-economic evaluations of dual pressure organic Rankine cycle (DPORC) driven by geothermal heat source. J. Renew. Sustain. Energy 2018, 10, 063901. [Google Scholar] [CrossRef]
  4. Ding, Y.; Liu, C.; Zhang, C.; Xu, X.; Li, Q.; Mao, L. Exergoenvironmental model of Organic Rankine Cycle system including the manufacture and leakage of working fluid. Energy 2018, 145, 52–64. [Google Scholar] [CrossRef]
  5. Zhang, C.; Liu, C.; Xu, X.; Li, Q.; Wang, S.; Chen, X. Effects of superheat and internal heat exchanger on thermo-economic performance of organic Rankine cycle based on fluid type and heat sources. Energy 2018, 159, 482–495. [Google Scholar] [CrossRef]
  6. Gao, H.; Liu, C.; He, C.; Xu, X.; Wu, S.; Li, Y. Performance analysis and working fluid selection of a supercritical Organic Rankine Cycle for low grade waste heat recovery. Energies 2012, 5, 3233–3247. [Google Scholar] [CrossRef]
  7. Marston, C.H. Parametric analysis of the Kalina cycle. J. Eng. Gas Turb. Power 1990, 112, 107–116. [Google Scholar] [CrossRef]
  8. Gao, H.; Chen, F. Thermo-economic analysis of a bottoming Kalina cycle for internal combustion engine exhaust heat recovery. Energies 2018, 11, 3044. [Google Scholar] [CrossRef]
  9. Zhang, C.; Liu, C.; Xu, X.; Li, Q.; Wang, S. Energetic, exergetic, economic and environmental (4E) analysis and multi-factor evaluation method of low GWP fluids in trans-critical organic Rankine cycles. Energy 2019, 168, 332–345. [Google Scholar] [CrossRef]
  10. Sadreddini, A.; Ashjari, M.A.; Fani, M.; Mohammadi, A. Thermodynamic analysis of a new cascade ORC and transcritical CO2 cycle to recover energy from medium temperature heat source and liquefied natural gas. Energy Convers. Manag. 2018, 167, 9–20. [Google Scholar] [CrossRef]
  11. Rony, R.U.; Yang, H.; Krishnan, S.; Song, J. Recent advances in transcritical CO2 (R744) heat pump system: A review. Energies 2019, 12, 457. [Google Scholar] [CrossRef]
  12. Omar, A.; Saghafifar, M.; Mohammadi, K.; Alashkar, A.; Gadalla, M. A review of unconventional bottoming cycles for waste heat recovery: Part II—Applications. Energy Convers. Manag. 2019, 180, 559–583. [Google Scholar] [CrossRef]
  13. Yari, M.; Mahmoudi, S.M.S. Thermodynamic analysis and optimization of novel ejector-expansion TRCC (transcritical CO2) cascade refrigeration cycles (Novel transcritical CO2 cycle). Energy 2011, 36, 6839–6850. [Google Scholar] [CrossRef]
  14. Xia, J.; Wang, J.; Zhang, G.; Lou, J.; Zhao, P.; Dai, Y. Thermo-economic analysis and comparative study of transcritical power cycles using CO2-based mixtures as working fluids. Appl. Therm. Eng. 2018, 144, 31–44. [Google Scholar] [CrossRef]
  15. Guo, J.; Li, M.; Xu, J.; Yan, J.; Wang, K. Thermodynamic performance analysis of different supercritical Brayton cycles using CO2-based binary mixtures in the molten salt solar power tower systems. Energy 2019, 173, 785–798. [Google Scholar] [CrossRef]
  16. Manzolini, G.; Binotti, M.; Bonalumi, D.; Invernizzi, C.; Iora, P. CO2 mixtures as innovative working fluid in power cycles applied to solar plants. Techno-economic assessment. Sol. Energy 2019, 181, 530–544. [Google Scholar] [CrossRef]
  17. Baik, W.; Lee, W.; Yun, R. Heat transfer and pressure drop characteristics of CO2 mixtures in a pipeline under the seawater condition. Int. J. Heat Mass Transf. 2019, 136, 627–634. [Google Scholar] [CrossRef]
  18. Dai, B.; Li, M.; Ma, Y. Thermodynamic analysis of carbon dioxide blends with low GWP (global warming potential) working fluids-based transcritical Rankine cycles for low-grade heat energy recovery. Energy 2014, 64, 942–952. [Google Scholar] [CrossRef]
  19. Yang, M.H. The performance analysis of the transcritical Rankine cycle using carbon dioxide mixtures as the working fluids for waste heat recovery. Energy Convers. Manag. 2017, 151, 86–97. [Google Scholar] [CrossRef]
  20. Shu, G.; Yu, Z.; Tian, H.; Liu, P.; Xu, Z. Potential of the transcritical Rankine cycle using CO2-based binary zeotropic mixtures for engine’s waste heat recovery. Energy Convers. Manag. 2018, 174, 668–685. [Google Scholar] [CrossRef]
  21. Sun, Z.; Liu, C.; Xu, X.; Li, Q.; Wang, X.; Wang, S.; Chen, X. Comparative carbon and water footprint analysis and optimization of Organic Rankine Cycle. Appl. Therm. Eng. 2019, 158, 113769. [Google Scholar] [CrossRef]
  22. Li, X.; Duniam, S.; Gurgenci, H.; Guan, Z.; Veeraragavan, A. Full scale experimental study of a small natural draft dry cooling tower for concentrating solar thermal power plant. Appl. Energy 2017, 193, 15–27. [Google Scholar] [CrossRef]
  23. Hu, J.; Liu, C.; Li, Q.; Shi, X. Molecular simulation of thermal energy storage of mixed CO2/IRMOF-1 nanoparticle nanofluid. Int. J. Heat Mass Transf. 2018, 125, 1345–1348. [Google Scholar] [CrossRef]
  24. Chen, X.; Liu, C.; Li, Q.; Wang, X.; Xu, X. Dynamic analysis and control strategies of Organic Rankine Cycle system for waste heat recovery using zeotropic mixture as working fluid. Energy Convers. Manag. 2019, 192, 321–334. [Google Scholar] [CrossRef]
  25. Zhou, Y.; Li, Q.; Wang, Q. Energy storage analysis of UIO-66 and water mixed nanofluids: An experimental and theoretical study. Energies 2019, 12, 2521. [Google Scholar] [CrossRef]
  26. Usman, M.; Imran, M.; Yang, Y.; Lee, D.H.; Park, B. Thermo-economic comparison of air-cooled and cooling tower based Organic Rankine Cycle (ORC) with R245fa and R1233zde as candidate working fluids for different geographical climate conditions. Energy 2017, 123, 353–366. [Google Scholar] [CrossRef]
  27. Hooman, K. Dry cooling towers as condensers for geothermal power plants. Int. Commun. Heat Mass 2010, 37, 1215–1220. [Google Scholar] [CrossRef]
  28. NIST Webbook. Available online: http://webbook.nist.gov/chemistry/fluid/ (accessed on 1 June 2019).
  29. Lemmon, E.W.; Huber, M.L.; McLinden, M.O. NIST Standard Reference Database 23: Reference Fluid Thermodynamic and Transport Properties Refprop; Version 9.1; NIST: Gaithersburg, MD, USA, 2007. [Google Scholar]
  30. Pioro, I.L.; Khartabil, H.F.; Duffey, R.B. Heat transfer to supercritical fluids flowing in channels—Empirical correlations (survey). Nucl. Eng. Des. 2004, 230, 69–91. [Google Scholar] [CrossRef]
  31. Petukhov, B.S. Heat Transfer and Friction in Turbulent Pipe Flow with Variable Physical Properties. In Advances in Heat Transfer; Hartnett, J.P., Irvine, T.F., Eds.; Elsevier: Amsterdam, The Netherlands, 1970; pp. 503–564. [Google Scholar]
  32. Cengel, Y.A.; Klein, S.; Beckman, W. Heat Transfer: A Practical Approach; McGraw-Hill: New York, NY, USA, 1998; Volume 141. [Google Scholar]
  33. Kröger, D.G. Air-Cooled Heat Exchangers and Cooling Towers; PennWell Books: Tulsa, OK, USA, 2004; Volume 1. [Google Scholar]
Figure 1. Schematic diagram of the power plant.
Energies 12 03342 g001
Figure 2. Temperature–entropy (T–s) diagram (CO2/R161: 50/50 wt.%) of the transcritical Rankine cycle (TRC).
Energies 12 03342 g002
Figure 3. The critical pressure and critical temperature for CO2/R161 mixtures.
Energies 12 03342 g003
Figure 4. Heat exchanger bundles and nodal approach for the heat exchanger model.
Energies 12 03342 g004
Figure 5. The distribution of heat exchangers in natural draft dry cooling tower (NDDCT).*DALR: Dry adiabatic lapse rate.
Energies 12 03342 g005
Figure 6. The coefficients of losses of air in NDDCT.
Energies 12 03342 g006
Figure 7. Thermal efficiencies for CO2/R161 TRC.
Energies 12 03342 g007
Figure 8. The relationships between thermal efficiency and turbine inlet pressure under various turbine inlet temperatures.
Energies 12 03342 g008
Figure 9. Contours of thermal efficiency with variation of mass fraction and turbine inlet pressure at different circulation minimum temperatures.
Energies 12 03342 g009
Figure 10. Temperature profile in the cooling tower.
Energies 12 03342 g010
Figure 11. Heat transfer coefficient of CO2 mixture variation in the heat exchanger.
Energies 12 03342 g011
Figure 12. The air velocities through the heat exchanger bundles.
Energies 12 03342 g012
Figure 13. Outlet temperature of CO2 in the condenser at different ambient temperatures.
Energies 12 03342 g013
Figure 14. Influence of ambient temperature on heat rejection of cooling tower.
Energies 12 03342 g014
Figure 15. Mass flow rate of air through the cooling tower at different ambient temperatures.
Energies 12 03342 g015
Table 1. Design operation parameters.
ParameterValue
Thermal power of heat source (kW)500.00
Annual average air temperature (K)298.15
Isentropic turbine efficiency0.70
Isentropic pump efficiency0.80
Turbine inlet temperature (K)423.15
Turbine inlet pressure (MPa)15.00
Pressure losses0.00
Table 2. The coefficients of loss of air in NDDCT [33].
Loss CoefficientEquation
The tower support loss coefficient, Kts K t s = 2 Δ p a t s ρ a 34 ( m a A f r ) 2 = C D t s L t s d t s n t s A f r 2 ( π d 3 H 3 ) 3 ( ρ a 34 ρ a 1 )
Contraction loss coefficient, Kctc K c t c = ( 1 2 σ c + 1 σ c 2 ) ( ρ a 34 ρ a 1 ) ( A f r A e 3 ) 2
Expansion loss coefficient, Kcte K c t e = ( 1 A e 3 A 3 ) 2 ( ρ a 34 ρ a 1 ) ( A f r A e 3 ) 2
Cooling tower inlet loss coefficient, Kct K c t = K c t h e ( ρ a 34 / ρ a 1 ) ( A f r / A e 3 ) 2
Terblanche and Kroger correlation
K c t h e = [ 100 18 ( d 3 H 3 ) + 0.94 ( d 3 H 3 ) 2 ] χ K h e [ 1.28 + 0.183 ( d 3 H 3 ) 7.769 × 10 3 ( d 3 H 3 ) 2 ]
Cooling tower outlet loss coefficient, Kto K t o = Δ p a 56 ρ a 5 v a 5 2 2 = 2 ρ a 5 Δ p a 56 ( m a A 5 ) 2 = 0.28 F r D 1 + 0.04 F r D 1.5
F r D = ( m a A 5 ) 2 / [ ρ a 5 ( ρ a 6 ρ a 5 ) g d 5 ] s
Heat exchanger loss coefficient, KheCharacteristic Reynolds number, R y = m a μ a 34 A f r T
K h e = 31383.8475 R y 0.332458 + 2 σ a 2 ( ρ a 3 ρ a 4 ρ a 3 + ρ a 4 )
Table 3. Specified parameters for the design of the NDDCT.
ParameterUnitValue
Aspect ratio of cooling tower, H5/d3-1.40
Tower inlet height, H3m5.00
Tower diameter ratio, d5/d3-0.70
Heat exchanger coverage of tower inlet, Afr/A3-0.65
Number of tower supports, nts-d3/(82.96/60)
Length of tower support, LtsmH3 × (15.78/13.67)
Table 4. The detailed data for the heat exchanger.
Heat Exchanger ParameterUnitValue
Hydraulic diameter of tubem9.00 × 10−3
Inside area of tube per unit lengthm22.85 × 10−2
Inside cross-sectional flow aream26.40 × 10−5
Length of finned tubem3.84
Effective length of tubem3.79
Number of tube rows-5
Number of tubes per bundles-220
Number of water passes-10
Number of bundles-18
Total effective frontal aream276.60
Fin root diameterm9.50 × 10−3
Fin pitchm2.10 × 10−3
Table 5. Design conditions for the air-cooled CO2/R161 TRC.
Plant SolutionValue
Turbine inlet temperature (K)423.15
Turbine inlet pressure (MPa)12.45
Cycle efficiency (%)7.42
Plant power output (kW)37.11
Condensing temperature (K)308.15
CO2/R161 mass fraction ratio0.5/0.5
Vapor fraction at turbine outlet (%)100.00
Turbine outlet temperature (K)345.00
Mass flow rate of the working fluid (kg·s−1)1.62
Heat rejection (kW)462.89
Table 6. The design parameters of the NDDCT at the condenser heat rejection of about 463 kW.
ParametersCooling Tower System
Tower height (m)10.00
Tower outlet diameter (m)5.00
Tower inlet diameter (m)7.14
Tower inlet height (m)4.00
Number of heat exchanger bundles7
Frontal area (m2)29.80
Working fluid inlet temperature (K)345.00
Working fluid outlet temperature (K)307.98
Working fluid inlet pressure (MPa)3.89
Working fluid mass flow (kg·s−1)1.62
Heat rejection (kW)463.00
Air mass flow (kg·s−1)22.20
Air mean outlet temperature (K)318.85

