Advection-Based Coordinated Control for Wave-Energy Converter Array


1
College of Mechatronics and Control Engineering, Shenzhen University, Shenzhen 518060, China
2
Shenzhen Intelligent Operation Technology Laboratory, Research Institute of Northwestern Polytechnical University in Shenzhen, Shenzhen 518060, China
*
Author to whom correspondence should be addressed.
Energies 2019, 12(18), 3567; https://0-doi-org.brum.beds.ac.uk/10.3390/en12183567
Submission received: 16 August 2019
/
Revised: 9 September 2019
/
Accepted: 16 September 2019
/
Published: 18 September 2019
(This article belongs to the Special Issue Wave Energy Conversion)
Abstract
:This paper presents a coordinated control based on the advection consensus control algorithm to implement power dispatch for each wave-energy converter (WEC) in a WEC array. Under unbalanced conditions, the proposed algorithm is applied in order to control each WEC to output power coordinately, to enable the total output power of the WEC array to satisfy the time-varying load requirements. The purpose of the additional energy storage unit on each WEC is to smooth the power output of each WEC and to obtain more margin. Case studies include the demonstration of some simulations and experiments, and the results show that the WEC array under the proposed control method can accurately respond to the demand for power supply under unbalanced initial conditions.
1. Introduction
An array composed of multiple wave-energy convertes (WECs) enables wave-energy harvesting at multiple ocean wave points and cooperative control during power generation. Therefore, the WEC array has higher acquisition efficiency and higher power output quality than a single WEC. The array of WECs is not only required to strictly respond to the total power supply requirements of the load, but also to dispatch adequate power to each WEC according to the current conditions of wave-energy harvesting. However, the prediction of the ocean wave power conditions is challenging because of intermittence and random wave motion [1]. Consequently, it is challenging to design a coordinated control algorithm for an array of WECs. Since both the power demand of the load and the conditions of the ocean wave change in real time, it is necessary to eliminate the influence of these factors on the quality of power supply of the WEC array by the designed controller. Additionally, there has been little work reported on the coordinated control that takes into account both power requirement response and energy capture constraints of each WEC.
To improve wave-energy extraction, many researchers have focused on studying the maximum power point tracking (MPPT) control strategy of WECs under real-time ocean conditions. In [2], a hill-climbing MPPT method was applied to design the control strategy for a direct-drive WEC, and the steady-state performance of the MPPT was improved through a window function-based mean value filtering. An MPPT experimental device was designed to demonstrate the feasibility of the MPPT technique for ocean wave-energy conversion [3]. A speed sensorless control method of the linear permanent magnet synchronous generator (LPMSG) was introduced to extract the maximum power from the ocean wave, and the translator velocity was estimated by the unscented Kalman filter [4]. The MPPT was considered to be an optimal controller which was implemented by a model predictive control (MPC), to guarantee feasible optimal solutions and safe operation in [5]. Because the optimal harvesting condition of a WEC is a region defined by the amount of capture width information available, the MPPT control was modified to be the maximum capture width tracking (MCWT) control to ensure robust during the rapidly changing in ocean wave in [6]. In [7], a robust model-free collaborative learning approach was presented for a latchable WEC array. Furthermore, the machine-learning algorithm with a shallow artificial neural network (ANN) was applied to obtain the optimal latching times and absorb more power [8]. However, the papers mainly concentrated on the MPPT control problem of WEC for maximum extraction of wave energy. Local power smoothing and energy management are necessary to deal with the stationarity of voltage and current output, as well as the tracking performance of real-time load power demand for each WEC [9]. An energy management law was adopted to smooth the power fluctuation to guarantee a limited voltage range [10]. In [11], a power smoothing strategy based on a voltage controller was proposed to manage the supercapacitors’ state of charge and generate a power profile capable of smoothing the varying power of renewable sources.
An array of WECs was connected to the bus to supply the electric power for the target load, and the whole system formed a DC microgrid. Hierarchical control methods are usually applied for the microgrid (MG) to satisfy the power requirement of the load [12]. The controller on the primary level regulates DC bus voltage and share current between sources in the MG, and the controller on the secondary level is a consensus-based distributed voltage regulator for power flow dispatch [13]. The consensus algorithm is not only able to ensure reactive power-sharing of the MG, but also restore the frequency and voltage [14]. The methods were also defined as a multiagent system (MAS) framework in which each participant in MG is assigned to an agent connected with its adjacent agents [15]. To ensure better system reliability in a hybrid power source, a distributed energy management solution based on the paradigm of MASs was proposed through a bottom-up approach [16]. However, the MAS framework only performed the coordinated control of the participant of MG rather than the tracking control of the total power requirement [17].
In this paper, a distributed advection-based coordinated control method is proposed as the secondary control strategy to implement the coordinated power outputs of an array of WECs and to satisfy the sum of the power output, which is matched with the load requirement. The advection algorithm of MAS is the modified consensus method inspired by the distribution process, which is actively transported by a flow field [18,19]. In this control framework, each WEC unit has its local control and energy management, known as the primary control, which coordinates the power outputs of the energy storage (ES) and the wave-harvesting device (WHD) according to the current rest energy in ES and the local ocean wave conditions. To guarantee that the total output of the WECs array satisfies the load requirement, an advection-based consensus algorithm is applied as the coordinated control law that dispatches appropriate power desired to each WEC unit by its local controller.
The main contributions of this paper are two-fold. First, a distributed control method based on the advection consensus algorithm is proposed as a coordinated control law of the WEC array in order that its total output power strictly matches the load power requirements, and the output power of each WEC satisfies the constraints of the energy condition of the ocean and the ES. Secondly, the experimental platform of a WEC array is designed and built to validate the control algorithm and system performance.
The remainder of this paper is organized as follows: Section 2 introduces the basic knowledge implemented in this paper. Section 3 elaborately describes the hierarchical system structure of the WEC array, including the primary control of WEC and the secondary control of the advection algorithm. In Section 4, the simulation examples are applied to verify the validity of the proposed control methods, and experimental tests are implemented and analyzed. Section 5 mainly discusses the limitations of this paper and the direction of future research. Finally, Section 6 summarizes the main research work and conclusions of this paper.
2. Preliminary
2.1. Graph Theory
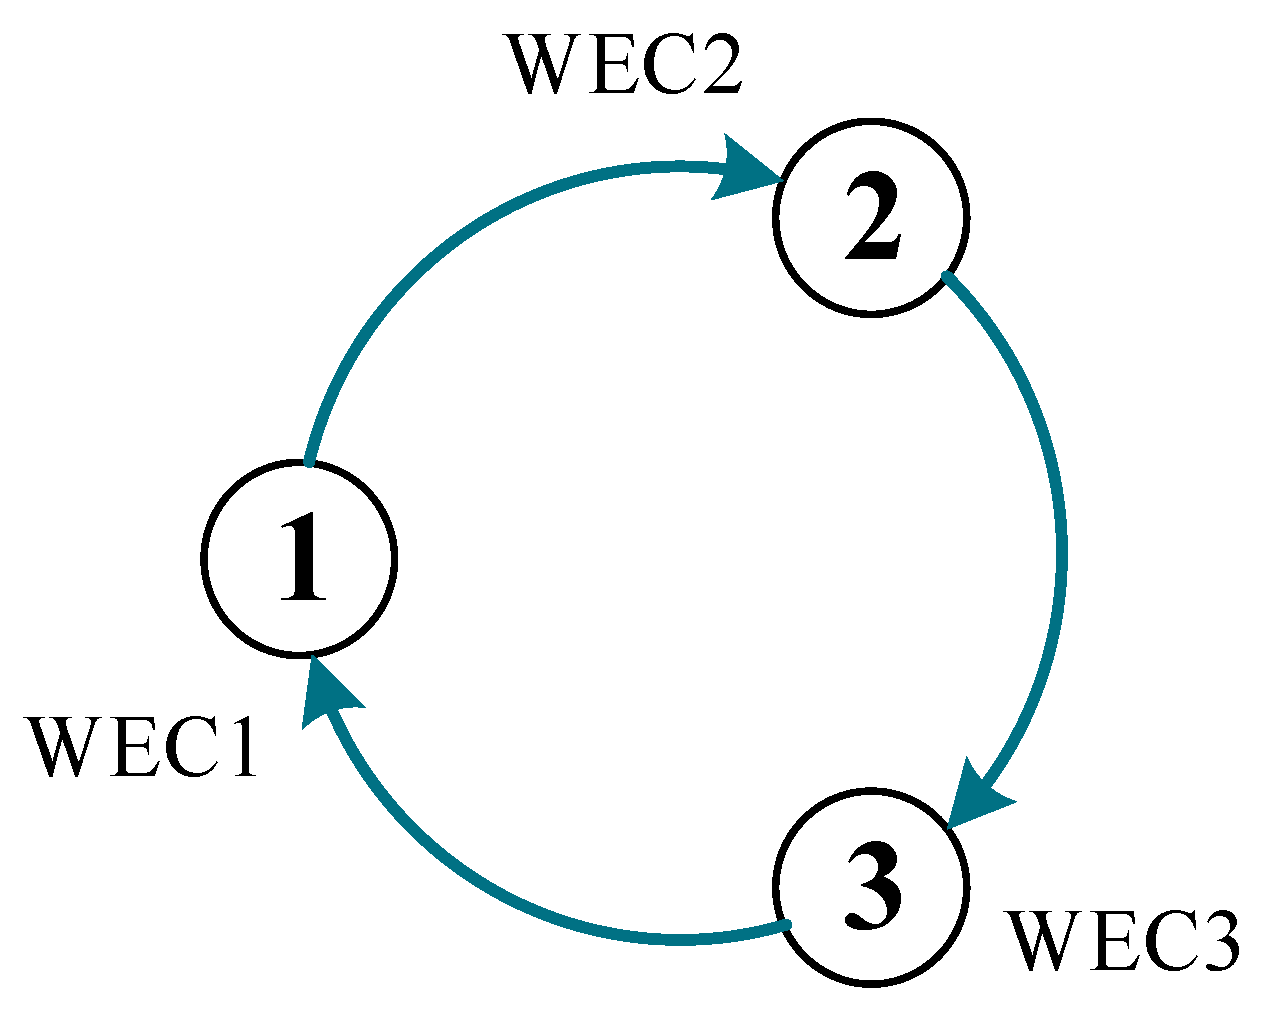
The communication network in the WEC array is modeled as a digraph consisting of a set of nodes and a set of edges as shown in Figure 1. In graph , a node, and an edge represent a WEC unit and the communication linkage between two WEC units, respectively. The can be described as the adjacency matrix ,
where represents the information flow from the WEC to the WEC by the communication linkage . If , the WEC can obtain the state information of the WEC . Otherwise, then the WEC cannot obtain the state information of the WEC .
The out-degree weight and in-degree weight of WEC are denoted as and , respectively. The out-degree matrix is a diagonal matrix with the diagonal elements , expressed as:
Similarly, the in-degree matrix is a diagonal matrix with the diagonal elements . The graph is described by the Laplacian matrix , and it is redefined as the out-degree Laplace matrix and the in-degree Laplace matrix , respectively. The out-degree Laplace matrix is shown as:
Identically, the in-degree Laplace matrix is obtained. According to graph theory, the topology structure of the communication network of the array of the WECs is exclusively represented by the Laplace matrix, and its eigenvalues are directly related to the dynamic response of the WECs array system.
2.2. Advection Algorithm
The dynamics describing the advection process of a fluid field is formulated as the discrete equation as follows [18]:
where is the state of the node at time . According to (2), the advection dynamics (4) can be reformulated as:
where , and the all final values of converge to the common value , as well as satisfy , known as the advection conservation, for all time t.
Let us define a specific graph used for the following contents.
Definition 1.
A graph is a rooted out-branching if it does not contain a directed cycle, and contains a node (root) such that there is a directed path from to every other node .
Theorem 1 [18].
If a graph is a rooted out-branching, the Jordan decomposition of the out-degree Laplacian is formulated as , where is an invertible matrix, then satisfies:
where are the first column of and the first row of , respectively. Since , is known. are the right and left eigenvectors associated with the zero eigenvalues of , respectively.
The detailed proof of the process described in Theorem 1 can be found in [18].
3. Structure of Distributed WEC Array
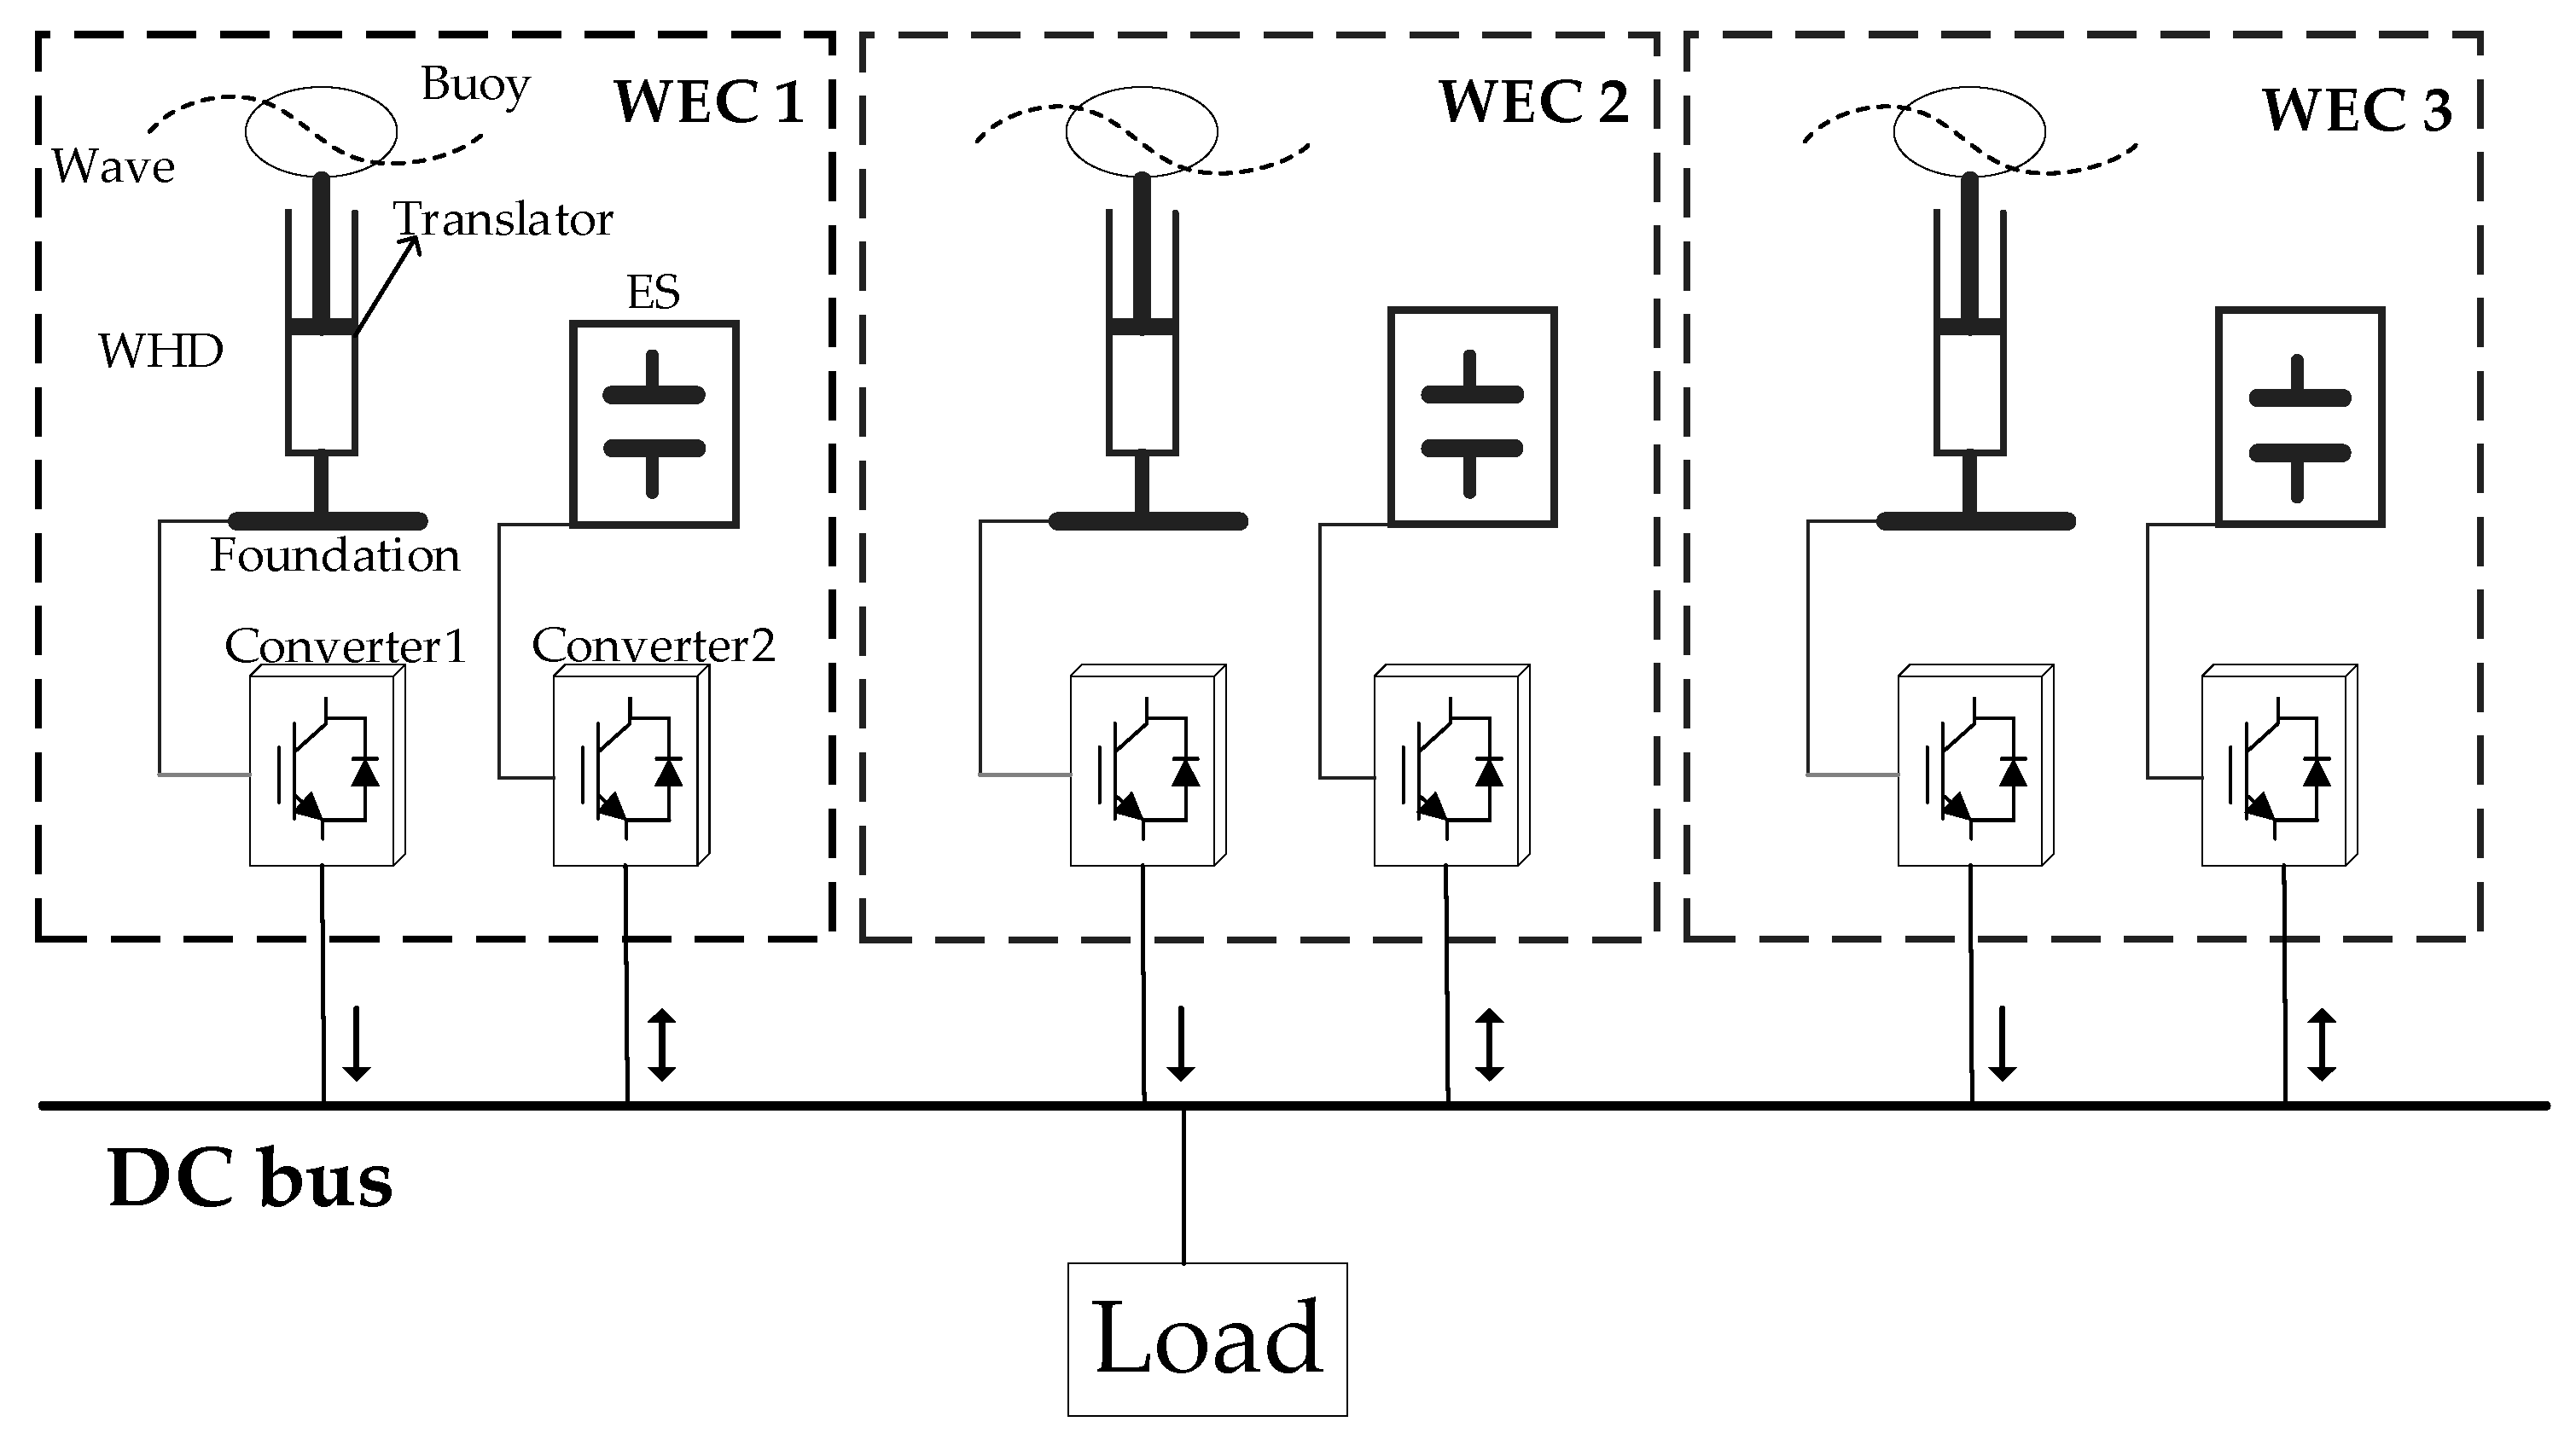
Figure 2 illustrates the structure diagram of the WEC array. Three WEC units are connected to the universal DC bus. A single WEC is composed of a WHD and an ES. To eliminate the output power fluctuation of the WHD, the ES is connected to the WHD in parallel to form a WEC unit for smoothing its power output. The desired output power of each WEC is dispatched by the distributed secondary control layer, according to the energy conditions of the ocean wave and the state of charging (SOC) of the ES.
3.1. Primary Control of WEC
3.1.1. WHD Primary Control
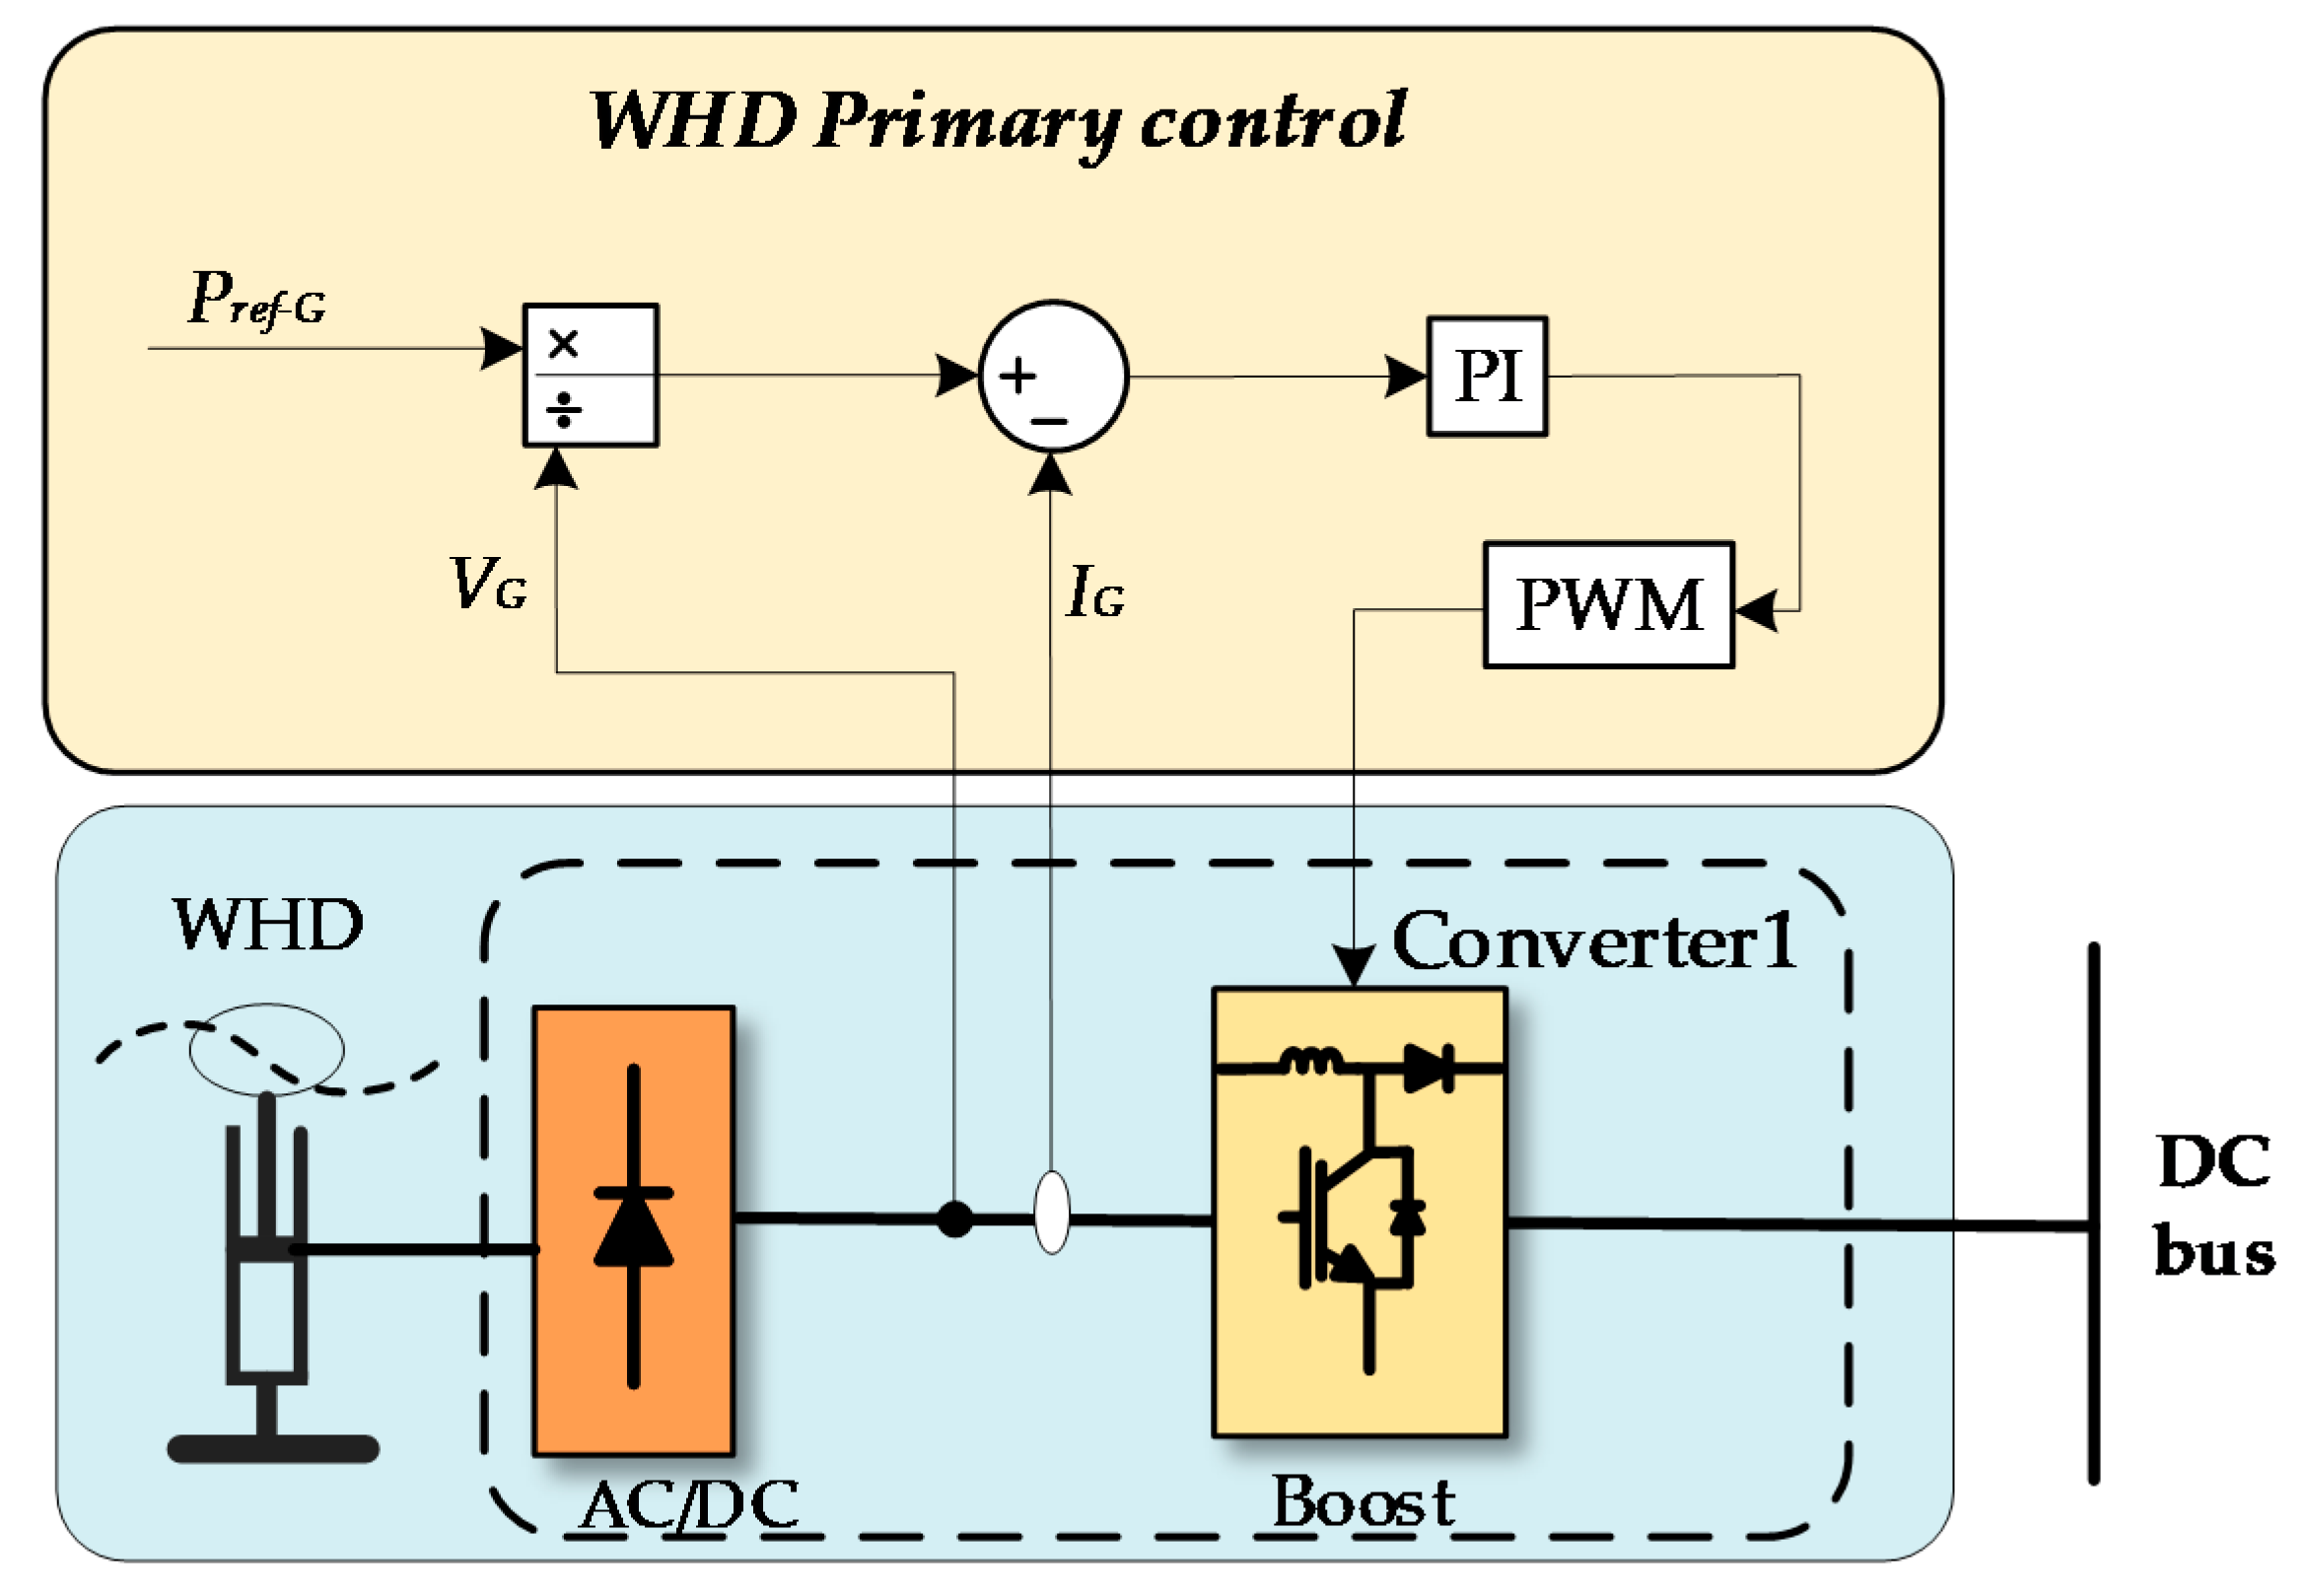
The primary control structure of the WHD is shown in Figure 3. The WHD is connected to the DC bus by the WHD converter, including an AC/DC converter and a boost converter. The AC/DC converter is used to convert AC power generated by WHD to DC power, and the boost converter is applied for boosting the rectified voltage to the desired value. The WHD converter tracks the reference power from the coordinated controller through the primary control module, including an internal current control loop and an external power control loop. The reference output current is calculated by the reference power divided by the current terminal voltage of the WHD and the current error is obtained by comparing the actual current with the reference current. Furthermore, according to the current error, the proportional-integral (PI) controller is designed to obtain the pulse width modulation (PWM) signal of boost converter. Therefore, the PI controller signal is as follows:
where and are the proportional and integral parameters, respectively. , are the WHD voltage and current, respectively.
3.1.2. ES Primary Control
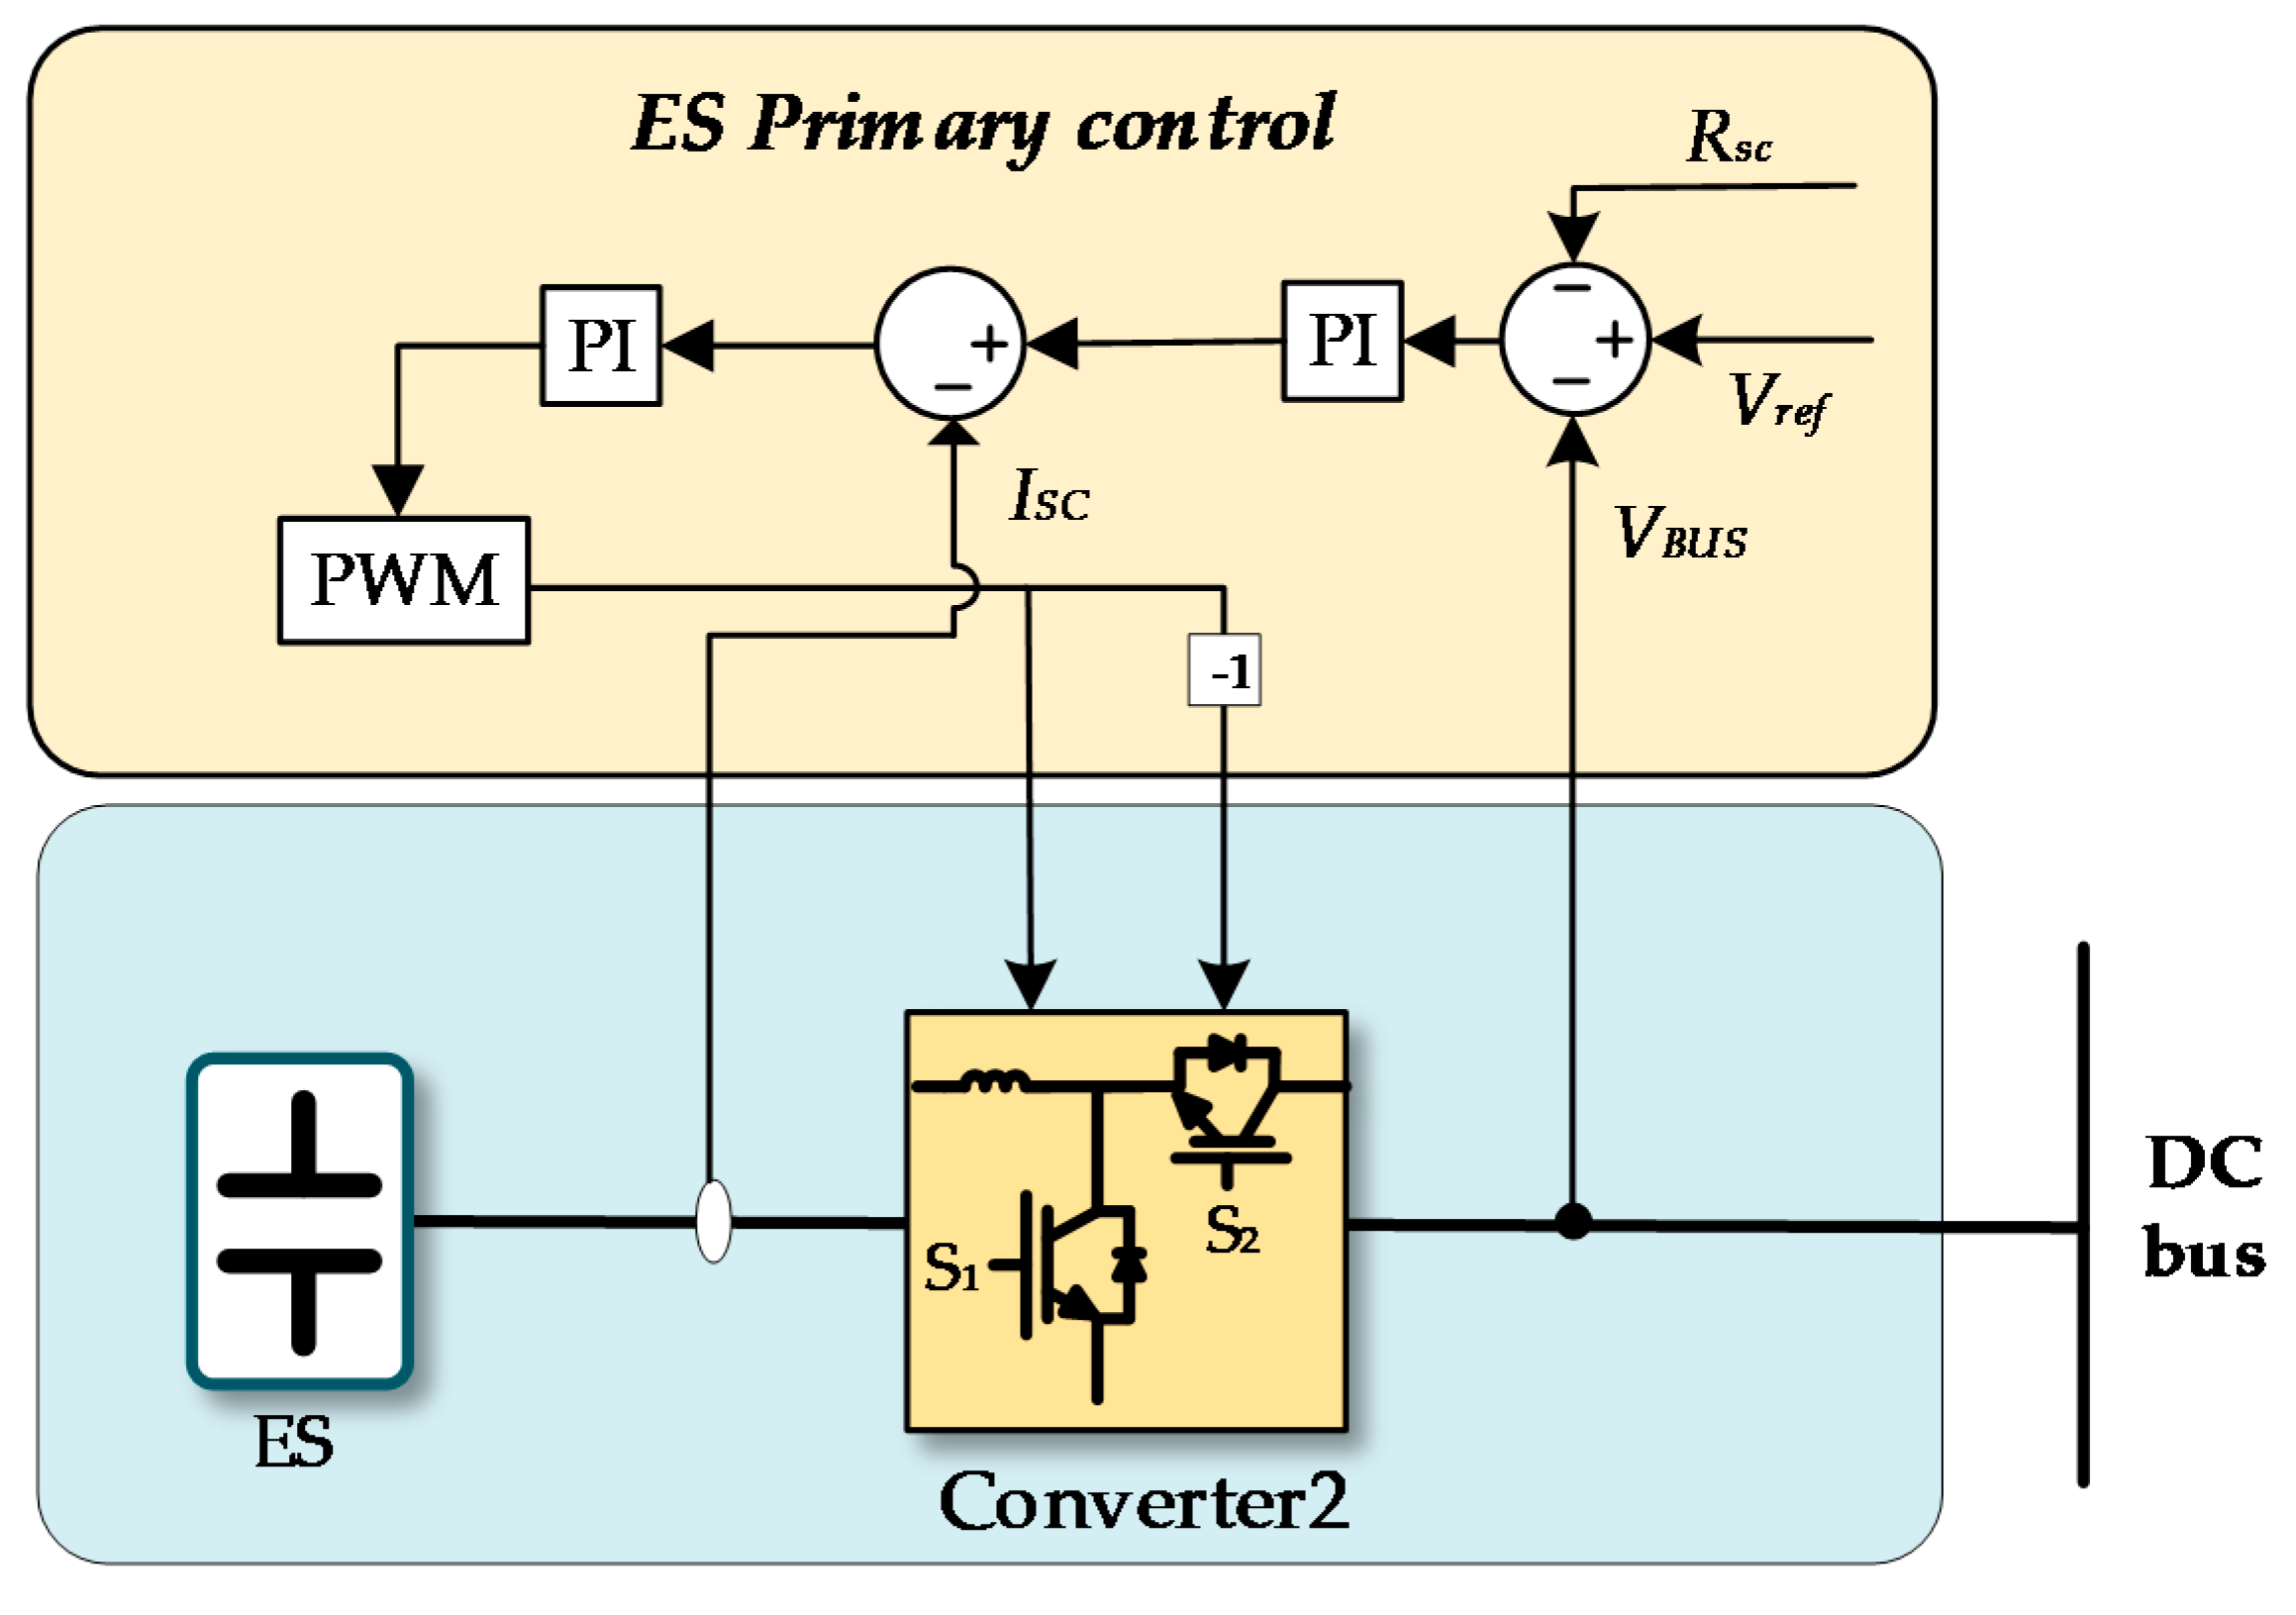
The primary control structure of ES is shown in Figure 4. The ES is connected to the DC bus by the ES converter based on a boost/buck converter, which is a bidirectional converter for boosting or bucking the rectified voltage to the desired value.
Similar to the WHD converter, the ES converter has a dual closed-loop control circuit composed of an internal current control loop and an external voltage control loop. The reference voltage signal is set based on the bus reference voltage, and the error between setting and feedback values is the input of the PI controller for compensating the internal current control loop. Then the ES current is measured and compared with the desired current given by the voltage control loop. The charge mode and the discharge mode are switched according to the positive and negative of the error value. If the error value is positive, the bidirectional converter is switched to the boost mode, which is ES discharge. Otherwise, the bidirectional converter runs in the buck mode. The voltage loop control value is calculated as follows:
where and are the proportional and integral parameters, and is the reference of ES power allocation calculated by the compensation controller. are the bus reference voltage and bus actual voltage, respectively.
The current loop control law is formulated as:
where and are the proportional and integral parameters, and are the reference ES current calculated by the voltage loop and the ES actual current, respectively.
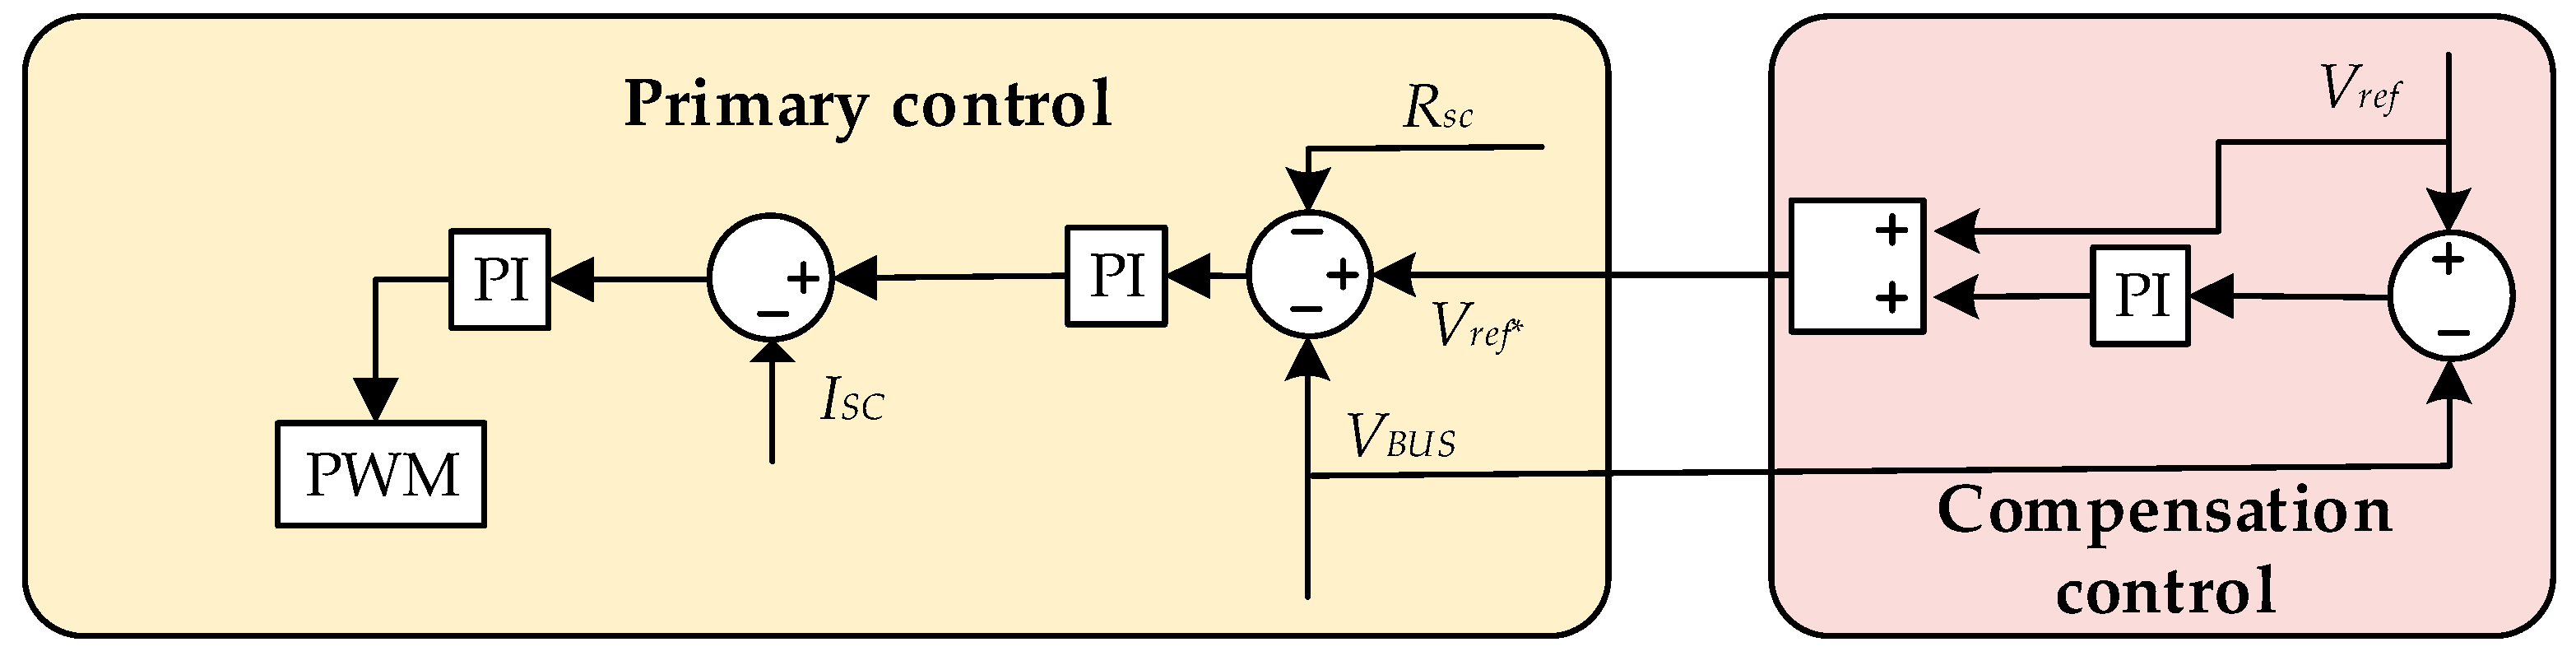
3.1.3. Compensation Control
When the primary control ensures the equalization of the current distribution of each WEC, it causes the DC bus voltage to decrease. By employing a compensation controller, the DC bus voltage is quickly recovered to the reference value.
As shown in Figure 5, the expected voltage of the bus is compared with the actual bus voltage, and then the error is as the input of the PI controller for the voltage compensation. Finally, replaces to be the new reference voltage in order that the voltage is recovered to the reference value. The voltage compensation control and new reference voltage are followed as:
where and are the proportional and integral parameters in the compensation controller, respectively.
3.2. Power Dispatch Based on Advection Algorithm
To satisfy the power supply requirements, the sum power of the WECs array is the same as the load power. The initial power command can be dispatched as follows:
where and are the initial power assignment command for each WEC, the total reference power, and the WECs number, respectively. Moreover, the vector is defined as . In the following sections, represents the component of .
Hence is equal to , and in Equation (6), then Equation (6) can be rewritten as:
where , and . denote the 1 norm and absolute value, respectively. From Equation (12), it can be known that the final power dispatch of each WEC is based on the right zero space of .
The state unbalance degree depicts the imbalance state of the i-th WEC, , including the SOC of ES and the power-harvesting level of WHD. The state unbalance degree can be written as:
where is the energy condition of the WEC , and denote the current power-harvesting level of WHD and the SOC of ES in WEC , respectively. is the unbalance gain parameters. The larger gain value leads to the larger power dispatch rate.
The diagonal matrix is established through the state unbalance degree, as:
Let , then we have , and can be written as:
Let be equal to in Equation (4), according to Equation (15), then the dynamic power dispatch procedure of WEC of the WECs array can be formulated as:
According to Equation (12), Equation (15) can be derived as:
From Equation (17), it can be seen that each WEC obtained the reference output power dispatched through the distributed power dispatch algorithm as Equation (16), according to the current power-harvesting level of WHD and the SOC of ES.
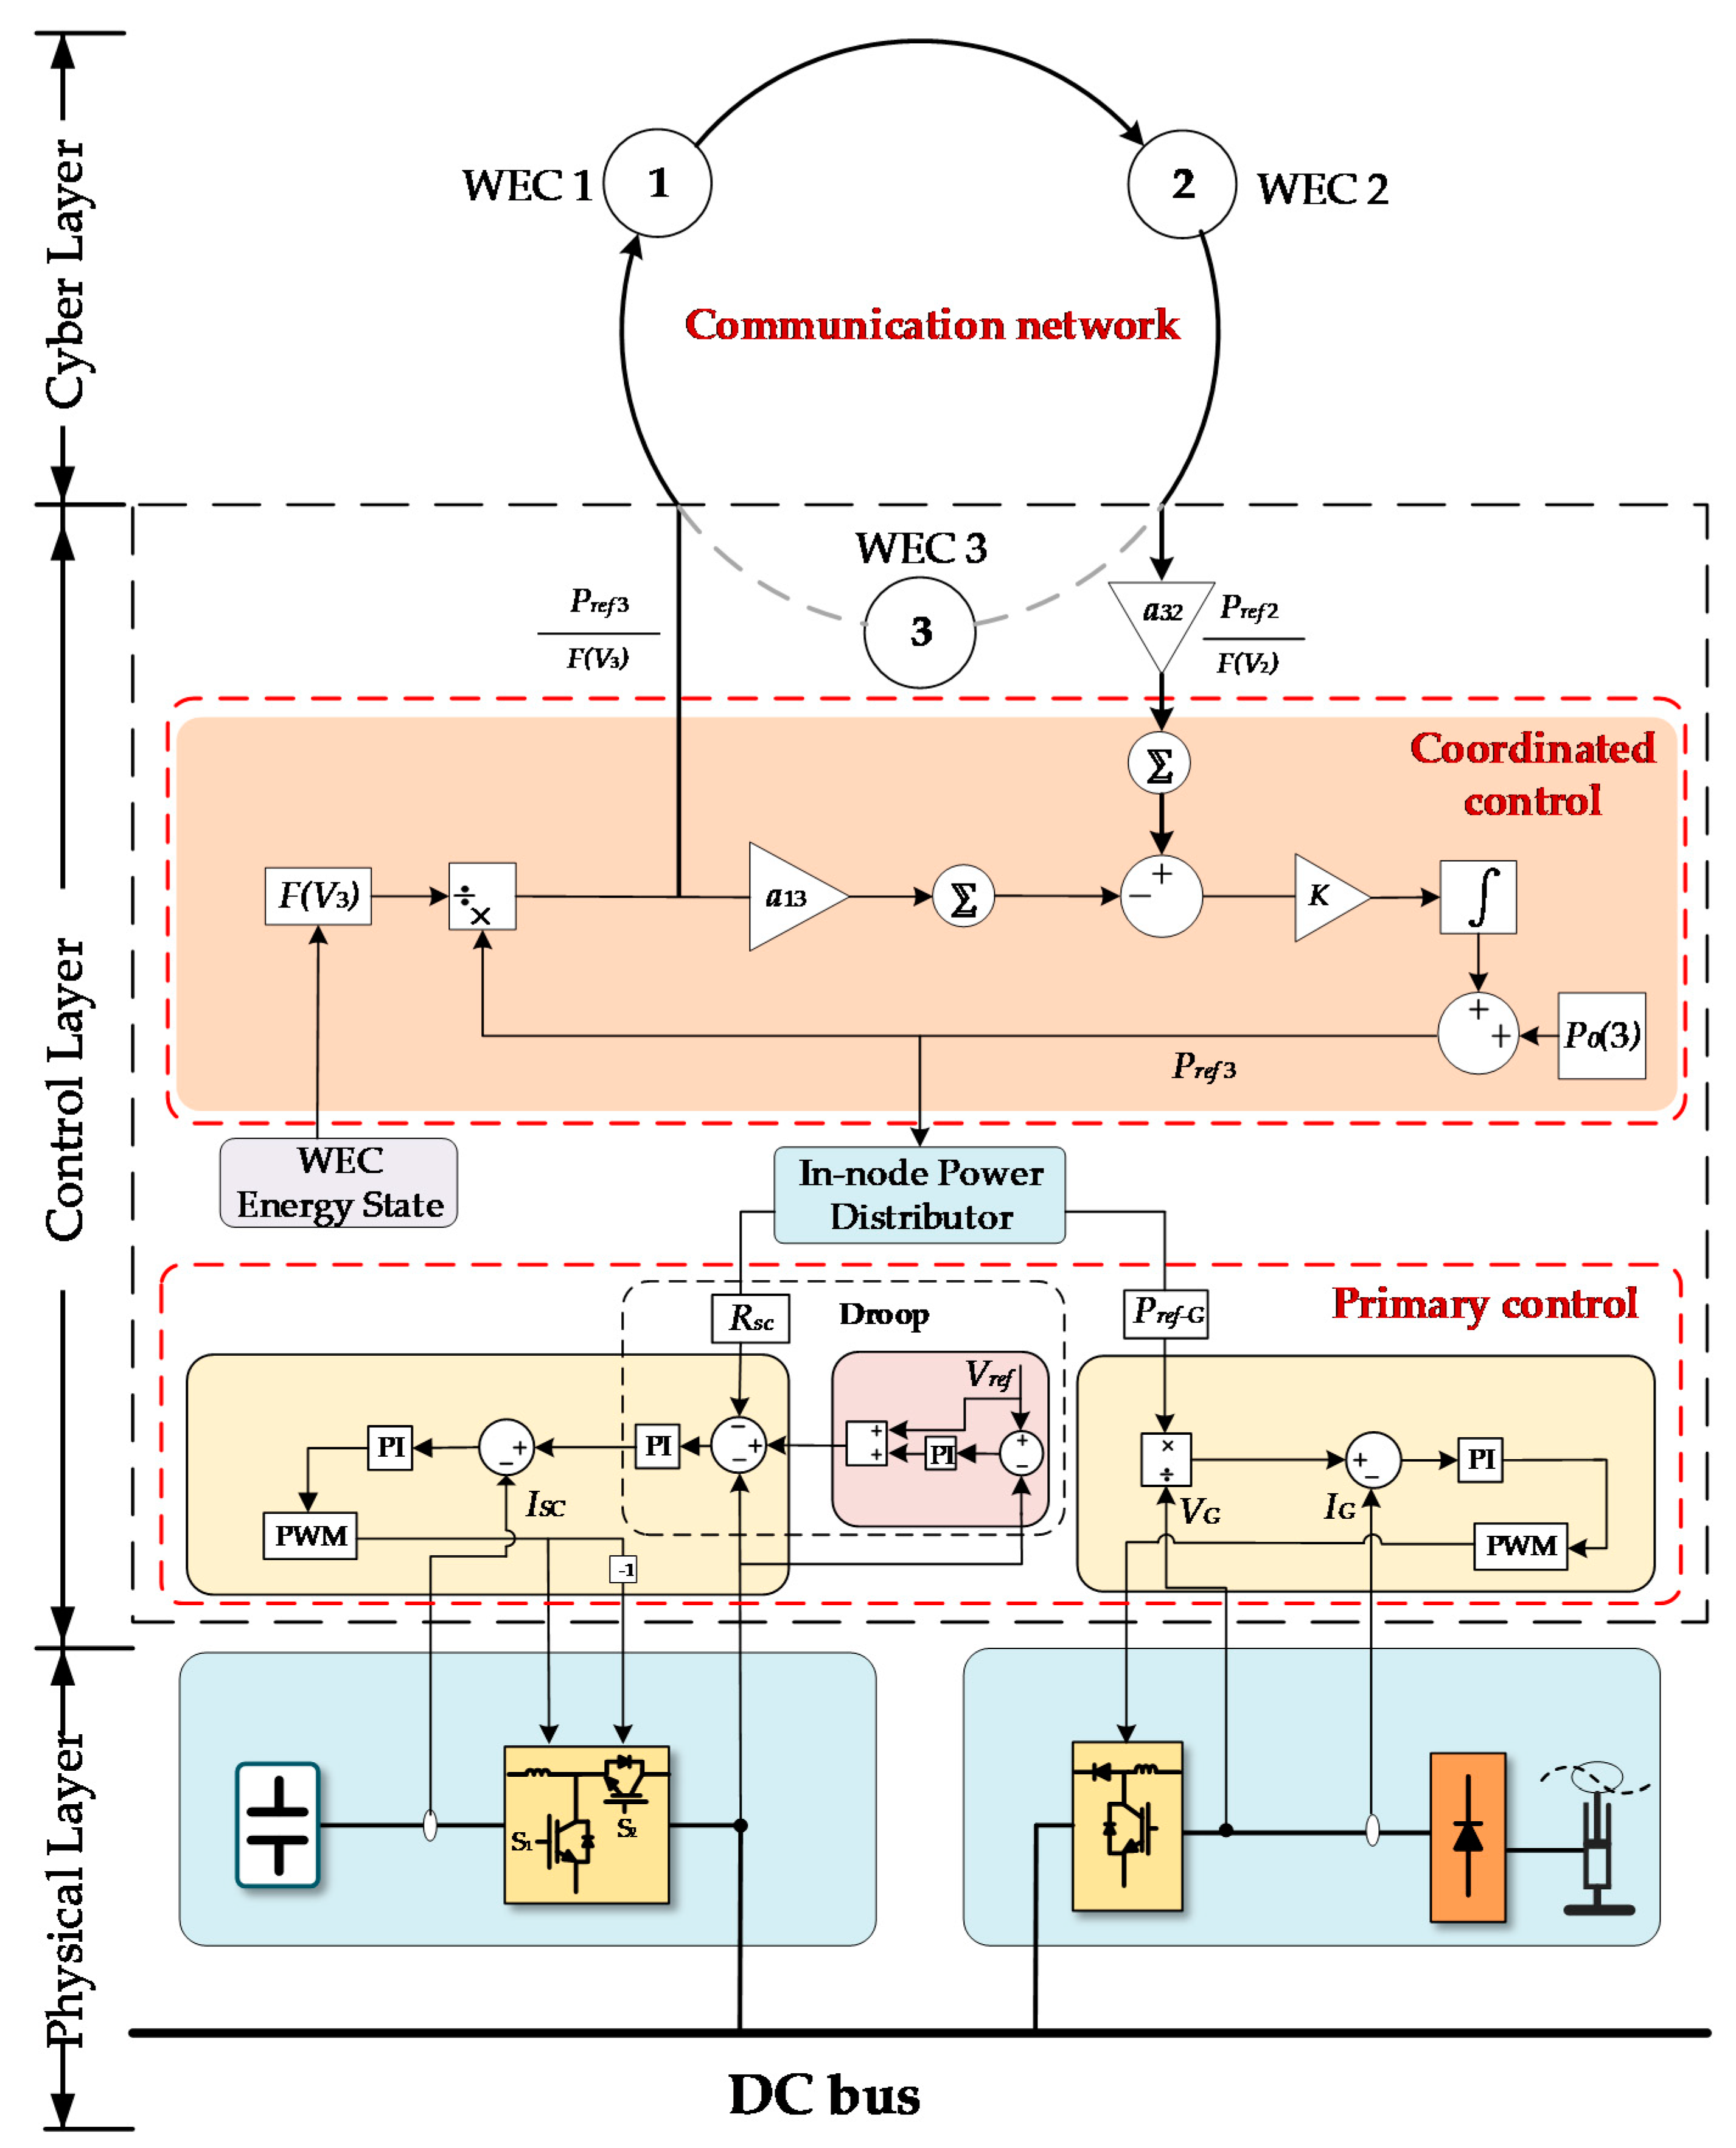
The system framework of the WEC array is illustrated in Figure 6. The WEC array includes the physical layer, the control layer, and the cyber layer. The physical layer is composed of the actual physical device including multiple WEC units, the bus, and the load, etc. The control layer consists of the primary control and coordinated control. The coordinated control is the upper control in order that each WEC can cooperatively provide electrical supply through the information network topology of the WECs array. Based on the state information transmitted from neighboring WECs and local state measurements, each WEC can obtain its current reference output power. The primary control is the underlying control, which ensures the WEC output power to track the reference output. The in-node power distributor is the interface between coordinated control and lower layer control, which assign to WEC according to a specific conversion relationship and ratio. The cyber layer is the communication network topology of the WECs array for exchanging the state information among all WECs.
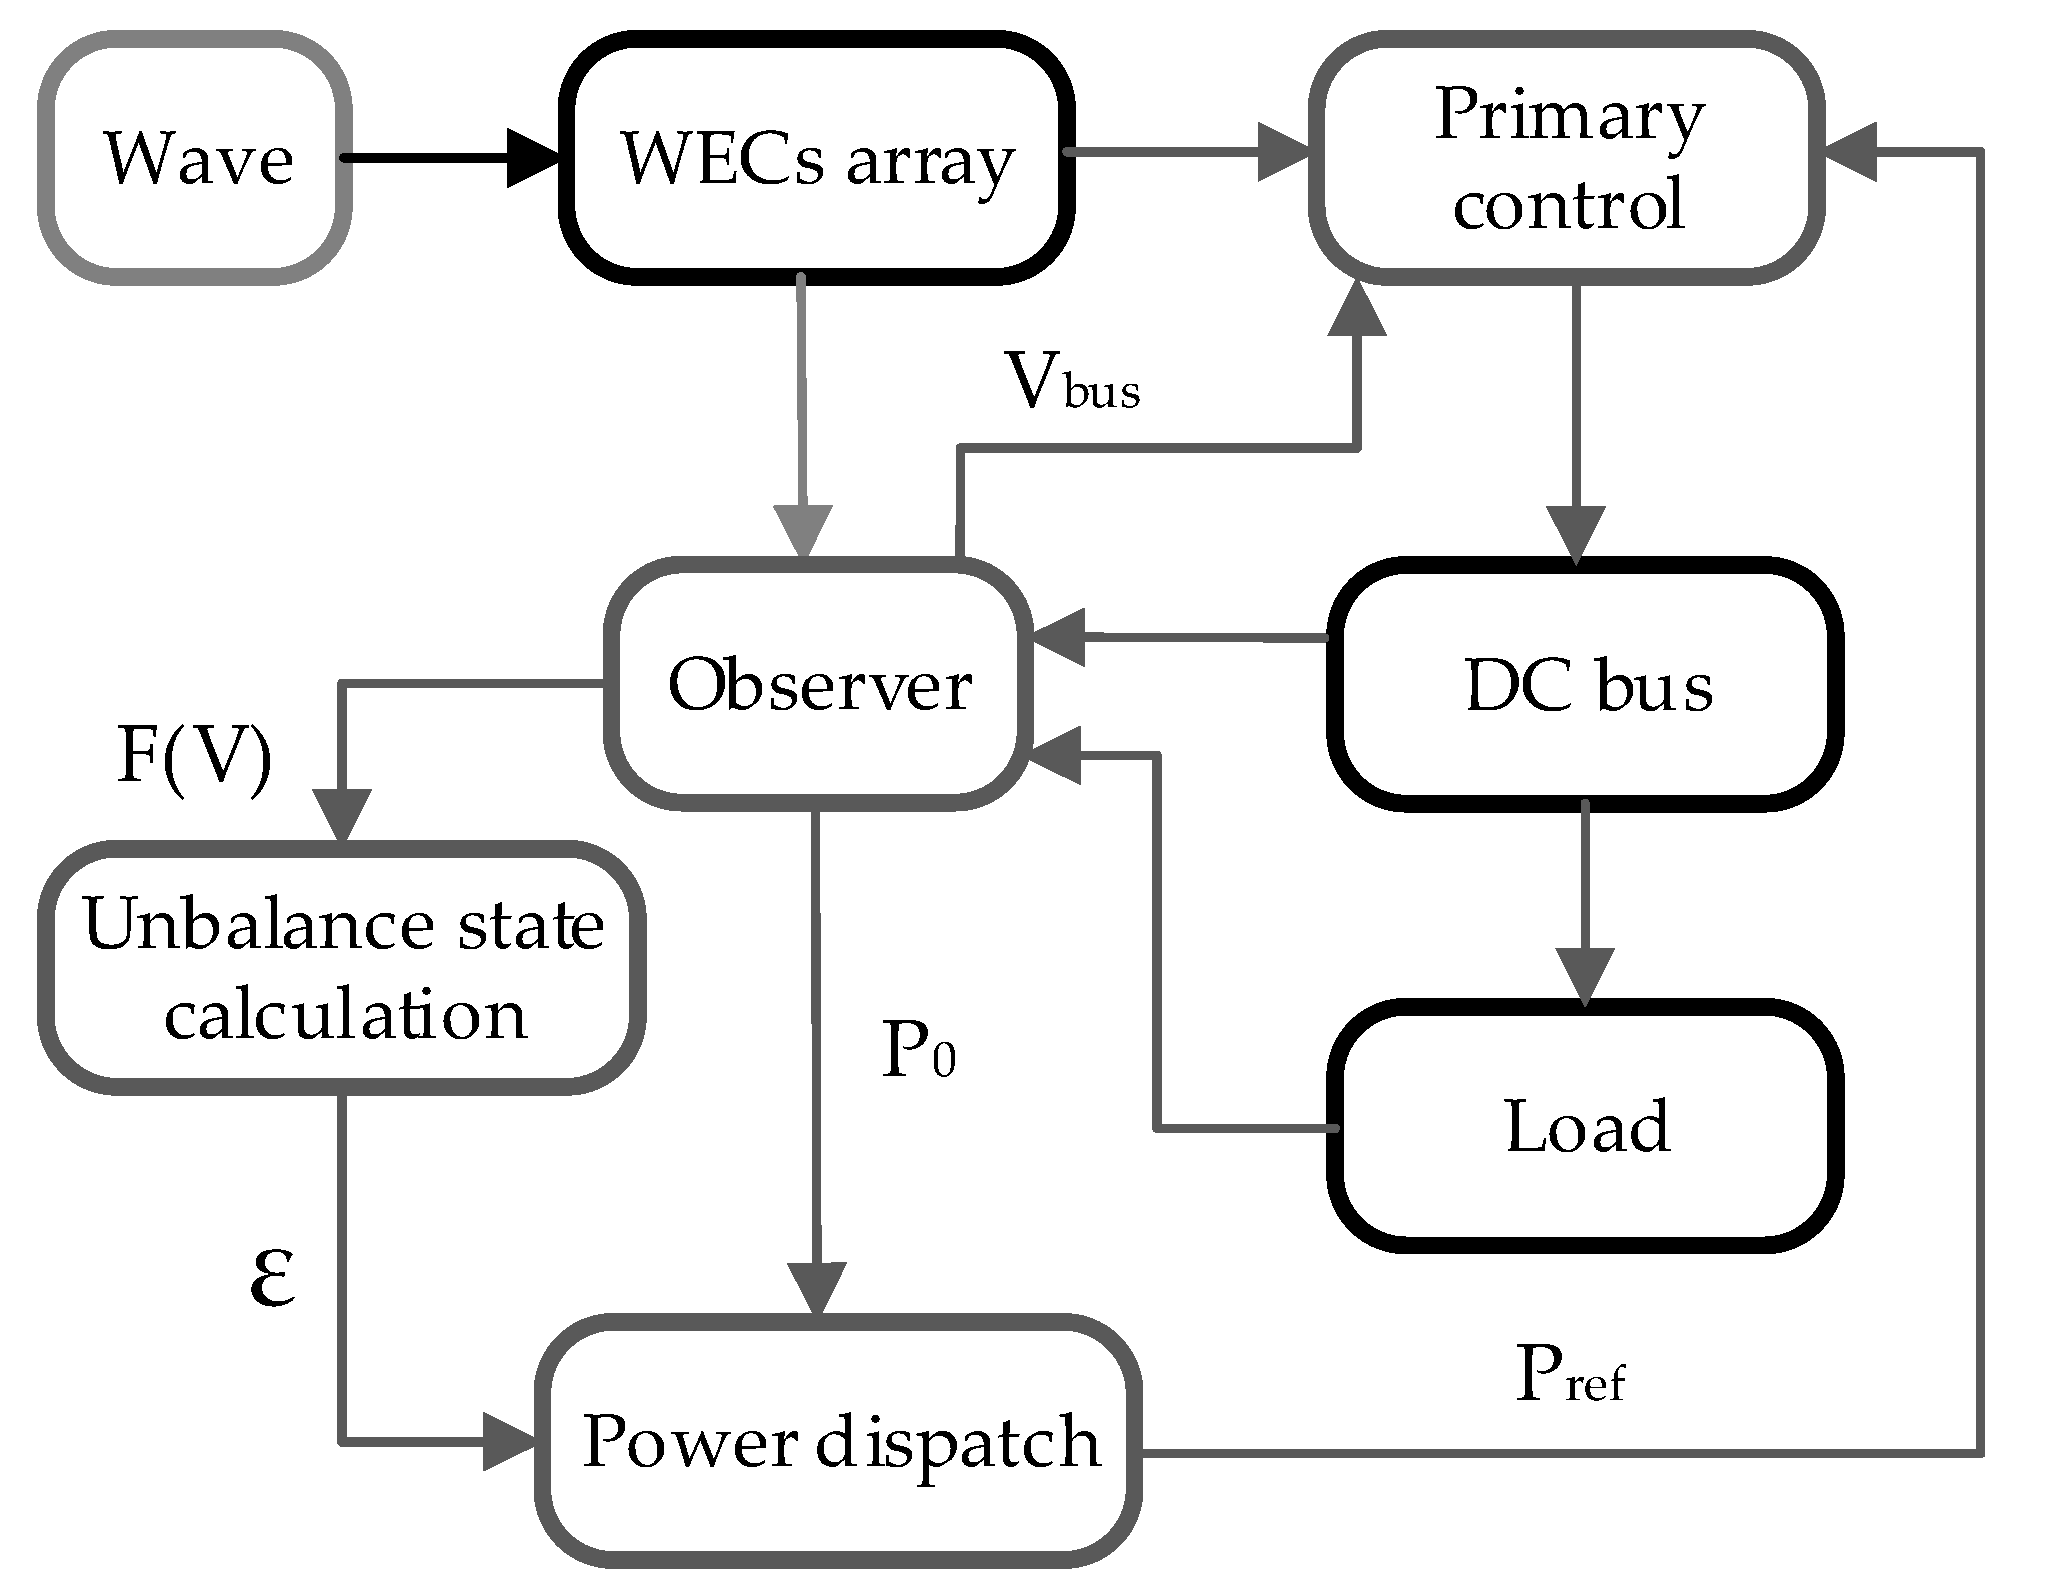
The power dispatch procedure of the WECs array is shown in Figure 7.
4. Simulation and Experiment Analysis
To validate the proposed control algorithm, several test cases are analyzed via simulations and experiment.
4.1. Simulation Setup
MATLAB/Simulink simulation is designed and performed to evaluate the proposed control method based on a DC microgrid formed by an array of three WECs. Based on the system structure illustrated in Figure 2, is specified as
Five tests are implemented to verify the effect of the mentioned methods. The common parameters of simulation tests are indicated in Table 1. Specific parameters of each test are shown in Table 2, Table 3 and Table 4. At the beginning of the several simulations, the buoy motion and the energy conversion are demonstrated. The performance of the compensation controller is shown in Test 1. Then, from Tests 2–4, the situation of different initial WHDs or ESs states are applied to demonstrate the control effects of each WEC’s energy through the advection-based algorithm. In Test 5, the convergence rate of the system is considered and analyzed.
4.2. Simulation Results
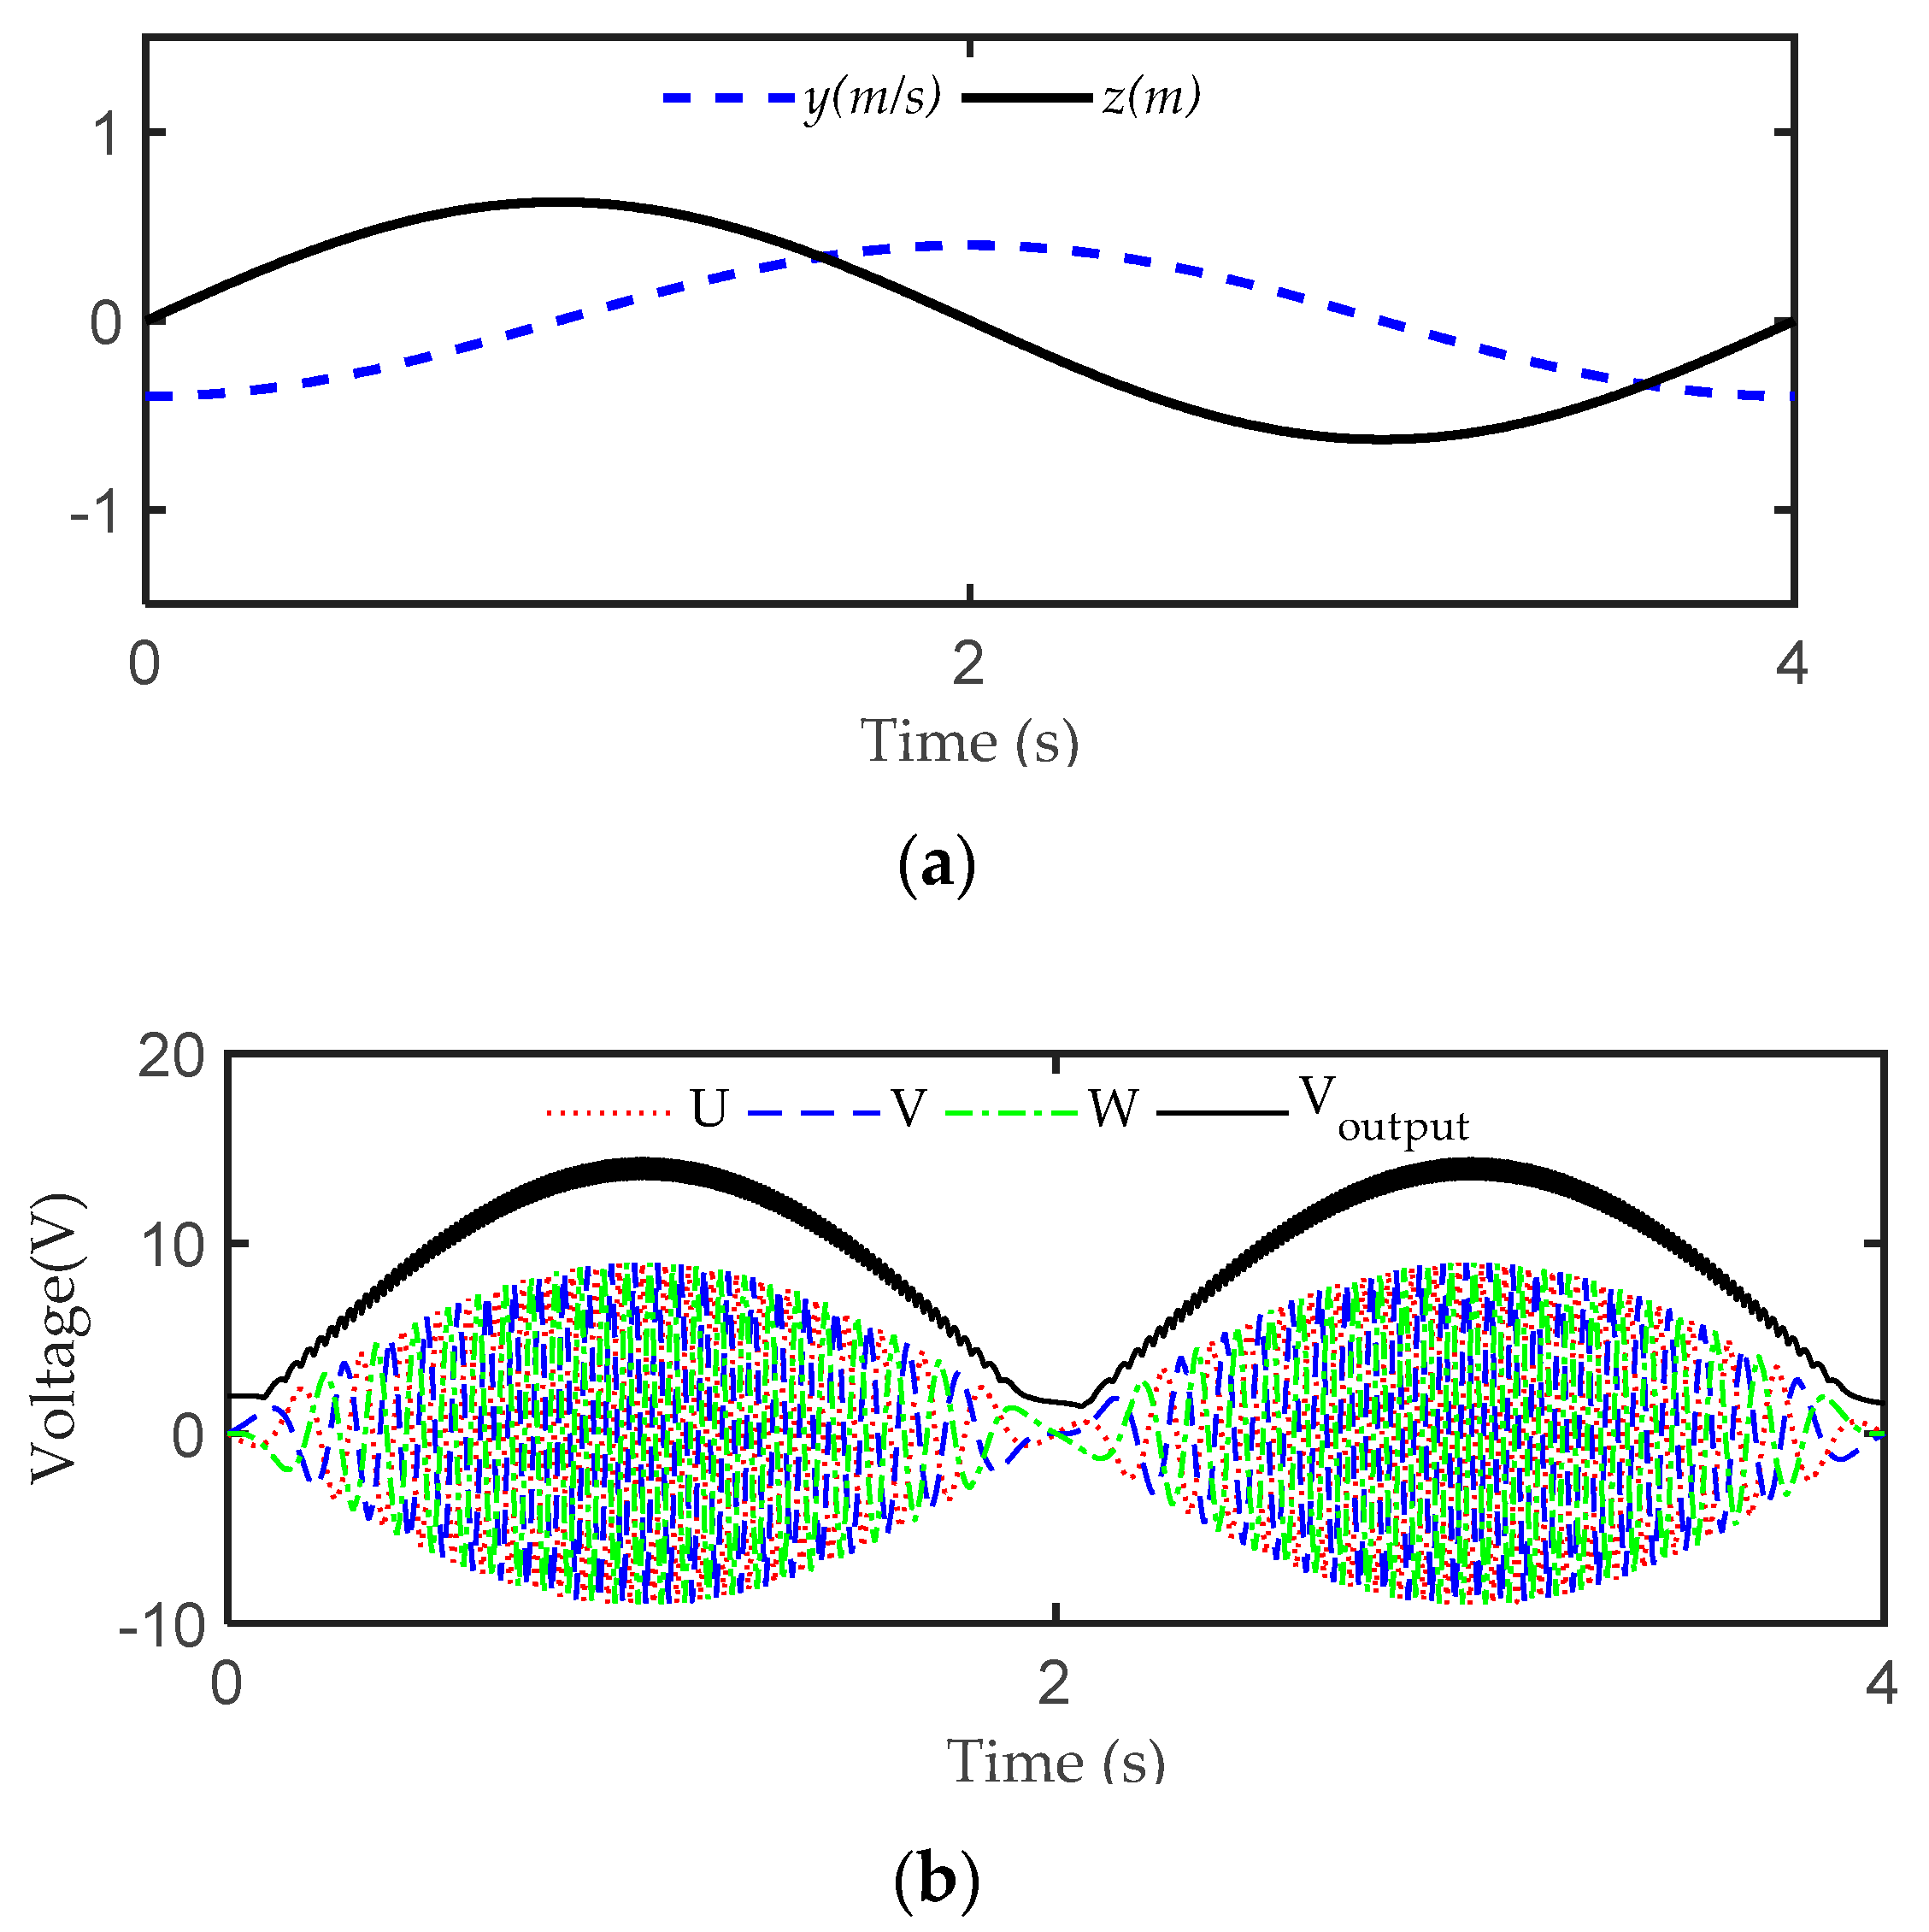
First, Each WEC energy-harvesting process from wave energy to electrical energy is simulated. The linear permanent magnet generator (LPMG) model proposed in [20] is applied to simulate buoy motion and power harvesting. The position and speed of the translator are the input of the LPMG (WHD) harvesting energy and transporting energy to the converter. In this paper, the buoy motion speed is equal to the speed of the WHD translator because the buoy and the translator are assumed to be inelastic and invisibly connected. The broken line of Figure 8a indicates the motion position of the buoy and translator and the solid line demonstrates the motion speed of the buoy and translator. Figure 8b shows the terminal voltage output of the WHD without the load, including the change of the three-phase UVW voltage and output voltage after treatment of rectification. The amplitude and frequency of the three-phase voltage with the speed of the buoy can be seen.
4.2.1. WECs with Compensation Controller
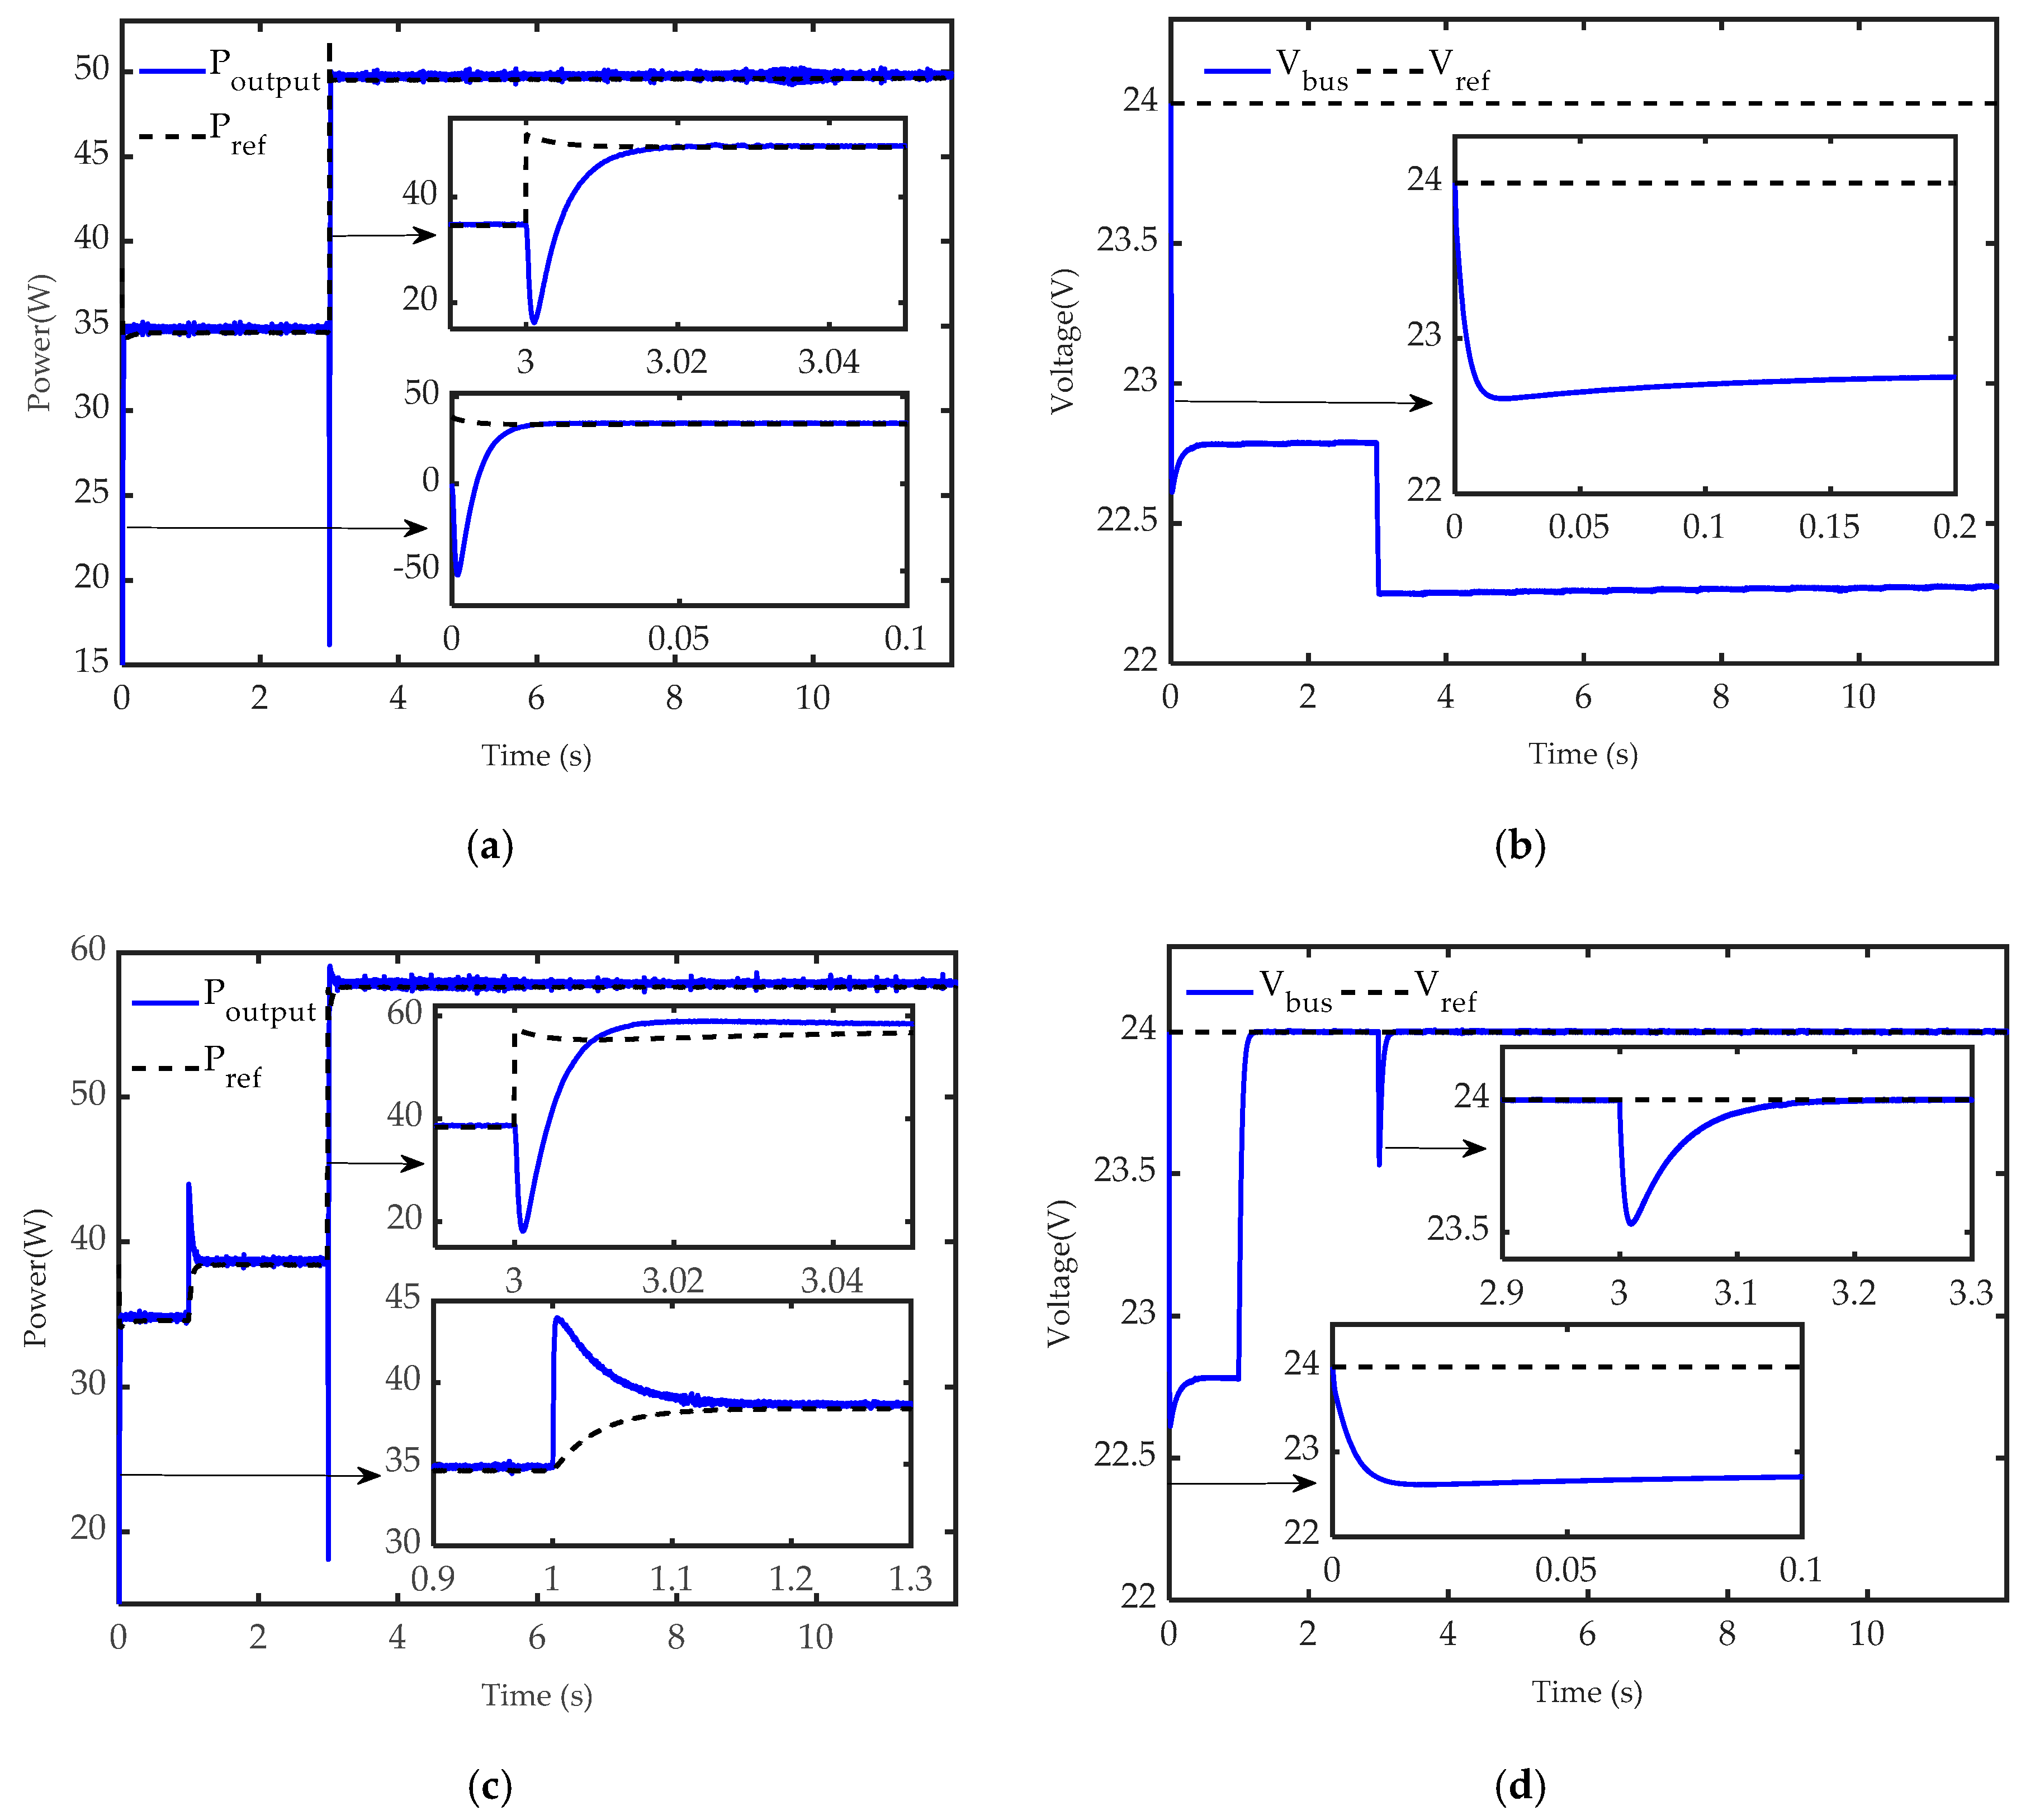
In this test, the compensation controller is applied to improve the control performance of WEC. The initial parameters of each WEC are shown in Table 2. Moreover, the compensation controller is mainly used to track precisely the expected bus voltage and power. In the first case, the compensation controller is not employed to the WEC in the simulation. The output power of the WEC array and actual power demand of the load are shown in Figure 9a, and the results show the load demand can always be satisfied at 3 s. Figure 9b illustrates that the deviation between the supplied voltage and the reference load voltage is not eliminated. In the second case, the compensation controller is used at 1 s. Figure 9c shows that the WECs array system power increases due to the increase of each WEC output voltage by the effect of the compensation controller. It can be seen that the compensation controller improves the performance of the WEC array. As shown in Figure 9d, the voltage deviation is eliminated immediately.
4.2.2. WECs with Different Initial SOC
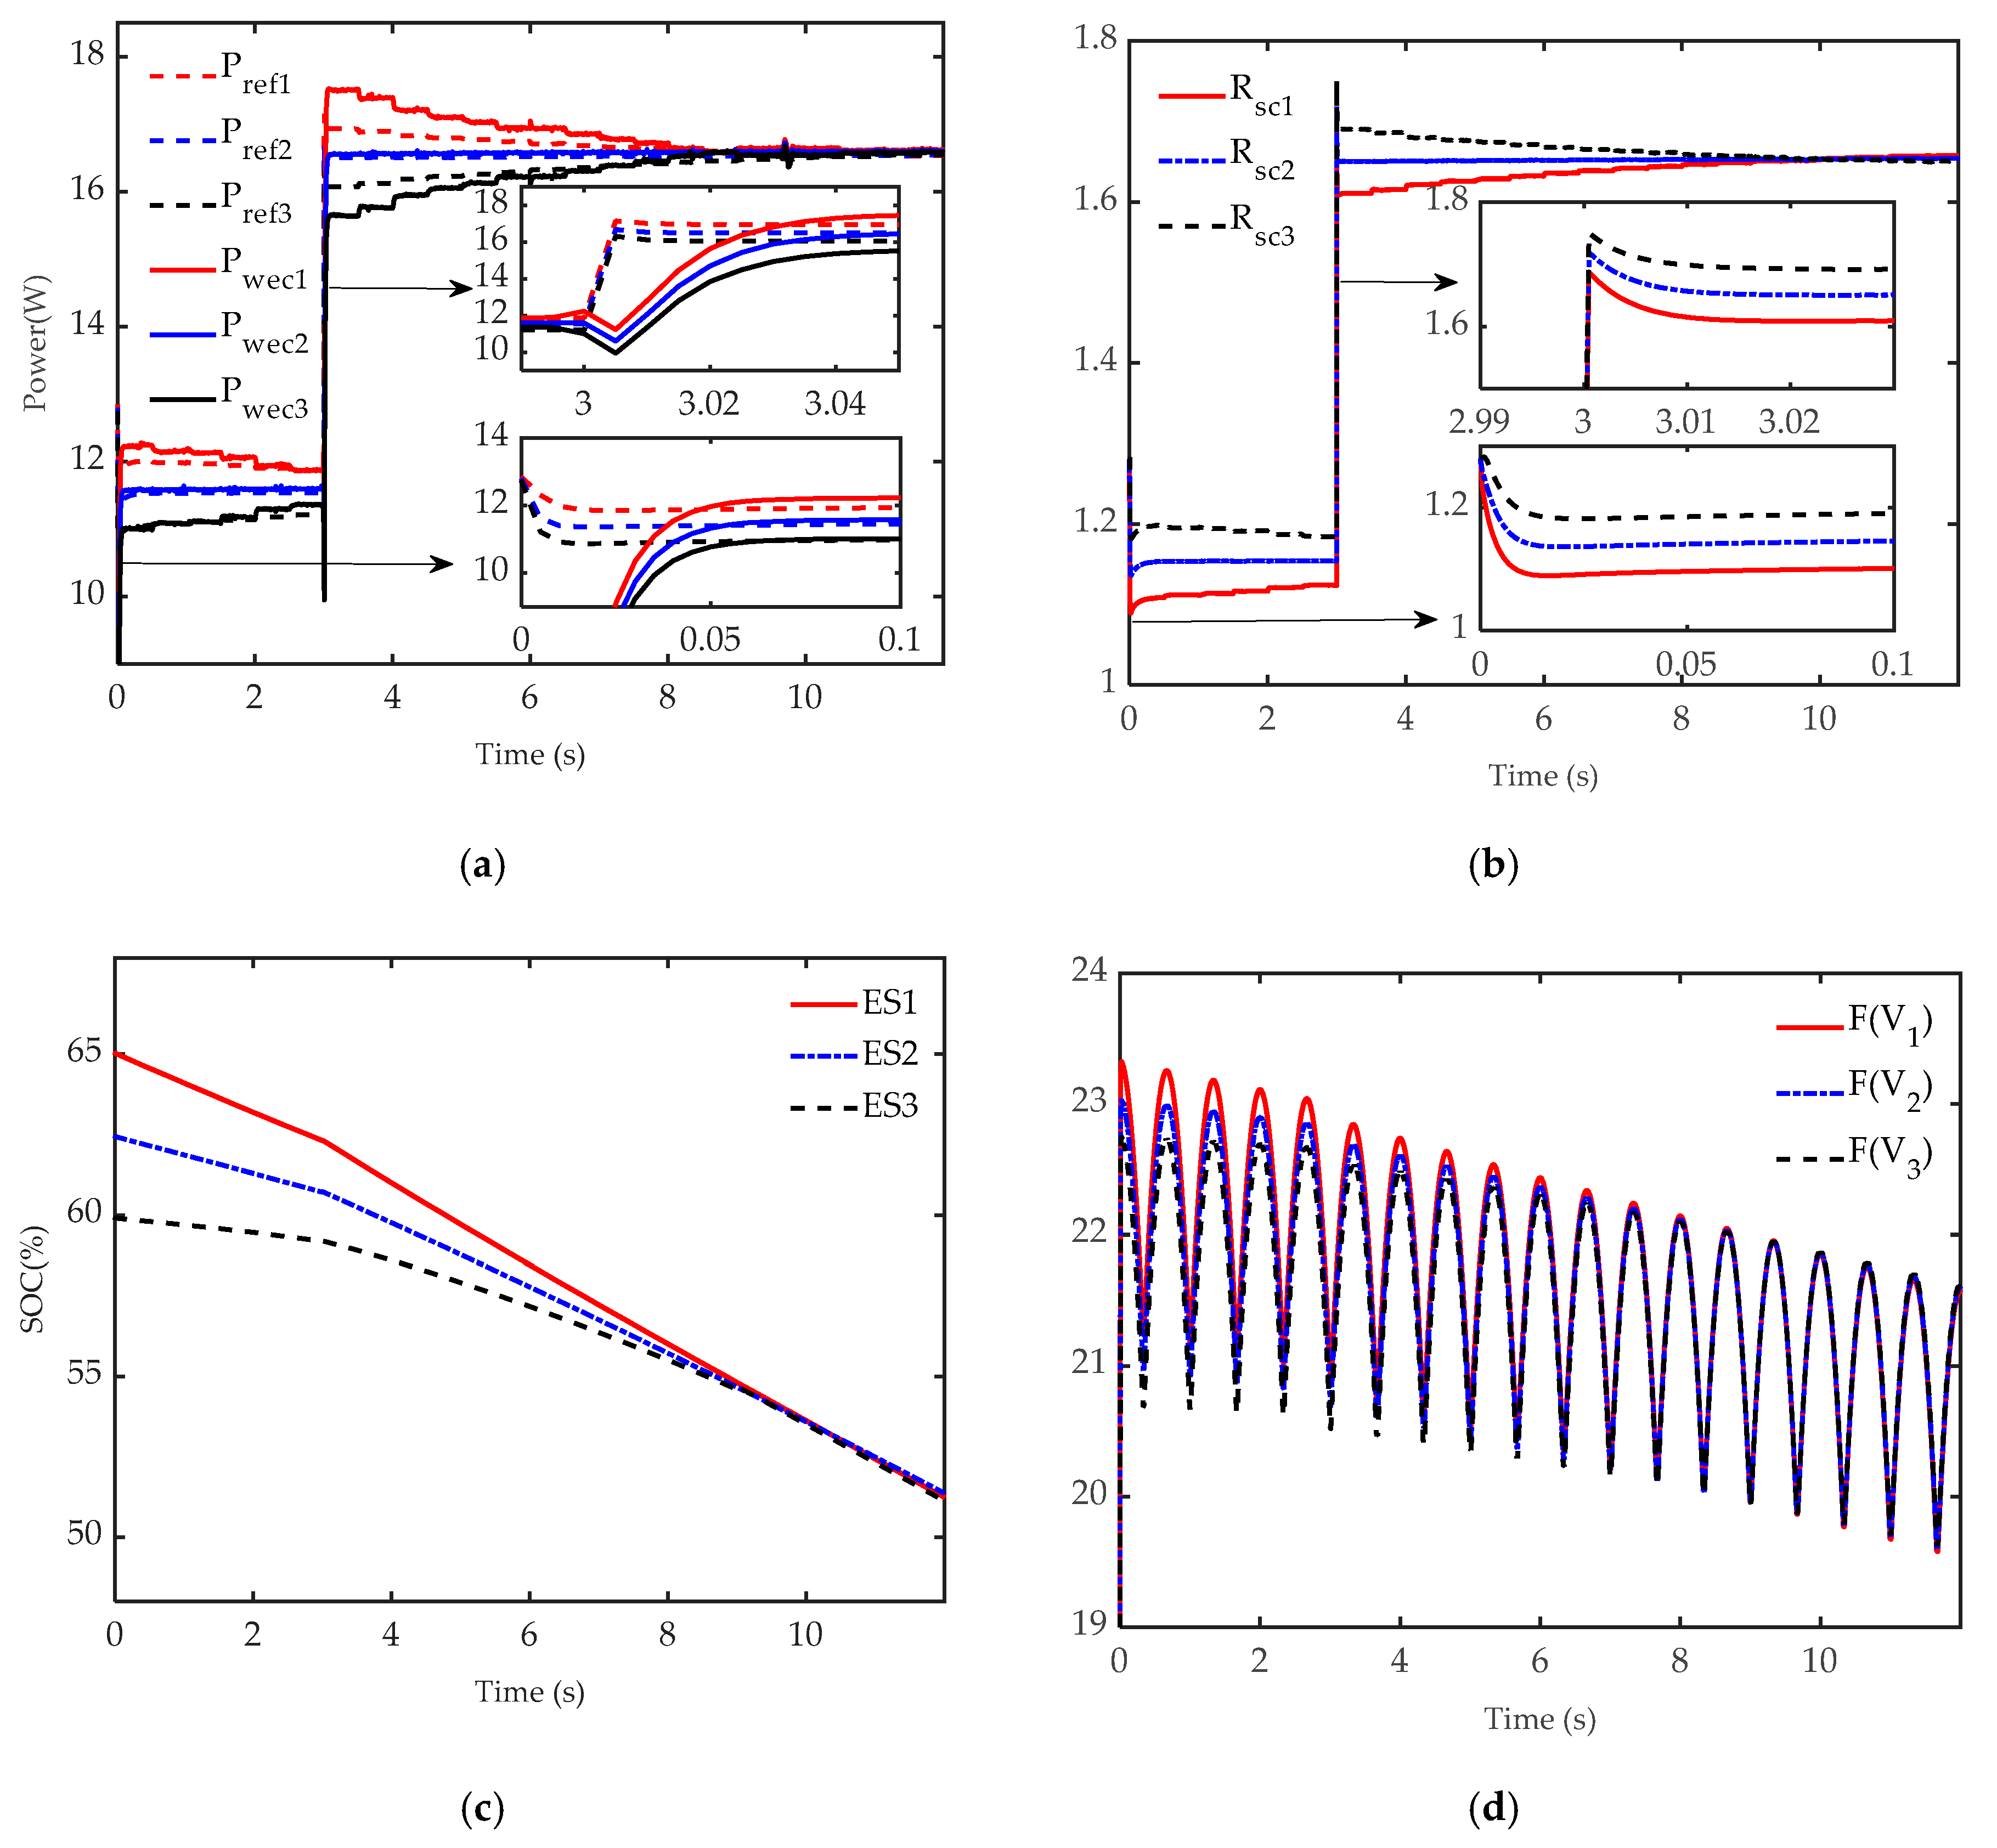
In this test, each WEC has the same WHD output and different initial SOC of ES, and its initial parameters are shown in Table 2. The bus power and voltage are illustrated in Figure 9. The performance of each WEC with different initial SOC is depicted in Figure 10. In Figure 10a, the reference output powers (broken lines) calculated by the coordinated controller can be tracked by the actual output powers (solid lines) of each WEC. When the load requirement suddenly increases at 3 s, the reference power changes accordingly. Figure 10b,c show that the larger output power is dispatched to the ES with higher SOC, and the power distribution ratio and SOC of each ES in each WEC converge to the same value at 9 s simultaneously. In Figure 10d, the WEC integral energy states trend to consistent at about 9 s.
4.2.3. WECs with Different Initial WHD Output
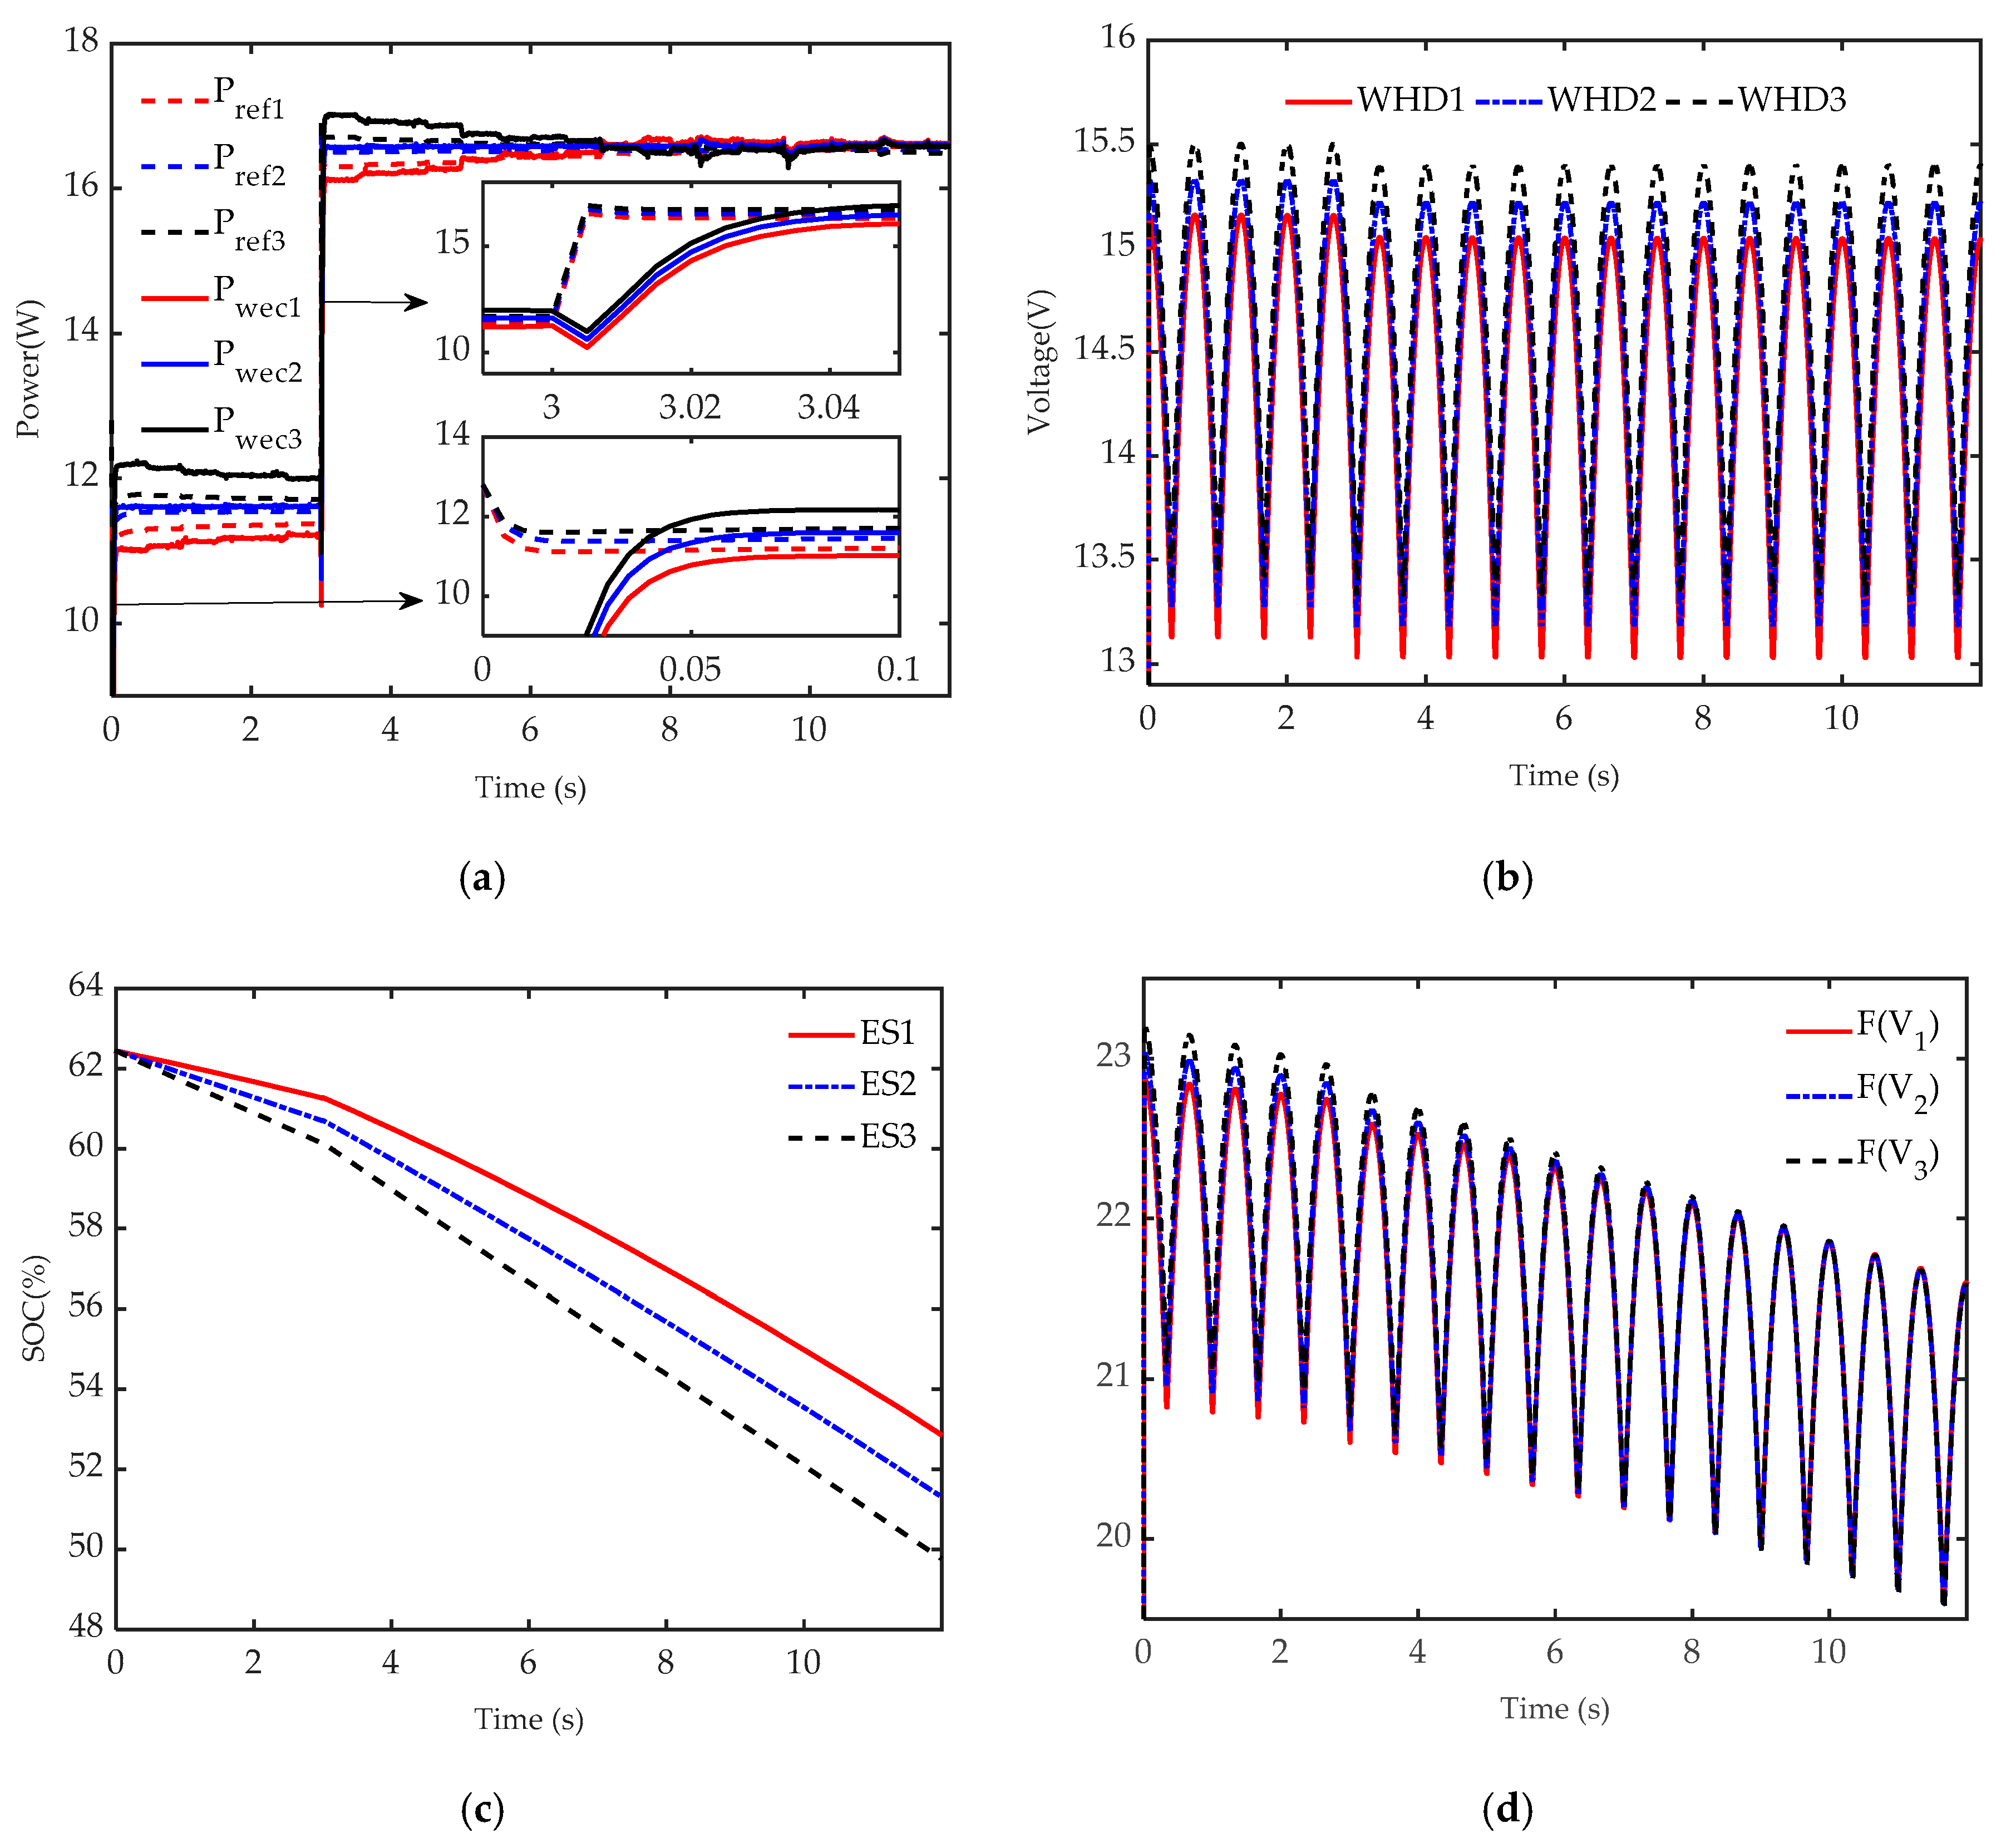
In this test, each WEC has a different WHD output and has the same initial SOC of ES. The initial parameters are given in Table 3. In Figure 11a, the performance of each WEC tracking the reference output powers is maintained in the WECs array. Figure 11b shows that the output voltage of each WHD keeps periodical variation, and reveals the steady diversity at the peak position. Figure 11c shows that the SOC values of the 3 ESs decrease and diverge simultaneously. Figure 11d illustrates that the WEC integral energy states trend to consistent at about 9 s.
4.2.4. WECs with Different Initial WHD Output and SOC
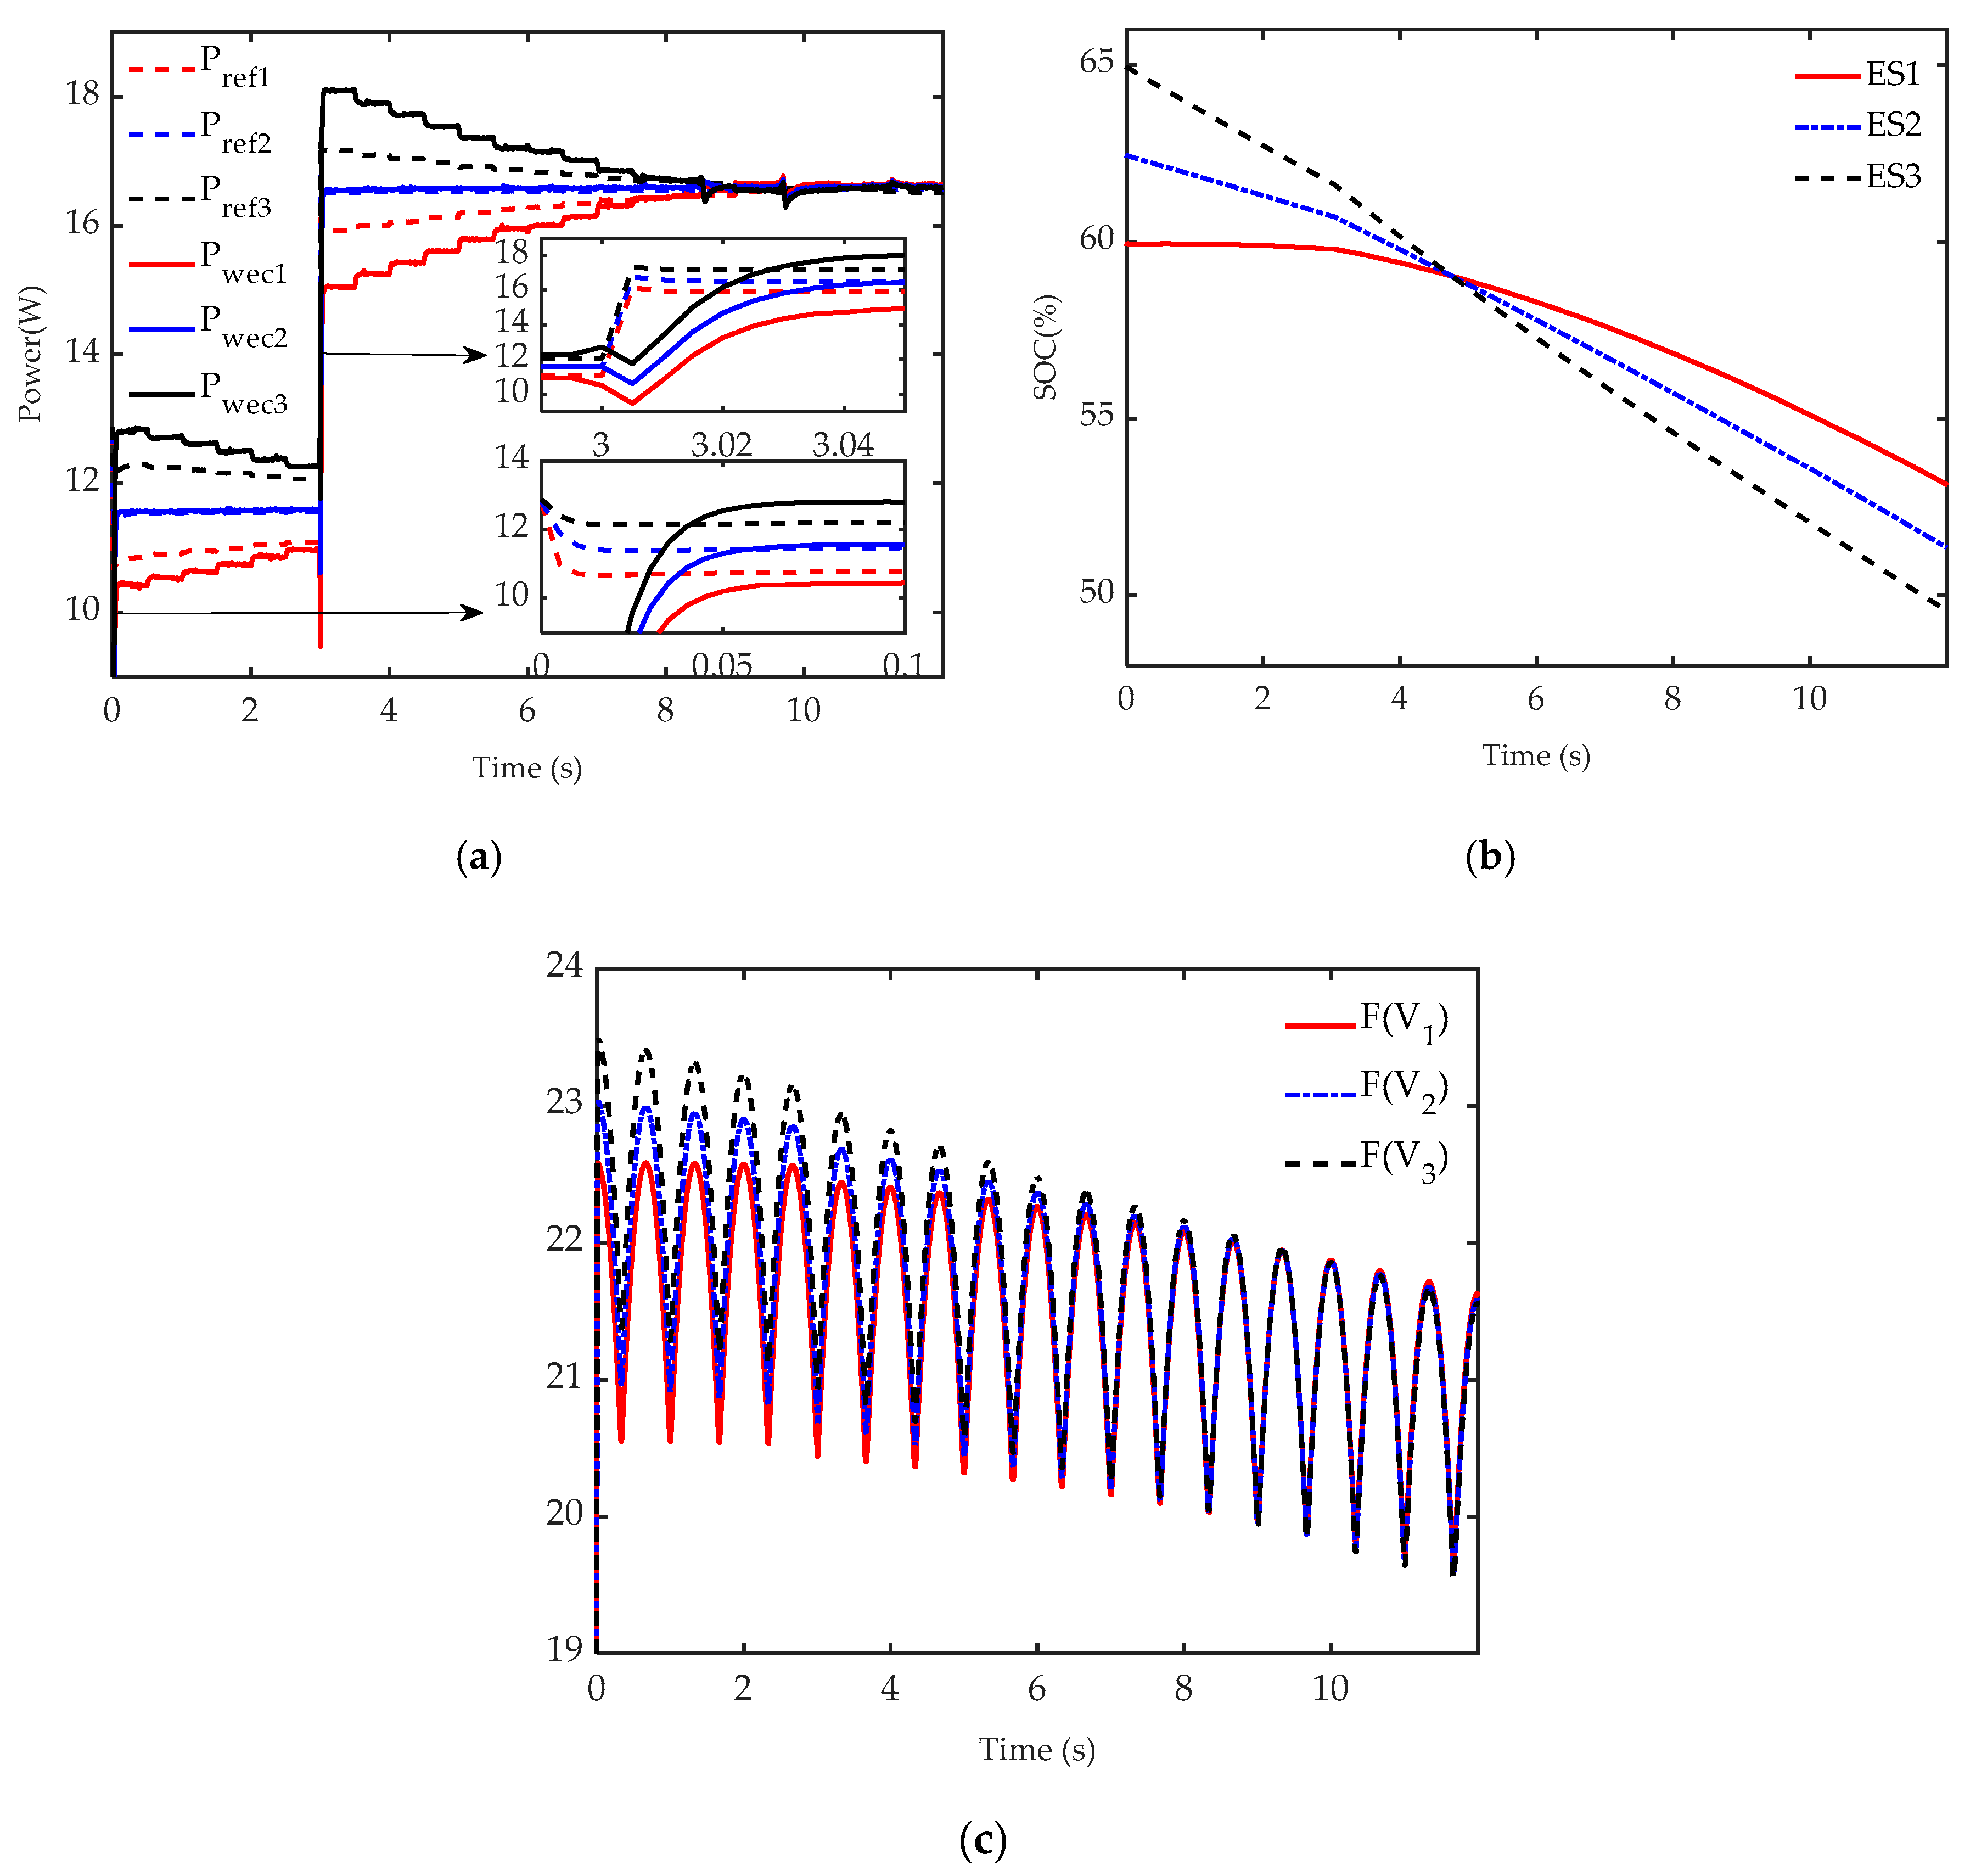
In this test, both WHD output and initial SOC of ES are different in each WEC. Table 4 shows the initial parameters of each WEC. As shown in Figure 12a–c, WEC 1 has the most significant initial output. As a result, the SOC of ES in WEC1 falls with the fastest rate. Figure 12b shows that the three SOC curves intersect and then separate, and in Figure 12c is consistent finally.
4.2.5. Convergence Rate
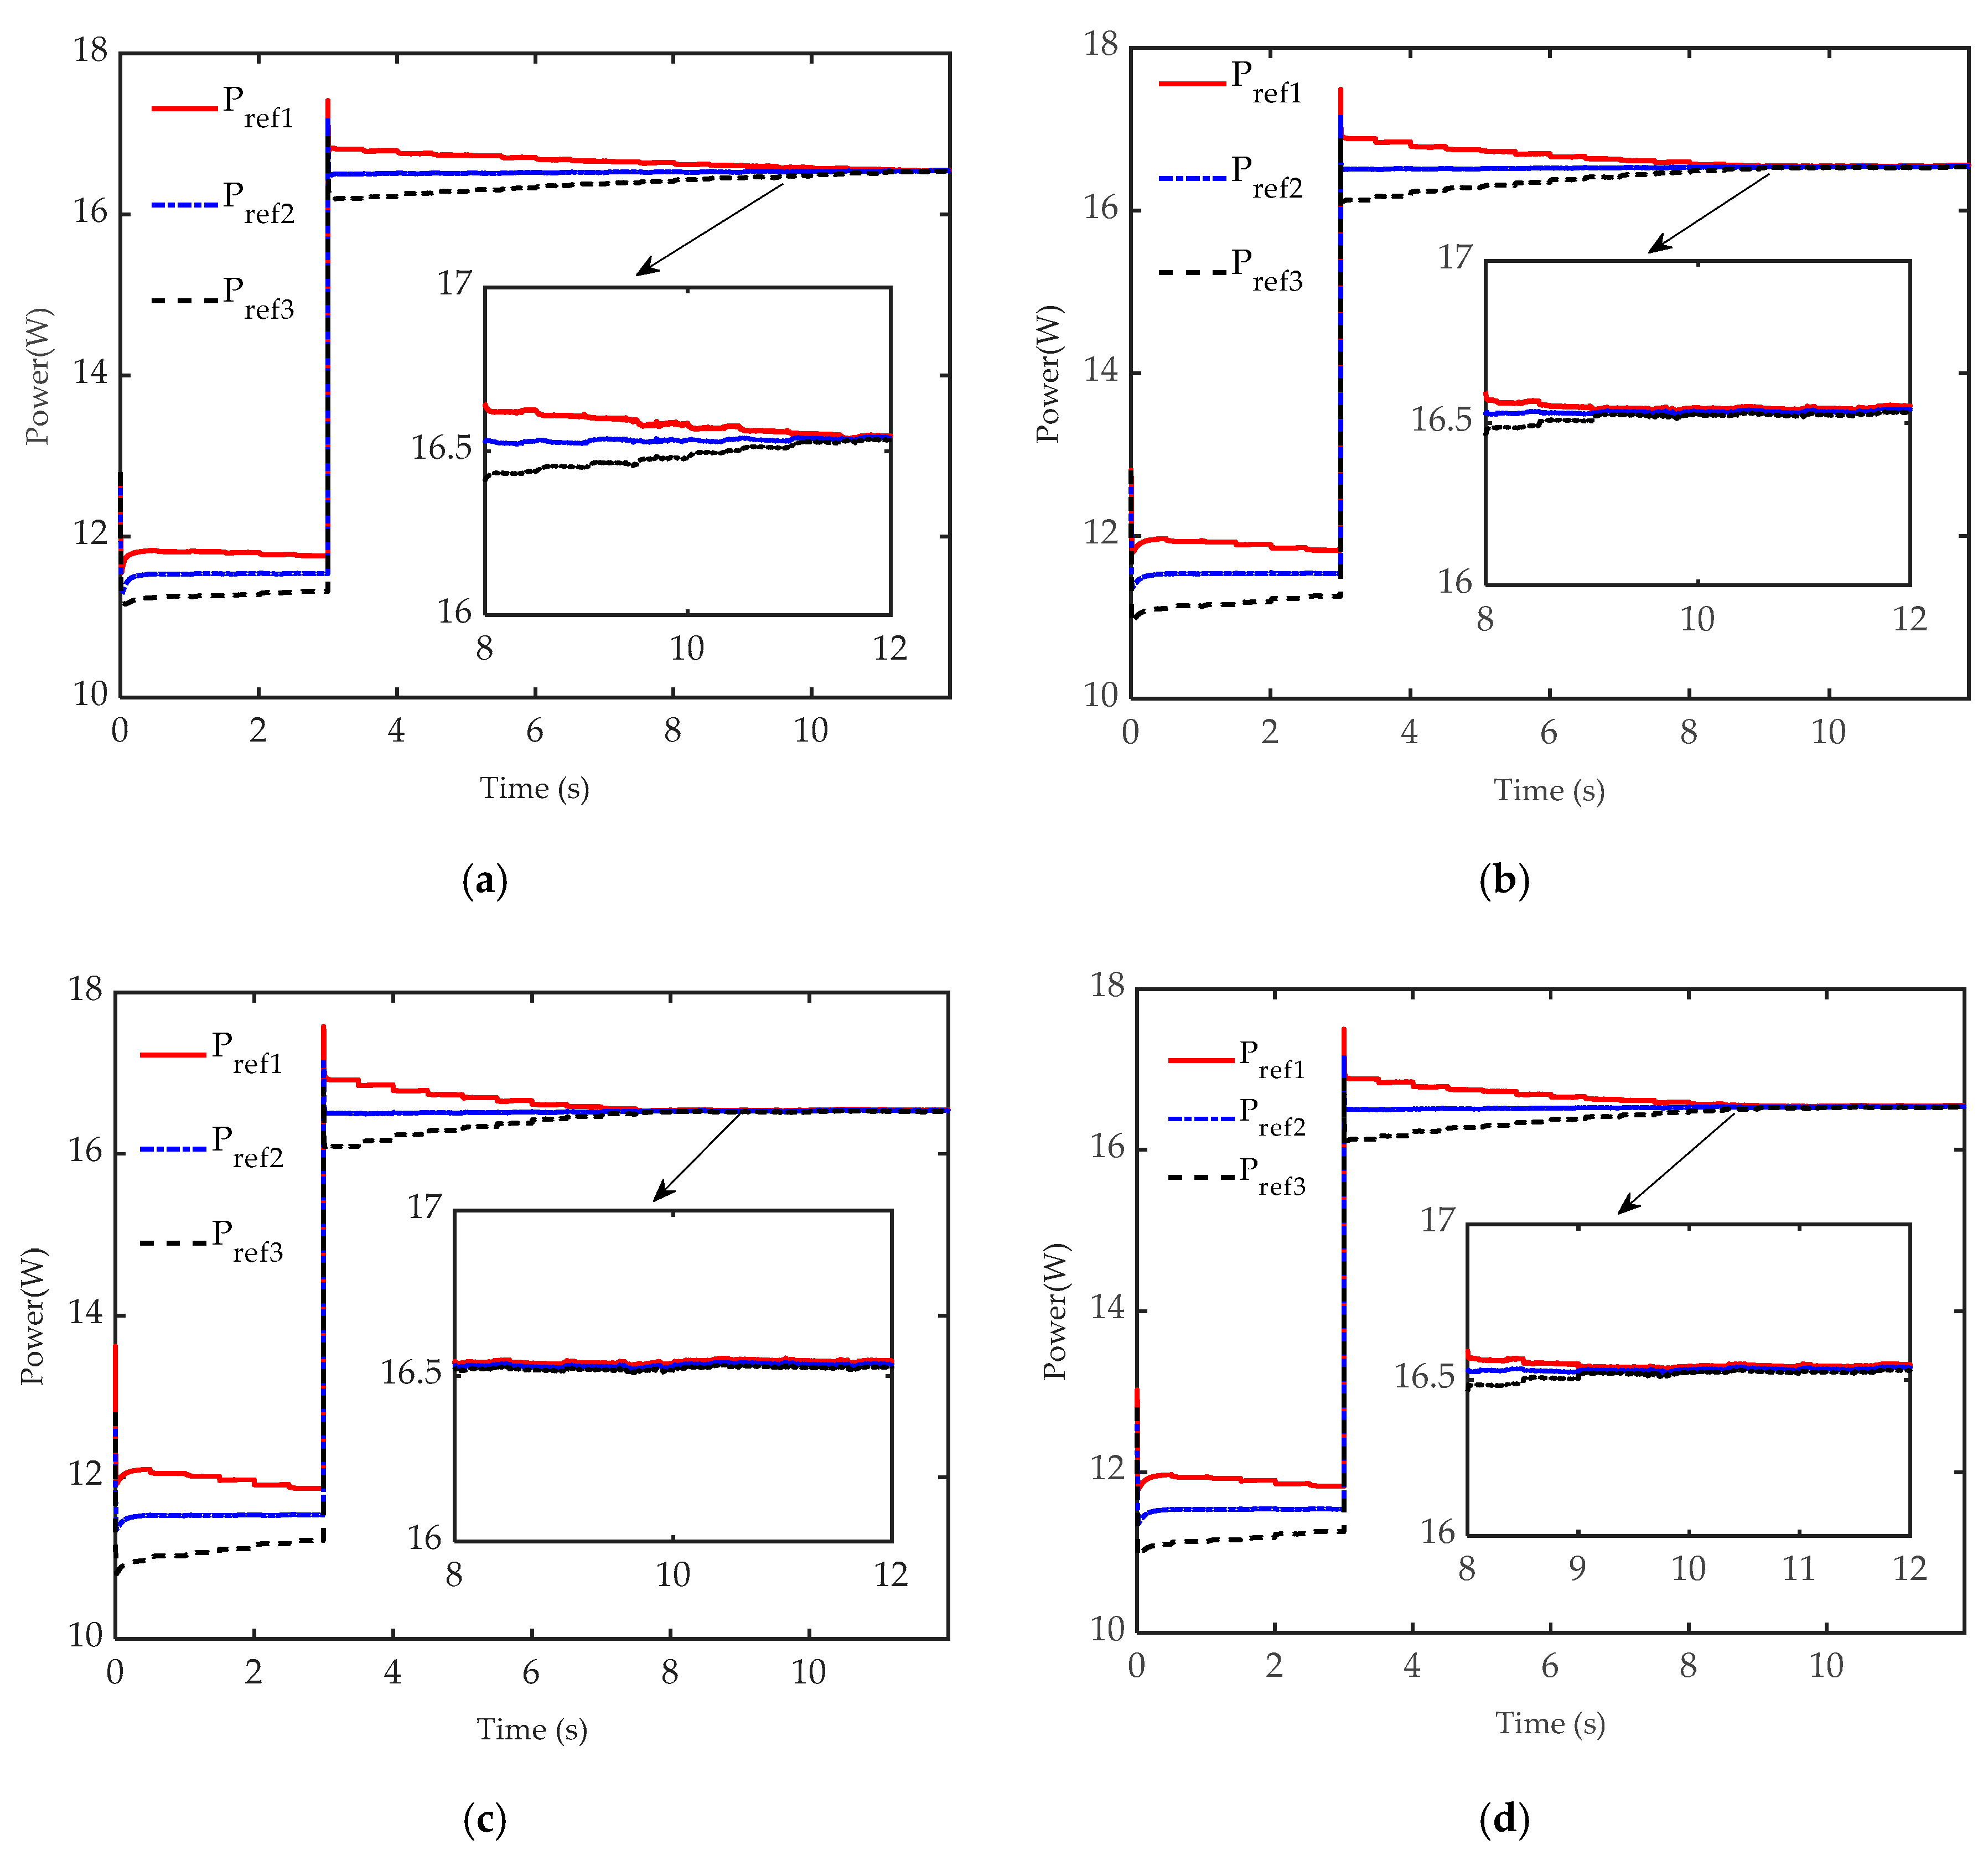
In this test, the parameters are adjusted to analyze the effect on the convergence rate of the WECs array. The initial parameters are same as Test 2 except or . In Figure 13b,c the reference outputs become consistent before 9 s, and the results shows that the larger the parameter value, the faster the convergence rate in Figure 13a. Figure 13d illustrates that K does not influence the convergence rate.
4.3. Experimental Setup
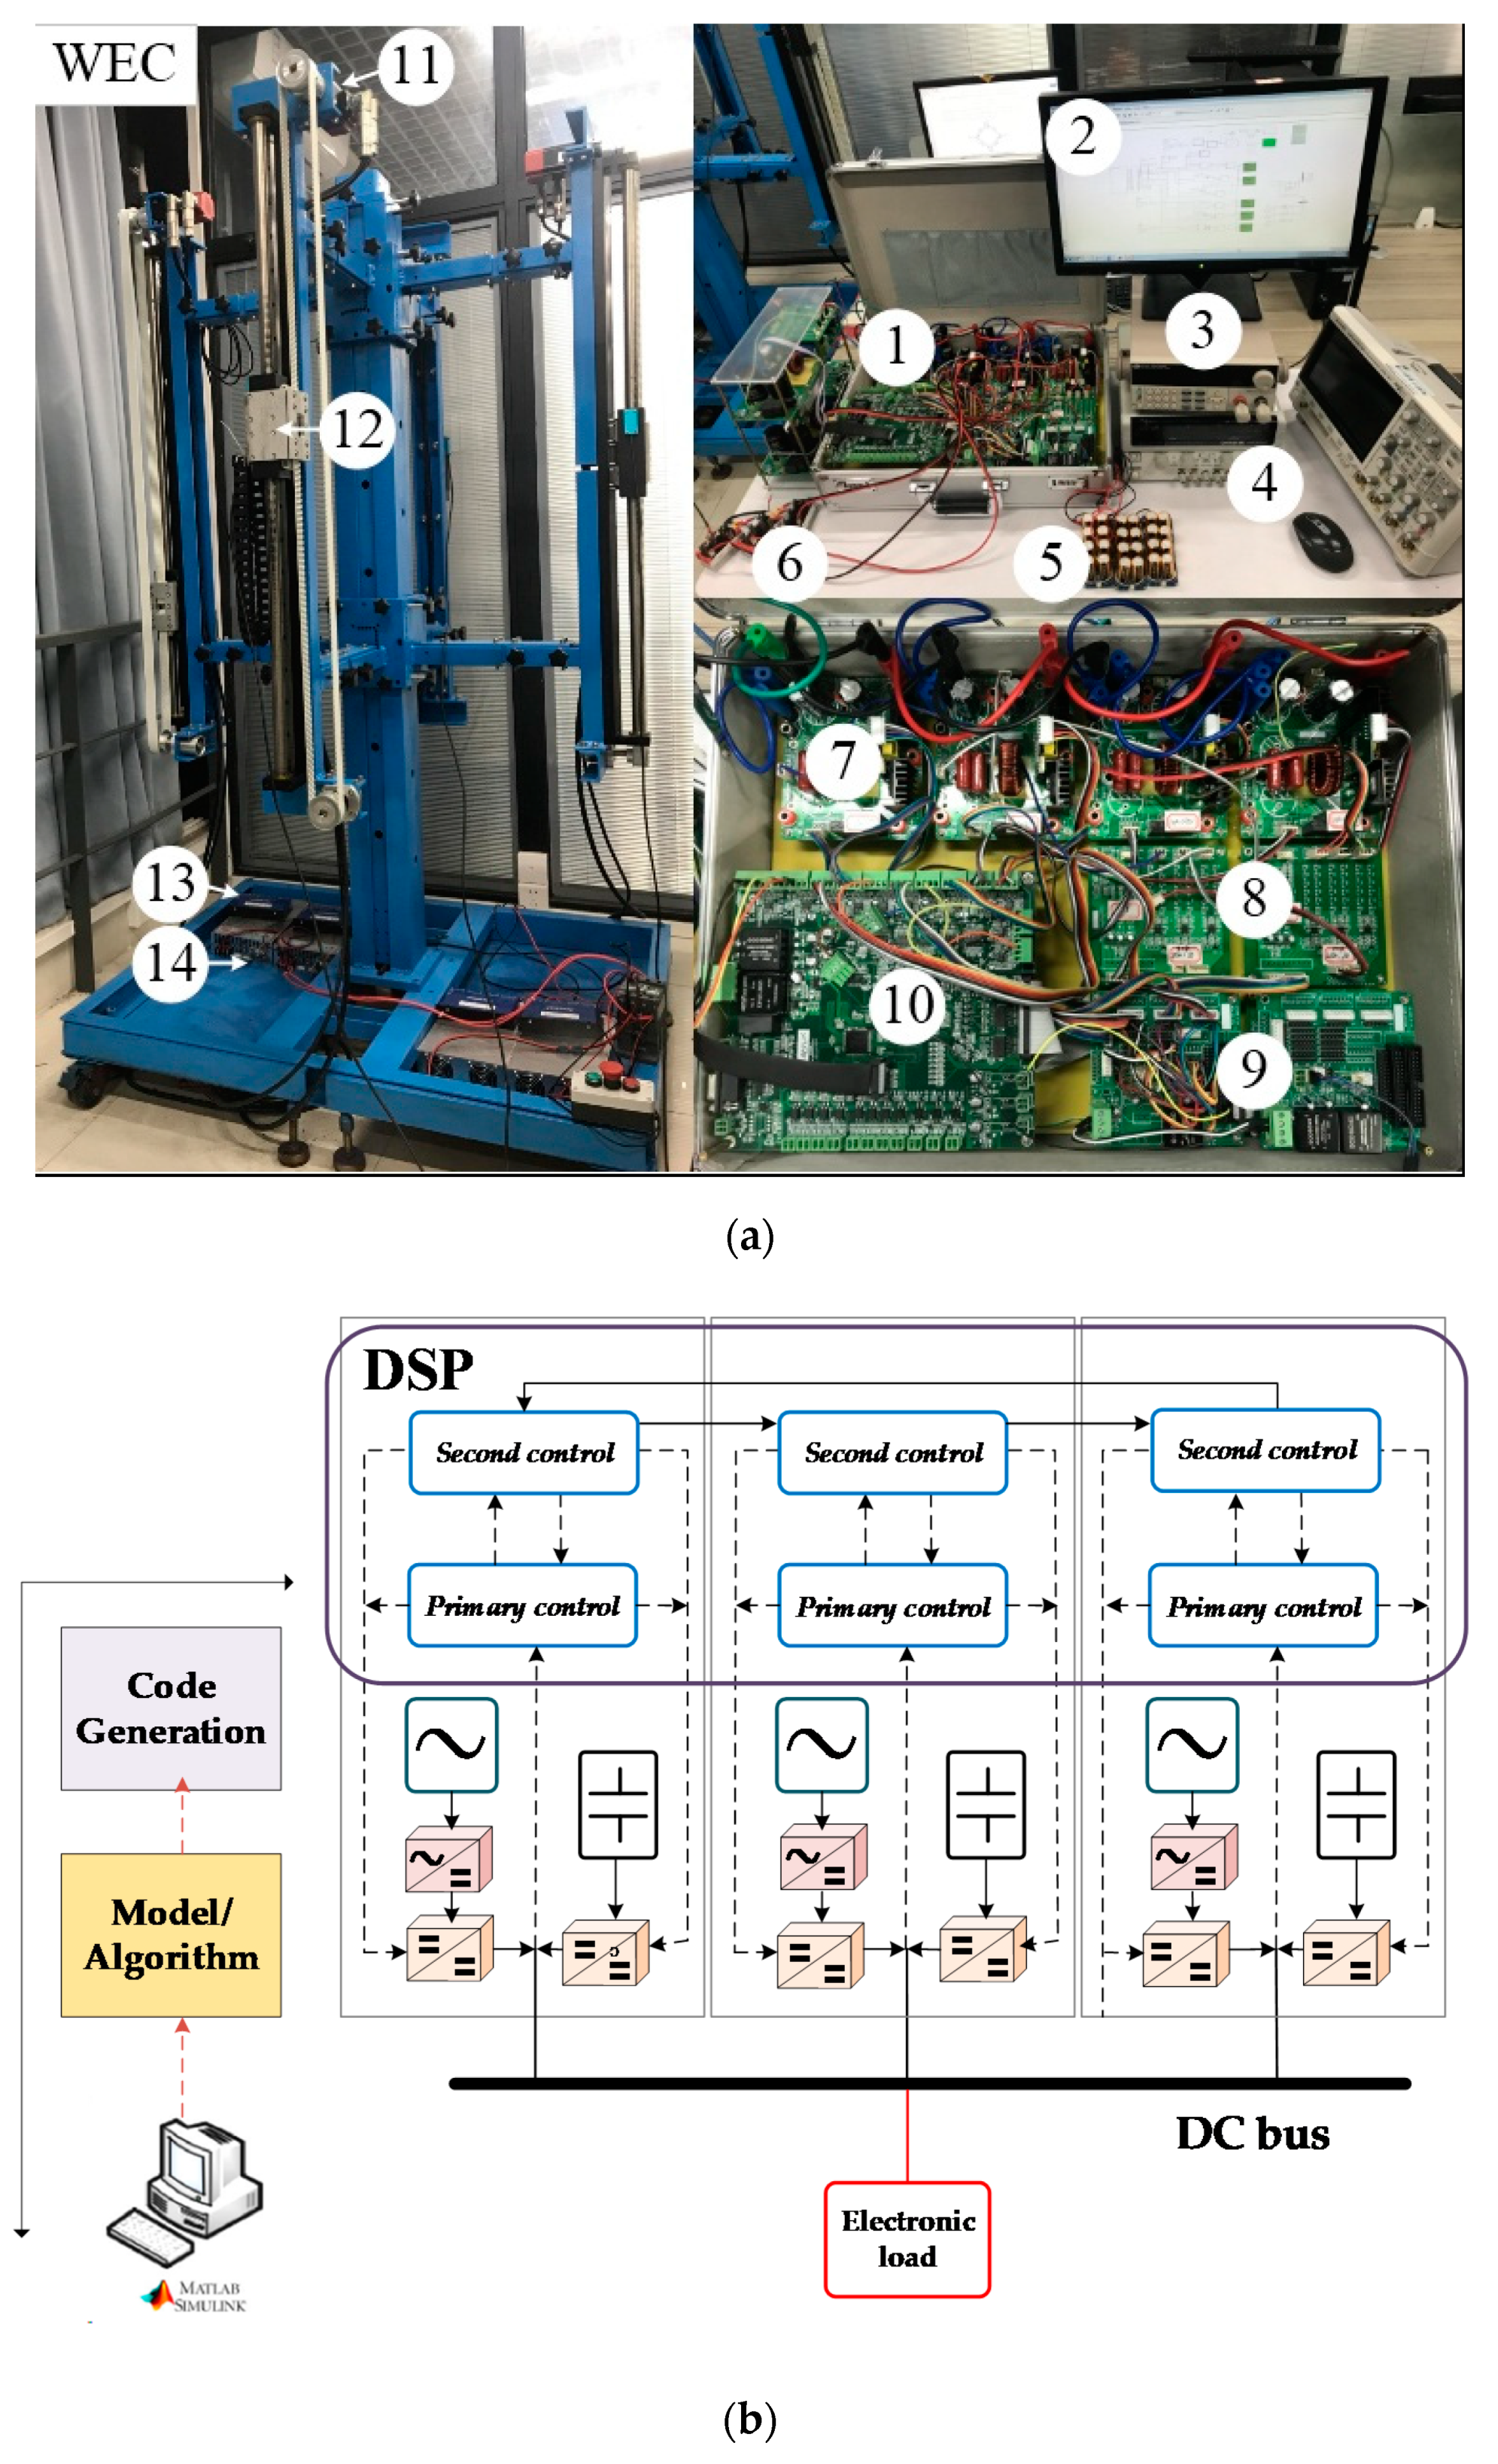
To further validate the system structure and the proposed control strategy of the WEC array, the experiment scenarios are implemented on the experimental platform, as shown in Figure 14a. The experimental platform is composed of a WEC array test bed, three power conversion devices, and a real-time controller. The WEC array test bed is a vertical mechanical frame hoisting multiple WECs, which is towed by three rotating motors to simulate the movement of buoys. Each power conversion device is composed of two AC/DC converters, which are used to convert the three-phase AC of the WEC into the DC power supply of the bus. The DSP28069 deploys the secondary control for dispatching the appropriate desired power to each WEC unit, and the primary control for steering the power conversion devices of the WEC to precisely track the power command. The coordinated control algorithm is programmed and verified in the MATLAB/Simulink environment, and then is built on the digital signal processing (DSP) board by the code generation manner. The voltage and current generated by WECs are measured and processed through the electrical parameter sampling sensor board in the power conversion devices for feeding back the WECs states to DSP controller. The rated bus voltage is maintained at 10 V, satisfying the requirement of a load of user terminal simulated the electronic load with constant resistance mode.
4.4. Experimental Results
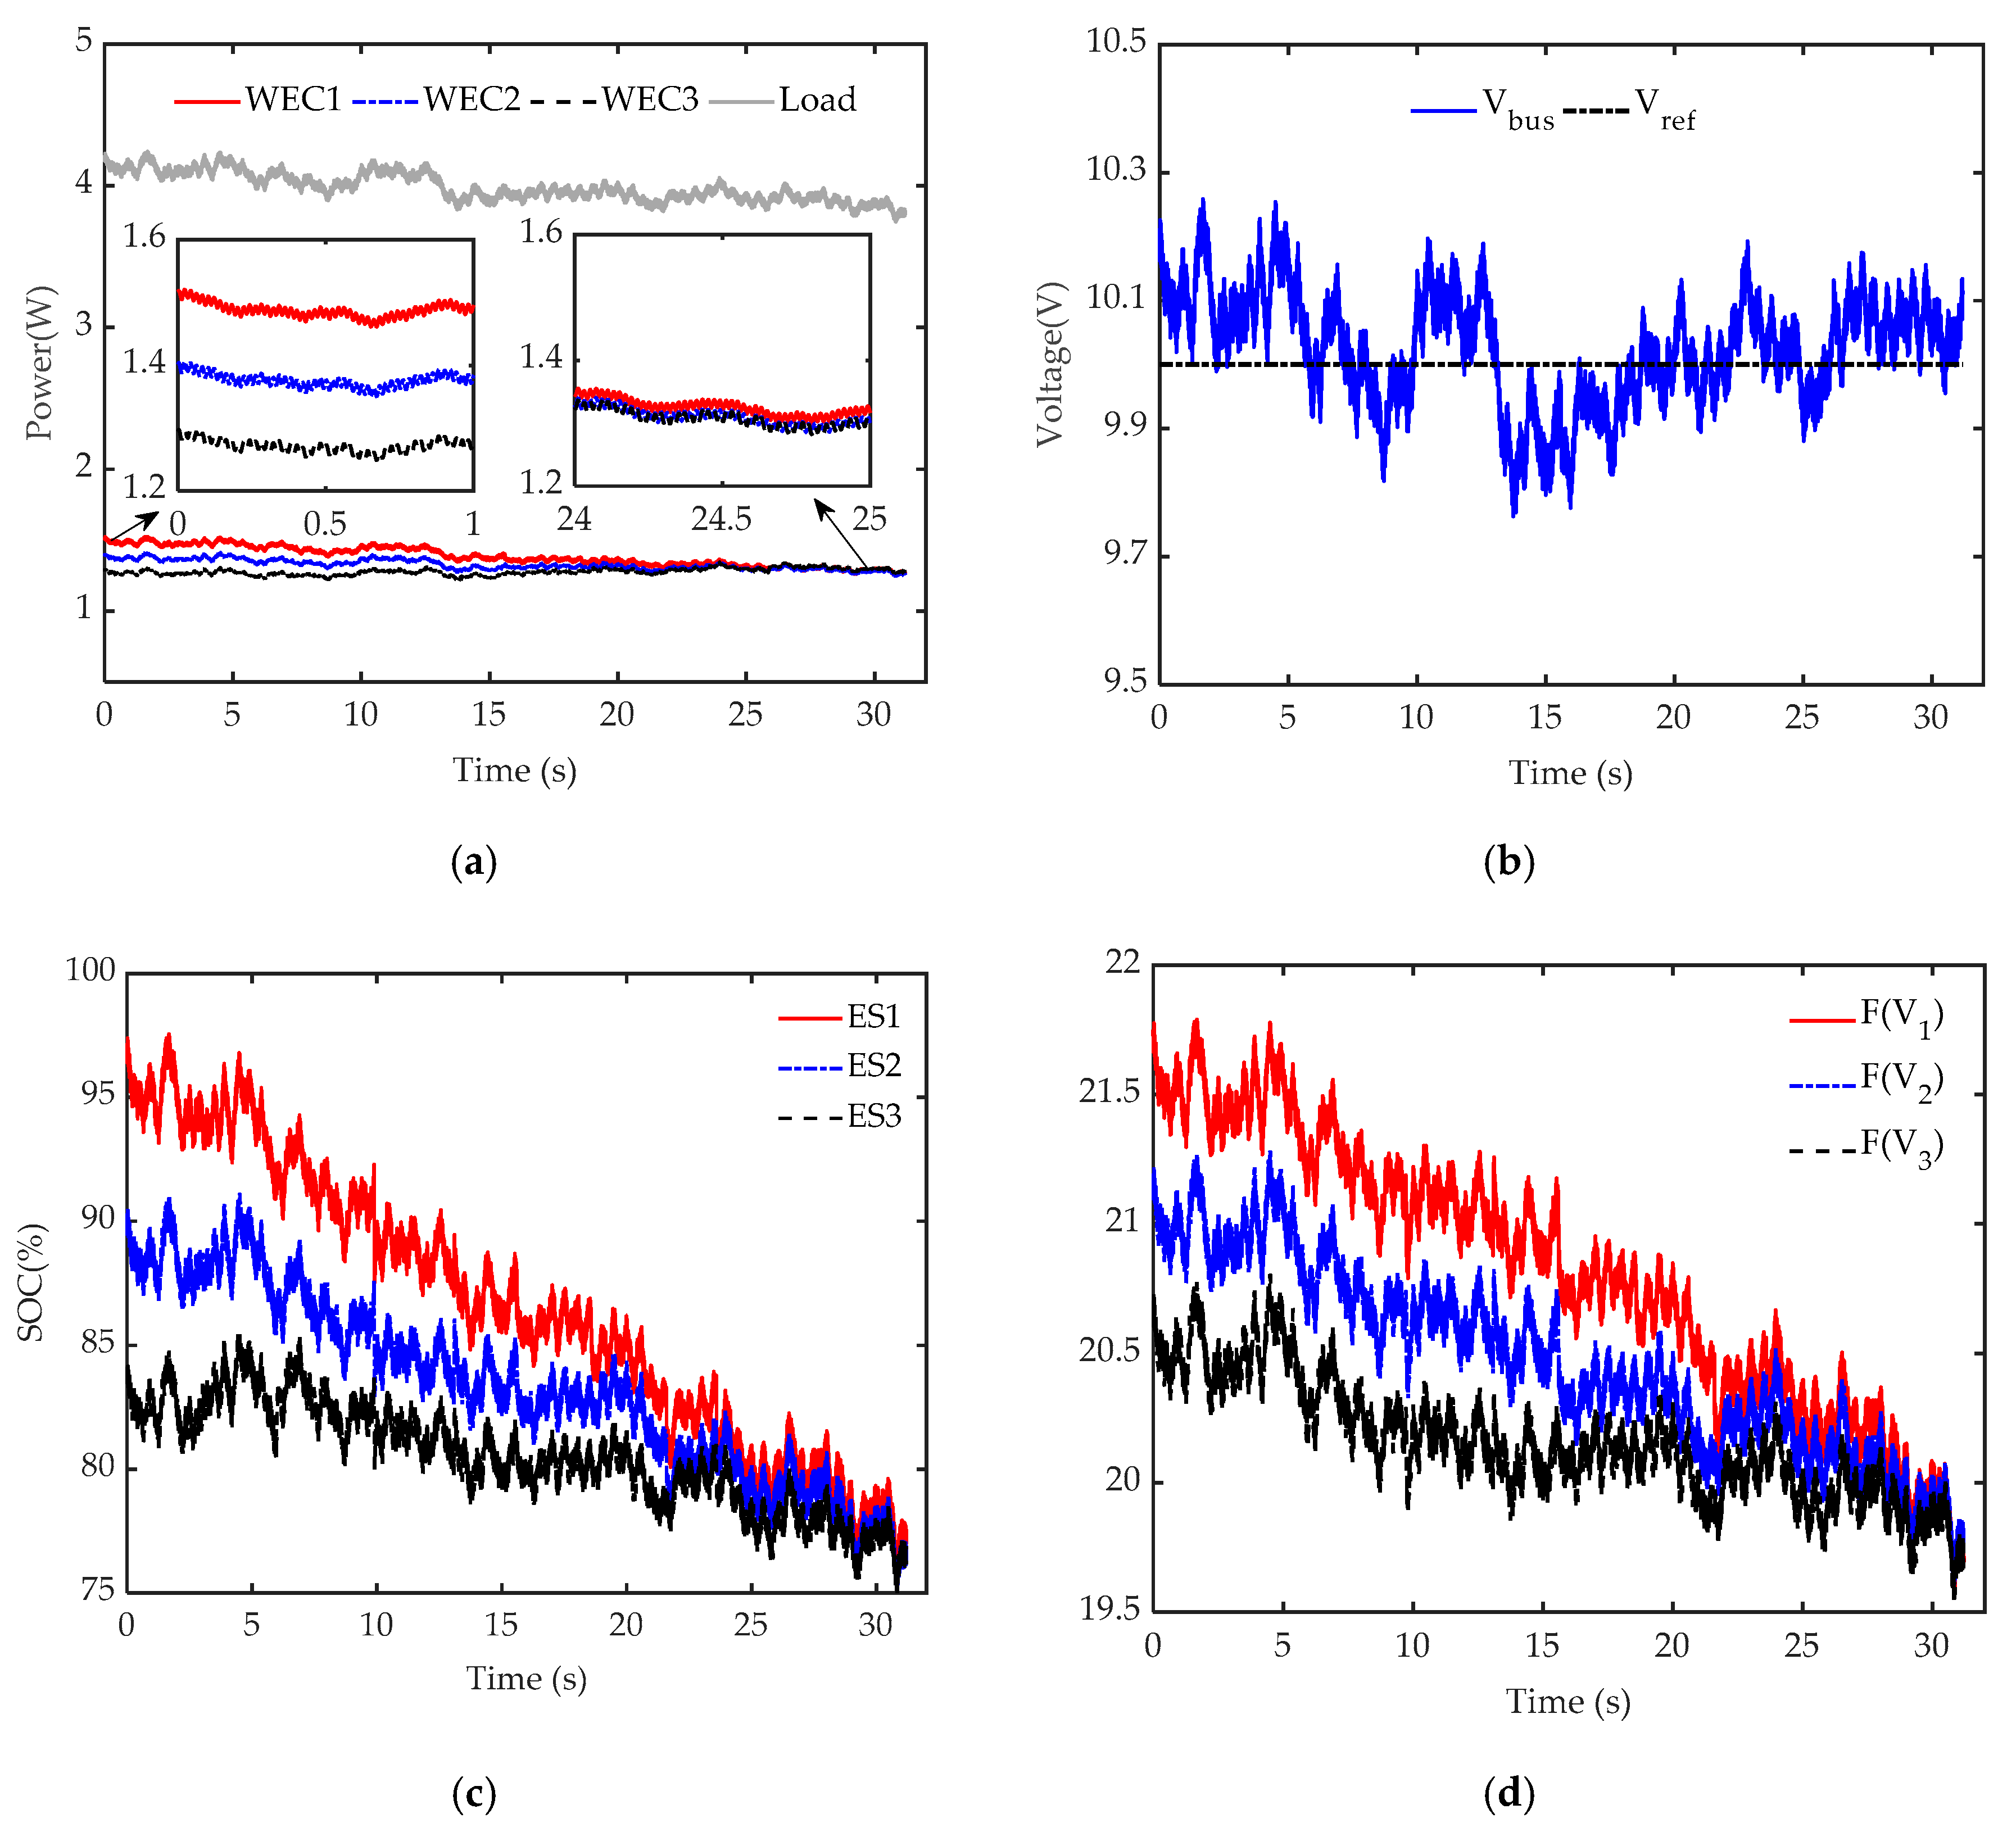
Figure 15a shows the output powers of three WECs converging to the same value 1.35 W, and the sum of three output powers meeting the requirement, the total power 4 W. As shown in Figure 15a, the WEC with higher SOC value is allocated to undertake the output power for the load. Figure 15b shows that the error between the bus and the reference voltage falls to approximately 0.2 V. In Figure 15c, the curve of SOC value of each ES synchronously tends to the same SOC value 78% at 25 s, i.e., the amount of energy stored in each ES becomes to be equal. Likewise, the WEC integral energy status trend to consistent at about 25 s, as shown in Figure 15d.
5. Discussions
To facilitate the simulation of the buoy motion in the laboratory environment, the complex irregular wave-energy condition is simplified to be regular. The buoy motion is assumed to be a reciprocating motion with sinusoidal waveform variation. Figure 8 illustrates the buoy movement and terminal voltage waveforms of WHD. However, the simplifying assumption is reasonable due to only focusing on the energy dispatch after harvesting wave energy in this paper. When an integrated wave-to-wires experiment is developed, the complexity of the real ocean environment cannot be ignored. Considering and simulating the real wave conditions reserves is a future study to be pursued.
In this paper, is applied to evaluate the energy condition of each WEC. However, the energy condition of each WEC is determined by two independent energy sources—WHD and ES. Although can accurately evaluate the energy level of each WEC, the scale ignores the error information of WHD and ES energy conditions. Therefore, the lack of information about the energy condition error of two energy sources may lead to the reduction of the sensitivity of the WECs array to the real wave-energy conditions. Furthermore, in the proposed algorithm, is segmented and considered to be time-invariant for each period of time. In fact, the energy condition of each WEC is a continuous variable with the power outputs. This fact also implies that the optimal power dispatch is also an important research direction for the WECs array.
According to the experimental results, as shown in Figure 15, the SOC of each ES tends to be consistent, and the WEC with higher SOC is required to take on more power output. However, the specific power demand means that each WEC is assigned to output the specified amount of electric power, rather than maximized output according to wave-energy conditions. Therefore, the MPPT control of WEC is necessary to consider in order to capture the wave energy more efficiently.
6. Conclusions
This paper develops a control framework of a WEC array consisting of hierarchical control architecture. In the system framework, each WEC has its local control and energy management, known as the primary control, which coordinates the power outputs of the ES and the WHD according to the current rest energy in ES and the local ocean wave conditions. An advection-based distributed coordinated algorithm—a modified consensus method inspired by diffusion of matters in a flow field—is applied to the secondary control strategy of the system to regulate the power outputs of each WEC to guarantee the load power supply in a coordinated manner. Furthermore, through the digital simulation and physical experiment of the WEC array, the validity of the control algorithm and the system performance are examined. The results demonstrate that the WEC array using the proposed control method accurately responds to the demand for power supply under conditions of unbalanced wave energy.
In the future, more realistic ocean wave conditions will be further considered, and the integrated control strategies from waves to wires will be developed to improve the performance of the WEC array.
Author Contributions
B.Z. conceived the main research work of the paper and guided the manuscript. H.L. designed the main body of study and wrote the manuscript of the paper. L.Q. revised and modified the manuscript. S.C. guided the system design, performed the simulations and experiments, and analyzed the data. J.Y. and J.L. helped to revise the paper.
Funding
This work was funded by the National Natural Science Foundation of China under Grant Nos. 51577121, 61873170, U1813225, 11572248, and 61690211.
Conflicts of Interest
The authors declare no conflict of interest.
Abbreviations
The abbreviations used by this manuscript is listed as follows:
| ES | Energy storage |
| LPMG | Linear permanent magnet generator |
| MAS | Multiagent system |
| MG | Microgrid |
| MPPT | Maximum Power Point Tracking |
| SOC | State of charging |
| WEC | Wave-energy converter |
| WHD | Wave-harvesting device |
References
- Aderinto, T.; Li, H. Ocean Wave Energy Converters: Status and Challenges. Energies 2018, 11, 1250. [Google Scholar] [CrossRef]
- Xiao, X.; Huang, X.; Kang, Q. A Hill Climbing Method-Based Maximum Power Point-Tracking Strategy for Direct-Drive Wave Energy Converters. IEEE Trans. Ind. Electron. 2015, 63, 257–267. [Google Scholar] [CrossRef]
- Amon, E.A.; Brekken, T.K.A.; Schacher, A.A. Maximum Power Point Tracking for Ocean Wave Energy Conversion. IEEE Trans. Ind. App. 2012, 48, 1079–1086. [Google Scholar] [CrossRef]
- Marei, M.I.; Mokhtar, M.; El-Sattar, A.A. MPPT strategy based on speed control for AWS-based wave energy conversion system. Renew. Energy 2015, 83, 305–317. [Google Scholar] [CrossRef]
- Li, G.; Belmont, M.R. Model predictive control of sea wave energy converters—Part I: A convex approach for the case of a single device. Renew. Energy 2014, 69, 453–463. [Google Scholar] [CrossRef]
- Hardy, P.; Cazzolato, B.S.; Ding, B.; Prime, Z. A maximum capture width tracking controller for ocean wave energy converters in irregular waves. Ocean. Eng. 2016, 121, 516–529. [Google Scholar] [CrossRef]
- Thomas, S.; Eriksson, M.; Göteman, M.; Hann, M.; Isberg, J.; Engström, J. Experimental and Numerical Collaborative Latching Control of Wave Energy Converter Arrays. Energies 2018, 11, 3036. [Google Scholar] [CrossRef]
- Thomas, S.; Giassi, M.; Eriksson, M.; Göteman, M.; Isberg, J.; Ransley, E.; Hann, M.; Engström, J. A Model Free Control Based on Machine Learning for Energy Converters in an Array. Big Data Cogn. Comput. 2018, 2, 36. [Google Scholar] [CrossRef]
- Wu, F.; Ju, P.; Zhang, X.P.; Qin, C.; Peng, G.J.; Huang, H.; Fang, J. Modeling, control strategy, and power conditioning for direct-drive wave energy conversion to operate with power grid. Proc. IEEE 2013, 101, 925–941. [Google Scholar] [CrossRef]
- Kovaltchouk, T.; Multon, B.; Ahmed, H.B.; Aubry, J.; Venet, P. Enhanced aging model for supercapacitors taking into account power cycling: Application to the sizing of an energy storage system in a direct wave energy converter. IEEE Trans. Ind. Appl. 2015, 51, 2405–2414. [Google Scholar] [CrossRef]
- Pegueroles-Queralt, J.; Bianchi, F.D.; Gomis-Bellmunt, O. A Power Smoothing System Based on Supercapacitors for Renewable Distributed Generation. IEEE Trans. Ind. Electron. 2015, 62, 343–350. [Google Scholar] [CrossRef]
- Guerrero, J.M.; Vasquez, J.C.; Matas, J.; De Vicuna, L.G.; Castilla, M. Hierarchical Control of Droop-Controlled AC and DC Microgrids—A General Approach Toward Standardization. IEEE Trans. Ind. Electron. 2011, 58, 158–172. [Google Scholar] [CrossRef]
- Shafiee, Q.; Dragicevic, T.; Vasquez, J.C.; Guerrero, J.M. Hierarchical control for multiple dc-microgrids clusters. IEEE Trans. Energy Convers. 2014, 29, 922–933. [Google Scholar] [CrossRef]
- Shafiee, Q.; Guerrero, J.M.; Vasquez, J.C. Distributed Secondary Control for Islanded Microgrids—A Novel Approach. IEEE Trans. Power Electron. 2013, 29, 1018–1031. [Google Scholar] [CrossRef]
- Zhao, T.; Ding, Z. Distributed finite-time optimal resource management for microgrids based on multi-agent framework. IEEE Trans. Ind. Electron. 2017, 65, 6571–6580. [Google Scholar] [CrossRef]
- Lagorse, J.; Paire, D.; Miraoui, A. A multi-agent system for energy management of distributed power sources. Renew. Energy 2010, 35, 174–182. [Google Scholar] [CrossRef]
- Nasirian, V.; Moayedi, S.; Davoudi, A.; Lewis, F.L. Distributed Cooperative Control of DC Microgrids. IEEE Trans. Power Electron. 2014, 30, 2288–2303. [Google Scholar] [CrossRef]
- Chapman, A. Semi-Autonomous Networks: Effective Control of Networked Systems through Protocols, Design, and Modeling; Springer: Basel, Switzerland, 2015; pp. 4–15. [Google Scholar]
- Chapman, A.; Schoof, E.; Mesbahi, M. Advection on networks with an application to decentralized load balancing. In Proceedings of the IEEE/RSJ International Conference on Intelligent Robots & Systems, Vilamoura, Portugal, 7–12 October 2012. [Google Scholar]
- Rao, W.F.; Zhang, B.; Pan, J.F.; Wu, X.; Yuan, J.P.; Qiu, L. Voltage control strategy of DC microgrid with direct drive wave energy generator. In Proceedings of the International Conference on Power Electronics Systems and Applications, Hong Kong, China, 12–14 December 2017. [Google Scholar]
Figure 1.
Graph of a cycle network.

Figure 2.
Structure of the WECs array.

Figure 3.
Primary control structure of WHD.

Figure 4.
Primary control structure of ES.

Figure 5.
Structure of the compensation control.

Figure 6.
System framework of WECs array.

Figure 7.
Power dispatch procedure of WECs array.

Figure 8.
(a) Buoy movement; (b) Terminal voltage waveforms of WHD.

Figure 9.
Performance of load power and voltage of WEC array: (a) Output power of WEC array without compensation controller; (b) Output voltage of WEC array without compensation controller; (c) Output power of WEC array with compensation controller; (d) Output voltage of WEC array with compensation controller.

Figure 10.
Performance of WECs with different initial SOC: (a) Reference output powers and actual output powers of each WEC; (b) Power distribution ratio of each ES in each WEC; (c) SOC curve; (d) WEC integral energy state .
Figure 10.
Performance of WECs with different initial SOC: (a) Reference output powers and actual output powers of each WEC; (b) Power distribution ratio of each ES in each WEC; (c) SOC curve; (d) WEC integral energy state .

Figure 11.
Performance of WECs with different initial WHD output: (a) Reference output power of each WEC; (b) Voltage of each WHD; (c) SOC curve; (d) WEC integral energy state of each WEC.
Figure 11.
Performance of WECs with different initial WHD output: (a) Reference output power of each WEC; (b) Voltage of each WHD; (c) SOC curve; (d) WEC integral energy state of each WEC.

Figure 12.
Performance of WECs with different initial WHD output and SOC: (a) Reference output powers and actual output powers of each WEC; (b) SOC curve; (c) WEC integral energy state ().
Figure 12.
Performance of WECs with different initial WHD output and SOC: (a) Reference output powers and actual output powers of each WEC; (b) SOC curve; (c) WEC integral energy state ().

Figure 13.
Performance of convergence rate: (a) = 2; (b) = 3; (c) = 4; (d) = 10.

Figure 14.
(a) Hardware structure: 1. Control board; 2. Computer. 3. Electronic load; 4. DC power; 5. Energy storage; 6. Rectifier; 7. Bidirectional converter; 8. Signal adapter board; 9. DC power; 10. DSP; 11. Rotating motor; 12. Translator; 13. Driver; 14. DC power; (b) Frame diagram of the experimental platform.

Figure 15.
Performance of WECs with different initial SOC: (a) Power curve; (b) Bus voltage. (c) SOC curve; (d) WEC integral energy state (). Figure 15 illustrates the performance of WECs with different initial SOC.
Figure 15.
Performance of WECs with different initial SOC: (a) Power curve; (b) Bus voltage. (c) SOC curve; (d) WEC integral energy state (). Figure 15 illustrates the performance of WECs with different initial SOC.


Table 1.
Simulation parameters setup.
| Parameters | Values | Parameters | Values |
|---|---|---|---|
| ES rated voltage (V) | 12 | 3 | |
| Bus rated voltage (V) | 24 | 0.2 | |
| Load power (W) | 35–55 | 1 | |
| K | 20 | 10 | |
| G | 3 | 0.1 | |
| 2 | 30 | ||
| 150 |
Table 2.
Initial parameters of Tests 1 and 2.
| Parameter | WEC 1 | WEC 2 | WEC 3 |
|---|---|---|---|
| ES initial voltage (V) | 8 | 7.7 | 7.4 |
| ES initial SOC (%) | 65 | 62.5 | 60 |
| WHD voltage (V) | 13.3–15.3 | 13.3–15.3 | 13.3–15.3 |
Table 3.
Initial parameters of Test 3.
| Parameter | WEC 1 | WEC 2 | WEC 3 |
|---|---|---|---|
| ES initial voltage (V) | 7.7 | 7.7 | 7.7 |
| ES initial SOC (%) | 62.5 | 62.5 | 62.5 |
| WHD voltage (V) | 13.4–15.5 | 13.3–15.4 | 13.2–15.3 |
Table 4.
Initial parameters of Test 4.
| Parameter | WEC 1 | WEC 2 | WEC 3 |
|---|---|---|---|
| ES initial voltage (V) | 7.8 | 7.7 | 7.6 |
| ES initial SOC (%) | 63.5 | 62.5 | 61.5 |
| WHD voltage (V) | 13.4–15.5 | 13.3–15.4 | 13.2–15.3 |
Table 5.
Experimental initial parameters.
| Parameters | WEC 1 | WEC 2 | WEC 3 |
|---|---|---|---|
| ES rated voltage (V) | 10.8 | 10.8 | 10.8 |
| ES initial voltage (V) | 10.6 | 10.2 | 9.8 |
| ES initial SOC (%) | 95 | 89 | 82 |
| WHD voltage (V) | 9.7–10.9 | 9.7–10.9 | 9.7–10.9 |
| K | 20 | 20 | 20 |
| g | 3 | 3 | 3 |
© 2019 by the authors. Licensee MDPI, Basel, Switzerland. This article is an open access article distributed under the terms and conditions of the Creative Commons Attribution (CC BY) license (http://creativecommons.org/licenses/by/4.0/).
Share and Cite
MDPI and ACS Style
Li, H.; Zhang, B.; Qiu, L.; Chen, S.; Yuan, J.; Luo, J. Advection-Based Coordinated Control for Wave-Energy Converter Array. Energies 2019, 12, 3567. https://0-doi-org.brum.beds.ac.uk/10.3390/en12183567
AMA Style
Li H, Zhang B, Qiu L, Chen S, Yuan J, Luo J. Advection-Based Coordinated Control for Wave-Energy Converter Array. Energies. 2019; 12(18):3567. https://0-doi-org.brum.beds.ac.uk/10.3390/en12183567
Chicago/Turabian StyleLi, Hong, Bo Zhang, Li Qiu, Shiyu Chen, Jianping Yuan, and Jianjun Luo. 2019. "Advection-Based Coordinated Control for Wave-Energy Converter Array" Energies 12, no. 18: 3567. https://0-doi-org.brum.beds.ac.uk/10.3390/en12183567
Note that from the first issue of 2016, this journal uses article numbers instead of page numbers. See further details here.