Article

Several Problems with Froude-Number Based Scale Modeling of Fires in Small Compartments

1
Faculty of Fire Safety Engineering, The Main School of Fire Service (SGSP), 01-629 Warsaw, Poland
2
Fire Research Department, Building Research Institute (ITB), 00-611 Warsaw, Poland
3
Faculty of Mining and Geoengineering, AGH University of Science and Technology, 30-059 Kraków, Poland
*
Author to whom correspondence should be addressed.
Submission received: 4 September 2019 / Revised: 17 September 2019 / Accepted: 19 September 2019 / Published: 23 September 2019
(This article belongs to the Section I: Energy Fundamentals and Conversion)

Abstract

:
The Froude-number based reduced-scale modeling is a technique commonly used to investigate the flow of heat and mass in building fires. The root of the method is the thermodynamic model of a flow in a compartment and several non-dimensional flow numbers based on the proportionalities of the Navier-Stokes and heat transfer equations. The ratio of inertial forces to the buoyancy forces, known as the Froude-number, plays a pivotal role within these proportionalities. This paper is an attempt to define the range of credible scale modeling using the Froude-number. We verify the credibility of the modeling by small fire (approximately 150 kW) in a small compartment, comparing data from a physical test (scale 1:1 and 1:4) and the numerical model’s data (Fire Dynamics Simulator, scales 1:1, 1:2, 1:4, 1:10, 1:20, and 1:50). The scope of the research covers a wide range of fires, with observed change of the flow from turbulent to laminar. The results show that the applicability of Froude-number reduced-scale modeling has limitations related to the scale. Therefore, it should be applied with care following sensibility analysis. We propose a method for sensibility analysis using Computational Fluid Dynamics (CFD) modeling.

1. Introduction

There is continuous progress in the reflection of the fire phenomenon in computer models [1]. There is also a growing number of applications of computer software to complex fire problems [2]. Computer models are continually gaining accuracy, as is the scope of the modeled fire phenomena. However, due to limitations in representation of many fire-related phenomena, computational costs, and uncertainties related to numerical investigation, physical experimentation in reduced-scale modeling is still a popular tool. Since the first studies on the smoke control of factories performed by Thomas et al. [3], reduced-scale research allowed for the development of better techniques and solutions to prevent fires and limit their consequences to occupants, buildings, and the environment. Such studies could also be used in forensic applications [4,5] and building design.
There are two governing non-dimensional numbers in low-Mach–fire-related flows, namely the Reynolds (Re) and Froude (Fr) numbers. However, the Fr scaling conflicts with the Re preservation by providing two different results for velocity in the scale models. There are analyses [6] that prove that in fire-related flows, one should preserve the Froude-number, not the Reynolds number when scaling is applied. In this case, so-called partial scaling is adopted that favors the Fr over the Re [7]. Quintiere et al. mentioned that maintaining sufficient height of the scale model compartment (>0.3 m) may be adequate to maintain flow turbulence [5].
The Fr scaling assumes that two fires are similar to each other, if the Froude-number characterizing both fires is equal, and there is geometrical and hydraulic similarity of the systems in which the fires take place. An illustration of the Froude-number scale fire modeling concept is shown in Figure 1. Variable x describes dimensions of the model in full- (index “f”) and reduced- (index “m”) scale. If the Heat Release Rate (HRR, Q) of the fire is scaled accordingly and the Fr is preserved, the temperatures (T) measured in the reduced- and full-scale fires should be equal.
The approach of the Fr scaling must be used with care, despite its popularity. Spalding emphasized that partial scaling is “an art” and not a science, due to problems in properly relating the behavior of the full-scale system to the one of the model [9]. Among these problems, the most common are with the scaling the chemistry of combustion and the flow turbulence [9]. Nevertheless, Froude-number scale modeling of fires has proven useful in understanding various fire phenomena, and their consequences [3,10,11,12].
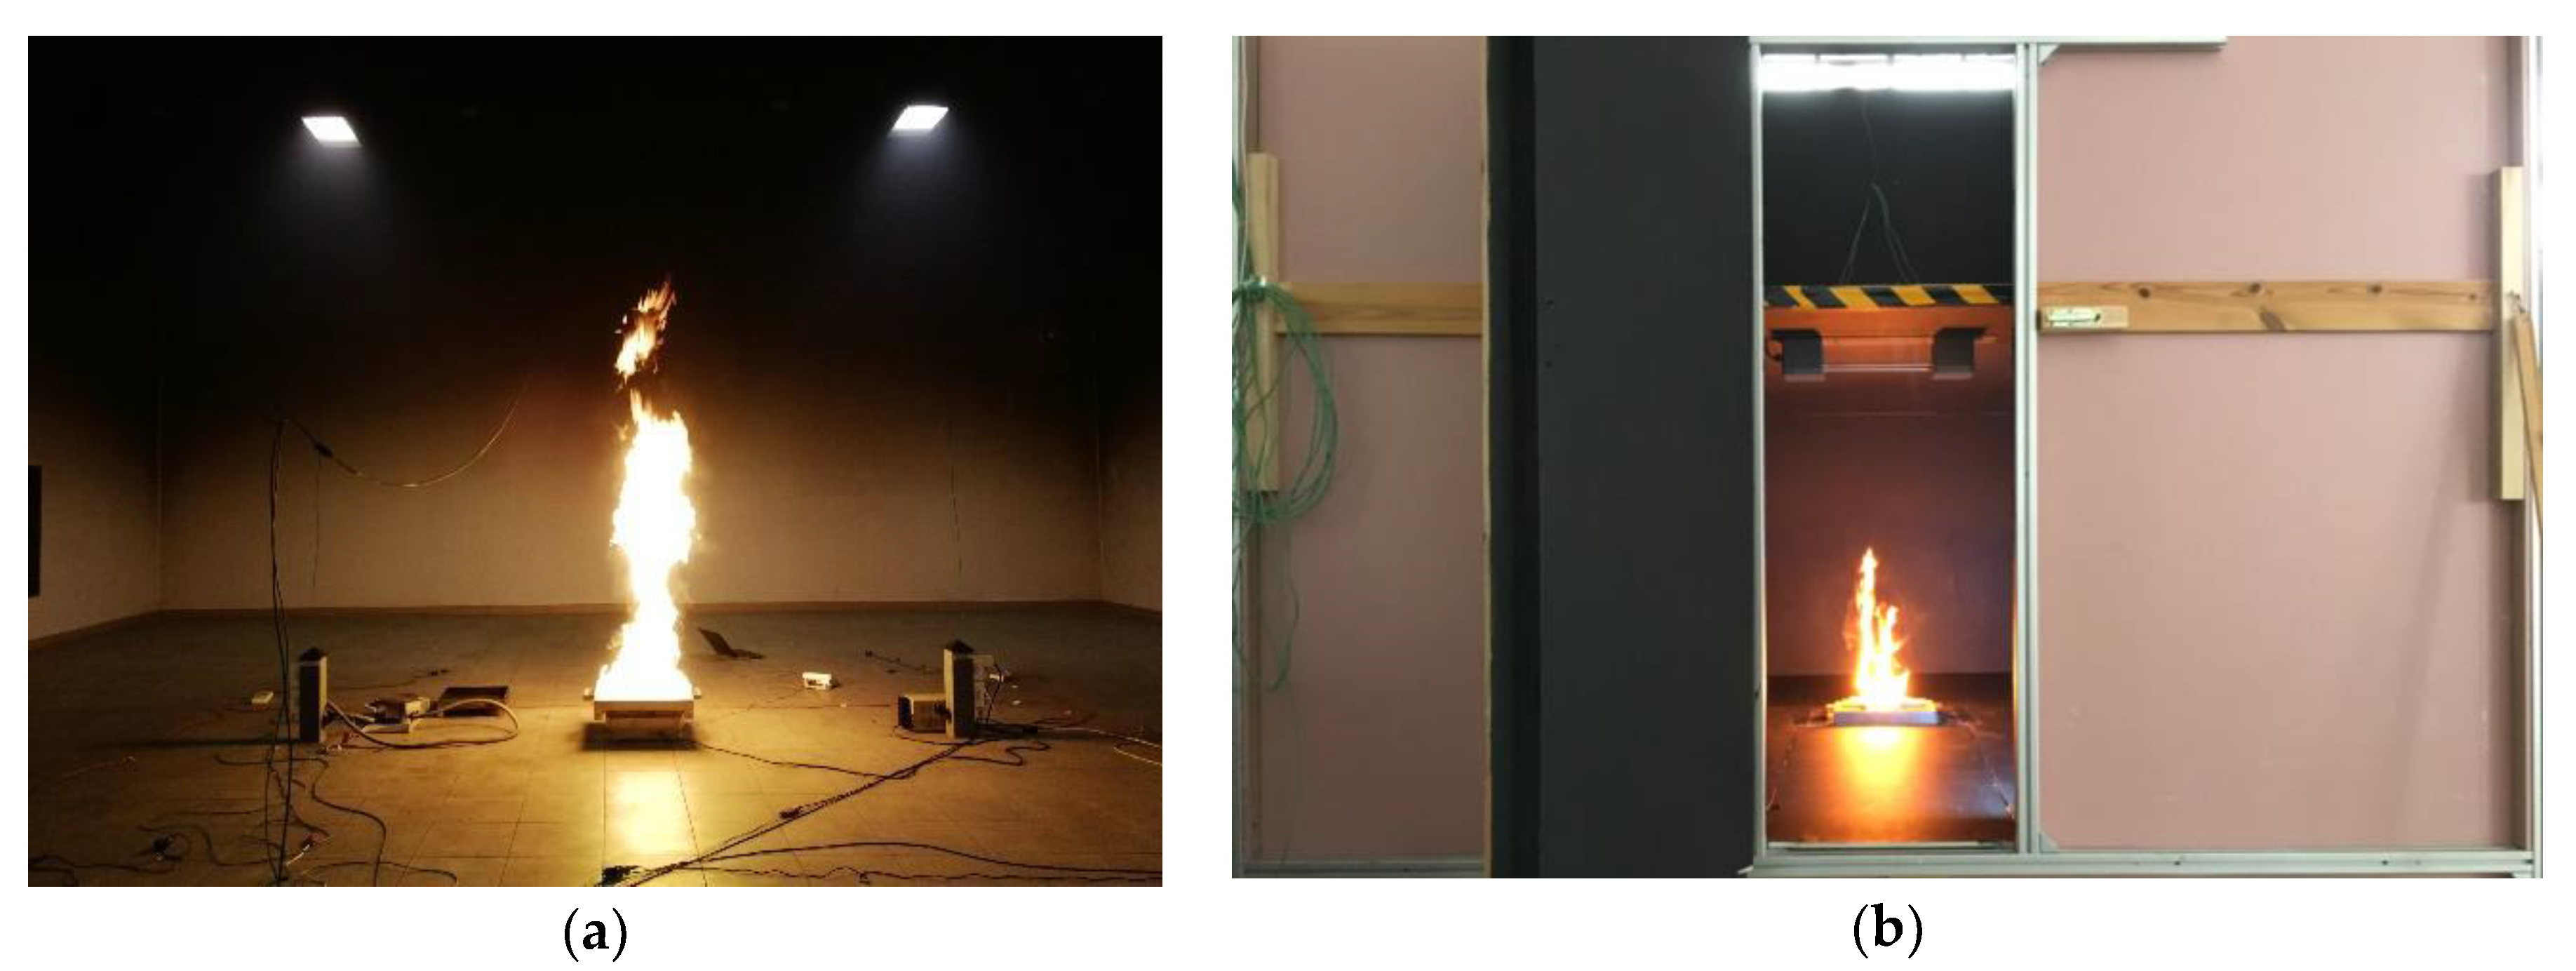
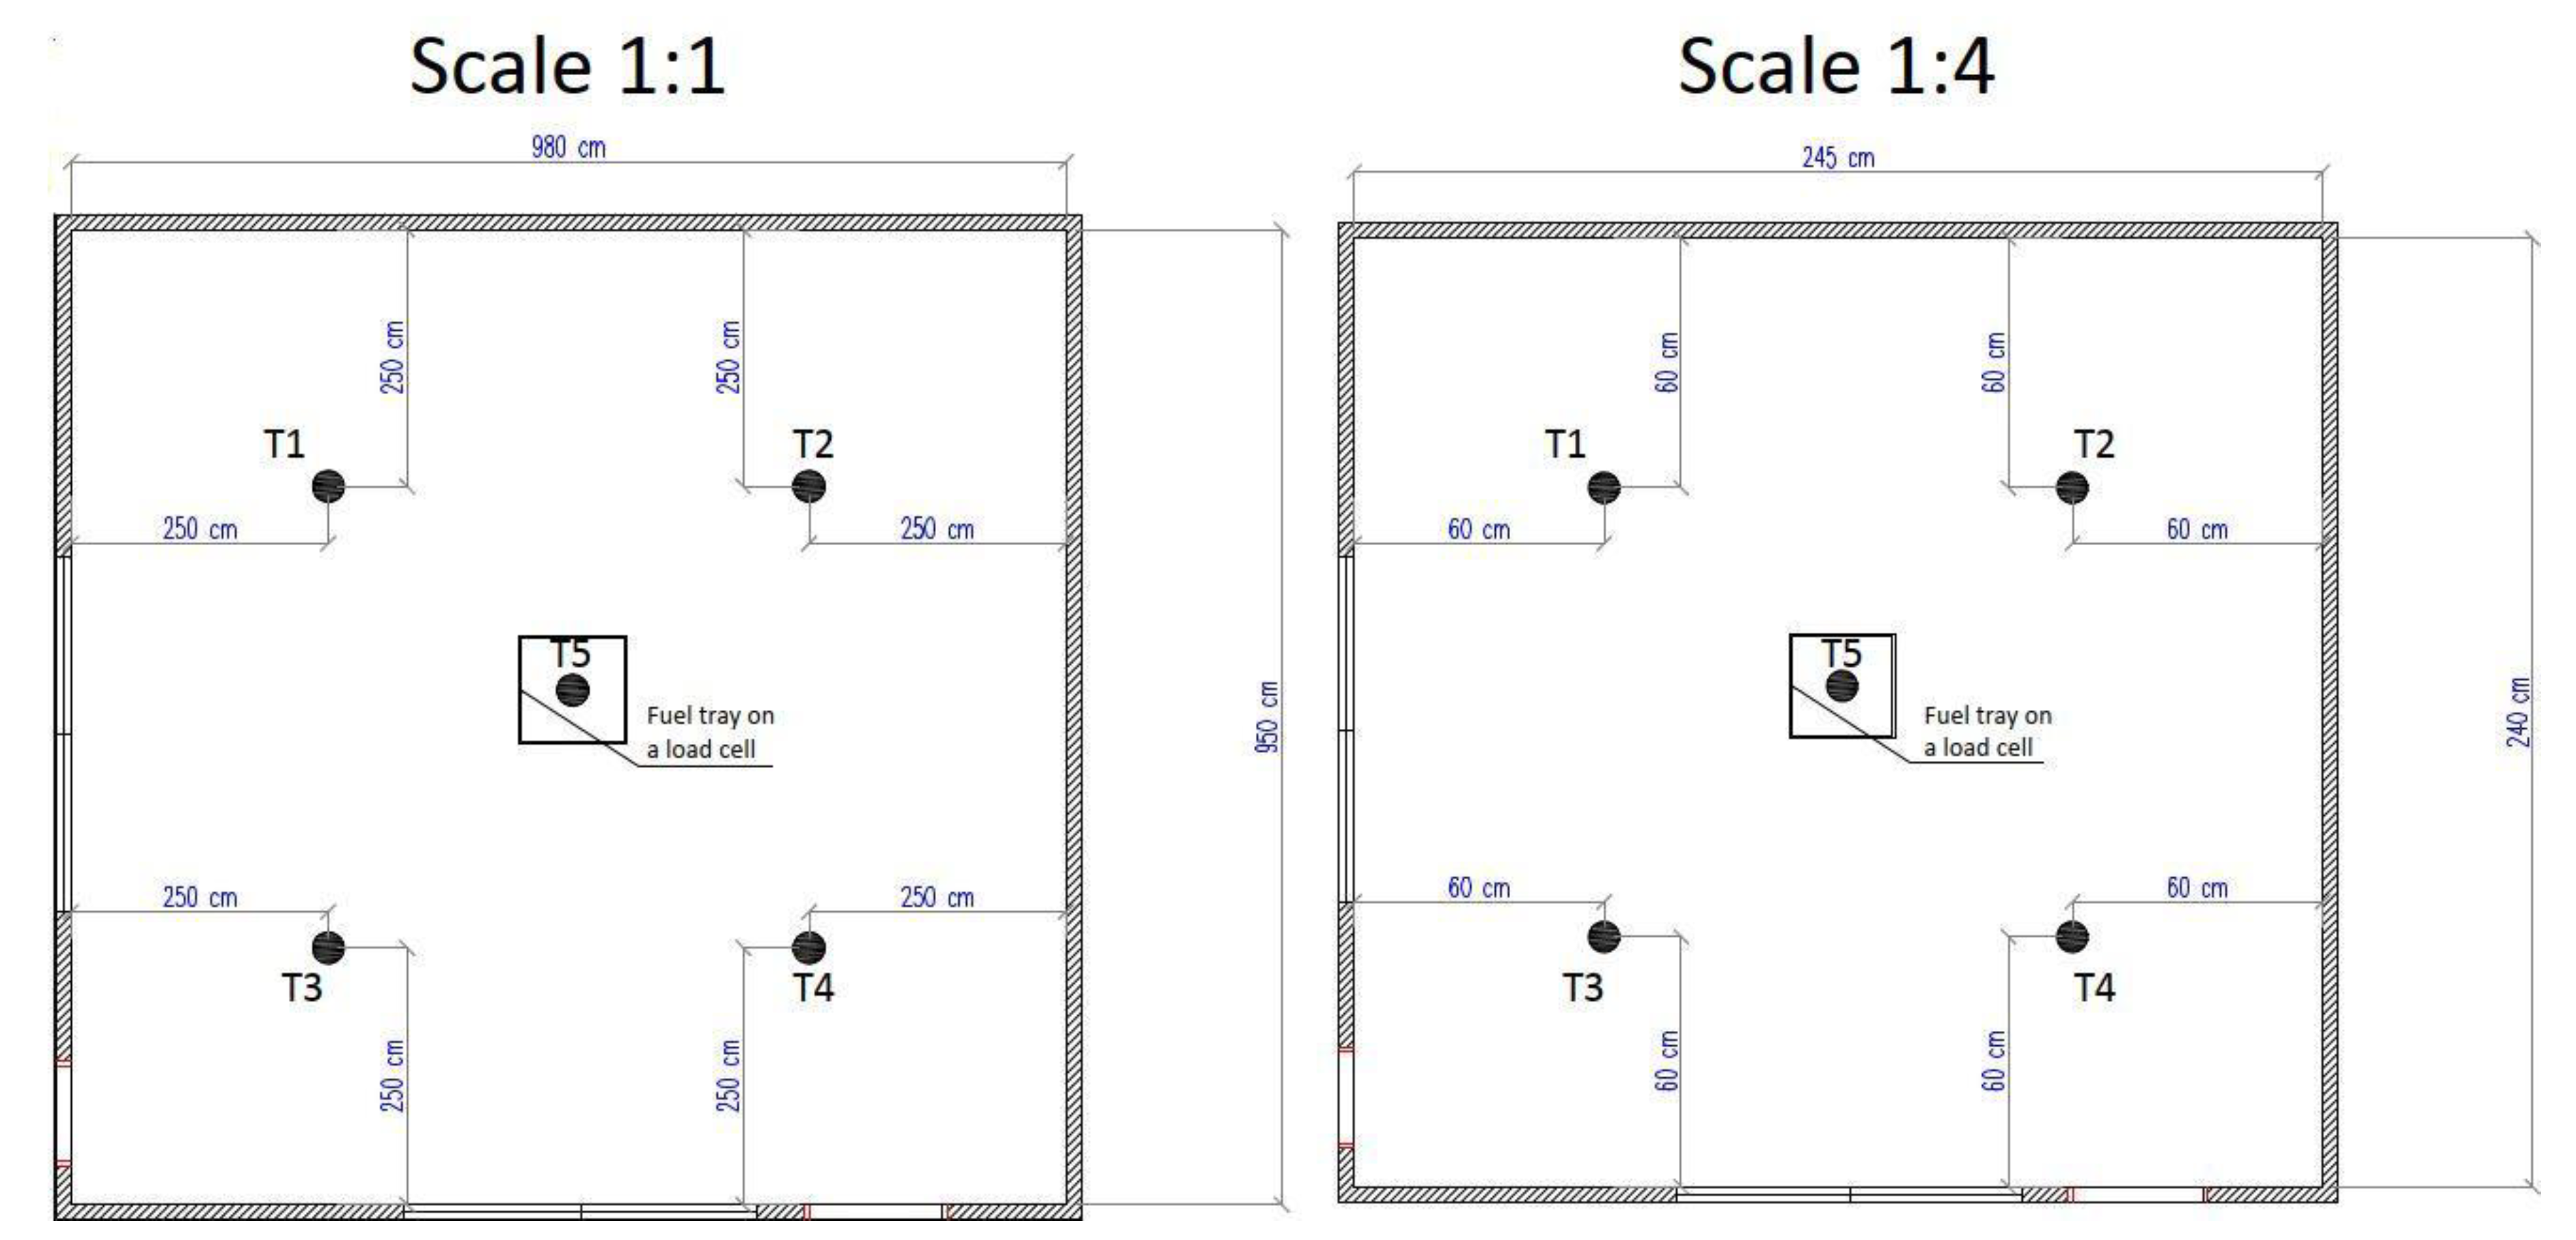
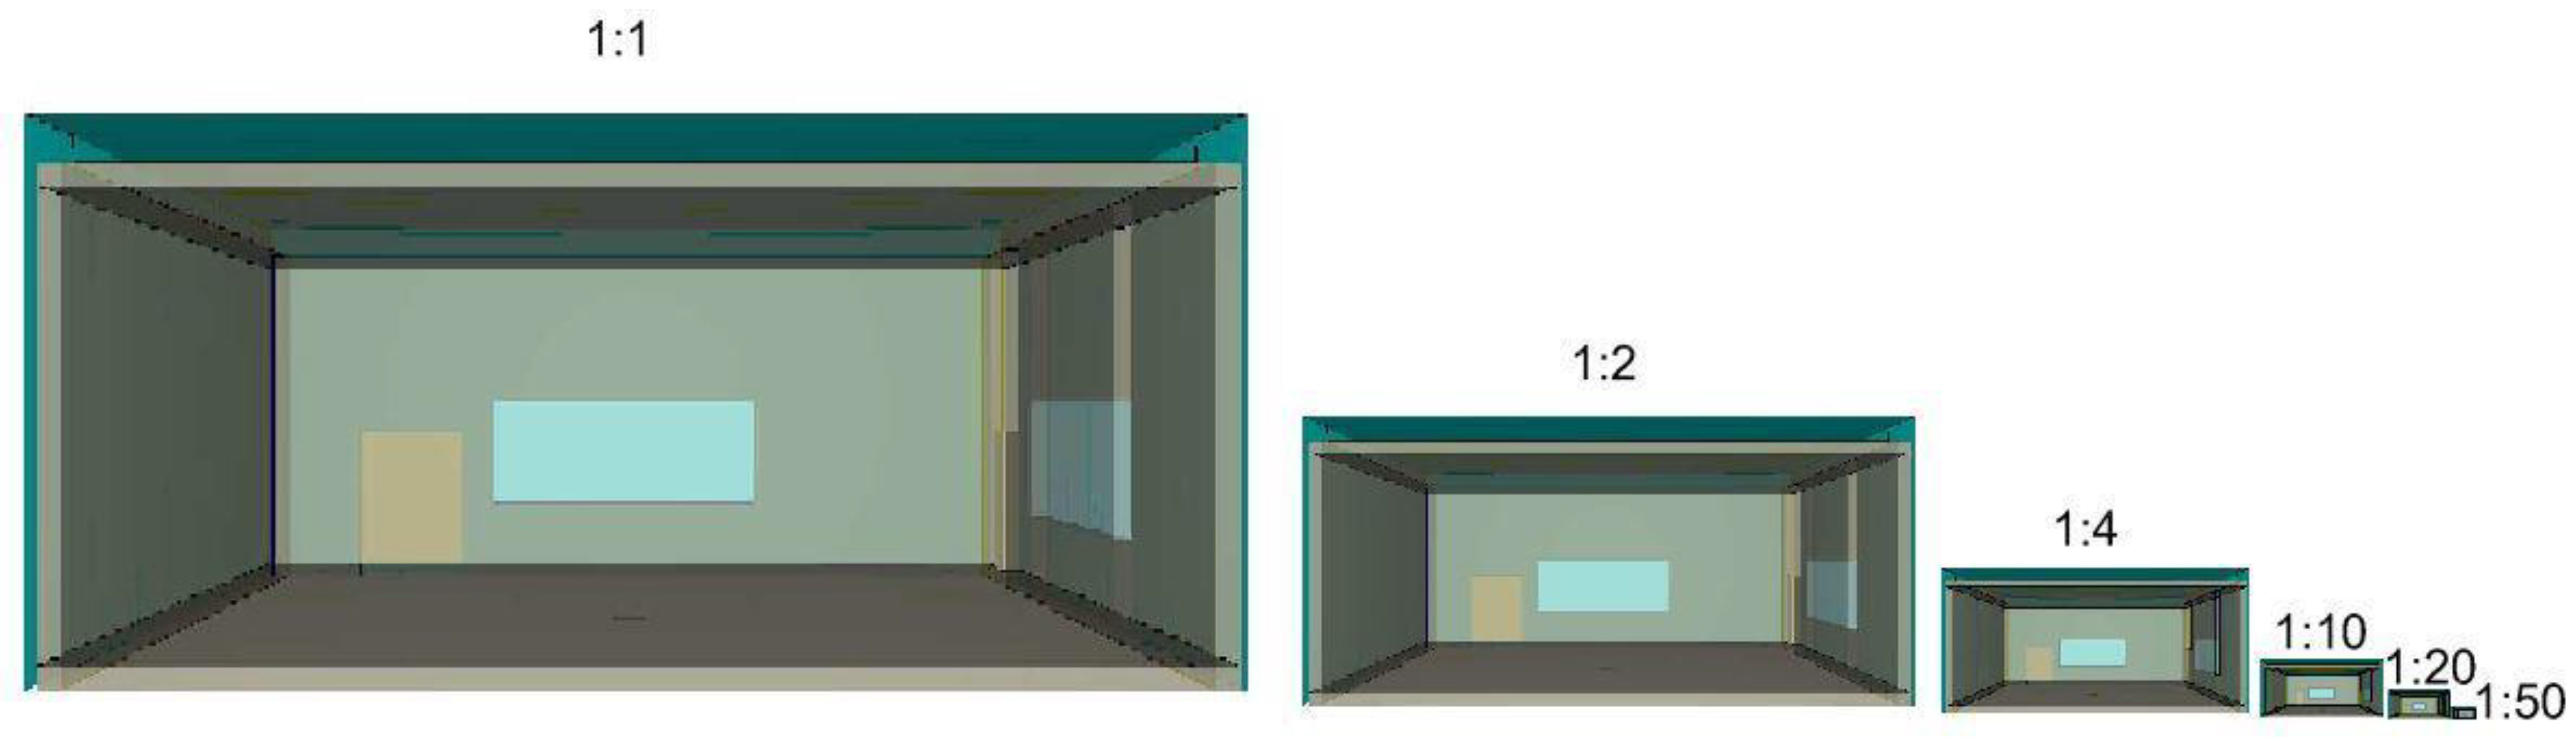
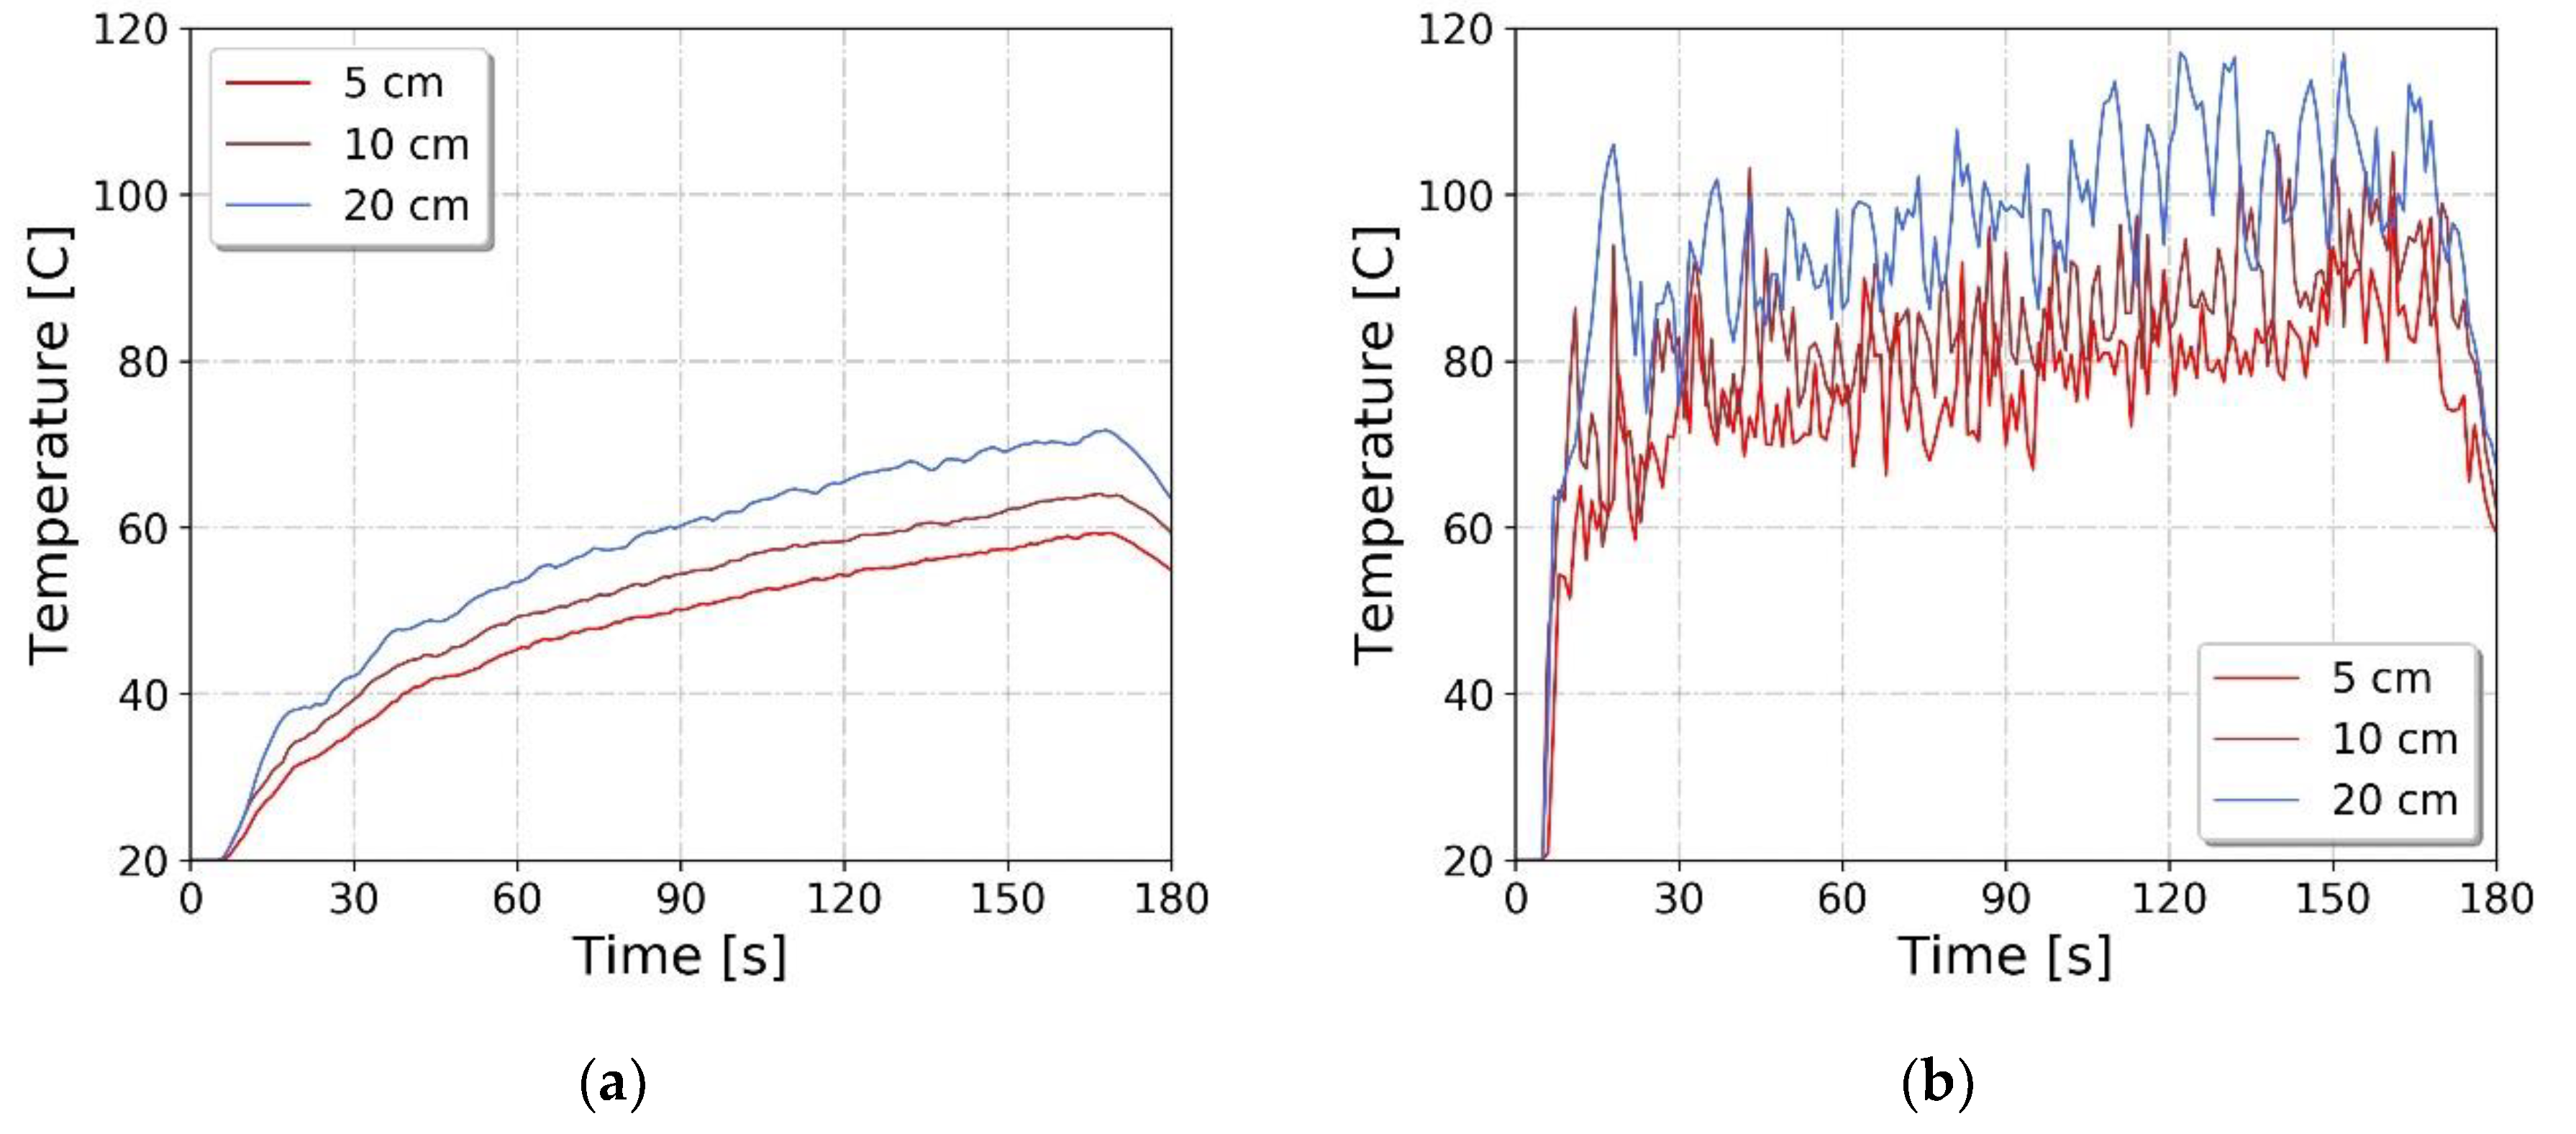
In this research, we focus on some issues identified with the practical use of the Froude-number scale modeling of a small fire (HRR of approximately 150 kW) in a small-sized compartment (approximately 10 × 10 × 4 m³). We have observed a discrepancy in the measurements of the temperature between the full- and reduced-scale experiments that match observations previously reported in the literature. Furthermore, the experiment was recreated with the use of CFD modeling in larger number of scales as an attempt to confirm the experimental observations, investigate the turbulent flow structure in more details, and form generalised conclusions. The temperature of smoke measured in the reduced-scale analyses was lower than in a full-scale experiment, despite conforming to the Froude-number scaling principles. The discrepancy was bigger when the scale used wassmaller. Moreover, in very small scales we have observed problems with maintaining a sufficiently high Reynolds number, and the fire behavior has changed from turbulent to laminar, leading to significant error in the modeled smoke temperatures and invalidating the scientific value of these experiments.

2. Froude-Number Based Fire Modeling

In the early 1960s, mass fires were considered to be an extremely complex phenomena that did present formidable scaling problems. A body of literature did exist (reviewed by Williams [9]) related to the scaling of specific, simple types of fires. It was in the review paper by Williams [9] where the foundation for future scaling of fires was laid, based on the combination of several different models based on the principal laws, mathematical operations, and empirical observations. The paper introduced 29 dimensionless groups that describe the scaling principles for fire phenomena. In this modeling technique, some of the phenomena are simplified, and others are omitted on purpose. However, the overall image of the reduced-scale fire may be useful and provide a reasonably good picture of the characteristics of the full-scale system that is of interest. The concept of reduced-scale modeling was summarized by Quintiere in reference [13] and more recently in references [5,14].
In the technique of scale modeling using dimensionless numbers of similarity, the starting point is the Buckingham theorem, also known as the “Pi Theorem” [14]. The theorem states that:
“Each function involving a certain number n of physical variables ai, and these variables are expressible in terms of k independent fundamental physical quantities, then the original expression is equivalent to an equation involving a set of p = n – k dimensionless parameters Π constructed from the original variables. If all dimensionless parameters Π are identical, the phenomenon will be identical despite the different parameters of the ai type.”
The statement above (Pi Theorem) is based on the principle of dimensionless unity. Moreover, it states that if the equation expresses a proper relation between variables in physics, the process shall be dimensionally homogeneous, and its parameters will have the same dimensions [15].
Thus, a dimensionally homogeneous equation containing n mathematical variables:
Z = f ( Z 1 , Z 2 Z n )
can be recorded in the dimensionless form:
Π = Θ ( Π 1 , Π 2 Π n k ) .
It was already identified by Williams [9] that creating a model that conserves all 29 dimensionless groups would be formidable. Thus, subsets were created, of which the basic subset is presented below. The geometrical scale of the model is the ratio of the characteristic dimensions of the scaled-down model (index “m”) to the corresponding dimensions in the full scale (index “f”).
x m x f
Froude-number similarity (4), convection and radiation groups, and gas-phase heat release were grouped together with fuel gasification and loading groups, and ambient atmospheric condition groups [9].
F r f = F r m = u 0 g l  
These were foundations for future scaling principle developments. The heat release rate in small scale is determined by the scaling of Zukoski number (5), also known as dimensionless group Π9.
Π 9 = Q * = Q ρ c p T g ( x m x f ) 5 2  
In modern fire modeling, it may be assumed that two fires can are similar if the following requirements are met [8]:
  • The Froude-numbers of both of the fires are equal;
  • All geometrical features related to the fire and the environment are scaled with the same scale;
  • The fires are occurring at well-ventilated conditions, i.e. the combustion is not significantly influenced by the reduced-scale, and the combustion efficiency in full and reduced-scale is similar;
  • The flow in the buoyant plume is turbulent.
If the Froude similarity criterion is met, and Reynolds criterion is satisfied, the other relevant parameters that describe the flow of mass and heat in the compartment will scale as summarized in reference [16] and listed below.
  • The heat release rate of the fire [kW]
    Q ˙ m Q ˙ f = ( x m x f ) 5 / 2
  • Time [s]
    t m t f = ( x m x f ) 1 / 2
  • Energy [kJ]
    E m E f = ( x m x f ) 3
  • Air velocity [m/s]
    V m V f = ( x m x f ) 1 / 2
  • Mass flow [kg/s]
    m ˙ m m f = ( x m x f ) 3
  • Temperature [K]
    T m = T f
For a more thorough introduction to Fr scaling of fires, the reader is kindly referred to reference [14].
The Fr scaling approach can be potentially used in an investigation of other phenomena relevant to fire safety, where buoyancy is the dominant force in the model. An example can be flammable gas dispersion, and a recent example of full-scale research can be found in reference [17]. However, in scaling of such phenomena other set of relations may apply, as the change of density in Equation (4) will not be related to heat release, as in Equations (5) and (6).
The abovementioned set of similarities was used widely in fire safety science, in a vast array of scales. Fire sizes in literature review range from 0.31 kW to 100 MW, and the scales from full scale (1:1, [18]) to 1:48 [19]. A summary of investigated research performed in reduced-scale is shown in Table 1.

3. Materials and Methods

3.1. Experimental Setup

The Froude-number based scaling technique was used in a series of full-scale (1:1) and small scale (1:4) physical experiments on the development of a hot smoke layer in a small size fire within a small, non-ventilated compartment. The n-Heptane was used as a fuel in all of the experiments, and the size of the fire was scaled through reducing the size of the pan and the amount of fuel. A secondary goal of the experiment was to verify the concept of a novel optical densitometer, which was thoroughly described in reference [8].
The physical experiments in scale 1:1 were performed in the Building Research Institute smoke detector testing chamber (Figure 2a and Figure 3). The dimensions of the chamber are 9.60 × 9.80 × 4.00 m. The chamber was sealed, but not airtight (the leakages are not known to the authors, although no visual observation of smoke leakage to the building was observed). All doors and ventilation openings of the chamber were sealed during the experiments. Walls of the chamber are built with gypsum plasterboard (2 × 12 mm) over the aluminum structure.
Two experiments, each consisting of three repeats were performed. In the first series a fuel tray with dimensions of 0.33 × 0.33 m² was used (further referred to as series A), and in the second series, a fuel tray with dimensions of 0.50 × 0.50 m² was used (series B). In both full-scale experiments, the fuel was 1 l of n-Heptane. The Heat Release Rate (HRR) was determined through mass loss rate measurements of the fuel tray, with the assumed Heat of Combustion value Hc = 44,400 kJ/kg. No ventilation was used in the experiment. The reduced-scale experiment was performed in a scaled-down model of the test chamber (1:4) (Figure 2b and Figure 3), with the dimensions of 2.40 × 2.45 × 1.00 m³. All physical features of the compartment were further scaled down accordingly in reduced-scale experiments, except the fuel tray. The size of the fuel tray was first determined through geometrical scaling and then refined based on mass-loss measurements of the combustion of n-Heptane so that the similarity of (5) and (9) is explicitly met. The correction to the size of the tray was within 10% of the geometrical size. The experiment overview is given in Table 2. Each of the experiments was repeated three times, and the conclusions are formed based on the averaged values.
The sketch presenting both of the testing chambers, and the location of measurement equipment is shown in Figure 3. Each of the testing chambers was equipped with:
-
4 type K 1mm Ni-Cr thermocouples (T1-T4) placed in the corners of the compartment, used to measure the average temperature of the smoke layer, extended uncertainty of the measurement was estimated at 0.3 °C;
-
1 type K 1mm Ni-Cr thermocouple placed in the plume centerline, underneath the ceiling (T5), used to measure the peak temperature of the smoke upon entering the smoke layer, extended uncertainty of the measurement was estimated at 0.3 °C;
-
load cell with a resolution of 0.01 g was used to measure the mass-loss rate of fuel in the tray in both experiments, with extended uncertainty of 0.02 g;

3.2. Numerical Simulations

The fire experiments (scale 1:1 and 1:4) described in Section 3.1 were recreated with Fire Dynamics Simulator (FDS) code (version 6.7.0). FDS is a Computational Fluid Dynamics (CFD) code developed for modeling of low Mach number fluid flows, with an emphasis on smoke and heat transport as a result of fires. The FDS software can analyse the transport of heat and combustion products of a fire, heat transfer through radiation and convection, as well as conduction (1-D Fourier’s equation). The radiative heat transfer is solved using the finite volume method (FVM). The program solves the Navier-Stokes equations using a second-order finite differences scheme. The modeling includes relatively low-velocity flows (Ma < 0,1) and non-compressible gases that are gases for which density variation at low flow velocities can be disregarded. The FDS code primarily employs the Large Eddy Simulation (LES) method for the turbulence modeling, with dynamic Smagorinsky model being the default model for the turbulent viscosity. Log-law wall functions are used to characterize the flow at the boundaries. The LES modeling assumes that only the largest flow scales (large eddies) are calculated directly from the transport equations, while below the so-called Smagorinsky filter length the turbulence is solved with a sub-scale model. The size of Smagorinsky filter is determined as the cubic root of the smallest cell in the model. The fire phenomena is introduced as a single step mixing controlled combustion reaction, for which the molar fractions of products are defined, as well as the yields of relevant products (especially CO, CO2, and soot). The space discretization is performed with a uniform Cartesian type mesh, without any wall mesh boundary layers. For more information relevant to the FDS model used in this analysis, and the complete definition of the underlying physical models the reader is kindly referred to reference [34], and for information on the validation of the model is referred to reference [35]. The scope of the application of FDS makes it especially fit to simulate the heat and mass transfer phenomena in small fire experiments, where the buoyant forces within the smoke plume can be considered as the dominant forces.
In order to determine the scope of Fr scaling applicability to small fires. Figure 4 shows a 1:1 scale 3-D computer model used in numerical calculations. To prepare the CFD model geometry, we used GUI software called PyroSim, developed by Thunderhead Engineering [36]. The dimensions of the model (full scale) were 9.6 m × 9.6 m × 4.2 m.
2-D slices were used to illustrate the temperature, velocity and pressure fields. Moreover, a matrix of point measurement devices has been prepared to measure velocity flow and the temperature distribution, forming an array in two planes: Y = 5.0 and Z = 4.0 with a 0.2 m interval. In the reduced-scale simulations, the location and interval have been scaled following the geometrical scale of the model.
A total number of 12 computer simulations were performed, i.e. six simulations per series (following the same notation as full-scale experiments described in 3.1). Table 3 provides a summary of the information on numerical models. Reduction of the geometric dimensions of the model caused the compression of the computing domain and the size of individual cells. Therefore, in all different scenarios the number of grid cells was constant and equal to 3,897,600. Thus, both the resolution and position of the measurement apparatus are consistent in relation to the full-scale model. The comparison of the dimensions of all CFD models is shown in Figure 4.
Following the geometrical scale, the HRR of the test-fire was reduced (Equation (6)), as well as the simulation time (Equation (7)). Before starting the calculations, the time step of recording the results in individual simulation has been determined so that regardless of the length of calculations, 200 records are obtained. This allows us to compare the results of numerical analyses in dimensionless time, regardless of the scale of analysis. However, for clarity, all results are shown in scaled-up time, as in the scale 1:1 (Equation (7)). Table 4 shows scaled-down calculation time and time step of records for each simulation.

3.3. Mesh Sensitivity Analysis for CFD Simulations

The mesh size may be an important factor in the CFD analyses. In this case, a regular cubic grid was used in CFD simulations. The grid size must be small enough to model the turbulent effects properly. For the used LES method, a spatial resolution of 1/4 < R < 1/16 is recommended [37]. This spatial resolution is defined as R = Δ/D*, where Δ is the element size and D* is the characteristic diameter of the plume, obtained from the Froude-number calculated as [38]:
D *   =   ( Q · ρ   c p ,   T   g )
Figure 5 presents the results of mesh sensitivity analysis in the form of measurements of (a) mean layer temperature and (b) maximum plume centerline temperature 20 cm below the ceiling in the full-scale (1:1), with subsequent values of Δ = 0.20 m, 0.10 m, and 0.05 m. It can be noted that for averaged temperatures, the difference between 0.10 m and 0.05 m mesh are below 10 °C, and are smaller than the differences between 0.20 m and 0.10 m. However, the differences in the maximum centerline plume temperatures between 0.10 m and 0.05 m are much lower and significantly smaller than between 0.20 m and 0.10 m. Based on these findings, the 5 cm mesh was chosen for further simulations. For simulations in reduced scale, the D* was maintained, and the mesh size was scaled accordingly.

4. Results

4.1. Experimental Research

The HRR value for each experiment was plotted based on the moving average value (5 s averaging time) mass loss rate measurements, and the assumed Heat of Combustion of the n-Heptane, as shown in Figure 6. In the case of Series A (1:4 scale), the representation of HRR in the early part of the experiment was not detailed enough, although the duration of the combustion was close to the predictions of the analytical model. The average HRR value was similar between reduced- and full-scale experiments (less than 5% difference after scaling up the time).
The mean temperature measured (mean value of thermocouples TC1–4) showed a good fit in terms of the shape of the temperature profile and the peak value timing (see Figure 7 and Figure 8). Average temperatures in reduced-scale were up to 30% lower than in the full-scale (Figure 8a,b), which can be considered significant and in line with the previous findings in the literature [4,39]. The plume centerline temperatures were in good fit (Figure 8c,d), with the exceptions of maximum temperatures during the HRR peak. The temperatures in the middle of the compartment during cooling down period were also in good agreement. It should be noted, that expected temperatures in reduced- and full-scale should be similar if conditions for Froude-number similarity are met. To identify the source of this discrepancy, the series of numerical simulations were performed (Section 3.2) and the results are shown in Section 4.2.
Additional results, related to the smoke obscuration measurements performed during the abovementioned experiments can be found in reference [8]. These will not be discussed here, as the result analysis of the experiment was performed primarily through the analysis of the smoke plume and smoke layer temperatures.

4.2. Numerical Modeling

The mean temperatures obtained in the experimental research were compared with 1:1 and 1:4 CFD model predictions (see Figure 9). In the first 150 s of simulations, the results for 1:1 scale were in a good fit between CFD and the vscale model. However, further into the experiment, some discrepancies occurred. The temperatures in numerical analysis were lower than in the experiment, with the maximum observed difference of 14 °C (series B, 1:1 scale). For scale 1:4, the CFD gave higher temperature than the scale model in the initial part of the experiment (which may be related to lower initial HRR in the physical experiment, see Figure 7). However, in the latter part of the simulation the agreement was very good (less than 10% difference). The differences in measured temperatures between scale 1:1 and 1:4 were slightly smaller than those observed between scales 1:1 and 1:4 in the physical experiment.
Figure 10 presents the mean smoke layer temperature (measured 20 cm underneath the ceiling) for all scales investigated in the CFD analyses. As observed in the experimental part, also in the numerical calculations, the mean layer temperature decreases with the scale. For scales 1:1, 1:2 and 1:4 the temperature differences are within 10% (1:1 vs 1:2) and 20% (1:1 vs 1:4) limits. The difference between 1:1 and 1:10 scale is significant, not only in the value of the temperature but also in the temperature increment. For scale 1:1 the temperature increases in the duration of the fire, while for scale 1:10 it stabilises around 75th second of the experiment. Similar differences were also observed for the maximum centerline plume temperature, as shown in Figure 11.

5. Discussion

5.1. Modeling the Temperature of the Smoke

The data from CFD analyses was post-processed in form of spatio-temporal graphs. The x-axis presents the position on a line drawn through the middle of the room at a height of 4.00 m above the floor (with middle of the line being the plume), Figure 12. The y-axis presents the time of the experiment, scaled up following Equation (7), and the colour represents the temperature, Figure 13 and Figure 14. The measurement resolution is 20 cm. From plots, the differences in modeling the temperature in different scales are evident. For series A, the differences between scales 1:1 and 1:2 are smaller than 10%, and for series B, the results for scales 1:1, 1:2, and 1:4 show similar degree of agreement. In case of scales 1:10, 1:20, and 1:50 the results can be considered to be wrong, and to have no scientific value. It is interesting, as scales 1:10–1:25 are commonly used in research (see Equations (6)–(11)). It should be noted, that in case of this study, the fire modeled can be considered “small” and the findings may not be relevant to modeling of large fires (such as fires of tunnel vehicles or large compartment fires). Nevertheless, observed discrepancies indicate that the applicability of the Froude-number scaling theory should not be assumed for every research, and a scale sensitivity analysis should precede such efforts.
Authors cannot identify the sole reason for the observed discrepancies, although a careful examination of the assumptions and results of the modeling indicate some possible problems with maintaining the correct flow turbulence (further discussed in Section 5.2) and modeling the thermal inertia of model boundaries (further discussed in Section 5.3).

5.2. Problems with Maintaining the Reynolds Number and Laminar Flames

In Section 2, we have mentioned a rule of thumb that the flow turbulence should be maintained, which is closely related to the Reynolds number of the modeled flow. Quintiere et al. mentioned that this is usually achieved in model compartments with height > 0.3 m [5]. A simplification in this aspect is necessary, as the conservation of Froude and Reynolds numbers in the same model may be difficult. From the definition of the Reynolds number:
R e = u 0 l ρ μ  
it can be noted that scaling of the velocity or density of the fluid would invalidate the Froude similarity. Thus, if one would need to conserve the Reynolds number while following the Froude relationship, it would require scaling of the kinematic viscosity of the medium, which is not practical. However, if the flow is mainly driven by the buoyancy and is highly turbulent (we propose a rule of thumb value of Re > 10,000), the further increase of the Re number will have a limited effect on the fluid dynamics of the smoke plume or layer. In such a case, the omission of the Reynolds similarity is justified.
In practice, the flows in full fires scale are turbulent. However, once scaled down to small scale, the flow turbulence may be insufficient to justify the omission of the Reynolds scaling. In such case, the buoyant plume will not mix with the surrounding air, and the entrainment will not represent the behavior of the large scale plume. Such a problem was observed in the numerical experiments for scales 1:20 and 1:50, where laminar plumes were observed. The illustration of the plumes is shown in Figure 15. The approximated values (for velocity averaged over 30 s) of Re number for the plume flow are shown in Table 5. The approximated Reynolds number for small scales (1:10, 1:20 and 1:50) indicates, that flow structure in these scenarios was laminar (significantly below Re = 2100). In case of Series A, the Re number for scale 1:4 was most likely in the transition range between laminar and turbulent flow (Re = 2982), while in Series B the flow was turbulent (Re = 5562). This observation is coherent with the temperature differences between scales, observed between the series A and B. For scale 1:2 in series B, which was in good agreement with full-scale research, the Re number was above 10,000.
A series of snapshots presenting the structure of the plume in CFD simulations (coloured by the temperature) is shown in Figure 15. The temperature scale for each picture was individually exaggerated, to highlight the plume shape (and the flow structure), illustrating the visible differences in the plume shape between large and small scale simulations.

5.3. The Influence of the Thermal Inertia of the Boundaries

Scaling of the thermal inertia (k·ρ·c) of the physical model boundaries is often disregarded in reduced-scale research. In short-duration experiments (shorter than few minutes) such as the one shown in this paper, this may not have a significant impact on the measured temperatures, as the heat transfer to the boundaries will be insignificant compared to radiation. However, in the case of long experiments or very large fires, the differences in heat transfer in full- and reduced-scale may be important. It should be noted, that in many research available in the literature, the full-scale materials such as concrete or masonry, are represented in the reduced-scale with steel and glass. This is due to the ease of the model building process, and the ability to observe the experiments, at the cost of completely different heat transfer at the model boundaries.
The problems with the scaling of heat transfer were thoroughly described by Quintiere [14], where dimensionless groups Π3, Π5, Π6, Π7, and Π8 should be preserved. However, this leads to inconsistencies with Equation (11) and in the scaling of the convective heat transfer coefficient (and the Nusselt number). To cope with that several strategies may be used to maintain partial scaling. One is to maintain dimensionless groups Π5 and Π8 as constant, to preserve wall conduction effects [14].
Π 5 = ( k ρ c ) 1 2 ρ c p g l 3 4   ( k ρ c ) ~ ( x m x f ) 3 2
Π 8 = ( k ρ c ) W 1 2 k w   ( g l ) 1 4 δ w δ w ~ ( x m x f ) 1 4
Additional considerations must be done for radiative heat flux, especially for large fires in which the radiation flux is significantly larger than convection heat flux [14]. In some cases in which radiation is believed to dominate, the Equation (14) can be ignored, while maintaining (16) instead:
q ~ ( k w δ w ) T ~ ( x m x f ) 0 ˙ .
In practice, the thermal parameters describing the wall (k, ρ, c) and the width of the walls (δ) can be chosen accordingly to the scale. The sensitivity of the scale model to these values may be verified in numerical CFD analysis, where usually these parameters can be easily defined by the user. It should be noted that the convective heat transfer will also depend on the Nusselt number, which is related to flow velocity and turbulence. This means that considerations related to the flow turbulence from Section 5.2 are even more relevant. Nevertheless, scaling of the thermal inertia and/or width of the model boundaries is possible, and in research where convection and conduction are important to the modeled phenomena, a sensitivity analysis should be performed.
The scaling of the thermal inertia of boundaries together with the introduction of heat sinks in the gas phase of the model tunnel can be used to increase the length of a pseudo tunnel model [40]. In this approach, the heat sinks simulate the effects of heat transfer along a significantly longer section of a tunnel, which may be useful for studying flow dynamics in long tunnels, without the need for building excessively large reduced-scale models. However, this approach was only tested in linear (close to 1D) buildings and may require further validation [40].

6. Conclusions

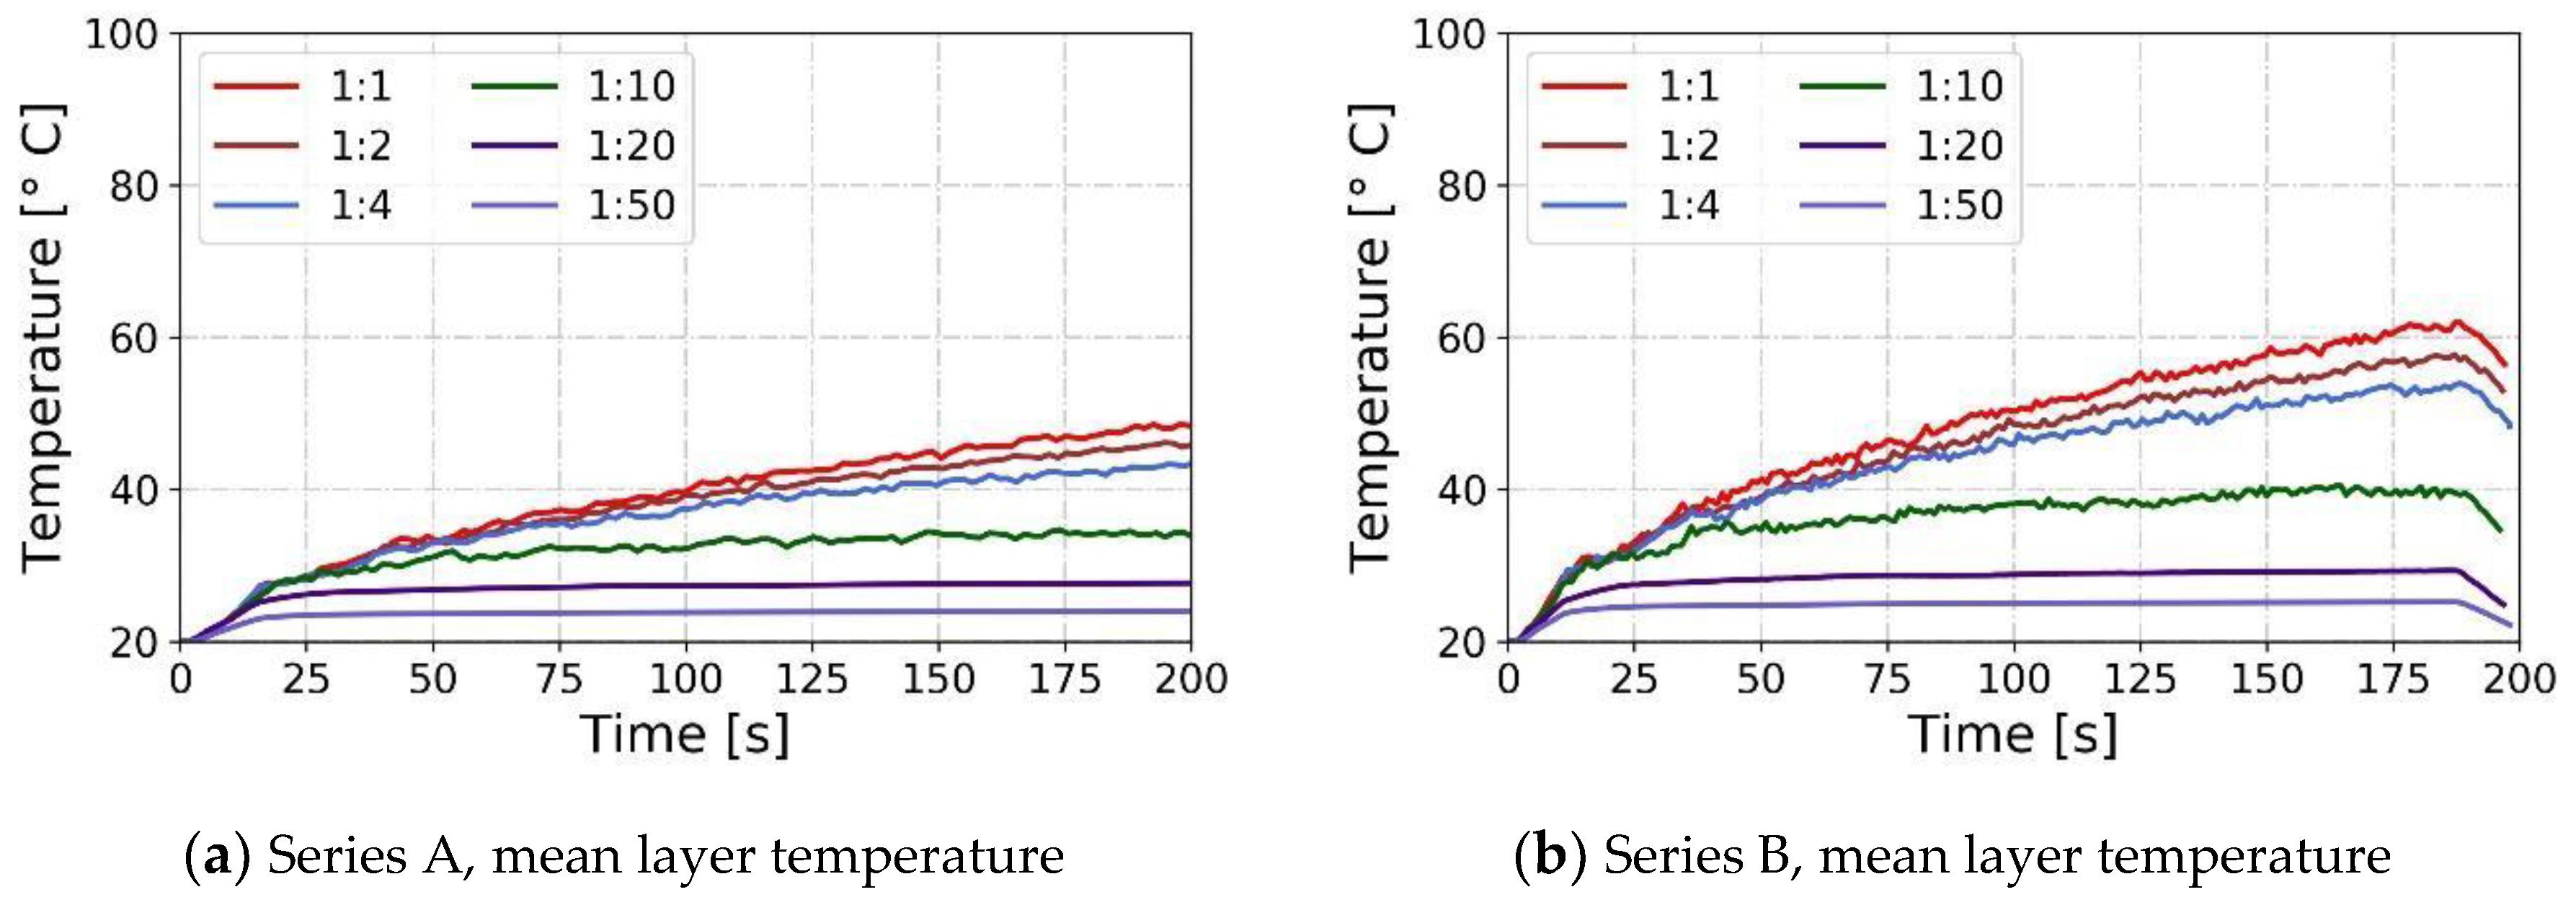
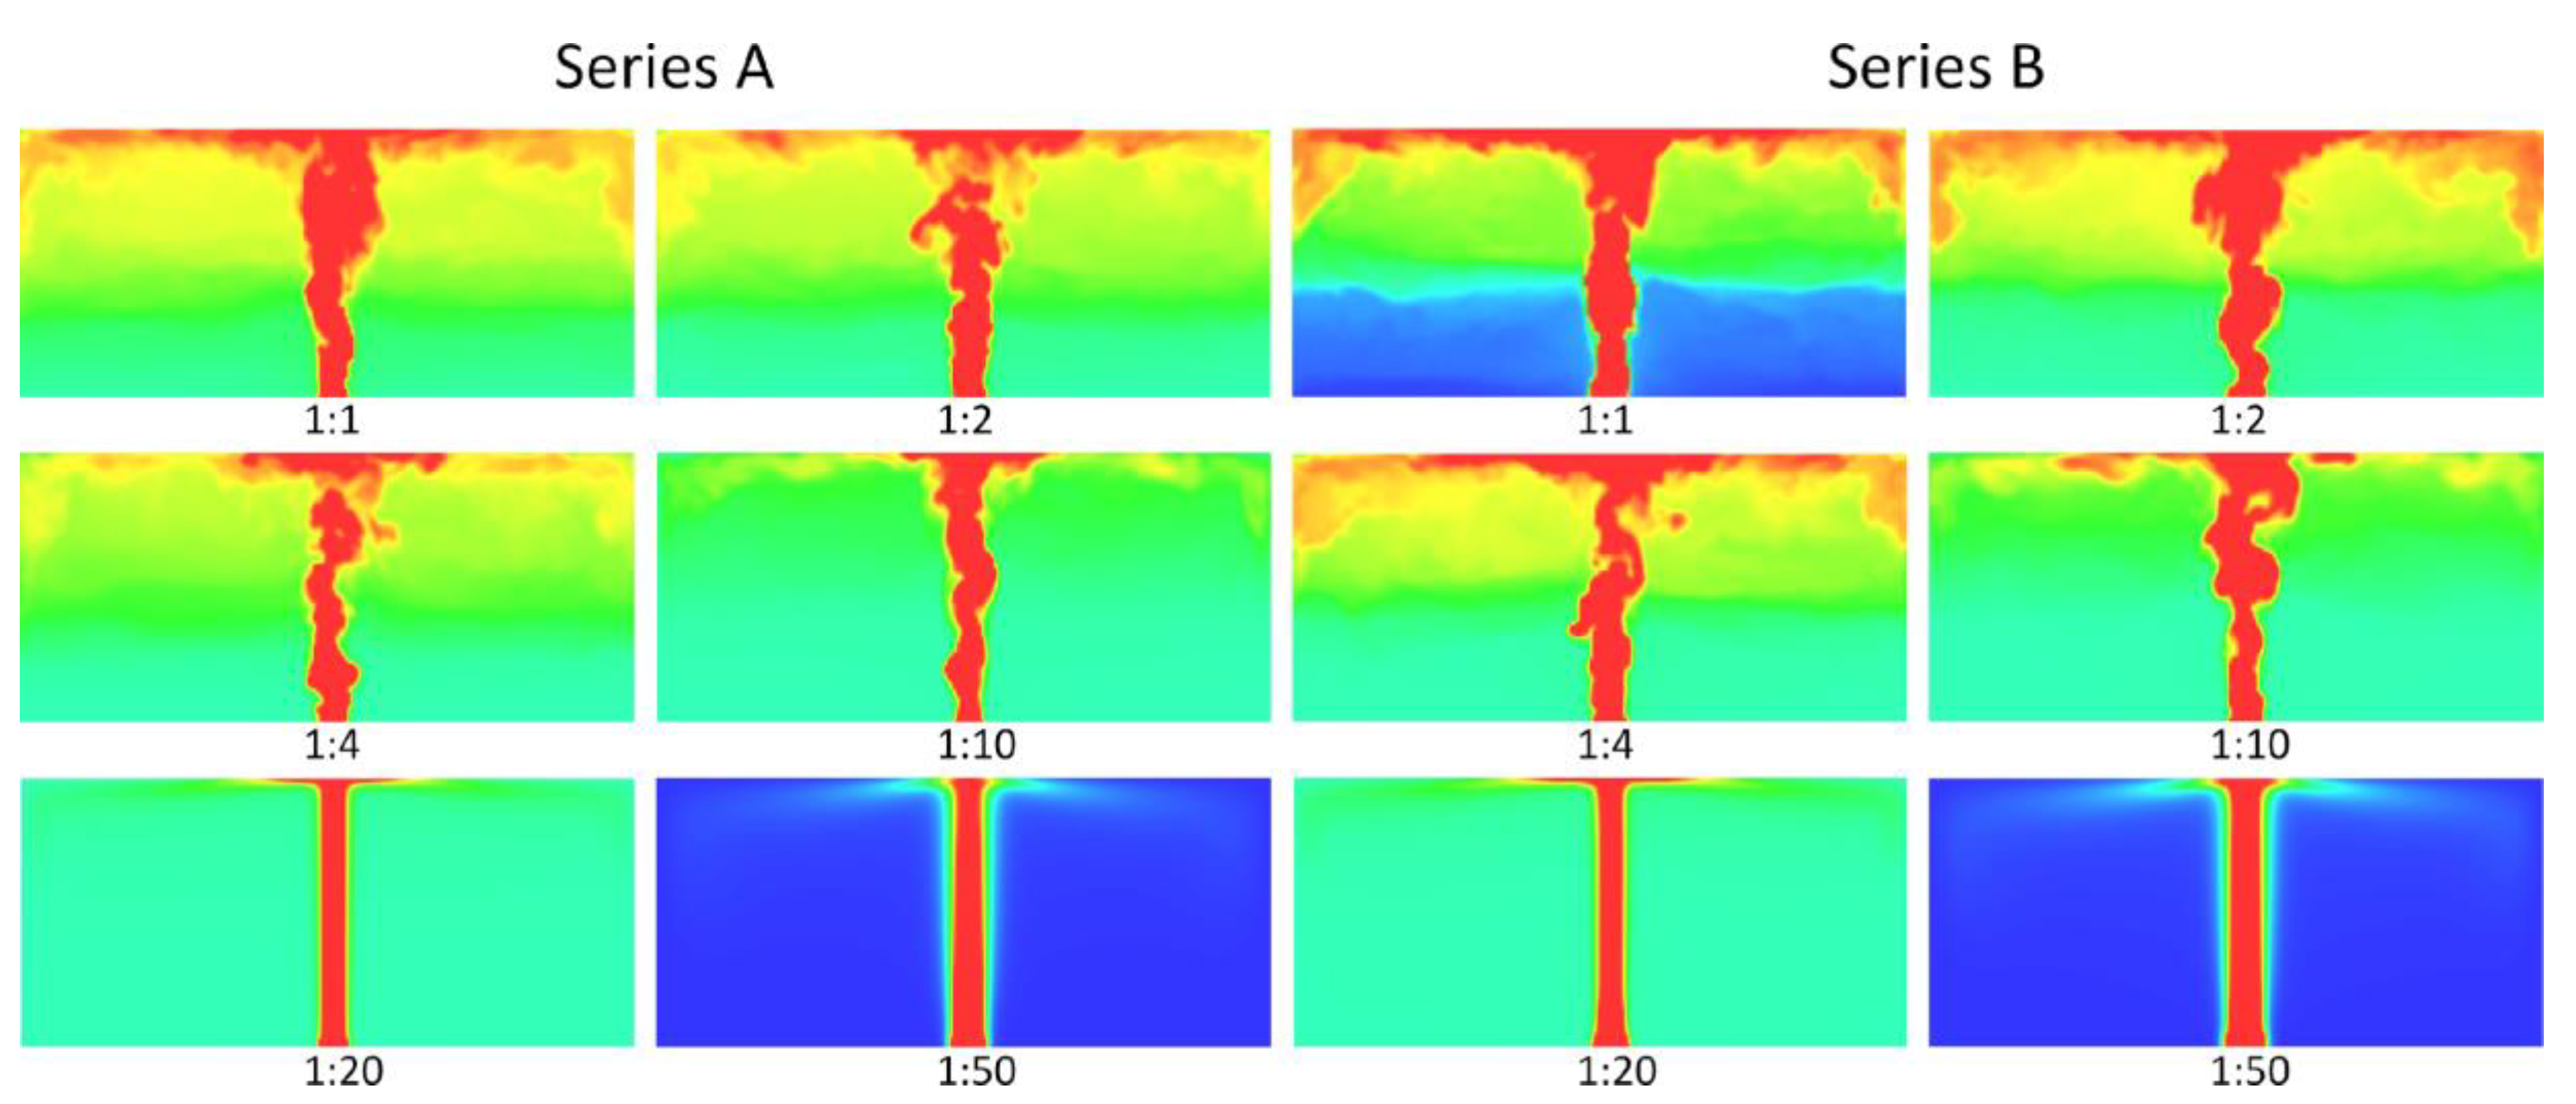
The paper has shown observed discrepancies and problems with the application of Froude-number scaling for modeling compartment fires. The experiments were performed with a wide range of Reynolds numbers, showing the essential role that turbulent flow has on the temperatures in the plume and the compartment. The previously mentioned rule of thumb value of Re = 10,000 was confirmed, to sufficiently minimize the error of the method related to the flow turbulence.
In case of small scales (1:2 and 1:4) the average temperatures measured were up to 30% lower than in the full-scale experiment, however in most of the experiment duration this difference was up to 10% (which in the opinion of the authors can be considered as an acceptable value). The temporal change in the temperature was well represented in small scale. These results indicate that the scaling method can be useful for investigation of the flow of smoke in buildings. For smaller scales (1:10 and smaller) the differences in the temperatures measured were significant, and in case of very small scales (1:20 and 1:50), the results have no scientific value due to change of the flow from turbulent to laminar.
CFD modeling with FDS software did sufficiently represent the full- and reduced-scale experiments and was used to analyze a wide array of scaled fires. A similar approach can be used before future experiments, to verify the sensitivity of the experiment to the scale, and estimate the Reynolds number of the flow. Furthermore, the numerical modeling may help with investigating the effects of materials used in the reduced-scale model on the heat transfer to the model boundaries.
As first discussed by Spalding, and mentioned by Williams [9] and Quintiere [14], the reduced-scale modeling is an art that requires the user to choose which dimensionless relations are conserved, and which are omitted. To maintain the high scientific value of scaled-down experiments, the user should make informed decisions, and use modern tools (such as CFD modeling) to assess the model sensibility to the changes introduced in the reduced-scale. As shown in this paper, just following the basic scaling theory is not sufficient to guarantee that the results of reduced-scale experiment are valid. Also, the temperature should not be considered as the only variable to be assessed. Other parameters such as flow velocity, mass concentration of pollutants, or heat fluxes may be useful for evaluating the validity of the model.

Author Contributions

Conceptualization, M.Z., P.A., A.K. and W.W.; Formal analysis, M.Z., G.K. and T.B.; Investigation, M.Z. and P.A.; Methodology, A.K. and W.W.; Resources, P.A.; Supervision, A.K. and W.W.; Visualization, M.Z., G.K. and T.B.; Writing—original draft, M.Z., G.K., T.B., A.K. and W.W.; Writing—review & editing, W.W.

Funding

This research received no external funding.

Conflicts of Interest

The authors declare no conflict of interest. The funders had no role in the design of the study; in the collection, analyses, or interpretation of data; in the writing of the manuscript, or in the decision to publish the results.

List of Symbols

c p specific heat [J/kgK]
Ddiameter of the plume
Eenergy [J]
FrFroude dimensionless number
ggravitational pull of Earth [N/kg]
HcHeat of combustion [kJ/kg]
kconductivity [W/m K]
ΚRadiation absorption coefficient
lcharacteristic length [m]
m . mass flow [kg/s]
NuNusselt number
ReReynolds dimensionless number
TTemperature [K]
ttime [s]
µkinematic viscosity [m²/s]
uair flow velocity [m/s]
Qrate of heat release [kW]
xcharacteristic dimension [m]
ρdensity [kg/m³]
Πdimensionless group

Subscripts

ffull-scale model
mreduced-scale model
oambient

References

  1. McGrattan, K. Fire modeling: Where are we? Where are we going? Fire Saf. Sci. 2005, 8, 53–68. [Google Scholar] [CrossRef]
  2. McGrattan, K.; Miles, S. Modeling Fires Using Computational Fluid Dynamics (CFD). In SFPE Handbook of Fire Protection Engineering; Springer: New York, NY, USA, 2016; pp. 1034–1065. [Google Scholar]
  3. Thomas, P.H.; Hinkley, P.L.; Theobald, C.R.; Simms, D.L. Investigations into the Flow of Hot Gases in Roof Venting; Her Majesty’s Stationary Office: London, UK, 1963. [Google Scholar]
  4. Carey, A.C. Scale Modeling of Static Fires in a Complex Geometry for Forensic Fire Applications. Ph.D. Thesis, University of Maryland, College Park, MD, USA, 2010. [Google Scholar]
  5. Quintiere, J.G.; Carey, A.C.; Reeves, L.; Mccarthy, L.K. 2008-DN-BX-K178: Scale Modeling in Fire Reconstruction; Natopnal Criminal Justice Reference Service: Rockville, MD, USA, 2017. [Google Scholar]
  6. Merci, B. Introduction to Fluid Mechanics. In SFPE Handbook of Fire Protection Engineering; Springer: New York, NY, USA, 2016; pp. 1–24. [Google Scholar]
  7. Thomas, P.H. Dimensional analysis: A magic art in fire research? Fire Saf. J. 2000, 34, 111–141. [Google Scholar] [CrossRef]
  8. Węgrzyński, W.; Antosiewicz, P.; Burdzy, T.; Zimny, M.; Krasuski, A. Smoke Obscuration Measurements in Reduced-Scale Fire Modeling Based on Froude Number Similarity. Sensors 2019, 19, 3628. [Google Scholar] [CrossRef] [PubMed]
  9. Williams, F.A. Scalling Mass Fires. In Fire Research Abstracts and Reviews, Volume 11; National Academies Press: Washington, DC, USA, 1969; pp. 1–22. ISBN 978-0-309-30950-9. [Google Scholar]
  10. Prahl, J.; Emmons, H.W. Fire induced flow through an opening. Combust. Flame 1975, 25, 369–385. [Google Scholar] [CrossRef]
  11. Harrison, R.; Spearpoint, M. The Balcony Spill Plume: Entrainment of Air into a Flow from a Compartment Opening to a Higher Projecting Balcony. Fire Technol. 2007, 43, 301–317. [Google Scholar] [CrossRef] [Green Version]
  12. Węgrzyński, W.; Konecki, M. Influence of the fire location and the size of a compartment on the heat and smoke flow out of the compartment. AIP Conf. Proc. 2018, 1922, 110007. [Google Scholar]
  13. Quintiere, J.G. Scaling applications in fire research. Fire Saf. J. 1989, 15, 3–29. [Google Scholar] [CrossRef]
  14. Quintiere, J.G. Fundamentals of Fire Phenomena; John Wiley & Sons Ltd.: Hoboken, NJ, USA, 2006. [Google Scholar]
  15. Zohuri, B. Dimensional Analysis and Self-Similarity Methods for Engineers and Scientists; Springer: New York, NY, USA, 2015; ISBN 9783319134765. [Google Scholar]
  16. Zimny, M. Physical modeling of a fire with the use of the Froude number. Bud. Archit. 2019, 18, 71–80. [Google Scholar]
  17. Brzezińska, D. Ventilation System Influence on Hydrogen Explosion Hazards in Industrial Lead-Acid Battery Rooms. Energies 2018, 11, 2086. [Google Scholar] [CrossRef]
  18. Li, Y.Z.; Ingason, H.; Lönnermark, A. Runehamar Tunnel Fire Tests; SP Technical Research Institute of Sweden: Borås, Sweden, 2011. [Google Scholar]
  19. Kim, D.H.; Park, W.H. Experiment by using reduced scale models for the fire safety of a rescue station in very long rail tunnel in Korea. Tunn. Undergr. Space Technol. 2006, 21, 303. [Google Scholar] [CrossRef]
  20. Lönnermark, A.; Lindström, J.; Li, Y.Z. Model-Scale Metro Car Fire Tests of Sweden; SP Technical Research Institute of Sweden: Borås, Sweden, 2011; ISBN 9789186622657. [Google Scholar]
  21. Heskestad, G. Modeling of enclosure fires. Symp. Combust. 1973, 14, 1021–1030. [Google Scholar] [CrossRef]
  22. Himoto, K.; Shinohara, M.; Sekizawa, A.; Takanashi, K.; Saiki, H. A field experiment on fire spread within a group of model houses. Fire Saf. J. 2018, 96, 105–114. [Google Scholar] [CrossRef]
  23. Croce, P.A.; Xin, Y. Scale modeling of quasi-steady wood crib fires in enclosures. Fire Saf. J. 2005, 40, 245–266. [Google Scholar] [CrossRef]
  24. Quintiere, J.; Mccaffrey, J.; Kashiwagi, T. A scaling study of a corridor subject to a room fire. Combust. Sci. Technol. 1978, 18, 1–19. [Google Scholar] [CrossRef]
  25. Arini, D.; Pancawardani, F.; Santoso, M.A.; Sugiarto, B.; Nugroho, Y.S. Froude Modeling of Fire Phenomena: Observation of Fire-induced Smoke Movement in Basement Structure for Firefighting Purpose. Procedia Eng. 2017, 170, 182–188. [Google Scholar] [CrossRef]
  26. Węgrzyński, W. Partitions and the flow of smoke in large volume buildings. Archit. Civ. Eng. Environ. 2018, 11, 155–164. [Google Scholar] [CrossRef]
  27. Tanaka, F.; Kawabata, N.; Ura, F. Smoke spreading characteristics during a fire in a shallow urban road tunnel with roof openings under a longitudinal external wind blowing. Fire Saf. J. 2017, 90, 156–168. [Google Scholar] [CrossRef]
  28. Kayili, S.; Yozgatligil, A.; Eralp, O.C. Effect of Ventilation and Geometrical Parameters of the Burning Object on the Heat Release Rate in Tunnel Fires. Combust. Sci. Technol. 2012, 184, 165–177. [Google Scholar] [CrossRef]
  29. Li, Y.Z.; Ingason, H. Model scale tunnel fire tests with automatic sprinkler. Fire Saf. J. 2013, 61, 298–313. [Google Scholar] [CrossRef]
  30. Li, Y.Z.; Lei, B.; Ingason, H. Scale modeling and numerical simulation of smoke control for rescue stations in long railway tunnels. J. Fire Prot. Eng. 2012, 22, 101–131. [Google Scholar] [CrossRef]
  31. Zhao, P.; Yuan, Z.; Yuan, Y.; Yu, N.; Yu, T. A Study on Ceiling Temperature Distribution and Critical Exhaust Volumetric Flow Rate in a Long-Distance Subway Tunnel Fire with a Two-Point Extraction Ventilation System. Energies 2019, 12, 1411. [Google Scholar] [CrossRef]
  32. Ingason, H.; Li, Y.Z. Model scale tunnel fire tests with longitudinal ventilation. Fire Saf. J. 2010, 45, 371–384. [Google Scholar] [CrossRef]
  33. Khattri, S.K.; Log, T.; Kraaijeveld, A. Tunnel Fire Dynamics as a Function of Longitudinal Ventilation Air Oxygen Content. Sustainability 2019, 11, 203. [Google Scholar] [CrossRef]
  34. McGrattan, K.; Hostikka, S.; McDermott, R.; Floyd, J.; Weinschenk, C.; Overholt, K. Fire Dynamics Simulator User’s Guide, 6th ed.; National Insitute of Standards and Technology: Gaithersburg, MD, USA, 2017.
  35. McGrattan, K.; Hostikka, S.; McDermott, R.; Floyd, J.; Weinschenk, C.; Overholt, K. Fire Dynamics Simulator Technical Reference Guide. Volume 3: Validation, 6th ed.; NIST Special Publication 1018-3; National Insitute of Standards and Technology: Gaithersburg, MD, USA, 2015; Volume 1.
  36. Thunderhead Engineering. PyroSim User Manual; Thunderhead Engineering: Manhattan, KS, USA, 2017; p. 167. [Google Scholar]
  37. Hill, K.; Dreisbach, J.; Joglar, F.; Najafi, B.; McGrattan, K.; Peacock, R.; Hamins, A. Verification and Validation of Selected Fire Models for Nuclear Power Plant Aplications, Volume 7; U.S. NRC: Washington, DC, USA, 2014.
  38. Hurley, M.J. SFPE Handbook of Fire Protection Engineering; Hurley, M.J., Gottuk, D., Hall, J.R., Jr., Harada, K., Kuligowski, E., Puchovsky, M., Torero, J., Watts, J.M., Jr., Wieczorek, C., Eds.; Springer: New York, NY, USA, 2016; ISBN 978-1-4939-2565-0. [Google Scholar]
  39. Barsim, M.M.; Bassily, M.A.; El-Batsh, H.M.; Rihan, Y.A.; Sherif, M.M. Froude scaling modeling in an Atrium Fire equipped with natural and transient forced ventilation. Int. J. Vent. 2019, 1–23. [Google Scholar] [CrossRef]
  40. Tanaka, F.; Fukaya, K.; Moinuddin, K.A.M. Development of a technique for establishing a pseudo tunnel length. Proc. Combust. Inst. 2019, 37, 3985–3992. [Google Scholar] [CrossRef]
Figure 1. The idea of the Froude-number reduced-scale fire modeling. Illustrating the concept of scaling down the Heat Release Rate (HRR, Q) to model a fire, which results in similar temperature (T) measured in the scaled-down (geometrical) compartment [8].
Energies 12 03625 g001
Figure 2. Full scale (a) and reduced-scale (1:4, b) experiments on the free burning of n-heptane [8]. Doors visible on picture (b) were open for the image and were sealed during experiments.
Energies 12 03625 g002
Figure 3. The overview of the test chambers, with the localization of the measuring equipment (T1-T4—four thermocouples that were placed symmetrically in four corners of the compartment, T5—thermocouple that was placed above fuel tray).
Energies 12 03625 g003
Figure 4. 3-D model of the laboratory in full-scale and comparison of the 3-D models in reduced scale.
Energies 12 03625 g004
Figure 5. Comparison of results of mesh sensitivity analysis for (a) mean values of smoke layer temperature measured 20 cm below the ceiling, and (b) maximum values of centerline plume temperature 20 cm below the ceiling.
Energies 12 03625 g005
Figure 6. Heat Release Rate measurements in the performed experiments—moving averages (5 s averaging time) calculated from mass loss measurements. Values measured in reduced-scale were scaled up based on Equations (6) and (7).
Energies 12 03625 g006
Figure 7. Mean temperature in full- and reduced-scale experiments. Value averaged on four measurements points underneath the ceiling.
Energies 12 03625 g007
Figure 8. Comparison of averaged and maximum recorded temperatures in full- and reduced-scale research.
Energies 12 03625 g008
Figure 9. Comparison of the temperature measurements in experiments and numerical simulations for full-scale and reduced-scale (1:4) experiments. The time value is scaled following Equation (7).
Energies 12 03625 g009
Figure 10. Comparison of the mean smoke layer temperature measurements in numerical experiments with different scales. The time value is scaled following Equation (7).
Energies 12 03625 g010
Figure 11. Comparison of the centerline plume temperature measurements in numerical experiments with different scales. The time value is scaled following Equation (7).
Energies 12 03625 g011
Figure 12. Location of the line along which the temperature was measured, and plotted in a function of time on Figure 13 and Figure 14.
Energies 12 03625 g012
Figure 13. Spatio-temporal plots of temperature in a line through the middle of the compartment (Figure 12), for Series A.
Energies 12 03625 g013
Figure 14. Spatio-temporal plots of temperature in a line through the middle of the compartment (Figure 12), for Series B.
Energies 12 03625 g014
Figure 15. Temperature slice through the centerline of the smoke plume, with visible vortices forming in the plume and laminar structures in scales 1:20 and 1:50, for series A (two left columns) and B (two right columns). The colour scale was individually altered to illustrate the flow structure of the plumes.
Energies 12 03625 g015
Table 1. Examples of fires in reduced-scale used in fire research.
ScaleCompartment of InterestNumber of ExperimentsHRR (Reduced-Scale)Reference
1:1Road tunnel56000–202,000 kW[18]
1:2Railway car1090–1247 kW[20]
1:2Compartmentn/an/a[21]
1:3.5Group of houses2up to 100,000 kW[22]
1:4Compartment165n/a[23]
1:7Room3300–1500 kW[24]
1:8Cellar118.31 kW[25]
1:8Corridor550–300 kW[4]
1:10Shopping mall 487.6 kW[26]
1:10Shopping mall256–10.3 kW[11]
1:12Road tunnel515.1–72.8 kW[27]
1:13Road tunnel617.81–215.1 kW[28]
1:15Road tunnel 286.7–430.1 kW[29]
1:20Road tunnel 54n/a (5–25 MW in full scale)[30]
1:20Subway tunnel1161.48–3.52 kW[31]
1:23Road tunnel 12102.2–320.8 kW[32]
1:48Train tunnel 10.31–1.88 kW[19]
undefinedSmall scale tunnel182 kW[33]
Table 2. Overview of the experiments.
SeriesSeries ASeries B
1:11:41:11:4
HRR [kW]81.7 kW2.55 kW158 kW4.94 kW
volume of fuel [L]1.0150.0158 L1.015 L0.0158 L
mass of fuel [g]0.6943 kg0.0108 kg0.6943 kg0.0108 kg
duration of the fire (real time) [s]350 s175 s181 s90.5 s
tray size [m]0.33 × 0.33 m0.075 × 0.075 m0.50 × 0.50 m0.125 × 0.125 m
Table 3. Parameters of the Fire Dynamics Simulator (FDS) numerical models.
ScenarioScaleModel Dimensions [m]Grid Size [m]Number of Grid Cells
1 A, B1:19.6 × 9.6 × 4.20.053,897,600
2 A, B1:24.8 × 4.8 × 2.10.0253,897,600
3 A, B1:42.4 × 2.4 × 1.050.01253,897,600
4 A, B1:100.96 × 0.96 × 0.420.0053,897,600
5 A, B1:200.48 × 0.48 0.210.00253,897,600
6 A, B1:500.192 × 0.192 × 0.0840.0013,897,600
Table 4. Overview of the Computational Fluid Dynamics (CFD) simulations.
ScenarioScaleTray Size [m]HRR Per Unit of Area [kW/ m 2 ]Calculation Time [s]Length of a Time Step for Results Analysis [s]
1 A1:10.35 × 0.357503501.75
1 B1:10.5 × 0.5 5841970.975
2 A1:20.175 × 0.1755302471.24
2 B1:20.25 × 0.254141390.7
3 A1:40.0875 × 0.08753751750.88
3 B1:40.125 × 0.125293990.49
4 A1:100.035 × 0.0352371100.55
4 B1:100.05 × 0.05185620.31
5 A1:200.0175 × 0.0175167780.39
5 B1:200.025 × 0.025131440.22
6 A 1:500.007 × 0.007106500.25
6 B1:500.01 × 0.0183280.14
Table 5. Approximation of the plume centerline Reynolds number.
ScaleVelocity [m/s]
(CFD)
Velocity [m/s] (Calculated with Equation (9))Reynolds Number (CFD) 1Reynolds Number (Calculated) 1
Series A
1:11.501.5027,53127,531
1:20.951.0687189734
1:40.650.7529823441
1:100.400.47734871
1:200.050.3446308
1:500.080.212978
Series B
1:11.501.5041,71341,713
1:21.001.0613,90414,748
1:40.800.7555625214
1:100,500.4713901319
1:200.070.3497466
1:500.090.2150118
1 For the purpose of this calculation, the kinematic viscosity of air was taken as for the air temperature of 60 °C and the characteristic dimension was chosen as the characteristic size of the pan (width of the plume).

