A Novel Machine Learning-Based Short-Circuit Current Prediction Method for Active Distribution Networks


College of Electrical Engineering, Zhejiang University, Hangzhou 310027, China
*
Author to whom correspondence should be addressed.
Energies 2019, 12(19), 3793; https://0-doi-org.brum.beds.ac.uk/10.3390/en12193793
Submission received: 2 September 2019
/
Revised: 20 September 2019
/
Accepted: 2 October 2019
/
Published: 7 October 2019
(This article belongs to the Section A1: Smart Grids and Microgrids)
Abstract
:The traditional mechanism models used in short-circuit current calculations have shortcomings in terms of accuracy and speed for distribution systems with inverter-interfaced distributed generators (IIDGs). Faced with this issue, this paper proposes a novel data-driven short-circuit current prediction method for active distribution systems. This method can be used to accurately predict the short-circuit current flowing through a specified measurement point when a fault occurs at any position in the distribution network. By analyzing the features related to the short-circuit current in active distribution networks, feature combination is introduced to reflect the short-circuit current. Specifically, the short-circuit current where IIDGs are not connected into the system is treated as the key feature. The accuracy and efficiency of the proposed method are verified using the IEEE 34-node test system. The requirement of the sample sizes for distribution systems of different scale is further analyzed by using the additional IEEE 13-node and 69-node test systems. The applicability of the proposed method in large-scale distribution network with high penetration of IIDGs is verified as well.
1. Introduction
Power inverters are commonly used to interface distributed generators (DGs) with distribution systems. Due to the strong nonlinear characteristics of inverter-interfaced distributed generators (IIDGs), the short-circuit current of IIDGs is significantly different from traditional generators [1], which is typically smaller than two times the rated current. In the case where the penetration of IIDGs in the distribution system is not high, the traditional symmetrical component method can still be used to calculate the short-circuit current, where the IIDGs are assumed to be disconnected from the grid when fault occurs. However, with the continuous increase of IIDG penetration, it is difficult to meet the application requirements, due to the increasing calculation errors of short-circuit current. Thus, the demand for the accurate and efficient short-circuit current calculation method in a distribution system with high penetration of IIDGs is becoming increasingly urgent.
There have been a large number of studies on short-circuit current calculation in distribution networks with IIDGs. In [2], under the assumption that IIDG is a generator with constant power output after fault, the short-circuit current was calculated by obtaining the state variables, which were kept constant during fault via power flow calculations. However, the low-voltage ride through (LVRT) characteristics and the current limiting effect of IIDG were not considered. In [3], the fault model of a photovoltaic (PV) system is equivalent to the voltage-controlled current source model, where the influence of the protection strategy on the short-circuit current of PV was analyzed. The iterative algorithm is adopted in the calculation of short-circuit current. In [4], a current source model for an IIDG with reactive power support during the LVRT was established by taking the ride through time of several IIDGs into consideration. An iterative algorithm using sequence network superposition was also proposed. In [5], the LVRT characteristics of IIDG were considered, and different fault equivalent models were established according to the positions of IIDGs in the distribution network, which is either upstream or downstream of the fault position. The iterative short-circuit current calculation method based on the superposition principle was adopted as well.
The above relevant literatures mainly focus on the method of mechanism modeling, in which the equivalent fault model of IIDG is established for the short-circuit current calculation. However, because of the model complexity of various IIDGs, the fault equivalent model of IIDG is often simplified according to the application scenario. Therefore, the applicability and accuracy of the equivalent model are limited, because the user needs to select the appropriate model according to actual demands. In addition, for the output current of IIDGs that is affected by factors such as grid-connected voltage, it is necessary to use an iterative algorithm to continuously correct the short-circuit current until the accuracy requirement is met. Consequently, the computational efficiency is low. With the increase of IIDG penetration and the complexity of control strategies, the shortcomings of mechanism modeling methods in terms of calculation speed, accuracy, and versatility are becoming increasingly obvious.
In recent years, artificial intelligence, especially machine learning methods, has received more and more attention [6,7,8,9]. Machine learning is a data-driven modeling method, where the correspondence between the input and the output can be established based on the sufficient known data called the sample set. Therefore, internal relationships can be directly extracted from the data without mechanism modeling. At present, applications of machine learning have achieved inspiring results in complicated problems that struggle to be modeled by the mechanism [10,11,12,13], which offers new insights for the short-circuit current calculation in distribution networks with IIDGs. For a certain steady-state operation mode of a specific distribution network, the short-circuit current flowing through a certain point is unique when fault information (i.e., fault position and type) is determined. Therefore, the mapping relationship between the short-circuit current and features of the distribution network can be automatically learned using machine learning technologies.
To this end, a novel data-driven short-circuit current prediction method for active distribution networks is proposed in this paper. Based on limited electric quantities and switch signals provided by the online monitoring system of the distribution network, the proposed approach is able to provide an accurate real-time prediction of the short-circuit current flowing through a specified measurement point for any kind of fault occurring in the network. The main contributions of this paper are as follows. (1) The proposed approach absorbs the calculated short-circuit current when IIDGs are not connected to the system as a key feature in the model training. (2) The extreme gradient boosting (XGBoost) algorithm is utilized to accurately map the relationships between the short-circuit current and the features of the distribution network. (3) The requirement of sample set size for different scale networks is analyzed and the applicability of the proposed method in large-scale active distribution networks is verified. The proposed data-driven approach has potential applications in adaptive settings and the coordination of protection relays, fault management, etc., which are all based on short-circuit calculation.
The rest of this paper is organized as follows. In Section 2, the overview and consideration of the proposed methodology is presented. In Section 3, the research object and sample composition of the proposed method is described. Section 4 introduces the algorithm of XGBoost. Section 5 presents the proposed data-driven short-circuit current prediction method. In Section 6, the simulation results for model verification are shown. Finally, Section 7 concludes the paper.
2. Overview and Consideration of the Proposed Methodology
In active distribution networks, short-circuit current calculation is one of the critical parts for many power applications of distribution system, such as adaptive settings and coordination of protection relays; for example, in the adaptive protection of active distribution systems, the settings of protection relays are expected to adapt automatically to the operation modes, which are reflected by the data provided by the online monitoring system of the distribution network, such as the distribution management system (DMS). Accurate and real-time short-circuit current calculation will facilitate the rationality and coordination of adaptive protection. In the existing literature, short-circuit current calculation methods are typically based on mechanism models, where online iterative calculation is needed, using the obtained electric quantities and switch signals. The real-time capability of calculation may not be guaranteed. Besides, the equivalent models of IIDGs are simplified to some extent, where different-level errors may introduce in the mechanism models. Therefore, these methods have shortcomings in efficiency and accuracy.
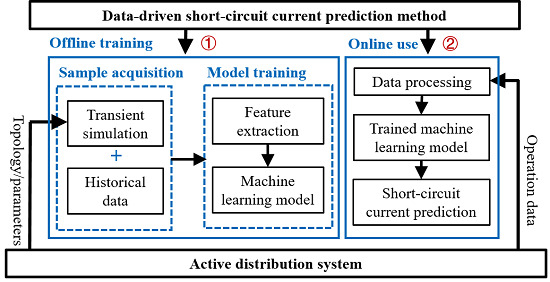
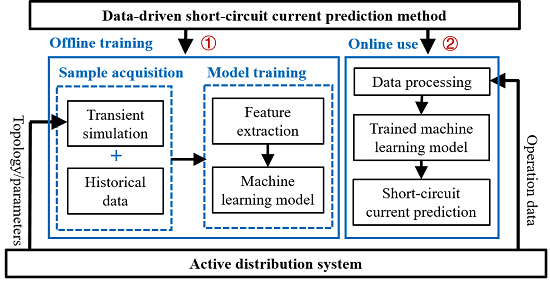
For this point, this paper proposes a short-circuit current prediction method based on machine learning. Based on some monitoring data related to the operation modes and fault features, the short-circuit current flowing through a specified measurement point can be accurately predicted in real-time for any kind of fault occurring in the network. The overall framework of the method is shown in Figure 1, which includes the procedures of offline training and online prediction. In the procedure of offline training, the sample set is established by using the historical data or simulation data of the active distribution network. Here, the sample set represents the set of all samples, including the training and test samples. The training/test samples represent the samples that are used in model training/testing. To meet the criteria of using fewer features and achieving higher quality, a feature composition of the sample for this problem is proposed. Then, machine learning models for different fault types are acquired offline by the training sets (the set of training samples) derived from historical data or simulation data. In the procedure of online application, the data of required sample features are collected at first. Then, according to the fault type, the corresponding model is selected to predict the short-circuit current directly.
Note that the online prediction of the proposed method is a straightforward process without iterations, which is extremely time-efficient. This is because the relationships between various features and the output have already been constructed in the procedure of offline training and can be used in online prediction directly. In addition, as the machine learning model learns the mapping relationships of the historical data or simulation data, there is no need for IIDG modeling where the control strategies and element parameters are required. Thus, the prediction accuracy of short-circuit current will not be affected via the proposed approach, which is unlike the simplified modeling of IIDG in the mechanism model-based methods.
3. Research Object and Sample Composition
3.1. Research Object
In this paper, the machine learning method is expected to establish a suitable short-circuit current prediction model, which learns the relationship between distribution network features and the short-circuit current. The requirement in short-circuit current calculation is as follows; when different short-circuit faults occur in different positions in distribution network, it is able to calculate the short-circuit current flowing through a certain equipment or protection relay to determine whether the equipment is safe or the operation of the protection relay is correct.
In machine learning, model selection is of great importance, which directly influences the model accuracy and complexity. Short-circuit current calculation should account for available measurements provided by measurement equipment, different fault positions, and fault types comprehensively. If the learning models are trained separately for each measurement, fault location, and fault type, the number of required models will be considerably large. In addition, with the increase of distribution network scale, the model training and selection will be more difficult. To reduce the number of required training models and improve the prediction accuracy of short-circuit current, the data-driven based models are developed as per fault type. In this way, the training models can be adopted according to different fault types, which is similar as the traditional short-circuit current calculation methods. Meanwhile, the number of model training and selection procedures is greatly reduced.
3.2. Sample Composition
Before machine learning, it is essential to determine the features and labels that make up the sample set. In this application, the short-circuit current flowing through the measurement point is the sample label. The distribution network features that determine the short-circuit current are the sample features, which usually include steady-state features and fault features. Steady-state features include electrical characteristics reflecting the steady-state operating state of the system, such as node voltage amplitude and phase angle, power transmitted by the line, equivalent impedance of rotating generators, loads, IIDG capacity and its injection current, etc. The topology characteristics of the distribution network, such as the grid connection statuses of IIDGs and the switching statuses of lines, are also included in the steady-state features. Fault features mainly include the fault positions. As for the fault type, it is considered as a known condition.
Although the above distribution network features are comprehensive, the feature number will increase with the growth of the distribution network scale. When the distribution network is of a large scale, the feature number will be very large, which is not conducive to machine learning. Moreover, only a small part of these features has a significant impact on the short-circuit current. Most of features are redundant with low quality, which are not helpful to improve the performance of the machine learning model. Therefore, it is necessary to find a suitable combination of features with fewer number and higher quality.
The active distribution network can be treated as a system that consists of the passive distribution network without IIDGs and the connected IIDGs. Therefore, the short-circuit current in the active distribution network can be treated as some kind of superposition of the short-circuit current contributed by the passive distribution network without IIDGs and the current provided by IIDGs during a fault. Based on this, the short-circuit current flowing through the measurement point, in the condition that the same fault occurs in the distribution network without IIDGs in the same operation mode, referred to as If, is elaborately selected as one of the sample features. As If is the short-circuit current calculated by the fault analysis mechanism model for the distribution network merely without IIDGs, the reliability and interpretability of the machine learning model can be improved. Meanwhile, the number of features can be potentially reduced because If implies a lot of distribution network information, such as the operation mode and fault features. With the above consideration, the sample composition is shown in Table 1.
In Table 1, f_type denotes the fault type, which represents the different sample types. Among the features, in addition to the aforementioned key feature If, the remaining features reflect the other steady-state and fault features of the distribution network. The grid connection status of the IIDG αj and the IIDG capacity SDGj are the features reflecting the impact of IIDGs on the short-circuit current, where αj = 1 and αj = 0 mean that the j-th IIDG is connected/not connected into the grid, respectively. SDGj is the capacity of the j-th IIDG. The cut-off line, line_cut, is a feature indicating the topology change of the distribution network. The fault line, f_line, and the fault position, f_pos, reflect the fault information. The value of f_pos ranges from 0 to 1, where 0 and 1 indicate that the fault occurs at the headend and the terminal position of the line, respectively. The values between 0 and 1 represent the percentage distance from the headend. The short-circuit current flowing through the measurement point when IIDGs are connected, referred to as If_DG, is the sample label. Both the features and the sample labels form the sample of the short-circuit current prediction model that corresponds to each fault type.
4. XGBoost Method for Short-Circuit Current Prediction
4.1. XGBoost Algorithm
The machine learning algorithms for regression problems are expected to exploit the internal relationships between the features and labels, which typically include support vector regression (SVR) [14], random forest (RF) [15], gradient boosting decision tree (GBDT) [16], XGBoost [17], and so on. RF, GBDT, and XGBoost algorithms are ensemble learning models based on decision regression trees, which are more capable of fitting complex features and large-scale samples. Therefore, their performance is better than SVR, which is based on the principle of finding the optimal hyperplane to minimize the expected risk. Among the three ensemble learning methods, RF is based on the idea of bagging, whereas both GBDT and XGBoost are based on the idea of boosting. From the perspective of bias–variance decomposition in machine learning, the idea of bagging mainly reduces variance, whereas the idea of boosting can reduce both the bias and the variance [18]. Thus, boosting has better performance compared with bagging in the regression problem. Compared with GBDT, XGBoost algorithm is further optimized by using the second derivative of the training loss function in the model training. In addition, the regularization term that considers the complexity of the tree model is added. Therefore, the trained model based on XGBoost may have better generalization ability. To this end, this paper adopts the XGBoost algorithm to map the relationships between distribution network features and short-circuit current. The principles for XGBoost algorithm are described as follows.
For a training sample set with N samples and L features D = {(xi, yi)|xi RL, yi R, i = 1,2,…,N}, the final training result of XGBoost algorithm is an ensemble model with K additive CART regression tree functions:
where is the output of the model, in other words, the prediction result. K represents the total number of CART regression trees. F = {f(x) = wq(x)}(w RT, q: RL → {1,2,…,T}) is the set of CART regression trees, in which f(x) represents the decision function of the regression tree, whereas q indicates the structure of the tree and represents the decision rule of the tree. T is the number of leaves in the tree. Unlike decision trees, each leaf of the regression tree, i, has a weight, wi, which is a continuous value. The weight vector of the tree w consists of all wi. Each fk corresponds to a specific tree structure, q, and leaf weight, w. Any sample can be classified into a certain leaf to obtain a corresponding weight value according to q. For a certain sample, it is classified into corresponding leaves on each regression tree. The final prediction value is obtained by summing the weights of the corresponding leaves on all regression trees.
The objective function of XGBoost is as follows,
where
In Equation (2), l is a derivable training loss function that measures the deviation between the prediction value, , and the target value, yi. The training loss function can be selected as the square loss function, the logarithmic loss function, and so on, accordingly. This paper studies the regression problem, and thus the square loss function is selected. The second term Ω in Equation (2) is the regularization term, which measures the model complexity (i.e., the regression tree function). The model complexity includes two parts: the number of leaves and the leaf weights. The parameters γ and λ are used to control the ratio between the two parts. The regularization term added in the objective function can not only ensure the model accuracy, but also make the model structure not too complicated. Thus, the improvement of model generalization ability and overfitting avoidance can be achieved.
In the XGBoost algorithm, model training is performed by adding the tree model iteratively, that is, adding a CART decision tree function, fk, in each step of the training process so that the objective can be further minimized. Hence, the objective function of t-th step Obj(t) is as follows
where and represent the prediction output in steps t−1 and t, respectively. The new tree structure ft makes the prediction output turn into = + ft(xi). To make the objective optimization easier, the above formula is approximated using the second-order Taylor expansion as follows,
where
In Equation (5), gi and hi represent the first-order and second-order gradients on the loss function l at the expansion point, respectively. The second-order Taylor approximation is employed to minimize the objective function quickly and improve the versatility of the algorithm. In the optimization at each step, a new structure scoring function and a greedy algorithm for split finding are adopted to establish an optimal regression tree structure, and thus minimize the objective function (5). These measures are also the improvements compared to traditional gradient tree boosting.
With the aforementioned manner of adding the tree function iteratively, the final XGBoost model ϕ(xi) will be obtained when the accuracy improvement of the increased tree model is less than a threshold value ε or the number of tree models reaches the upper limit K.
4.2. Performance Indicator
To evaluate the accuracy of the short-circuit current prediction model, the mean absolute percentage error (MAPE) is chosen as the performance indicator, which is defined as follows,
where N is the number of samples in the accuracy evaluation. yt is the label value of the t-th sample. is the prediction value of the t-th sample. MAPE reflects the relative error between the prediction and the actual value of the short-circuit current. Smaller MAPE implies that more accurate prediction of short-circuit current is acquired.
5. Data-Driven Short-Circuit Current Prediction Method
5.1. Sample Set Establishment
Machine learning modeling relies on a sufficient and complete sample set that reflects the mapping relationship between the features and objective, as the short-circuit current changes with the operation modes and fault conditions. To obtain a sufficient sample set, the method used in [19] is adopted to generate different operation modes and fault conditions.
To make the samples more diverse, M basic operation modes (M ≥ 1) are considered for a distribution network with c rotating generators, s IIDGs and l loads. The configuration parameters of rotating generators, IIDGs, and loads can be set according to requirements. Taking a basic operation mode as an example, the equivalent impedances of rotating generators are Zbasei (i = 1, 2, …, c); the IIDG outputs are SDGbasej (j = 1, 2, …, s); and the active and reactive power of loads are PLbasek and QLbasek (k = 1, 2, …, l), respectively. Different operation modes of the system can be obtained by generating different equivalent impedances of rotating generators, IIDG outputs, and load demands using Equations (8)–(10):
In Equations (8)–(10), τi (i = 1, 2, …, c), βj (j = 1, 2, …, s) and ρPk/ρQk (k = 1, 2, …, l) are randomly generated in the range of [−0.2, 0.2], which represent the variations of equivalent impedances of rotating generators, IIDG outputs, and loads, respectively. These parameters obey the uniform distribution, which aims to generate different operation modes with equal probability.
In addition, considering the grid connection statuses of IIDGs, a vector α = [α1 α2 … αs]T is randomly generated for each operation mode, where αj = 0 or 1 (j = 1, 2, …, s). αj = 0 means that the j-th IIDG is disconnected from the grid, whereas αj = 1 means that the j-th IIDG is connected into the grid. Moreover, the topology change of the network is considered from the perspective of the N − 1 principle. The cut-off line, line_cut, will be randomly generated from the line set for each operation mode. The line set contains all the lines in the distribution network which are represented by line numbers. The number 0 is used to indicate that no line is cut (i.e., the complete network topology). Fault conditions are also randomly generated, including fault line, f_line, and fault position, f_pos. The fault line is also randomly selected from the line set that excludes the number 0. The fault type f_type, denoted by numbers 1 to 10, is automatically set with all 10 combinations of four fault types, which contains single-phase grounding, two-phase grounding, phase-to-phase, and three-phase short-circuit fault.
In the generation of samples, the steady-state and fault features of the distribution network except If are first obtained through random settings of operation mode and fault condition. The corresponding short-circuit current when IIDGs are connected, namely, If_DG, is set as the label. Subsequently, for each simulated operation mode and fault condition of 10 fault types, the short-circuit current flowing through the measurement point without any IIDG, namely, If, is obtained via simulation. With the above process, the sample sets of 10 machine learning models can be accumulated.
5.2. Short-Circuit Current Prediction Process
The flow chart of the proposed short-circuit current prediction method based on XGBoost is shown in Figure 2, which includes offline training and online application.
In offline training, ten machine learning models are trained for 10 fault types, respectively. First, the configuration parameters of M basic operation modes and the number of samples e for each basic operation mode are set according to the user requirement. Then, for each operation mode, i, configuration parameters are randomly generated based on the basic operation mode as described in Section 5.1, which includes the equivalent impedance of the system, loads, network topology, etc. The fault line and position are also randomly generated. Next, on the basis of the operation mode and fault parameters, ten fault types are set in turn. For each fault type, first, the feature If is obtained through simulation. Then, IIDGs are added into the simulation model according to IIDG parameters that are randomly generated, and thus If_DG is obtained using simulation. Therefore, the features, which include If and steady-state and fault features, as well as the label If_DG for each fault type, are acquired. With all 10 × e simulations completed, ten original sample sets of corresponding fault types are established. Before model training, the data preprocessing procedure, such as one-hot encoding of specific features, is performed to transform the original sample sets into the ones for model training. Then, hyperparameter selection for model training is performed through cross-validation, which will be further introduced in Section 6. Finally, using the appropriately selected hyperparameters, the machine learning models are acquired.
In online application, first, the trained model is selected according to the fault type that the user chooses. The statuses of IIDGs and information of operation mode are firstly obtained from the online monitoring systems. Then, according to the current operation mode and fault location setting, If is calculated by using traditional short-circuit current calculation program. Combining If with IIDG connection statuses and so on, the initial features of the sample are obtained. Using the same data preprocessing procedure as the training phase, the requested sample of the model is obtained. Finally, the short-circuit current prediction result is obtained by using the pretrained machine learning model. In real applications, the proposed method can be used in short-circuit current calculation software of distribution systems, which facilitate the applications of adaptive setting and coordination of protection relays, fault management, etc., which are based on short-circuit calculation.
6. Case Study
6.1. Case and Sample Generation
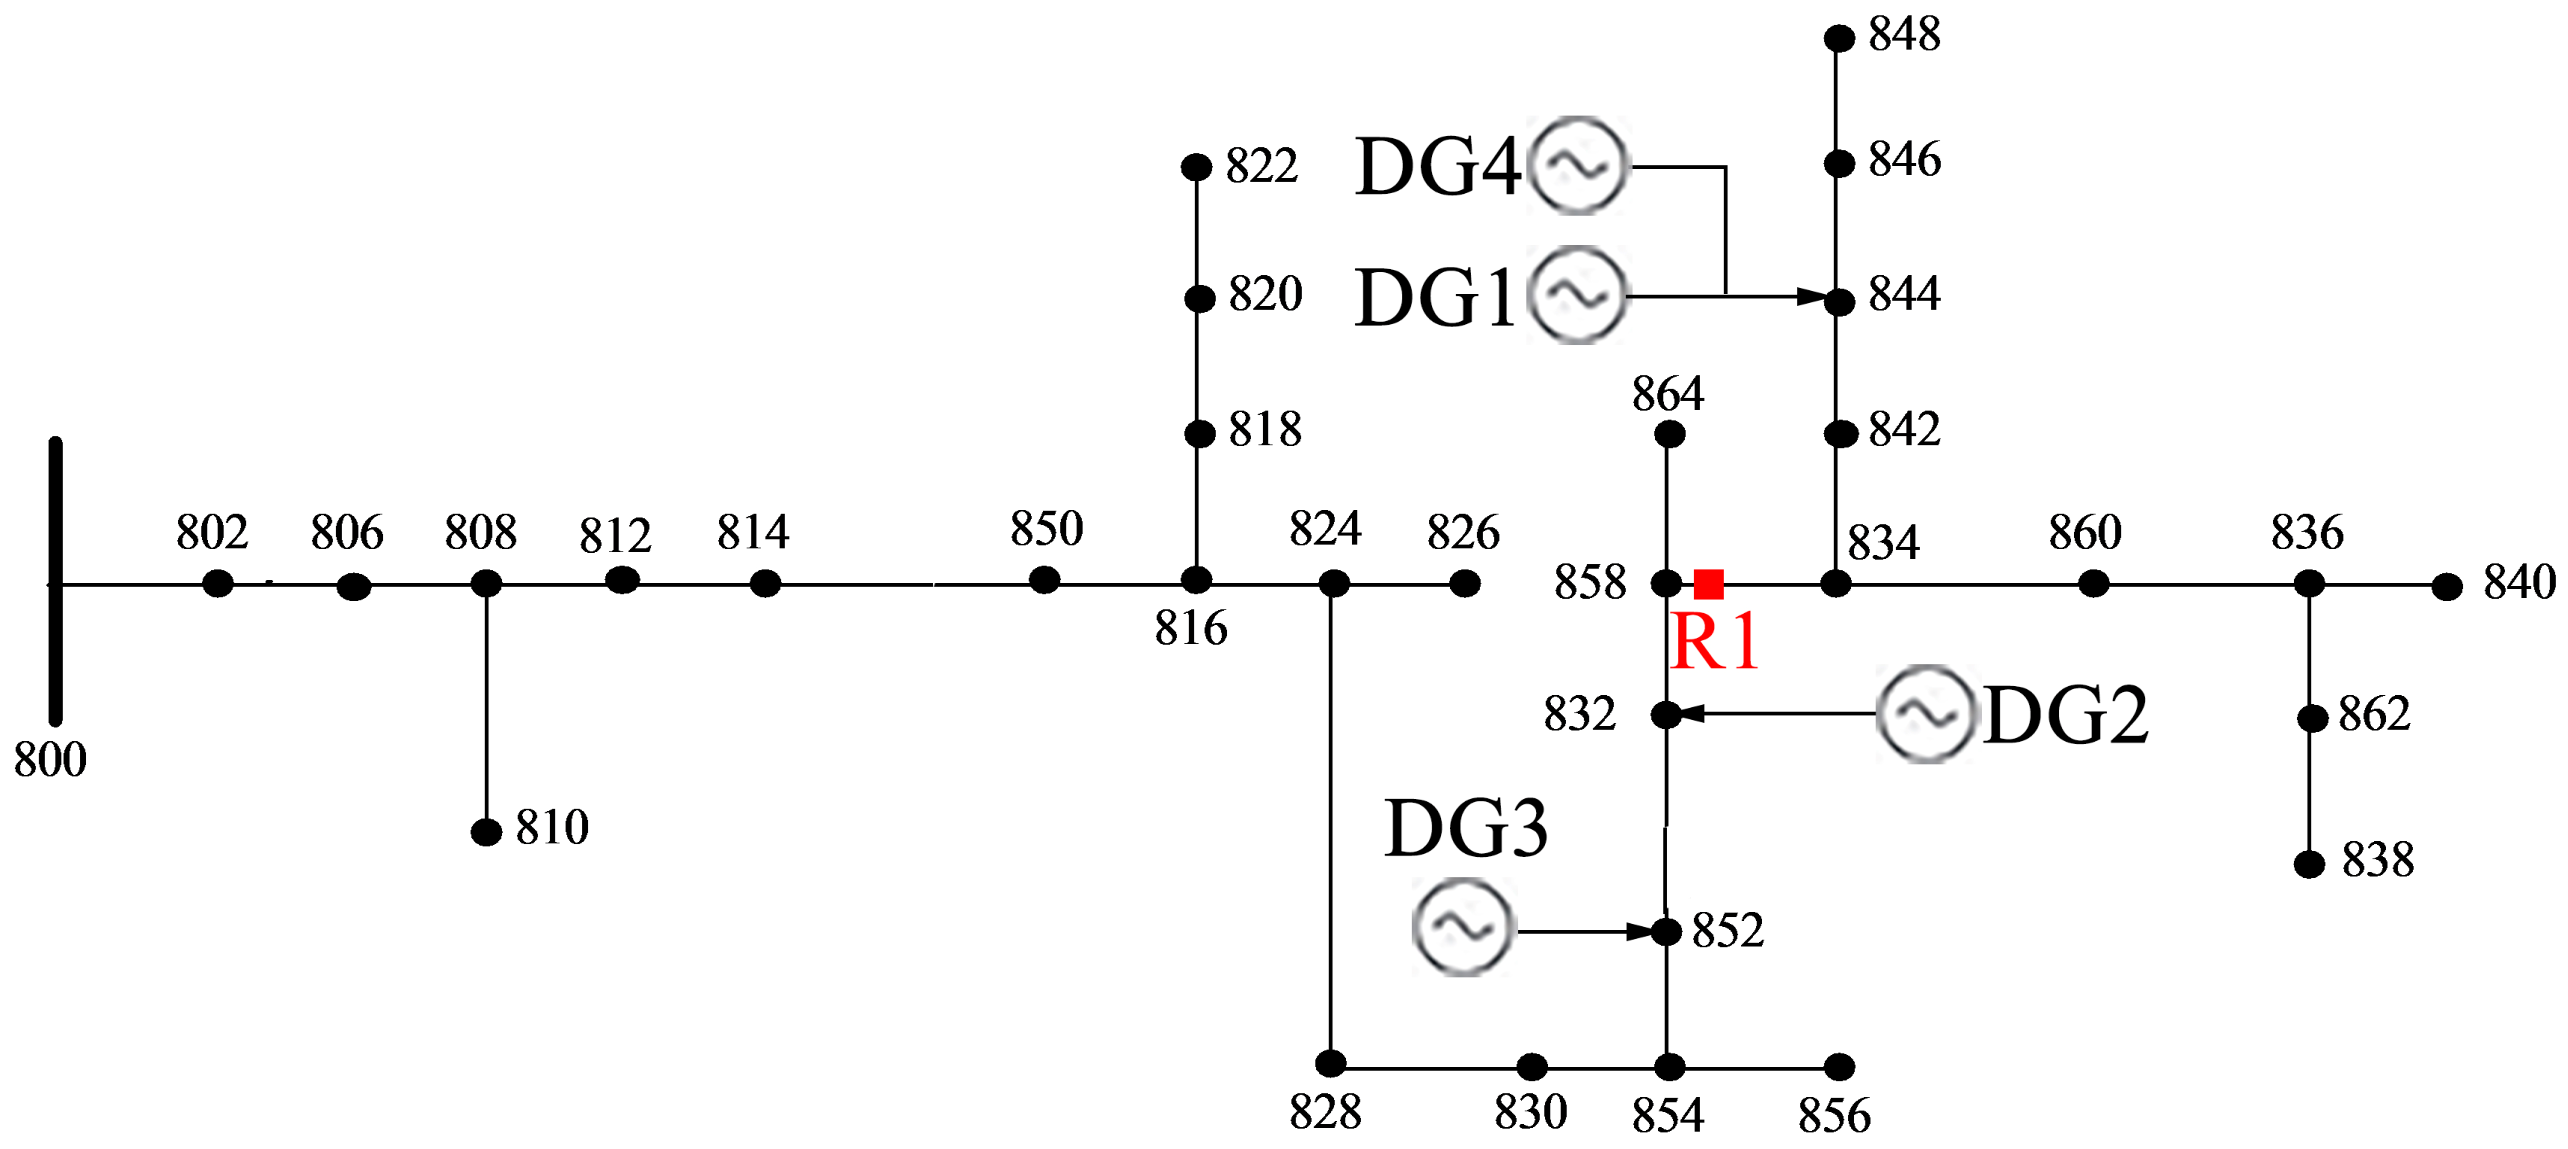
To verify the feasibility of the proposed method, a modified IEEE 34-node test feeder is used as an example. The structure of the system is shown in Figure 3. The rated voltage of the distribution system is 24.9 kV, and the system has 31 lines. The swing bus is Node 800, and IIDGs are considered in this test case. This test network is an unbalanced system that consists of unbalanced loads and lines, including single-phase and three-phase loads and lines with different mutual impedances between phases.
The simulation model of the above IEEE 34-node distribution system is established in MATLAB/Simulink. In this case study, the maximum and minimum basic operation modes of the system are considered, and thus M is set as 2. The equivalent impedances of these two modes are set as j0.5 Ω and j1 Ω, respectively. The loads and IIDG capacities are set as the same values in both basic operation modes. Specifically, loads are set according to literature [20]. IIDG1-4 have a base capacity of 500, 200, 500, and 400 kW, respectively. All IIDGs are assumed to have LVRT capability. The maximum output current of each inverter is two times the rated value during fault or anomaly. According to the aforementioned method in Section 5, the change of the equivalent impedance of the system, loads, and IIDG capacities are randomly generated within the range of (−0.2, 0.2). Meanwhile, the grid connection status vector of IIDGs α and the cut-off line line_cut are also generated randomly. Thus, many new operation modes are generated on the basis of these two basic operation modes.
The sample set in case study is obtained by setting the faults in the distribution network. The fault positions are set at anywhere in the network, including the lines and nodes. As the analysis procedures are the same for different fault types, the analysis of three-phase short-circuit fault is taken as an example. The calculation target of simulation is the short-circuit current flowing through the fixed measurement point. In this case, Node 858 is selected as the measurement point, that is, position R1 in Figure 3. A total of 35,000 operating modes are set, meaning that 17,500 modes are generated based on each basic operating modes. The features and labels in each operation mode are extracted based on the simulation results. Thus 35,000 samples are obtained to establish the original sample set. For these samples, 20% of the sample set is randomly selected as the testing data, and the remainder serves as the training data. So there are a training set of 28,000 samples and a test set (the set of test samples) of 7000 samples. Considering that IEEE 34-node test system is a three-phase asymmetric system, only the phase-C current label is chosen in the following case study. The results for phase-A and phase-B are similar to those of phase-C.
6.2. Tests and Results
6.2.1. Hyperparameter Selection
In the establishment of a machine learning model, it is necessary to select suitable hyperparameters of the model for the purpose of obtaining optimal prediction results. The determination of optimal hyperparameters is achieved by grid search in this paper. The process is described as follows. (1) Determine optional values of each hyperparameter. (2) Traverse all hyperparameter combinations. (3) Use v-fold cross-validation [21] of the training set to find the optimal parameter combination as final hyperparameters of the model. The v-fold cross-validation means that the training set is randomly divided into v subsets with equal size, where the training and testing are performed for v times. In the p-th training (p = 1, 2, …, v), the p-th subset is used as the test set, and the remaining subsets are used to train the model. The average MAPE of v test sets is used to evaluate the accuracy.
6.2.2. Prediction Results
With adequate hyperparameter selection, the machine learning model is trained using the training data. To verify the accuracy of the proposed method, the testing data is used to compare the sample values with the prediction values via the developed model. Some prediction results of the machine learning model on test set are shown in Table 2, which includes the real values of test samples, prediction values, and absolute percentage errors (APEs) of predictions. It can be observed that all the APEs of predictions in Table 2 are smaller than 2%, which validates that the proposed method is accurate to predict the short-circuit current in active distribution networks.
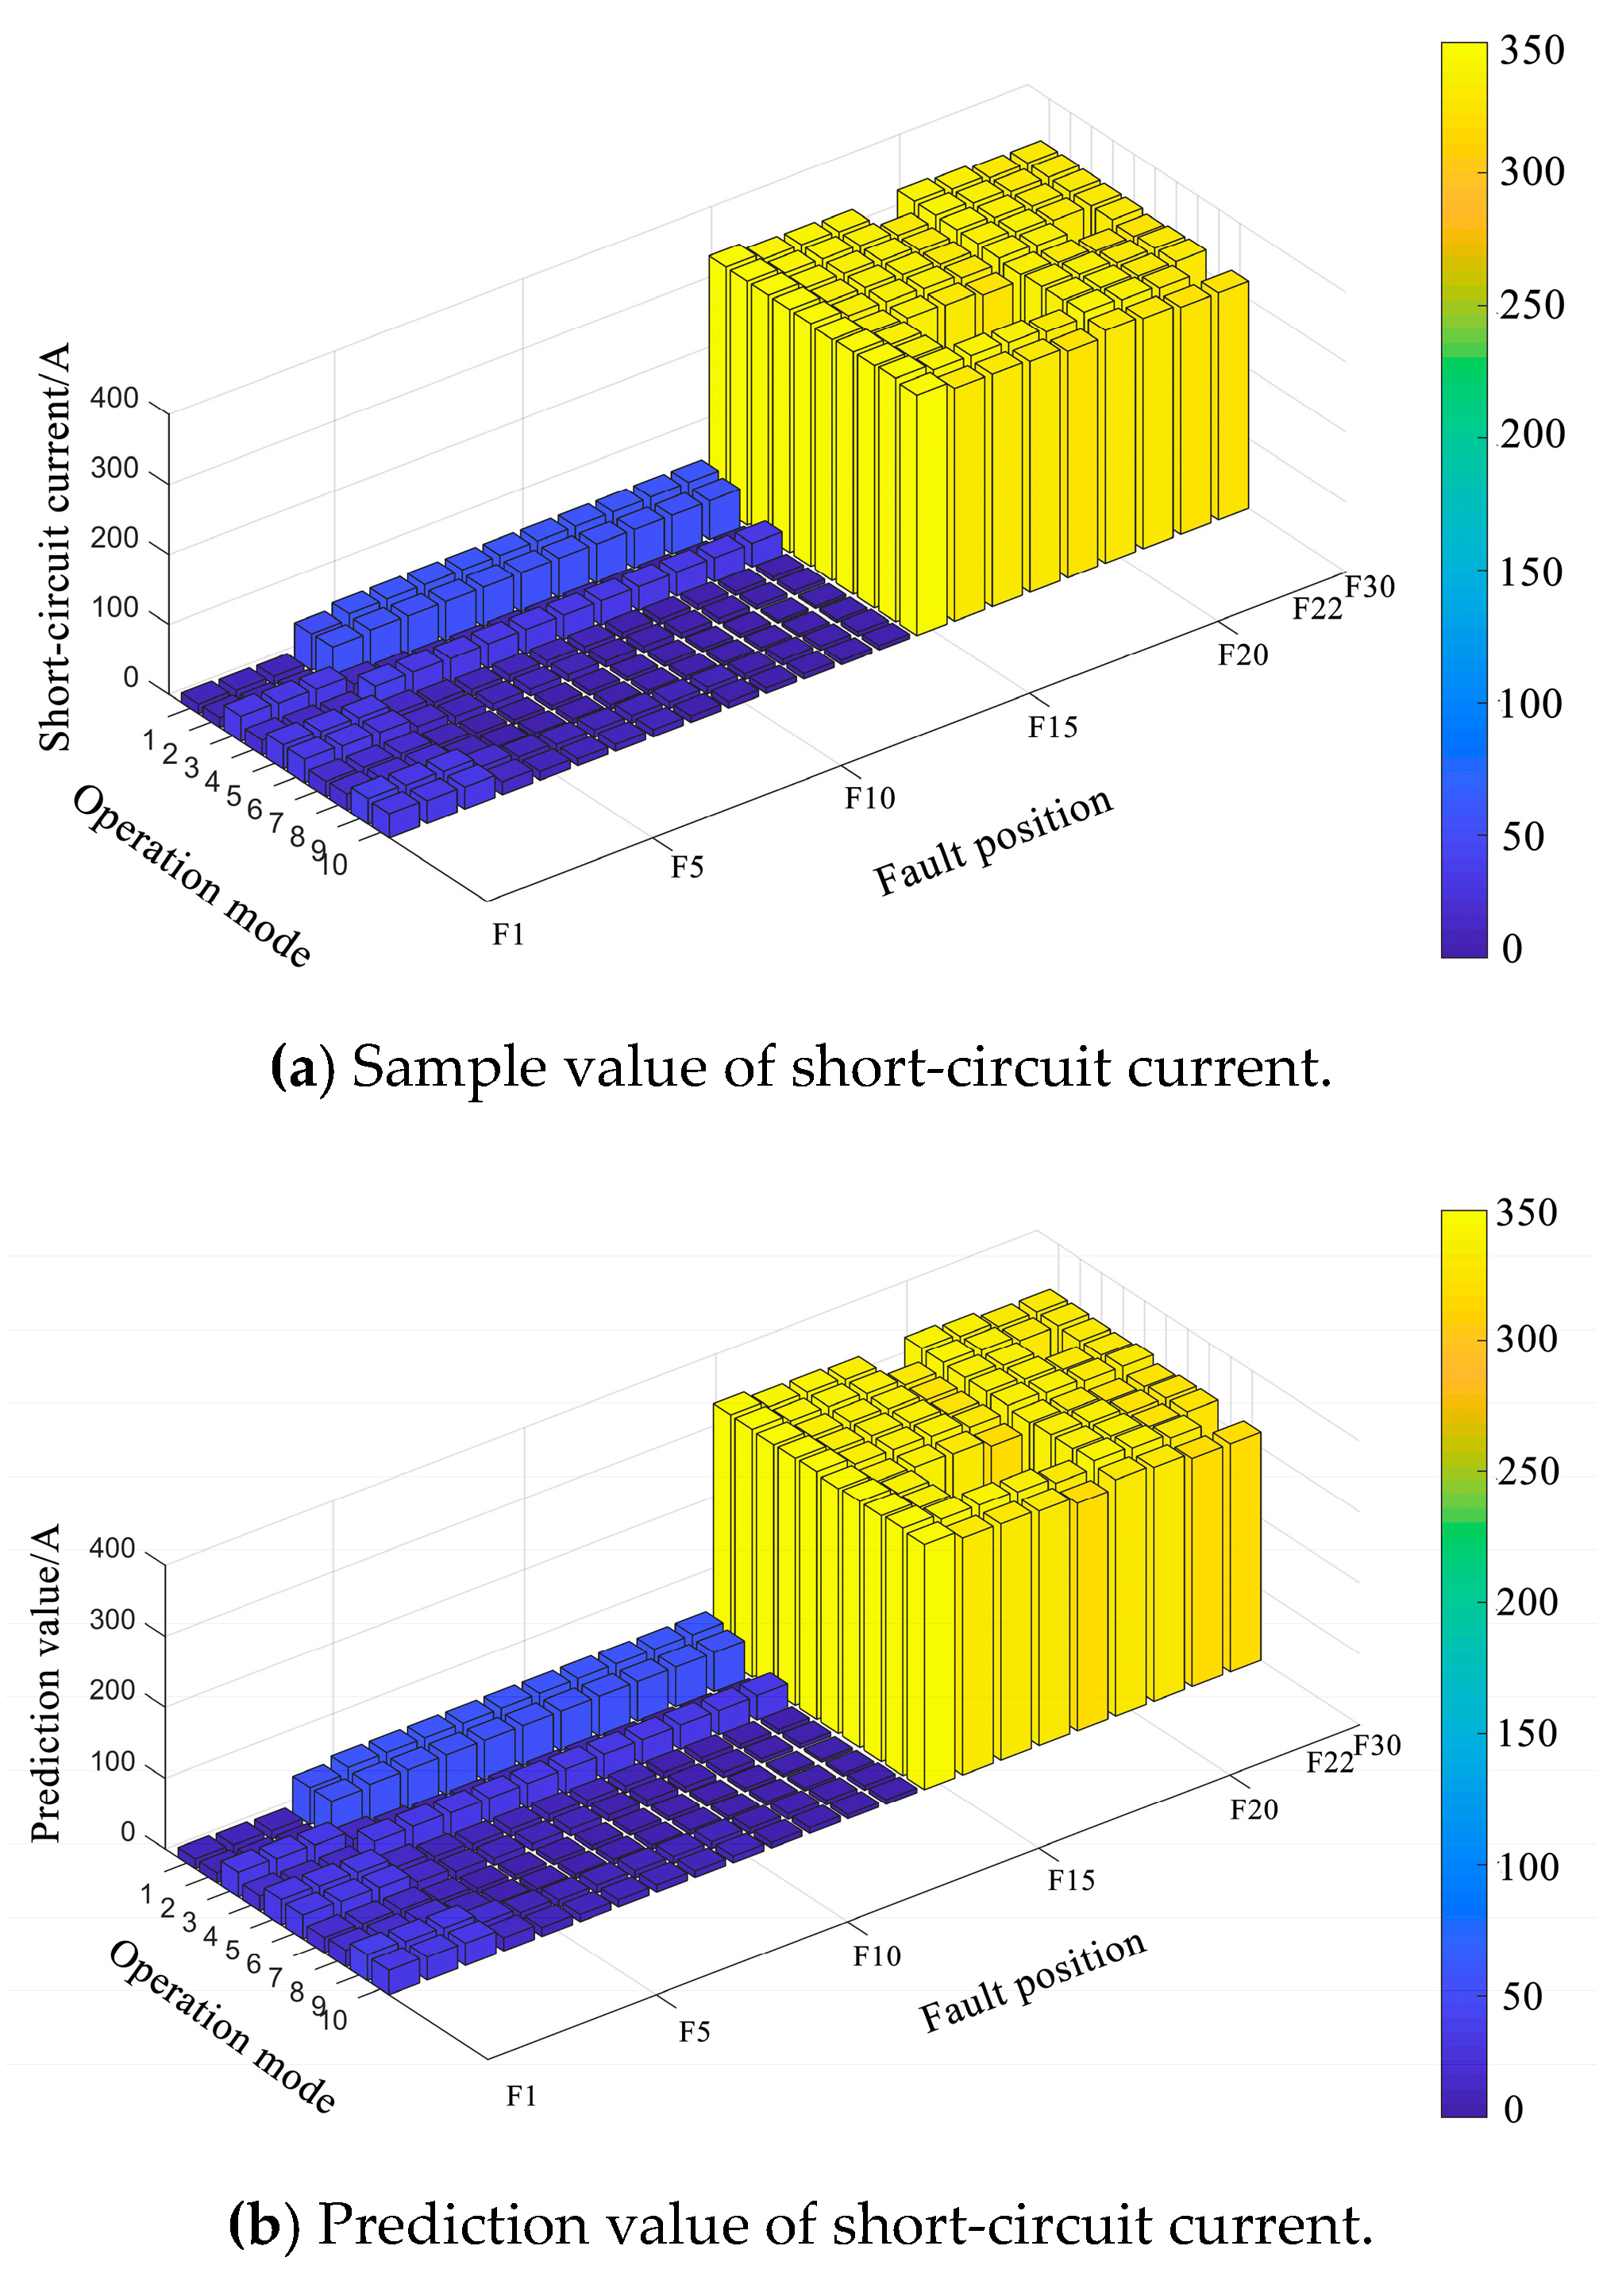
In addition, the prediction results of short-circuit current when fault occurs at all possible nodes in 10 operation modes are shown in Figure 4 and Table 3. The operation modes are randomly generated using the aforementioned method. The fault positions include all three-phase nodes of the IEEE 34-node test system, the number of which is 23. From Figure 4 and Table 3, it can be observed that for 230 predictions, 175 have an APE below 1%, 36 have an APE between 1% and 2%, and 19 have an APE between 2% and 3%. Therefore, the relative errors for all predictions are below 3%, the majority of which are below 1%. The prediction results in Figure 4 and Table 3 further verify the accuracy of the proposed data-driven method in estimating short-circuit current.
6.2.3. Comparison of the Different Machine Learning Methods
In this paper, the accuracy of predicted short-circuit current via different machine learning algorithms is also compared. Table 4 lists the prediction errors via SVR, RF, GBDT, and XGBoost, respectively.
6.3. Requirement of Sample Set Size for Networks with Different Scales
The prediction accuracy of the model depends largely on the size of the sample set. To avoid the exponential growth of the sample number with the increase of the network scale, it is necessary to evaluate the requirements of the sample set sizes for different network scales.
To further analyze the impact of network scale on the required sample number, IEEE 13-node and IEEE 69-node test feeders are employed to compare with IEEE 34-node network. The rated voltage of IEEE 13-node distribution network is 4.16 kV and it has 10 lines. The structure of the system is shown in Figure 5. Loads are set according to literature [20]. Two IIDGs are connected to Node 633 and 680, respectively, both have a base capacity of 200 kW. Position R2 is selected as the fixed measurement point. For IEEE 69-node distribution network, the rated voltage is 12.66 kV, and it contains a total of 68 lines. The network structure is shown in Figure 6. Loads are set according to literature [22]. Six IIDGs are connected to Node 19, 25, 32, 45, 54, and 65 respectively, and they all have a base capacity of 200 kW. Node 7 (i.e., positon R3 in Figure 6) is selected as the fixed measurement point. The simulations are also carried out according to the aforementioned procedure.
The prediction errors and average prediction time of XGBoost models for three distribution networks are compared in Table 5. For each distribution network, with the sample number increasing, the prediction accuracy of the model on the short-circuit current is further improved, whereas the average prediction time of the model remains nearly the same. Meanwhile, from the comparison of prediction results of three distribution networks under the same sample set size, with the increase of the network scale and IIDG number, the prediction of short-circuit current using the machine learning model is more difficult. This is mainly because that the rise of feature numbers will result in the increase of model complexity and prediction error and prediction time to some extent. Nevertheless, the prediction errors can generally meet application requirements and the prediction speed of each model is fast enough. Therefore, with the increase of the distribution network scale, the requirement of sample number for the proposed model does not increase exponentially on the premise of ensuring accuracy and efficiency. Therefore, it can be considered that the proposed method has good applicability in large-scale distribution network with high IIDG penetration.
6.4. The Applicable Scenarios of the Proposed Method
The results of aforementioned case studies verify the accuracy and efficiency of the proposed data-driven method for active distribution networks with different scales. In addition, as the IIDG penetration rate has a close relationship with the short-circuit current in active distribution networks, prediction performance under different IIDG penetration rates directly influences the applicable scenarios of the proposed method.
In the case study, the different IIDG penetration rates are tested in the adopted three distribution systems. Considering the basic operation mode for each test system, the rated active power for IEEE 13-, 34- and 69-node test systems is 3466, 1769, and 3802.19 kW, respectively. Their respective total IIDG capacities are 400, 1600, and 1200 kW, respectively. Thus, the IIDG penetration rates for the adopted IEEE 13-, 34-, and 69-node test systems are 11.5%, 90.4%, and 31.6%, respectively. As can be observed from the prediction results of aforementioned case studies, the accuracy of the proposed data-driven method is guaranteed in a wide range of IIDG penetration rate from 11.5% to 90.4%. Therefore, the proposed method has satisfactory performance to predict short-circuit current for active distribution networks with different IIDG penetration rates. Nevertheless, it is worth pointing out that when the IIDG penetration rate is low, such as under 10%, the injection current from IIDGs only occupies a small proportion of short-circuit current compared to the injection current from the main grid. In this situation, the accuracy of traditional short-circuit current calculation methods are acceptable so that these traditional methods can still be adopted. Therefore, it is considered that the proposed data-driven method is used in distribution networks with IIDG penetration rate over 10%.
7. Conclusions
In this paper, a novel data-driven method for calculating short-circuit current in active distribution networks based on XGBoost is proposed. Compared with the traditional mechanism model, the proposed method has the advantages of fast online calculation, strong applicability, high accuracy, and easy programming. This data-driven model can be used in real-time short-circuit current calculations for a specified measurement point when a fault occurs at any position in the distribution network. Meanwhile, a feature selection method is proposed: the short-circuit current when IIDGs are not connected to the distribution network, referred to as If, is used as a key feature to replace many steady-state features of the distribution network. On the one hand, the number of features is reduced. On the other hand, the reliability of the model is improved because the feature If is supported by the theory of power system fault analysis. The applicability and efficiency of the proposed method in large-scale distribution networks with multi IIDGs are verified in case study.
Author Contributions
Conceptualization, X.Z. and H.W.; methodology, X.Z.; software, X.Z. and K.J.; validation, X.Z. and H.W.; formal analysis, X.Z., H.W. and K.J.; investigation, H.W.; resources, H.W.; data curation, X.Z.; writing—original draft preparation, X.Z. and H.W.; writing—review and editing, K.J., X.Z. and H.W.; visualization, X.Z. and K.J.; supervision, H.W. and B.H.; project administration, H.W. and B.H.; funding acquisition, H.W.
Funding
This research received no external funding.
Conflicts of Interest
The authors declare no conflicts of interest.
References
- Girgis, A.; Brahma, S. Effect of distributed generation on protective device coordination in distribution system. In Proceedings of the 2001 Large Engineering Systems Conference on Power Engineering, Halifax, NS, Canada, 11–13 July 2001; pp. 115–119. [Google Scholar]
- Wang, C.; Sun, X. An Improved Short Circuit Calculation Method for Distribution Network with Distributed Generations. Autom. Electr. Power Syst. 2012, 36, 54–58. [Google Scholar]
- Hooshyar, H.; Baran, M.E. Fault analysis on distribution feeders with high penetration of PV systems. IEEE Trans. Power Syst. 2012, 28, 2890–2896. [Google Scholar] [CrossRef]
- Wang, Q.; Zhou, N.; Ye, L. Fault analysis for distribution networks with current-controlled three-phase inverter-interfaced distributed generators. IEEE Trans. Power Del. 2015, 30, 1532–1542. [Google Scholar] [CrossRef]
- Yang, S.; Tong, X. Short-circuit Current Calculation of Distribution Network Containing Distributed Generators with Capability of Low Voltage Ride Through. Autom. Electr. Power Syst. 2016, 40, 93–99. [Google Scholar]
- Zhao, J.; Dong, Z.; Wen, F.; Xue, Y. Data Science for Energy Systems: Theory, Techniques and Prospect. Autom. Electr. Power Syst. 2017, 41, 1–11. [Google Scholar]
- Ramchurn, S.; Vytelingum, P.; Rogers, A.; Jennings, N.R. Putting the “smarts” into the smart grid: A grand challenge for artificial intelligence. Commun. ACM 2012, 55, 86–97. [Google Scholar] [CrossRef]
- Bose, B.K. Artificial intelligence techniques in smart grid and renewable energy systems—Some example applications. Proc. IEEE 2017, 105, 2262–2273. [Google Scholar] [CrossRef]
- Yang, T.; Zhao, L.; Wang, C. Review on Application of Artificial Intelligence in Power System and Integrated Energy System. Autom. Electr. Power Syst. 2019, 43, 8–20. [Google Scholar]
- Xu, Y.; Dong, Z.Y.; Zhao, J.H.; Zhang, P.; Wong, K.P. A reliable intelligent system for real-time dynamic security assessment of power systems. IEEE Trans. Power Syst. 2012, 27, 1253–1263. [Google Scholar] [CrossRef]
- Ding, N.; Benoit, C.; Foggia, G.; Bésanger, Y.; Wurtz, F. Neural network-based model design for short-term load forecast in distribution systems. IEEE Trans. Power Syst. 2015, 31, 72–81. [Google Scholar] [CrossRef]
- Zheng, H.; Yuan, J.; Chen, L. Short-term load forecasting using EMD-LSTM neural networks with a Xgboost algorithm for feature importance evaluation. Energies 2017, 10, 1168. [Google Scholar] [CrossRef]
- Chen, Y.Q.; Fink, O.; Sansavini, G. Combined fault location and classification for power transmission lines fault diagnosis with integrated feature extraction. IEEE Trans. Ind. Electron. 2018, 65, 561–569. [Google Scholar] [CrossRef]
- Smola, A.J.; Schölkopf, B. A tutorial on support vector regression. Stat. Comput. 2004, 14, 199–222. [Google Scholar] [CrossRef] [Green Version]
- Breiman, L. Random forests. Mach. Learn. 2001, 45, 5–32. [Google Scholar] [CrossRef]
- Friedman, J.H. Greedy Function Approximation: A Gradient Boosting Machine. Ann. Statist. 2001, 29, 1189–1232. [Google Scholar] [CrossRef]
- Chen, T.; Guestrin, C. XGBoost: A Scalable Tree Boosting System. In Proceedings of the 22nd ACM SIGKDD International Conference on Knowledge Discovery and Data Mining, San Francisco, CA, USA, 13–17 August 2016; pp. 785–794. [Google Scholar]
- Bauer, E.; Kohavi, R. An Empirical Comparison of Voting Classification Algorithms: Bagging, Boosting, and Variants. Mach. Learn. 1999, 36, 105–139. [Google Scholar] [CrossRef]
- Wang, H.; Zhang, C.; Lin, D.; He, B. An artificial intelligence based method for evaluating power grid node importance using network embedding and support vector regression. Front. Inform. Technol. Electron. Eng. 2019, 20, 816–828. [Google Scholar] [CrossRef]
- PES Test Feeder. IEEE PES AMPS DSAS Test Feeder Working Group. Available online: http://0-sites-ieee-org.brum.beds.ac.uk/pes-testfeeders/ (accessed on 28 August 2019).
- Kohavi, R. A study of cross-validation and bootstrap for accuracy estimation and model selection. In Proceedings of the Fourteenth International Joint Conference on Artificial Intelligence, Montreal, QC, Canada, 20–25 August 1995; pp. 1137–1143. [Google Scholar]
- Wang, S.; Wang, C. Modern Distribution System Analysis, 2nd ed.; Higher Education Press: Beijing, China, 2014; pp. 248–251. [Google Scholar]
Figure 1.
Overall framework of the proposed method.

Figure 2.
Flowchart of short-circuit current prediction method based on XGBoost.

Figure 3.
Structure of the IEEE 34-node test distribution system.

Figure 4.
Prediction results in different operation modes.


Figure 5.
Structure of IEEE 13-node distribution system.

Figure 6.
Structure of IEEE 69-node distribution system.


Table 1.
Composition of the sample.
| Composition of the Sample | Symbol | Description |
|---|---|---|
| Sample type | f_type | The fault type |
| Feature | If | Short-circuit current when IIDGs are disconnected from the system |
| αj | Grid connection status of the IIDG | |
| SDGj | IIDG capacity | |
| line_cut | Cut-off line | |
| f_line | Fault line | |
| f_pos | Fault position | |
| Label | If_DG | Short-circuit current when IIDGs are connected to the system |
Table 2.
Prediction results on the test set.
| No. | Sample Value (A) | Prediction Value (A) | APE (%) |
|---|---|---|---|
| 1 | 351.476 | 350.193 | 0.365 |
| 2 | 67.772 | 66.706 | 1.573 |
| 3 | 25.682 | 25.906 | 0.876 |
| 4 | 48.369 | 47.879 | 1.013 |
| 5 | 322.865 | 322.978 | 0.035 |
Table 3.
Number of prediction in each range of absolute percentage error (APE).
| Range of APE (%) | Number |
|---|---|
| 0–1 | 175 (76.1%) |
| 1–2 | 36 (15.6%) |
| 2–3 | 19 (8.3%) |
Table 4.
Comparison of prediction result via different machine learning methods.
| Method | MAPE (%) | |
|---|---|---|
| Training | Testing | |
| SVR | 2.078 | 2.570 |
| RF | 1.074 | 1.298 |
| GBDT | 0.312 | 0.902 |
| XGBoost | 0.040 | 0.846 |
Table 5.
Comparison of prediction results for different distribution networks.
| Sample Set Size | IEEE 13-Node System | IEEE 34-Node System | IEEE 69-Node System | |||
|---|---|---|---|---|---|---|
| MAPE (%) | Prediction Time (ms) | MAPE (%) | Prediction Time (ms) | MAPE (%) | Prediction Time (ms) | |
| 15,000 | 0.670 | 0.089 | 1.439 | 0.151 | 1.406 | 0.144 |
| 20,000 | 0.624 | 0.090 | 1.354 | 0.177 | 1.396 | 0.141 |
| 25,000 | 0.615 | 0.111 | 1.163 | 0.180 | 1.262 | 0.174 |
| 30,000 | 0.602 | 0.101 | 1.042 | 0.177 | 1.257 | 0.165 |
| 35,000 | 0.591 | 0.097 | 0.847 | 0.184 | 1.149 | 0.177 |
© 2019 by the authors. Licensee MDPI, Basel, Switzerland. This article is an open access article distributed under the terms and conditions of the Creative Commons Attribution (CC BY) license (http://creativecommons.org/licenses/by/4.0/).
Share and Cite
MDPI and ACS Style
Zheng, X.; Wang, H.; Jiang, K.; He, B. A Novel Machine Learning-Based Short-Circuit Current Prediction Method for Active Distribution Networks. Energies 2019, 12, 3793. https://0-doi-org.brum.beds.ac.uk/10.3390/en12193793
AMA Style
Zheng X, Wang H, Jiang K, He B. A Novel Machine Learning-Based Short-Circuit Current Prediction Method for Active Distribution Networks. Energies. 2019; 12(19):3793. https://0-doi-org.brum.beds.ac.uk/10.3390/en12193793
Chicago/Turabian StyleZheng, Xiang, Huifang Wang, Kuan Jiang, and Benteng He. 2019. "A Novel Machine Learning-Based Short-Circuit Current Prediction Method for Active Distribution Networks" Energies 12, no. 19: 3793. https://0-doi-org.brum.beds.ac.uk/10.3390/en12193793
Note that from the first issue of 2016, this journal uses article numbers instead of page numbers. See further details here.