Prediction of Contact Angle of Nanofluids by Single-Phase Approaches †
by
 ,
,
Nur Çobanoğlu
1,2,*, 
Ziya Haktan Karadeniz
3,
Patrice Estellé
4,*,
Raul Martínez-Cuenca
5 and
Matthias H. Buschmann
2 1
Graduate School of Natural and Applied Sciences, İzmir Kâtip Çelebi University, 35620 İzmir, Turkey
2
Institut für Luft- und Kältetechnik gGmbH Dresden, 01309 Dresden, Germany
3
Department of Mechanical Engineering, İzmir Kâtip Çelebi University, 35620 İzmir, Turkey
4
Univ Rennes, LGCGM, EA3913, F-35000 Rennes, France
5
Departamento de Ingeniería Mecánica y Construcción, Universitat Jaume I, 12071 Castelló de la Plana, Spain
*
Authors to whom correspondence should be addressed.
†
This article is an extended version of our paper published in 1st International Conference on Nanofluids (ICNf) and 2nd European Symposium on Nanofluids (ESNf), Castellón, Spain, 26–28 June 2019; pp. 162–166.
Energies 2019, 12(23), 4558; https://0-doi-org.brum.beds.ac.uk/10.3390/en12234558
Submission received: 30 October 2019
/
Revised: 22 November 2019
/
Accepted: 27 November 2019
/
Published: 29 November 2019
(This article belongs to the Special Issue Selected papers of the "1st International Conference on Nanofluids (ICNf)")
Abstract
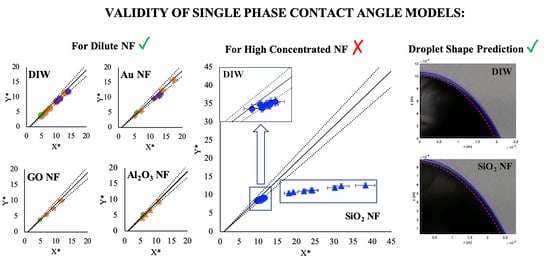
:Wettability is the ability of the liquid to contact with the solid surface at the surrounding fluid and its degree is defined by contact angle (CA), which is calculated with balance between adhesive and cohesive forces on droplet surface. Thermophysical properties of the droplet, the forces acting on the droplet, atmosphere surrounding the droplet and the substrate surface are the main parameters affecting on CA. With nanofluids (NF), nanoparticle concentration and size and shape can modify the contact angle and thus wettability. This study investigates the validity of single-phase CA correlations for several nanofluids with different types of nanoparticles dispersed in water. Geometrical parameters of sessile droplet (height of the droplet, wetting radius and radius of curvature at the apex) are used in the tested correlations, which are based on force balance acting on the droplet surface, energy balance, spherical dome approach and empirical expression, respectively. It is shown that single-phase models can be expressed in terms of Bond number, the non-dimensional droplet volume and two geometrical similarity simplexes. It is demonstrated that they can be used successfully to predict CA of dilute nanofluids’ at ambient conditions. Besides evaluation of CA, droplet shape is also well predicted for all nanofluid samples with ±5% error.
1. Introduction
Wettability is the property of a solid surface contacted with a liquid within a surrounding fluid (liquid or gas) and its quantity is defined by the contact angle (CA). Wettability is important for the industrial applications such as phase change heat transfer, oil recovery and liquid coating. Contact angle (CA) is the angle between liquid–gas (or liquid–liquid) interface and liquid–solid interface for a droplet on a solid surface. The CA strongly depends on solid, liquid and surrounding fluid properties. If CA is smaller than 90°, it means that the liquid wets the solid surface. For CA greater than 90°, the liquid has lower wettability. CA is also dependent on liquid type and surface properties. Surface material including chemical composition and morphology, roughness and contamination make the CA and thus wetting properties. Since CA is predicted by the balance of interfacial/surface forces at triple point where solid, liquid and surrounding fluid contact, surrounding fluid properties play a role in wettability and CA evaluation. Besides these main parameters, temperature is another important affecting parameter for CA. Increase of temperature results in evaporation of the droplet and modifies CA.
It was also found that addition of nanoparticles (at least one dimension <100 nm) into conventional heat transfer fluids affects their thermophysical properties and results in interesting enhanced heat transfer ability. These suspensions were called as nanofluid (NF) [1]. In order to increase the markets’ uptake of nanofluids, thermophysical properties of nanofluids have been studied widely [2,3,4,5,6,7,8,9]. However, surface tension and wettability behavior of NF is still at the beginning compared to other properties. Estellé et al. [10] have reviewed the surface tension and wettability and have concluded that nanoparticle nature, shape, size, content and concentration are governing parameters on surface tension and wettability. Some studies reported that the addition of nanoparticles increases the CA [11,12,13,14]. However, also a reduction in CA has also been observed in [15,16,17]. Lu et al. [18] also mentioned that increase in concentration decreases the spreading area of NF. However, effect of addition of nanoparticles changes with temperature [19]. Chinnam et al. [20] analyzed particle size, concentration and temperature effect on CA of NFs and developed a correlation. CA was also recently described as a relevant thermophysical property for dilute nanofluids [19]. As a result of round robin test carried out by nine independent European institutes, physically founded CA correlations dependent on temperature and droplet volume are developed from the experimental data. With zero-volume approximation, it was shown that limiting contact angle is dependent only on temperature at certain substrate and certain atmosphere.
More recently, wetting behavior of molten salt nanofluids and phase-change material nano-emulsions was studied by Grosu et al. [21]. They used wettability control to propose new methods to predict specific heat and thermal conductivity of molten salts and their nanofluids accurately. Moreover, Cabaleiro et al. [22] found that addition of a phase change material into water decreases the CA up to 52%.
Generally, measurement of CA is not easy and can have limited accuracy due to the stability of nanofluid and measurement methods. For practical applications, it is important to obtain accurate CA data of NF and models could be useful. So, the aim of this study is to evaluate the relevance of single-phase liquids models for the prediction of contact angle and droplet shape of nanofluids. Such an investigation is here reported for the first time where a comparison of different models is proposed for a large variety of nanofluids. A previous study [23] aimed to predict CA of dilute NFs by using single phase models, which were based on force balance and energy balance on the droplet surface. The previous study [23] was extended by considering a theoretical and an empirical model to improve the accuracy. Theoretical model was a spherical dome approach and empirical model was developed by Wong et al. [24]. Moreover, prediction of droplet shape was studied. All models were expressed in terms of Bond number (Bo) and geometrical similarity simplexes of droplets.
2. Materials and Methods
2.1. Nanofluids
To assess the relevance of different single-phase models for the prediction of nanofluid contact angle, experimental data for distilled water (DIW) as a single-phase reference fluid and base fluid of nanofluids with GO, Au, SiO2 and Al2O3 nanoparticles were utilized. Au, Al2O3 and GO NFs here employed were fully characterized in [19] where preparation and thermophysical properties evaluation including density are also reported.
For preparation of SiO2 NF, silica raw material with density of 2000 kg/m3 at 20 °C (SIPERNAT® 22S, Evonik Industries AG, Germany) was dispersed unfractionated. NF had pH- value of 10.5 with stabilization by KOH. Mean agglomerate size of particles was measured as 177 nm by using Dynamic Light Scattering analysis (Zetasizer Nano ZS, Malvern Instruments GmbH, Germany). Density of SiO2 NF was calculated with the mixture rule (Equation (1)) [25]. Thermal conductivity of SiO2 nanofluid was measured by using 3ω method [26]. Measurements were conducted at 24 °C with three repetitions. Main information for all nanofluids are compiled in Table 1 showing the difference in concentration, size, shape and density of nanoparticles, and density and thermal conductivity of NF.
2.2. Experiments on Contact Angle Measurements and Determination of Geometrical Parameters
Experiments were performed in different institutes. The CA data of DIW, Au, Al2O3 and GO NFs were collected at İzmir Kâtip Çelebi University (İKÇÜ), Universitat Jaume I Castelló (UJI) and Université Rennes 1 (UR1) and were taken from [19]. CA of SiO2 nanofluid was measured at ILK-Dresden (ILK). Sessile drop method was used in all institutes. Devices used in institutes and experimental conditions such as temperature T, droplet volume V and relative humidity RH used by each institute for the different liquids are described in Table 2.
Main steps of the CA measurements performed by each institute are described in the following paragraph. The reader is also referred to [19] for more details. Attention Theta Goniometer (Biolin Scientific, (Sweden/Finland)) was used in the experiments carried out by İKÇÜ. After calibration of the device, surface tension of liquids was measured and then introduced to device software as property to find CA. In 10 s, 125–140 images of droplet were captured. CA was evaluated by fitting the droplet shape with the Young-Laplace equation.
UR1 calibrated the commercial device (DSA-30 Drop Shape Analyzer (KRÜSS GmbH, Germany)) from gauges with known CAs of 30°, 60° and 120°, and a maximum relative deviation was obtained as 0.52%. Droplet was positioned at the surface by using 15-gauge needle with an outer diameter of 1.835 mm. After positioning, CA values were measured in a few seconds. Further information on setup, experimental procedure and image analysis was given in [19].
Lab-made device developed by UJI was combination of camera, syringe, indirect LED light source and micrometer carrier. The droplet regulator, which holds the syringe, was controlled by a micrometer carrier. Syringe was used to position the droplet on the solid surface at a controlled volume. LED panel light was used to obtain high contrast by background illumination. This device allows the prediction of CA and volume of the droplet by image processing.
CA was measured at ILK by using the lab-made device [19]. In the setup [19], the droplet was positioned by a micropipette (VWR Pipettor 2–20 μL) on the solid substrate. Digital reflex camera (Canon EOS 40D) equipped with close-up lens (Tamron, SP 90 mm F/2.8, Di MACRO 1:1, VC USD; Japan) was used to capture the droplet images. In order to obtain accurate CA, contrast of images improved by using light disperser and light source with 129 LEDs. Images of droplet were stored at a laptop and contact angle of each droplet was predicted by using ImageJ [27] software with extension “drop analysis” [28]. Contact angle of the droplet was determined for both sides and mean contact angle was used. Experiments of CA measurement were conducted in ILK for constant volume at 10 μL.
CA of DIW and NFs was measured on the solid stainless steel substrate with thickness of 5 mm and an averaged roughness of 1.4 μm. For each institution, solid substrates were manufactured from single round stock with same lathe to provide same material and surface quality for all substrates. Properties of the solid substrate were presented in [19] with details.
In addition to CA, surface tension () of the working fluids was evaluated experimentally at UR1 (DIW, Au NF, Al2O3 and GO NF) and İKÇÜ (SiO2 NF; Table 3). In both institutes, the pendant drop method was employed to define the . DSA-30 Drop Shape Analyzer (KRÜSS GmbH, Germany) and Biolin Scientific, (Sweden/Finland) were used at UR1 and İKÇÜ, respectively. In İKÇÜ, surface tension of DIW was measured before SiO2 NF. For both working fluids, the volume was kept constant at 10 µL and three measurements were carried out. There is no significant deviation between replicates and between experimental values of DIW with NIST data [29] at a given temperature. The comprehensive description of the experimental procedure used for the surface tension measurement at UR1 can be found in [30].
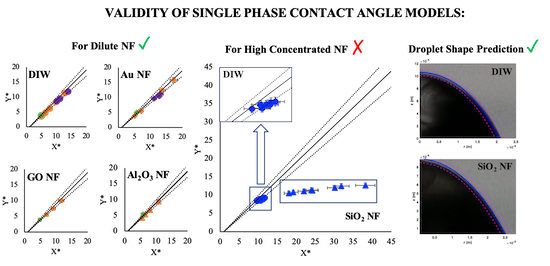
Finally, the geometrical parameters (, rd and R0) used in the models that are described in the next section were obtained by CA image analysis. Such an analysis has been performed with an image processing program called Fiji [31] as shown in Figure 1. Pixel-to-mm ratio with respect to a reference dimension for the images from the institutes is defined to spatial calibration of each data set.
2.3. Single-Phase Models for Prediction of Contact Angle
In this section, the models developed for the CA evaluation of single-phase liquids are presented. The first model considered was developed by Vafaei and Podowski [32], which is based on the force balance of gravity and surface forces on the droplet surface. Reason behind the gravity force is to the hydrostatic force of the variable droplet height and the surface forces are result of external pressure and surface tension. Vafaei and Podowski [32] proposed a model for the prediction of droplet volume that writes as follow:
Here denotes density and V are droplet baseline radius and volume. As geometrical parameters rd, and R0 are the droplet baseline radius, apex height and curvature, respectively. is the contact angle of the droplet. Droplet volume equation (2) was reformulated by using non-dimensional numbers: Bond number (Bo), which is the ratio of gravitational and surface forces, two geometrical similarity simplexes—G1 and G2—which describe the droplet geometry and V* as the non-dimensional droplet volume.
where Bo is
In the definition of Bo number characteristic length equals to which is defined by Kuiken [33]. Moreover, Stacy [34] reported that characteristic length equals to radius at the droplet equator and wetting radius for non-wetting droplets and for wetting droplets, respectively.
The second model we have considered was proposed by Yonemoto and Kunugi [35] (YK model), which is based on the energy balance for various-sized droplets on a solid surface. This correlation writes
A non-dimensional form is obtained by dividing (5) by the gravitational potential .
YK model is used for only spherical droplets. Therefore, employing the correlation for given in [32] Equation (5) is rewritten. The contact angle for spherical droplets is denoted by s and its baseline radius by rds.
Moreover, the spherical dome model (SD model), which is based on the tangent of only dimensions of the droplet ( and ), analyzed in [24] was rewritten in terms of geometrical similarity simplex, G1, and validity was studied for nanofluids.
Finally, Wong et al. [24] (W model) developed an empirical formulation, expressed in Equation (9), to predict contact angle of liquids, which was reported as being valid for any substrate and droplet materials. This empirical model uses the contact angle, droplet volume, height and width () and allows us to find two of them by using known other two parameters.
2.4. Prediction of Droplet Shape
In addition to CA prediction from single phase models, the sessile droplet shape of NFs is compared to the following approach. Thus, Vafaei and Podowski [32] reported that droplet shape could be predicted by force balance on the droplet surface as well as CA as following:
Coefficients ( were determined by applying boundary conditions:
Applying one more boundary condition and power series assumption (), Equation (10) was re-arranged by using geometrical similarity simplexes.
Considering the origin is at the center of the wetting circle, r is the horizontal axis and z is the vertical axes of the droplet (Figure 1).
3. Results and Discussion
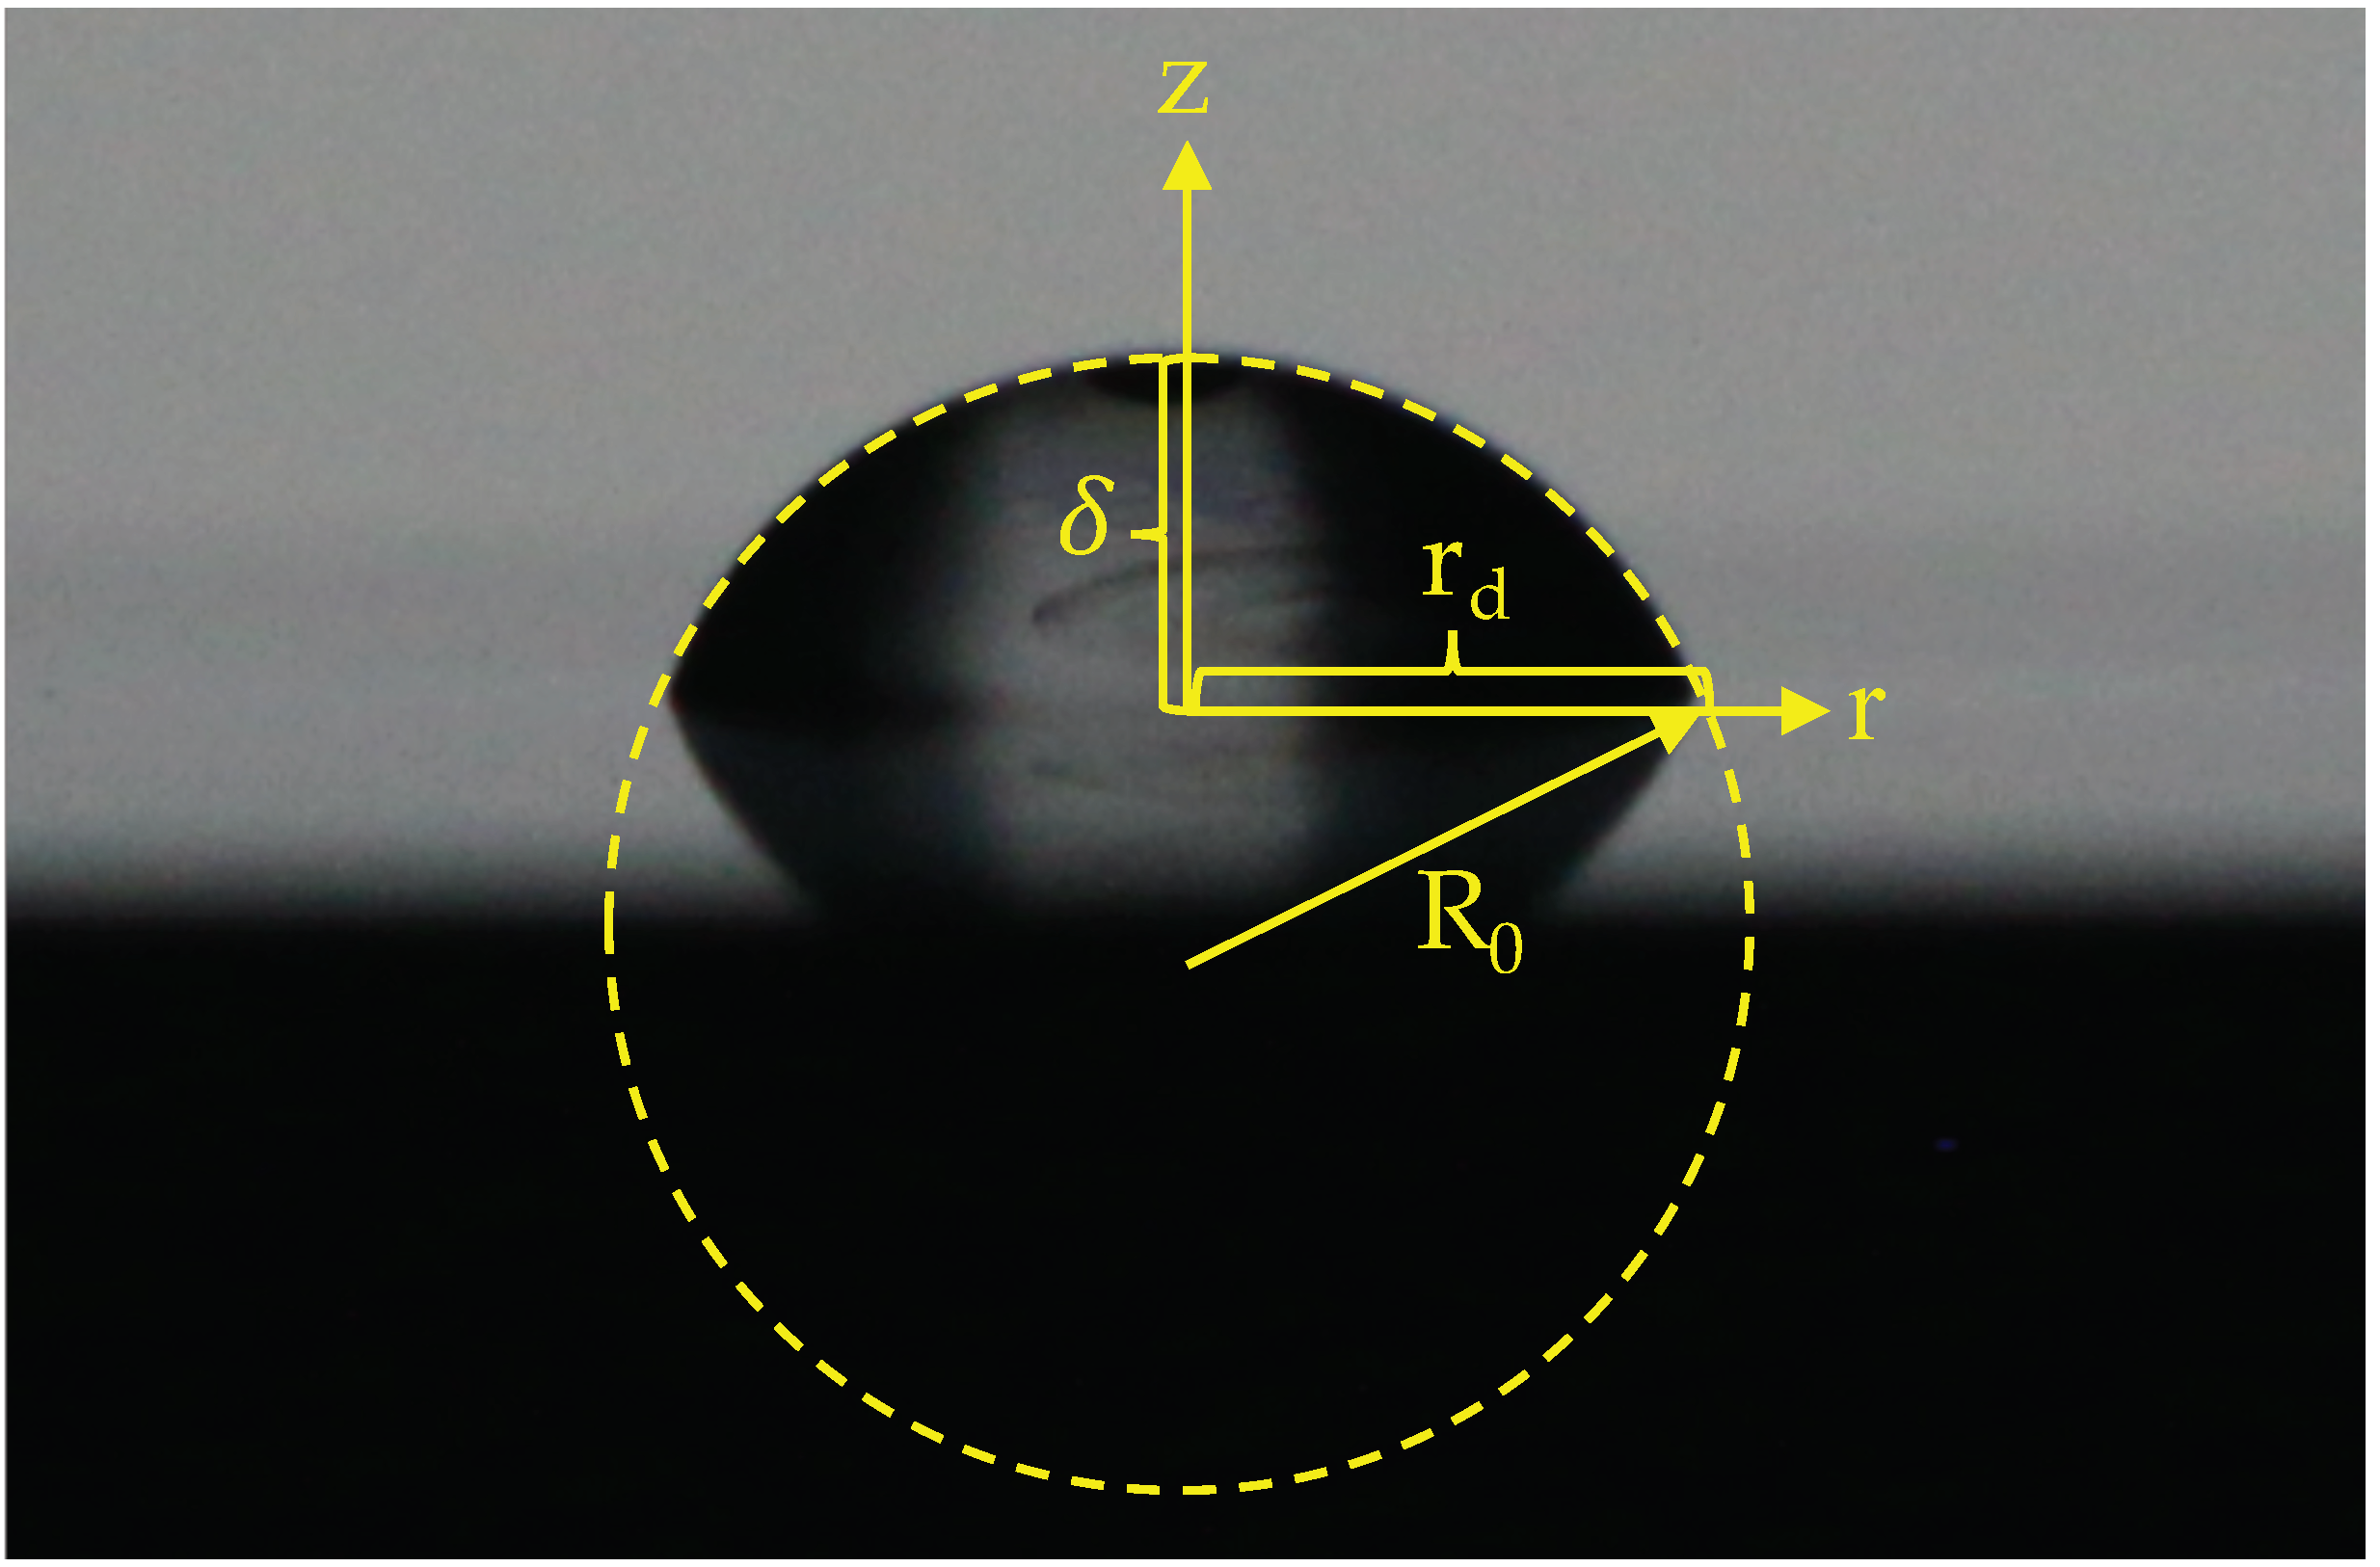
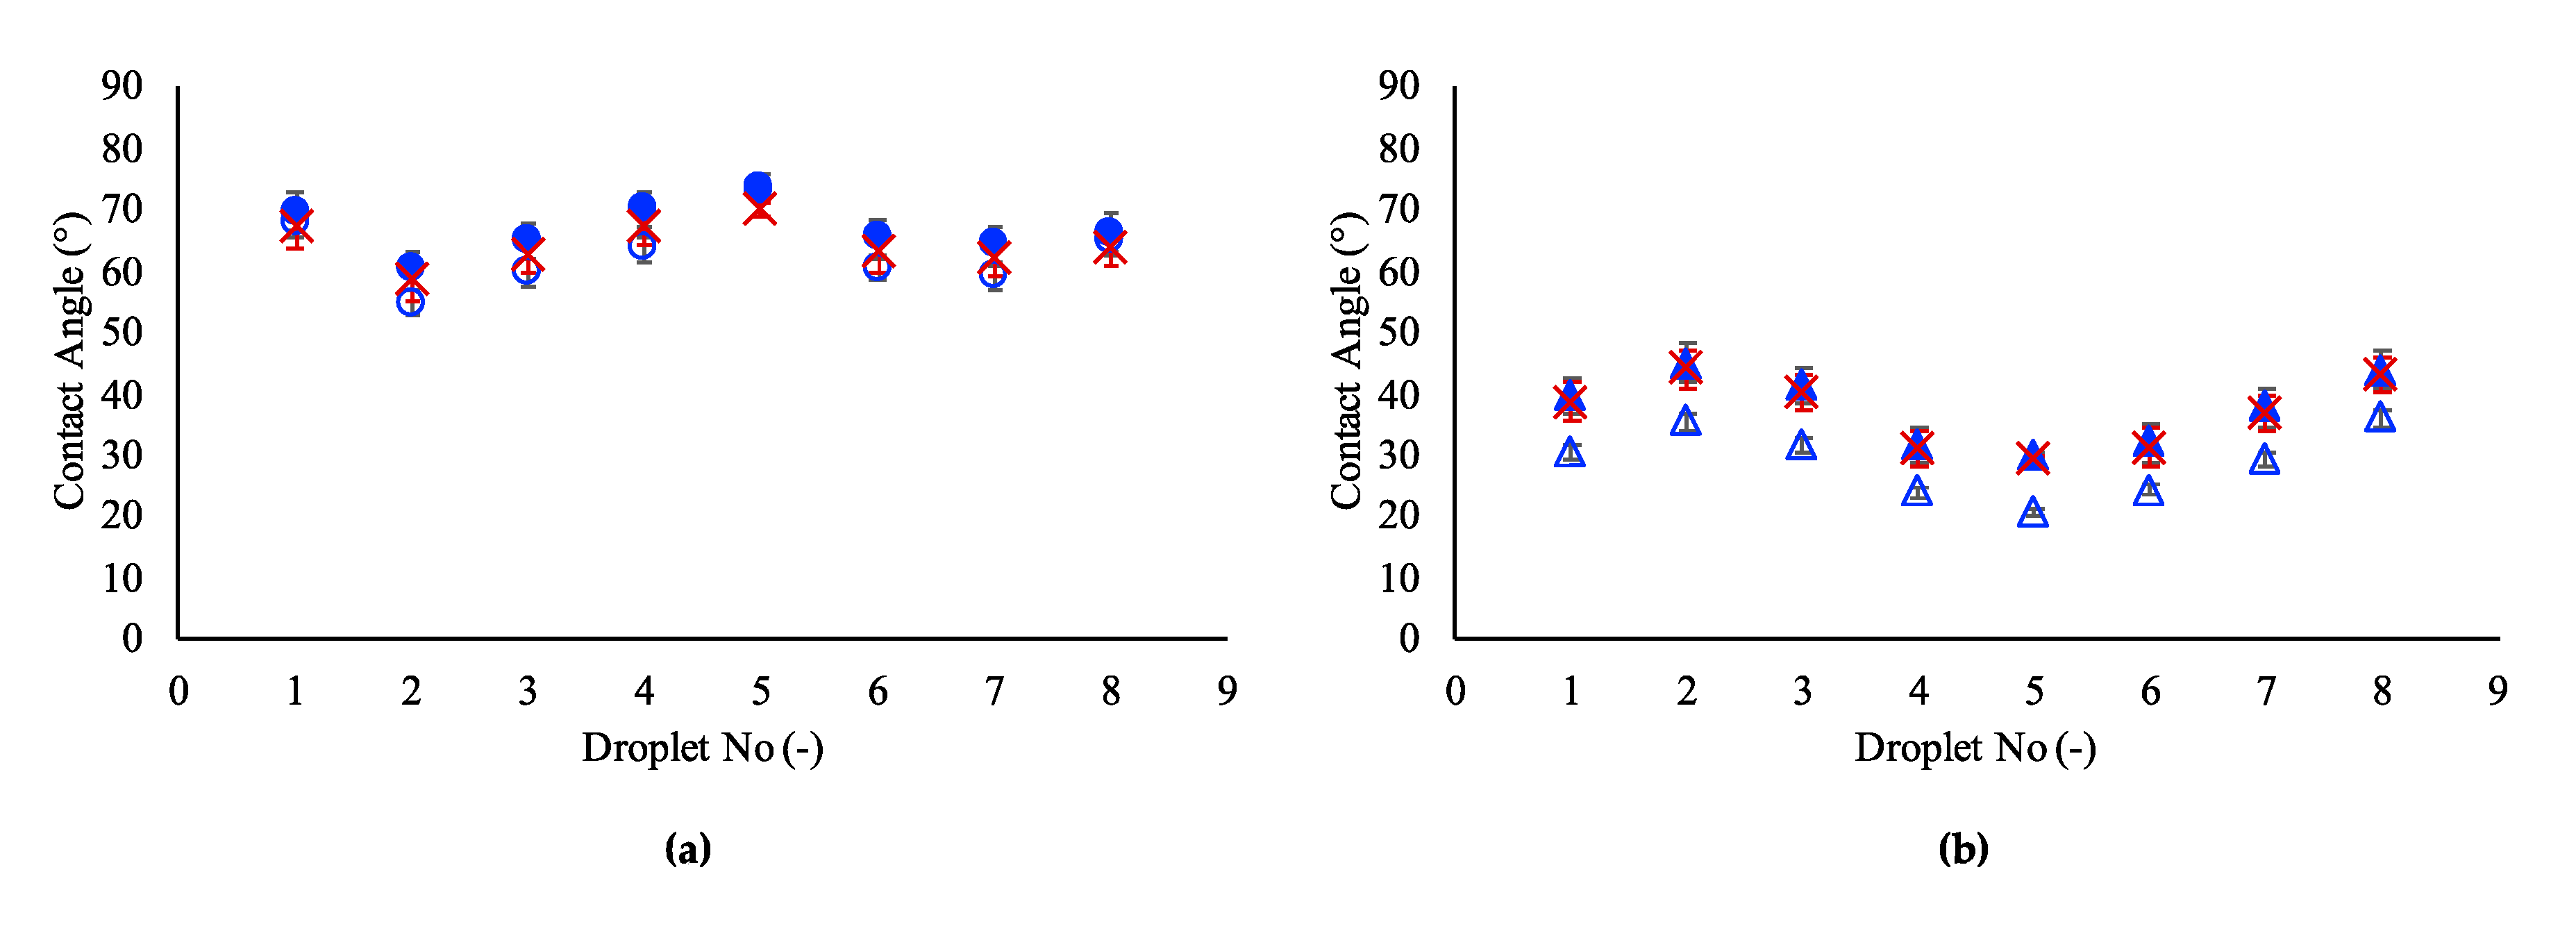
In this study, validity of contact angle models, which were developed for single-phase fluids, was investigated. In the figures, filled symbols (•) were for models and empty symbols (○) were used for experimental results. Due to the measurement uncertainties and in order to evaluate their influence, numerical results from the models were corrected with increasing R0 by 2% and it was presented as a red cross in the figures (✕).
Error between experimental and predicted CA was determined by using mean absolute percentage error (MAPE) and was denoted as Ω in the study. It is found as:
3.1. Contact Angle Prediction with Single-Phase Models
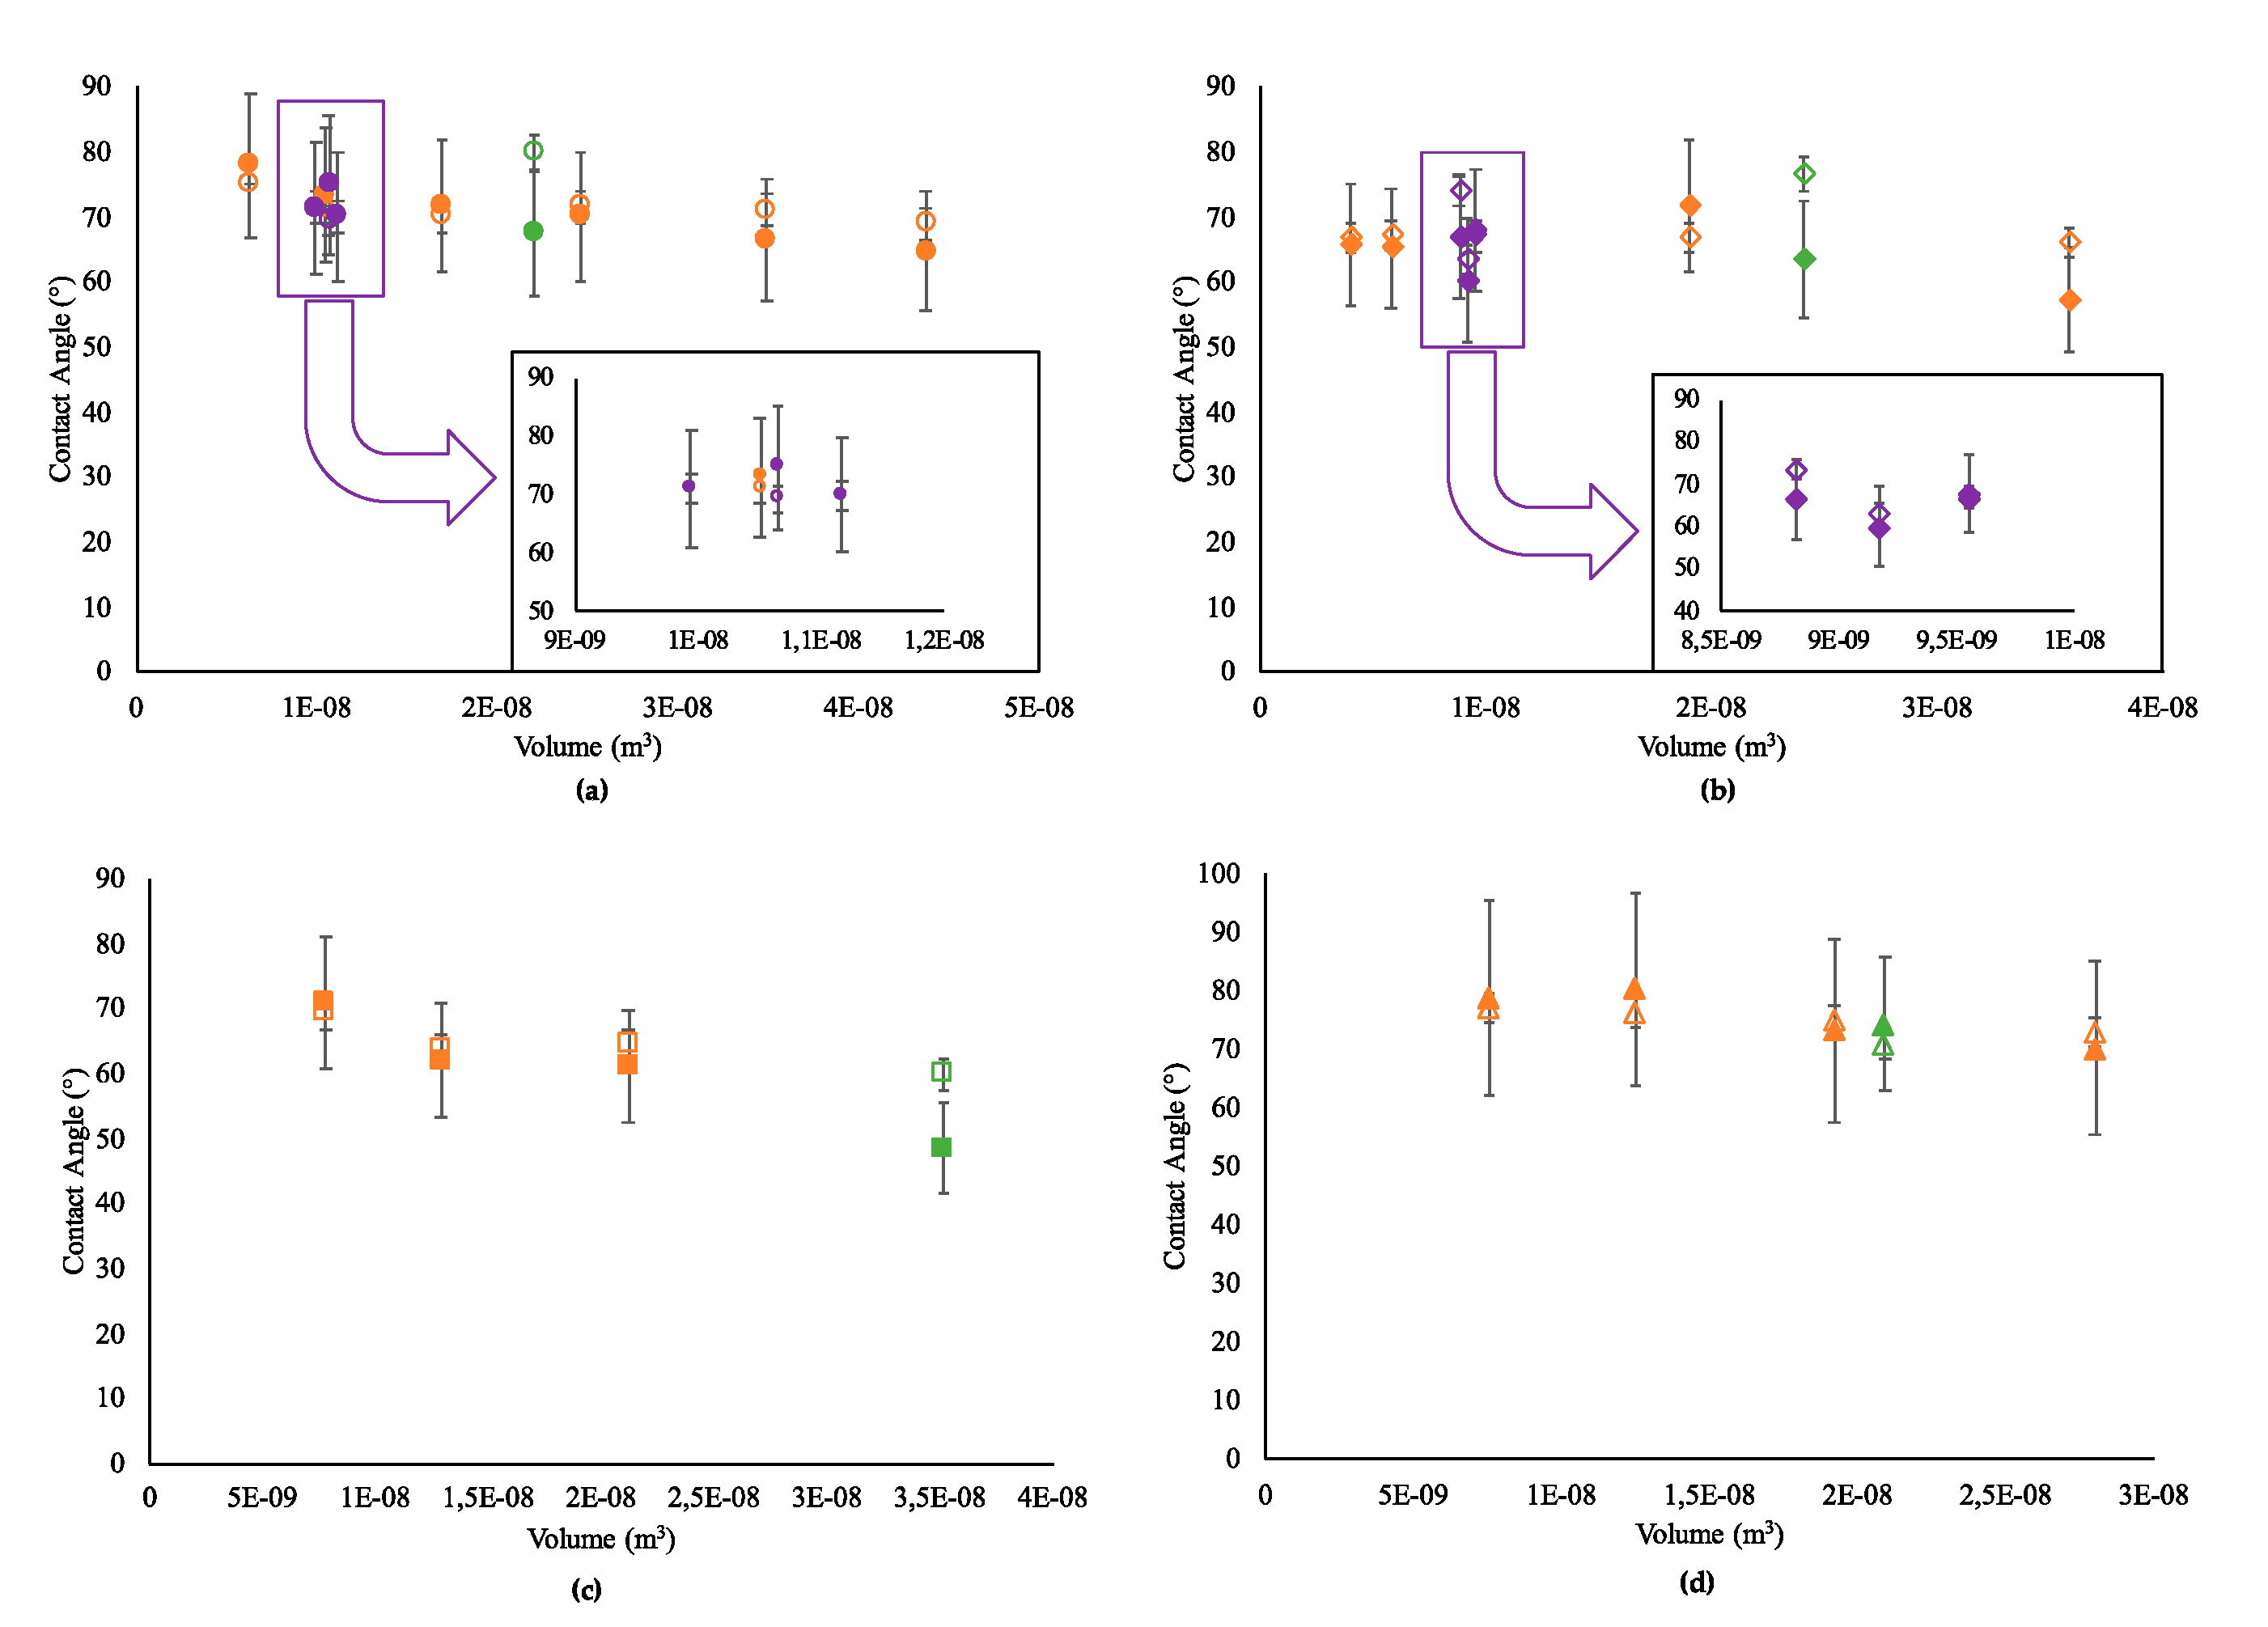
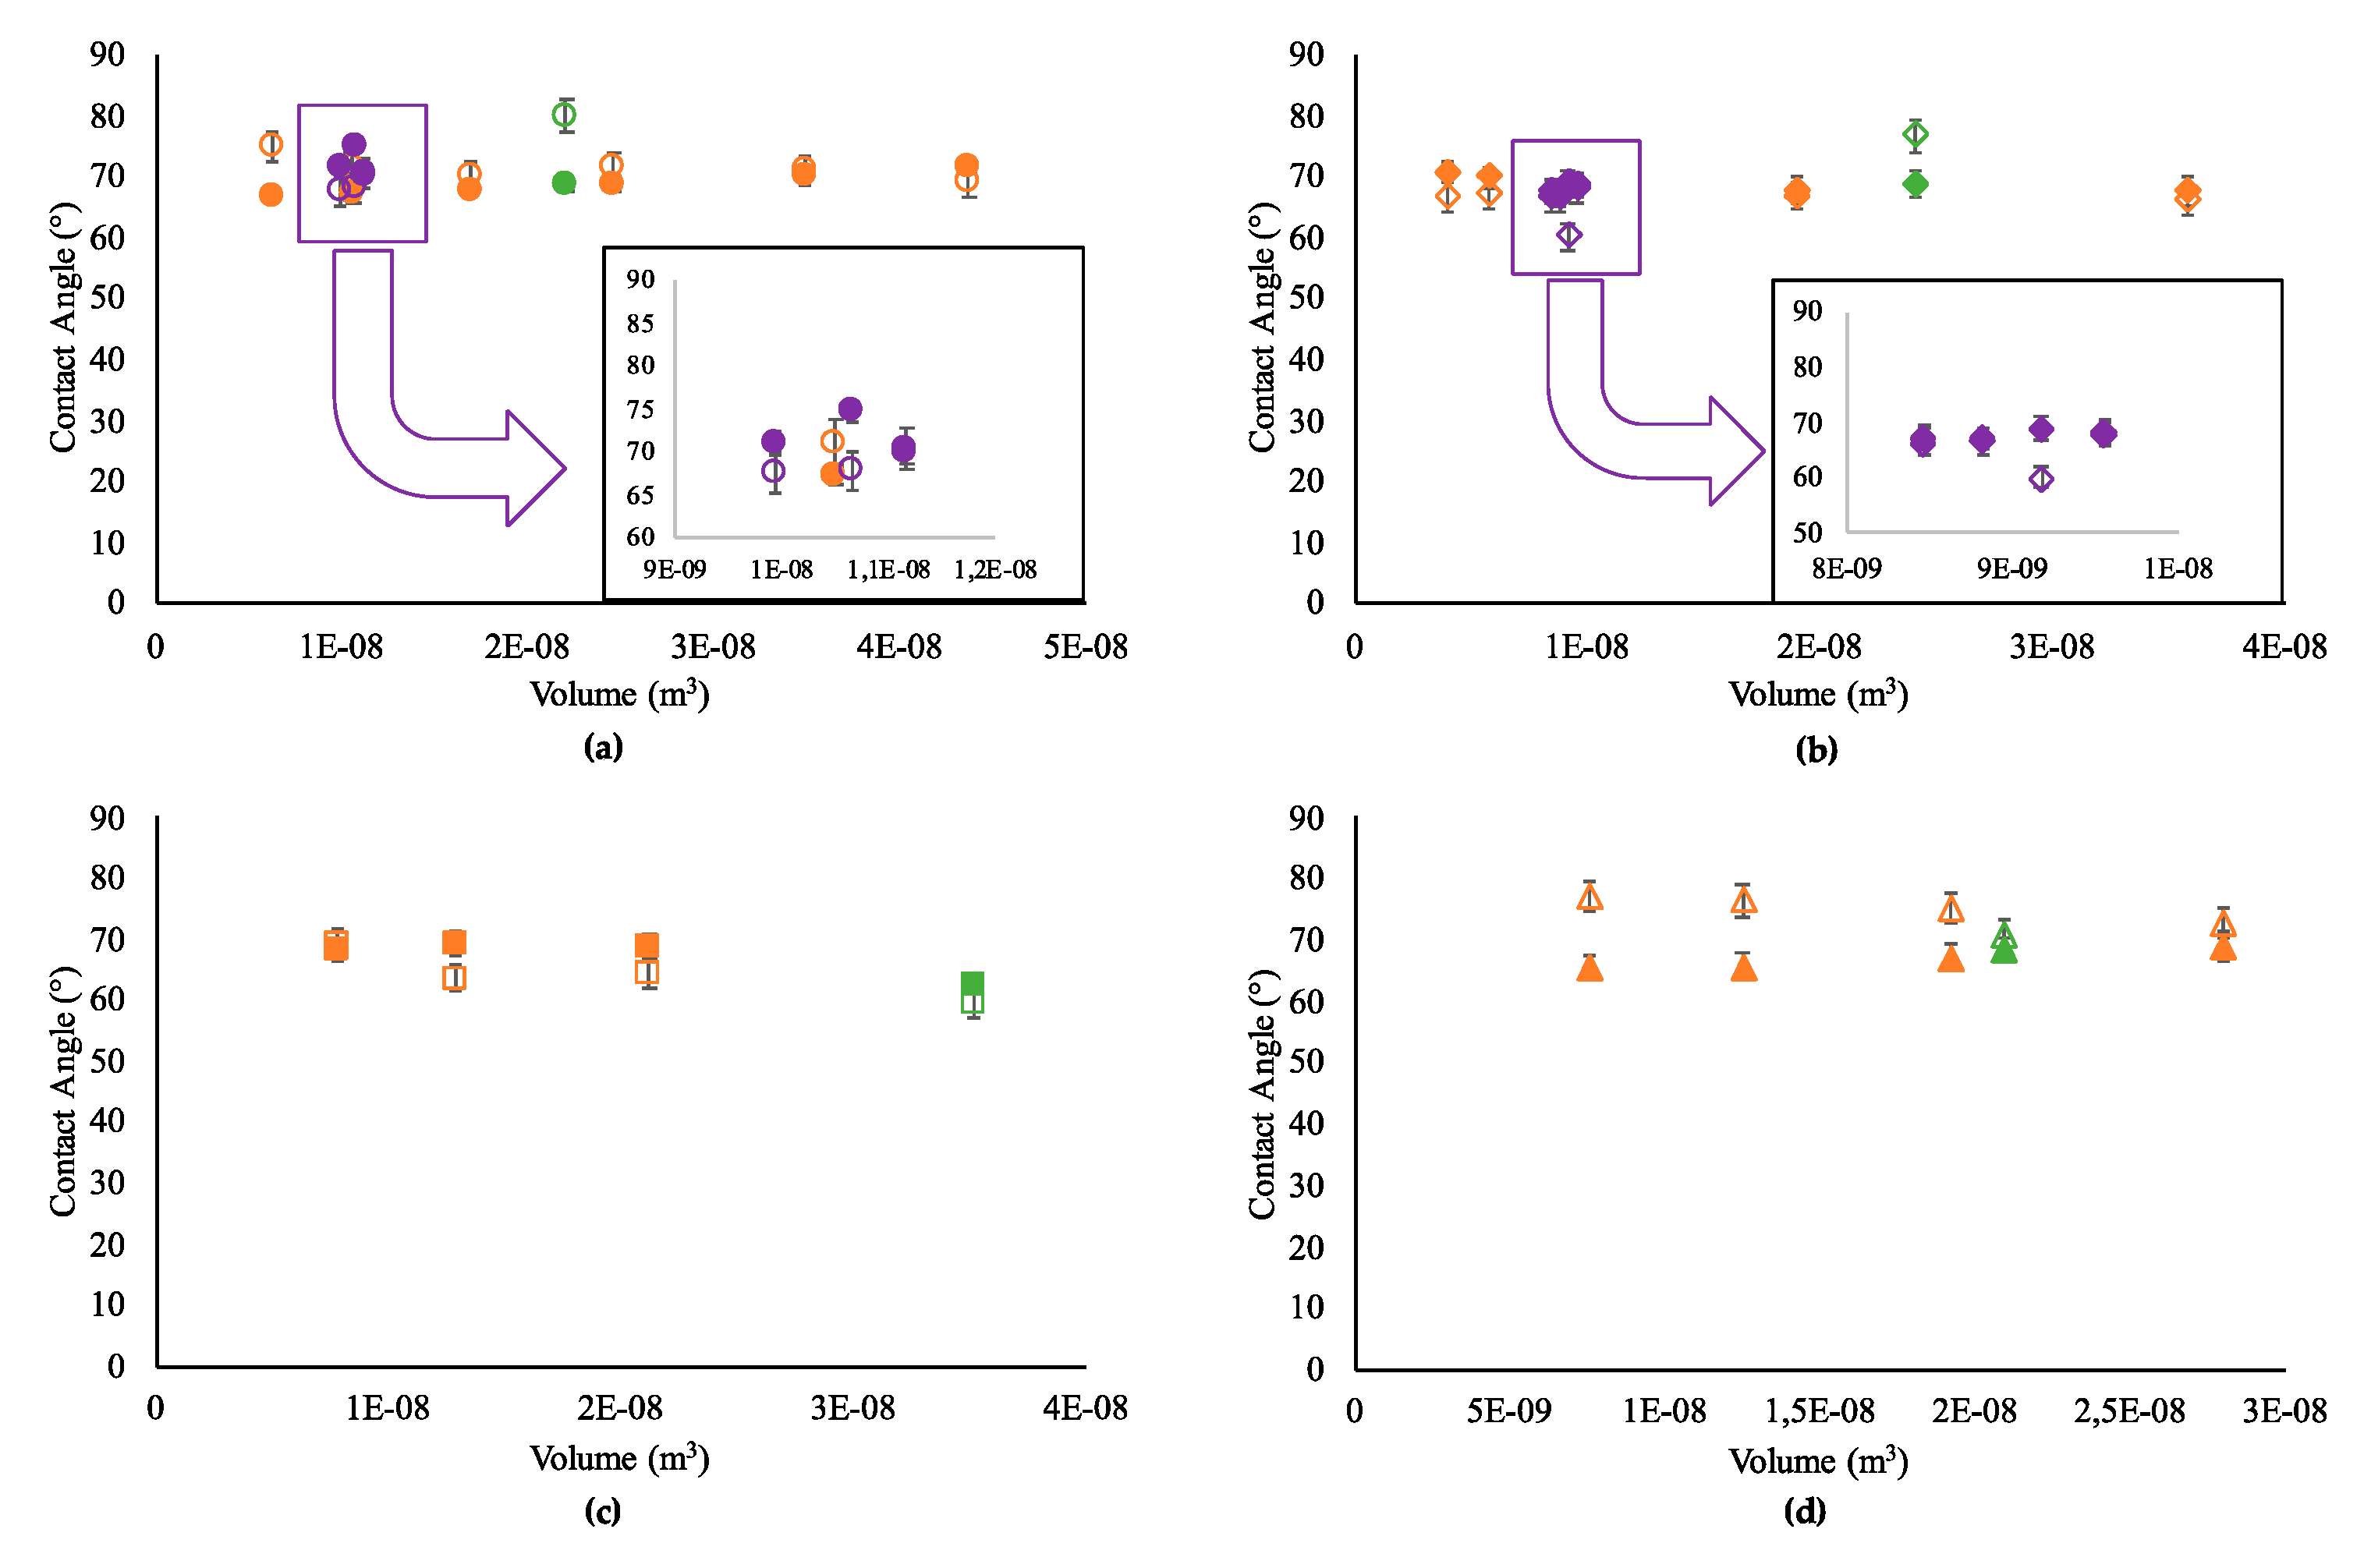
Figure 2 and Figure 3 show the validity of VP model for DIW and the different nanofluids. DIW as expected for a single-phase liquid has good agreement with the model (for various volume Ω = 2.32% and for constant volume Ω = 6.34%). Due to the low concentration and the small particle size, the Au and Al2O3 NF shows also reasonable good agreement with Ω = 2.07% and Ω = 4.07%, respectively. However, the VP model seems to be not valid for GO (Ω = 8.52%) and SiO2 NFs (Ω = 30.46%). Large graphene flakes in GO NF and higher concentration (3.935 wt.%) of SiO2 NF may be the reason of preventing the application of the VP model.
It was found, that the VP model was very sensitive against tiny experimental errors following the determination of R0. To illustrate this, R0 was increased artificially by just 2% and additional results presented in Figure 2 for GO NF, and Figure 3 for DIW and SiO2. CA data of GO NF fit much better with the VP model with this correction. Ω decreased from 8.52% to 4.19% for GO NF. Unlike GO NF, CA of SiO2 NF was not affected from the increase of R0 (Ω = 27.79%). This shows the influence of nanoparticle content on the applicability of V–P model with nanofluids.
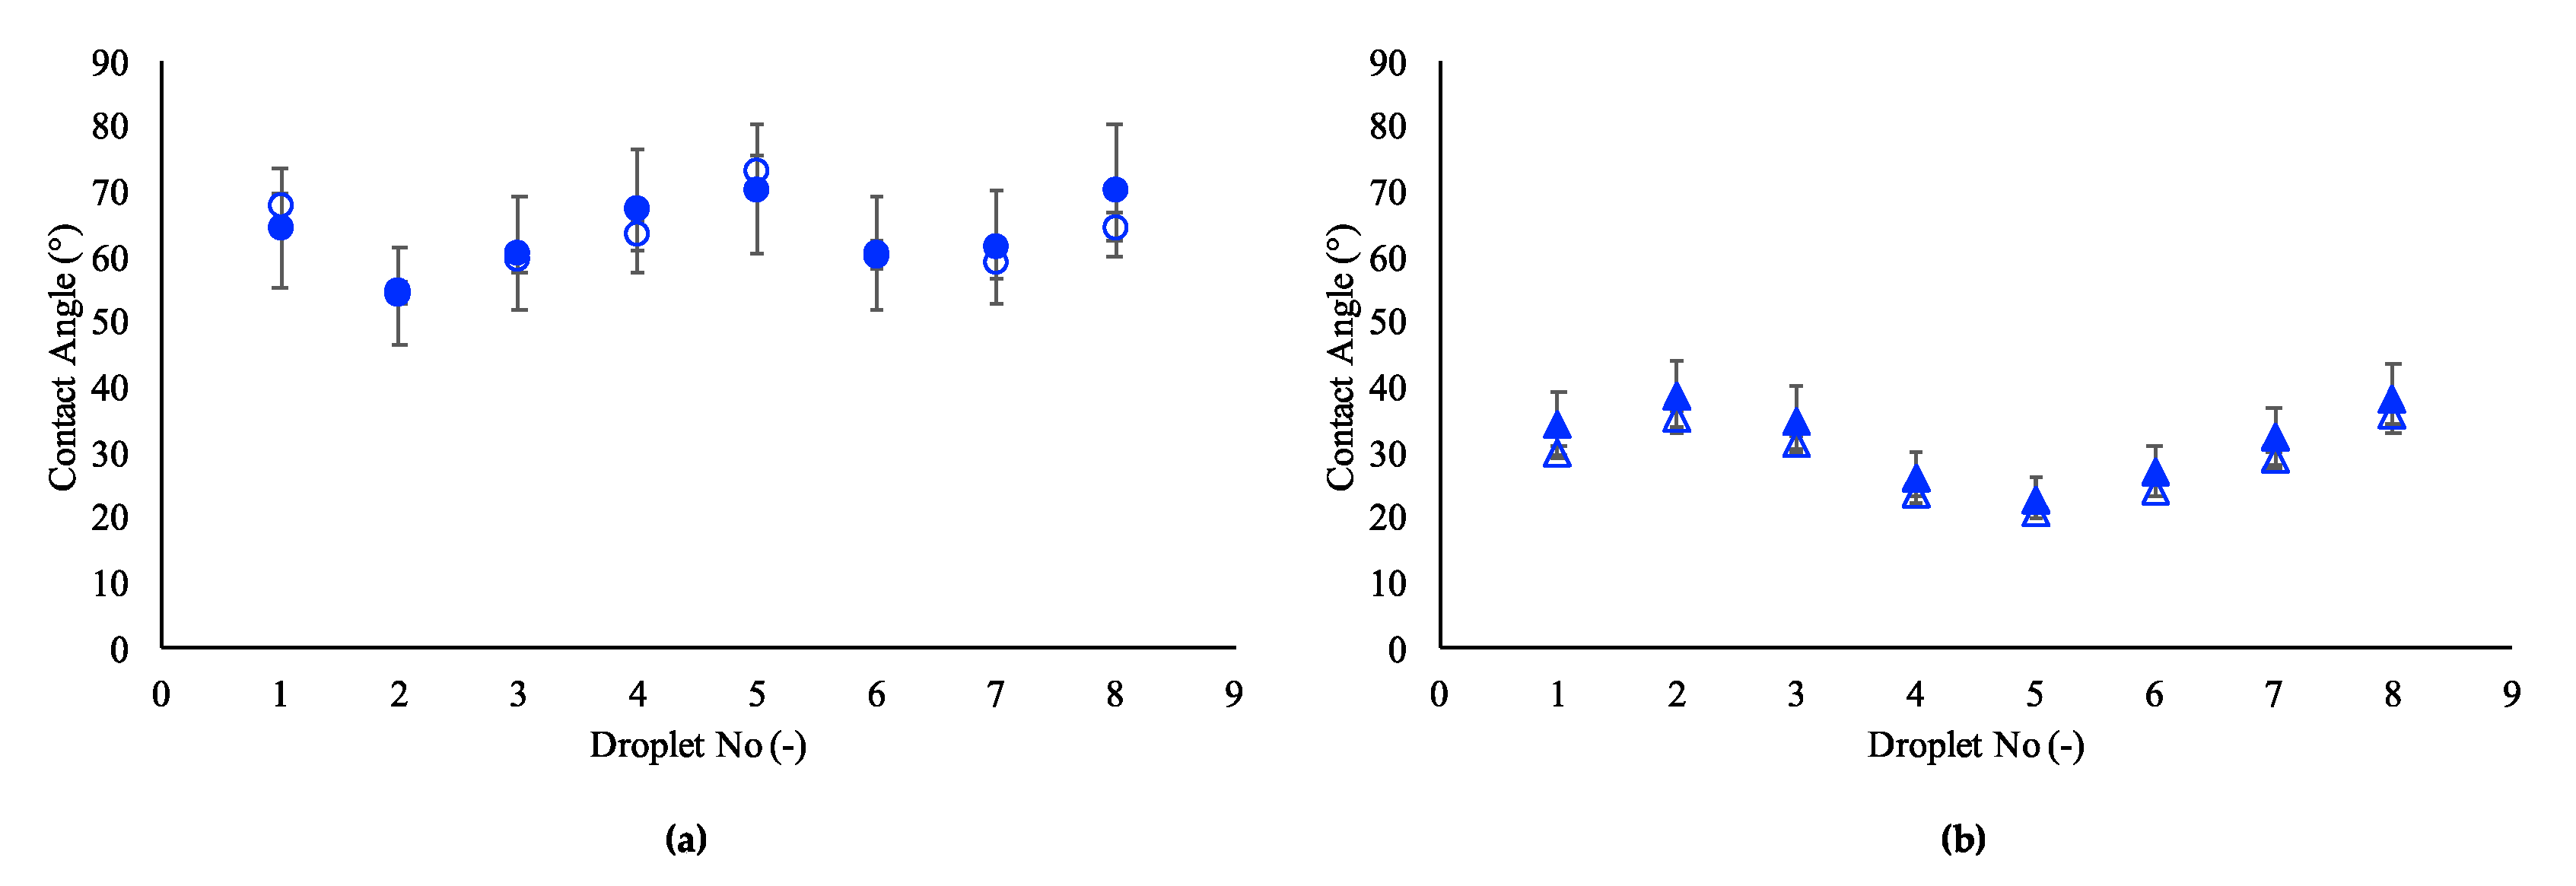
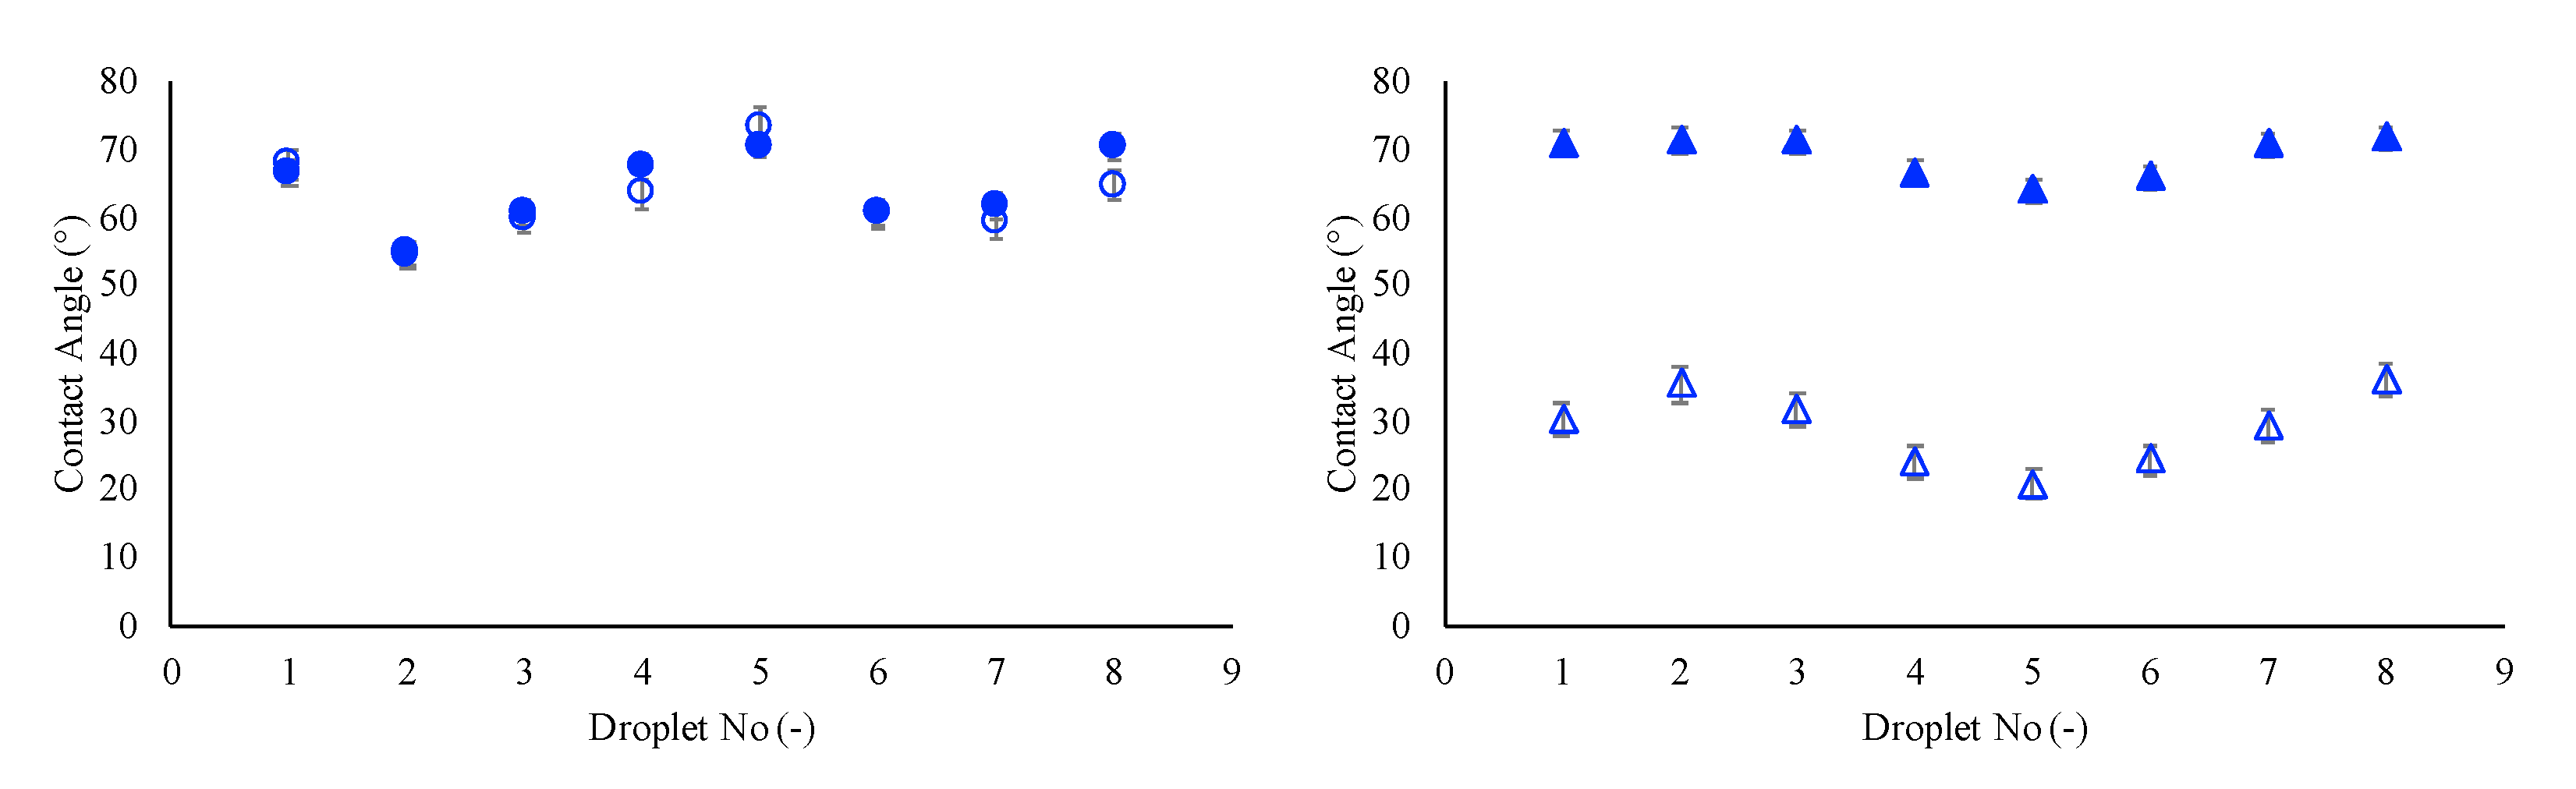
The modified YK model was in good agreement with experimental results for DIW, Au, Al2O3 and GO nanofluids. As shown in Figure 4, all the data was in the range of the ±10% error band. However, the results for the SiO2 NF (Figure 5) show again that a single-phase model was not appropriate for a highly concentrated nanofluid.
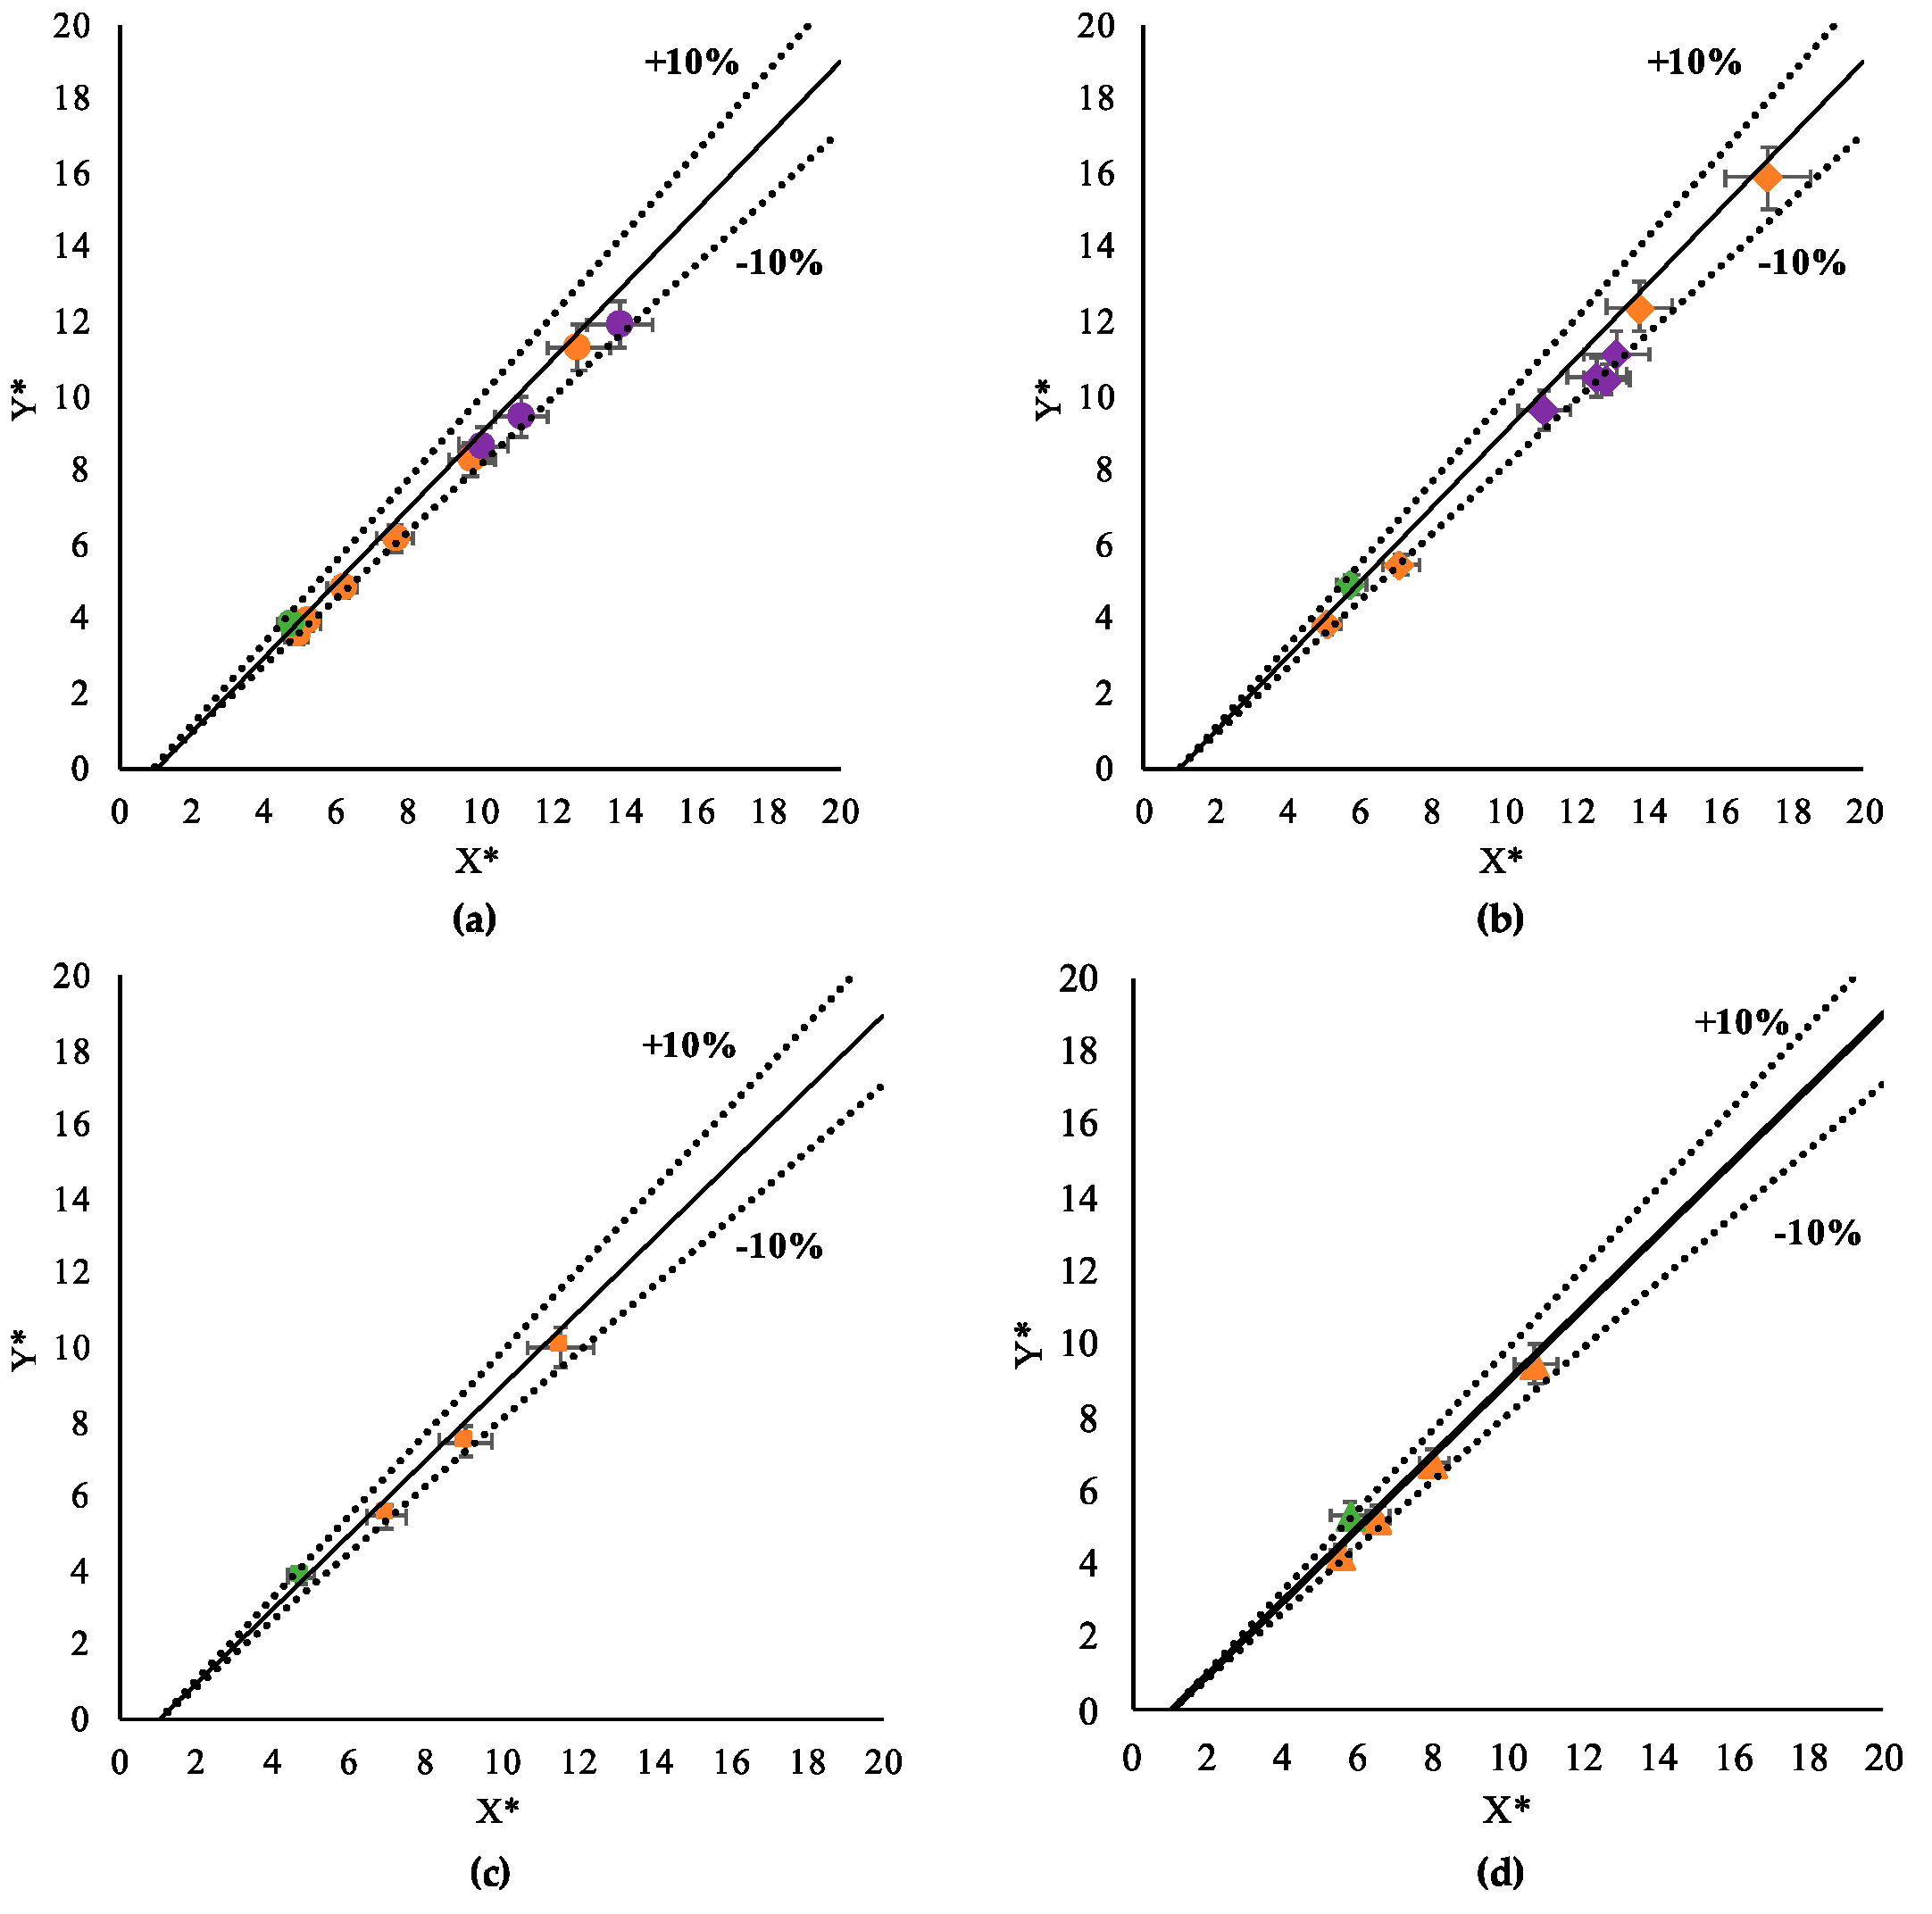
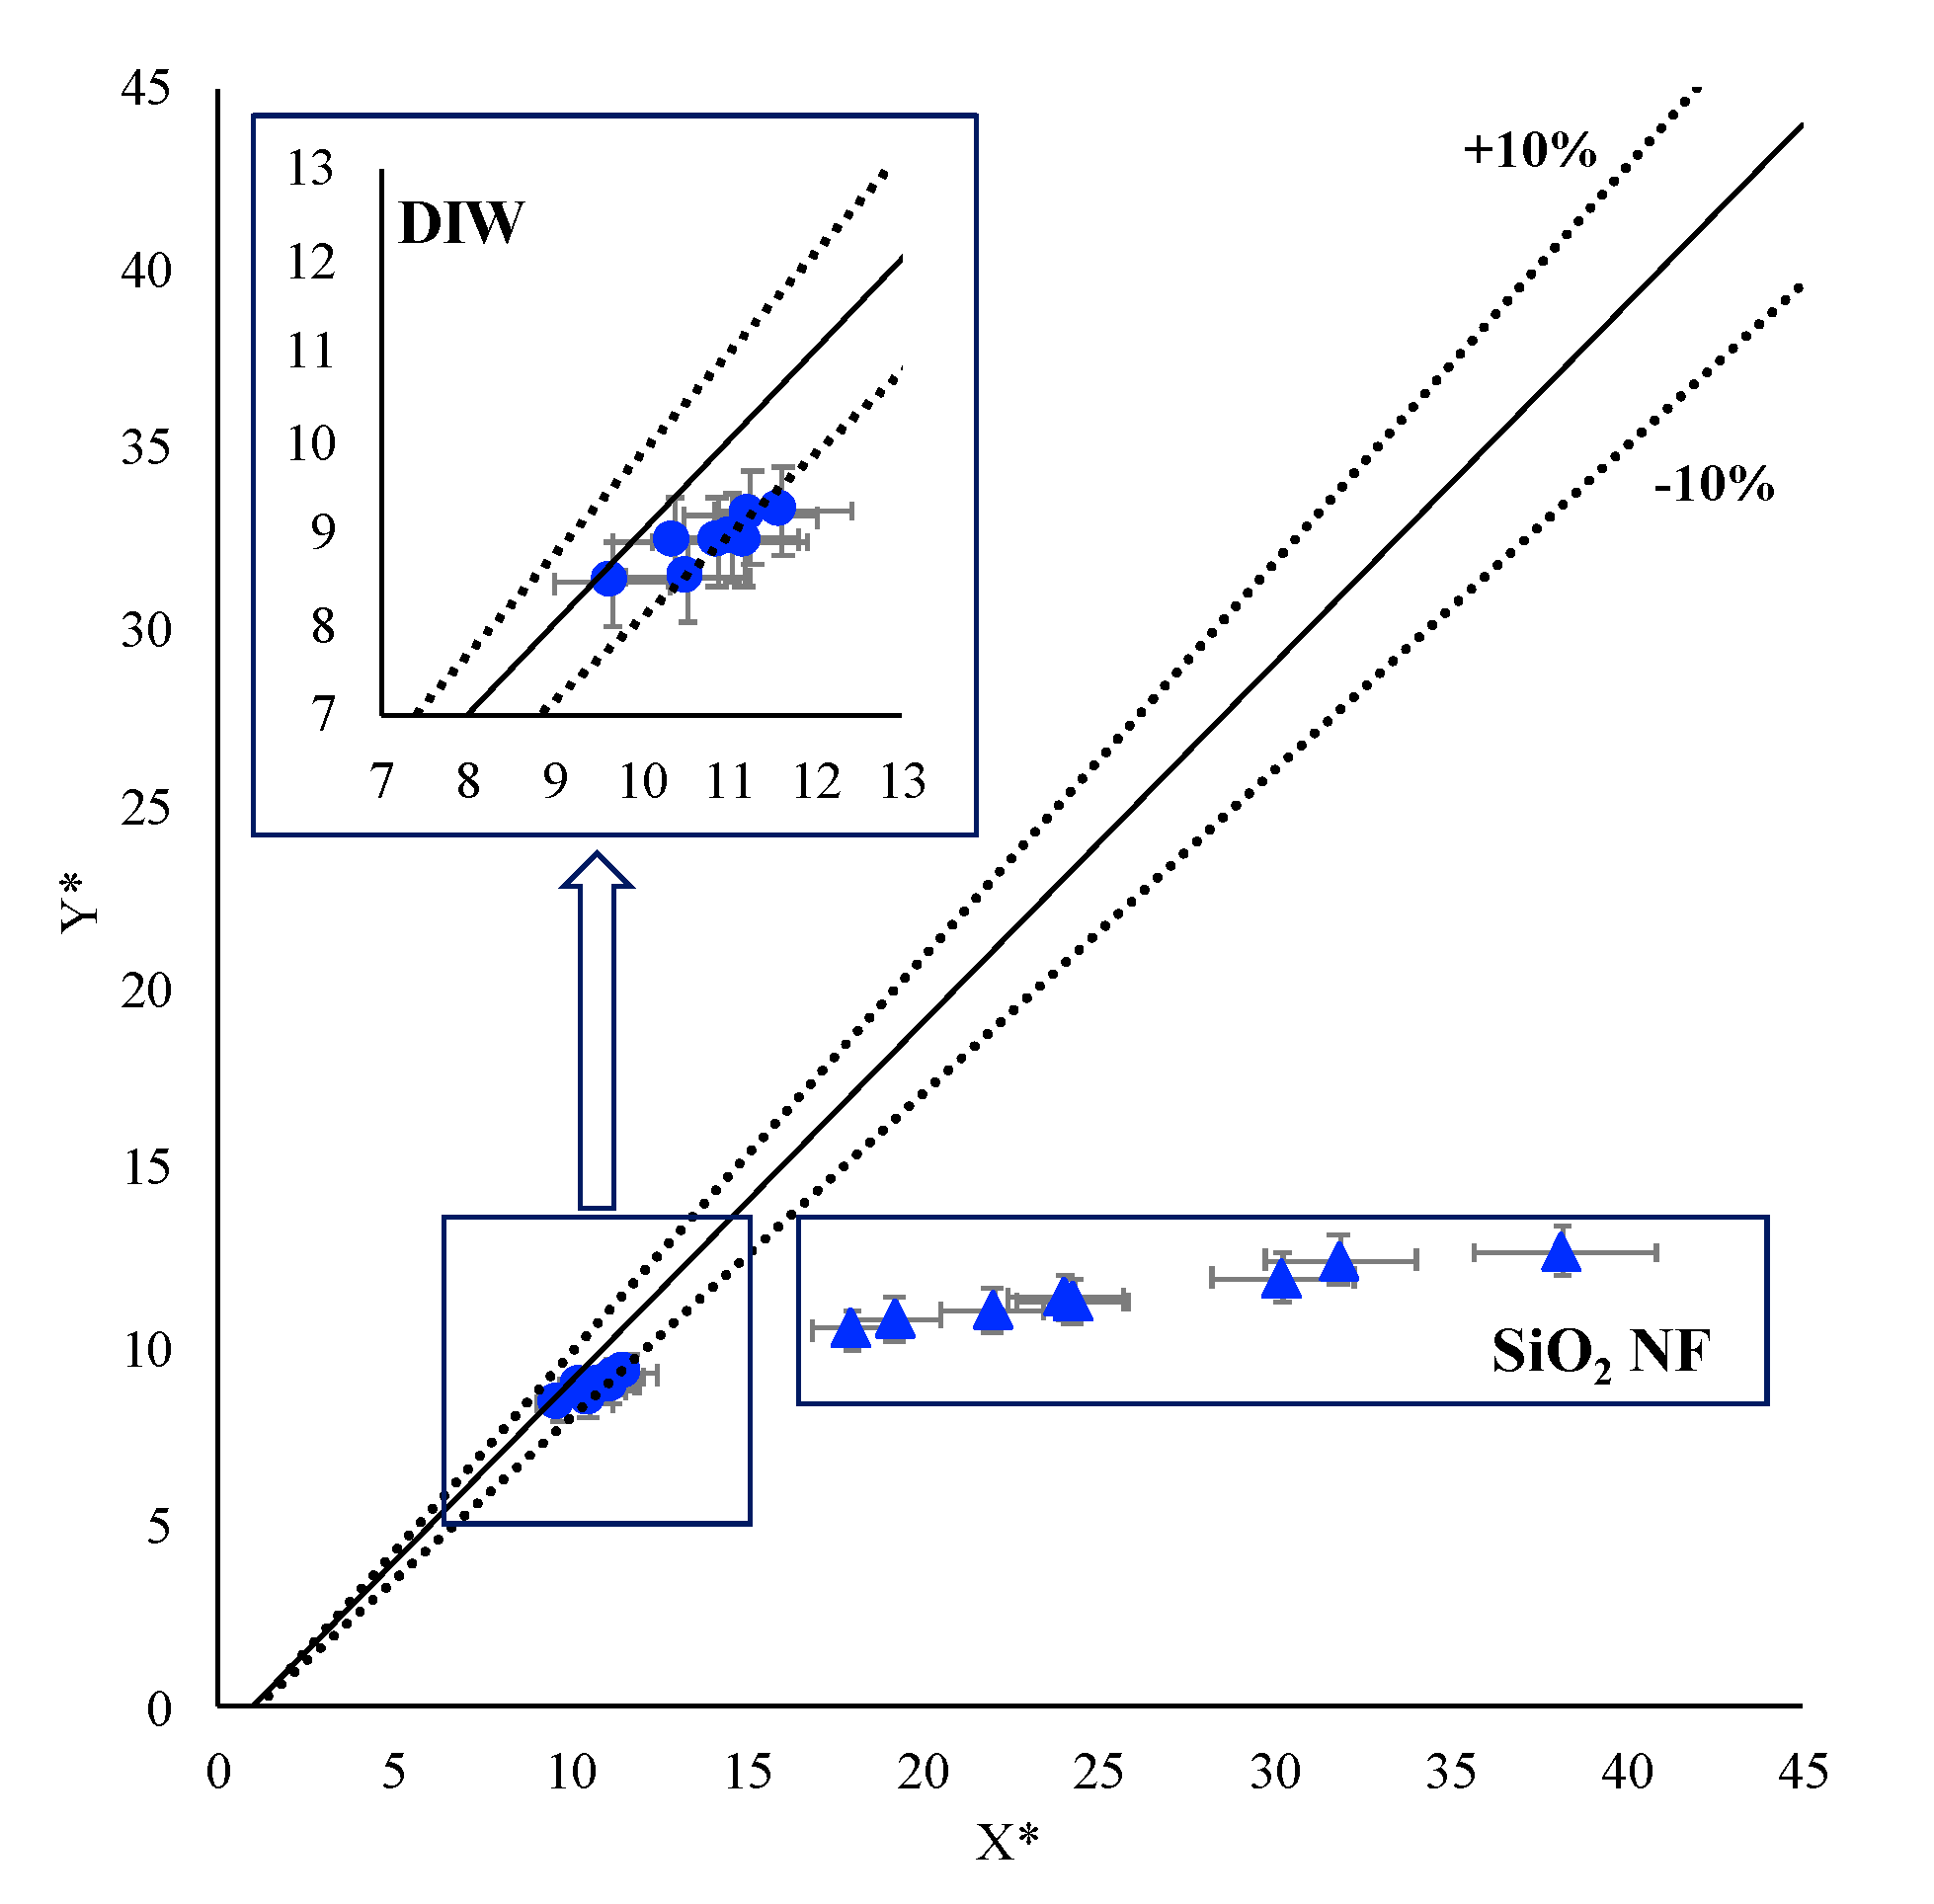
Figure 6 and Figure 7 show that the SD model was valid for DIW (Ω = 4.71%), Al2O3 NF (Ω = 3.78%) and Au NF (Ω = 7.18%). Vafaei and Podowski [32] mentioned that as volume decreases the shape of the droplet is more spherical. Although the volume range was narrow for this study, change of the droplet shape with volume was obviously clear. For GO nanofluid at the highest volume, CA was underpredicted compared to experimental results with Ω = 7.35%. The reason could be the shape and size of the graphene flakes. Different from the other theoretical models, predicted SiO2 data with the SD model was much collapsed with the experimental data with Ω = 10.71% where DIW had Ω = 3.90%.
In addition to these theoretical models, the empirical model developed by Wong et al. [24] allowed us to predict contact angle of nanofluids at lower concentrations (Figure 8). Ω value was calculated for DIW for various volumes, DIW at constant volume, Au NF and GO NF were 5.77%, 3.53%, 4.70% and 5.26%, respectively. CA data of Al2O3 NF (Ω = 9.78%) predicted by the W model is different for smaller volumes. However, increase in volume results in more accurate results with the W model. The reason could be that the concentration highly affects on CA at lower volumes for this model. Similar behavior was observed for also SiO2 NF. The W model was not suitable for highly concentrated nanofluids as shown in SiO2 NF (Ω = 144.46%) results in Figure 9.
3.2. Droplet Shape Prediction
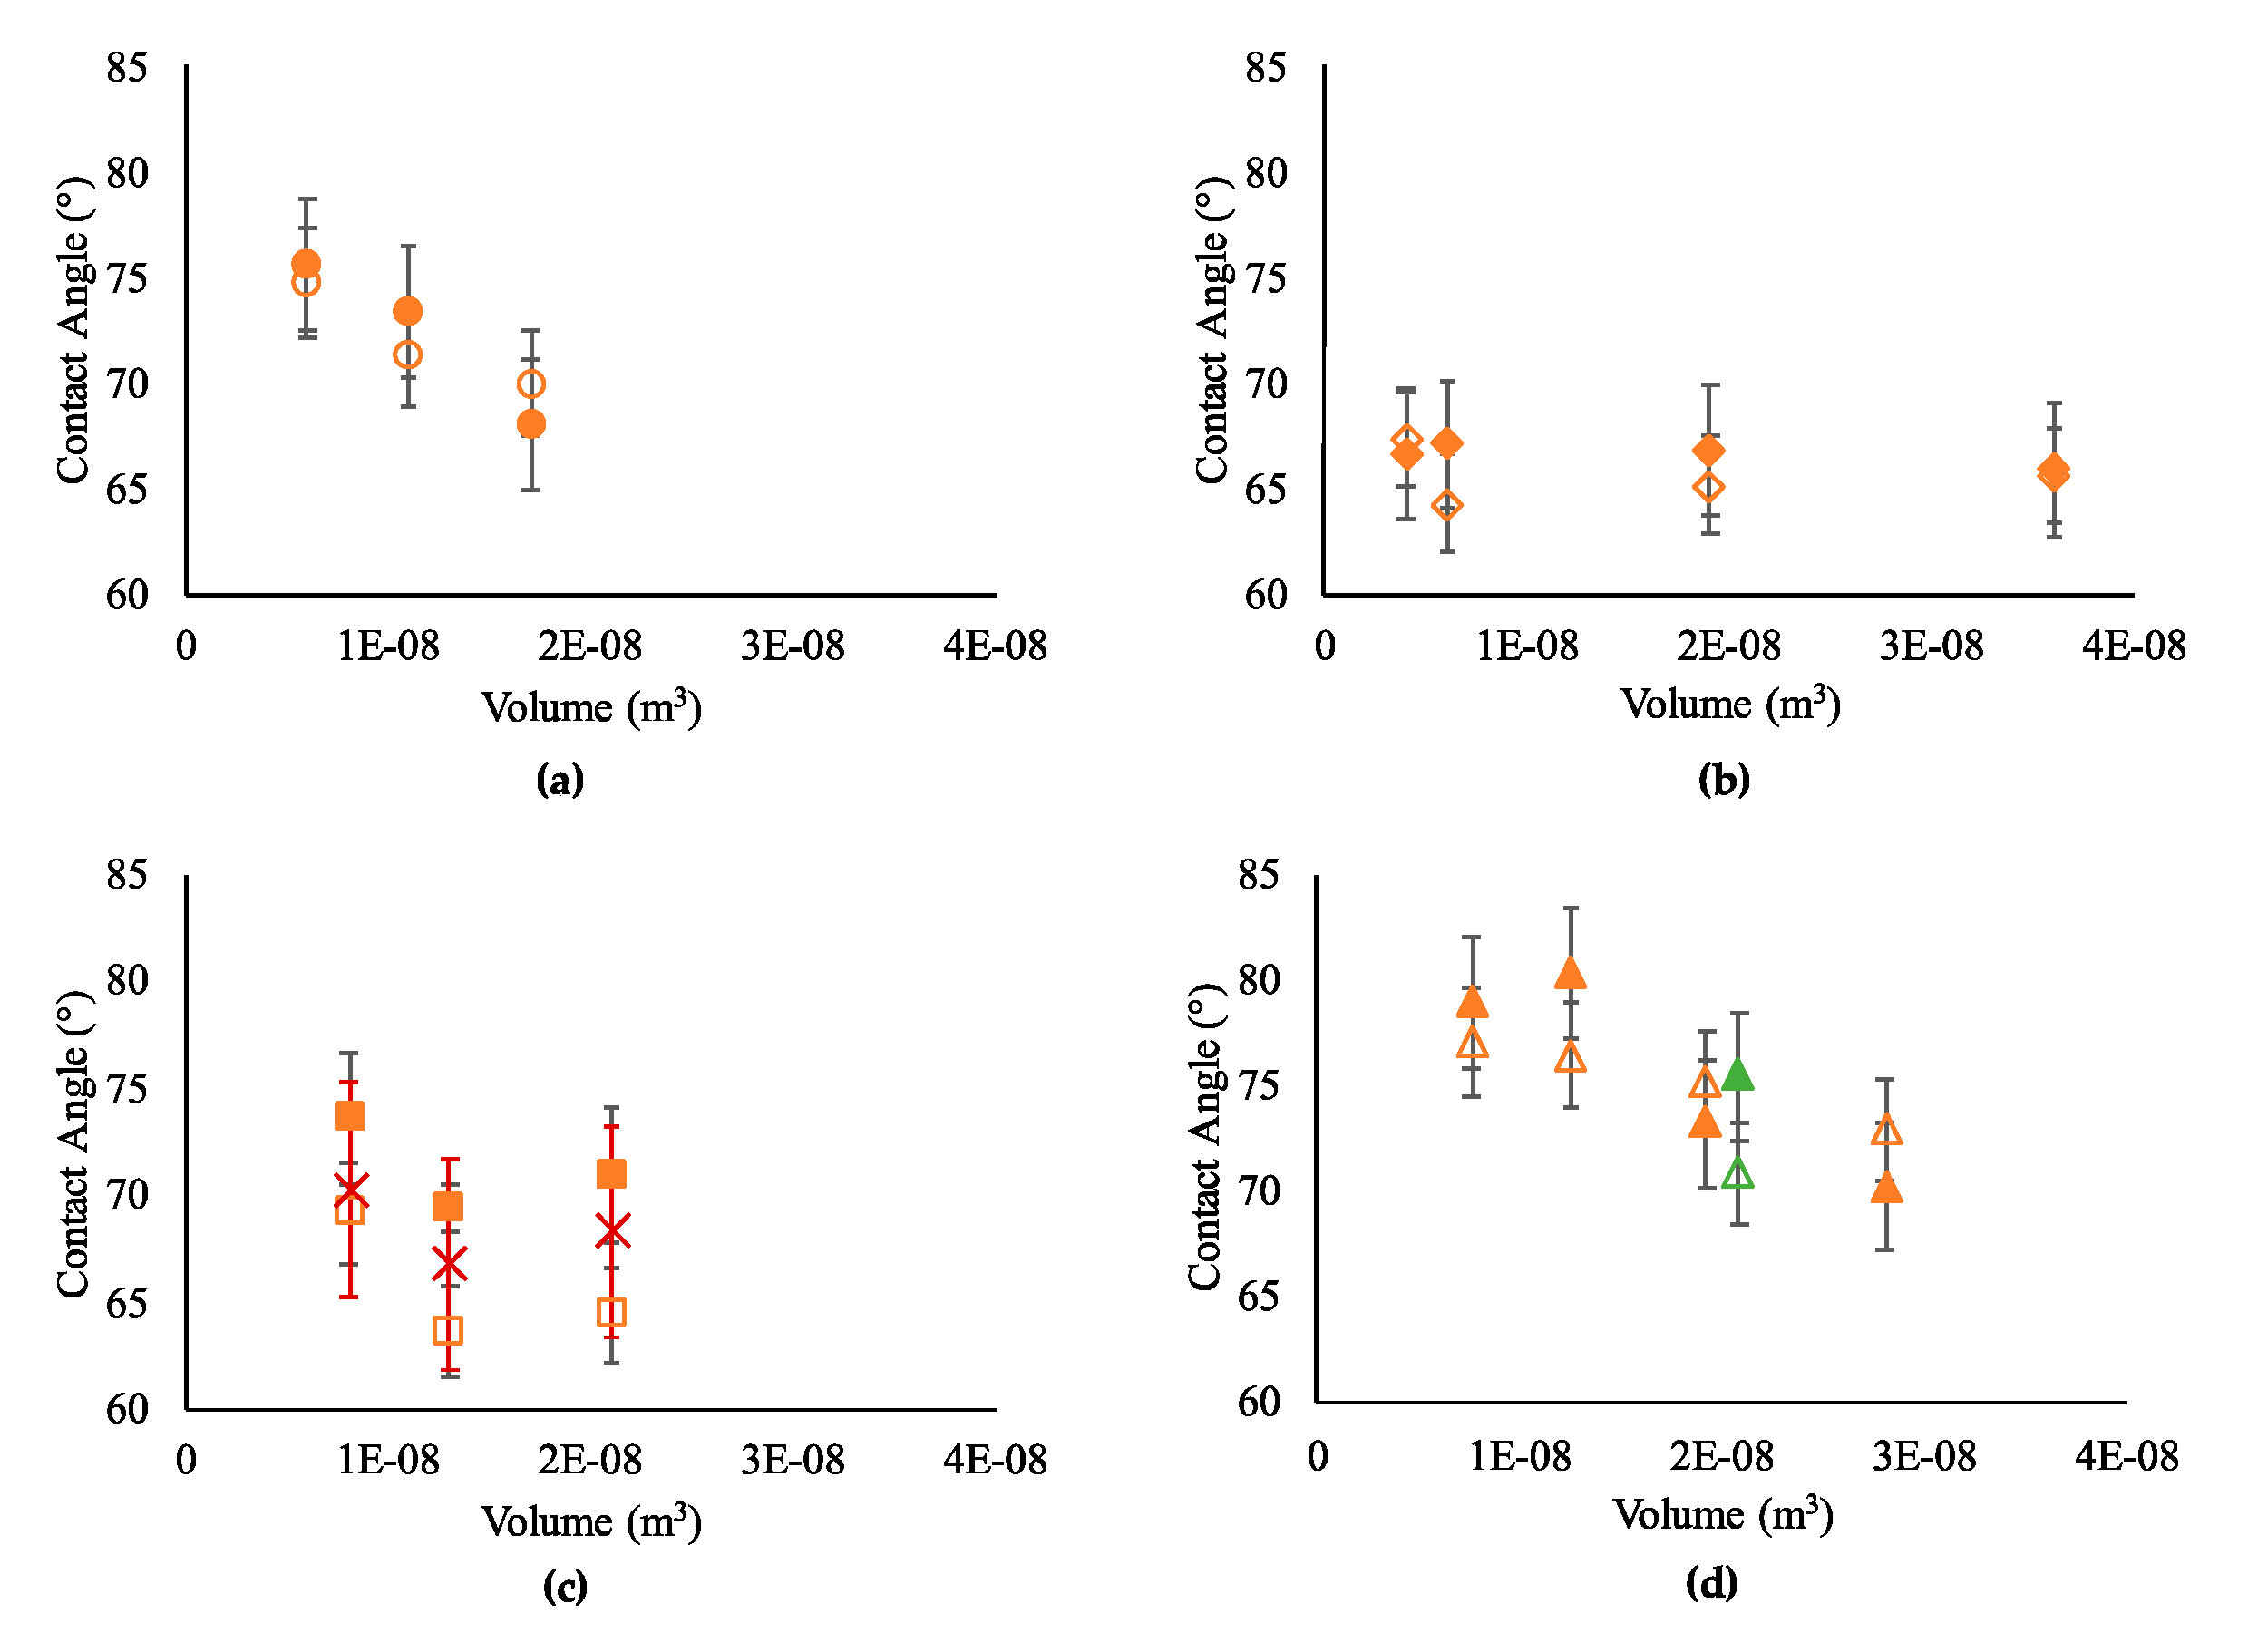
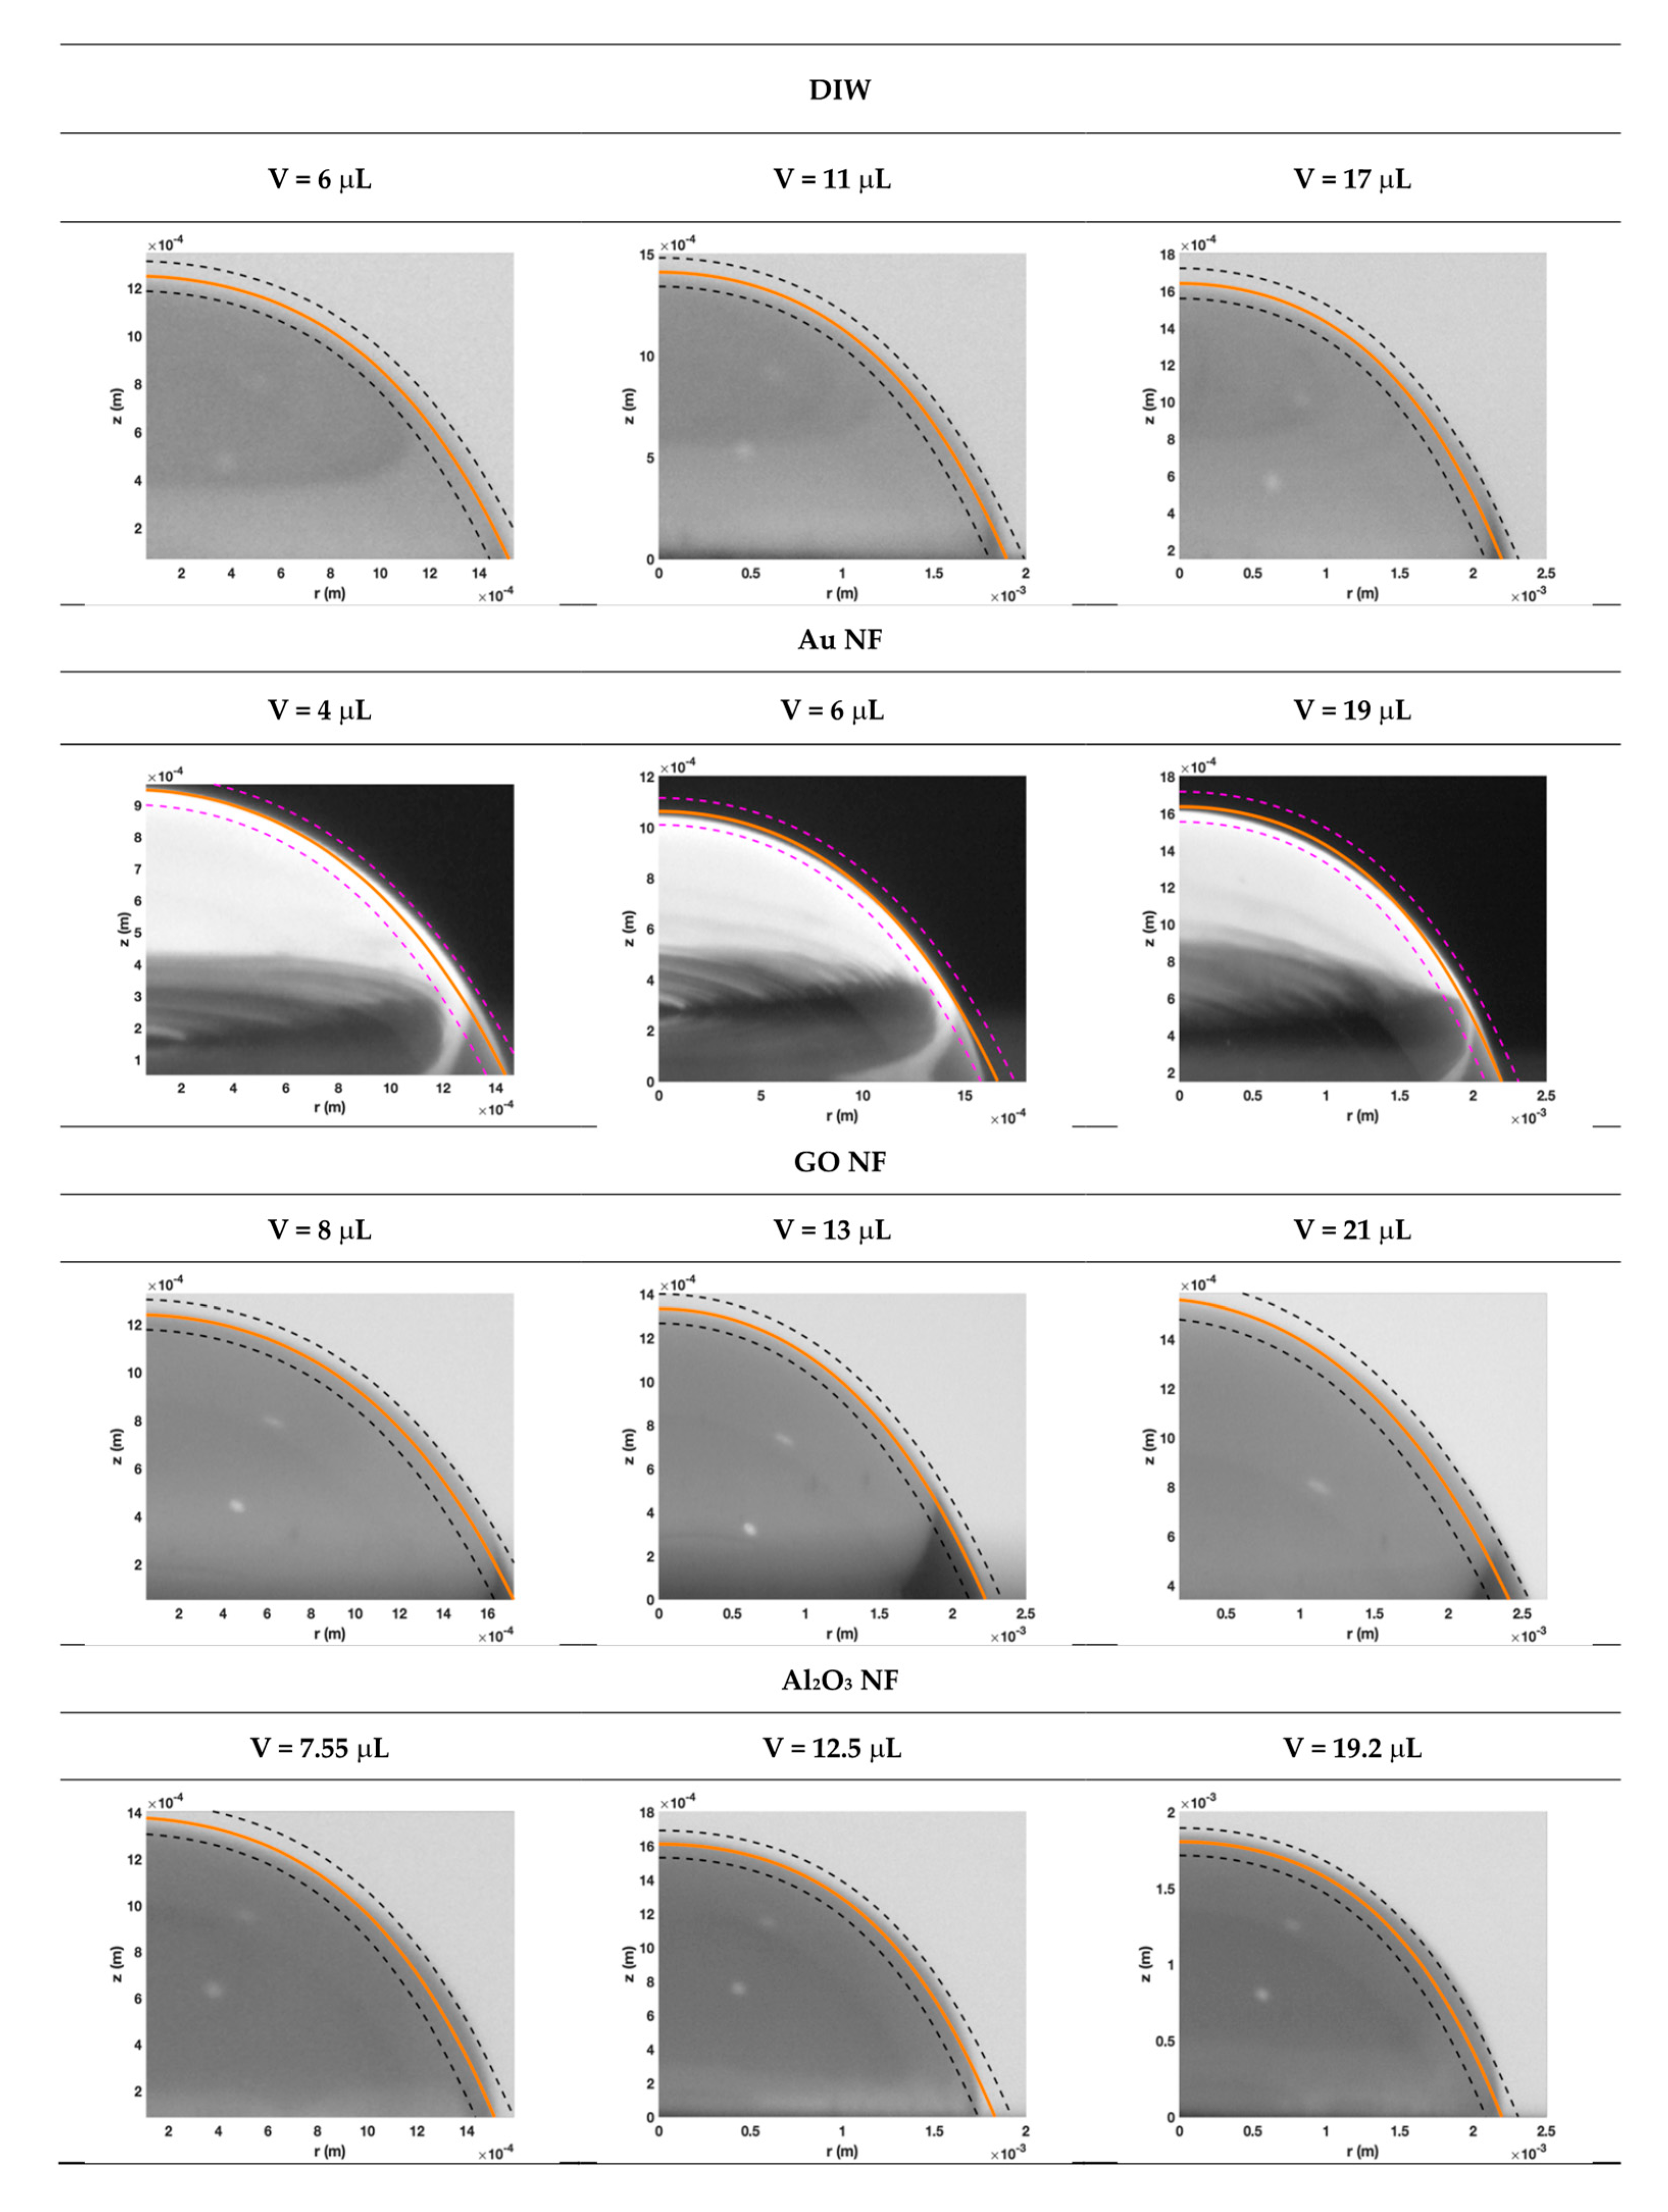
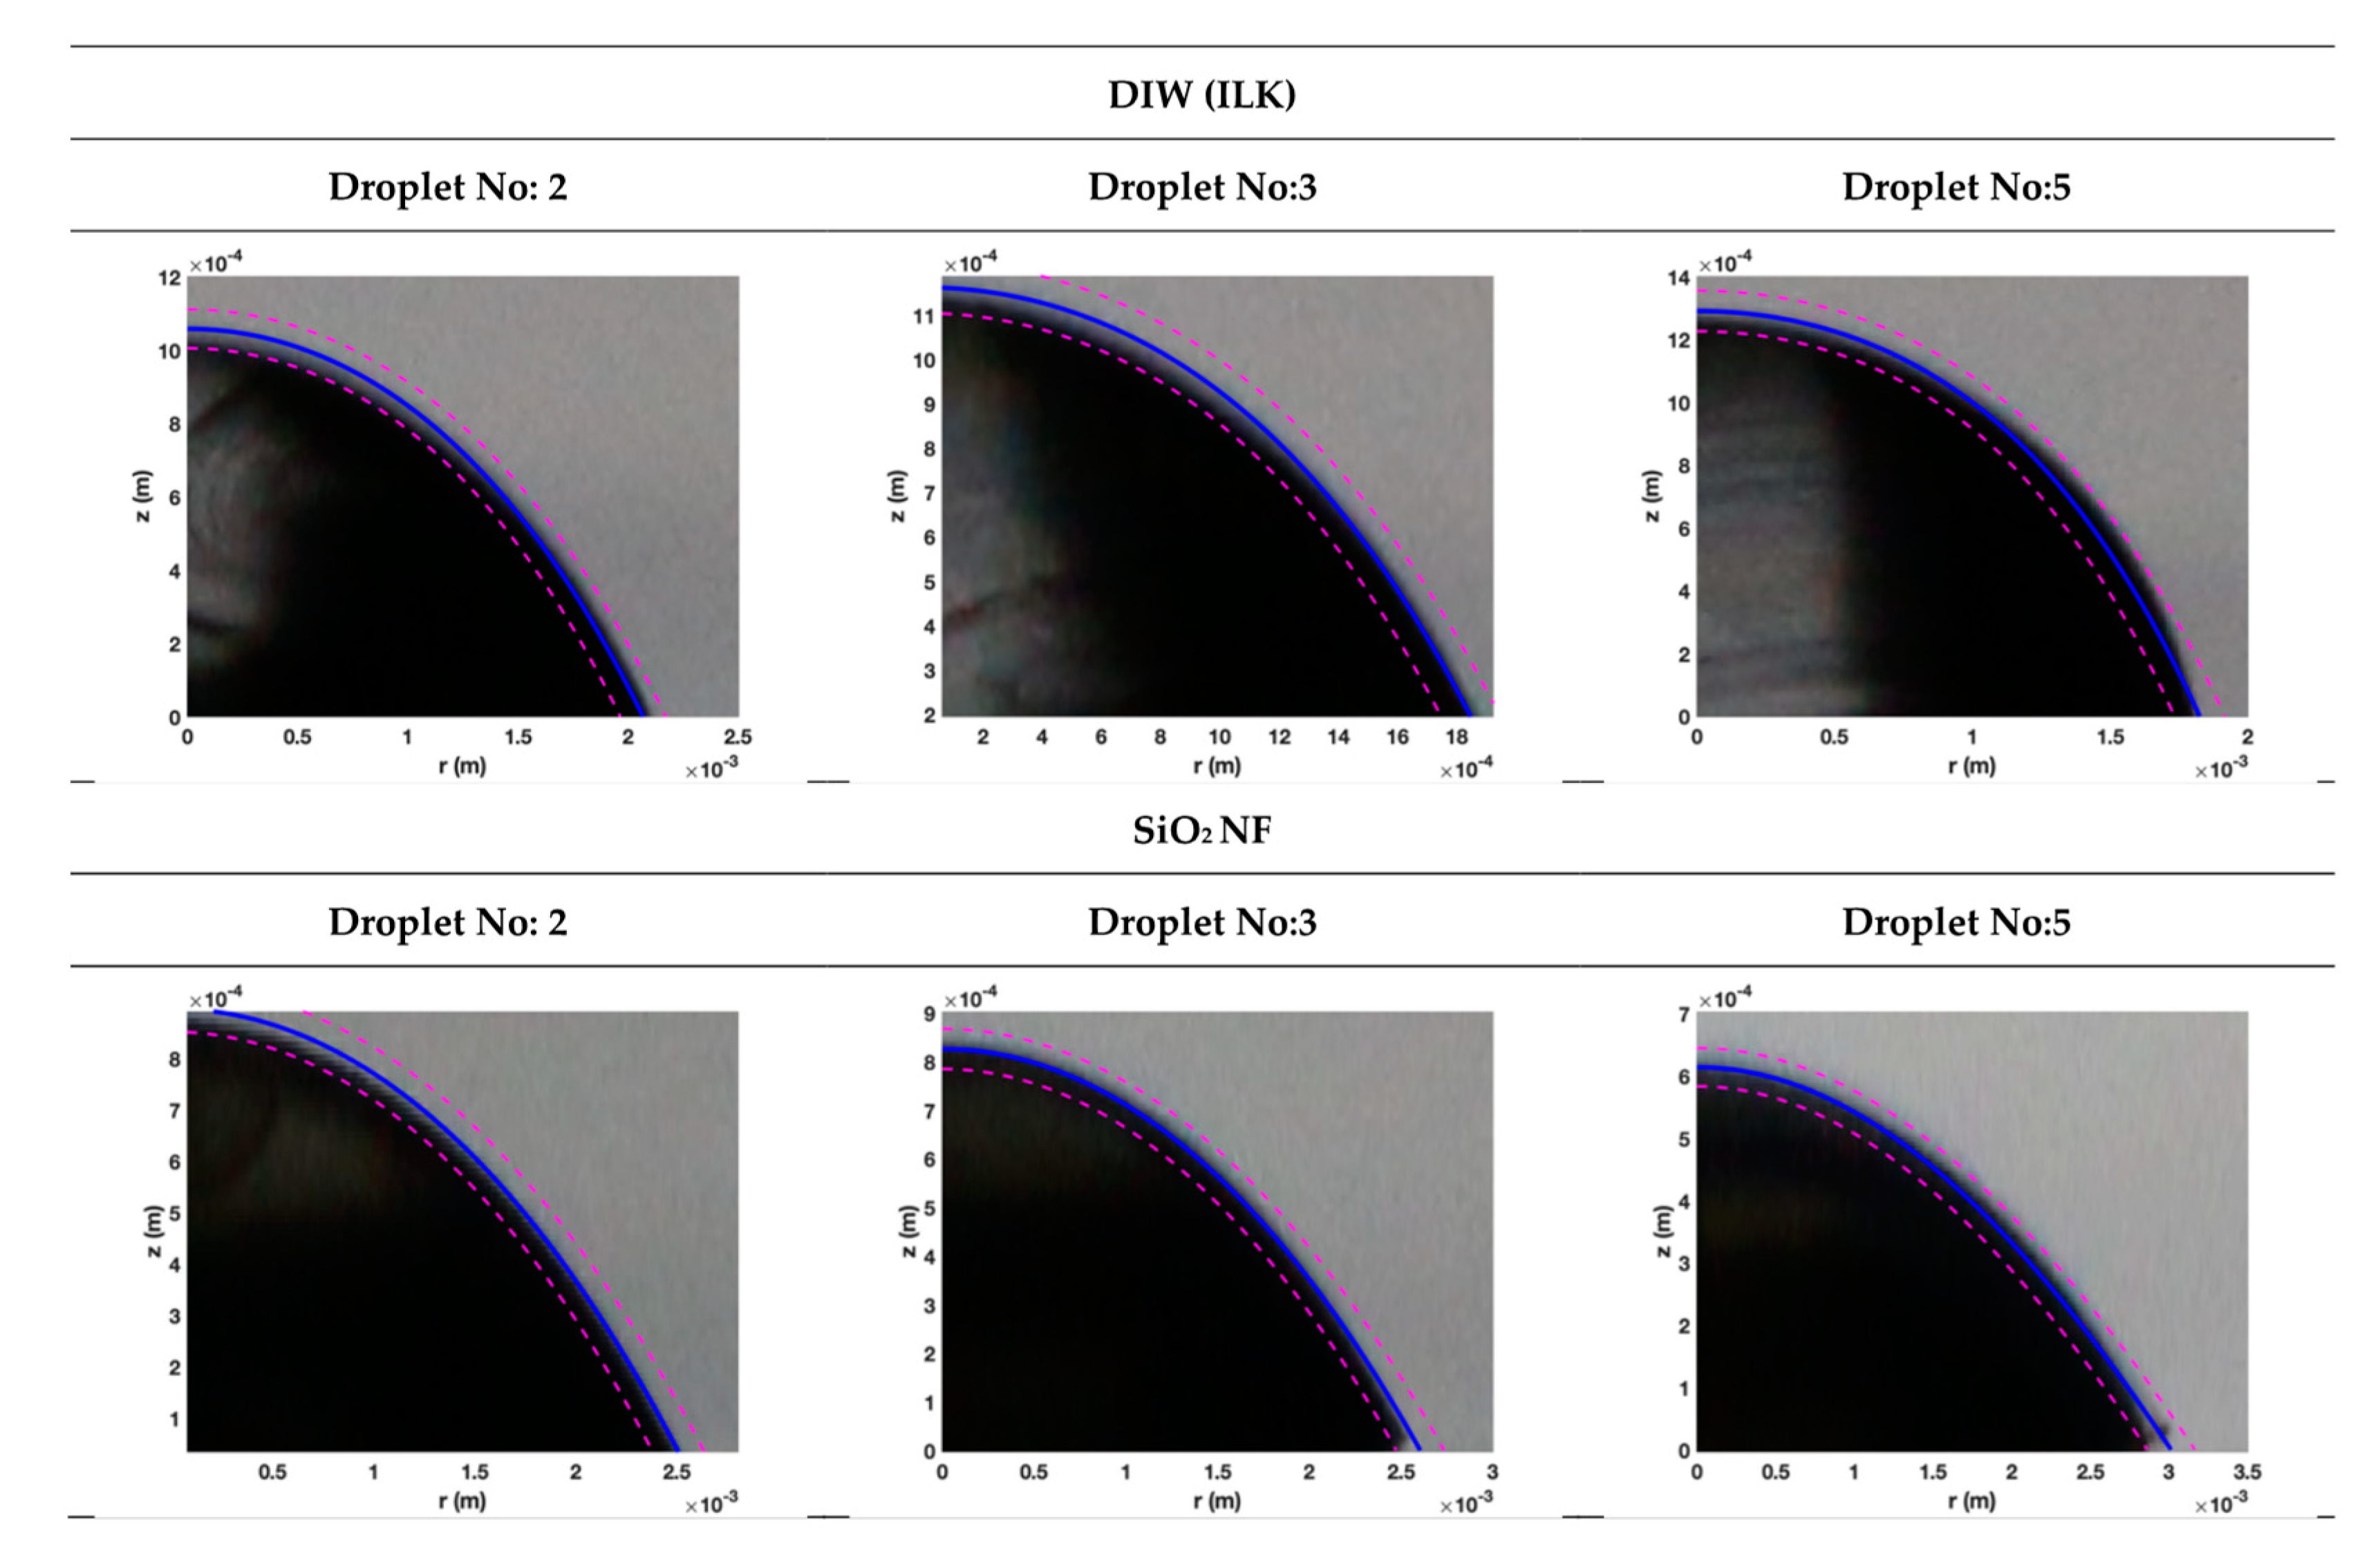
Vafaei and Podowski [32] also developed a model to predict droplet shape based on force balance (Equation (15)). This subsection presents the validity of this model for nanofluids considered in this study. For volume dependent analysis, droplets had a maximum 21 μL of volume (Figure 10). For constant volume analysis of DIW and SiO2 NF, droplets that had maximum, minimum and average contact angles were chosen (Figure 11).
Droplet shape was predicted with ±5% error for all cases without influence of shape and concentration of nanoparticles, and volume of the droplet. This ±5% error band could include measurement errors in geometrical parameters and experimental errors.
4. Conclusions
The aim of this study was to evaluate the reliability of three theoretical models and one empirical model developed for single-phase liquids for describing the correlation between contact angle, geometrical parameters and forces/energy balance of nanofluid sessile droplets. Four types of water-based nanofluids were considered varying the size, shape and nature of nanoparticles as well as the concentration.
Single-phase models were expressed in terms of Bo, which depends on surface tension and density, non-dimensional volume V* and geometrical simplexes and they were used for prediction of dilute NFs’ CA. Although the measurement of the required geometrical parameters for prediction of CA demands high precision to obtain accurate results, it is concluded that concentration is the main factor to affect applicability of models for NFs. Although the force balance-based VP model was too sensitive to measurement errors for GO NF and CA of dilute NFs (Au, GO and Al2O3 NF) could be predicted by both the VP model and energy balance-based YK model. Moreover, the empirical W model was valid for dilute NFs (Au and GO NF) and higher volumes of Al2O3 NF. However, significant differences were obtained for highly concentrated SiO2 NF in these theoretical models and empirical model. Additional effects like disjoining pressure, convective flows inside the droplet, etc. could be the reasons of differences in results of different models. Beside them, the SD model is suitable for almost all samples due to the spherical shape of droplets as a result of smaller volumes. However, higher error band of SD model is the limitation for accurate prediction of CA. It was also shown that the droplet shape of all NFs could be well predicted from a model based on force balance.
To conclude, further research is now needed to resolve and improve the limitation of the measurement of dimensions and for the development of a useful and generic CA model by investigation of additional possible effects such as temperature, a wider range of nanoparticle size and shape varying the nanoparticle concentration.
Author Contributions
Conceptualization, N.Ç. and M.H.B.; Methodology, N.Ç., Z.H.K., P.E. and R.M.-C.; Validation, N.Ç., P.E. and M.H.B.; Formal Analysis, N.Ç. and M.H.B.; Investigation, N.Ç., P.E. and R.M.-C.; Resources, N.Ç., P.E. and R.M.-C.; Data Curation, N.Ç. and M.H.B.; Writing—Original Draft Preparation, N.Ç.; Writing—Review and Editing, Z.H.K., P.E., R.M.-C. and M.H.B.; Visualization, N.Ç., Z.H.K., P.E., R.M.-C. and M.H.B.; Supervision, M.H.B.; Project Administration, N.Ç., Z.H.K. and M.H.B.
Funding
N.Ç. acknowledges the EU COST Action CA15119: Overcoming Barriers to Nanofluids Market Uptake for financial support in the participation of the 1st International Conference on Nanofluids (ICNf) and the 2nd European Symposium on Nanofluids (ESNf) held at the University of Castellón, Spain during 26–28 June 2019. P.E. acknowledges the European Union through the European Regional Development Fund (ERDF), the Ministry of Higher Education and Research, the French region of Brittany and Rennes Métropole for the financial support related to the device used in this study for surface tension and contact angle measurements.
Acknowledgments
This investigation is a contribution to the COST (European Cooperation in Science and Technology) Action CA15119: Overcoming Barriers to Nanofluids Market Uptake (NanoUptake).
Conflicts of Interest
The authors declare no conflict of interest.
Nomenclature
| Bo | Bond Number (–) |
| c | Coefficients |
| g | Gravitational Acceleration (m/s2) |
| G | Geometrical Similarity Simplex (–) |
| k | Thermal Conductivity (W/mK) |
| r | Droplet Wetting Radius (m) |
| R | Radius of Curvature (m) |
| RH | Relative Humidity (%) |
| V | Volume (m3) |
| W | Width of the droplet (m) |
| T | Temperature (°C) |
Abbreviations
| CA | Contact Angle |
| DIW | Distilled Water |
| İKÇÜ | Izmir Katip Çelebi University |
| ILK | ILK-Dresden |
| NF | Nanofluid |
| UJI | Universitat Jaume I Castelló |
| UR1 | Université Rennes 1 |
Subscripts
| 0 | At the apex |
| d | Droplet |
| e | Effective |
| f | Base Fluid |
| lg | Liquid–Gas |
| p | Particle |
| s | Spherical |
| v | Volumetric |
Greek Letters
Surface Tension (mN/m) | |
Location of Apex (m) | |
Density (kg/m3) | |
Contact Angle (°) | |
Mean Absolute Percentage Error (%) | |
Concentration of NF (%) |
References
- Choi, S.U.; Eastman, J.A. Enhancing Thermal Conductivity of Fluids with Nanoparticles; Argonne National Lab.: DuPage County, IL, USA, 1995. [Google Scholar]
- Cabaleiro, D.; Gracia-Fernández, C.; Legido, J.; Lugo, L. Specific heat of metal oxide nanofluids at high concentrations for heat transfer. Int. J. Heat Mass Transf. 2015, 88, 872–879. [Google Scholar] [CrossRef]
- Riazi, H.; Murphy, T.; Webber, G.B.; Atkin, R.; Tehrani, S.S.M.; Taylor, R.A. Specific heat control of nanofluids: A critical review. Int. J. Therm. Sci. 2016, 107, 25–38. [Google Scholar] [CrossRef]
- Koca, H.D.; Doganay, S.; Turgut, A.; Tavman, I.H.; Saidur, R.; Mahbubul, I.M. Effect of particle size on the viscosity of nanofluids: A review. Renew. Sustain. Energy Rev. 2018, 82, 1664–1674. [Google Scholar] [CrossRef]
- Murshed, S.S.; Estellé, P. A state of the art review on viscosity of nanofluids. Renew. Sustain. Energy Rev. 2017, 76, 1134–1152. [Google Scholar] [CrossRef]
- Antoniadis, K.D.; Tertsinidou, G.J.; Assael, M.J.; Wakeham, W.A. Necessary conditions for accurate, transient hot-wire measurements of the apparent thermal conductivity of nanofluids are seldom satisfied. Int. J. Thermophys. 2016, 37, 78. [Google Scholar] [CrossRef]
- Ahmadi, M.H.; Mirlohi, A.; Nazari, M.A.; Ghasempour, R. A review of thermal conductivity of various nanofluids. J. Mol. Liquids 2018, 265, 181–188. [Google Scholar] [CrossRef]
- Tongkratoke, A.; Pramuanjaroenkij, A.; Kakaç, S. Numerical Study of Mixing Thermal Conductivity Models for Nanofluid Heat Transfer Enhancement. J. Eng. Phys. Thermophys. 2018, 91, 104–114. [Google Scholar]
- Murshed, S.S.; Estellé, P. Rheological Characteristics of Nanofluids for Advance Heat Transfer. In Advances in New Heat Transfer Fluids; CRC Press: Boca Raton, FL, USA, 2017; pp. 227–266. [Google Scholar]
- Estellé, P.; Cabaleiro, D.; Żyła, G.; Lugo, L.; Murshed, S.S. Current trends in surface tension and wetting behavior of nanofluids. Renew. Sustain. Energy Rev. 2018, 94, 931–944. [Google Scholar] [CrossRef]
- Radiom, M.; Yang, C.; Chan, W.K. Characterization of Surface Tension and Contact Angle of Nanofluids; SPIE: Bellingham, WA, USA, 2010; Volume 7522, p. 75221D. [Google Scholar]
- Radiom, M.; Yang, C.; Chan, W.K. Dynamic contact angle of water-based titanium oxide nanofluid. Nanoscale Res. Lett. 2013, 8, 282. [Google Scholar] [CrossRef]
- Cieśliński, J.T.; Krygier, K.A. Sessile droplet contact angle of water–Al2O3, water–TiO2 and water–Cu nanofluids. Exp. Therm. Fluid Sci. 2014, 59, 258–263. [Google Scholar] [CrossRef]
- Murshed, S.S.; Tan, S.-H.; Nguyen, N.-T. Temperature dependence of interfacial properties and viscosity of nanofluids for droplet-based microfluidics. J. Phys. Appl. Phys. 2008, 41, 085502. [Google Scholar] [CrossRef]
- Harikrishnan, A.; Dhar, P.; Agnihotri, P.K.; Gedupudi, S.; Das, S.K. Wettability of complex fluids and surfactant capped nanoparticle-induced quasi-universal wetting behavior. J. Phys. Chem. B 2017, 121, 6081–6095. [Google Scholar] [CrossRef] [PubMed]
- Jeong, Y.H.; Chang, W.J.; Chang, S.H. Wettability of heated surfaces under pool boiling using surfactant solutions and nano-fluids. Int. J. Heat Mass Transf. 2008, 51, 3025–3031. [Google Scholar] [CrossRef]
- Prajitno, D.; Trisnawan, V.; Syarif, D. Effect of Spreading Time on Contact Angle of Nanofluid on the Surface of Stainless Steel AISI 316 and Zircalloy 4; IOP Publishing: Bristol, UK, 2017; Volume 196, p. 012028. [Google Scholar]
- Lu, G.; Duan, Y.-Y.; Wang, X.-D. Experimental study on the dynamic wetting of dilute nanofluids. Colloids Surf. Physicochem. Eng. Asp. 2015, 486, 6–13. [Google Scholar] [CrossRef]
- Hernaiz, M.; Alonso, V.; Estellé, P.; Wu, Z.; Sundén, B.; Doretti, L.; Mancin, S.; Çobanoğlu, N.; Karadeniz, Z.; Garmendia, N.; et al. The contact angle of nanofluids as thermophysical property. J. Colloid Interface Sci. 2019, 547, 393–406. [Google Scholar] [CrossRef]
- Chinnam, J.; Das, D.; Vajjha, R.; Satti, J. Measurements of the contact angle of nanofluids and development of a new correlation. Int. Commun. Heat Mass Transf. 2015, 62, 1–12. [Google Scholar] [CrossRef]
- Grosu, Y.; González-Fernández, L.; Nithiyanantham, U.; Faik, A. Wettability control for correct thermophysical properties determination of molten salts and their nanofluids. Energies 2019, 12, 3765. [Google Scholar] [CrossRef]
- Cabaleiro, D.; Hamze, S.; Agresti, F.; Estellé, P.; Barison, S.; Fedele, L.; Bobbo, S. Dynamic Viscosity, Surface Tension and Wetting Behavior Studies of Paraffin–in–Water Nano–Emulsions. Energies 2019, 12, 3334. [Google Scholar] [CrossRef]
- Çobanoğlu, N.; Karadeniz, Z.; Estellé, P.; Martínez-Cuenca, R.; Buschmann, M. On the contact angle of nanofluids. In Proceedings of the 1st International Conference on Nanofluids (ICNf2019) & 2nd European Symposium on Nanofluids (ESNf2019), Castelló, Spain, 26–28 June 2019. [Google Scholar]
- Wong, T.I.; Wang, H.; Wang, F.; Sin, S.L.; Quan, C.G.; Wang, S.J.; Zhou, X. Empirical Formulae in Correlating Droplet Shape and Contact Angle. Aust. J. Chem. 2016, 69, 431–439. [Google Scholar] [CrossRef]
- Murshed, S.S. Determination of effective specific heat of nanofluids. J. Exp. Nanosci. 2011, 6, 539–546. [Google Scholar] [CrossRef]
- Turgut, A.; Sauter, C.; Chirtoc, M.; Henry, J.; Tavman, S.; Tavman, I.; Pelzl, J. AC hot wire measurement of thermophysical properties of nanofluids with 3ω method. Eur. Phys. J. Spec. Top. 2008, 153, 349–352. [Google Scholar] [CrossRef]
- Abràmoff, M.D.; Magalhães, P.J.; Ram, S.J. Image processing with ImageJ. Biophoton. Int. 2004, 11, 36–42. [Google Scholar]
- Stalder, A.F.; Kulik, G.; Sage, D.; Barbieri, L.; Hoffmann, P. A snake-based approach to accurate determination of both contact points and contact angles. Colloids Surf. Physicochem. Eng. Asp. 2006, 286, 92–103. [Google Scholar] [CrossRef]
- Linstrom, P.J.; Mallard, W.G. The NIST Chemistry WebBook: A chemical data resource on the internet. J. Chem. Eng. Data 2001, 46, 1059–1063. [Google Scholar] [CrossRef]
- Gomez-Villarejo, R.; Aguilar, T.; Hamze, S.; Estellé, P.; Navas, J. Experimental analysis of water-based nanofluids using boron nitride nanotubes with improved thermal properties. J. Mol. Liquids 2019, 277, 93–103. [Google Scholar] [CrossRef]
- Schindelin, J.; Arganda-Carreras, I.; Frise, E.; Kaynig, V.; Longair, M.; Pietzsch, T.; Preibisch, S.; Rueden, C.; Saalfeld, S.; Schmid, B. Fiji: An open-source platform for biological-image analysis. Nat. Methods 2012, 9, 676. [Google Scholar] [CrossRef]
- Vafaei, S.; Podowski, M. Analysis of the relationship between liquid droplet size and contact angle. Adv. Colloid Interface Sci. 2005, 113, 133–146. [Google Scholar] [CrossRef]
- Kuiken, H. A single-parameter method for the determination of surface tension and contact angle. Colloids Surf. 1991, 59, 129–148. [Google Scholar] [CrossRef]
- Stacy, R. Contact Angle Measurement Technique for Rough Surfaces. Ph.D. Thesis, Michigan Technological University, Houghton, MI, USA, 2009. [Google Scholar]
- Yonemoto, Y.; Kunugi, T. Wettability model for various-sized droplets on solid surfaces. Phys. Fluids 2014, 26, 082110. [Google Scholar] [CrossRef]
Figure 1.
Geometrical parameters on droplet.

Figure 2.
VP model validity for fluids at various volumes. Working fluids are (a) distilled water (DIW), (b) Au nanofluid (NF), (c) GO NF and (d) Al2O3 NF. Colors indicate: orange—Universitat Jaume I Castelló (UJI) and green—Université Rennes 1 (UR1).
Figure 2.
VP model validity for fluids at various volumes. Working fluids are (a) distilled water (DIW), (b) Au nanofluid (NF), (c) GO NF and (d) Al2O3 NF. Colors indicate: orange—Universitat Jaume I Castelló (UJI) and green—Université Rennes 1 (UR1).

Figure 3.
VP model validity for fluids at constant volume. Working fluids are (a) DIW and (b) SiO2 NFs.
Figure 3.
VP model validity for fluids at constant volume. Working fluids are (a) DIW and (b) SiO2 NFs.

Figure 4.
Yonemoto and Kunugi (YK) model validity for fluids at various volumes. Working fluids are (a) DIW, (b) Au NF, (c) GO NF and (d) Al2O3 NF. Colors indicate: orange—UJI, green—UR1 and purple—İzmir Kâtip Çelebi University (İKÇÜ).
Figure 4.
Yonemoto and Kunugi (YK) model validity for fluids at various volumes. Working fluids are (a) DIW, (b) Au NF, (c) GO NF and (d) Al2O3 NF. Colors indicate: orange—UJI, green—UR1 and purple—İzmir Kâtip Çelebi University (İKÇÜ).

Figure 5.
YK model validity for fluids at constant volume.

Figure 6.
Spherical dome (SD) model validity for fluids at various volumes. Working fluids are (a) DIW, (b) Au NF, (c) GO NF and (d) Al2O3 NF. Colors indicate: orange—UJI, green—UR1 and purple—İKÇÜ.
Figure 6.
Spherical dome (SD) model validity for fluids at various volumes. Working fluids are (a) DIW, (b) Au NF, (c) GO NF and (d) Al2O3 NF. Colors indicate: orange—UJI, green—UR1 and purple—İKÇÜ.

Figure 7.
SD model validity for fluids at constant volume. Working fluids are (a) DIW and (b) SiO2 NF.
Figure 7.
SD model validity for fluids at constant volume. Working fluids are (a) DIW and (b) SiO2 NF.

Figure 8.
Wong et al. (W) model validity for fluids at various volumes. Working fluids are (a) DIW, (b) Au NF, (c) GO NF and (d) Al2O3 NF. Colors indicate: orange—UJI, green—UR1 and purple—İKÇÜ.
Figure 8.
Wong et al. (W) model validity for fluids at various volumes. Working fluids are (a) DIW, (b) Au NF, (c) GO NF and (d) Al2O3 NF. Colors indicate: orange—UJI, green—UR1 and purple—İKÇÜ.

Figure 9.
W model validity for fluids at constant volume. Working fluids are (a) DIW and (b) SiO2 NF.
Figure 9.
W model validity for fluids at constant volume. Working fluids are (a) DIW and (b) SiO2 NF.

Figure 10.
Droplet shape prediction at various volumes (—shows Equation (14) and—shows the ±5% errors).
Figure 10.
Droplet shape prediction at various volumes (—shows Equation (14) and—shows the ±5% errors).

Figure 11.
Droplet shape prediction at constant volume (—shows Equation (14) and—shows the ±5% errors).
Figure 11.
Droplet shape prediction at constant volume (—shows Equation (14) and—shows the ±5% errors).


Table 1.
Characteristics of working fluids.
| Nanoparticle | Particle Size | Particle Shape | Density of Nanoparticle (kg/m3) | Density of NF (kg/m3) | Thermal Conductivity Ratio (kNF/kDIW) | |
|---|---|---|---|---|---|---|
| Gold (Au) | Particle diameter: 8.34 nm | Spherical | 0.001 wt. % (0.000052 vol.%) | 1,9300 | 997.25 | 0.999 |
| Silica (SiO2) | Particle diameter: 117 nm | Spherical | 3.935 wt. % (2 vol.%) | 2000 | 1017.06 | 1.008 |
| Graphene oxide (GO) | Extension of particle: 770 to 900 nm Thickness: 2 nm to 10 nm | Flake | 0.01 wt. % (0.005679 vol.%) | 1500–1900 | 997.25 | 0.9964 |
| Alumina (Al2O3) | Particle Diameter: 123 ± 2 nm | Spherical | 0.4 wt. % (0.1 vol. %) | 3987 | 997.25 | 0.9961 |
Table 2.
Devices, temperature, relative humidity and droplet volume of experimental study in each institute.
Table 2.
Devices, temperature, relative humidity and droplet volume of experimental study in each institute.
| Institutions & Devices | Working Fluids | ||||
|---|---|---|---|---|---|
| DIW | Au NF | GO NF | SiO2 NF | Al2O3 NF | |
| İKÇÜ Attention Theta Goniometer (Biolin Scientific, (Sweden/Finland)) | T = 24.2 °C RH = 40% V = 4.6 µL | T = 23.7 °C RH = 40% V = 9.8 µL | T = 23.1 °C RH = 36% V = 4.1 µL | ||
| ILK Lab-made device | T = 22.0 °C RH = 67% V = 10 µL | T = 25.0 °C RH = 64.5 % V = 10 µL | |||
| UJI Lab-made device | T = 24.0 °C RH = 54% V = 5.1–71.1 µL | T = 24.0 °C RH = 54% V = 5.3–68.6 µL | T = 24.0 °C RH = 54% V = 8.4–35.4 µL | T = 24.0 °C RH = 54% V = 5.5–28.8 µL | |
| UR1 DSA-30 Drop Shape Analyzer (KRÜSS GmbH, Germany) | T = 21.0 °C RH = 24% V = 22.3 µL | T = 21.0 °C RH = 24% V = 24.1 µL | T = 21.0 °C RH = 24% V = 34.3 µL | T = 21.0 °C RH = 24% V = 20.9 µL | |
Table 3.
Surface tensions of the working fluids.
| Working Fluid | T (°C) | RH (%) | (mN/m) | Standard Deviation |
|---|---|---|---|---|
| DIW | 21 | 24 | 72.960 | 0.06 |
| GO NF | 21 | 24 | 73.345 | 0.125 |
| Au NF | 21 | 24 | 72.77 | 0.13 |
| Al2O3 NF | 21 | 24 | 72.005 | 0.255 |
| SiO2 NF | 22.8 | 40 | 70.13 | 0.25 |
© 2019 by the authors. Licensee MDPI, Basel, Switzerland. This article is an open access article distributed under the terms and conditions of the Creative Commons Attribution (CC BY) license (http://creativecommons.org/licenses/by/4.0/).
Share and Cite
MDPI and ACS Style
Çobanoğlu, N.; Karadeniz, Z.H.; Estellé, P.; Martínez-Cuenca, R.; Buschmann, M.H. Prediction of Contact Angle of Nanofluids by Single-Phase Approaches. Energies 2019, 12, 4558. https://0-doi-org.brum.beds.ac.uk/10.3390/en12234558
AMA Style
Çobanoğlu N, Karadeniz ZH, Estellé P, Martínez-Cuenca R, Buschmann MH. Prediction of Contact Angle of Nanofluids by Single-Phase Approaches. Energies. 2019; 12(23):4558. https://0-doi-org.brum.beds.ac.uk/10.3390/en12234558
Chicago/Turabian StyleÇobanoğlu, Nur, Ziya Haktan Karadeniz, Patrice Estellé, Raul Martínez-Cuenca, and Matthias H. Buschmann. 2019. "Prediction of Contact Angle of Nanofluids by Single-Phase Approaches" Energies 12, no. 23: 4558. https://0-doi-org.brum.beds.ac.uk/10.3390/en12234558
Note that from the first issue of 2016, this journal uses article numbers instead of page numbers. See further details here.