An Ultrasonic Pulse-Echo Method to Detect Internal Defects in Epoxy Composite Insulation


School of Electric Power, South China University of Technology, Guangzhou 510640, China
*
Author to whom correspondence should be addressed.
Energies 2019, 12(24), 4804; https://0-doi-org.brum.beds.ac.uk/10.3390/en12244804
Submission received: 25 October 2019
/
Revised: 11 December 2019
/
Accepted: 15 December 2019
/
Published: 17 December 2019
(This article belongs to the Section F: Electrical Engineering)
Abstract
:Voids or cracks in basin insulators inside a GIS (gas-insulated metal-enclosed switchgear) could trigger partial discharges or surface flashover under electrical stresses, threatening safe GIS operation. For this paper, some epoxy composite specimens were made from similar materials and manufacturing processes to make 252 kV GIS basin insulators. Some voids with different diameters or cracks with different diameters and orientations were artificially made in the specimens with different thicknesses. An ultrasonic pulse-echo system was set up, and ultrasonic tests were carried out on the specimens with voids or cracks. A method to calculate the depth of a defect was proposed by the propagation time of defect reflected waves. The results showed that a depth of 50 mm, a diameter φ of 2 mm void, and a diameter φ of 1 mm crack in epoxy composite insulation were detected by the ultrasonic system using a 1 MHz transducer.
1. Introduction
Because of its advantages such as high reliability, small ground space requirements, long maintenance cycle, and low environmental impact, the gas-insulated metal-enclosed switchgear (GIS) is widely used in large-scale hydropower projects and urban high-voltage power grids with a complex terrain and a narrow area. Two areas of the insulation design of the GIS are considered critical, namely support spacer reliability and metallic particle contamination. Basin insulators play the roles of electrical insulation, the isolation of gas chamber and supporting conductor in the GIS, and, mainly, the determiners of the safe and reliable operation of the GIS [1].
Reports on GIS reliability have shown that basin insulator defects accounted for about 23% of the GIS failures from 2010 to 2014 [2]. Internal defects in basin insulators include voids and cracks. Voids might result from the incomplete removal of air or impurity gases when the epoxy resin and filler are mixed during manufacturing. Cracks might be generated under huge internal stress in the following conditions: the temperature change during curing, the unbalanced force during transportation or installation, the ambient temperature difference during operation, or the mechanical extrusion of the central conductor and the enclosure. Tiny cracks on the surface of insulators gradually develop towards the depth direction, eventually resulting in damage to insulators, a sharp decline in insulation performance, and even an explosion—thus causing power outage accidents [3].
Regarding allowable defects in basin insulators, the NB/T 42105-2016 [4] and QGDW 1127-2013 [5] standards state that the partial discharge of a single basin insulator should be not higher than 3 pC under the power frequency voltage, the diameter of a void should be no larger than 0.5 mm in the area with the high field strength, and 2 mm in other areas.
As for defect detection technology in basin insulators, the charge method, the ultra-high frequency method (UHF), the very-high frequency method (VHF), the vibration method, and the acoustic method are recommended for partial discharges in withstand voltage tests on-site by the GB-Z 24836-2009 [6] and DL/T 555-2004 [7] standards, as well as an X-ray flaw detection test for allowable defects in a routine tests by the NB/T 42105-2016 [4] and QGDW 1127-2013 [5] standards.
The charge method can effectively detect metal particles, protrusions on electrodes, defects in insulators by variation in discharge magnitude. The UHF method can detect the discharge of several pC, and a range of 300–1000 MHz is effective. Couplers should be located inside GIS on the inner surface of enclosure, and the installation distance should be less than 20 m. Defects can be located by the time difference between UHF signals. The VHF method with a frequency range of 40–300 MHz can locate discharge sources by combining the propagation time of signals with the distance of couplers. The vibration method, based on the important parameters of signal amplitude and flight time, receives 10–30 kHz signals generated by discharge sources through transducers placed on GIS enclosures, and this method is particularly sensitive to metal particles. The principle of the acoustic method, with a range of 20–100 kHz, is similar to that of the vibration method. It is sensitive to metal particles, burrs and protrusions on electrodes, but it may be insensitive to voids in insulators.
At present, investigations on detecting defects in basin insulators have focused on the UHF method, partial discharge ultrasonic detection, and the pulse current method, which are, respectively, based on electromagnetic waves, acoustic waves, and currents generated by partial discharges originated at defects.
Meijer et al. [8] picked up discharging signals by external and internal couplers on a GIS by the UHF method. The signal-to-noise spectra obtained by their spectrum analysis could distinguish free moving particles, protrusions on conductors, and floating electrodes on conductors. Hoshino et al. [9] used loop-type and disc-type of UHF sensors to detect metallic particles with a diameter of 0.25 mm on a conductor and an enclosure. The frequency range of these two types of sensors was increased to 8 GHz. The loop-type sensor had a higher sensitivity to particles on conductors, and the disc-type sensor had a higher sensitivity to particles on enclosures. The UHF method is mostly used for on-site monitoring and can detect a discharge of 5 pC. However, this method’s defect location ability is not accurate enough, and it is not able to quantitatively detect discharge [9,10,11].
Lundgaard et al. [12] used an acoustic emission (AE) sensor to receive the ultrasonic signal propagating along a GIS enclosure. It could distinguish flaw type and magnitude by signal shape and peak, respectively. Qi et al. [13] used an ultrasonic sensor to detect simulated defects in a 252 kV GIS. The change in signal amplitude could find defects, which have a high sensitivity to free metal particles, protrusions on inner shells, and high voltage electrodes. Partial discharge ultrasound detection is often used for live inspection, as it has an accurate location ability and can detect a discharge of 10 pC. However, it is insensitive to the discharge of voids in basin insulators, and its detection efficiency is low [11,13].
Yoshida et al. [14] set up two sets of oscilloscopes to collect discharge signals through the pulse current method. The discharge time and signal amplitude were obtained, and a discharge of 0.1 pC was detected. The pulse current method was able to quantitatively detect a discharge of 2 pC. Because of its susceptibility to interference signals, this method is mostly used in laboratory settings [11,15].
Xu et al. [16] applied an X-ray to penetrate insulators and obtain a digital image. A metallic particle with a diameter of 3 mm on the insulator surface was observed, but the crack on the surface could not be detected. This method was able to detect voids in basin insulators, but its sensitivity to cracks with smaller widths is not high. Additionally, the equipment is large in volume, and radiation has potential harm to the human body [16,17].
In this paper, a nondestructive ultrasonic pulse-echo method for detecting internal defects in basin insulators is studied. At present, there have been more studies on the detection of fiber-reinforced composites by the ultrasonic pulse-echo method [18,19], but there have been fewer studies on epoxy composites. In 1994, Nelson et al. [20] used two angle beam ultrasonic transducers to propagate shear waves into the glass-reinforced epoxy-mica laminated insulation of the stator bars of large generators 3 mm in thickness. Delamination could be detected by the signal amplitude. In 1999, Wisheart et al. [21] used an ultrasonic C-scan method to detect transverse cracks with a length of 6 mm and delamination in pultruded glass polyester laminated composites due to low-velocity impact damage. Aymerich et al. [22] used an ultrasonic C-scan method to detect the impact damage of polyether-etherketone (PEEK) laminates with a thickness of 2.2 mm. The method, which uses the oblique and vertical incidence of longitudinal waves, was able to detect cracks that were perpendicular to the surface and delamination. In 2000, Mouritz et al. [23] used the ultrasonic pulse-echo method with a low frequency, based on gain change, to detect the delamination and cracks caused by fatigue damage in glass fiber-reinforced laminated composites between 7 and 38 mm thick. In 2003, Hao et al. [24,25,26] used a low-frequency probe to detect concentrated defects such as air voids, cracks, and delamination in the glass-reinforced epoxy-mica laminated insulation of the stator bar of a main insulation that was 5.5 mm in thickness by the ultrasonic pulse-echo method. The glass-reinforced epoxy-mica composite insulation of the stator bars of large generators is a glass-reinforced half-lapped laminated structure. The ultrasonic attenuation is large, the detectable thickness is thin, and the sensitivity is low.
It has also been reported that non-laminated insulation could be detected by the ultrasonic wave technique. In 1994, Auckland et al. [27] detected delamination and cracks in bushing materials and air voids with diameters of 0.5 and 1 mm, a depth of 15 mm in an XLPE(cross-linked polyethylene) cable by the ultrasonic pulse-echo method. The authors were able to point out the potential for detecting voids, cracks and delamination in various insulation systems with ultrasonic waves. In 2003, Armentrout et al. [28] placed AE sensors at each end of a glass fiber-reinforced polymer (GRP) composite rod to detect cracks caused in the stress corrosion process, and they obtained the location of these cracks. In 2005, Liang et al. [29] developed a special angle beam transducer to detect cracks between 0.2 and 1.2 mm deep that were perpendicular to the axis of a composite insulator fiber-reinforced plastics (FRP) rod by using ultrasonic critical refracted longitudinal waves. The depth of a crack was analyzed by the amplitude of reflected waves. In 2009, Xie et al. [30] detected debonding bubbles of 0.5 mm in diameter between a composite insulator sheath and a core by an ultrasonic radio frequency method based on the waveform amplitude by. Additionally, ultrasonic phased array technology [19] was used to detect air voids and drill holes of 2 mm in diameter in a silicone rubber plate of 8 mm in thickness and a composite insulators sheath. In [31], an ultrasonic phased array probe was coupled with a composite insulator sheath by a silicone rubber water capsule. Bubbles of 1 mm in diameter and 2.5 mm in depth in the 4 mm thick sheath were detected, as well as bubbles of 2 mm in diameter in the core. Bushing, cable and composite insulators are not laminated insulation, but the materials are soft, and the ultrasonic attenuation is large.
The epoxy composite material of basin insulators is composed of epoxy resin and a filler, which is hard and possibly has less ultrasonic attenuation. In 2015, Shen et al. [32,33] detected internal air gaps and cracks in epoxy composites with a thickness of 30 mm by ultrasonic waves. This method was able to distinguish air gaps between 2 and 1 mm in diameter and cracks with different orientations by analyzing the spectrum of bottom reflected waves. Additionally, the low frequency, ultrasonic pulse-echo method [34] was used to detect bubbles 5 mm in depth and 2 mm in diameter in the insulation pull rod, with a cylindrical structure, of a circuit breaker. Additionally, a polystyrene focusing probe was developed. In 2017, Zhu et al. [35] used Lamb waves to detect micro-cracks 3 mm in length and 1 mm in depth as well as micro-attachments on a basin insulator surface. However, this method was not suitable to detect internal bubbles and cracks.
Existing methods cannot satisfy the needs of a quality assessment, a sampling inspection, a routine test, and a type test. There is an urgent need for the detection technology of internal defects in basin insulators. In this paper, an ultrasonic pulse-echo method was proposed to detect internal defects in an epoxy composite specimen similar to basin insulators. An ultrasonic pulse-echo system was set up. Then, reflected waveforms at voids with different diameters and cracks with different orientations were compared. The sensitivity and effective depth for a transducer were analyzed, and the effectiveness of detecting internal defects in basin insulators was investigated.
2. Ultrasonic Pulse-Echo Method
2.1. Ultrasound Testing System
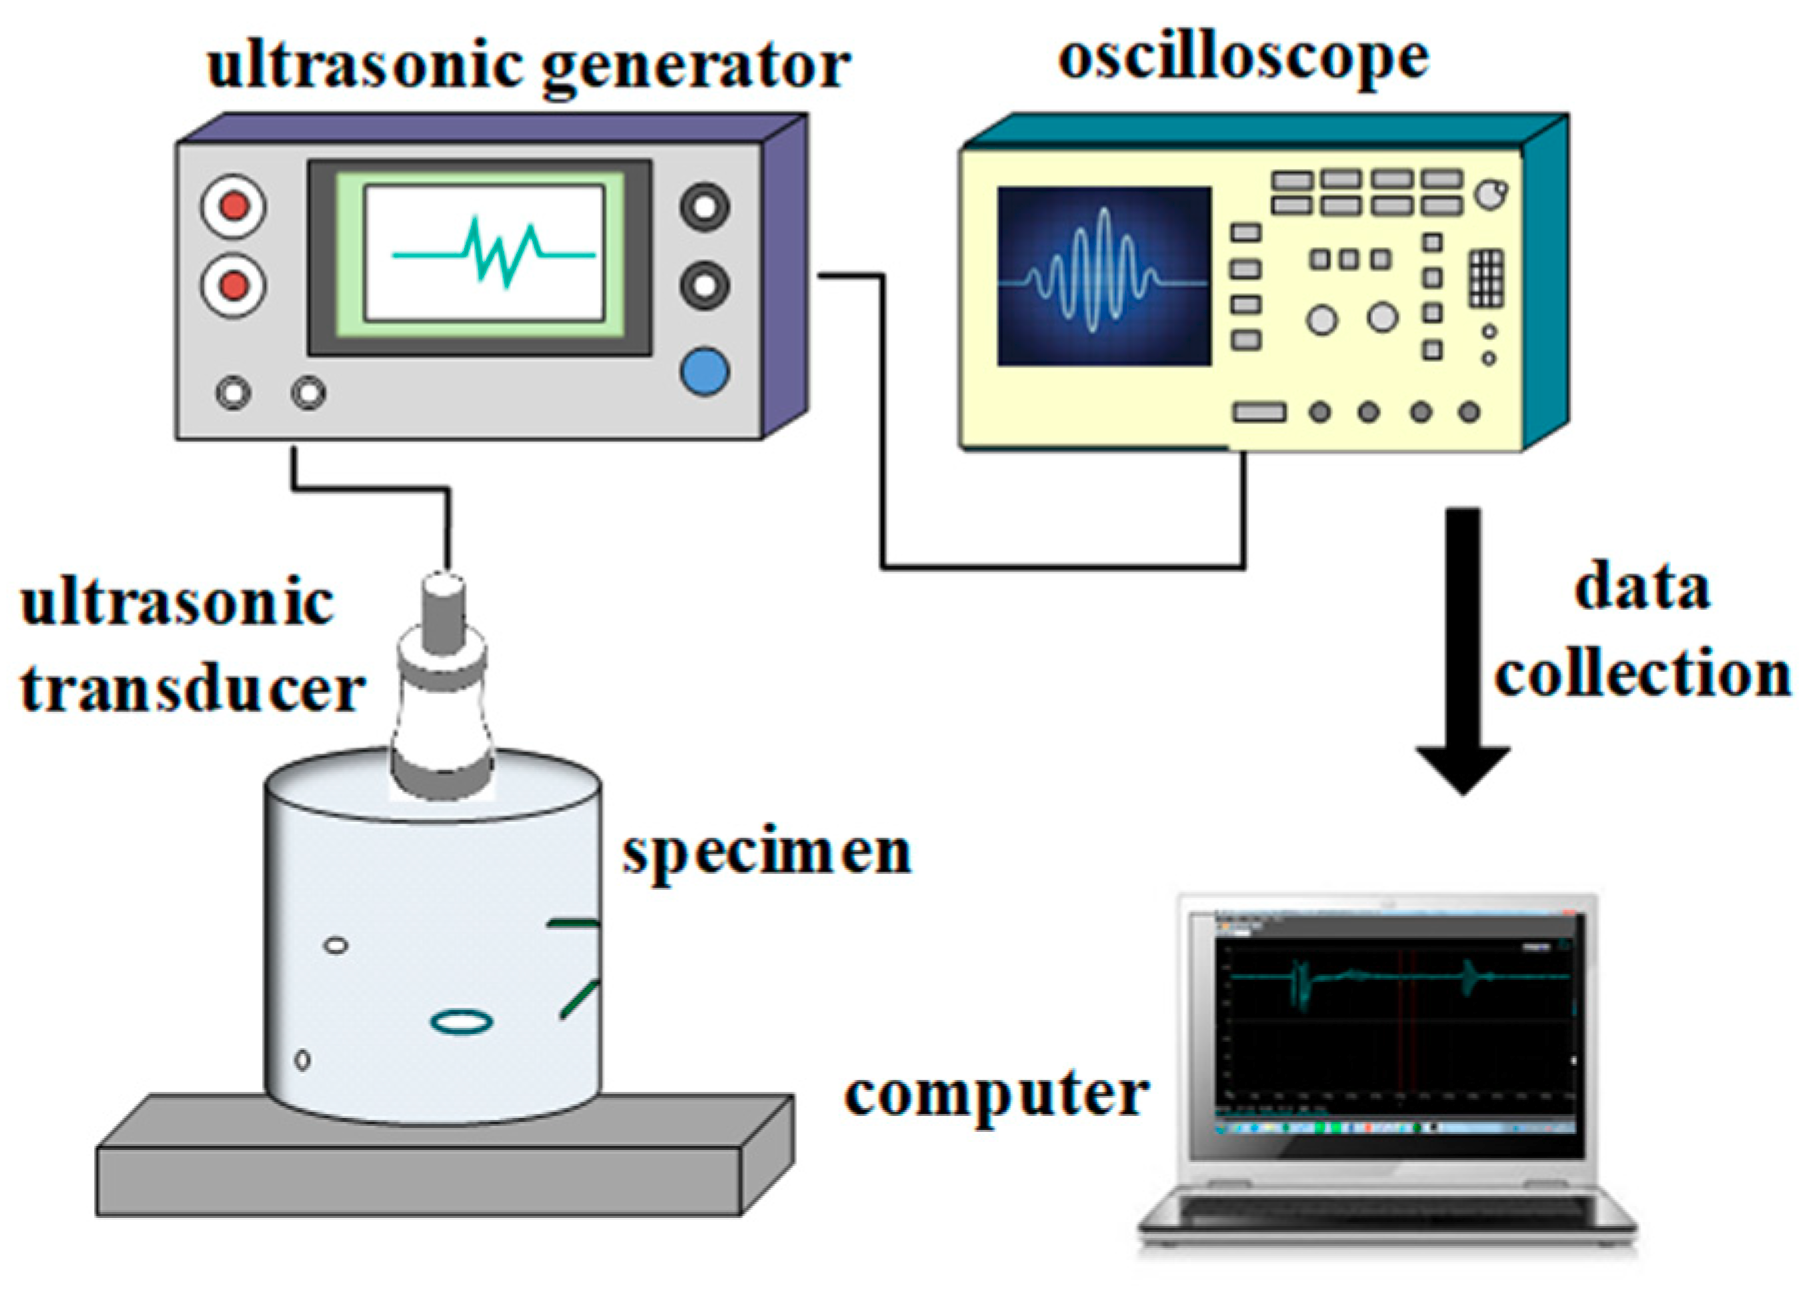
The ultrasonic pulse-echo system in this paper consisted of an ultrasonic generator, a transducer, an oscilloscope and a computer, as shown in Figure 1. Water was used as the coupling between the transducer and the specimen.
2.1.1. Ultrasonic Generator
The ultrasonic generator was an analog type CTS-23 model, and 0.5–20 MHz is an effective range. The CTS-23 model has three kinds of rectification modes, including positive, negative and bidirectional. Original waveforms were processed by the circuit. In order to obtain the original waveform with the full defect information, the ultrasonic generator was improved by directly connecting the oscilloscope with the circuit before the detection mode [25]. The attenuation was 27.5 dB for detecting voids, and 32 and 38 dB for detecting the cracks in epoxy composite specimens with thicknesses of 50 and 30 mm, respectively. The frequency bandwidth of the ultrasonic generator was selected in the range of 1–6 MHz.
2.1.2. Transducer
A single beam transducer was used. The main parameters of transducers include the size of the crystal plate, the frequency, the pulse width and the resolution. The size of the crystal plate determines the acoustic energy emitted by transducers. The larger the size is, the higher the energy is. Low frequency transducers have a strong penetration ability, but their pulse width is large, their wavelength is long, and their sensitivity is low [33,36].
There is a near field area in transducers. Acoustic pressure is partly strengthened and partly weakened in a near field so that the test result has a deviation [36]. According to the ultrasonic propagation velocity or wavelength in an epoxy composite specimen, the length N of the near field area is calculated by the following equation:
where D is the diameter of a transducer and is the wavelength [37]. A range of 1–3 N has a higher sensitivity because it belongs to the non-diffusion zone of acoustic waves.
In this paper, the type of the ultrasonic straight beam transducer was 1P20 (frequency: f = 1 MHz; diameter: φ = 20 mm; and = 3 mm). The near field area was 33 mm, and the sound velocity was 3005.60 m/s.
2.2. Specimen
Epoxy composite specimens were prepared. The material and process were similar to those of 252 kV GIS basin insulators (the thickness was about 40 mm): To begin with, epoxy resin and alumina filler (Al2O3) were mixed with a certain proportion. Then, the curing agent was added. Next, vacuum degassing was conducted. Furthermore, the liquid mixture was poured into a preheated casting mold. Finally, a two-stage solidification process was conducted [38]. The density was 2.23 g/cm3, and the acoustic impedance was 0.67 × 10⁶ g/cm2·s.
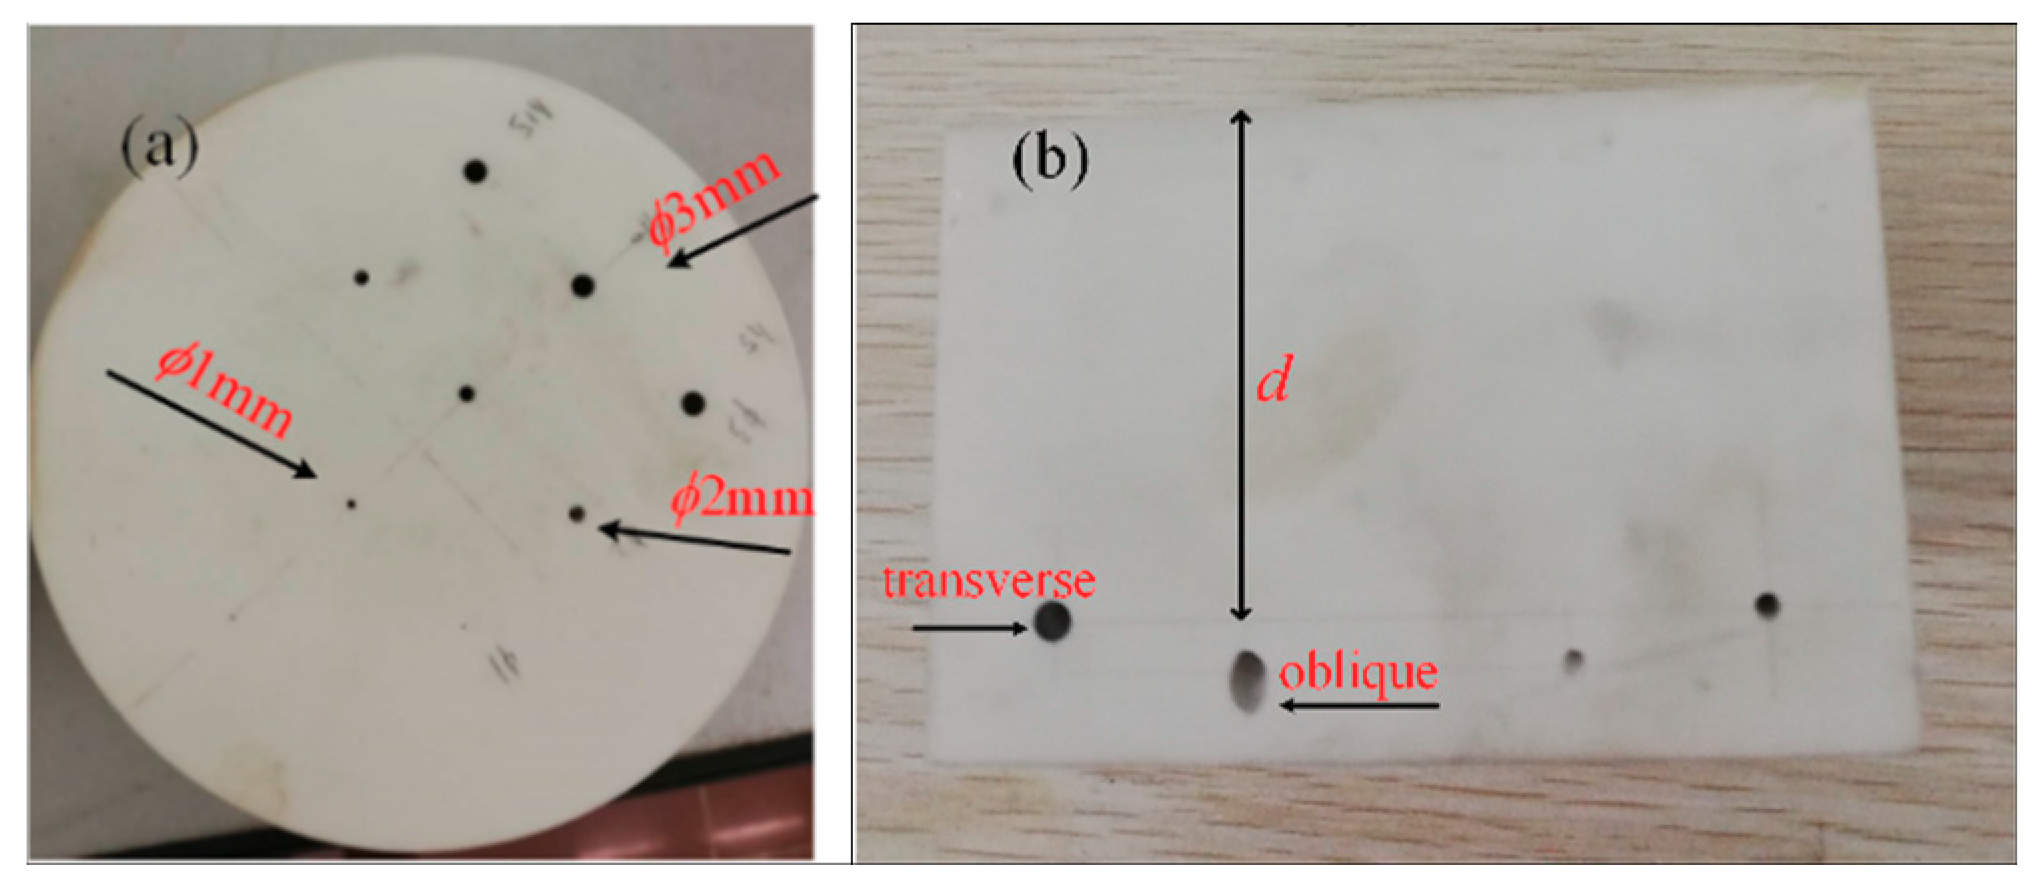
The epoxy composite specimens with voids had cylindrical shapes (diameter: φ = 100 mm) with thicknesses (d0) of 55 and 30 mm, recorded as A1 and A2, respectively. Artificial drill holes in the bottom of specimens mimicked voids. For ultrasonic propagation, the solid epoxy–void interface at the top of artificial voids in specimens was equivalent to that of voids in epoxy material. The diameter (φ) and depth (d) of artificial voids are shown in Table 1, and the distribution is shown in Figure 2a.
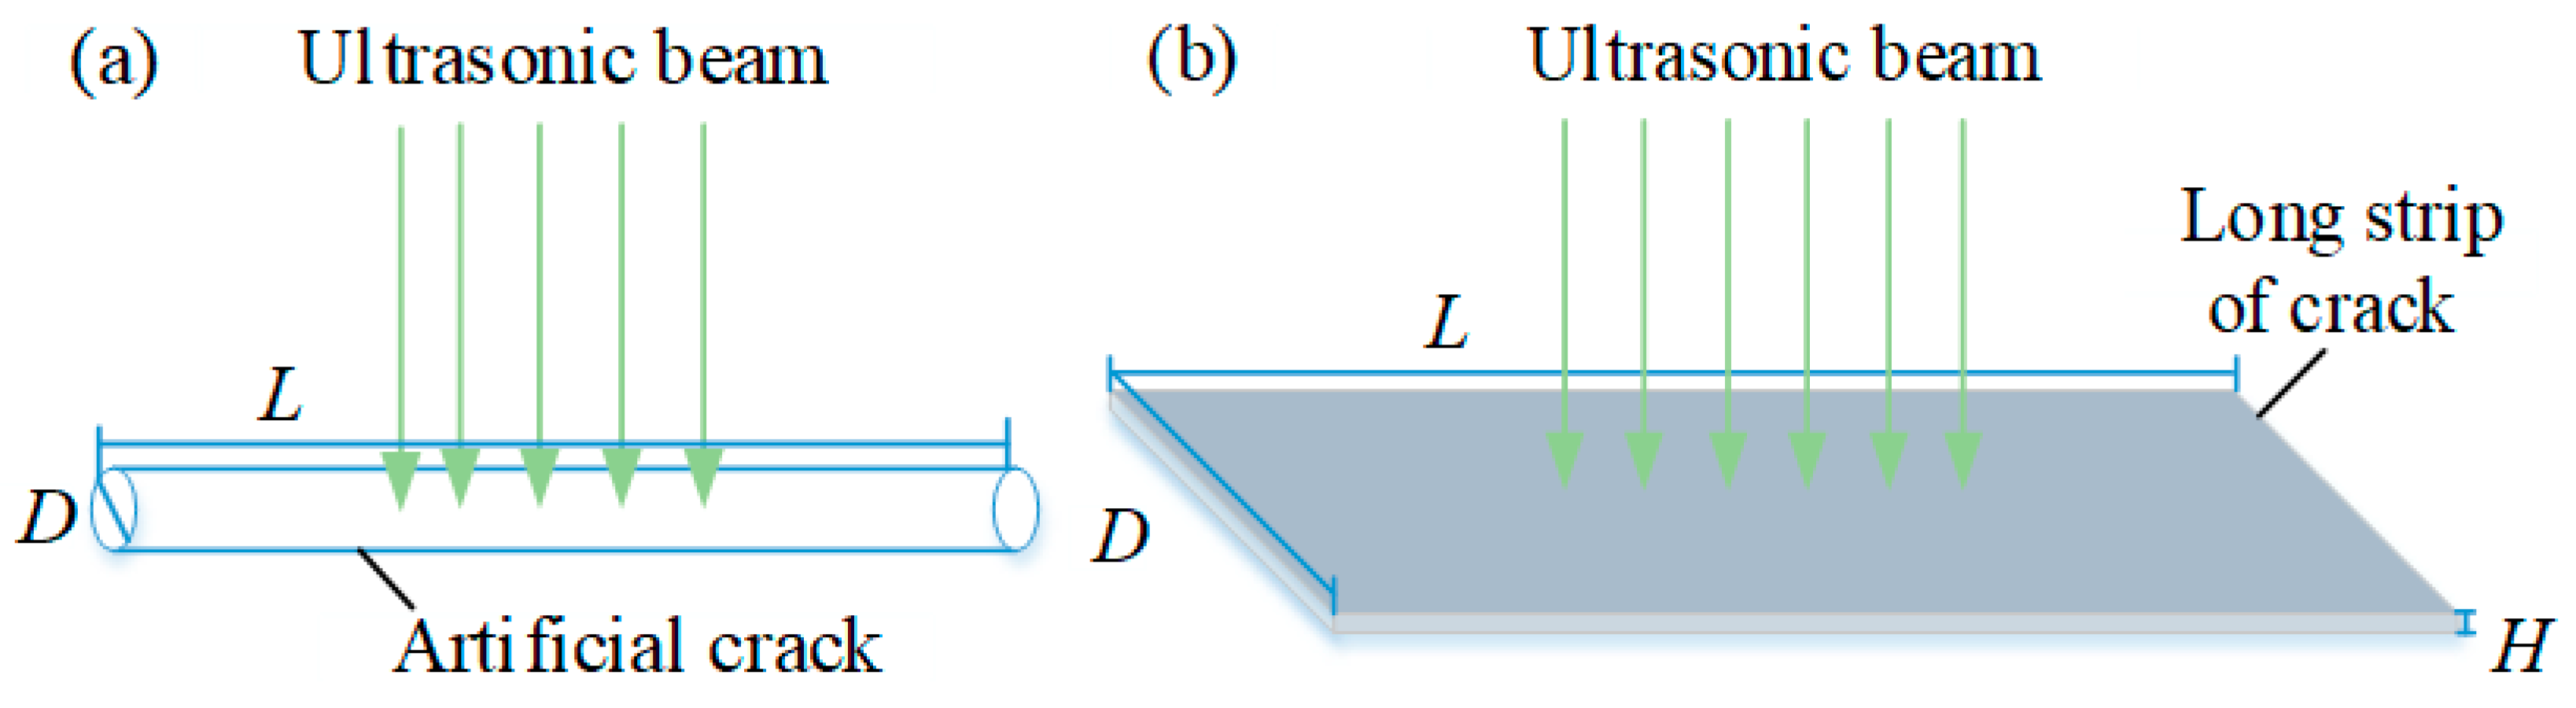
The epoxy composite specimens with cracks had cuboidal shapes, with sizes of 75 × 65 × 50 mm3 and 75 × 65 × 30 mm3, recorded as B1 and B2, respectively. Cracks were made by drilling holes on the side of the specimen located 40 (B1) and 15 mm (B2) away from the upper surface. The cracks were located in the material and could not be observed on the surface of the material. This was a latent defect before the development of external, obvious cracks on insulators. The cracks were characterized by length L (maximum size), height H, and width D. The length and width affected the ultrasonic test results in this paper. For ultrasonic propagation, the epoxy–air interface at the half surface of an artificial hole vertical to ultrasonic propagation was equivalent to that at the largest surface of a long strip of the crack in specimens, as shown in Figure 3. The mimicked cracks included transverse cracks, oblique cracks of a 45-degree angle, and vertical cracks, which all were 10 mm in length, 2 mm or 1 mm in width, as shown in Figure 2b. The depth of the center point of oblique cracks was consistent with that of the centerline of the transverse cracks and the top of the vertical cracks.
2.3. Detection Principle
Ultrasonic reflected waves carry material information such as material structure, homogeneity, internal defect, partial discharge, and deterioration [24].
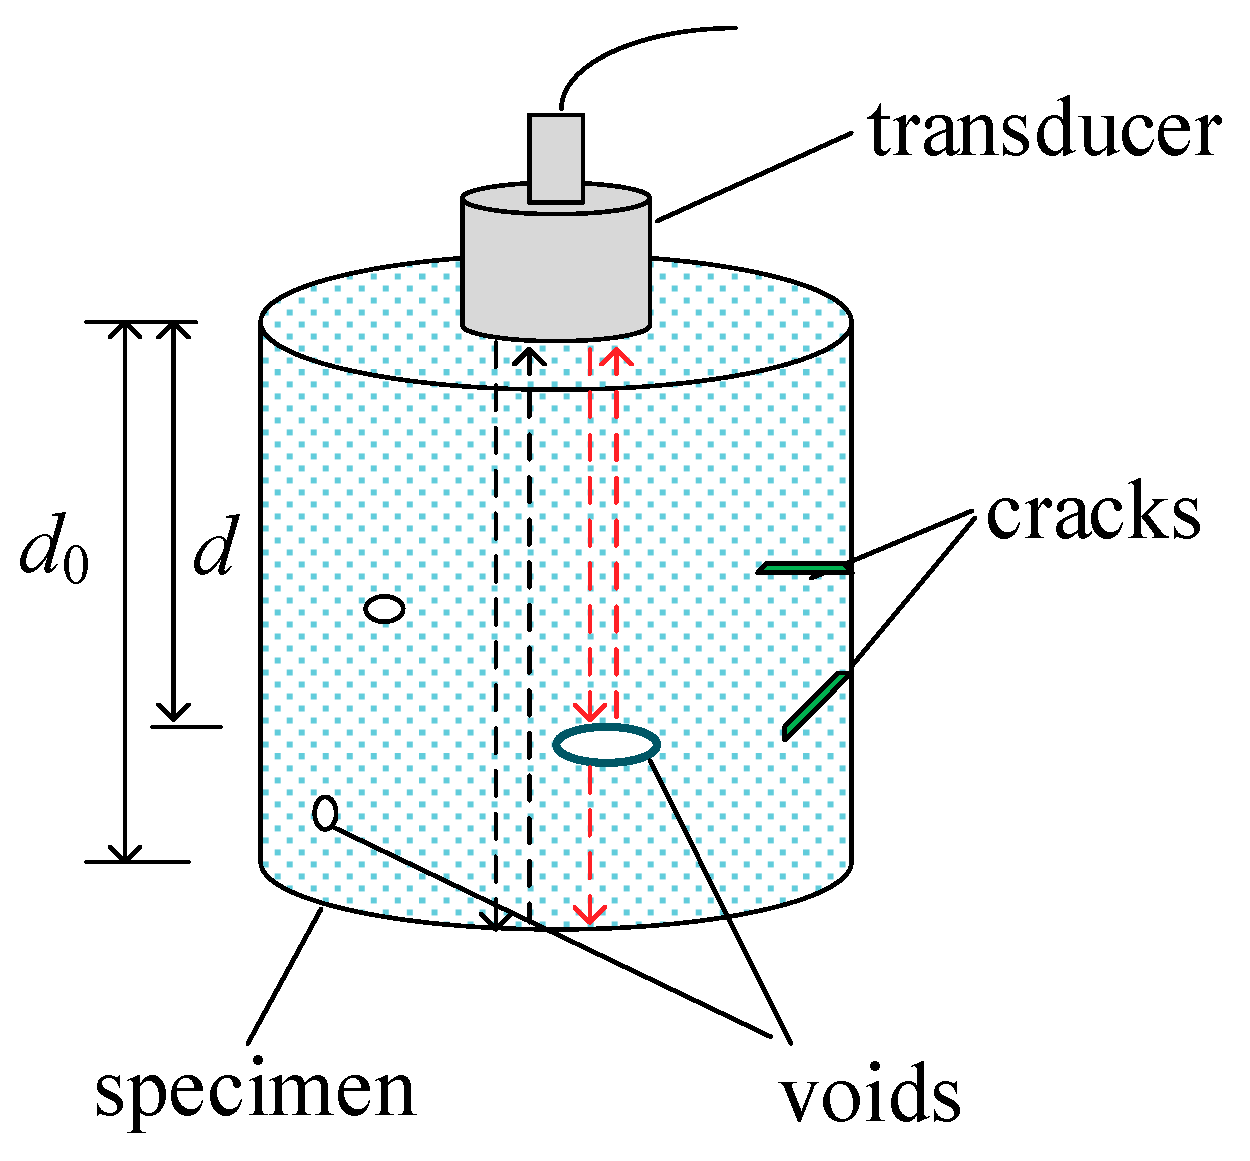
The ultrasonic pulse-echo method was used to detect the artificial defects of epoxy composite specimens in this paper. A straight beam transducer was placed vertically on the specimen surface. Then, the piezoelectric crystal plate was stimulated by the ultrasonic generator to produce ultrasonic waves. When ultrasonic waves reach a tested specimen, they reflect and transmit at the transducer–specimen interface. The reflected waves on the specimen surface (F) are able to return to the piezoelectric crystal plate along the original path, and the transmitted waves can continue to propagate along the straight line in specimens. If ultrasonic waves encounter small defects such as voids in the propagation process, they reflect at the specimen–void interface. However, the ultrasonic waves that do not encounter the specimen–void interface propagate to the specimen’s bottom and reflect at the specimen–air interface. In this condition, both the defect reflected waves (D) and the bottom reflected waves (B) are received, as shown in Figure 4. If the transducers diameter is small, the ultrasonic beam is small, and the defect is large, then the defect reflected wave can be received.
The sound velocity in the specimen is calculated according to the following equation [33,39]:
where d0 is the specimen thickness, t0 is the peak time of the surface reflected waves, and t1 is the peak time of the bottom reflected waves.
The depth d of defects is calculated using the following equation.
where t2 is the peak time of the defect reflected waves. Thus, Equation (4) may be substituted for Equation (3).
This paper defines d% as the measurement deviation of the depth of defects:
The ultrasonic pulse-echo method was used to conduct the experiments of detecting voids and cracks.
3. Results and Discussion
3.1. Void Detection
In this paper, detecting φ3 mm voids was carried out to investigate the effectiveness of detection, and detecting φ2 mm and φ1mm voids was carried out to investigate the sensitivity of detection.
3.1.1. Voids of φ3 mm
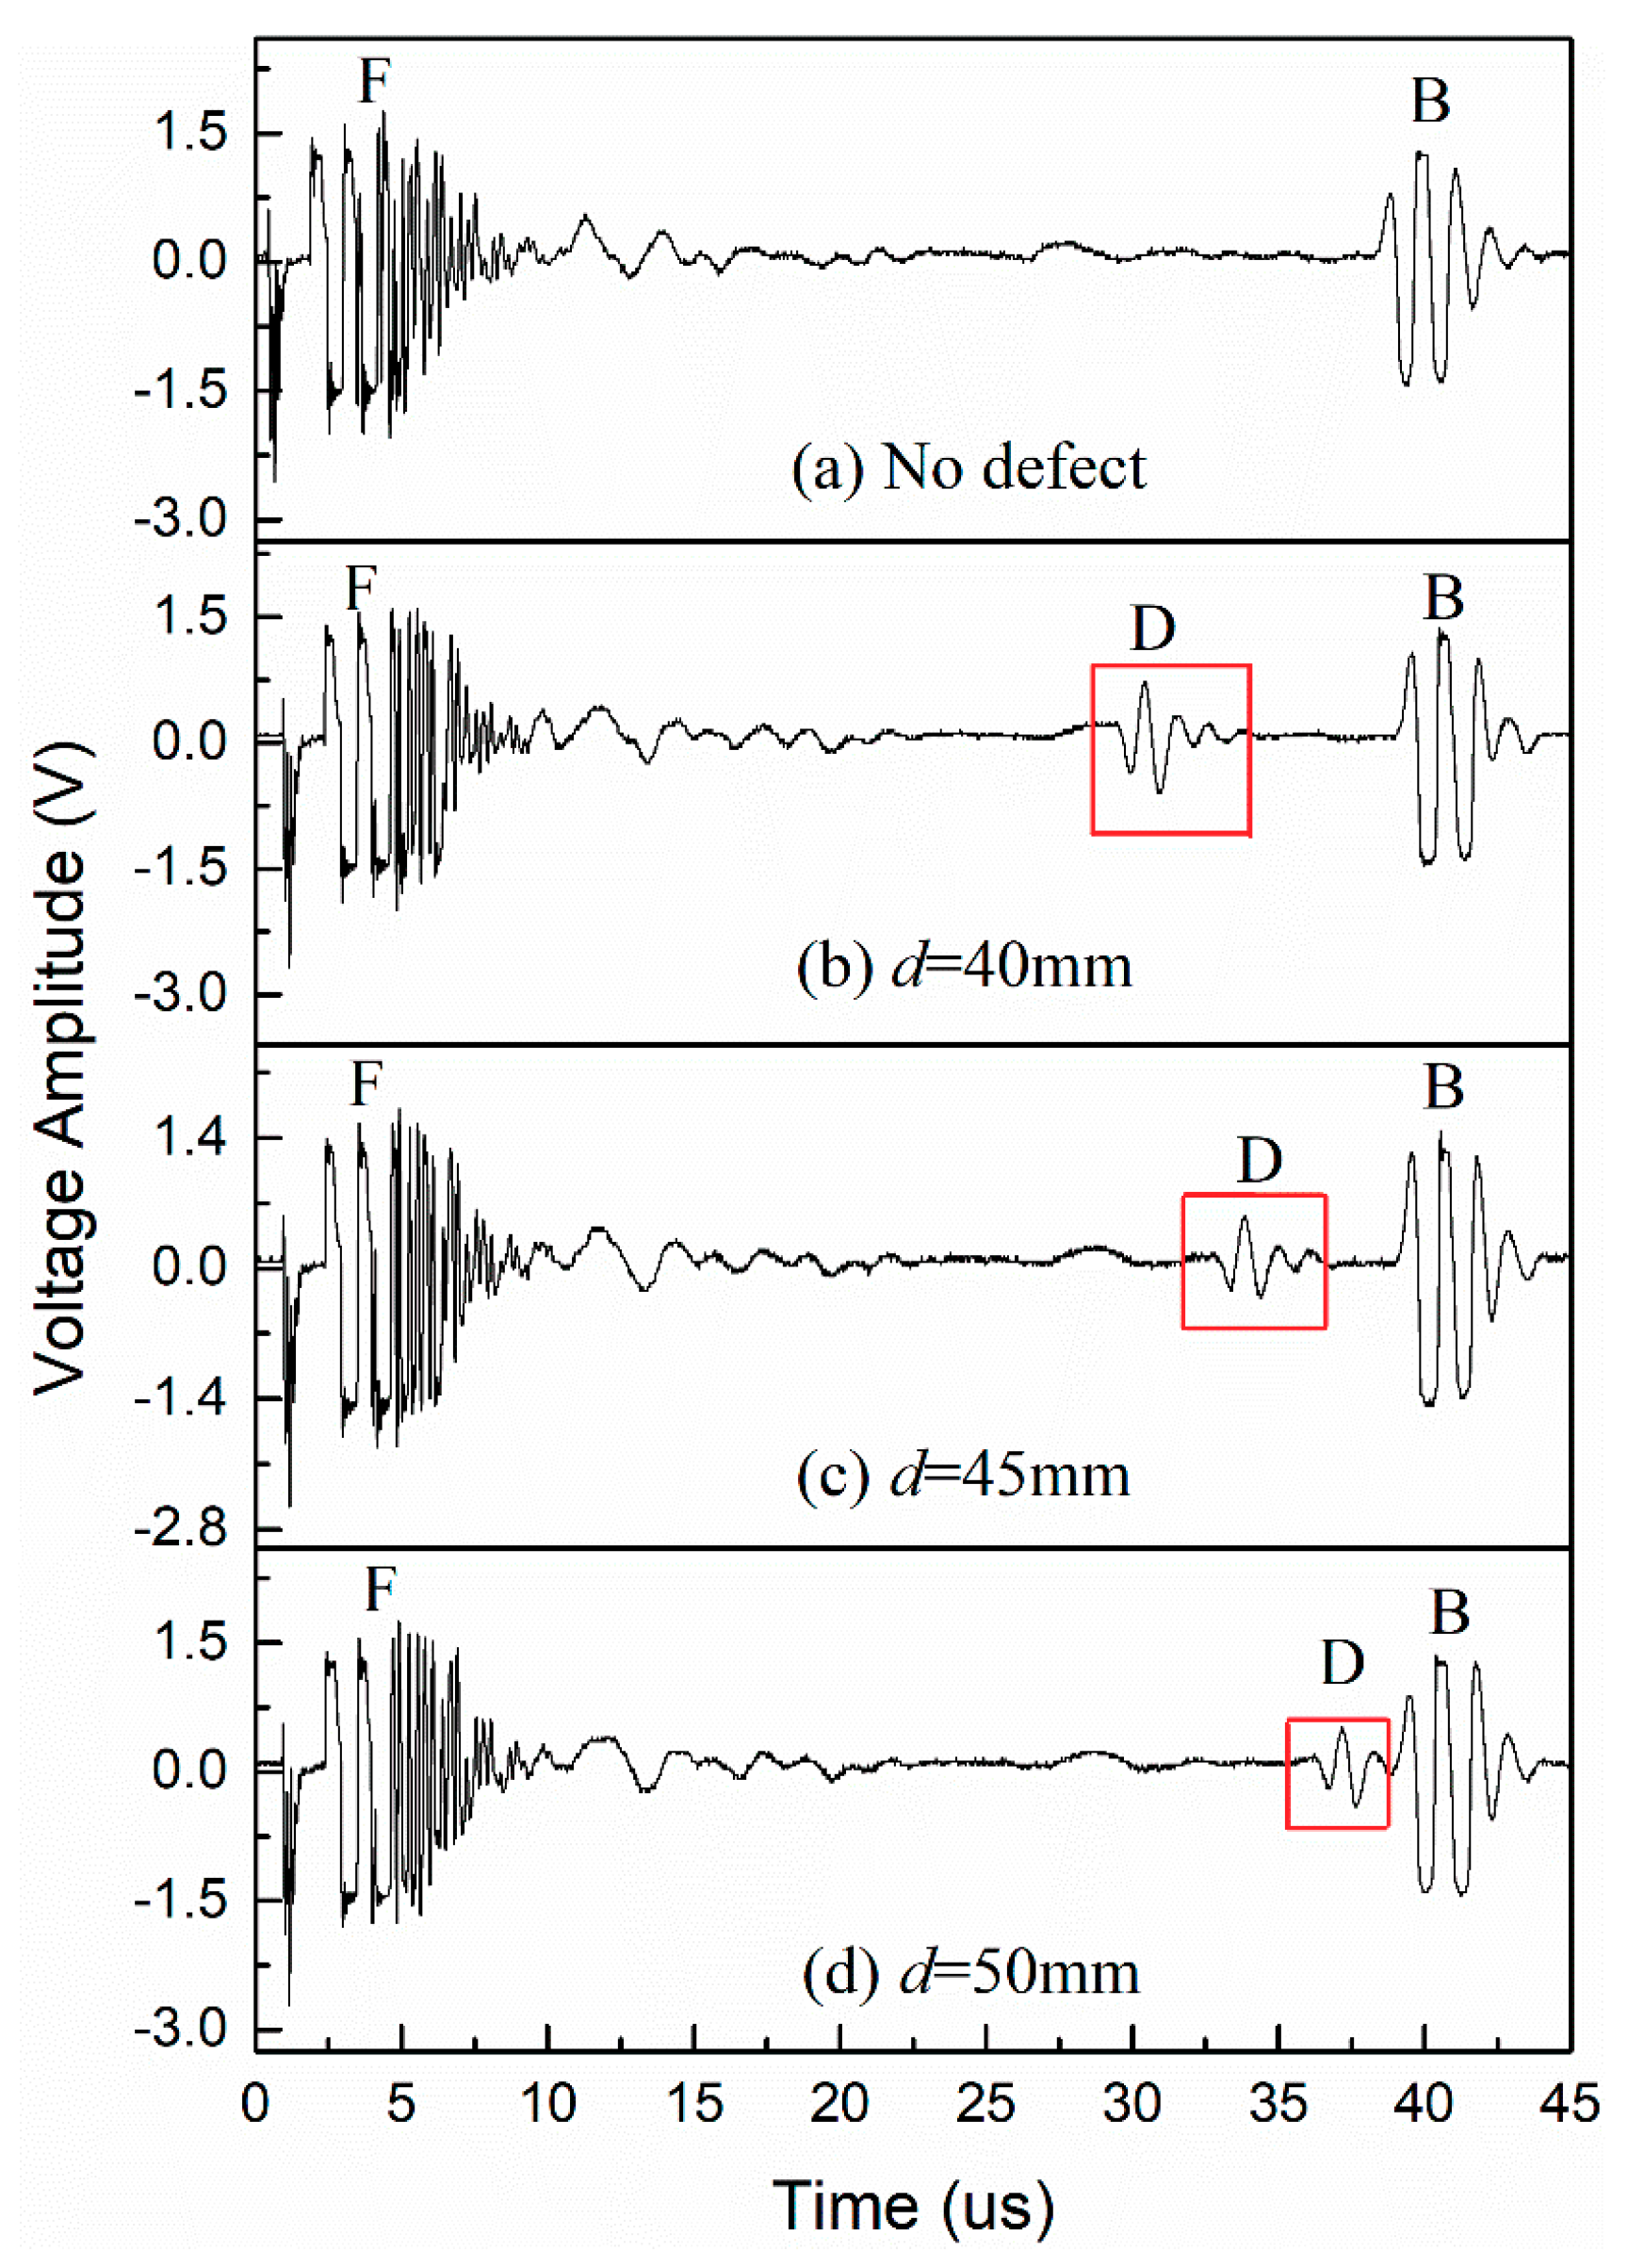
The 1P20 transducer was used to detect φ3 mm voids in the A1 specimen. The reflected ultrasonic waveforms at voids with different depths d are shown in Figure 5.
Figure 5 shows that the 1P20 transducer could detect φ3 mm voids with a depth d of 50 mm. According to Equations (4) and (5), the depth of defects and measurement deviation could be calculated, as shown in Table 2. This shows that the deviation d% was less than 0.75%. With the increase in defect depth, the amplitude Ad of defect reflected wave (D) gradually decreased. This was because the farther the ultrasonic propagation distance was, the higher the attenuation was and the less the reflected acoustic energy was.
3.1.2. Sensitivity of Detection
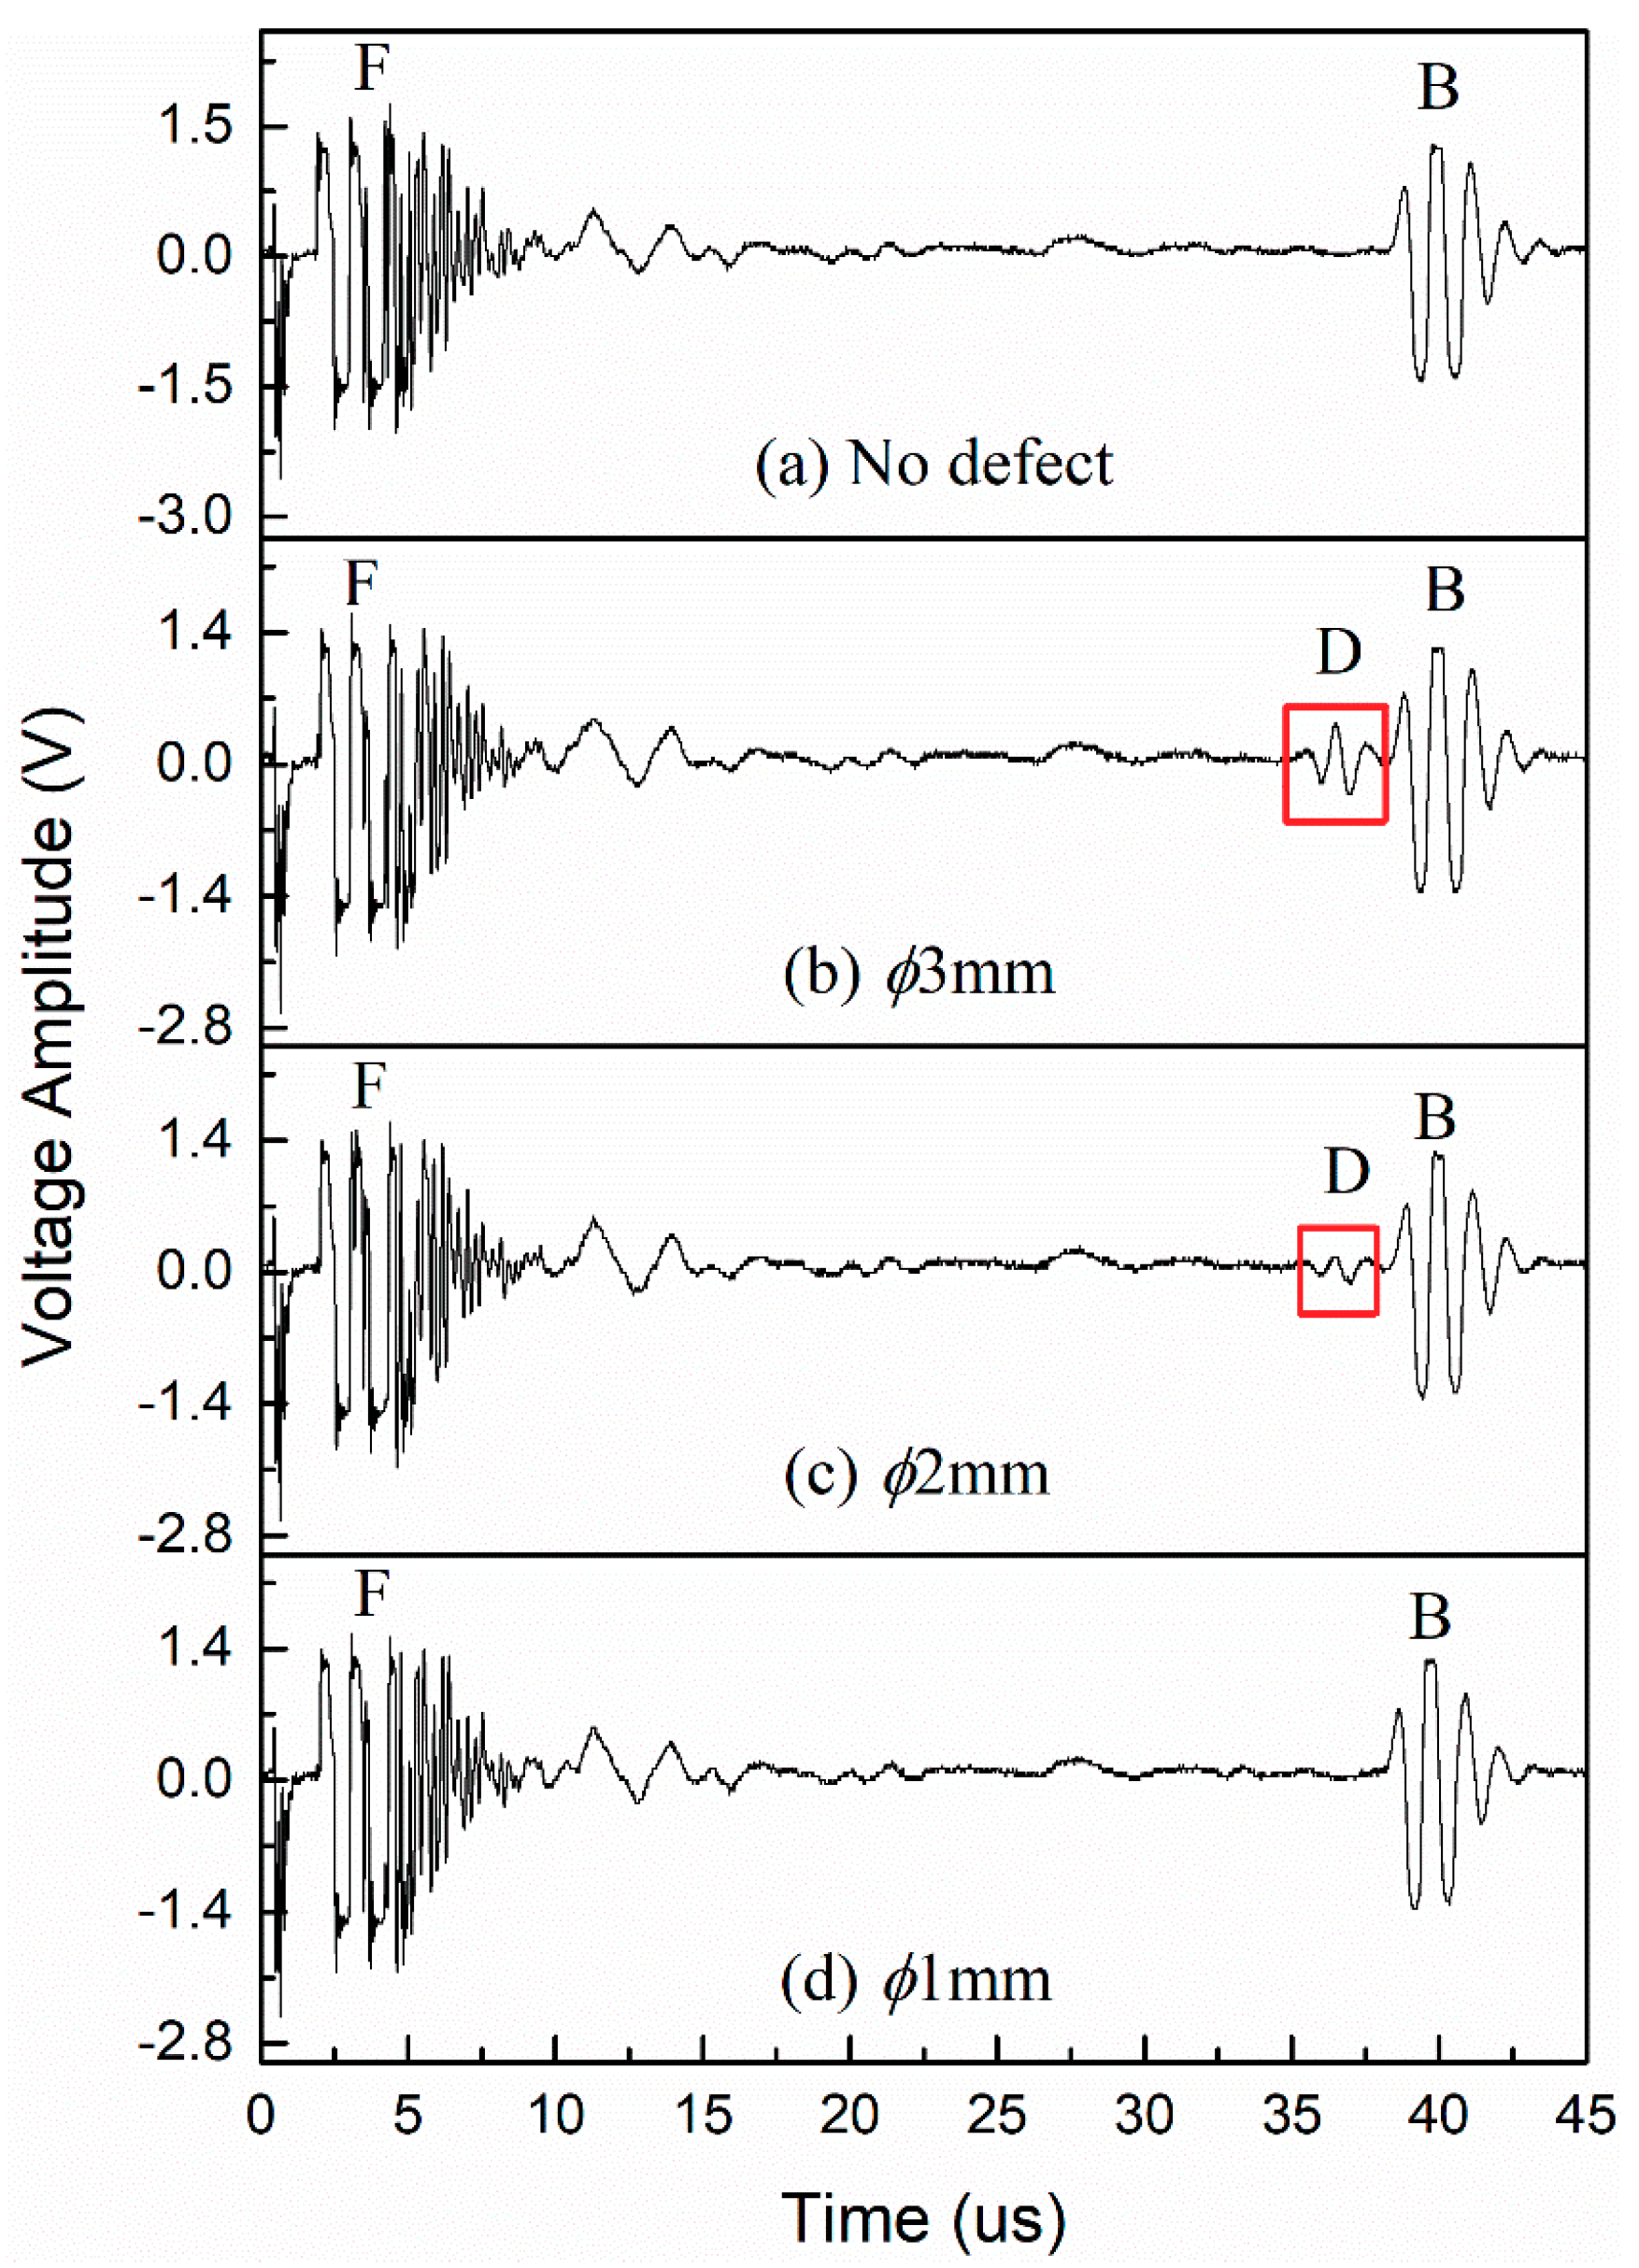
The 1P20 transducer was used to detect voids (d = 50 mm) with diameters of 3, 2, and 1 mm, respectively, in the A1 specimen. The reflected waveforms are shown in Figure 6.
Figure 6 illustrates that the propagation time of the defect reflected waves in the same depth was the same. The 1P20 transducer could detect φ2 mm voids, and the amplitude Ad of φ3 mm voids was relatively great, but the φ1 mm voids were difficult to be detected. This was because the larger the diameter of a void was, the larger the encountered reflecting interface was in the ultrasonic propagation. Then, the energy of the reflected wave and the amplitude were greater. Table 3 shows that the deviation d% was less than 0.32%.
3.1.3. Depth of Detection
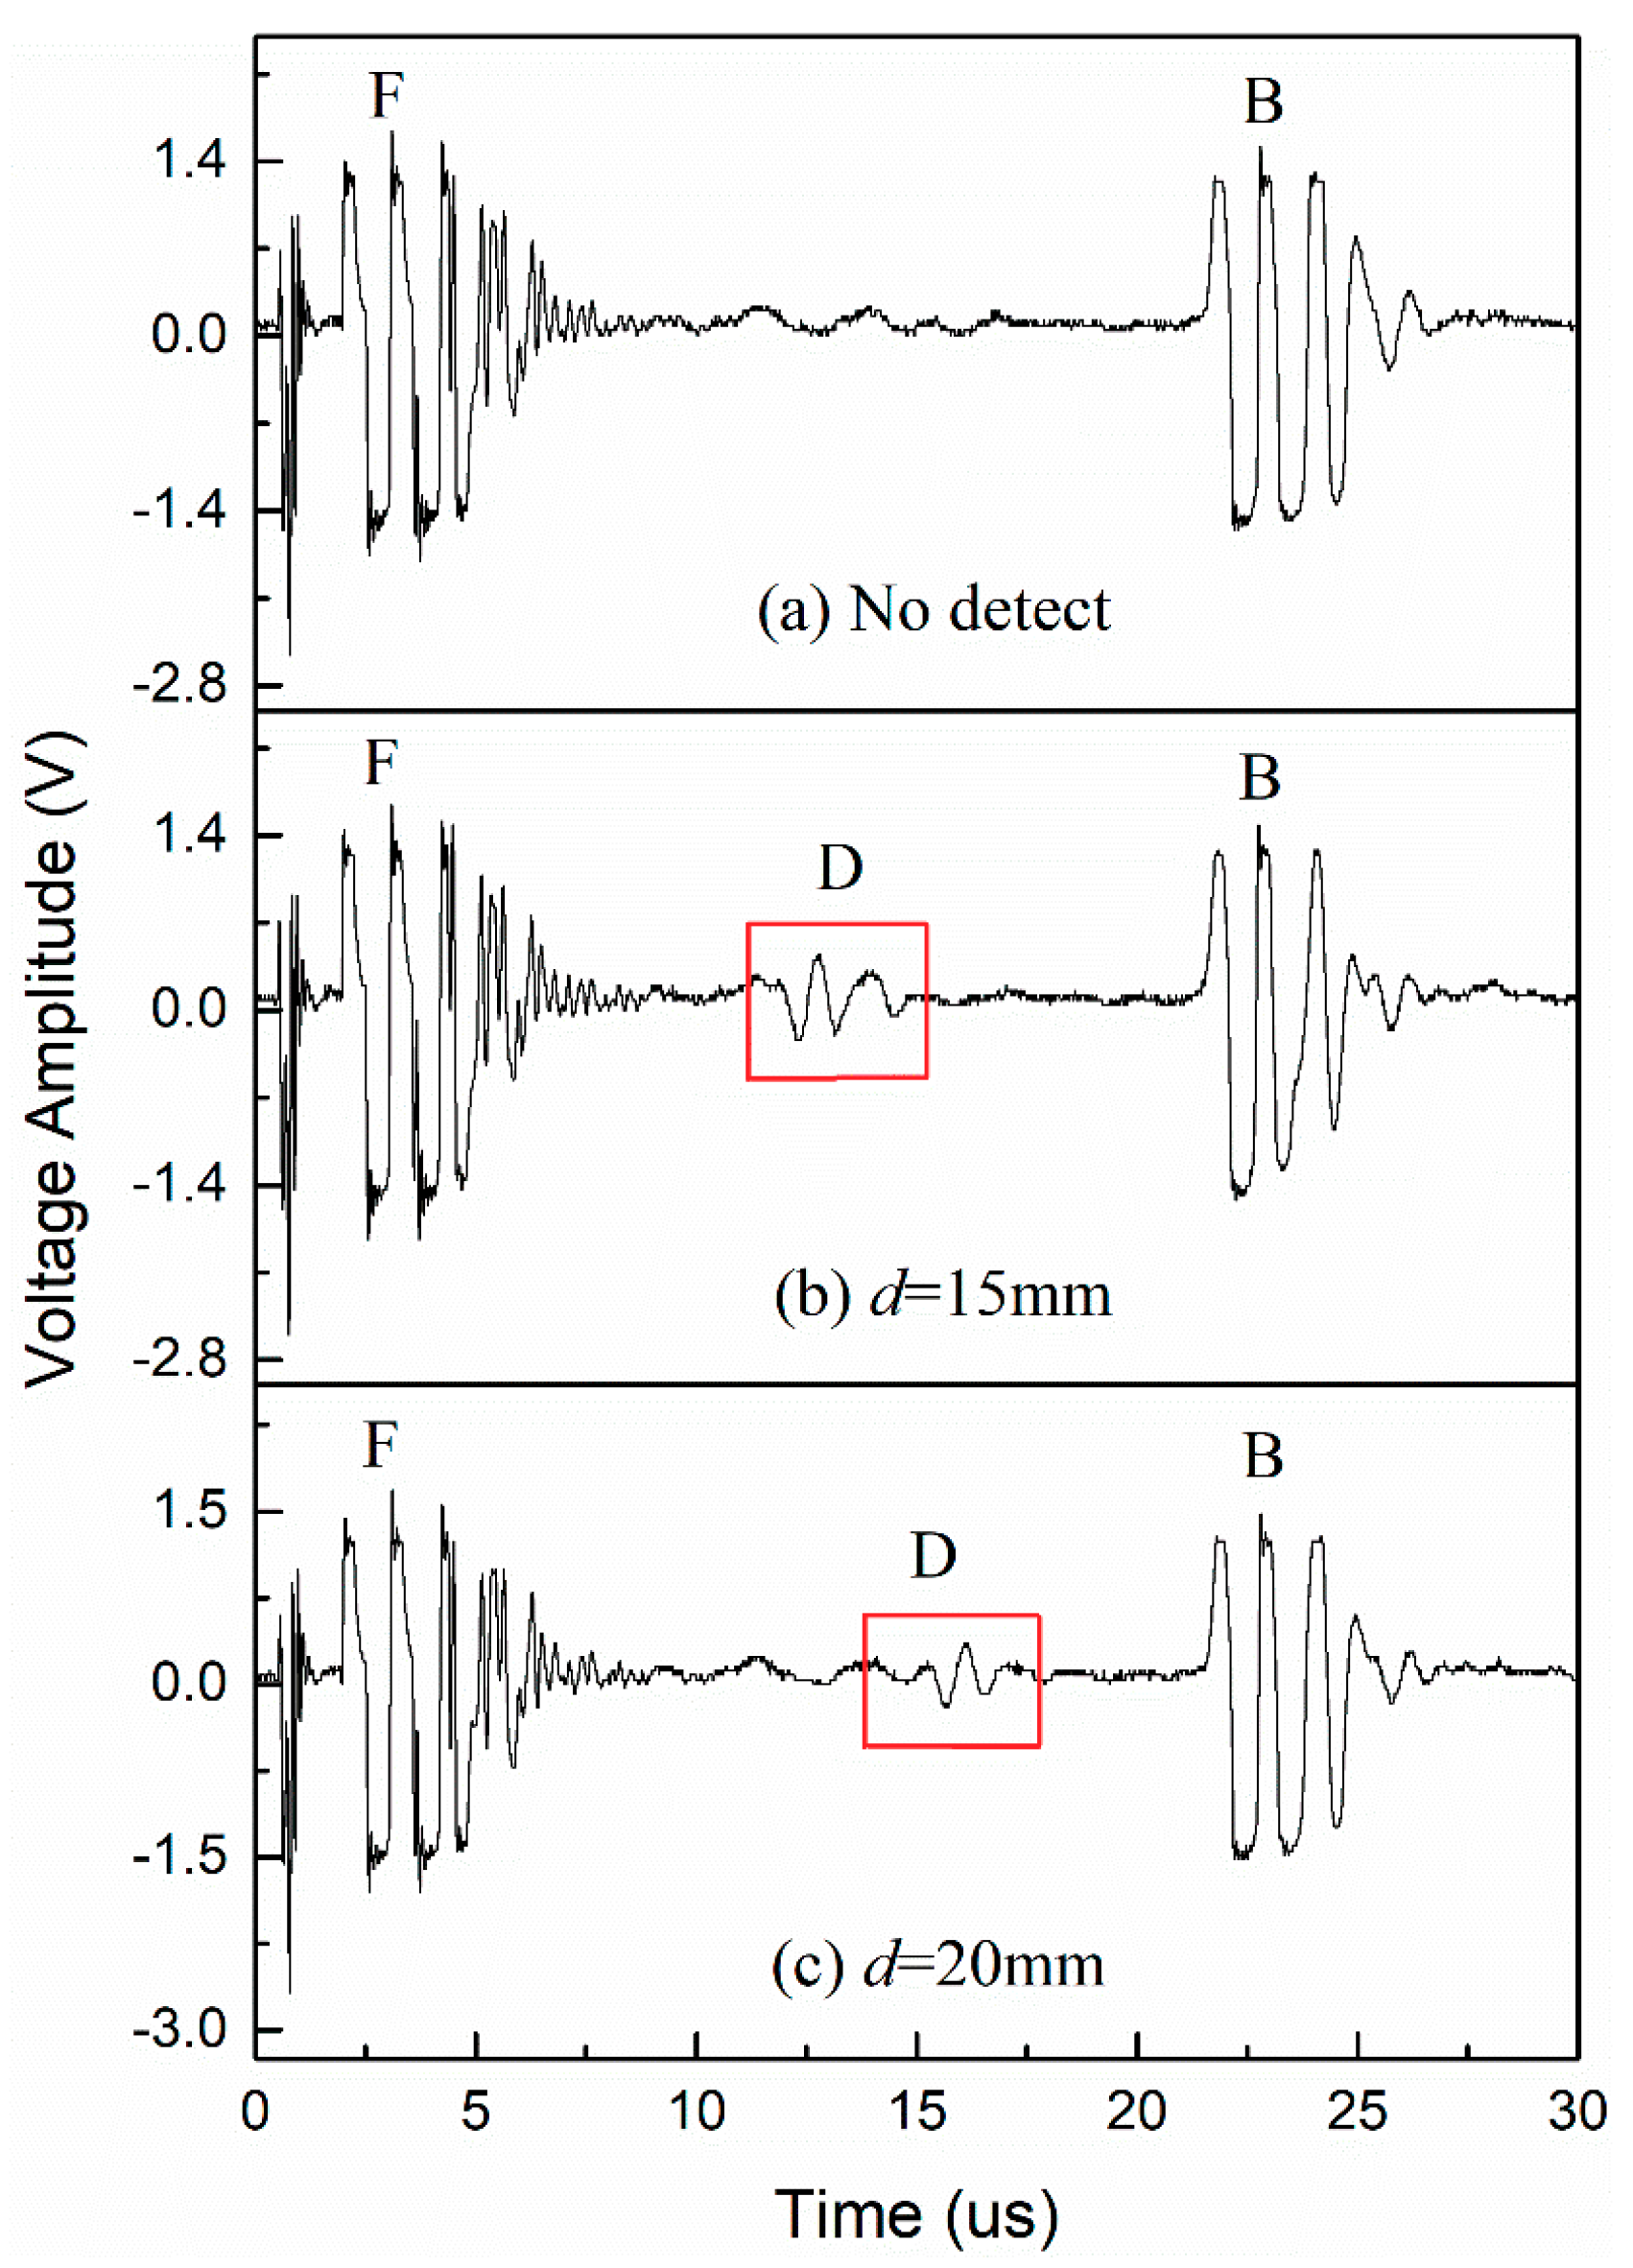
The 1P20 transducer was used to detect φ2 mm voids in the A2specimen. The reflected waveforms are shown in Figure 7.
Figure 7 illustrates that the 1P20 transducer could detect φ2 mm voids with a depth d of 15 mm in the near field (N = 33 mm). The deviation d% was less than 1.40%, as shown in Table 4. This shows that defects in the near field of the 1P20 transducer could still be detected with high accuracy.
Figure 8 illustrates that the defect reflected waves could not be observed. This was because the epoxy composite specimen was thick and the sound attenuation at the frequency was large, so the φ1 mm voids could not be successfully detected. It was necessary to investigate the special ultrasonic composite transducer or increase the frequency.
3.2. Crack Detection
In this paper, an orientation test of a φ2 mm crack was carried out to investigate the effect of crack orientations on ultrasonic detection, and a φ1 mm crack was detected to investigate the sensitivity and depth of detection.
3.2.1. Crack Orientations
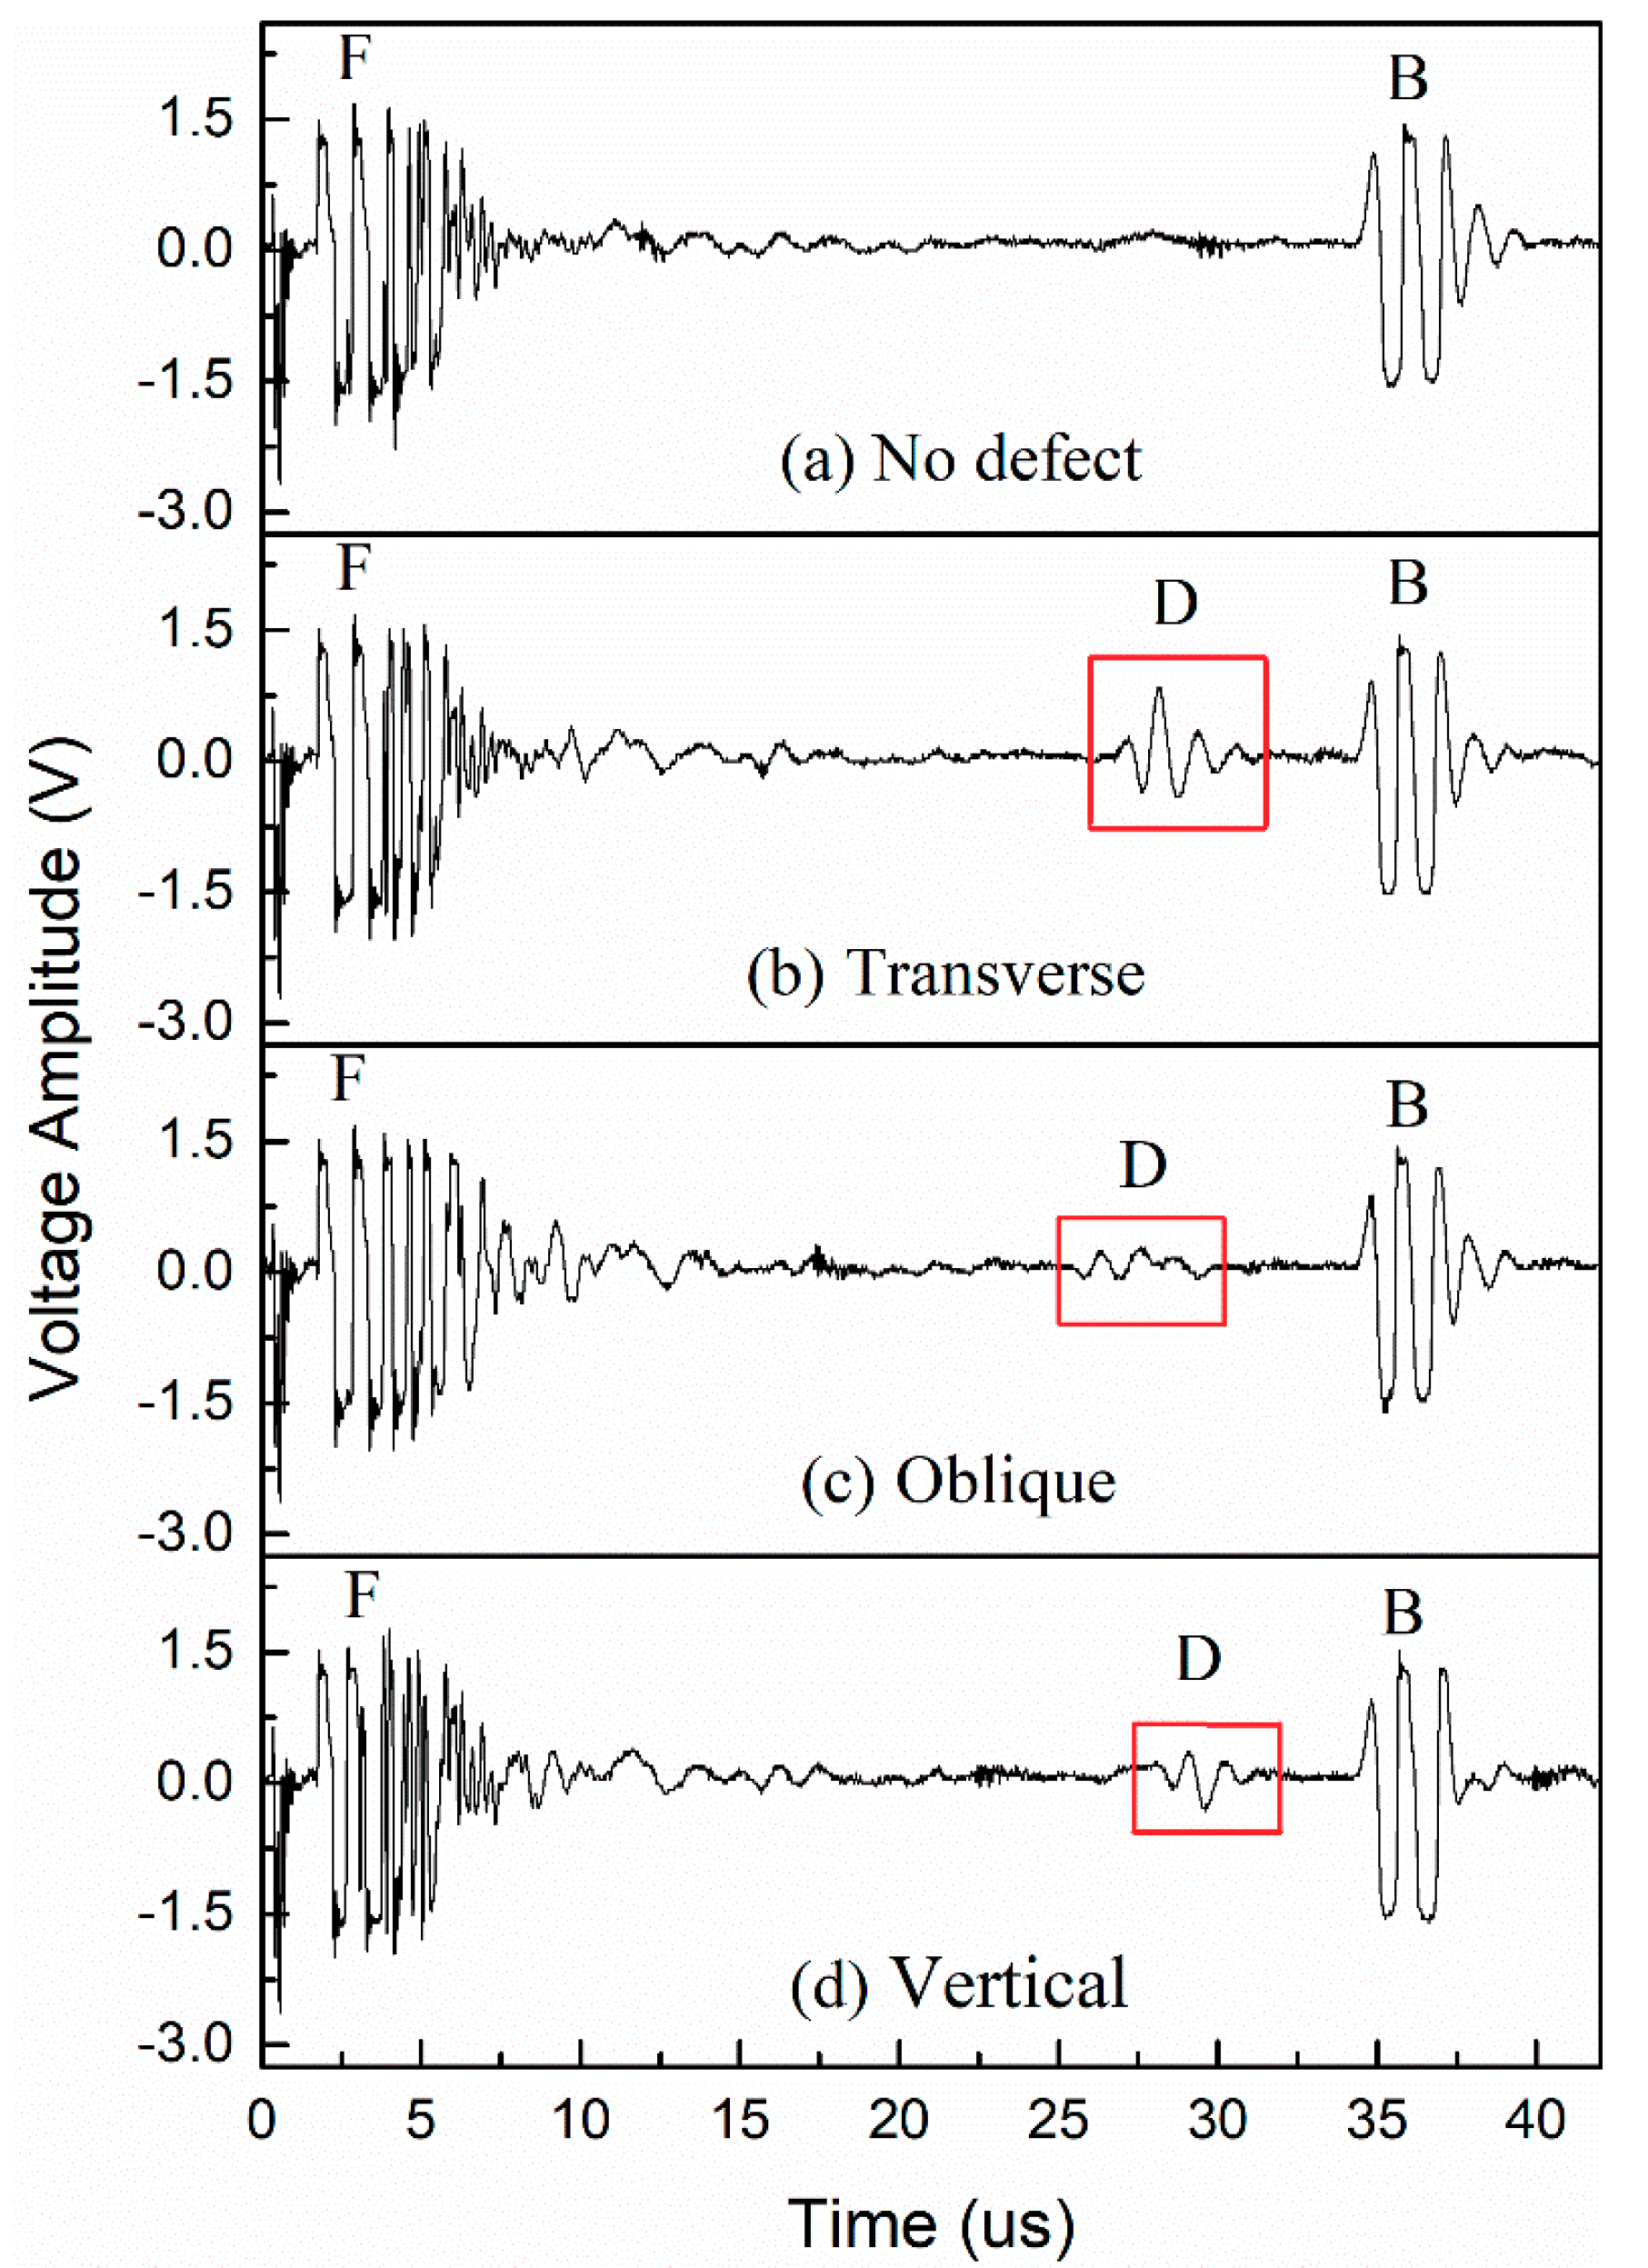
The 1P20 transducer was used to detect transverse cracks, oblique cracks of 45 degrees, and vertical cracks with a depth of 40 mm in the B1specimen. The reflected waveforms at the φ2 mm cracks are shown in Figure 9. The depth d of cracks and the amplitude Ad of the defect reflected waves are shown in Table 5.
As can be seen from Figure 9, for cracks of the same width, the transverse crack had the greatest amplitude of the defect reflected wave, followed by the vertical crack, and, finally, the oblique crack. This is because the transverse crack had the largest reflecting interface, followed by the vertical (equivalent to voids) when ultrasound propagated in the specimen. However, the interface of oblique cracks was 45 degrees from the direction of ultrasonic propagation, and most of the reflected waves could not return along the original path. Thus, the transducer could only receive a small number of reflected waves near the edge of the transducer. Additionally, the reflected waves of oblique cracks appeared earlier than that of the transverse and vertical cracks. This was because that the oblique part above the center of oblique cracks was closer to the upper surface, and the ultrasonic wave reflected the transducer earlier.
For the location of cracks, the calculated result of Table 5 took the width of artificial cracks itself into account. For transverse and vertical cracks, the deviation d% was less than 1.13%. However, the oblique crack was affected by the inclined part, and the calculated depth was determined from the first arrival point of ultrasonic waves.
3.2.2. Sensitivity of Detection
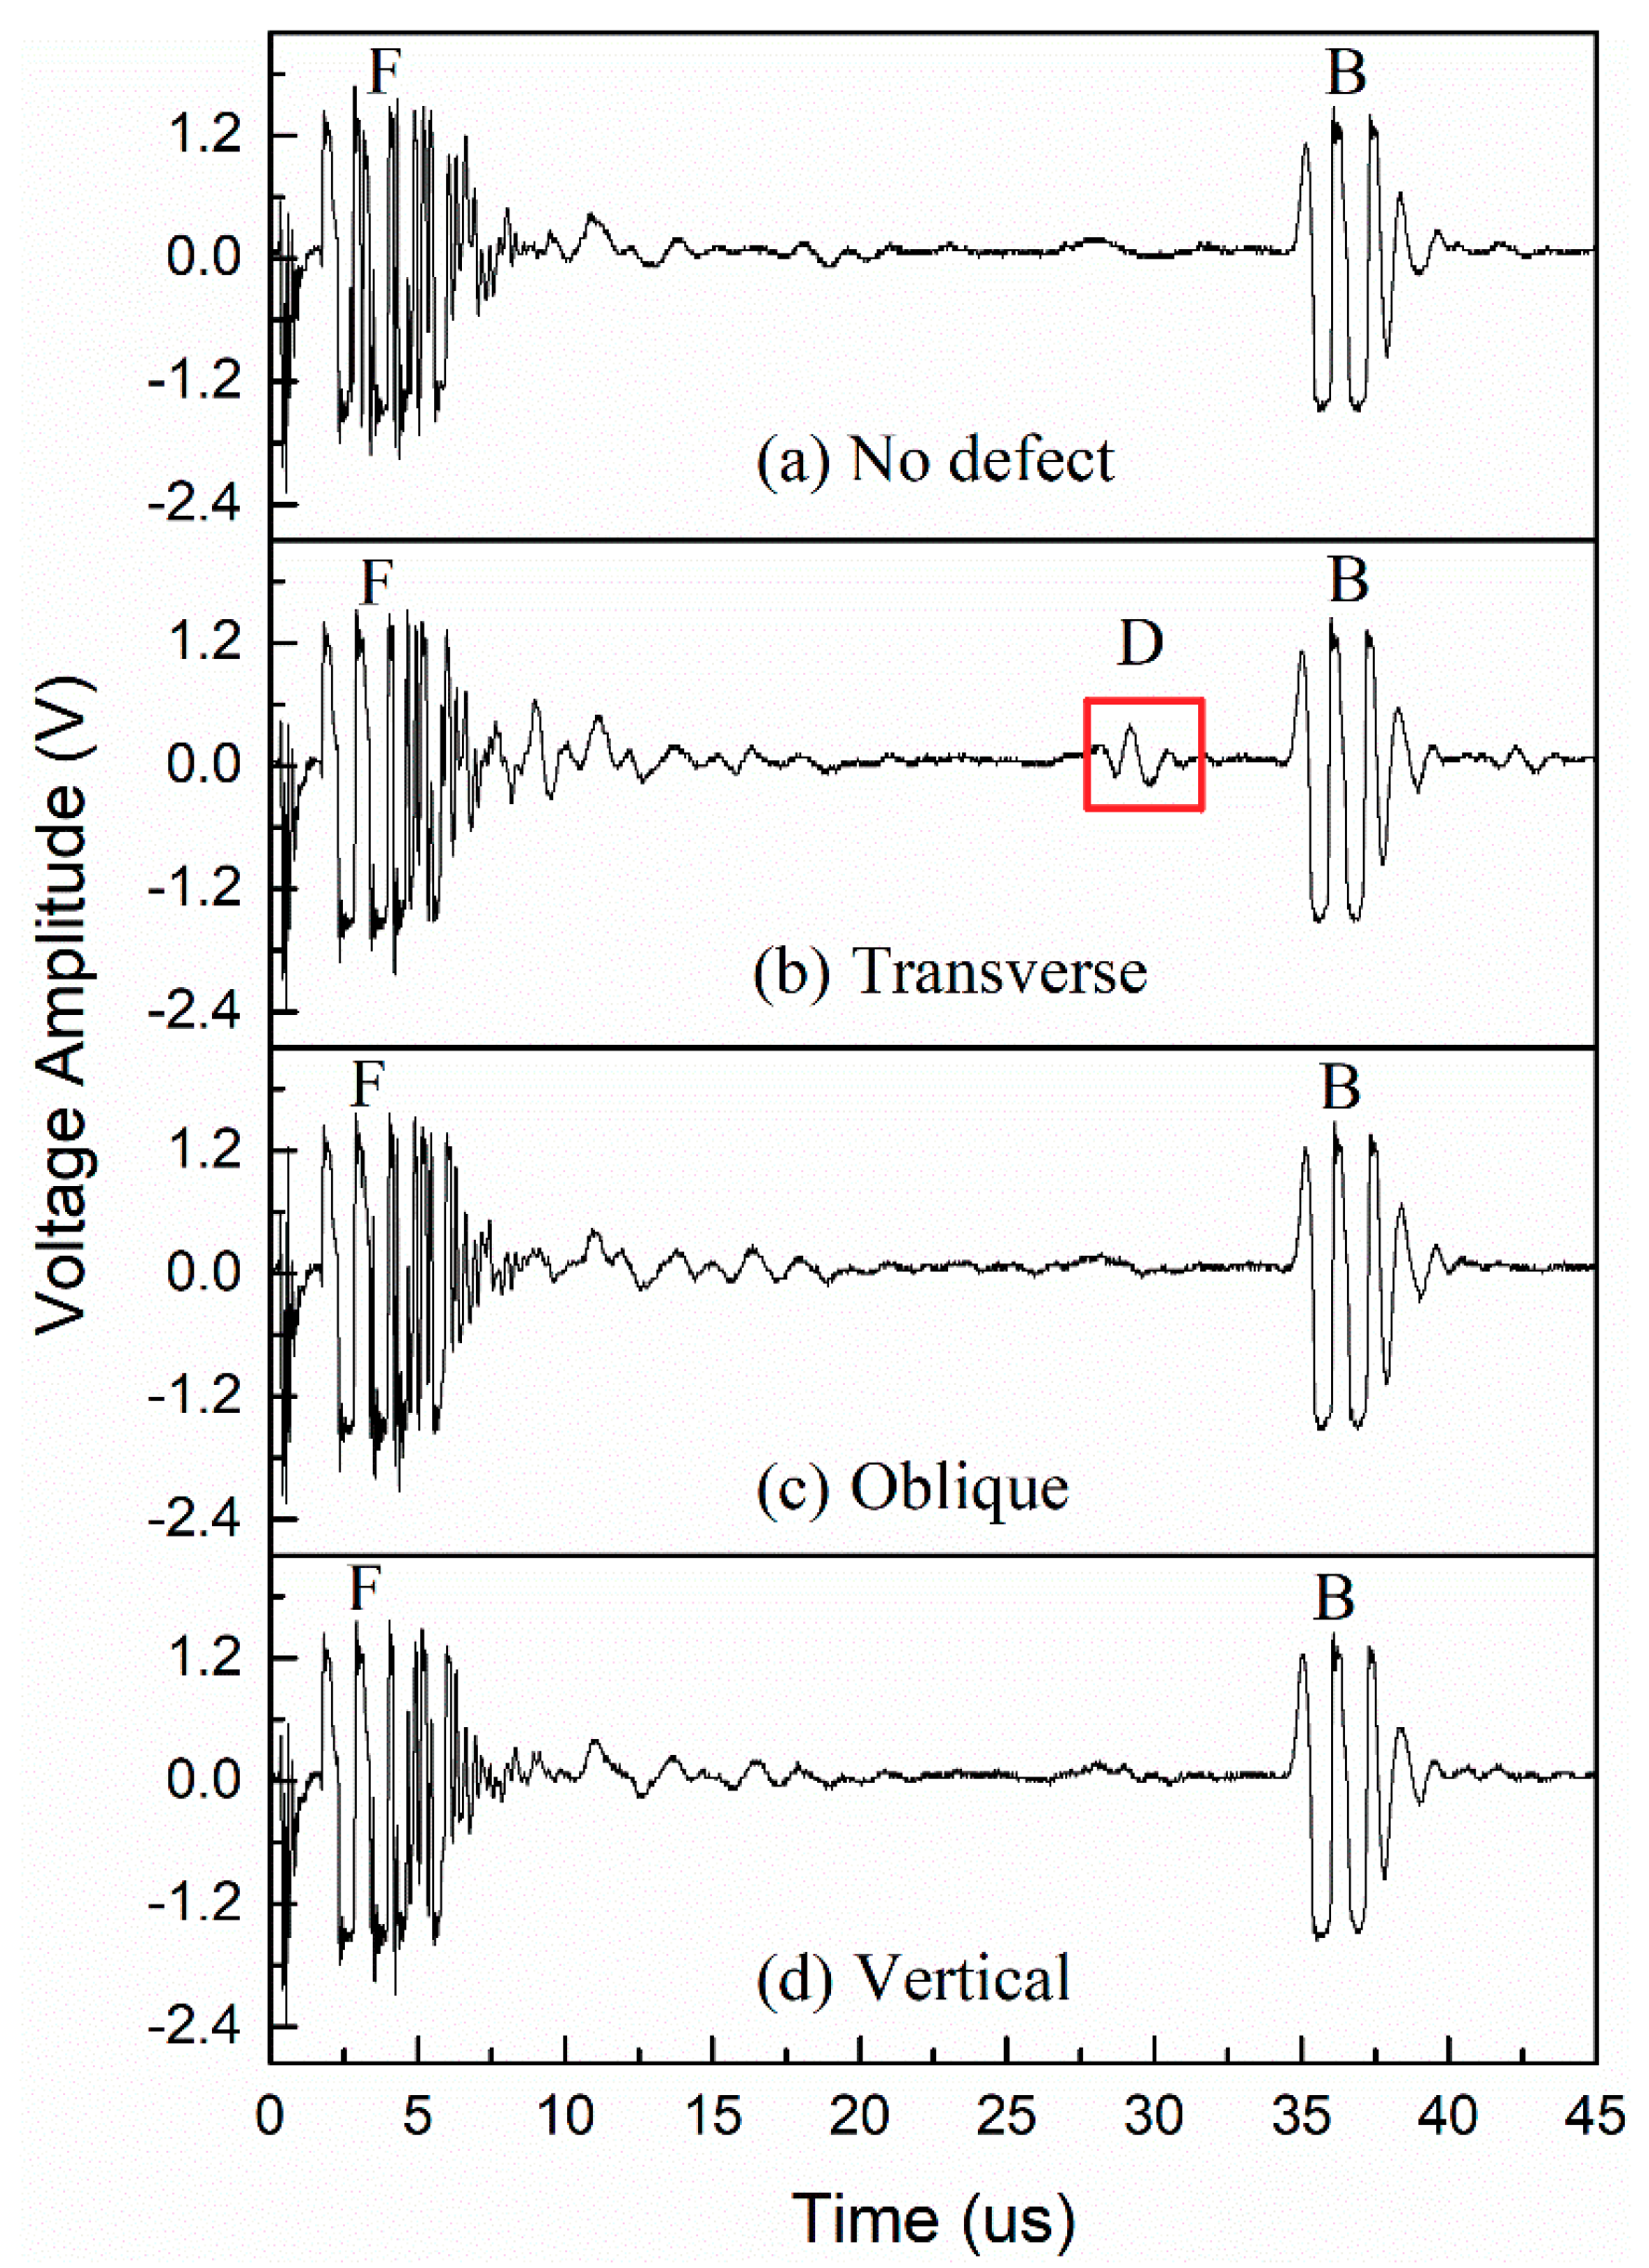
The 1P20 transducer was used to detect φ1 mm cracks with a depth d of 40 mm in the B1 specimen. The reflected waveforms are shown in Figure 10.
Figure 10 shows that the defect reflected waves of transverse cracks could only be observed. The depth of transverse crack calculated by the Equation (4) was 39.63 mm with a deviation of 0.93%. Because the widths of cracks were small and the specimen was thick, the reflected waves of the oblique cracks and vertical cracks could not be observed.
3.2.3. Depth of Detection
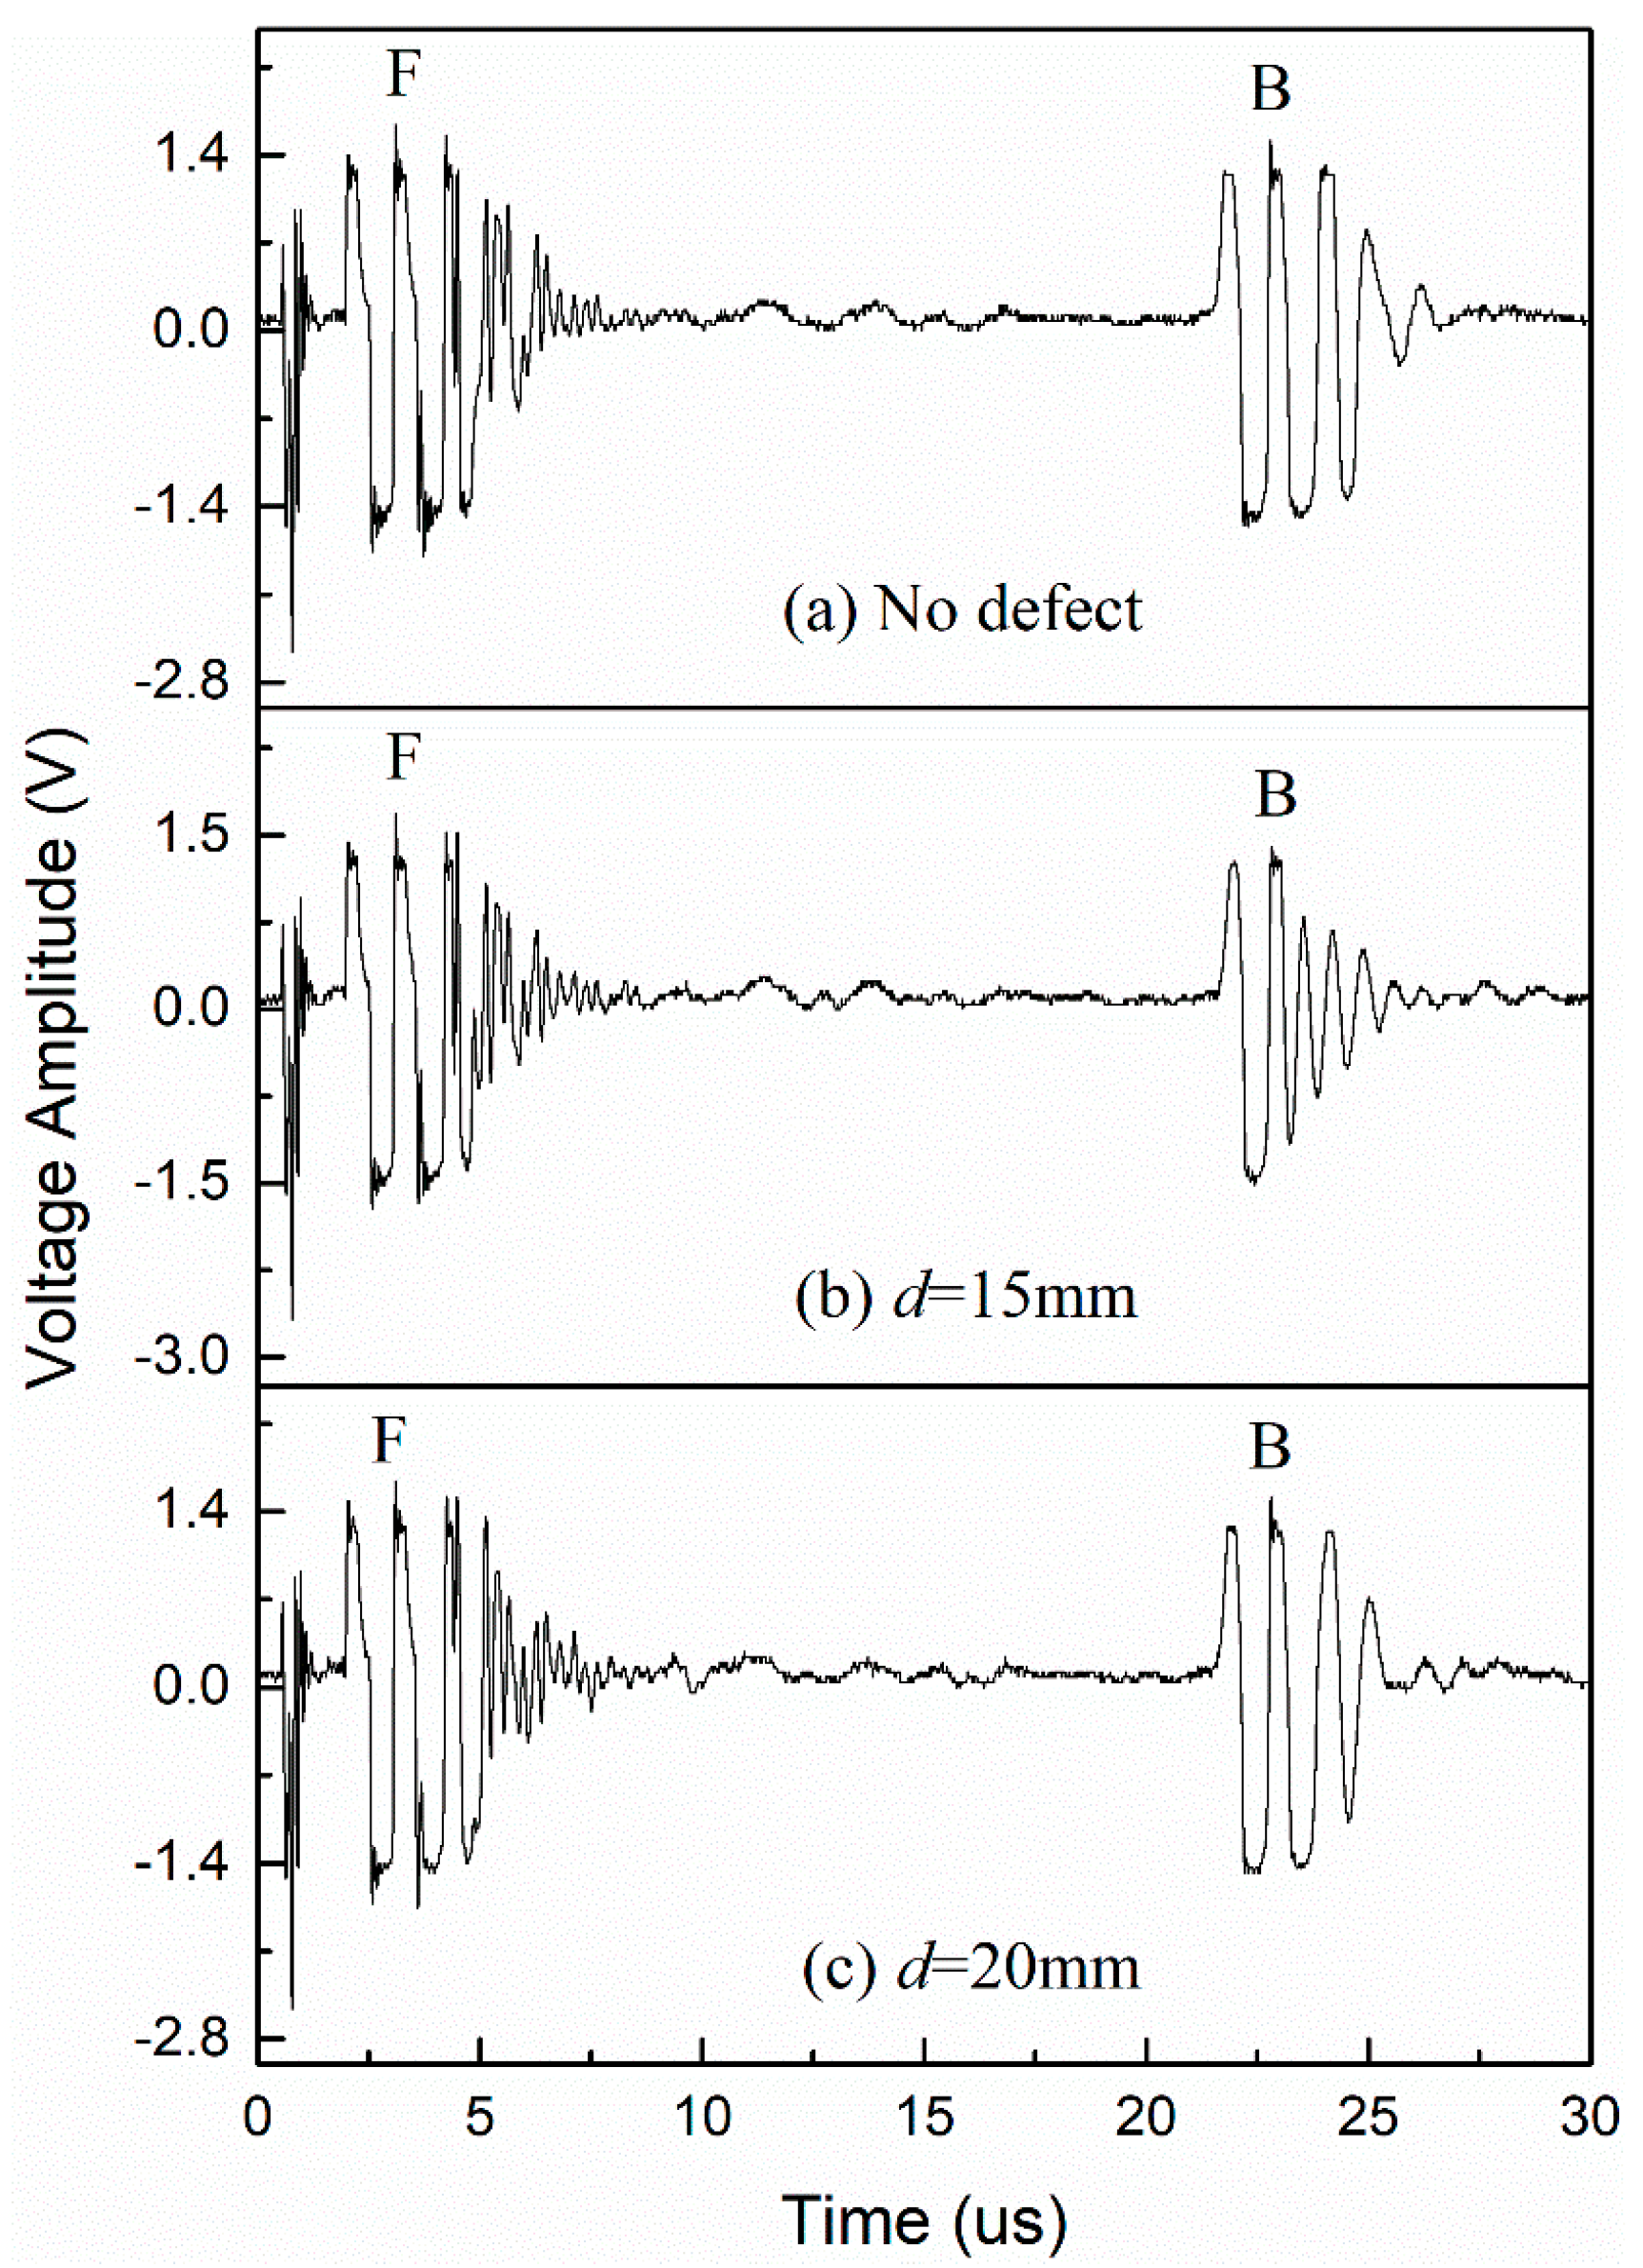
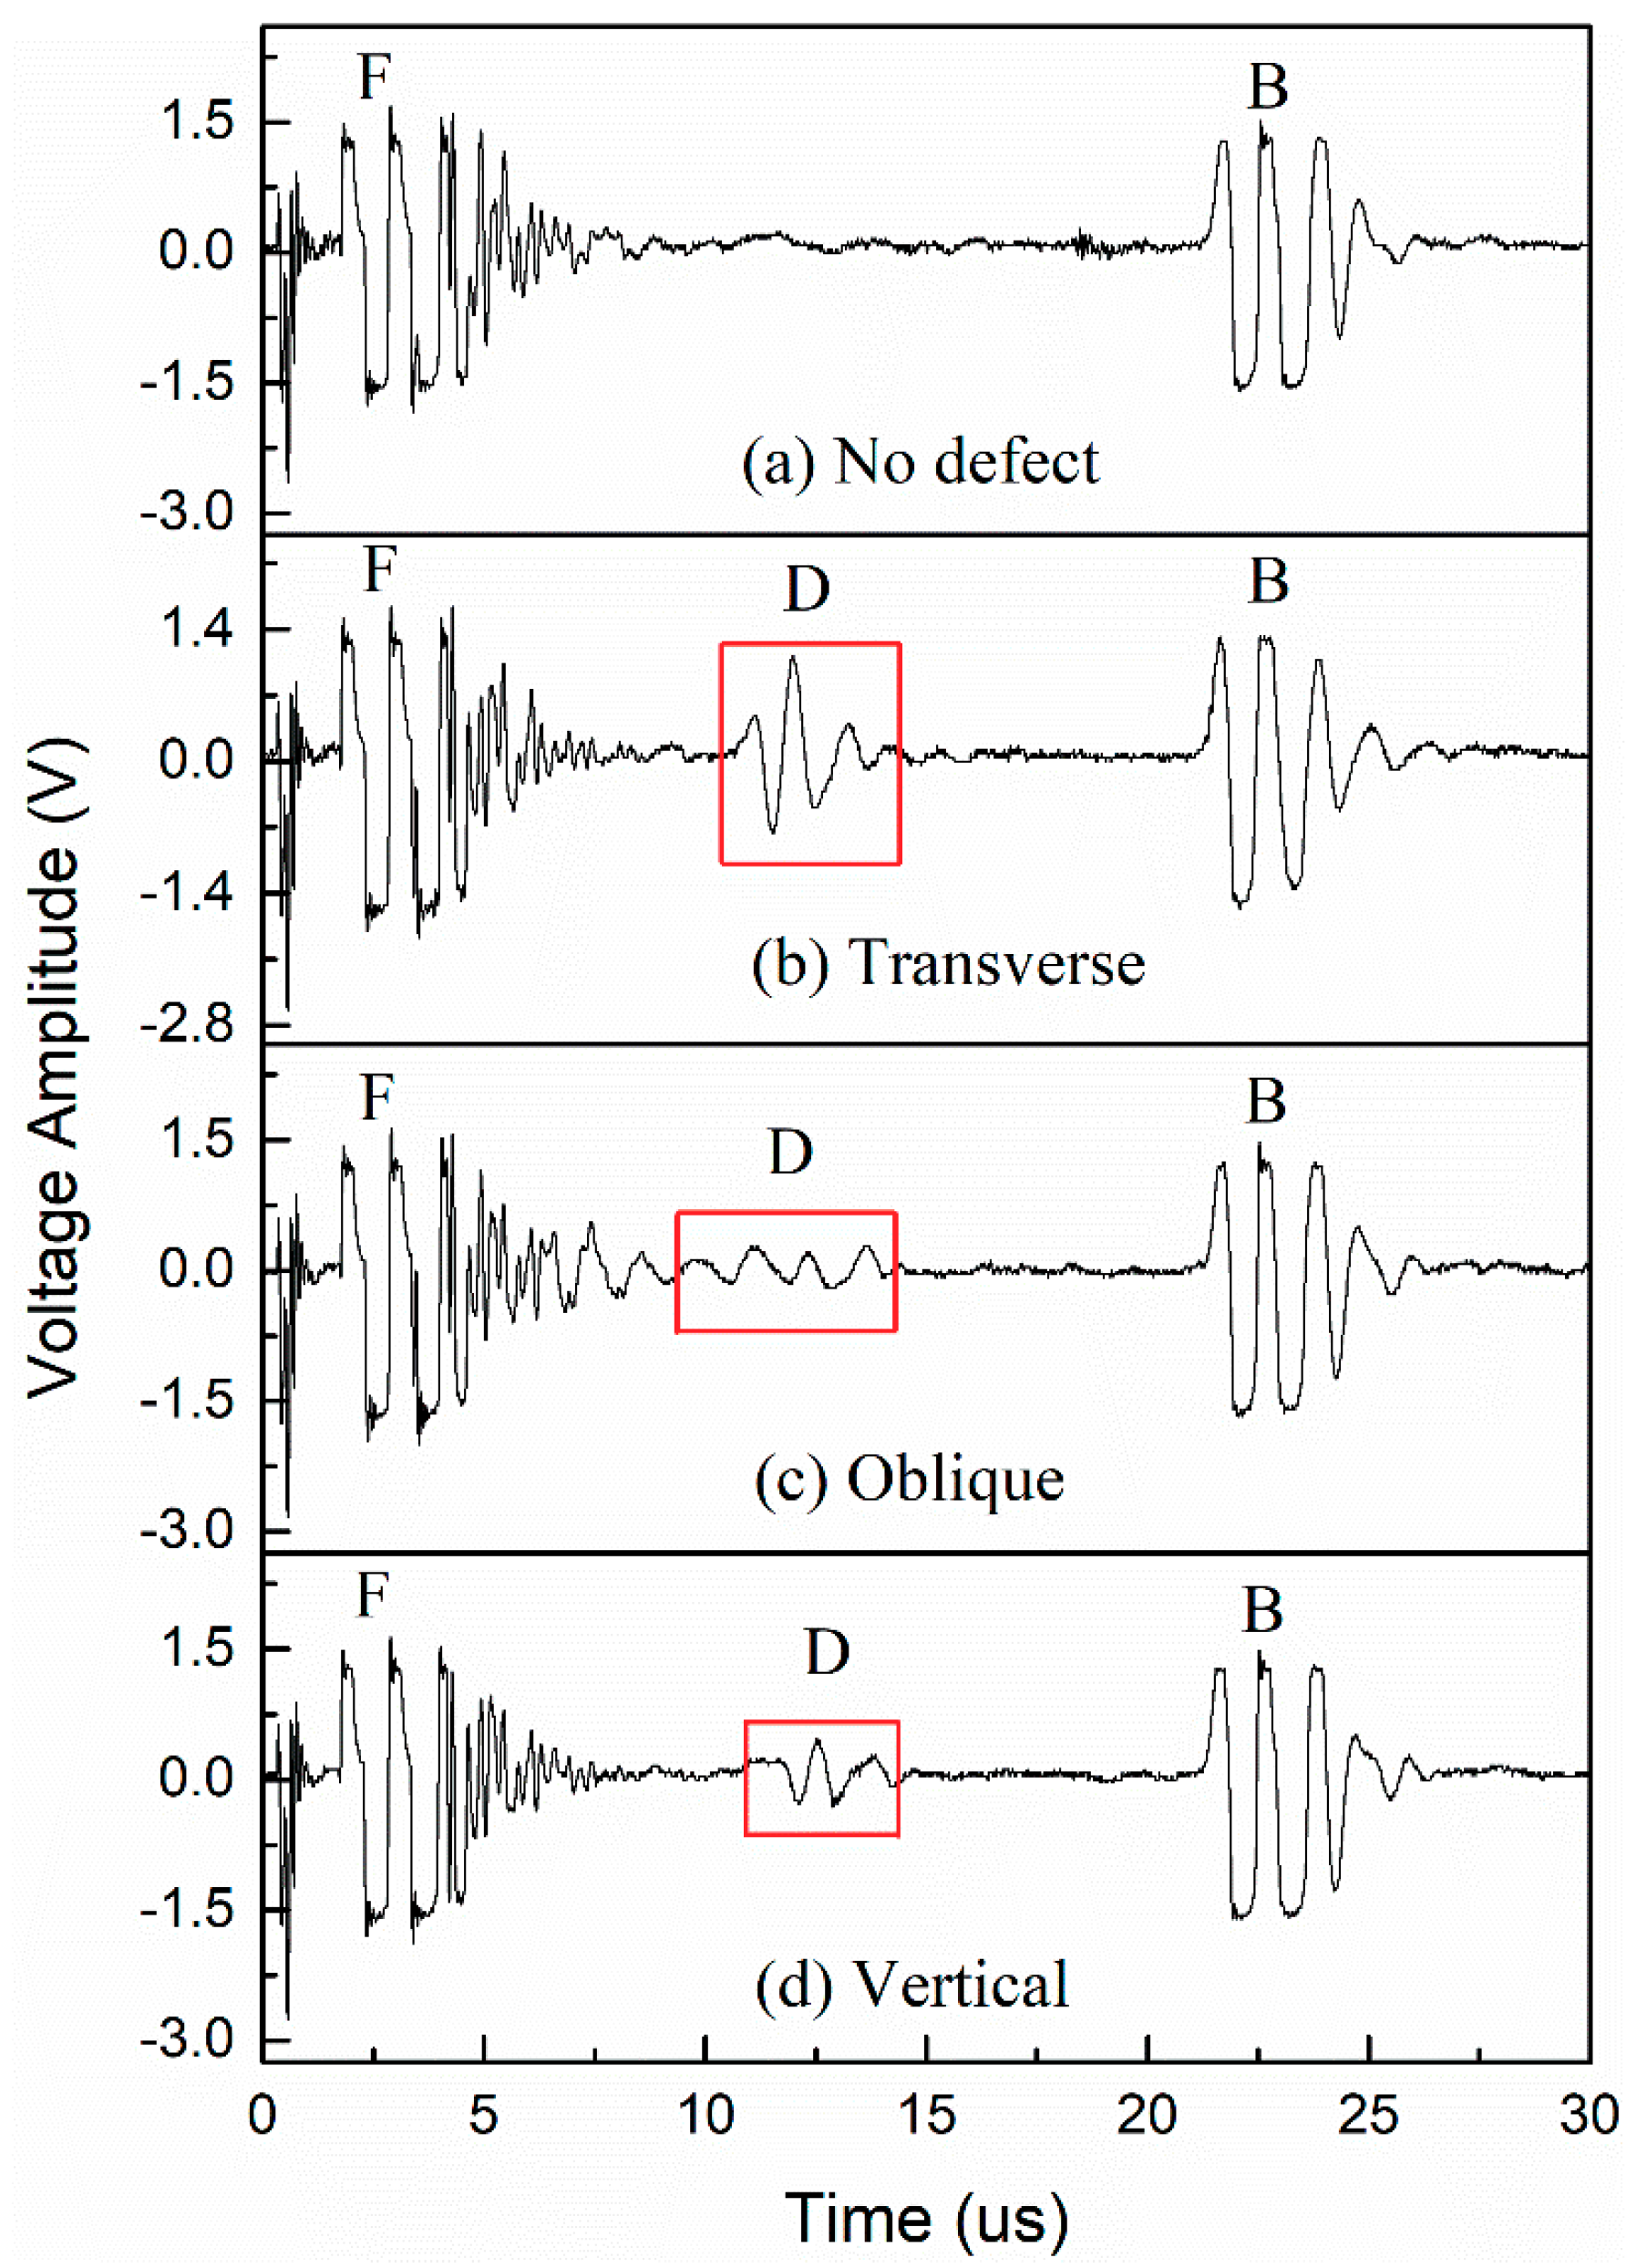
The 1P20 transducer was used to detect φ2 mm cracks with a depth d of 15 mm in the B2 specimen. The reflected waveforms are shown in Figure 11. The depth d of cracks and the amplitude Ad of defect reflected waves are shown in Table 6.
Figure 11 illustrates the defect reflected waves of φ2 mm cracks with different orientations, and a depth d of 15 mm could be observed. For transverse and vertical cracks, the deviation d% was less than 0.73%.
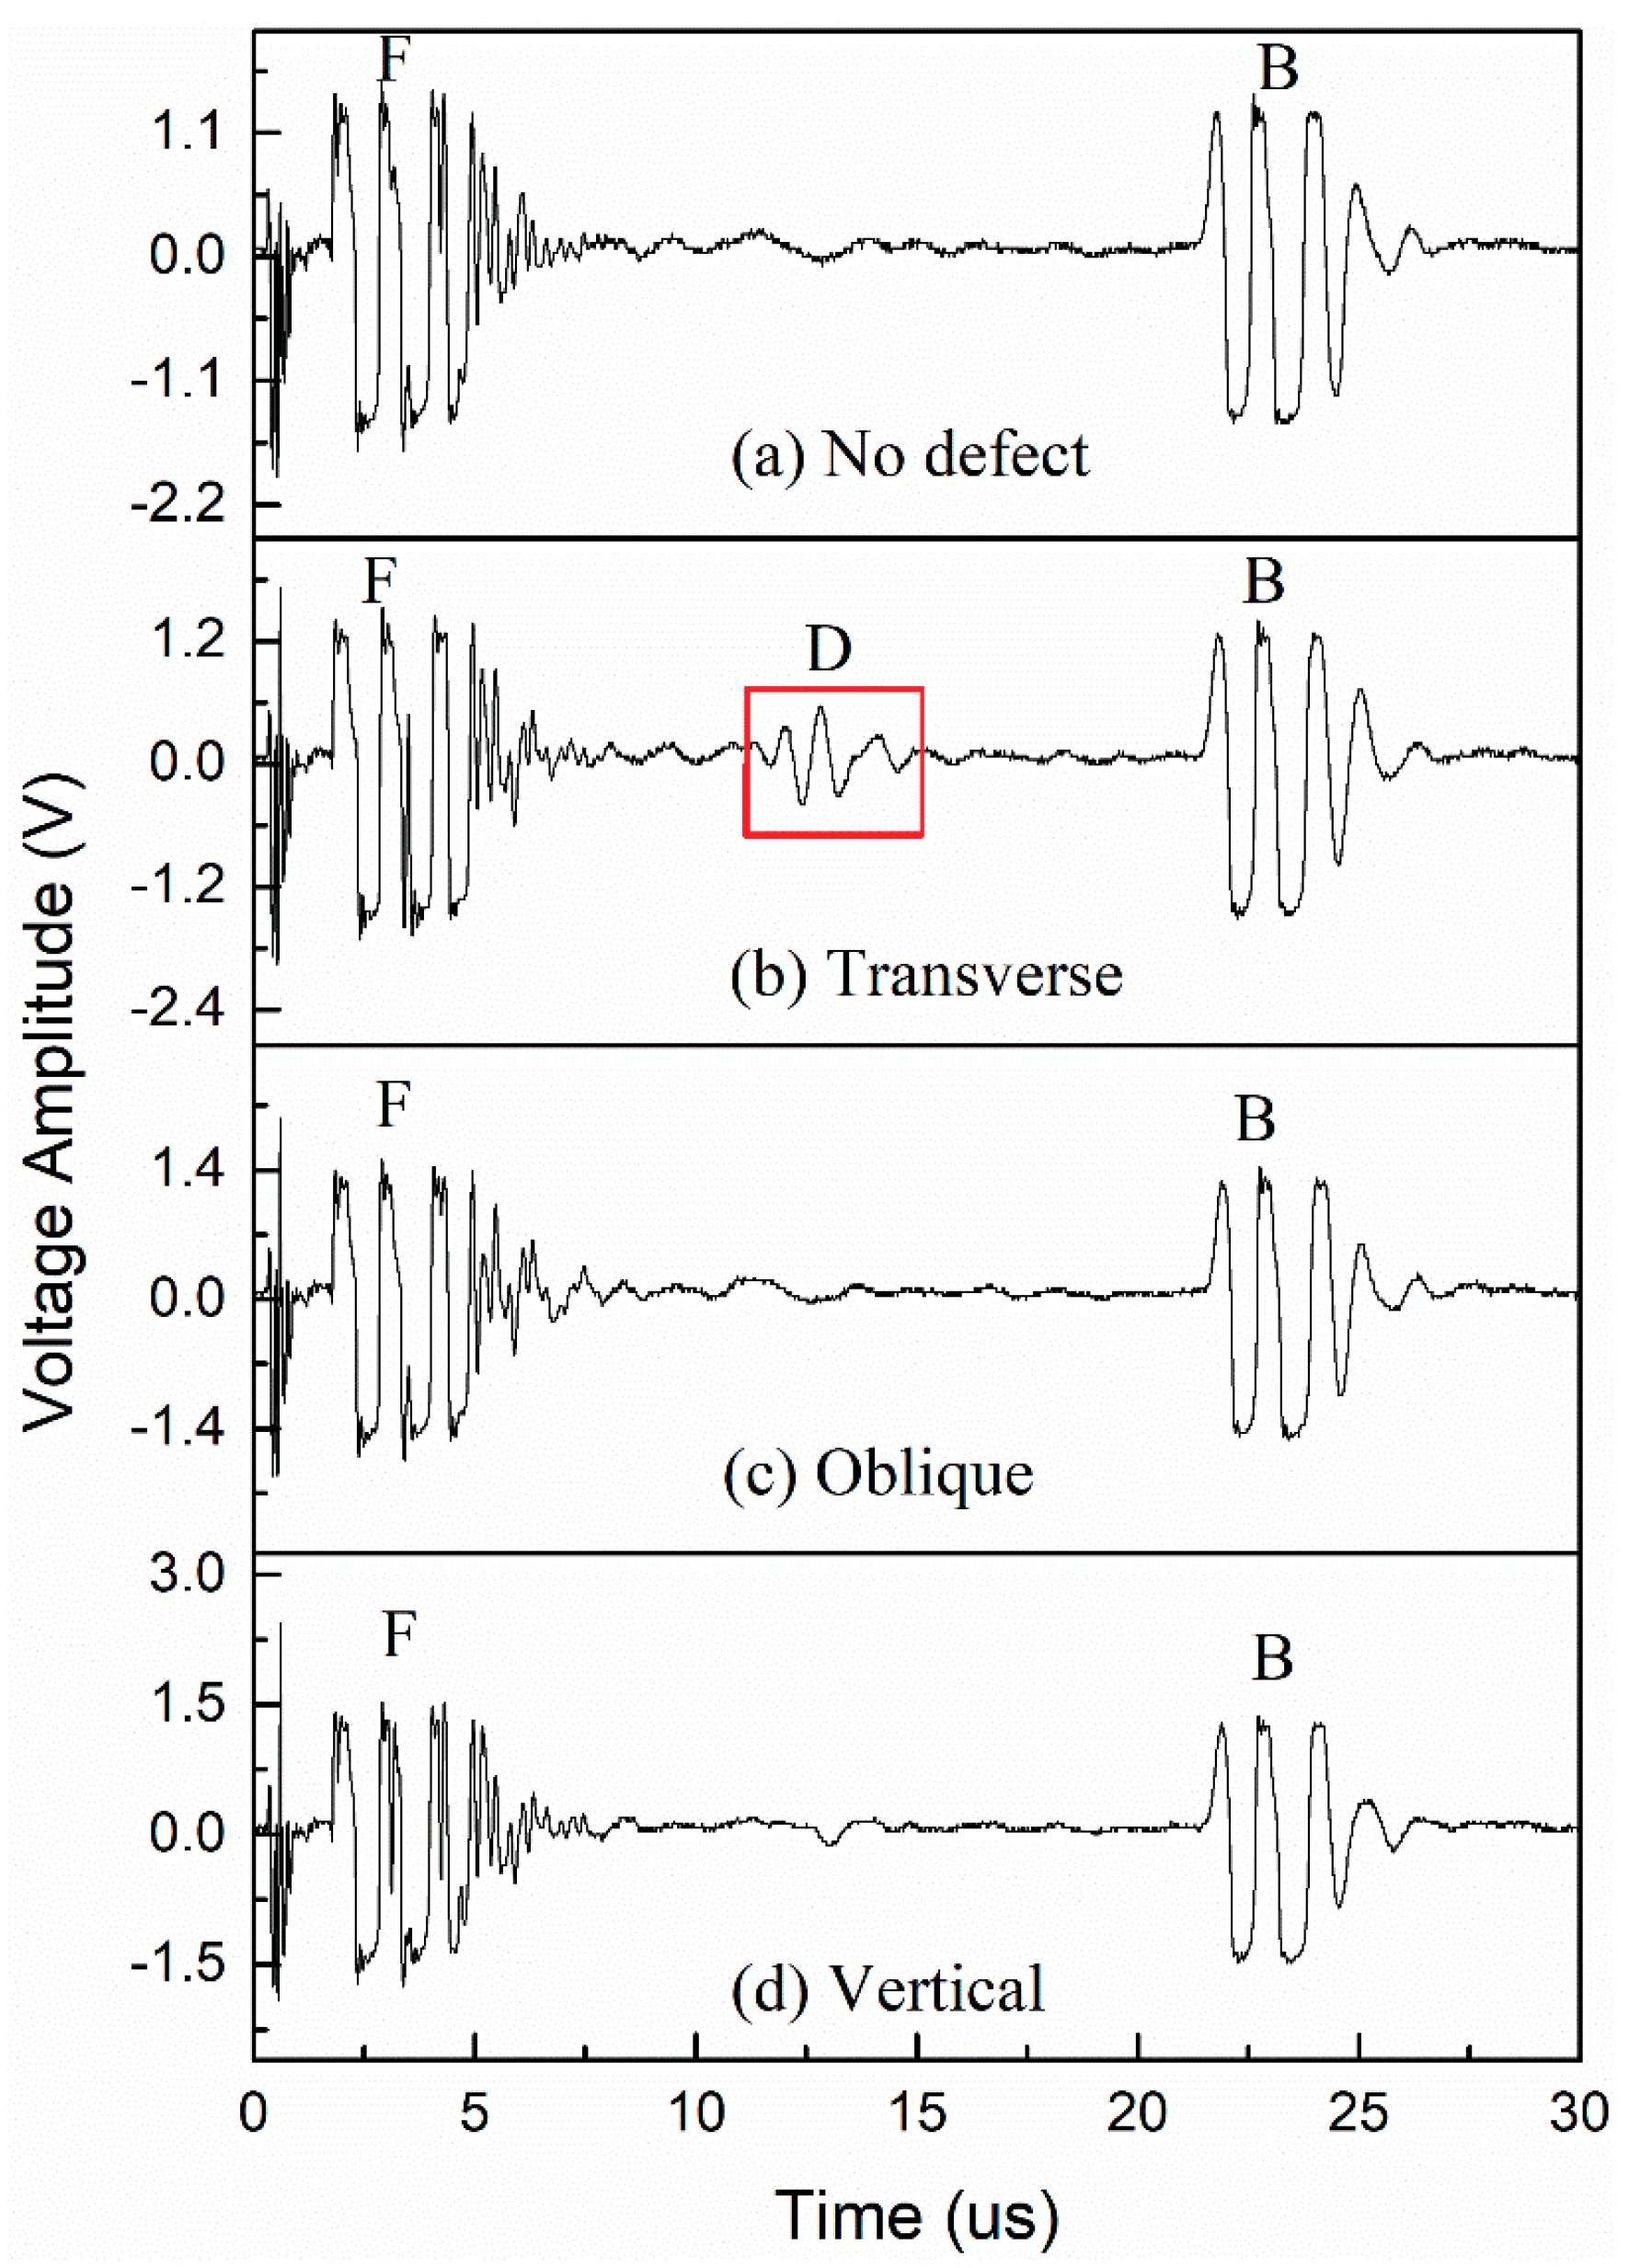
Additionally, φ1 mm cracks with a depth d of 15 mm were detected in the B2 specimen. The reflected waveforms are shown in Figure 12, which illustrates that the defect reflected waves of transverse cracks could only be observed. The depth of the transverse crack calculated by the Equation (4) was 14.89 mm, with a deviation of 0.73%.
It can be concluded that the effective depth range for cracks was 15–40 mm, and a φ1 mm crack could be detected by the 1P20 transducer.
4. Partial Discharge Measurements and Ultrasonic Detection of Voids
To show the correlation between used defects and the possible PD (partial discharge) initiation after energizing the specimen, the PD measurements were conducted.
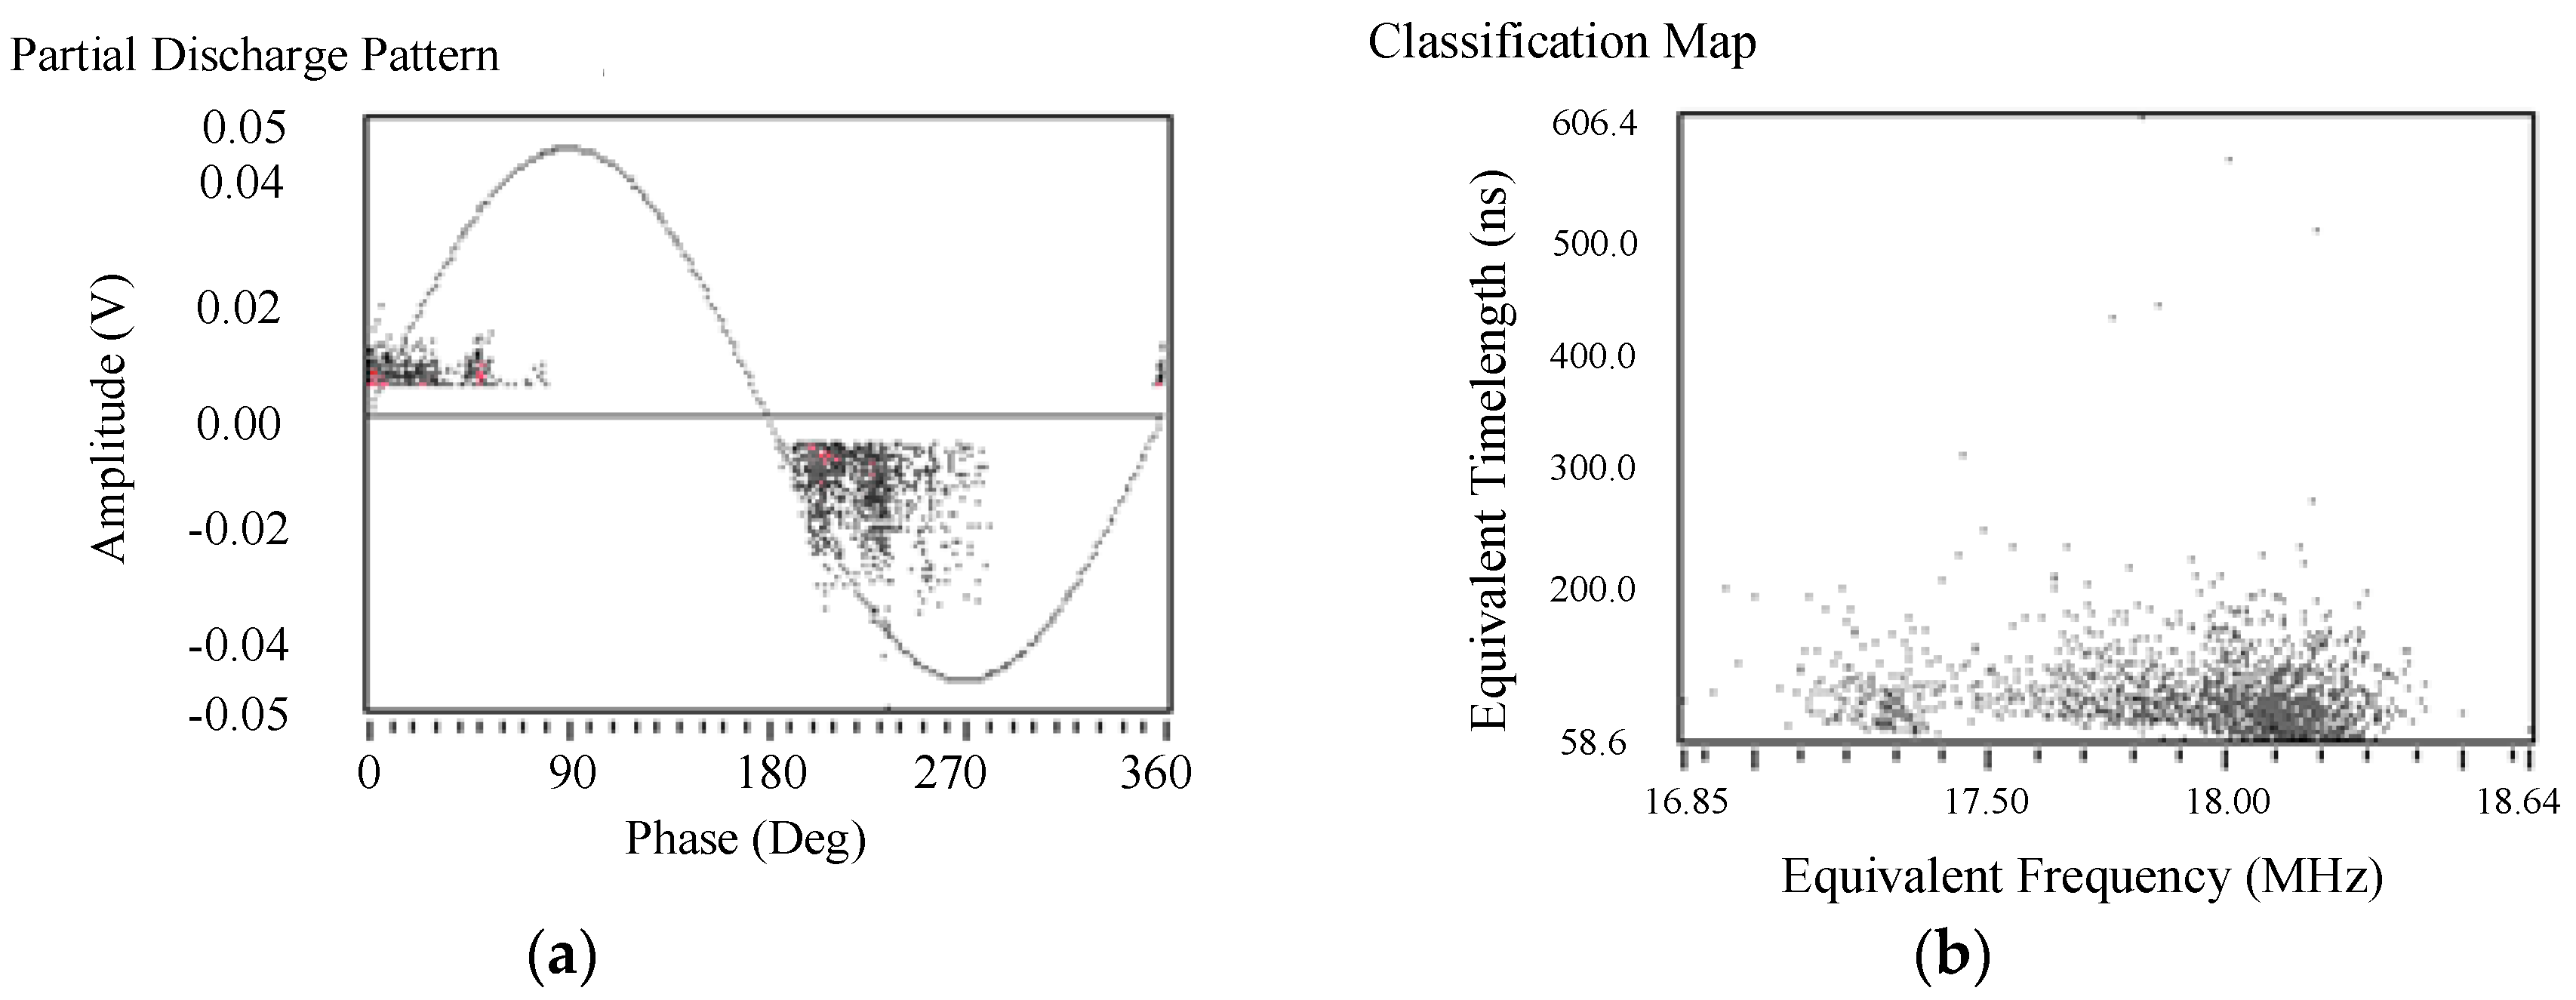
Firstly, the PD inception voltage was measured for a void with a diameter of 2 mm in the specimen A2 by applying high voltage, shown in Figure 13. Then the PD inception voltage was 2.3 kV. Besides, the void with a diameter of 2 mm could be detected by the ultrasonic pulse-echo method.
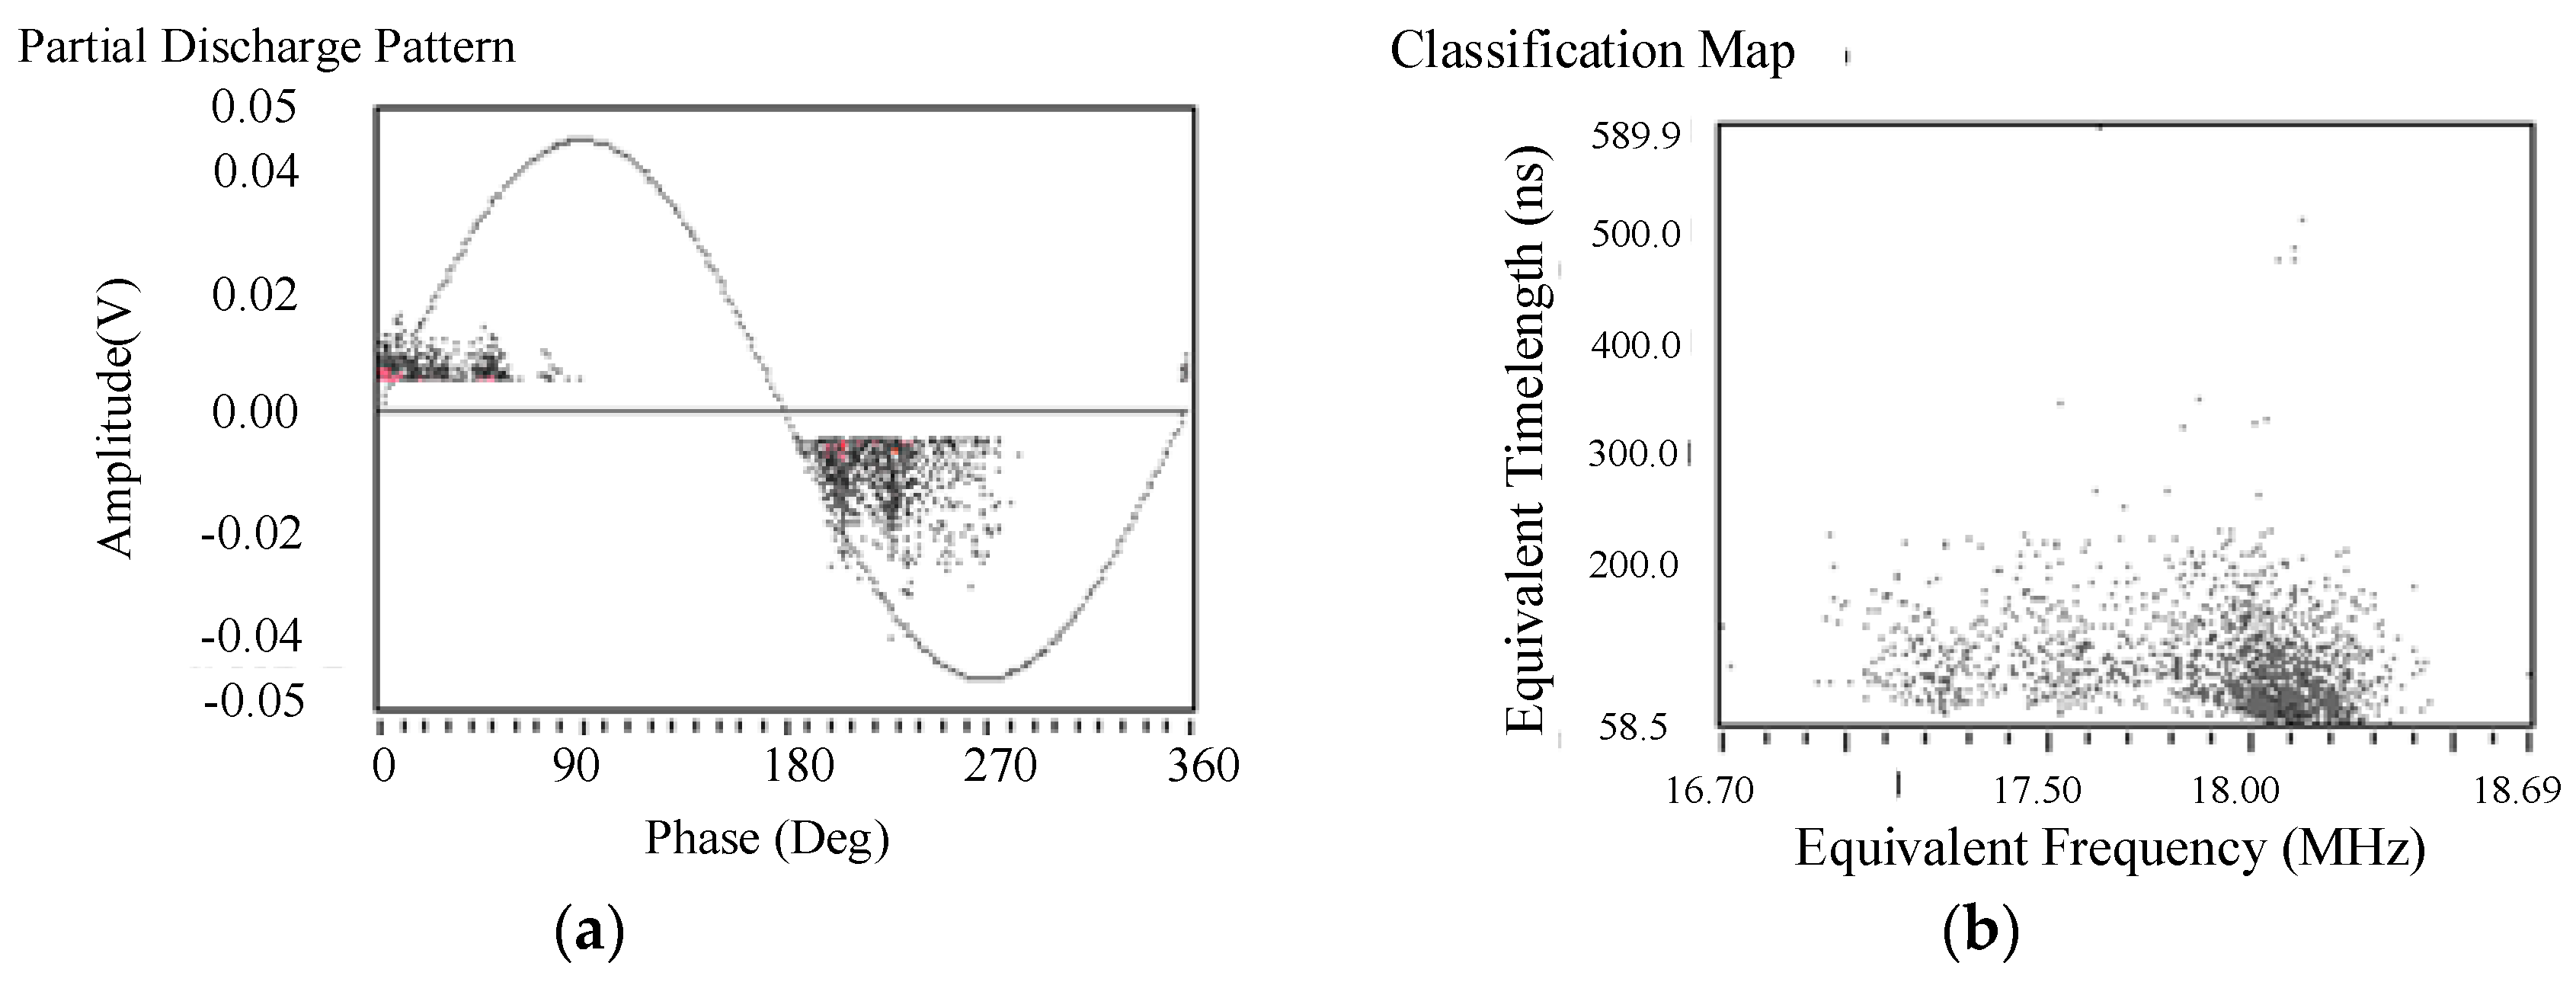
Secondly, the PD inception voltage was measured for a void with a diameter of 1 mm in the specimen A2 by applying high voltage, shown in Figure 14. Then the PD inception voltage was 2.5 kV, which was 8.7% higher than the void with a diameter of 2 mm. Besides, the void with a diameter of 1 mm could not be detected by the ultrasonic pulse-echo method.
The above results illustrate that the difference of the PD inception voltages is very small for the voids with diameters of 1 mm and 2 mm, and the characteristics of partial discharge patterns are consistent. From the PD measurement, it is difficult to distinguish voids with diameters of 1mm and 2mm, but the paper can distinguish them by the ultrasonic pulse-echo method.
5. Conclusions
In this paper, some voids with different diameters or cracks with different diameters and orientations were artificially made in epoxy composite specimens similar to 252 kV GIS basin insulators. An ultrasonic pulse-echo system was set up to detect voids and cracks in specimens. The ultrasonic reflected wave was analyzed in the time domain. The depth of the defects was calculated by the propagation time of reflected waves.
The results showed that the 1P20 transducer could detect voids and cracks in epoxy composite specimens. The smallest defects that could be detected were voids, vertical cracks, oblique cracks of φ2 mm, and transverse cracks of φ1 mm. For the φ2 mm cracks, the amplitude of the transverse crack was the greatest, followed by the vertical crack, and, finally, the oblique crack. A depth of 50 mm was detected in epoxy composites by the 1P20 transducer, and the deviation was less than 1.40%.
Author Contributions
Y.H.: conceived and designed the experiments. She also wrote the paper; F.T. performed the experiments and helped in writing the paper; Z.Z., Y.Z., and W.H. worked on the analysis part and helped in the experiments; L.Y. guided the writing and the data analysis; L.L. provided guidance on the test.
Funding
This research was funded by Smart Grid Joint Fund Key Project between National Natural Science Foundation of China and State Grid Corporation, grant number U1766220.
Conflicts of Interest
The authors declare no conflict of interest.
References
- Xie, J.; Chalmers, I.D. The influence of surface charge upon flashover of particle-contaminated insulators in under impulse-voltage conditions. J. Phys. D Appl. Phys. 1997, 30, 1055–1063. [Google Scholar]
- Tian, Y.; Fu, M.L. Investigation report on surface flashover failure mechanism of GIS basin insulators. In press.
- Yuan, W.Q. The study of crack discharge in ultra-high voltage basin-type insulator. Master’s Thesis, North China Electric Power University, BeiJing, China, 2014. [Google Scholar]
- China Standard NB/T42105. Basin Insulator for High-Voltage Alternating Current Gas-Insulated Metal-Enclosed Switchgear; Electric Power Press of China: Beijing, China, 2016. [Google Scholar]
- China Standard Q GDW11127. Specifications for Basin Insulators Used in 1100kV Gas-Insulated Metal-Enclosed Switchgear; Electric Power Press of China: Beijing, China, 2014. [Google Scholar]
- China Standard GB-Z24836. 1100kV Gas-Insulated Metal-Enclosed Switchgear; Electric Power Press of China: Beijing, China, 2009. [Google Scholar]
- China Standard DL/T555. Guide for Withstand Voltage and Insulated Test of Gas Insulated Metal-Enclosure Switchgear on Site; Electric Power Press of China: Beijing, China, 2004. [Google Scholar]
- Meijer, S.; Smit, J.J. UHF defect evaluation in gas insulated equipment. IEEE Trans. Dielectr. Electr. Insul. 2005, 12, 285–296. [Google Scholar] [CrossRef]
- Hoshihino, T.; Maruyama, S.; Ohtsuka, S.; Hikita, M.; Wada, J.; Okabe, S. Sensitivity comparison of disc- and loop-type sensors using the UHF method to detect partial discharges in GIS. IEEE Trans. Dielectr. Electr. Insul. 2012, 19, 910–916. [Google Scholar] [CrossRef]
- Xiong, J.; Yuan, W.; Ma, G.M.; Zhang, Q.; Zheng, S.S. Field Applications of Ultra High Frequency Techniques for Defect Detection in GIS. Sensors 2018, 18, 2425. [Google Scholar] [CrossRef] [PubMed] [Green Version]
- Zheng, W. The Experimental Study of Partial DischargeDetection Technology in GIS Equipments. Master’s Thesis, North China Electric Power University, BeiJing, China, 2012. [Google Scholar]
- Lundgaard, L.E.; Tangen, G.; Skyberg, B.; Faugstad, K. Acoustic diagnoses of GIS; field experience and development of expere system. IEEE Trans. Power Deliv. 1992, 7, 287–294. [Google Scholar] [CrossRef]
- Qi, B.; Li, C.R.; Hao, Z.; Geng, B.; Xu, D.; Liu, S.; Deng, C. Partial Discharge Detection for GIS: A Comparison between UHF and Acoustic Methods. In Proceedings of the 2010 IEEE International Symposium on Electrical Insulation, San Diego, CA, USA, 6–9 June 2010; Available online: https://0-ieeexplore-ieee-org.brum.beds.ac.uk/document/5549553 (accessed on 10 September 2019).
- Yoshida, M.; Kojima, H.; Hayakawa, N.; Endo, F.; Okubo, H. Evaluation of UHF method for partial discharge measurement by simultaneous observation of UHF signal and current pulse waveforms. IEEE Trans. Dielectr. Electr. Insul. 2011, 18, 425–431. [Google Scholar] [CrossRef]
- Kock, N.D.; Coric, B.; Pietsch, R. UHF PD detection in gas-insulator switchgear-suitability and sensitivity of the UHF method in comparison with the IEC 270 method. IEEE Electr. Insul. Mag. 1996, 12, 20–26. [Google Scholar] [CrossRef]
- Xu, H.Q.; Ma, J.P.; Wang, C.L.; Zheng, S.S.; Huang, X.C.; Liu, X.B. Study on Digital X-Ray Imaging Technology for Detecting Typical Defects in GIS Equipment. Power Syst. Technol. 2017, 41, 1967–1972. [Google Scholar]
- Tehlar, D.; Riechert, U.; Behrmann, G.; Schraudolph, M.; Herrmann, L.G.; Pancheshnyi, S. Pulsed X-ray induced partial discharge diagnostics for routine testing of solid GIS insulators. IEEE Trans. Dielectr. Electr. Insul. 2013, 20, 2173–2178. [Google Scholar] [CrossRef]
- Auckland, D.W.; Varlow, B.R.; Maloney, D. Ultrasonic detection of insulation degradation. IEE Proc. A Phys. Sci. Meas. Instrum. Manag. Educ. 1990, 137, 356–360. [Google Scholar] [CrossRef]
- Yuan, C.; Xie, C.Z.; Li, L.C.; Zhang, F.Z.; Gubanski, S.M. Ultrasonic phased array detection of internal defects in composite insulators. IEEE Trans. Dielectr. Electr. Insul. 2016, 23, 525–531. [Google Scholar] [CrossRef]
- Lee, Y.S.; Nelson, J.K.; Scarton, H.A.; Teng, D.; Azizi-Ghannad, S. An acoustic diagnostic technique for use with electric machine insulation. IEEE Trans. Dielectr. Electr. Insul. 1994, 1, 1186–1193. [Google Scholar] [CrossRef]
- Wisheart, M.; Richardson, M.O.W. Low velocity response of a complex geometry pultruded glass/polyester composite. J. Mater. Sci. 1999, 34, 1107–1116. [Google Scholar] [CrossRef]
- Aymerich, F.; Meili, S. Ultrasonic evaluation of matrix damage in impacted composite laminates. Compos. Part B Eng. 2000, 31, 1–6. [Google Scholar] [CrossRef]
- Mouritz, A.P.; Townsend, C.; Shah Khan, M.Z. Non-destructive detection of fatigue damage in thick composites by pulse-echo ultrasonics. Compos. Sci. Technol. 2000, 60, 23–32. [Google Scholar] [CrossRef]
- Hao, Y.P.; Wang, G.L.; Jia, Z.D.; Xie, H.K. Application of ultrasonic pulse-echo method to insu lation condition diagnosis for large generators. IEEE Trans. Dielectr. Electr. Insul. 2005, 12, 104–113. [Google Scholar]
- Hao, Y.P.; Xie, H.K.; Wang, G.L.; Jia, Z.D. Assessment of insulation condition of generator stator bars based on velocity of ultrasonic waves. IEEE Trans. Dielectr. Electr. Insul. 2003, 10, 539–547. [Google Scholar]
- Hao, Y.P.; Wang, G.L.; Xie, H.K. Ultrasonic nondestructive detection for defects in epoxy/mica insulation. In Proceedings of the 2001 International Symposium on Electrical Insulating Materials, Himeji, Japan, 22 November 2001; Available online: https://0-ieeexplore-ieee-org.brum.beds.ac.uk/document/973767 (accessed on 10 September 2019).
- Auckland, D.W.; Smith, C.D.; Varlow, B.R. Application of ultrasound to the NDT of solid insulation. IEE Proc. A Sci. Meas. Technol. 1994, 141, 20–24. [Google Scholar] [CrossRef]
- Armentrout, D.L.; Kumosa, M.; McQuarrie, T.S. Boron-Free Fibers for Prevention of Acid Induced Brittle Fracture of Composite Insulator GRP Rods. IEEE Trans. Power Deliv. 2003, 18, 684–693. [Google Scholar] [CrossRef]
- Liang, X.D.; Dai, J.J.; Zhou, Y.X.; Chen, Y.F. Ultrasonic detection on crack of frp rod in brittle fracture of composite insulators. Proc. CSEE 2005, 25, 110–114. [Google Scholar]
- Xie, C.Z.; Zhang, Y.; Hao, Y.P.; Yuan, X.J.; Wei, Q.H. Application of ultrasonic flaw detector to internal defects in composite insulators. High Volt. Eng. 2008, 35, 2464–2469. [Google Scholar]
- Chen, H.Y.; Li, L.; Xia, Z.W.; Li, C.L.; Liu, G.Q. Inspection of Internal Defects of Composite Insulators by Ultrasonic Phased Array Method Based on Flexible Coupling. High Voltage Eng. 2019, 45, 1274–1280. [Google Scholar]
- Shen, W.; Meng, Y.P.; Jian, Y.F. Study on ultrasonic spectral characteristics of internal defects in epoxy composite materials. Insul. Mater. 2015, 48, 55–60. [Google Scholar]
- Shen, W.; Meng, Y.P.; Jian, Y.F.; Yang, R.; Song, W.J. Study on ultrasonic detection for internal defects appearance of solid insulation materials. High Volt. Appar. 2016, 52, 145–151. [Google Scholar]
- Song, W.J.; Meng, Y.P.; Men, C.; Zhu, B.W.; Cheng, Y.H. Study on the ultrasonic detection method for internal defects of insulation pull rod in circuit breakers. In Proceedings of the 2016 International Conference on Condition Monitoring and Diagnosis (CMD), Xi’an, China, 25–28 September 2001; Available online: https://0-ieeexplore-ieee-org.brum.beds.ac.uk/document/7757898 (accessed on 10 September 2019).
- Zhu, T.Y.; Yang, D.W.; Ye, J.T. GIS basin insulator damage detection based active motivation. J. Tianjin Univ. Technol. 2017, 33, 39–43. [Google Scholar]
- Zheng, H.; Lin, S.Q. Ultrasonic Detection, 2nd ed.; China Labor and Social Security Publishing House: Beijing, China, 2008; pp. 57–61. [Google Scholar]
- Ueno, H.; Walter, P.; Cornelissen, C.; Schnettler, A. Resolution evaluation of ultrasonic diagnosis tools for electrical insulation devices and the detection of electrical trees. IEEE Trans. Dielectr. Electr. Insul. 2007, 14, 249–256. [Google Scholar] [CrossRef]
- Naous, W.; Yu, X.Y.; Naito, K.; Kagawa, Y. Morphology, tensile properties, and fracture toughness of epoxy/Al2O3 nanocomposites. J. Polym. Sci. Part B Polym. Phys. 2006, 44, 1466–1473. [Google Scholar] [CrossRef]
- Rohatgi, P.K.; Matsunaga, T.; Gupta, N. Compressive and ultrasonic properties of polyester/fly ash composites. J. Mater. Sci. 2009, 44, 1485–1493. [Google Scholar] [CrossRef]
Figure 1.
Schematic diagram of detecting defects in epoxy composite specimens by the ultrasonic pulse-echo method.
Figure 1.
Schematic diagram of detecting defects in epoxy composite specimens by the ultrasonic pulse-echo method.

Figure 2.
Epoxy composite specimens with artificial voids or cracks. (a) Voids; (b) cracks.

Figure 3.
Diagrams of the detecting interface of an artificial hole and a long strip of a crack by the ultrasonic beam. (a) Artificial hole; (b) long strip of crack.
Figure 3.
Diagrams of the detecting interface of an artificial hole and a long strip of a crack by the ultrasonic beam. (a) Artificial hole; (b) long strip of crack.

Figure 4.
Ultrasonic propagation model in epoxy composite specimens with defects.

Figure 5.
Reflected ultrasonic waveforms at φ3 mm voids with different depths d in the A1 specimen (d0 = 55 mm).
Figure 5.
Reflected ultrasonic waveforms at φ3 mm voids with different depths d in the A1 specimen (d0 = 55 mm).

Figure 6.
Reflected ultrasonic waveforms at voids with different diameters in the A1 specimen (d0 = 55 mm).
Figure 6.
Reflected ultrasonic waveforms at voids with different diameters in the A1 specimen (d0 = 55 mm).

Figure 7.
Reflected ultrasonic waveforms at φ2 mm voids with different depths d in the A2 specimen (d0 = 30 mm).
Figure 7.
Reflected ultrasonic waveforms at φ2 mm voids with different depths d in the A2 specimen (d0 = 30 mm).

Figure 8.
Reflected ultrasonic waveforms at φ1 mm voids with different depths d in the A2 specimen (d0 = 30 mm).
Figure 8.
Reflected ultrasonic waveforms at φ1 mm voids with different depths d in the A2 specimen (d0 = 30 mm).

Figure 9.
Reflected ultrasonic waveforms at φ2 mm cracks with a depth of 40 mm and different orientations in the B1 specimen (d0 = 50 mm).
Figure 9.
Reflected ultrasonic waveforms at φ2 mm cracks with a depth of 40 mm and different orientations in the B1 specimen (d0 = 50 mm).

Figure 10.
Reflected ultrasonic waveforms at φ1 mm cracks with different orientations in the B1 specimen (d0 = 50 mm).
Figure 10.
Reflected ultrasonic waveforms at φ1 mm cracks with different orientations in the B1 specimen (d0 = 50 mm).

Figure 11.
Reflected ultrasonic waveforms at φ2 mm cracks with a depth of 15 mm and different orientations in the B2 specimen (d0 = 30 mm).
Figure 11.
Reflected ultrasonic waveforms at φ2 mm cracks with a depth of 15 mm and different orientations in the B2 specimen (d0 = 30 mm).

Figure 12.
Reflected ultrasonic waveforms at φ1 mm cracks (d = 15 mm) with a different orientation in the B2 specimen (d0 = 30 mm).
Figure 12.
Reflected ultrasonic waveforms at φ1 mm cracks (d = 15 mm) with a different orientation in the B2 specimen (d0 = 30 mm).

Figure 13.
The partial discharge pattern and classification map of a void with a diameter of 2 mm. (a) partial discharge pattern; (b) classification map.
Figure 13.
The partial discharge pattern and classification map of a void with a diameter of 2 mm. (a) partial discharge pattern; (b) classification map.

Figure 14.
The partial discharge pattern and classification map of a void with a diameter of 1 mm. (a) partial discharge pattern; (b) classification map.
Figure 14.
The partial discharge pattern and classification map of a void with a diameter of 1 mm. (a) partial discharge pattern; (b) classification map.


Table 1.
Diameter and depth of artificial voids in epoxy composite specimens.
| Specimens | φ1 mm d/mm | φ2 mm d/mm | φ3 mm d/mm |
|---|---|---|---|
| A1 | - | 40 | 40 |
| 45 | 45 | 45 | |
| 50 | 50 | 50 | |
| A2 | 15 | 15 | - |
| 20 | 20 | - |
Table 2.
The depth d of defects and the amplitude Ad of defect reflected waves at φ3 mm voids in the A1 specimen (d0 = 55 mm).
Table 2.
The depth d of defects and the amplitude Ad of defect reflected waves at φ3 mm voids in the A1 specimen (d0 = 55 mm).
| Actual d/mm | t0/us | t1/us | t2/us | Calculated d/mm | d% | Ad/V |
|---|---|---|---|---|---|---|
| 40 | 3.13 | 39.88 | 29.66 | 39.70 | 0.75 | 0.75 |
| 45 | 3.13 | 39.88 | 33.07 | 44.81 | 0.42 | 0.52 |
| 50 | 3.08 | 39.93 | 36.47 | 49.84 | 0.32 | 0.48 |
Table 3.
The depth d of defects and the amplitude Ad of defect reflected waves at voids with a depth of 50 mm and different diameters in the A1 specimen (d0 = 55 mm).
Table 3.
The depth d of defects and the amplitude Ad of defect reflected waves at voids with a depth of 50 mm and different diameters in the A1 specimen (d0 = 55 mm).
| φ/mm | t0/us | t1/us | t2/us | Calculated d/mm | d% | Ad/V |
|---|---|---|---|---|---|---|
| 3 | 3.08 | 39.93 | 36.47 | 49.84 | 0.32 | 0.48 |
| 2 | 3.17 | 39.88 | 36.47 | 49.89 | 0.22 | 0.16 |
Table 4.
The depth d of defects and the amplitude Ad of defect reflected waves at φ2 mm voids in the A2 specimen (d0 = 30 mm).
Table 4.
The depth d of defects and the amplitude Ad of defect reflected waves at φ2 mm voids in the A2 specimen (d0 = 30 mm).
| Actual d/mm | t0/us | t1/us | t2/us | Calculated d/mm | d% | Ad/V |
|---|---|---|---|---|---|---|
| 15 | 3.08 | 22.81 | 12.81 | 14.79 | 1.40 | 0.44 |
| 20 | 3.08 | 22.76 | 16.14 | 19.91 | 0.45 | 0.32 |
Table 5.
The depth d of defects and the amplitude Ad of defect reflected waves at φ2 mm cracks with a depth of 40 mm and different orientations in the B1 specimen (d0 = 50 mm).
Table 5.
The depth d of defects and the amplitude Ad of defect reflected waves at φ2 mm cracks with a depth of 40 mm and different orientations in the B1 specimen (d0 = 50 mm).
| φ2 mm | t0/us | t1/us | t2/us | Calculated d/mm | d% | Ad/V |
|---|---|---|---|---|---|---|
| Transverse | 2.94 | 35.73 | 28.22 | 39.55 | 1.13 | 0.84 |
| Oblique | 2.94 | 35.73 | 27.57 | 37.56 | 6.10 | 0.24 |
| Vertical | 2.94 | 35.73 | 29.15 | 39.97 | 0.08 | 0.32 |
Table 6.
The depth d and the amplitude Ad of defect reflected waves at φ2 mm cracks with a depth of 15 mm and different orientations in the B2 specimen (d0 = 30 mm).
Table 6.
The depth d and the amplitude Ad of defect reflected waves at φ2 mm cracks with a depth of 15 mm and different orientations in the B2 specimen (d0 = 30 mm).
| φ2 mm | t0/us | t1/us | t2/us | Calculated d/mm | d% | Ad/V |
|---|---|---|---|---|---|---|
| Transverse | 2.89 | 22.53 | 11.99 | 14.90 | 0.67 | 0.80 |
| Oblique | 2.89 | 22.57 | 11.19 | 12.65 | 15.67 | 0.24 |
| Vertical | 2.89 | 22.43 | 12.59 | 14.89 | 0.73 | 0.28 |
© 2019 by the authors. Licensee MDPI, Basel, Switzerland. This article is an open access article distributed under the terms and conditions of the Creative Commons Attribution (CC BY) license (http://creativecommons.org/licenses/by/4.0/).
Share and Cite
MDPI and ACS Style
Tian, F.; Hao, Y.; Zou, Z.; Zheng, Y.; He, W.; Yang, L.; Li, L. An Ultrasonic Pulse-Echo Method to Detect Internal Defects in Epoxy Composite Insulation. Energies 2019, 12, 4804. https://0-doi-org.brum.beds.ac.uk/10.3390/en12244804
AMA Style
Tian F, Hao Y, Zou Z, Zheng Y, He W, Yang L, Li L. An Ultrasonic Pulse-Echo Method to Detect Internal Defects in Epoxy Composite Insulation. Energies. 2019; 12(24):4804. https://0-doi-org.brum.beds.ac.uk/10.3390/en12244804
Chicago/Turabian StyleTian, Fangyuan, Yanpeng Hao, Zhouyiao Zou, Yao Zheng, Weiming He, Lin Yang, and Licheng Li. 2019. "An Ultrasonic Pulse-Echo Method to Detect Internal Defects in Epoxy Composite Insulation" Energies 12, no. 24: 4804. https://0-doi-org.brum.beds.ac.uk/10.3390/en12244804
Note that from the first issue of 2016, this journal uses article numbers instead of page numbers. See further details here.