Article

Analysis of Local Measurement-Based Algorithms for Fault Detection in a Multi-Terminal HVDC Grid

by
María José Pérez Molina
*,
Dunixe Marene Larruskain
,
Pablo Eguía López
and
Agurtzane Etxegarai
Department of Electrical Engineering, Faculty of Engineering of Bilbao, University of the Basque Country UPV/EHU, Plaza Ingeniero Torres Quevedo, 1, 48013 Bilbao, Spain
*
Author to whom correspondence should be addressed.
Submission received: 27 November 2019 / Revised: 11 December 2019 / Accepted: 13 December 2019 / Published: 17 December 2019
(This article belongs to the Special Issue Control and Protection of HVDC-Connected Offshore Wind Power Plants)

Abstract

:
One of the most important challenges of developing multi-terminal (MT) high voltage direct current (HVDC) grids is the system performance under fault conditions. It must be highlighted that the operating time of the protection system needs to be shorter than a few milliseconds. Due to this restrictive requirement of speed, local measurement based algorithms are mostly used as primary protection since they present an appropriate operation speed. This paper focuses on the analysis of local measurement based algorithms, specifically overcurrent, undervoltage, rate-of-change-of-current, and rate-of-change-of-voltage algorithms. A review of these fault detection algorithms is presented. Furthermore, these algorithms are applied to a multi-terminal grid, where the influence of fault location and fault resistance is assessed. Then, their performances are compared in terms of detection speed and maximum current interrupted by the HVDC circuit breakers. This analysis aims to enhance the protection systems by facilitating the selection of the most suitable algorithm for primary or backup protection systems. In addition, two new fault type identification algorithms based on the rate-of-change-of-voltage and rate-of-change-of-current are proposed and analyzed. The paper finally includes a comparison between the previously reviewed local measurement based algorithms found in the literature and the simulation results of the present work.

1. Introduction

High-voltage direct current (HVDC) technology has earned relevance in power systems. Its characteristics make it a promising solution for long distance power transmissions [1]. Some of those characteristics, compared with AC systems, are:
  • Lower power losses transporting the same amount of power [1,2,3,4].
  • Lesser number of electrical conductors (two poles in DC, three phases in AC) [1,5].
  • Lower visual impact and footprint [3,4,6].
  • Capability of interconnecting asynchronous AC systems [3,7,8,9,10,11,12].
  • Capability of transmitting power through underground and undersea cables without being limited by the capacitive effect [1,5,13].
  • Flexible power control [1,2,3,14,15].
  • Lower costs for long transmission distance [1,2,4].
However, there are some unsolved technical challenges limiting the development of multi-terminal HVDC (MTDC) grids. During fault conditions, DC current reaches very high values and voltage drops sharply to zero due to the small line resistance of DC electrical conductors. This condition is propagated fast and widely throughout the entire system, which can finally result in a blackout. It is even more problematic when voltage source converters (VSC) are used since power electronic devices, usually IGBTs, cannot withstand high overcurrents [16]. If the current is not limited and interrupted on time, the IGBTs could be damaged or even destroyed.
Therefore, very fast protection systems are needed for the protection of MTDC systems, including algorithms for fault location and detection. Thus, fault detection, location and clearance is assumed to be held within 10 ms. As a consequence, AC protection algorithms cannot be used in HVDC systems without proper adaptations. Yet, requirements of reliability, speed, selectivity, and accuracy should be fulfilled [17,18,19]. Only the faulty part of the grid should be disconnected and the healthy parts of the grid should remain in operation. The latter point is even more critical in multi-terminal and meshed HVDC grids.
HVDC fault detection algorithms can be based on local measurements or on communications.
On the one hand, local measurement based algorithms can directly use DC current and voltage measurements or process these signals before using them. The direct type algorithms use single-ended DC current or voltage measurements as a fault detection criterion, or other variables that are mathematically derived from them [20]. These methods are very fast but they lack selectivity [17,21]. Also, limiting inductors are usually located in the system in order to improve the algorithm selectivity and, in addition, to limit the rate-of-rise-of-current. The size of these inductors has to be carefully selected since a larger size improves the selectivity of the algorithm but can affect the stability of the HVDC grid [22].
The most common direct algorithms are undervoltage (UV) and overcurrent (OC) algorithms, which directly use the current and voltage magnitudes, as well as the rate-of-change-of-current (ROCOC) and rate-of-change-of-voltage (ROCOV) algorithms, based on the derivatives of those magnitudes.
Overcurrent algorithms have been extensively used in the literature. Thus, this algorithm is employed for protecting a radial MT system in [23] and a four-terminal symmetric monopole VSC based grid in [24]. In both cases, unidirectional HVDC circuit breakers (CB) are used. The overcurrent algorithm combined with an inverse time characteristic is used in [21] to protect a three-terminal bipole VSC based system. This way, the operation time varies inversely with the current magnitude. A directional feature is added to the overcurrent algorithm in [25] in order to improve its selectivity. In addition, this algorithm is commonly used for grid partition in partially-selective fault clearing strategies, e.g., [26,27,28].
Since the undervoltage algorithm presents lower selectivity is not as commonly used as the OC algorithm. Still, it can be found in the literature in [29] protecting a four-terminal symmetric monopole VSC based system.
Also, the ROCOC algorithm is used to protect a three-terminal bipole VSC based grid in [30,31]; the fault direction is identified by analyzing the polarity of the ROCOC first peak. Another ROCOC-based protection system is presented in [32].
Finally, the ROCOV algorithm protects a nine-terminal VSC based grid in [33] and a three-terminal bipole VSC based grid in [34]. Alternatively, a comparison of the ROCOV at both sides of the limiting inductor is used in [35] for fault detection. Similarly, the ratio between the ROCOV at both sides of the limiting inductor is employed in [36].
Meanwhile, the signal processing algorithms are usually based on traveling wave analysis in which the most relevant features of the signal are extracted using transforms as wavelet transform [37,38,39,40], Fourier transform [41,42,43], and Hilbert transform [44,45]. However, they present some difficulties in the detection of the wave-front due to interference of signals and its dependence on the sampling frequency value [46,47,48]. Traveling wave methods could be communication based if measurements are taken at both ends of the protection zone and afterwards compared [49].
On the other hand, communication based algorithms exchange information between both ends of the protection zone through a communication channel. They are more selective than local algorithms [18], but the time delay imposed by the communication channel could make the protection system too slow; to the point of not being able to meet the requirement of speed. Even if fast communication media such as optical fiber (communication time delay of 1 ms per 200 km [50,51]), are used, the operation time could be too high. Certainly, the communication time delay is the most critical parameter in the operation time of a communication based algorithm [52]. Therefore, in HVDC systems, communication-based algorithms are mostly used:
  • As a backup system to enhance the performance of the main protection system [53].
  • In high impedance fault conditions where the requirements of speed are not so important [54].
  • In cases of short transmission distances [51].
Likewise, fast HVDC CB are needed. They must operate in a range of a few milliseconds and their current interruption capability must be high [55]. In addition, to interrupt the current they have to produce a current zero because the DC current does not cross zero ‘naturally’ as in AC systems. Furthermore, they have to be able to dissipate the energy stored in the system during fault conditions [56].
Fault clearing strategies are key on how faults affect the system. There are non-selective, partially-selective, or full-selective strategies [19,57].
  • Non-selective strategy: the entire system is shut down after fault detection; this strategy is usually based on AC CBs.
  • Full-selective strategy: only the faulty part of the system is disconnected, usually accomplished with HVDC CBs.
  • Partially-selective strategy: it is a combination of the previous strategies. The system is divided in several protection zones. When a fault occurs inside one of these zones, that zone, including the healthy parts, is shut down and afterwards the faulty part is isolated, usually by fast disconnectors. After fault isolation, the healthy parts of the affected zone are re-energized.
So, the adopted fault clearing strategy determines the impact of a fault condition on the system and which type of components of the protection system are selected; including breaker devices and protection algorithms.
The main focus of the present paper is set on protection systems for HVDC grids. Specifically, local measurement based algorithms are studied in Section 2, due to their capability of meeting the requirement of speed. Overcurrent, undervoltage, rate-of-change-of-voltage and rate-of-change-of-current algorithms are applied to a multi-terminal VSC based system. The application of the protection algorithms under study is analyzed for similar scenarios against different fault types, fault resistances, and fault locations. Then, the performance of the algorithms is discussed and compared in Section 3. This way, their advantages and disadvantages are highlighted in order to estimate their applicability. Besides, two new fault type identification algorithms are proposed. In addition, a comparison between the discussed protection algorithms on this paper and some of the most representative algorithms in the literature is included. Finally, the conclusions of the work presented in the paper are detailed in Section 4.

2. Analysis of Local Measurement Based Algorithms

In this section, local measurement based fault detection algorithms are analyzed. These methods use directly the DC current and voltage magnitudes or some variables mathematically derived from them, i.e., their derivatives. The local measurement based algorithms using directly the signal magnitudes are overcurrent and undervoltage algorithms. Besides, the derivative based algorithms under study for the present paper are the rate-of-change-of-current and the rate-of-change-of-voltage. Their characteristics and performances in a multi-terminal (MT) grid are described in the following subsections.
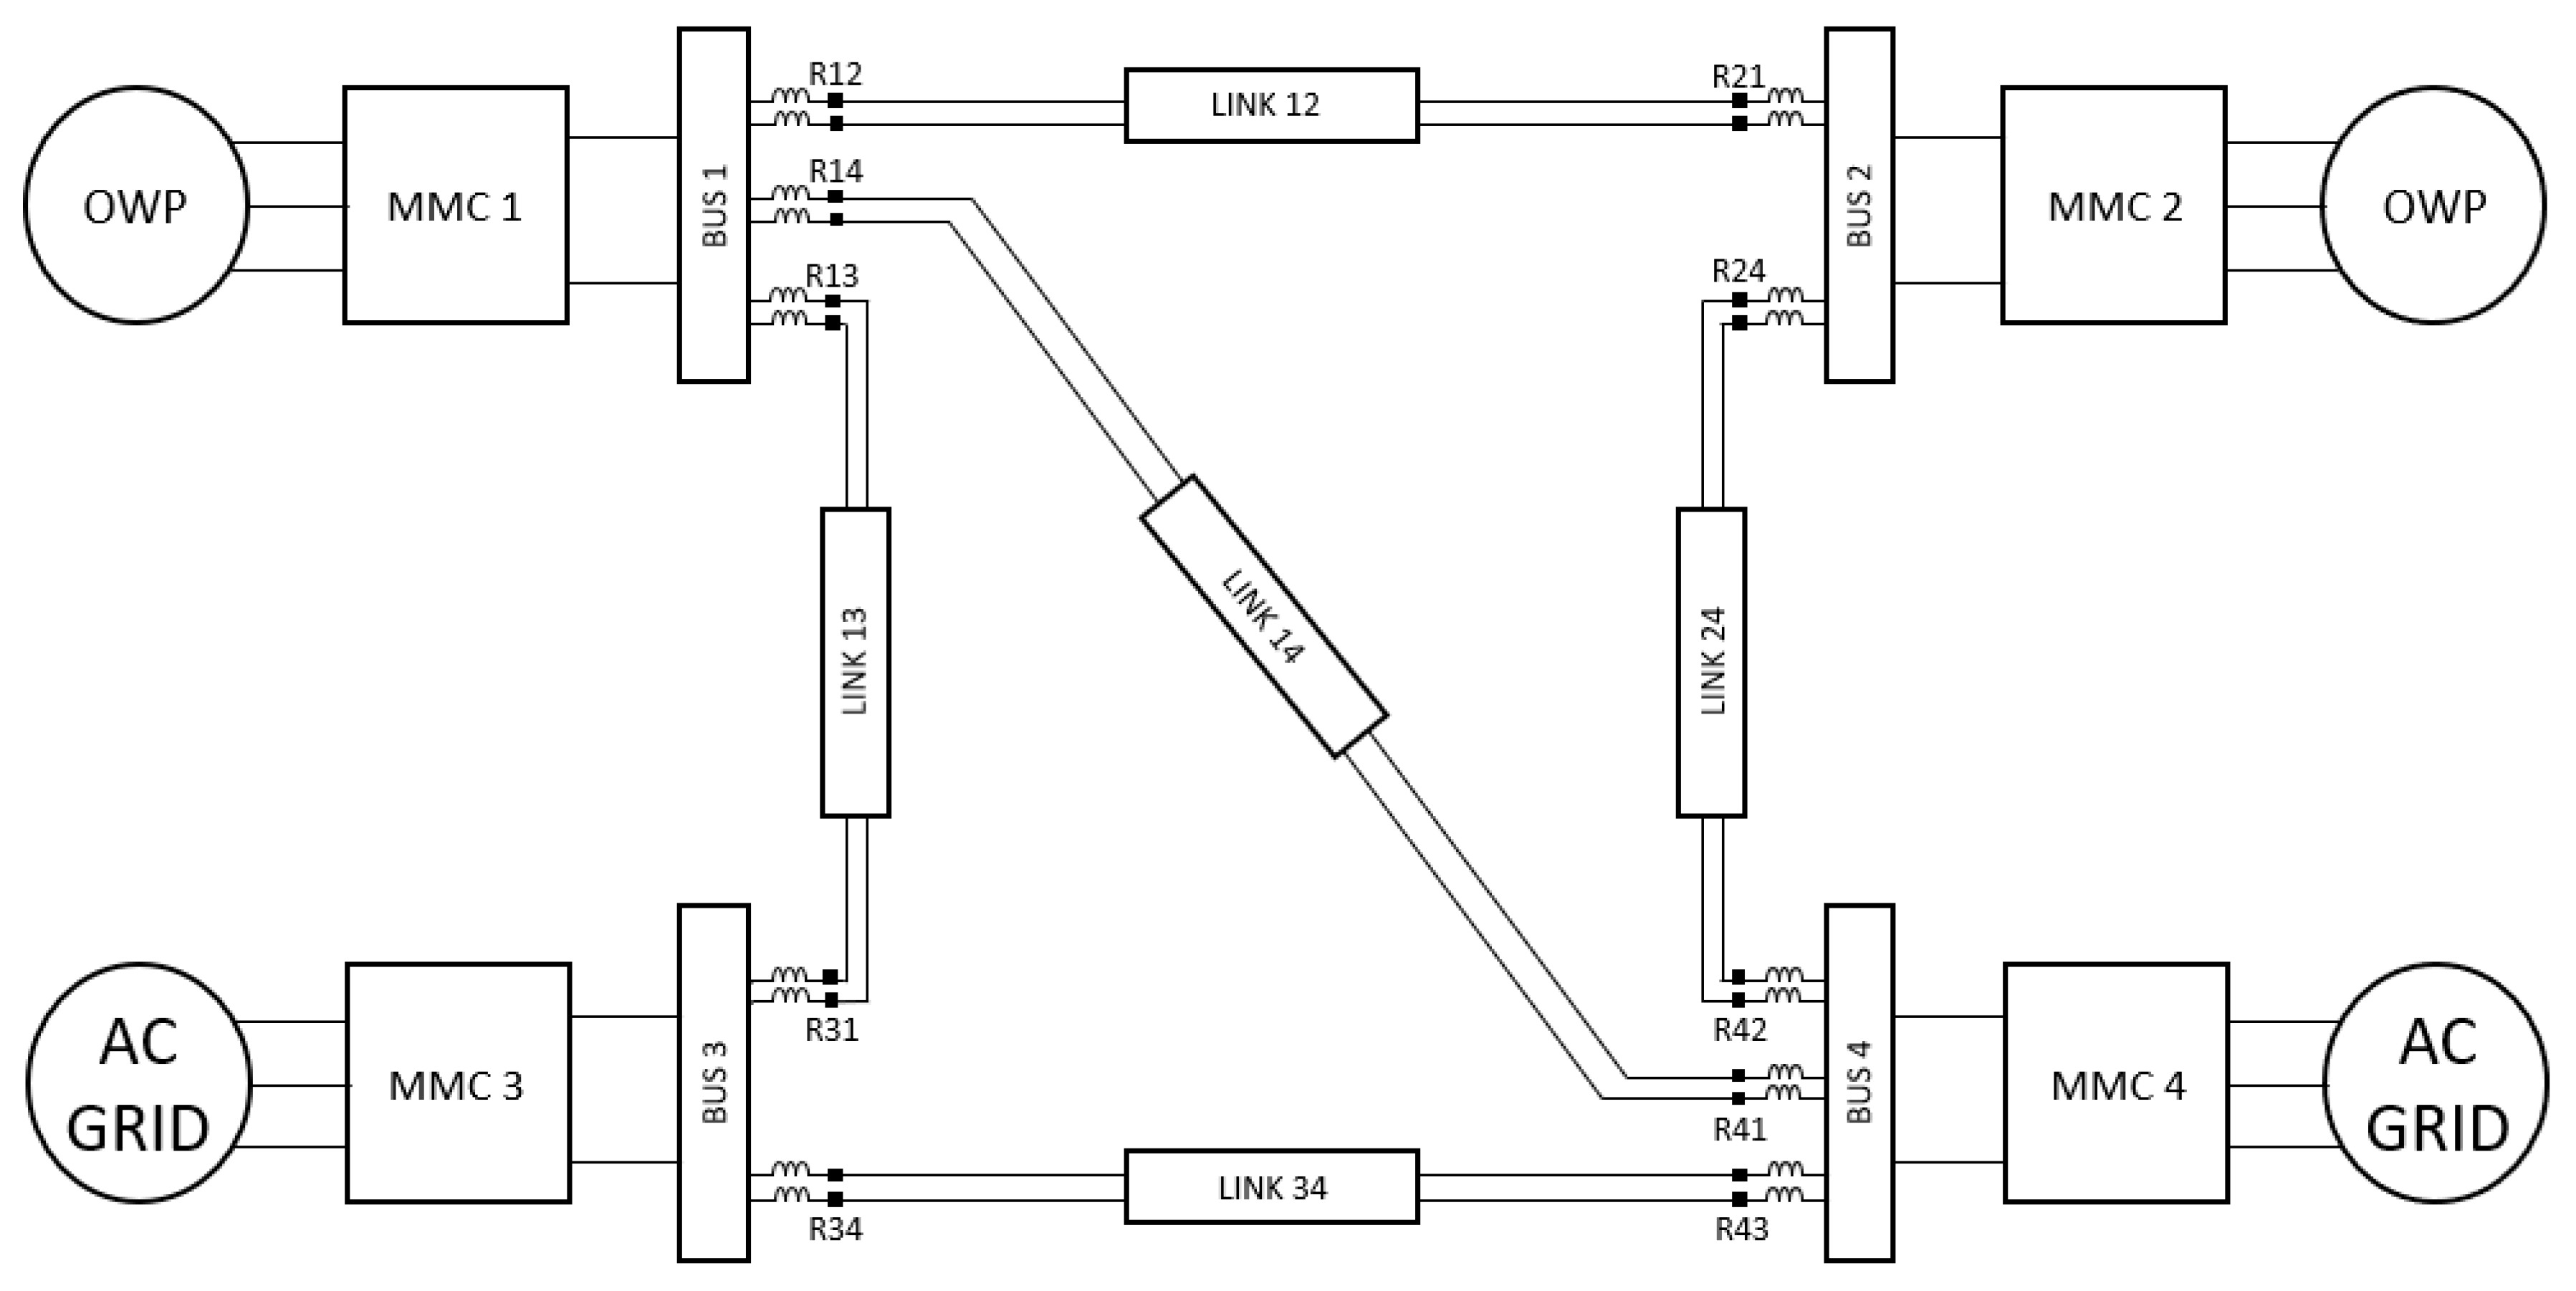
The system used for this analysis is presented in Figure 1. It is a four-terminal half-bridge modular multilevel converter (MMC) based grid with a symmetrical monopole configuration. It is modelled in PSCAD and available in [29]. The converters are interconnected through five cables, their lengths are showed in Table 1. Two of the MMCs are connected to offshore wind power plants, the other two to onshore AC grids. Converters 1, 2, and 3 have a rated capacity of 900 MVA, whilst converter 4 presents a rated power of 1200 MVA.
A full-selective strategy is adopted in this grid. HVDC hybrid CBs and inductive reactors are located in series at both ends of all cables. The operating time of the CBs is assumed to be 2 ms. The value of the inductors is selected depending on the characteristics of the grid and the protection algorithm. In the study case, a value of 150 mH has been selected for the analysis of the OC and UV algorithms and a value of 100 mH has been chosen for the ROCOC and ROCOV algorithms for selectivity purposes. This component is very important when using local measurement based algorithms since it improves its selectivity. Inductors demarcate the borders of protection zones by damping external signals. In addition, they limit the rate-of-rise-of-current allowing the use of HVDC CBs with lower current interruption capability.
Furthermore, the performance of a local algorithm is dependent on the threshold used to discriminate between external and internal faults and normal operating conditions. The value of the threshold is characteristic of the grid conditions and must be selected through simulations. Selectivity and sensitivity of the protection algorithm are affected by the selected threshold. Higher threshold values increase the selectivity and decrease the sensitivity. Thus, a trade-off value between these two requirements must be considered.
In the following subsections, the performances of these algorithms are analyzed for different fault conditions. Different pole-to-pole (PtP) and pole-to-ground (PtG) faults are considered. Only positive PtG faults have been considered since it is assumed that the algorithms will show the same behavior for negative PtG faults. Different fault conditions are simulated, varying the location and resistance of the faults.

2.1. Overcurrent Algorithm

The magnitude of the DC current in the links is measured and compared with a threshold. A fault is detected inside its protection zone if the current exceeds the threshold as in (1); where iDC is the current magnitude and Octh is the selected overcurrent threshold. The relay sends a tripping signal to its respective HVDC CB in order to clear the fault. 150 mH inductors are used to confine the protection zones and a threshold of 3 kA is used to ensure fault discrimination between internal and external faults.
i DC > OC th
The performance of the OC algorithm is analyzed varying the fault type, location and resistance.

2.1.1. Fault Location

Several 0.01 Ω PtP and PtG faults located at different points in link 13 are simulated. Values of the fault detection time, the operation time (fault detection time + operating time of the CB) and the maximum current interrupted by the respective CB are summarized in Table 2. Fault locations are related to bus 1, meaning that a 0 km fault location is a fault located close to this bus and a 200 km fault location is a fault located at the end of the cable, close to bus 3. Relay 13 is located at the beginning of the cable (bus 1) and relay 31 at the end (bus 3).
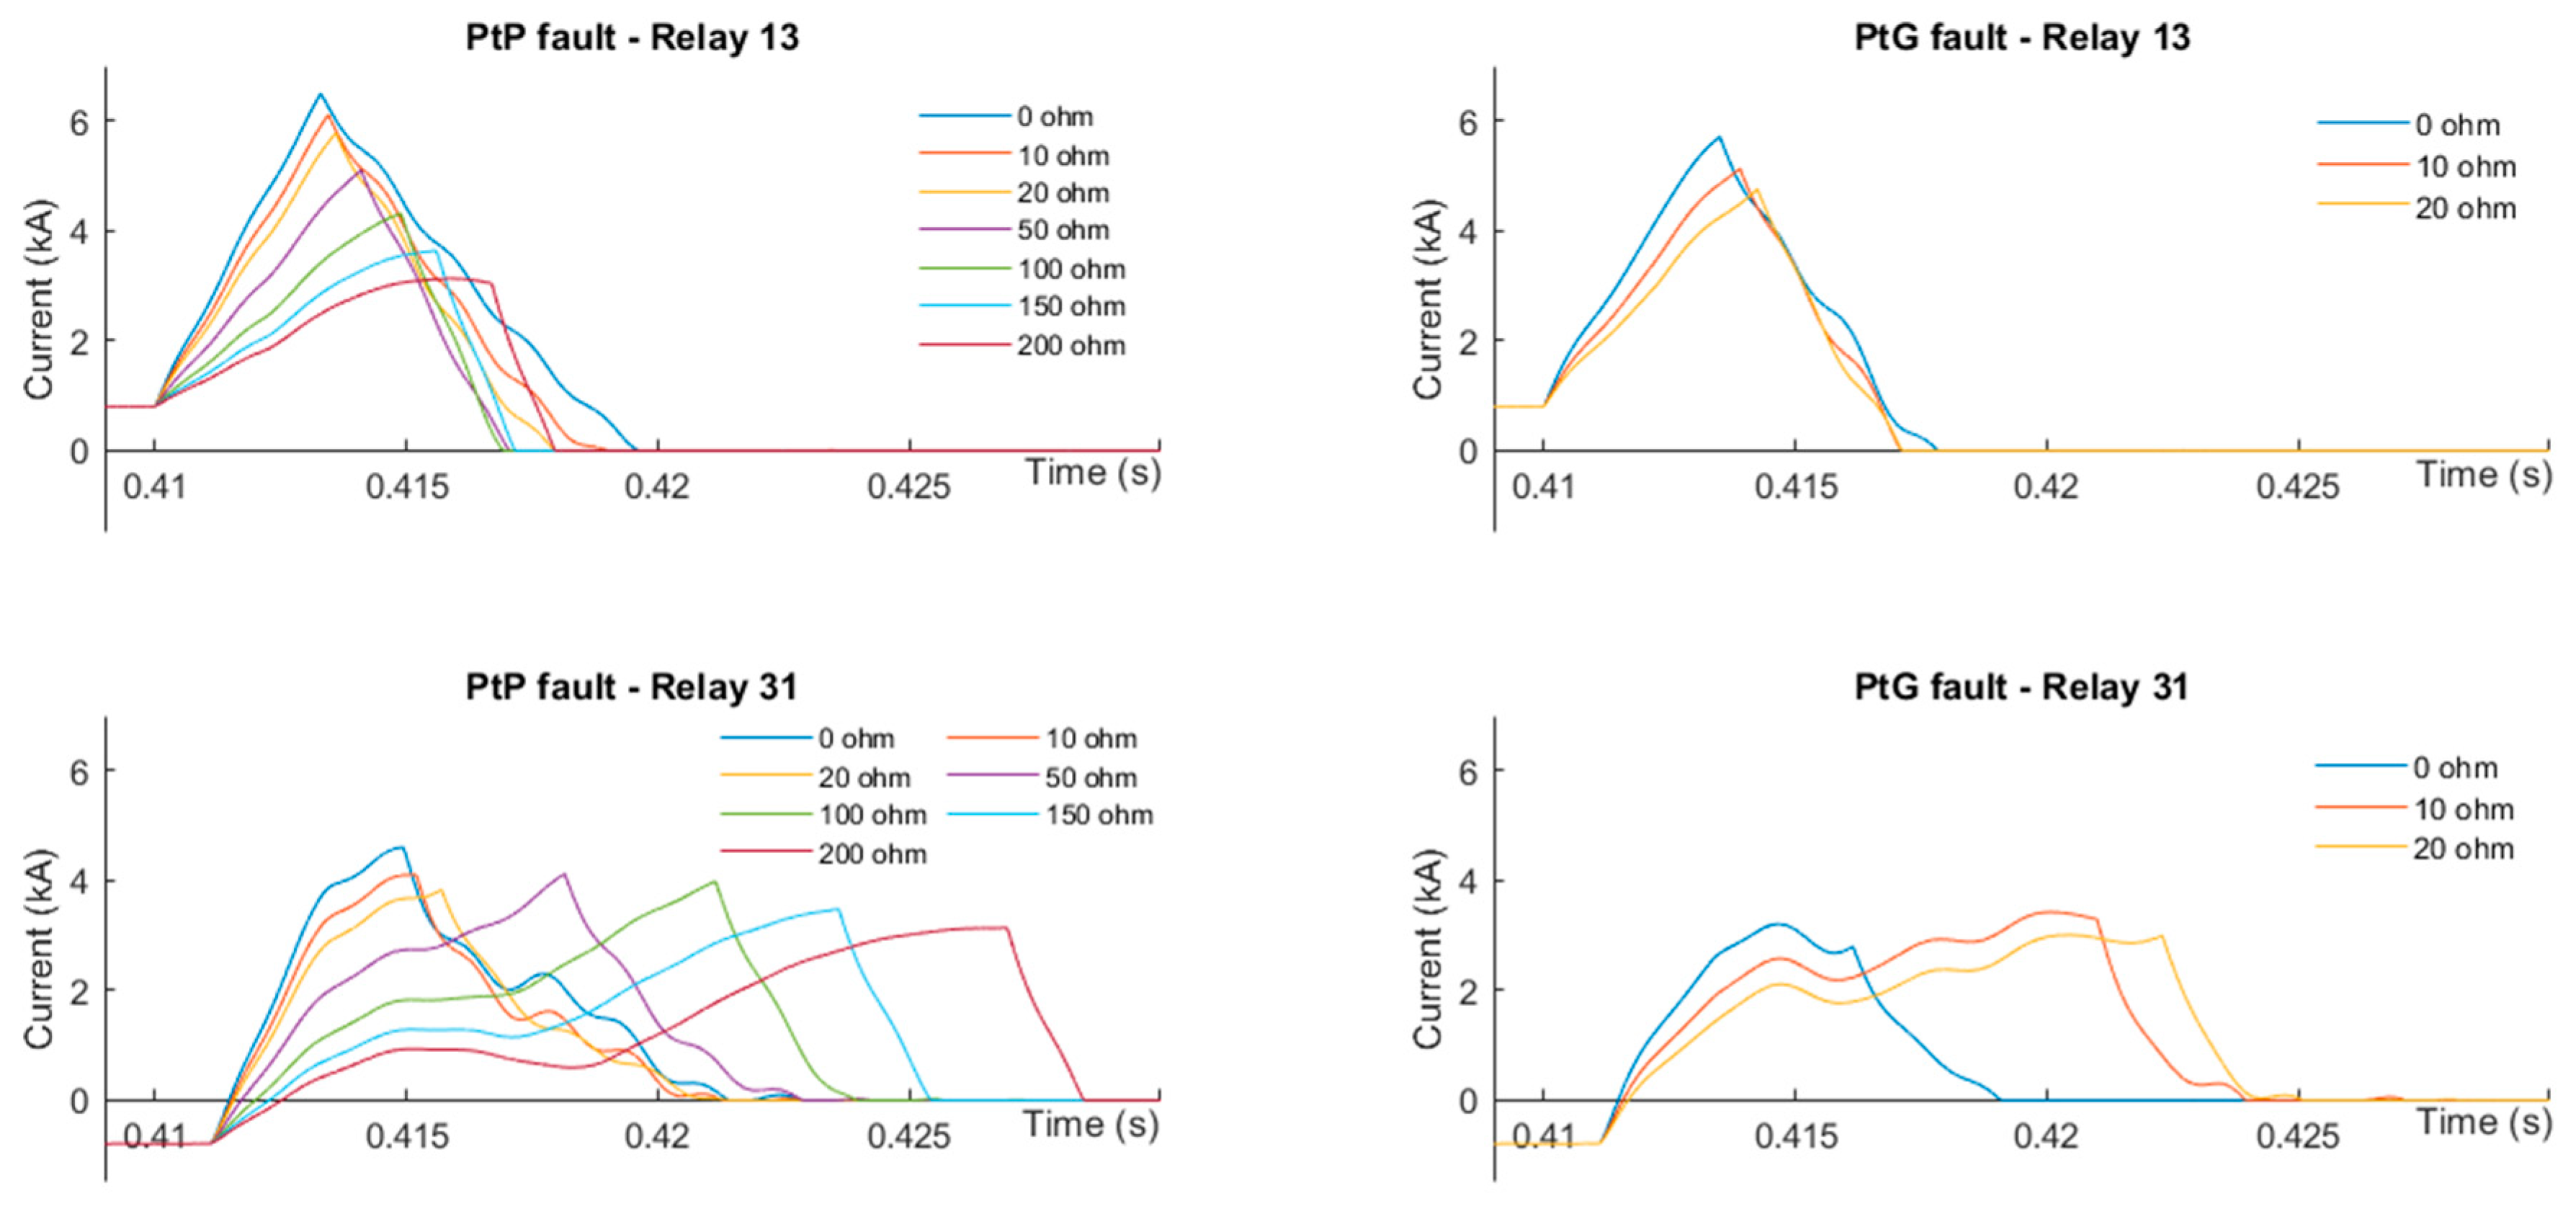
For PtP faults, relay 13 needs between 1.260 and 2.165 ms since fault inception to detect a fault, meanwhile relay 31 is slower and needs between 2.185 and 2.915 ms. Likewise, for PtG faults, the relays need between 1.460 and 2.280 ms, and 3.020 and 4.125 ms, respectively. Relay 31 is slower detecting faults since the current direction at this end of the link is reversed when a fault occurs, as it is shown in Figure 2, so the current magnitude needs more time to cross the positive OC threshold.
In both fault type cases, CB 13 has to interrupt higher values of current than CB 31, the highest being 6.500 kA for PtP fault and 5.712 kA for PtG fault versus the 6.081 kA and 4.123 kA interrupted by CB 31.

2.1.2. Fault Resistance

In this section, different PtP and PtG faults are simulated varying the fault resistance. The fault is located close to bus 1, in link 13. Fault inception is at 0.41 s.
Figure 2 shows how the current wave is affected by the fault resistance. Higher fault resistance values reduce fault currents, making them lower than the algorithm threshold. This algorithm can detect high impedance PtP faults up to 200 Ω but it is limited to 20 Ω PtG faults. Then, PtG faults are more critical since their maximum values are not as high as those of the PtP faults.

2.2. Undervoltage Algorithm

In this case, the DC voltage magnitude is measured and directly compared with a threshold as in (2); where vDC is the voltage magnitude and UVth is the selected undervoltage threshold. A fault is detected when three consecutive samples of the DC voltage drop below the threshold value. A sampling frequency of 10 kHz is used. As in the OC algorithm, 150 mH inductors are used. The fault discrimination threshold is 32 kV (0.1 p.u.).
v DC < UV th

2.2.1. Fault Location

The same 0.01 Ω PtP and PtG faults described in sub Section 2.1.1. are simulated to analyze the performance of the UV algorithm. The results of this analysis are summarized in Table 3.
Conversely to the OC algorithm case where the detection time depends on the pre-fault current direction, in the UV algorithm case, both relays need between 0.205 and 1.375 ms to detect the fault since fault inception, independently of the fault type. Similarly to the case of the OC algorithm, CB 13 interrupts higher values of current than CB 31. The maximum currents in PtP faults are higher than in PtG faults.

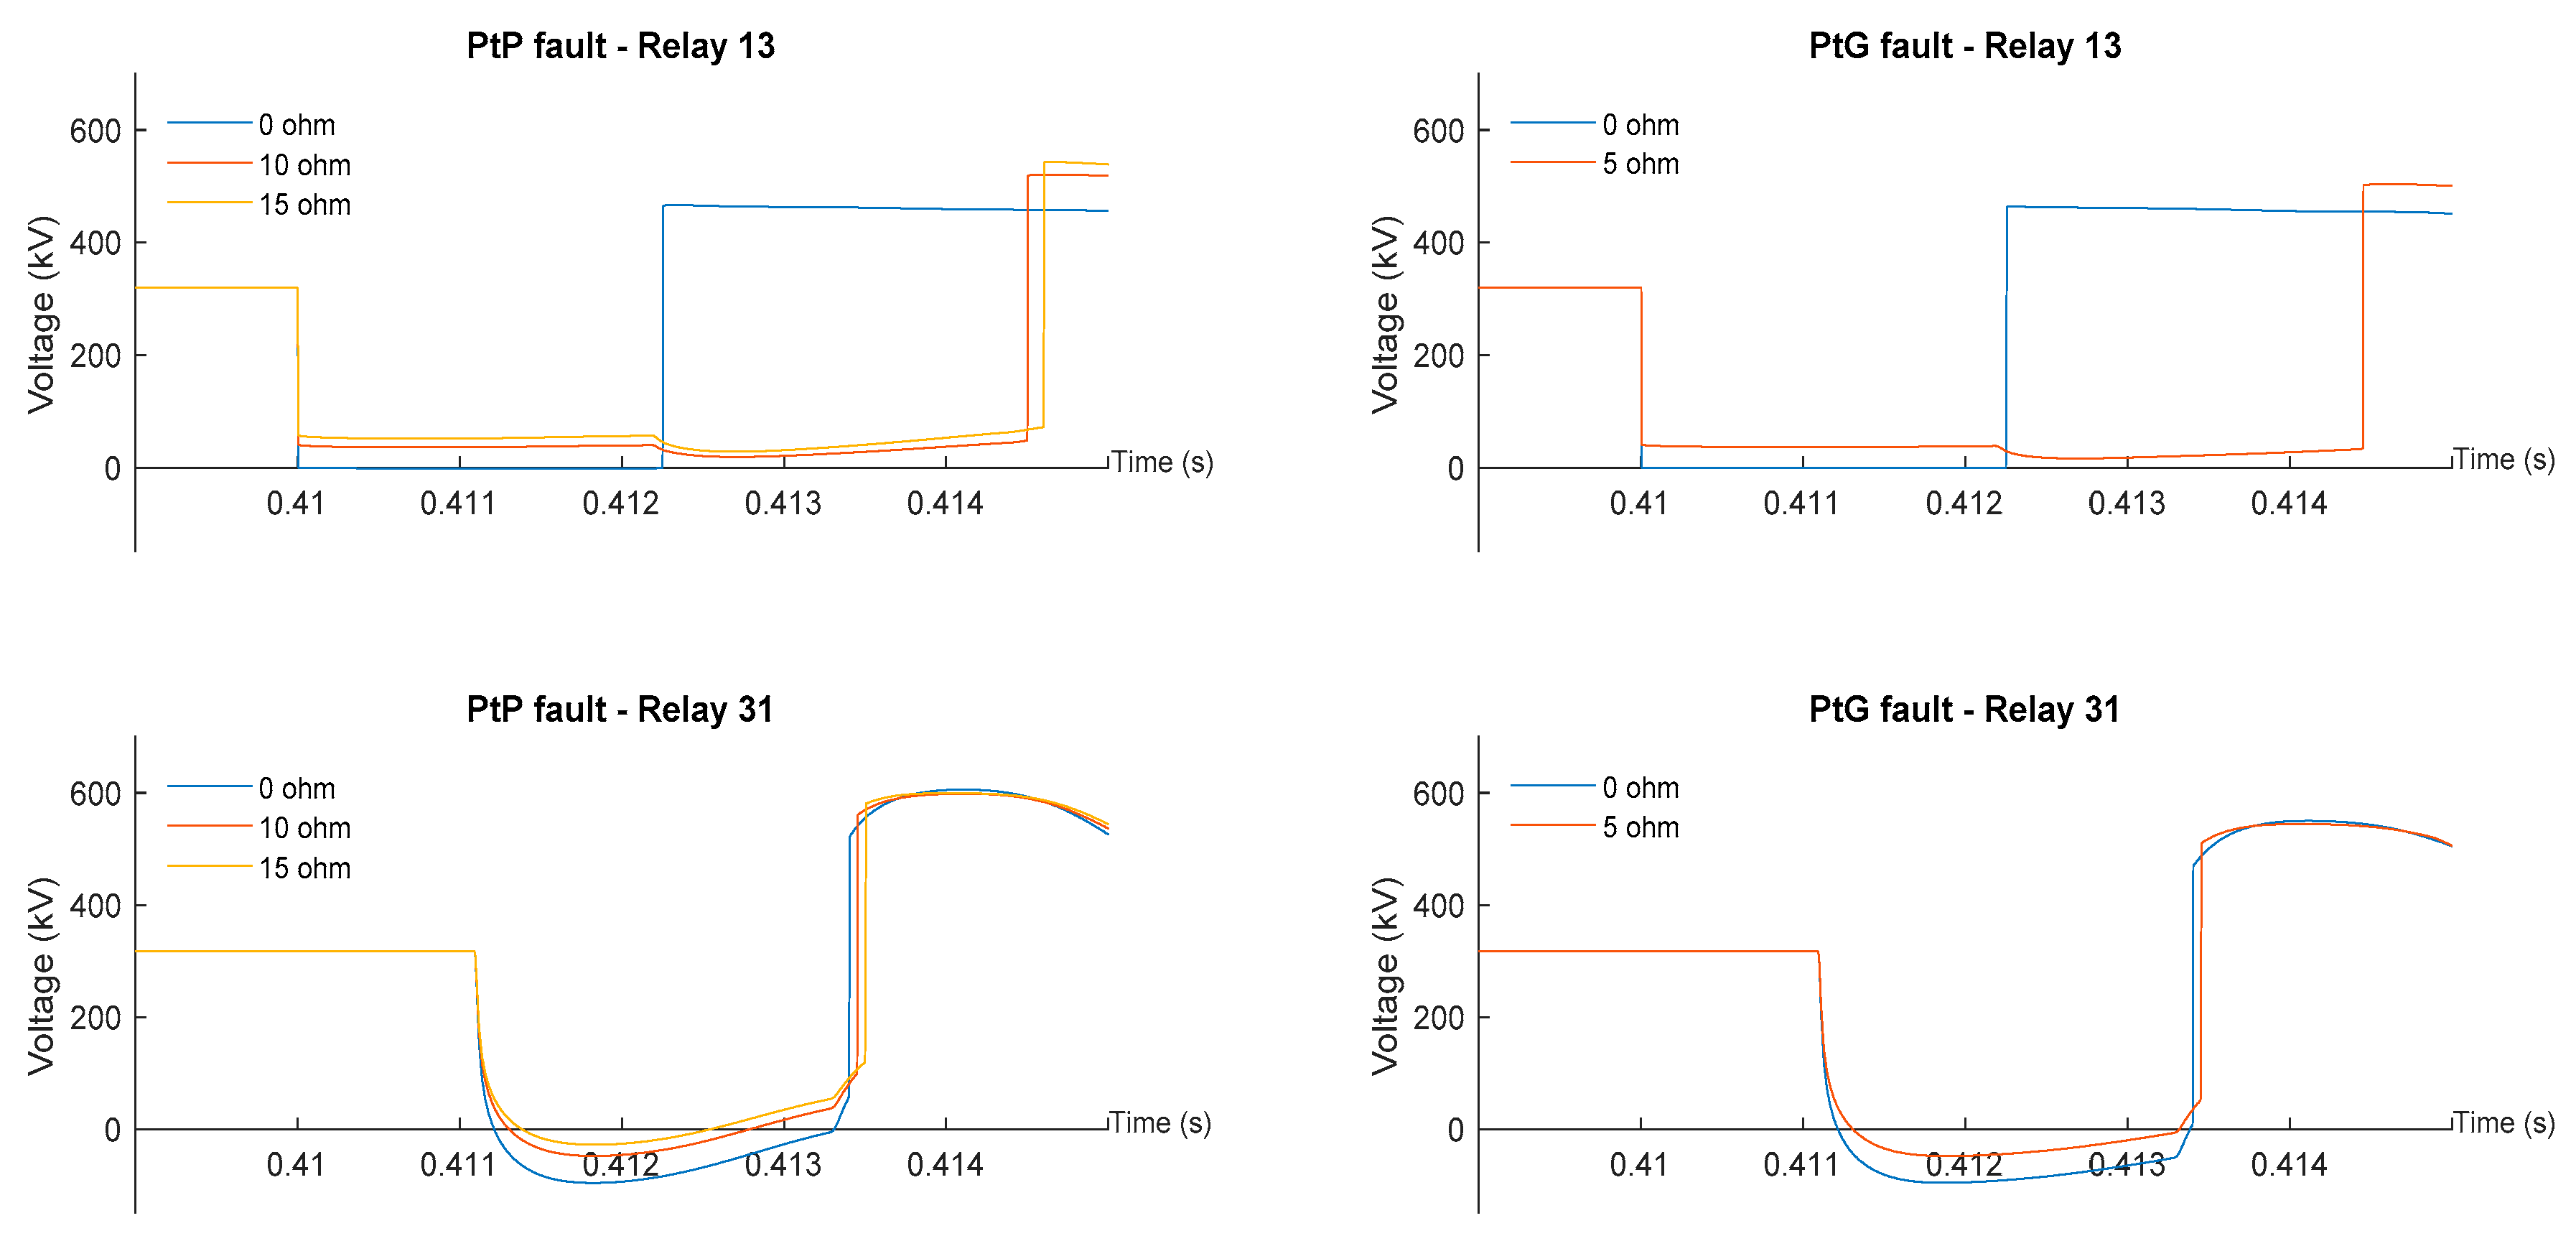
2.2.2. Fault Resistance

Figure 3 shows the influence of the variation of the fault resistance on the fault-induced voltage drop at both ends of the link. The fault is located in link 13, close to bus 1. Fault inception is at 0.41 s. This algorithm is more problematic on high impedance fault conditions since the minimum value of the voltage drop is severely affected by the fault resistance. The voltage drop might not cross the threshold and it might be interpreted as an external fault. The fault detection is limited to 15 Ω in PtP faults and 5 Ω in PtG faults. In this case, the UV algorithm sensitivity to high impedance faults is worse than the OC algorithm sensitivity.

2.3. ROCOC Algorithm

DC current derivative is calculated in (3) and its value is compared with a threshold. Similarly to the overcurrent method, when the ROCOC value exceeds the threshold as in (4), a fault is detected and a tripping signal is sent to the CB in order to clear the fault. In (3) and (4), ROCOC is the calculated current derivative, I1 is the current magnitude at time t1, I2 is the current magnitude at time t2, being t2 greater than t1, and ROCOVth is the selected ROCOV threshold.
ROCOC = Δ I Δ t = I 2 I 1 t 2 t 1
ROCOC > ROCOC th
The ROCOC values are calculated every 0.1 ms (sampling frequency of 10 kHz). To enable fault discrimination, a threshold of 3000 kA/s and 100 mH inductors are selected.

2.3.1. Fault Location

Again, different 0.01 Ω PtP and PtG fault conditions are simulated varying their location through link 13 to analyze the performance of the ROCOC algorithm.
As it can be seen in Table 4, both relays need between 0.095 and 1.250 ms to detect a fault since fault inception independently of its type. CB 13 interrupts a maximum current of 6.373 kA for PtP faults and 5.848 kA for PtG faults versus the 4.803 kA and 3.532 kA interrupted by CB 31.

2.3.2. Fault Resistance

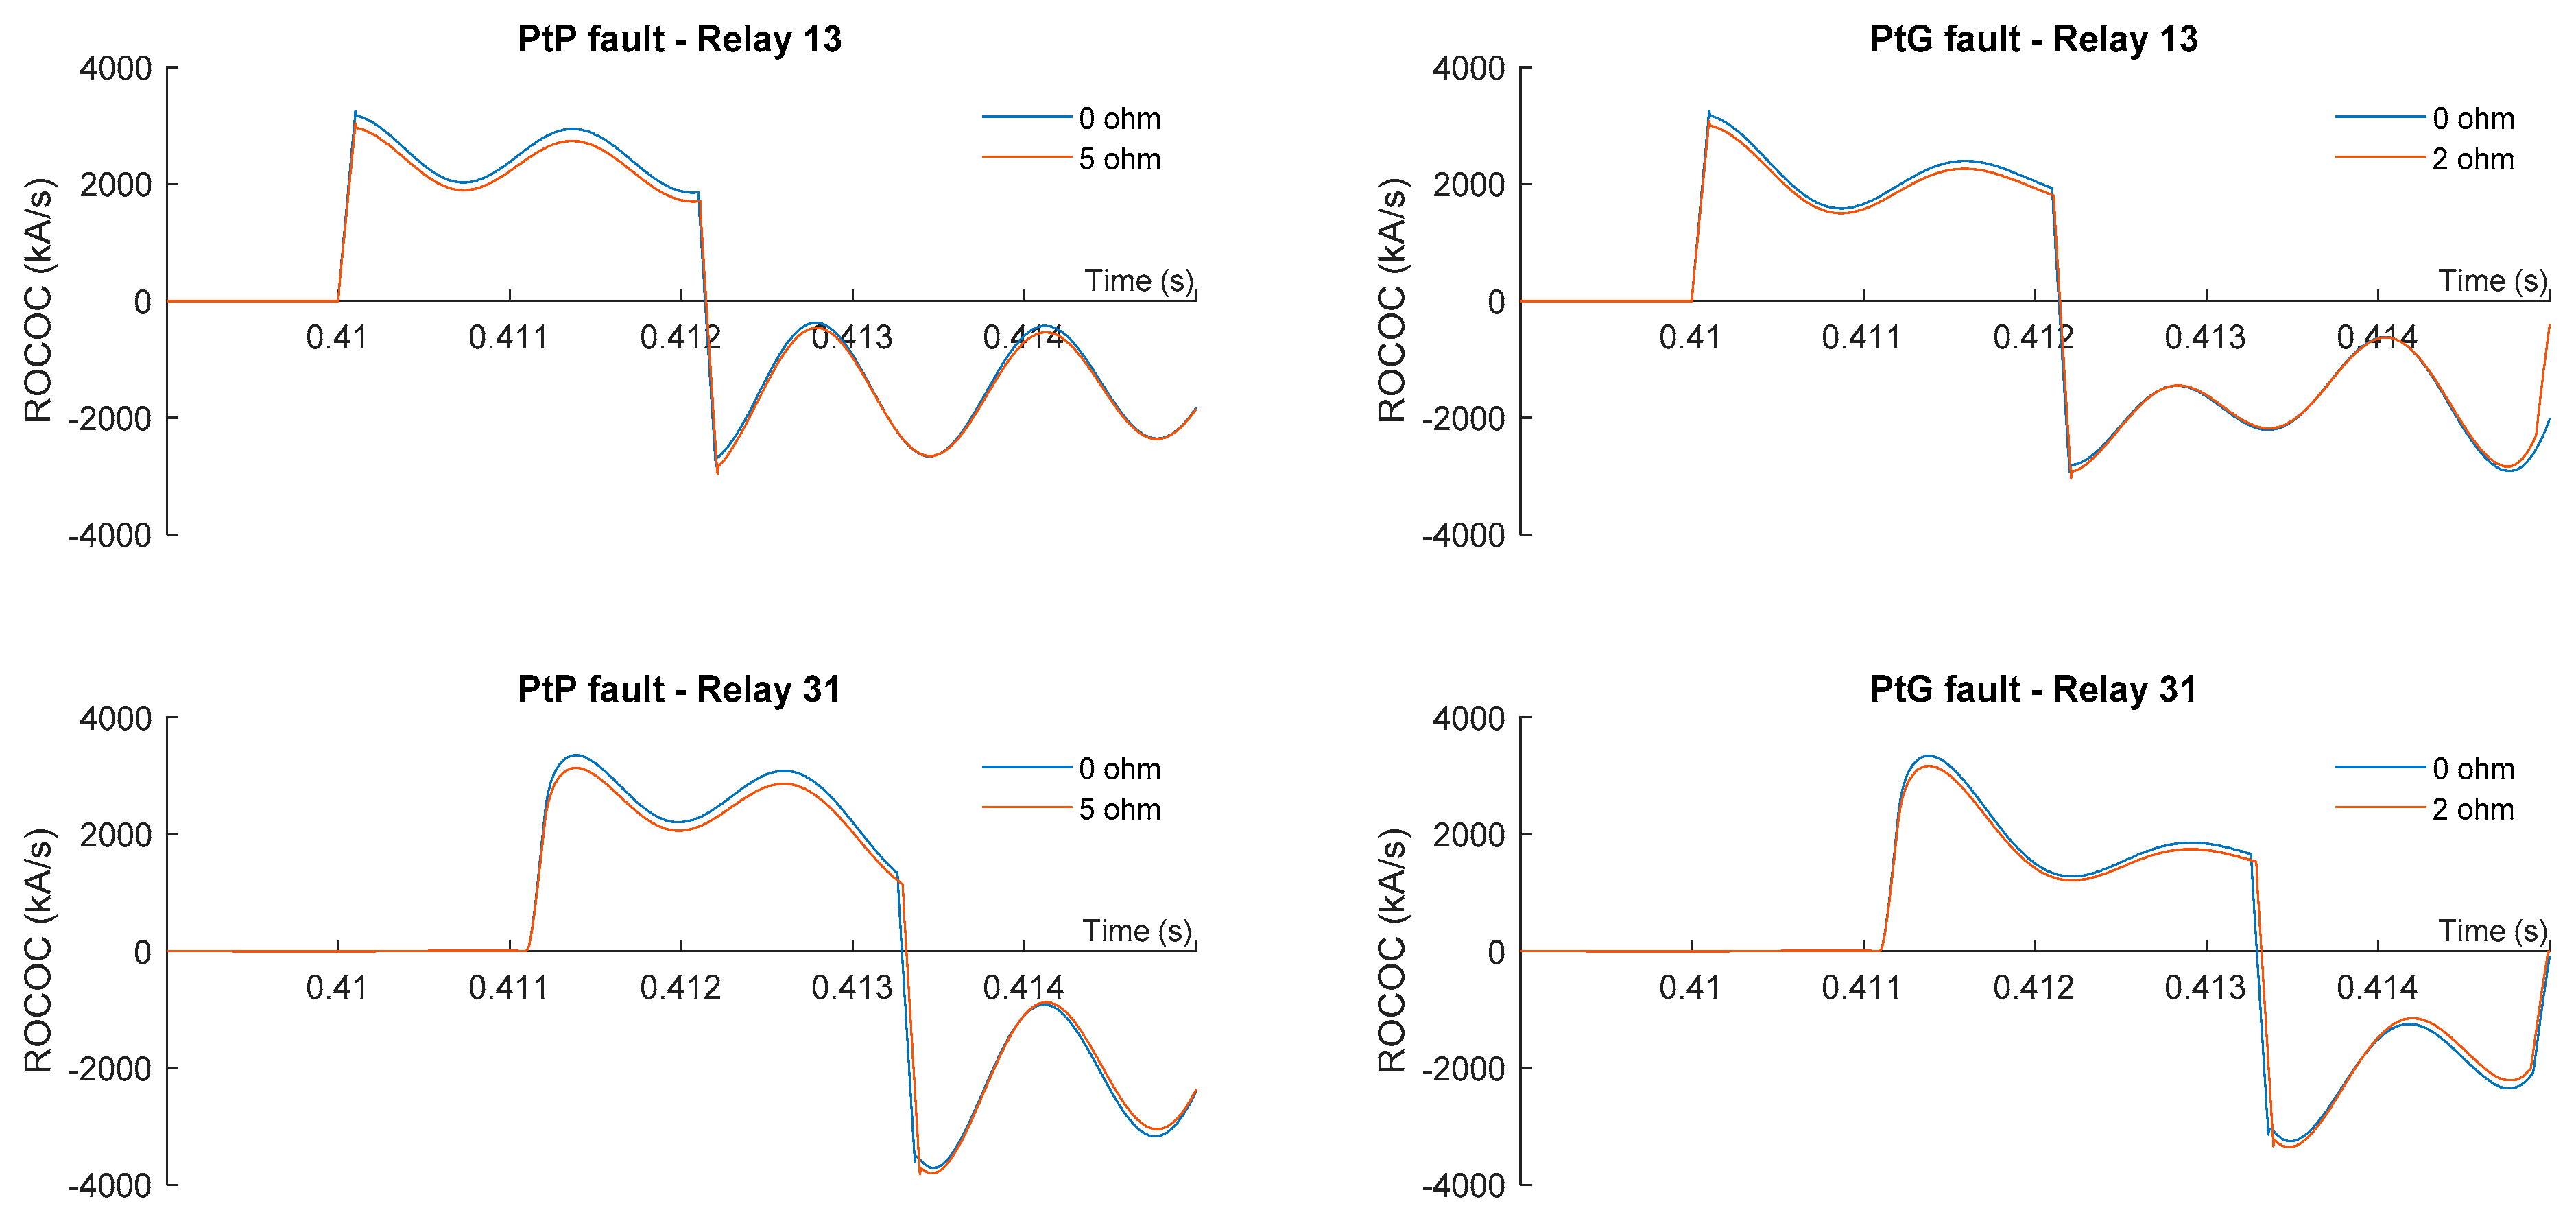
As in the two previous cases, the fault is located in link 13, close to bus 1. Both PtP and PtG faults with different fault resistances are simulated. Fault inception is at 0.41 s. The value of the calculated ROCOC for different fault conditions at both ends of the link is shown in Figure 4.
The sensitivity of the ROCOC algorithm to fault impedance is not high enough. It is limited to 2 Ω PtG faults and 5 Ω PtP faults. This incapability of detecting higher impedance faults is due to the selected threshold. Therefore, a threshold lower than 3000 kA/s should be selected for high impedance faults. Nevertheless, this solution is not recommended since the algorithm selectivity would be affected and external faults might be interpreted as internal faults.

2.3.3. Fault Type Identification

A new fault type identification algorithm is proposed in this paper using the characteristics of the rate-of-change-of-current during fault conditions. When an internal fault occurs, regardless of the fault type, the sign of the first peak of the ROCOC is always positive for the positive pole and negative for the negative pole. This criterion is not satisfied during external faults.
To discriminate between PtP and PtG faults additional criteria are proposed:
  • PtP fault: the ROCOC of both poles exceeds their respective thresholds, as in (5).
    ROCOC p > ROCOC th   &   ROCOC n > ROCOC th     PtP   fault
  • Positive PtG fault: only the positive pole ROCOC exceeds its threshold, as in (6).
    ROCOC p > ROCOC th   &   ROCOC n < ROCOC th     Positive   PtG   fault
  • Negative PtG fault: only the negative pole ROCOC exceeds its threshold, as in (7).
    ROCOC p < ROCOC th   &   ROCOC n > ROCOC th     Negative   PtG   fault
In (5)–(7), ROCOCp is the current derivative in the positive pole, ROCOCn is the current derivative in the negative pole and ROCOCth is the selected ROCOC threshold.
All simulated fault type cases are correctly identified within 1.3 ms since fault inception, as it can be seen in Table 5. Both PtP and PtG faults are identified almost immediately after fault detection, between 5 and 10 μs later.

2.4. ROCOV Algorithm

DC voltage derivative is calculated in (8). An internal fault is detected when its value drops below a certain threshold as in (9). In (8) and (9), ROCOV is the calculated voltage derivative, V1 is the voltage magnitude at time t1, V2 is the voltage magnitude at time t2, being t2 greater than t1, and ROCOVth is the selected ROCOV threshold.
ROCOV = Δ V Δ t = V 2 V 1 t 2 t 1
ROCOV < ROCOV th
The sampling frequency of the measurements is 10 kHz. A threshold of −0.2 MV/ms and 100 mH inductors are selected for fault discrimination purposes. This algorithm is very fast since the rate-of-change-of-voltage presents very high values due to the extremely sharp and almost instantaneous voltage drop during fault conditions.

2.4.1. Fault Location

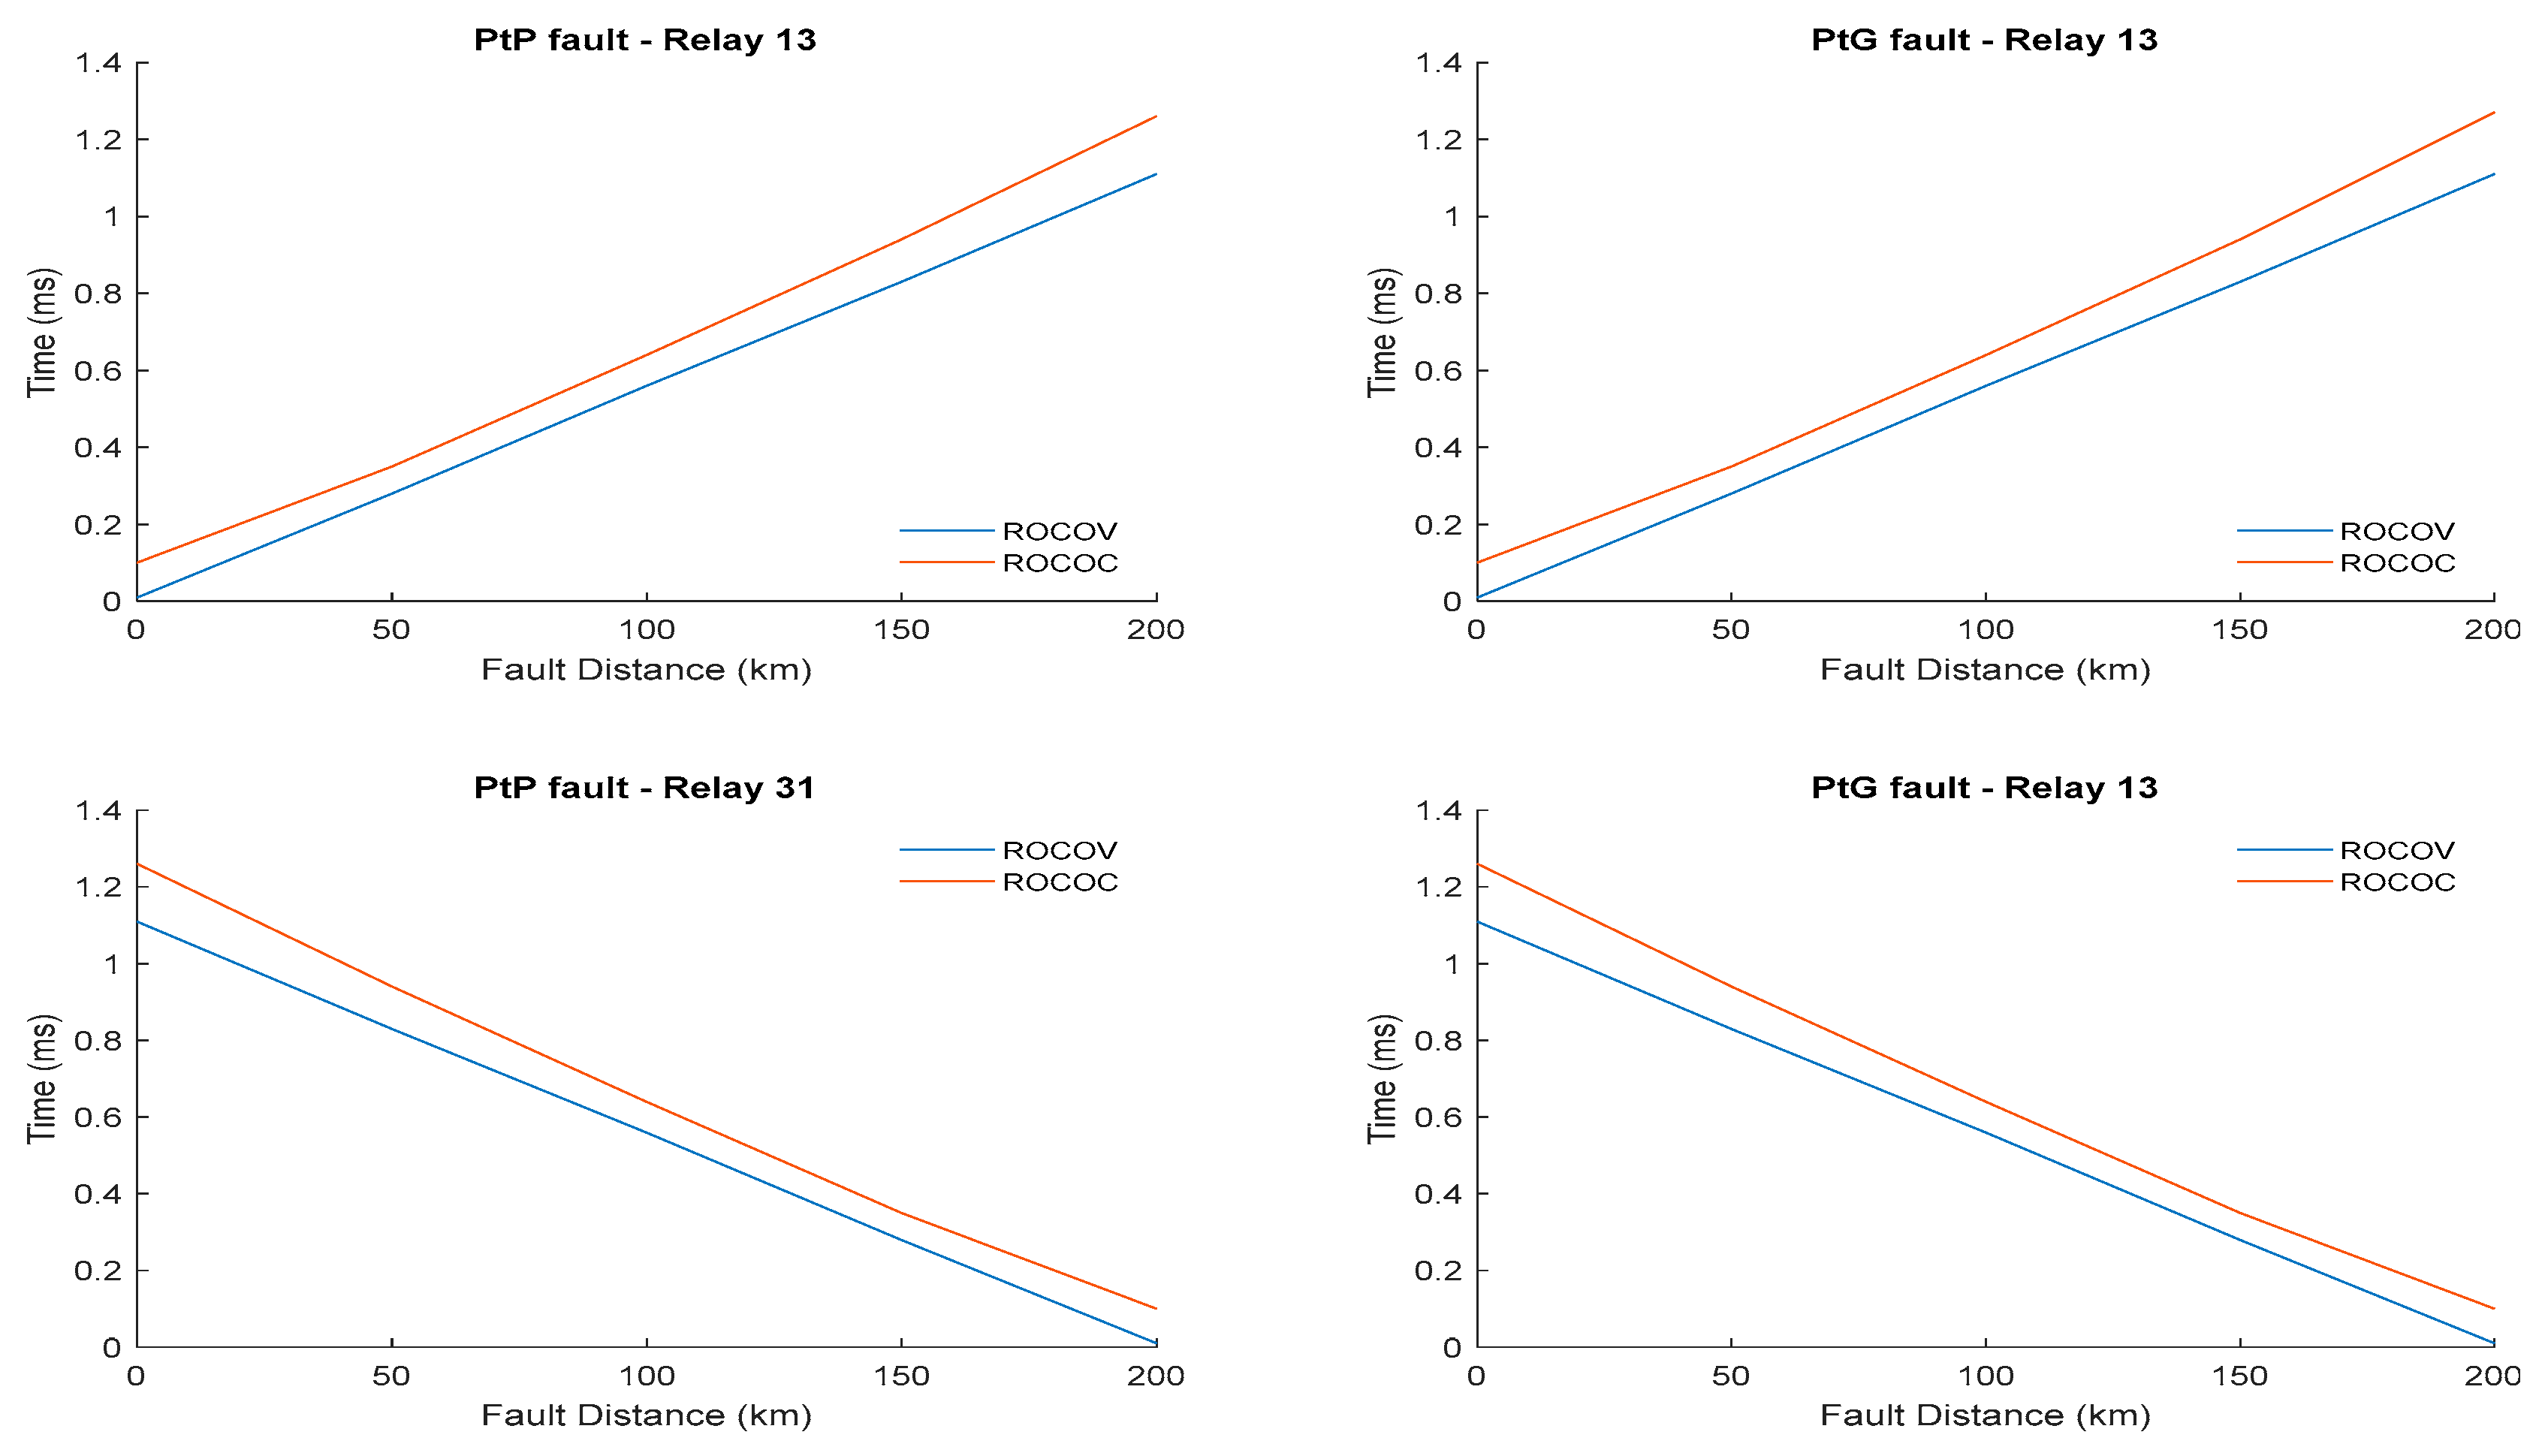
In this subsection, the influence of the fault location on the ROCOV performance is analyzed. Several 0.01 Ω PtP and PtG faults at different locations in link 13 are simulated. The analysis of the ROCOV algorithm performance is summarized in Table 6. Independently of the fault type, both relays need between 0.005 ms and 1.100 ms since fault inception to detect the faults. Once again, CB 13 interrupts higher values of current than CB 31 and these currents are higher in PtP fault conditions than in PtG fault conditions (6.167 kA and 5.590 kA versus 4.591 kA and 3.280 kA).

2.4.2. Fault Resistance

The performance of the ROCOV algorithm against higher fault impedance values is tested simulating different PtP and PtG faults. Fault point is located in link 13, close to bus 1.
Even when the value of the DC voltage is severely affected by the fault resistance (as analyzed in Section 3.2.), the voltage drop remains sharp and almost instantaneous, as it is shown in Figure 5. Due to this, very high values of ROCOV appear and the faults can still be detected as it is shown in Figure 6. ROCOV algorithm shows great performance detecting high impedance faults. It can detect faults with resistances as high as 750 Ω in the case of PtP faults and as high as 400 Ω in the case of PtG faults.

2.4.3. Fault Type Identification

Similarly to the analysis done for the ROCOC algorithm, using the characteristics of the rate of change of voltage during fault conditions, a new fault type identification algorithm is proposed in the paper. The following criteria are proposed to discriminate between pole-to-pole (PtP) and pole-to-ground (PtG) faults:
  • PtP fault: the ROCOV of both poles exceeds their respective thresholds, as in (10).
    ROCOV p < ROCOV th   &   ROCOV n < ROCOV th     PtP   fault
  • Positive PtG fault: only the positive pole ROCOV exceeds its threshold, as in (11).
    ROCOV p < ROCOV th   &   ROCOV n > ROCOV th     Positive   PtG   fault
  • Negative PtG fault: only the negative pole ROCOV exceeds its threshold, as in (12).
    ROCOV p > ROCOV th   &   ROCOV n < ROCOV th     Negative   PtG   fault
In (10)–(12), ROCOVp is the voltage derivative in the positive pole, ROCOVn is the voltage derivative in the negative pole and ROCOVth is the ROCOV threshold.
All simulated fault type cases are correctly identified within 1.2 ms since fault inception, as it can be seen in Table 7. In this case, the time difference between fault detection and type identification is between 5 and 10 μs.

3. Discussion

In this section, the performance of the different algorithms is compared regarding fault detection time, maximum interrupted current, and fault identification time.

3.1. Fault Detection Time

Figure 7 summarizes the data from the tables presented in previous sections. It can be extracted that, in terms of fault detection speed, OC is the slowest algorithm, being the ROCOV algorithm the fastest one followed by the ROCOC and UV algorithms. The margin between the latter three algorithms is relatively small (in the range of 100 µs). Moreover, the fault detection time is proportional to the fault distance to the relay for all algorithms but the OC one. In that case, the current direction reversal affects the detection time.

3.2. Maximum Interrupted Current

In accordance with the results of the simulations presented in previous tables, circuit breakers need to interrupt the highest values of current when the OC algorithm is used. The lowest values are presented when the UV algorithm is used. Nevertheless, this fact is influenced by the inductor, as different values have been selected. This way, the ROCOV and ROCOC algorithms are using 100 mH inductors instead of the 150 mH ones used in the cases of the OC and UV algorithms. The current is not as damped so their CBs have to deal with higher values of current in some cases even though they are faster detecting faults, as Figure 8 shows.

3.3. Fault Identification Time

As it can be seen from the results presented in Table 5 and Table 7, both ROCOC and ROCOV based algorithms present a fault type identification time between 5 and 10 μs after fault detection.
Given that both fault type identification algorithms start after a fault is detected, their response time is limited by the detection time. Then, since the ROCOV fault detection algorithm is faster than the ROCOC one, its fault identification algorithm is also faster, as it can be seen in Figure 9. The faster operation of the ROCOV based algorithm is due to the sharp voltage drop during fault conditions; the ROCOV increases almost instantaneously to a very high value. Meanwhile, the current rises fast but not as sharply as the voltage drop. In addition, since the detection time depends on the fault distance, the faulty type identification time is also dependent on the fault distance. The operation time of the fault type identification algorithms, as well as the operation time of the fault detection algorithm, increases linearly with the fault distance, as it can be seen in Figure 9, since the fault-induced travelling wave has to cover the distance between the fault point and the location of the relay.

3.4. Comparison with Other Methods

Finally, a comparison between different local measurement based algorithms found in the literature and the algorithms that have been analyzed on this paper is shown in Table 8. The type of configuration, converter and breaker device employed in each system are also listed. In addition, the size of the limiting inductor and the operation time of all protection systems are indicated. The operation time comprises the time needed for the algorithm to detect the fault and the operating time of the used breaker device. From the comparison, it can be extracted that the operation times of the proposed algorithms are similar to those algorithms found in the literature. In addition, it can be noted that the circuit breaker type most commonly used in the literature under analysis corresponds to hybrid HVDC CBs and the size of the limiting reactors is usually set around 100 mH.

4. Conclusions

In this paper, protection systems for multi-terminal VSC-HVDC systems have been addressed. The characteristics and classification of algorithms into local measurement based and communication based have been overviewed. Communication based algorithms offer great selectivity but they are relatively slow due to communication time delay, whilst local measurements based algorithms are very fast detecting faults but they lack selectivity. The most common types of local measurement based algorithms are overcurrent, undervoltage, rate-of-change-of-current and rate-of-change-of-voltage algorithms. Several application cases of these algorithms as found in the literature have been reviewed in the present work. The paper emphasizes the use of local measurement based algorithms and highlights the importance of the selected fault clearing strategy, as well as inductors and thresholds.
The paper considers four local measurement-based algorithms and applies them to a four-terminal symmetric monopole half-bridge MMC grid in order to analyze and compare their behavior with different fault types, fault locations, and fault resistances. The considered algorithms are overcurrent, undervoltage, rate-of-change-of-current, and rate-of-change-of-voltage. In addition, two new fault type identification algorithms based on the characteristics of the ROCOC and ROCOV have been proposed in the paper.
From the results presented in Section 3, it can be determined that voltage based algorithms are faster than current based ones. This can be attributed to the sharp voltage drop when a fault occurs inside the protection zone, whilst inductors limit the rate-of-rise-of-current. Likewise, those algorithms using derivatives rather than magnitudes are considerably faster detecting faults; especially if compared with the OC algorithm. Moreover, fault type identification is faster using the characteristics of ROCOV rather than ROCOC, given that fault detection based on ROCOV is faster. Under high impedance fault conditions, ROCOV algorithm shows the best performance in fault detection and discrimination, followed by the OC algorithm. Though the voltage drop is not very large, it is still sharp. Therefore, ROCOV values are still high and high impedance faults can be correctly detected (Figure 5). ROCOV algorithm performance is barely affected by the fault resistance.
Furthermore, regarding OC algorithm, the CBs need to interrupt higher levels of current than using the UV, ROCOC, or ROCOV algorithm. Nevertheless, the derivative based algorithms have to deal with relatively higher levels of current in some cases, as they are using smaller inductors.
Also, it can be concluded that inductors are essential for the limitation of protection zones and the value of the threshold is very important to enable fault discrimination.
As a result of the work presented in this paper, the use of combined protection algorithms can be recommended, instead of using one single algorithm. This way, the performance of the protection system will be improved; and it will benefit from their combined characteristics and advantages. In addition, the combined action of several algorithms will provide backup in case of fault detection failure. However, correct threshold values and inductor sizes should be selected for this purpose.
Finally, a comparison of the main features of the reviewed OC, UV, ROCOV, and ROCOC algorithms found in the literature and the algorithms analyzed in this paper has been summarized in the present paper. The analysis shows that the algorithms analyzed in this paper present similar operation times to those algorithms reviewed in the literature.

Author Contributions

Conceptualization, methodology, and writing—review and editing: M.J.P.M., D.M.L., P.E.L., and A.E.; Supervision: D.M.L., P.E.L., and A.E.; Funding acquisition: D.M.L. and P.E.L.; and Software, validation, formal analysis, investigation, data curation, writing—original draft preparation, visualization, and project administration: M.J.P.M.

Funding

This research was funded by the Spanish Ministry of Economy, Industry and Competitiveness (project ENE2016-79145-R AEI/FEDER, UE), the Basque Government (GISEL research group IT1191-19) and the UPV/EHU (GISEL research group 181/18).

Conflicts of Interest

The authors declare no conflict of interest. The funders had no role in the design of the study; in the collection, analyses, or interpretation of data; in the writing of the manuscript, or in the decision to publish the results.

References

  1. Heyman:, O.; Sweden, A.; Weimers, L. HVDC-A Key Solution in Future Transmission Systems. 2010. Available online: https://www.researchgate.net/publication/229000667_HVDC-A_key_solution_in_future_transmission_systems (accessed on 16 December 2019).
  2. Farhadi, M.; Mohammed, O.A. Protection of multi-terminal and distributed DC systems: Design challenges and techniques. Electr. Power Syst. Res. 2017, 143, 715–727. [Google Scholar] [CrossRef]
  3. le Blond, S.; Bertho, R.; Coury, D.V.; Vieira, J.C.M. Design of protection schemes for multi-terminal HVDC systems. Renew. Sustain. Energy Rev. 2016, 56, 965–974. [Google Scholar] [CrossRef]
  4. Shang, L.; Liang, W. The review of high voltage DC transmission lines fault location. Int. J. Comput. Consum. Control. (IJ3C) 2014, 3, 21–28. [Google Scholar]
  5. Jovcic, D. High Voltage Direct Current Transmission: Converters, Systems and DC Grids, 2nd ed.; John Wiley & Sons: Hoboken, NJ, USA, 2019. [Google Scholar]
  6. Weimers, L. Bulk Power Transmission at Extra High Voltages, a Comparison between Transmission Lines for HVDC at Voltages above 600 kV DC and 800 kV AC. 2011. Available online: https://www.researchgate.net/publication/228789513_Bulk_power_transmission_at_extra_high_voltages_a_comparison_between_transmission_lines_for_HVDC_at_voltages_above_600_kV_DC_and_800_kV_AC (accessed on 16 December 2019).
  7. Gemmell, B.; Dorn, J.; Retzmann, D.; Soerangr, D. Prospects of multilevel VSC technologies for power transmission. In Proceedings of the 2008 IEEE/PES Transmission and Distribution Conference and Exposition, Chicago, IL, USA, 21–24 April 2008; pp. 1–16. [Google Scholar] [CrossRef]
  8. Abbas, A.M.; Lehn, P.W. PWM based VSC-HVDC systems—A review. In Proceedings of the 2009 IEEE Power & Energy Society General Meeting, Calgary, AB, Canada, 26–30 July 2009; pp. 1–9. [Google Scholar] [CrossRef]
  9. Chen, H. Research on the control strategy of VSC based HVDC system supplying passive network. In Proceedings of the 2009 IEEE Power & Energy Society General Meeting, Calgary, AB, Canada, 26–30 July 2009; pp. 1–4. [Google Scholar] [CrossRef]
  10. Davidson, C.C.; de Preville, G. The future of high power electronics in Transmission and Distribution power systems. In Proceedings of the 2009 13th European Conference on Power Electronics and Applications, Barcelona, Spain, 8–10 September 2009; pp. 1–14. [Google Scholar]
  11. Schettler, F.; Huang, H.; Christl, N. HVDC transmission systems using voltage sourced converters design and applications. In Proceedings of the Power Engineering Society Summer Meeting, Seattle, WA, USA, 16–20 July 2000; Volume 2, pp. 715–720. [Google Scholar] [CrossRef]
  12. Candelaria, J.; Park, J. VSC-HVDC system protection: A review of current methods. In Proceedings of the 2011 IEEE/PES Power Systems Conference and Exposition, Phoenix, AZ, USA, 20–23 March 2011; pp. 1–7. [Google Scholar] [CrossRef]
  13. ENTSO-E’s Regional Group North Sea, (RG NS). Offshore Transmission Technology; ENTSO-E: Brussels, Belgium, 2012. [Google Scholar]
  14. Spahic, E.; Ergin, D.; Schettler, F.; Dorn, J.; Petino, C. A Closer Look at Protection Concepts for DC Systems. 2016. Available online: https://e-cigre.org/publication/B4-118_2016 (accessed on 16 December 2019).
  15. Jiebei, Z.; Booth, C. Future multi-terminal HVDC transmission systems using Voltage source converters. In Proceedings of the 45th International Universities Power Engineering Conference UPEC2010, Cardiff, Wales, UK, 31 August–3 September 2010; pp. 1–6. [Google Scholar]
  16. CIGRÉ WG B4.52. HVDC Grid Feasibility Study; Cigré: Paris, France, 2013; Available online: https://e-cigre.org/publication/533-hvdc-grid-feasibility-study (accessed on 16 December 2019).
  17. Buigues, G.; Valverde, V.; Zamora, I.; Larruskain, M.; Abarrategui, O.; Iturregi, A. DC fault detection in VSC-based HVDC grids used for the integration of renewable energies. In Proceedings of the 2015 International Conference on Clean Electrical Power (ICCEP), Taormina, Italy, 16–18 June 2015; pp. 666–673. [Google Scholar]
  18. Marten, A.K.; Troitzsch, C.; Westermann, D. Non-telecommunication based DC line fault detection methodology for meshed HVDC grids. IET Gener. Transm. Distrib. 2016, 10, 4321–4339. [Google Scholar] [CrossRef]
  19. Leterme, W.; van Hertem, D. Classification of Fault Clearing Strategies for HVDC Grids. In Proceedings of the Cigre Lund Symposium, Lund, Sweden, 27–28 May 2015. [Google Scholar]
  20. Marvik, J.I.; D’Arco, S.; Suul, J.A. Communication-less fault detection in radial multi-terminal offshore HVDC grids. In Proceedings of the 11th IET International Conference on AC and DC Power Transmission, Birmingham, UK, 13 July 2015; pp. 1–8. [Google Scholar]
  21. Torres-Olguin, R.E.; Høidalen, H.K. Inverse time overcurrent protection scheme for fault location in multi-terminal HVDC. In Proceedings of the 2015 IEEE Eindhoven PowerTech, Eindhoven, The Netherlands, 29 June–2 July 2015; pp. 1–6. [Google Scholar]
  22. Häfner, J.; Jacobson, B. Proactive hybrid HVDC breakers- A key innovation for reliable HVDC grids. In Proceedings of the the Electric Power System of the Future- Integrating Supergrids and Microgrids International Symposium, Bologna, Italy, 13–15 September 2011. [Google Scholar]
  23. Yang, J.; Fletcher, J.E. Protection scheme design for meshed VSC-HVDC transmission systems of large-scale wind farms. In Proceedings of the 9th IET International Conference on AC and DC Power Transmission (ACDC 2010), London, UK, 19–21 October 2010; p. 4. [Google Scholar]
  24. Mokhberdoran, A.; Silva, N.; Leite, H.D.; Carvalho, A. Unidirectional Protection Strategy for Multi-terminal HVDC Grids. Trans. Environ. Electr. Eng. 2016, 1. [Google Scholar] [CrossRef]
  25. Kontos, E.; Pinto, R.T.; Bauer, P. Fast DC fault recovery technique for H-bridge MMC-based HVDC networks. In Proceedings of the 2015 IEEE Energy Conversion Congress and Exposition (ECCE), Montreal, QC, Canada, 20–24 September 2015; pp. 3351–3358. [Google Scholar] [CrossRef]
  26. Rahman, M.H.; Xu, L.; Yao, L. Protection of large partitioned MTDC Networks Using DC-DC converters and circuit breakers. Prot. Control. Mod. Power Syst. 2016, 1, 19. [Google Scholar] [CrossRef] [Green Version]
  27. Rahman, M.H.; Xu, L.; Yao, L. DC fault protection strategy considering DC network partition. In Proceedings of the 2016 IEEE Power and Energy Society General Meeting (PESGM), Boston, MA, USA, 17–21 July 2016; pp. 1–5. [Google Scholar] [CrossRef] [Green Version]
  28. Rahman, H.; Xu, L.; Bell, K. DC fault protection of multi-terminal HVDC systems using DC network partition and DC circuit breakers. In Proceedings of the Sixth Protection, Automation and Control World Conference (PAC World 2015), Glasgow, UK, 29 June–3 July 2015. [Google Scholar]
  29. Leterme, W.; Ahmed, N.; Beerten, J.; Ängquist, L.; Van Hertem, D.; Norrga, S. A new HVDC grid test system for HVDC grid dynamics and protection studies in EMT-type software. In Proceedings of the 11th IET International Conference on AC and DC Power Transmission, Birmingham, UK, 13 July 2015; p. 95. [Google Scholar]
  30. Marvik, J.I.; D’Arco, S.; Suul, J.A. A two-layer detection strategy for protecting multi-terminal HVDC systems against faults within a wide range of impedances. In Proceedings of the 13th International Conference on Development in Power System Protection 2016 (DPSP), Edinburgh, UK, 7–10 March 2016; pp. 1–6. [Google Scholar] [CrossRef]
  31. Marvik, J.I.; D’Arco, S.; Sharifabadi, K. Protection scheme for multi-terminal radial VSC HVDC system without communication between terminals. In CIGRE International Symposium- Across borders - HVDC Systems and Markets Integration- Lund 2015; CIGRE (International Council on Large Electric Systems): Paris, France, 2015. [Google Scholar]
  32. Geddada, N.; Yeap, Y.M.; Ukil, A. Experimental Validation of Fault Identification in VSC-Based DC Grid System. IEEE Trans. Ind. Electron. 2018, 65, 4799–4809. [Google Scholar] [CrossRef]
  33. Sneath, J.; Rajapakse, A.D. DC Fault Protection of a Nine-Terminal MMC HVDC Grid. In Proceedings of the 11th IET International Conference on AC and DC Power Transmission, Birmingham, UK, 10–12 February 2015; pp. 1–8. [Google Scholar] [CrossRef]
  34. Sneath, J.; Rajapakse, A.D. Fault Detection and Interruption in an Earthed HVDC Grid Using ROCOV and Hybrid DC Breakers. IEEE Trans. Power Deliv. 2016, 31, 973–981. [Google Scholar] [CrossRef]
  35. Haleem, N.M.; Rajapakse, A.D. Application of new directional logic to improve DC side fault discrimination for high resistance faults in HVDC grids. J. Mod. Power Syst. Clean Energy 2017, 5, 560–573. [Google Scholar] [CrossRef] [Green Version]
  36. Haleem, N.; Rajapkse, A.D. Local measurement based ultra-fast directional ROCOV scheme for protecting Bi-pole HVDC grids with a metallic return conductor. Int. J. Electr. Power Energy Syst. 2018, 98, 323–330. [Google Scholar] [CrossRef]
  37. Zou, G.; Feng, Q.; Huang, Q.; Sun, C.; Gao, H. A fast protection scheme for VSC based multi-terminal DC grid. Int. J. Electr. Power Energy Syst. 2018, 98, 307–314. [Google Scholar] [CrossRef]
  38. Eldin, A.H.; Lotfy, A.; Elgamal, M.; Ebeed, M. Protection oriented observability in multi-terminal HVDC systems. In Proceedings of the 2016 7th International Conference on Information and Communication Systems (ICICS), Irbid, Jordan, 5–7 April 2016; pp. 102–108. [Google Scholar] [CrossRef]
  39. Shuai, W.; Tianshu, B.; Ke, J. Wavelet entropy based fault detection approach for MMC-HVDC lines. In Proceedings of the 2015 IEEE Power & Energy Society General Meeting, Denver, CO, USA, 26–30 July 2015; pp. 1–5. [Google Scholar] [CrossRef]
  40. Mallick, R.K.; Patnaik, R.K. Fault analysis of voltage-source converter based multi-terminal HVDC transmission links. In Proceedings of the 2011 International Conference on Energy, Automation and Signal, Bhubaneswar, Odisha, India, 28–30 December 2011; pp. 1–7. [Google Scholar]
  41. Qingqing, Y.; Simon Philip Le, B.; Bertrand, C.; Philippe, V.; Jianwei, L. A Novel Fault Detection and Fault Location Method for VSC-HVDC Links Based on Gap Frequency Spectrum Analysis. Energy Procedia 2017, 142, 2243–2249. [Google Scholar] [CrossRef]
  42. Yeap, Y.M.; Ukil, A. Fault detection in HVDC system using Short Time Fourier Transform. In Proceedings of the 2016 IEEE Power and Energy Society General Meeting (PESGM), Boston, MA, USA, 17–21 July 2016; pp. 1–5. [Google Scholar] [CrossRef]
  43. Yeap, Y.M.; Ukil, A.; Geddada, N. STFT analysis of high frequency components in transient signals in multi-terminal HVDC system. In Proceedings of the IECON 2016—42nd Annual Conference of the IEEE Industrial Electronics Society, Florence, Italy, 23–26 October 2016; pp. 4008–4013. [Google Scholar] [CrossRef]
  44. Perveen, R.; Mohanty, S.R.; Kishor, N. Fault location in VSC-HVDC section for grid integrated offshore wind farm by EMD. In Proceedings of the 2016 18th Mediterranean Electrotechnical Conference (MELECON), Lemesos, Cyprus, 18–20 April 2016; pp. 1–5. [Google Scholar] [CrossRef]
  45. Perveen, R.; Kishor, N.; Mohanty, S.R. Fault detection for offshore wind farm connected to onshore grid via voltage source converter-high voltage direct current. IET Gener. Transm. Distrib. 2015, 9, 2544–2554. [Google Scholar] [CrossRef]
  46. Guobing, S.; Xinlei, C.; Shuping, G.; Jiale, S.; Guang, L. Natural frequency based protection and fault location for VSC-HVDC transmission lines. In Proceedings of the 2011 International Conference on Advanced Power System Automation and Protection, Beijing, China, 16–20 October 2011; pp. 177–182. [Google Scholar]
  47. Zheng-You, H.; Kai, L.; Xiao-peng, L.; Sheng, L.; Jian-wei, Y.; Rui-Kun, M. Natural Frequency-Based Line Fault Location in HVDC Lines. IEEE Trans. Power Deliv. 2014, 29, 851–859. [Google Scholar] [CrossRef]
  48. Livani, H.; Evrenosoglu, C.Y. A single-ended fault location method for segmented HVDC transmission line. Electr. Power Syst. Res. 2014, 107, 190–198. [Google Scholar] [CrossRef]
  49. Magnago, F.H.; Abur, A. Fault location using wavelets. IEEE Trans. Power Deliv. 1998, 13, 1475–1480. [Google Scholar] [CrossRef]
  50. Descloux, J.; Rault, Y.; Nguefeus, S.; Curis, J.B.; Guillaud, X.; Colas, F.; Raison, B. HVDC Meshed Grid: Control and Protection of a Multi-terminal HVDC System. In Proceedings of the CIGRÉ Session Paris (Paper B4-308), Paris, France, 26–31 August 2012; p. 10. Available online: https://e-cigre.org/publication/B4-308_2012-hvdc-meshed-grid-control-and-protection-of-a-multi-terminal-hvdc-system (accessed on 16 December 2019).
  51. Dallas, I.; Booth, C. Teleprotection in multi-terminal HVDC supergrids. In Proceedings of the 12th IET International Conference on Developments in Power System Protection (DPSP 2014), Copenhagen, Denmark, 31 March–3 April 2014; pp. 1–6. [Google Scholar]
  52. Pérez-Molina, M.J.; Larruskain, D.M.; Lopez, P.E.; Santos-Mugica, O.A.M. A comparison of non-unit and unit protection algorithms for HVDC grids. In Proceedings of the AEIT HVDC International Conference 2019, Florence, Italy, 9–10 May 2019. [Google Scholar]
  53. Naidoo, D.; Ijumba, N.M. HVDC line protection for the proposed future HVDC systems. In Proceedings of the 2004 International Conference on Power System Technology. PowerCon 2004, Singapore, 21–24 November 2005; Volume 2, pp. 1327–1332. [Google Scholar]
  54. Leterme, W.; Beerten, J.; van Hertem, D. Nonunit Protection of HVDC Grids with Inductive DC Cable Termination. IEEE Trans. Power Deliv. 2016, 31, 820–828. [Google Scholar] [CrossRef] [Green Version]
  55. Leterme, W. Communication-Less Protection Algorithms for Meshed VSC HVDC Cable Grids; KU Leuven: Leuven, Belgium, 2016. [Google Scholar]
  56. Bucher, M.K.; Franck, C.M. Fault Current Interruption in Multiterminal HVDC Networks. IEEE Trans. Power Deliv. 2016, 31, 87–95. [Google Scholar] [CrossRef]
  57. Leterme, W.; Jahn, I.; Ruffing, P.; Sharifabadi, K.; van Hertem, D. Designing for High-Voltage dc Grid Protection: Fault Clearing Strategies and Protection Algorithms. IEEE Power Energy Mag. 2019, 17, 73–81. [Google Scholar] [CrossRef]
Figure 1. Scheme of the MT-HVDC grid modelled in PSCAD.
Energies 12 04808 g001
Figure 2. Current variation due to fault resistance at both ends of the link for PtP and PtG faults.
Energies 12 04808 g002
Figure 3. Voltage variation due to fault resistance at both ends of the link for PtP and PtG faults.
Energies 12 04808 g003
Figure 4. ROCOC variation due to fault resistance at both ends of the link for PtP and PtG faults.
Energies 12 04808 g004
Figure 5. Voltage drop variation due to fault resistance at both ends of the link for PtP and PtG faults.
Energies 12 04808 g005
Figure 6. ROCOV variation due to fault resistance at both ends of the link for PtP and PtG faults.
Energies 12 04808 g006
Figure 7. OC, UV, ROCOC, and ROCOV fault detection time at both ends of the link for PtP and PtG faults.
Energies 12 04808 g007
Figure 8. Current through both relays of a link for different fault types and locations.
Energies 12 04808 g008
Figure 9. Fault identification times for the ROCOV and ROCOC algorithm for different fault types and locations.
Energies 12 04808 g009
Table 1. Cable lengths.
LinkCable Length (km)
12100
13200
14200
24150
34100
Table 2. Operation characteristics of the OC algorithm for different fault types and locations.
Fault TypeFault Location (km)Detection Time (ms)Operation Time (ms)Maximum Current (kA)
Relay 13Relay 31Relay 13Relay 31Relay 13Relay 31
PtP fault01.2602.9153.3004.9506.5004.598
501.5202.5053.5504.5506.2374.398
1001.4052.8353.4504.8505.4265.482
1501.7852.6203.8004.6505.4205.892
2002.1652.1854.2004.2005.8866.081
PtG fault01.4604.1253.5006.1505.7123.205
501.6754.1853.7006.2005.3113.399
1001.4603.4703.5005.5005.1233.581
1501.8653.1653.9005.2004.9033.810
2002.2803.0204.3005.0505.1724.123
Table 3. Operation characteristics of the UV algorithm for different fault types and locations.
Fault TypeFault Location (km)Detection Time (ms)Operation Time (ms)Maximum Current (kA)
Relay 13Relay 31Relay 13Relay 31Relay 13Relay 31
PtP fault00.2051.3752.2503.4004.7383.820
500.4801.0602.5003.1004.4723.505
1000.7650.7652.8002.8004.5232.977
1501.0600.4803.1002.5005.0852.897
2001.3750.2053.4002.2505.3943.096
PtG fault00.2051.3752.2503.4004.1952.598
500.4801.0602.5003.1004.0852.227
1000.7650.7652.8002.8004.0281.757
1501.0600.4803.1002.5004.4941.901
2001.3750.2053.4002.2504.8061.990
Table 4. Operation characteristics of the ROCOC algorithm for different fault types and locations.
Fault TypeFault Location (km)Detection Time (ms)Operation Time (ms)Maximum Current (kA)
Relay 13Relay 31Relay 13Relay 31Relay 13Relay 31
PtP fault00.0951.2502.1003.2605.9774.803
500.3450.9302.3502.9405.5974.548
1000.6350.6352.6402.6405.4753.963
1500.9300.3452.9402.3506.1364.043
2001.2500.0953.2602.1006.3734.287
PtG fault00.0951.2502.1003.2605.3963.532
500.3450.9302.3502.9405.1493.209
1000.6350.6352.6402.6405.0562.694
1500.9300.3452.9402.3505.5852.895
2001.2500.0953.2602.1005.8482.990
Table 5. ROCOC algorithm’s fault detection and type identification times for different fault types and locations.
Fault TypeFault Location (km)Detection Time (ms)Identification Time (ms)Δ13 1 (μs)Δ31 2 (μs)
Relay 13Relay 31Relay 13Relay 31
PtP fault00.0951.2500.1001.260510
500.3450.9300.3500.940510
1000.6350.6350.6400.64055
1500.9300.3450.9400.350105
2001.2500.0951.2600.100105
PtG fault00.0951.2550.1001.26055
500.3450.9300.3500.940510
1000.6350.6350.6400.64055
1500.9300.3450.9400.350105
2001.2600.0951.2700.100105
1 Time difference between detection and identification times at relay 13. 2 Time difference between detection and identification times at relay 31.
Table 6. Operation characteristics of the ROCOV algorithm for different fault types and locations.
Fault TypeFault Location (km)Detection Time (ms)Operation Time (ms)Maximum Current (kA)
Relay 13Relay 31Relay 13Relay 31Relay 13Relay 31
PtP fault00.0051.1002.0103.1105.8104.591
500.2750.8252.2802.8305.5974.548
1000.550.552.5602.5605.4613.930
1500.8250.2752.8302.2806.1364.043
2001.1000.0053.1102.0106.1674.130
PtG fault00.0051.1002.0103.1105.2233.280
500.2750.8252.2802.8305.1473.174
1000.550.552.5602.5604.9742.575
1500.8250.2752.8302.2805.5602.883
2001.1000.0053.1102.0105.5902.830
Table 7. ROCOV algorithm’s fault detection and type identification times for different fault types and locations.
Fault TypeFault Location (km)Detection Time (ms)Identification Time (ms)Δ13 1 (μs)Δ31 2 (μs)
Relay 13Relay 31Relay 13Relay 31
PtP fault00.0051.1000.0101.110510
500.2750.8250.2800.83055
1000.5500.5500.5600.5601010
1500.8250.2750.8300.28055
2001.1000.0051.1100.010105
PtG fault00.0051.1000.0101.110510
500.2750.8250.2800.83055
1000.5500.5500.5600.5601010
1500.8250.2750.8300.28055
2001.1000.0051.1100.010105
1 Time difference between detection and identification times at relay 13. 2 Time difference between detection and identification times at relay 31.
Table 8. Comparison of the reviewed local measurement-based algorithms and the analyzed algorithms in this paper.
Ref.YearAlgorithmConverterConfigurationBreaker DeviceLimiting ReactorOperation Time
2015OCHB-MMCBipole-10, 100, 500 mH2–3 ms
[25]2015OCHB-MMCSym. monopoleAC CBs and DC switches-60 ms
Analyzed2019OCHB-MMCSym. monopoleHybrid HVDC CBs150 mH3–7 ms
[29]2015UVHB-MMCSym. monopoleHybrid HVDC CBs100 mH5–6 ms
Analyzed2019UVHB-MMCSym. monopoleHybrid HVDC CBs150 mH2.205–3.375 ms
[30]2016ROCOCMMCBipoleHVDC CBs25 mH2–3 ms
[31]2015ROCOCMMCBipoleHVDC CBs10 mH3 ms
Analyzed2019ROCOCHB-MMCSym. monopoleHybrid HVDC CBs100 mH2.095–3.25 ms
[33]2015ROCOVMMCBipoleHybrid HVDC CBs100 mH3 ms
[34]2016ROCOVMMCBipoleHybrid HVDC CBs100 mH3 ms
[35]2017ROCOVMMCBipoleHybrid HVDC CBs50, 100, 125 mH3 ms
[36]2018ROCOVMMCBipoleHybrid HVDC CBs40 mH200 μs 1
Analyzed2019ROCOVHB-MMCSym. monopoleHybrid HVDC CBs100 mH2.005–3.1 ms
1 Fault detection time without CB operating time.

