1. Introduction
Currently, encouraging the use of renewable energy sources (RESs) for electricity generation is continually increasing in several countries around the world aiming to reduce the use of energy sources emitting greenhouse gas. Solar energy, one type of RESs, has been extensively used to produce electricity through the photovoltaic (PV) systems, especially over the past ten years, since it can mitigate climate change. However, the major concern of PV systems is that their output characteristics highly depend on the amount of sunlight. This may accordingly cause poor impacts on the distribution system in terms of power quality and efficiency of energy usage. Also, the significant issue of the distribution system with a high PV penetration level is an occurrence of overvoltage, which normally occurs when the power flow is reversed to a transformer or substation [
1]. This reverse power flow can also cause other issues, such as increasing of fault current, fault tripping, total harmonic distortion, and blinding of protection [
2]. Since overvoltage is widely known as the high influential factor of the distribution system, many methods have been proposed to solve this problem, such as the use of active medium-voltage transformers, active power curtailment, reactive power control, demand response, and installing energy storage systems (ESSs). In recent years, several publications have shown that an integration ESSs could overcome the overvoltage issues at high PV penetration levels since the ESSs can store the reversed power flow and provide several power quality improvements, such as power loss reduction and smoothing of PV output. In particular, the battery energy storage system (BESS) has currently received massive attention due to its valuable characteristics, such as quick response, practicable controllability, and geographically independent [
3]. It has been widely known as a notable technique for improving the performance of the distribution system since it could achieve the requirements of the system, such as high power and high energy density, high efficiency, and environmentally friendly and grid-scale batteries [
4]. Several pieces of literature have reviewed an integration of BESS on distribution grids. In [
5], the insights of BESS integration in distribution networks were reviewed. The optimal planning, including optimal locations, energy capacity, and power rating determination of BESS integration in grids, was also determined in many studies [
6,
7].
In addition, an implementation of BESS normally provides a benefit to the investor. Most of the studies have focused on the installation of centralized BESS since it could provide high benefit and requires low investment costs. Also, the optimal sitting, sizing, and operation of this BESS installation type can be easily determined. Therefore, optimal planning of centralized BESS implementation has been widely proposed in many publications. The total net present value (NPV) is generally used as an economic indicator to evaluate the benefit and feasibility of BESS installation.
So far, the meta-heuristic methods have widely performed to solve the optimization problems of BESS installation due to their simple implementation, flexibility, robustness, and high accuracy. In 2016, an optimal sitting and sizing of BESS were determined to achieve the minimum total NPV of the distribution system during the project life cycle [
8]. The network loss reduction and profit from load shifting were the main benefits of BESS implementation, while the considered costs included the investment cost, operation cost, maintenance cost, and replacement cost. The genetic algorithm (GA) was applied to solve a proposed bi-level optimization model. Later on, the optimal planning model of BESS implementation was solved by the intelligent single particle optimizer (IPSO), aiming to maximize the economic benefit [
9]. The focused benefits were a reduction of purchased energy, upgrade deferral, environmental benefit, a reduction of power outage, and reliability improvement, whereas the costs included the one-time investment cost and the cost for operation and maintenance. After that, Sardi et al. determined an optimal allocation of multiple Community Energy Storages (CES) in the distribution system with PV systems with a consideration of all possible benefits and costs of CES [
10]. The maximum total NPV was the objective function, which was determined by using GA. The benefits were power loss reduction, peak load shaving, upgrade deferral, supporting of reactive power, and emission reduction, while the costs included the replacement, investment, and operation and maintenance costs. In 2018, an optimal sitting, sizing, and charging strategy of BESS was determined for improving the power quality of the distribution system with a high PV penetration level [
2]. The GA with a linear programming method was performed to solve the optimization problem, aiming to maximize the cost function. The benefits were the power loss reduction, environmental emission reduction, energy arbitrage, and transmission access fee; meanwhile, the costs were the capital cost and operation and maintenance cost. In 2019, the optimal BESS installation was implemented in the distribution system, aiming to increase the PV penetration level of the system [
11]. The maximum total NPV was used as the objective function, which was solved by GA. Recently, the BESS with strategies of central and distributed ancillary services in distribution systems were used to accommodate high penetration levels of wind power generation [
12]. The considered benefits included improvement of voltage profile, improvement of power factor, and reduced energy losses and demand deviation; meanwhile, the GA was used as the optimization algorithm. The shunt capacitor was also allocated for coordination to increase the benefits.
Additionally, installation of a capacitor is widely known as the method for enhancing the economic benefit and enhancing the power quality of the distribution system [
12,
13]. Since the capacitor itself normally supplies the reactive power into the distribution system, it typically improves the voltage magnitude as well as reduces the power loss of the system. Several publications have been studied to determine the sitting and sizing of a capacitor aiming to obtain the maximum benefit [
12,
13]. However, only a few studies applied the simultaneous installation of capacitor and BESS to maximize the benefit of the distribution system with integrated PV systems [
14,
15]. Therefore, an implementation of BESS planning simultaneously with optimal capacitor placement was focused on in this work, aiming to increase the benefit of the distribution system with integrated PV systems. Also, a comparison of BESS installation between the cases with centralized BESS installation, centralized BESS with LV capacitor, and decentralized BESS has not yet been considered in the literature.
Recently, the optimization algorithm, called Salp Swarm Algorithm (SSA), was proposed to solve the optimization problem [
16]. It was inspired by navigating and foraging behavior of salps in the oceans. In 2018, the notable ability of SSA for locating and optimal sizing of renewable distributed generators and shunt capacitor banks on radial distribution networks was indicated [
16]. Also, several recent studies claimed that SSA indicates an outstanding performance for finding the optimal solution of the power system optimization problem [
17,
18,
19]. However, the use of SSA for solving the optimal installation of BESS and capacitor has not been reported yet. Accordingly, the SSA was purposely performed to solve the optimization problem in this study.
In the current situation in which the cost of installing PV systems has been rapidly dropped, a number of PV systems were installed in the distribution system. It is challenging to handle the power quality degradation of the distribution system at a high PV penetration level. This paper aims to maximize the benefit of the distribution system with PV systems integrated at a very high PV penetration level by using the optimal BESS installation and LV capacitor placement. The objective function for maximizing the benefit of a particular system was also proposed. The focused distribution system in this work was the practical 41-bus LV system located in Ratchaburi province, Thailand. The considered benefits included selling active power, loss reduction, system upgrade deferral, reduction in CO2, and construction deferral of a coal-fired power plant; meanwhile, the considered costs included capital cost and operation and maintenance cost. The SSA was applied to solve the optimization problem, while the performance of SSA was compared to GA, which is a well-known algorithm. The total NPV of utility was used as an economic indicator. The difference of NPV for three different cases, including installation of the centralized BESS case, centralized BESS with LV capacitor case, and decentralized BESS case, was considered. And then, the case providing a maximum total NPV was selected as the most profitable case of BESS implementation in this study.
2. Methodology
2.1. Modeling of Load Profile and PV Output
2.1.1. Load Profile Model
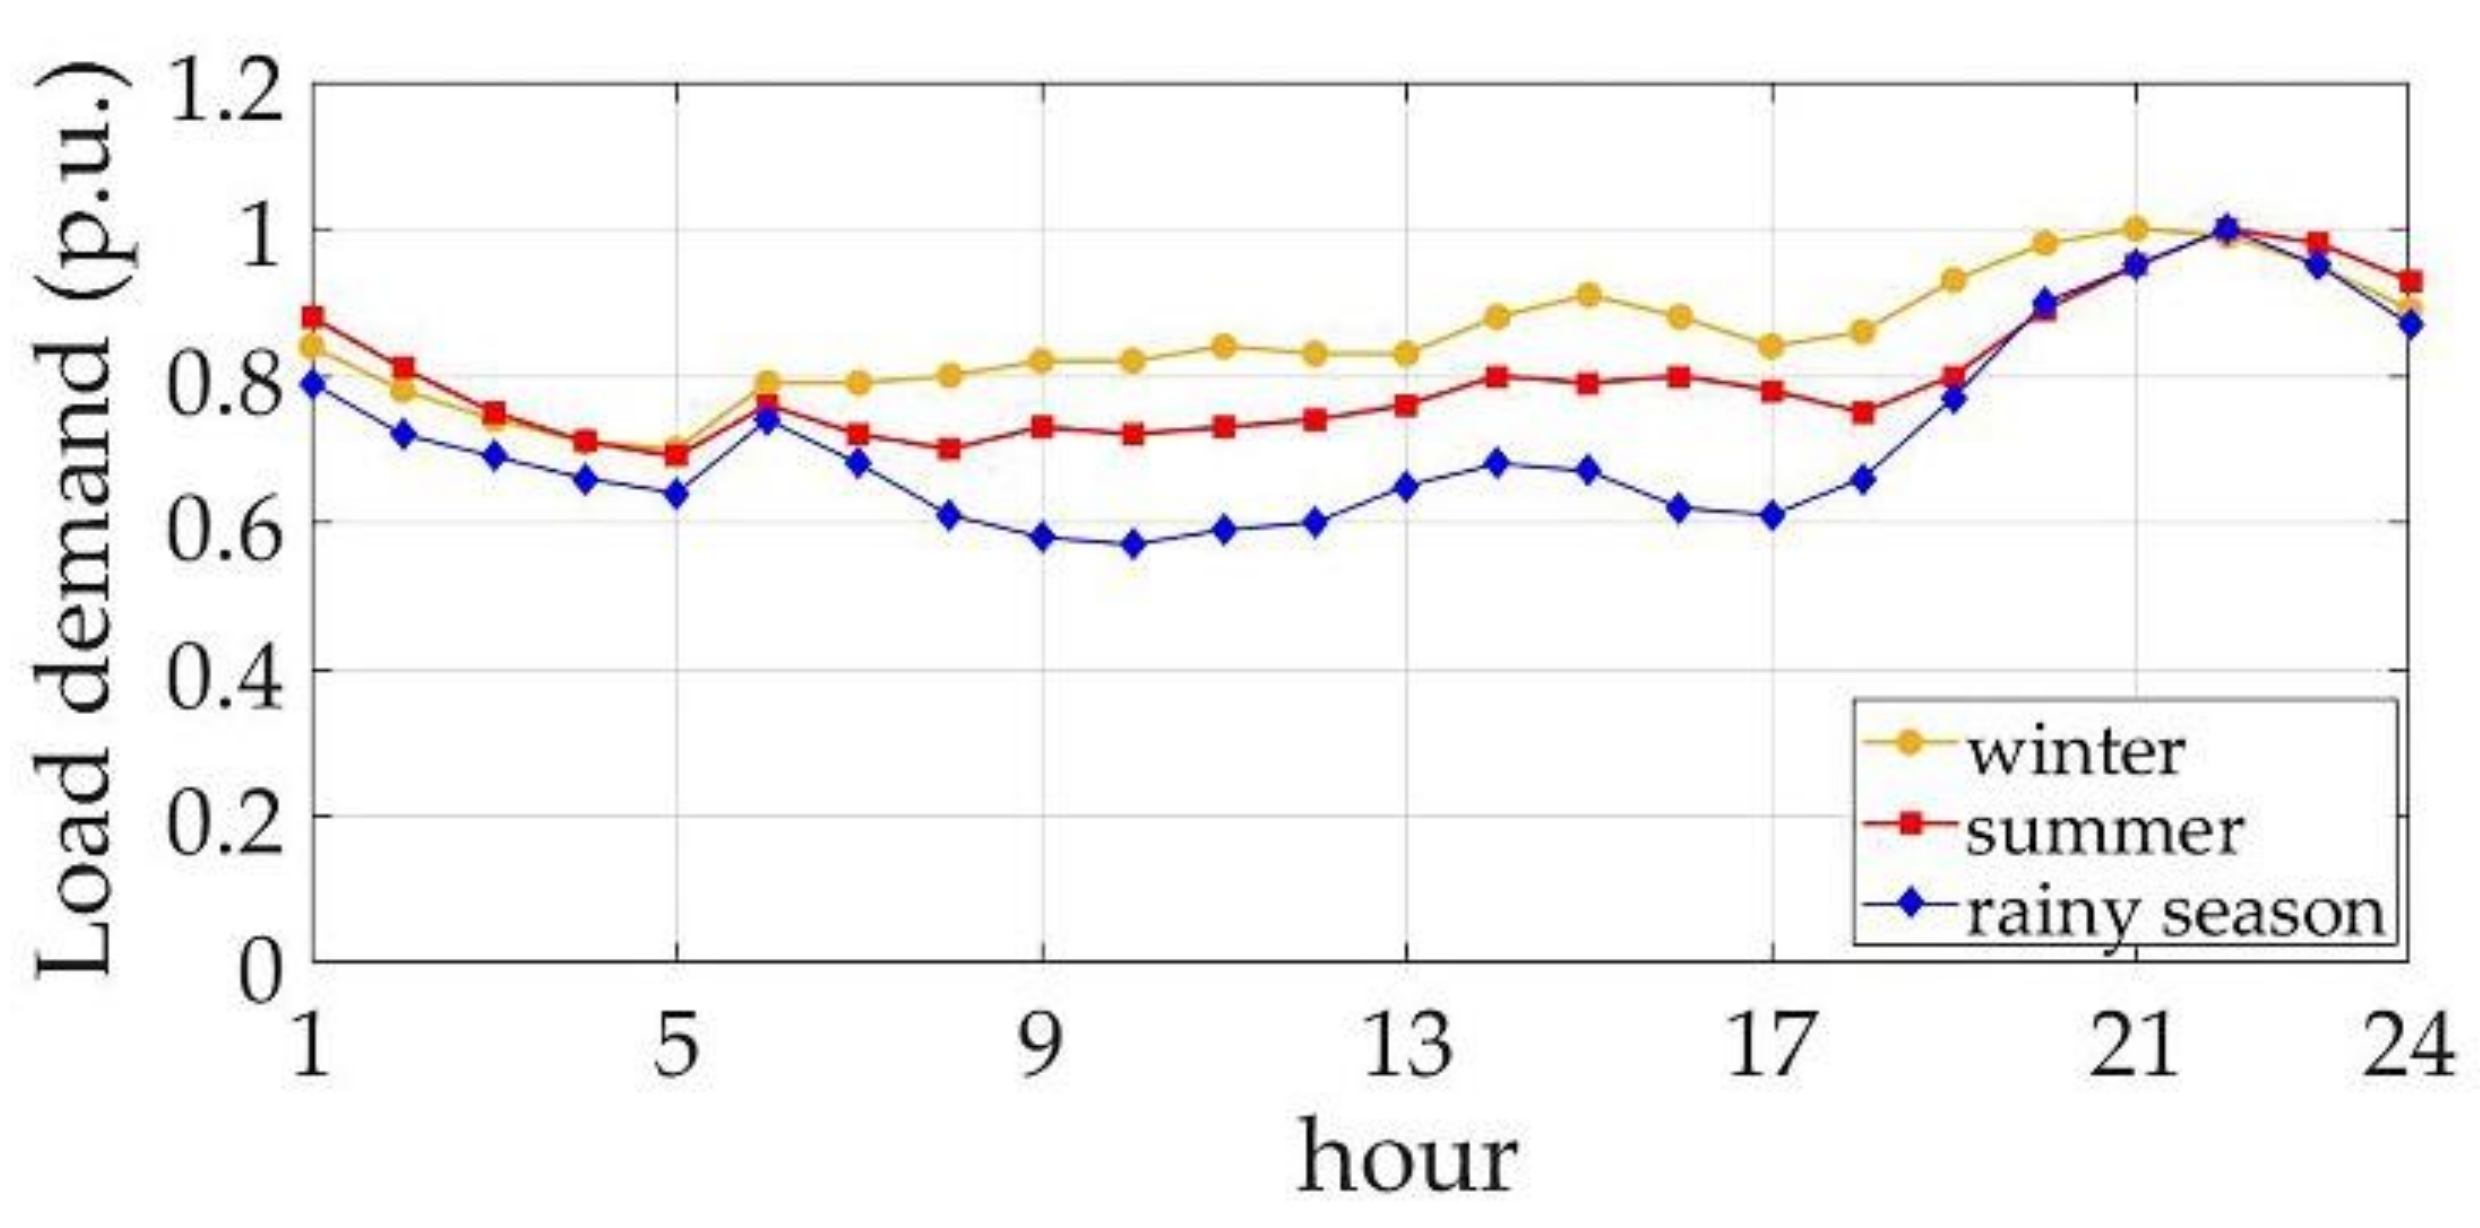
In this paper, the load profiles were modeled based on the practical data of electricity demand of the residential houses located in the Provincial Electricity Authority (PEA) southern area of Thailand. The load data for 12 months, from September 2017 to October 2018, was collected [
20]. The load profiles were divided into 3 models according to three different seasons of Thailand, including winter, summer, and the rainy season. The winter is from November until February, the summer is from March until May, and the rainy season is from June until October.
Figure 1 shows the average load model for 1 day of three different seasons. The average load factor of the winter, summer, and rainy seasons is 0.85, 0.80, and 0.72, respectively.
2.1.2. PV Output Model
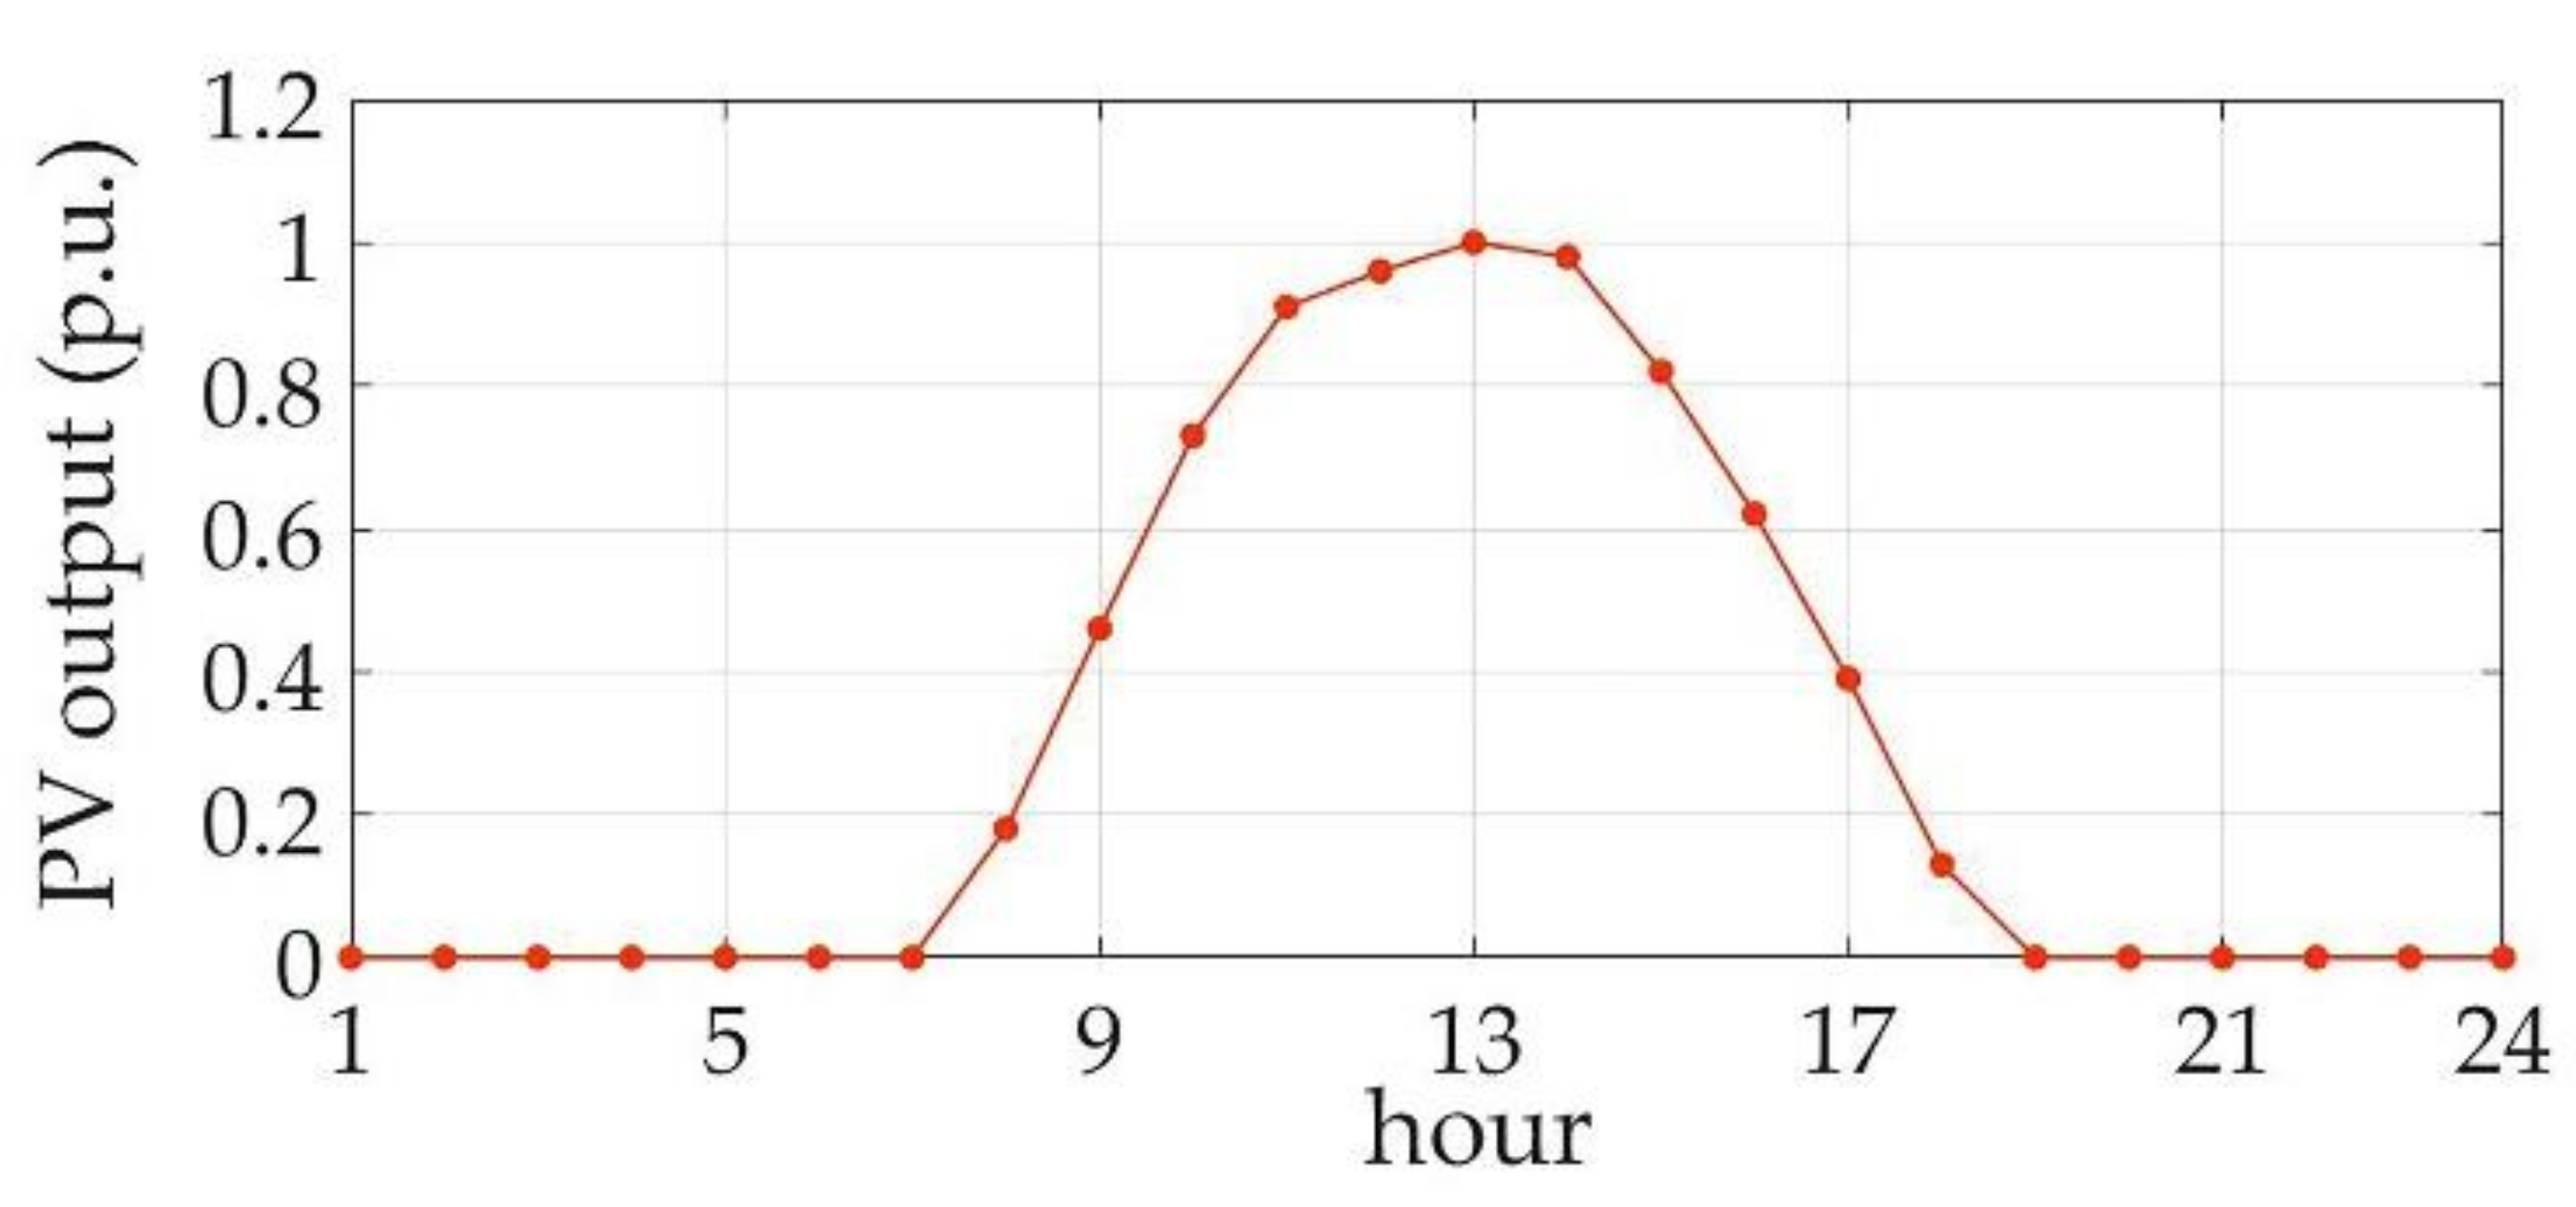
The normalized pattern of the output power of PV systems obtained from the practical data of Ratchaburi Province, Thailand, was used in the calculation throughout the planning project, as shown in
Figure 2.
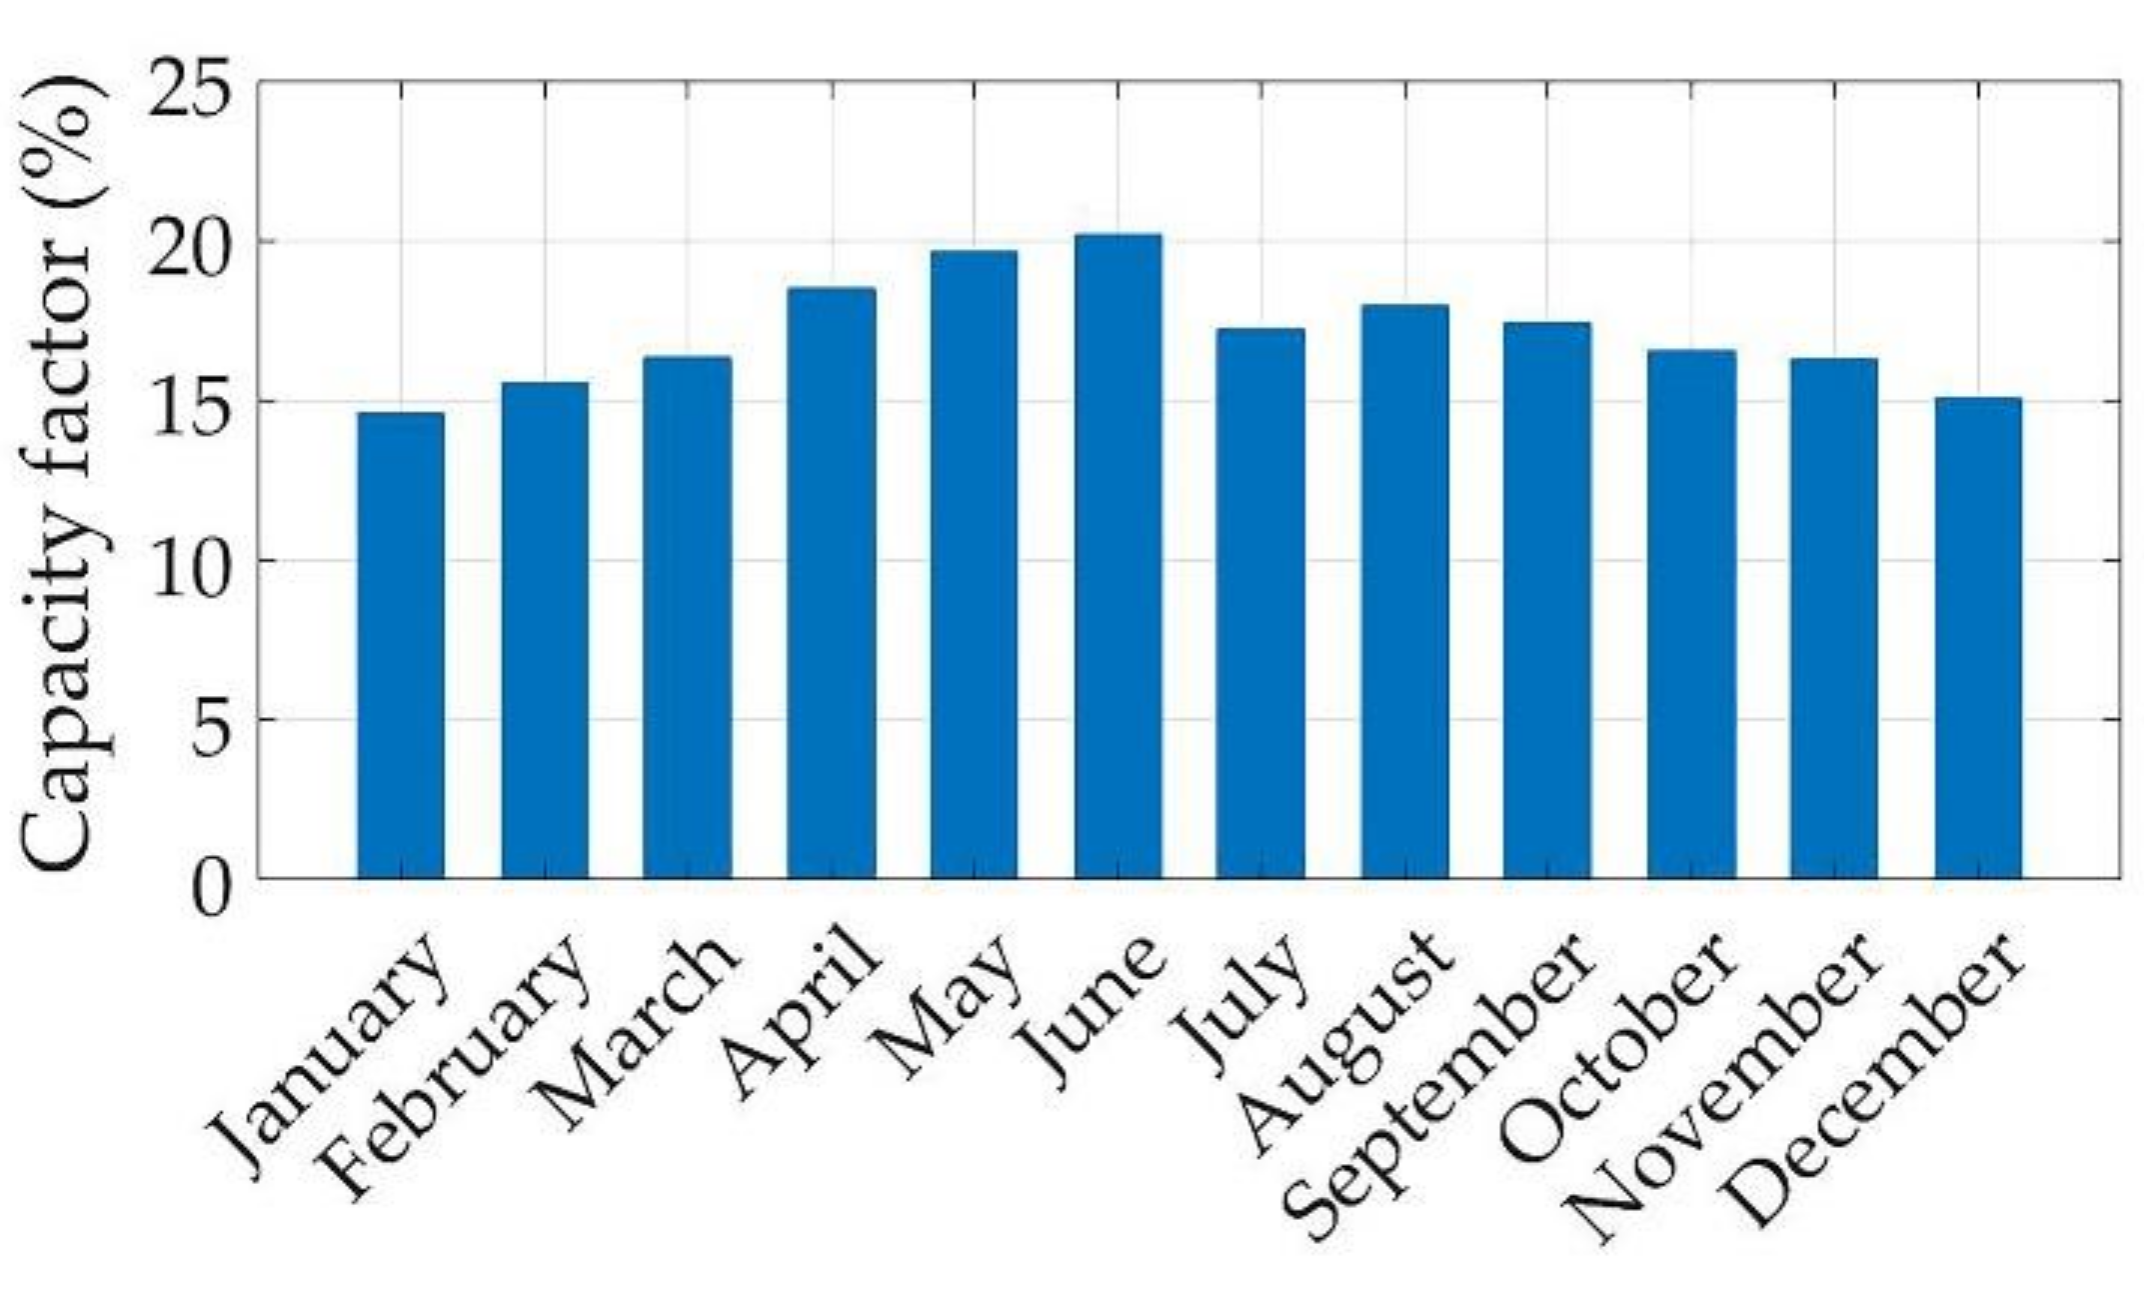
Figure 3 shows the average capacity factor of 5 houses for 12 months (September 2017 to October 2018), which was obtained from the practical data in the local area. The average capacity factor of the winter, summer, and rainy season was 15.37, 18.16, and 17.84, respectively. In addition, it is noted that the worst impact of the PV system on the distribution system occurred during the sunny day where the PV systems generate over demand energy. The maximum PV output was limited by 80% of rated PV systems. Therefore, the PV output model of the sunny day was represented as a case indicating the worst impact of the PV system on the distribution system.
2.2. Implementation of Centralized BESS
2.2.1. Operation Strategy of Centralized Bess Installation
The strategy for charge and discharge of the battery storage system in this work was determined based on the iterative method [
11]. The proposed operation strategy was to flatten the load profile. The optimal sizing and location of BESS were determined through the optimization problem. The load factor of the focused distribution system after the implementation of BESS was assumed to be greater than 0.75. The usage range of the transformer was limited at 80% of its capacity. It is also noted that the size of BESS had to be enough to store the reverse energy occurring during a sunny day.
2.2.2. Battery Properties
In the literature, there were various types of batteries implemented in the distribution systems to support an increase of penetration level of renewable energy resources, such as the lithium-ion, lead-acid, sodium-sulfur, nickel-cadmium, vanadium redox flow battery (VRB), and zinc-bromine. The lithium-ion and sodium-sulfur battery can generate a very high energy density; however, they are quite expensive, and their life cycle is short. The lead-acid battery has the lowest price compared to other battery types; however, it demonstrates a lower energy density and shorter cycle lifetime. The advantages of VRB are high capacity, high cycle lifetime, and low cost, but the weakness of this battery type is the low energy density. The zinc-bromine battery has similar features to those of VRB, but it has a lower cycle lifetime than VRB. In this paper, we focused on the VRB battery type since it has several merits, such as long lifetime, high-performance, high cycle lifetime, and no self-discharge. It was also suitable to be implemented in the community scale of the distribution system. In addition, its long cycle lifetime can minimize the replacement of BESS over planning horizons. The technical parameters of VRB are summarized in
Table 1 [
2].
The cycle life per day of the battery,
, is calculated by using Equation (1) [
21]:
where
is the capacity of BESS (kWh) at time
, and
is the total number of time steps. The battery lifetime in a year during the planning horizon,
, was then determined by Equation (2).
2.3. Implementation of Centralized Bess with Lv Capacitor Placement
In order to increasingly enhance the benefit from the distribution system, we aimed to further consider the installation of the LV capacitor in the system simultaneously with centralized BESS installation. The operation strategy and battery properties of BESS, in this case, are similar to those explained in
Section 2.2. The optimal sizing and location of the LV capacitor were determined through the optimization problem. The existing size of the LV capacitor in this work was 5, 10, and 20 kvar. The cost of installing the LV capacitor was included in capital cost, which can be written in Equation (3):
where
and
are the total capacitor purchase and installation cost (5 USD/kvar) [
12] and the size of the LV capacitor.
2.4. Implementation of Decentralized BESS
2.4.1. Operation Strategy of Decentralized BESS
In this study, the proposed operation strategy of the decentralized BESS installation of each bus was to store the excess energy from the PV systems installed at that bus. And then, the stored energy will be used by the load at that bus when PV systems are not being operated.
2.4.2. Decentralized BESS Model
In this paper, the decentralized BESS was owned by the customers; therefore, the customers were responsible for the installation cost of BESS. Accordingly, the investment cost of the utility was ignored in this case. However, the benefits from BESS installation were still taken into account on the utility’s side in terms of loss reduction, system upgrade deferral, and construction deferral of a coal-fired power plant.
2.4.3. Sizing of Decentralized BESS
The size of decentralized BESS was determined by the excess energy that was supposed to be stored at that bus. Similar to the case of centralized BESS, the maximum size of the decentralized BESS of the sunny day was used as the battery size.
2.5. Capital and Maintenance Cost of BESS Installation
In this work, the capital and maintenance costs of BESS installation exist only in the cases of centralized BESS installation. On the other hand, the customers are responsible for those costs in the case of decentralized BESS installation. The BESS capital cost,
, includes the cost of the battery, power electronic system, and replacement cost, which can be written as Equation (4) [
10]:
where
is the battery replacement cost of BESS,
is the rated power of BESS in kVA, and
is the maximum capacity of BESS in kWh.
The operation and maintenance cost,
, of BESS includes the fixed cost and variable cost. The fixed part includes the annual project costs, annual property taxes, and insurance. The variable part includes the standby losses [
2]. However, the variable cost has a very small value and can be ignored in this work. The
can be written as Equation (5) [
10]:
where
is the rated active power of BESS (kW).
The
,
, and
can be obtained from the technical properties of each battery technology, indicated as follows [
10]:
where
are the pre-assigned size of BESS in kWh, active power of BESS at time
(kW), and reactive of BESS at time
(kvar), respectively.
In order to determine the size of BESS installed in the distribution system, an optimal operation of BESS was performed, aiming to provide the maximum benefit of each season. The BESS size of the sunny day of each season was also evaluated and set as a constraint to prevent the reverse power flow. Then, the size of BESS installed in the distribution system was selected based on the maximum capacity of BESS obtained from each season and the sunny day. The sizing of BESS installed in the distribution system was collected in BESS parameters, including the active power of BESS , power of BESS , and capacity of BESS .
2.6. System Upgrade Cost
During the planning horizon, the system upgrade is normally required in the case in which the capacity of the transformer is reached. The system upgrade cost includes the cost of enlarging the capacity of the transformer, installing the additional transformer, and changing the location transformer and upgrade infrastructure. However, the system upgrade in this particular distribution system was required only once during the planning horizon, aiming to increase the capacity of the transformer. The change in transformer location was undesired in this case. Therefore, the system upgrade cost was included in a calculation of benefit. Additionally, since the project duration of selling the energy from the PV system was restricted to 10 years according to the condition in of Provincial Electricity Authority in Thailand, the system upgrade was performed as early as possible to minimize the impact of the inflation rate.
2.7. Cost-Benefit Analysis
In general, an implementation of BESS, along with PV systems in the distribution system, can provide several benefits to the system. In this paper, we focused on the utility benefits resulting from the implementation of BESS and a capacitor. The difference between implementation types of BESS, including centralized BESS, centralized BESS with LV capacitor, and decentralized BESS, was also taken into account. The considered benefits included the benefit of selling active power , loss reduction , system upgrade deferral , CO2 emission reduction , and deferral construction of a coal-fired power plant . Particularly, it is noted that all profits were achievable for centralized BESS and centralized BESS with LV capacitor installation. On the other hand, the selling active power cost and cost of CO2 emission reduction were unachievable for decentralized BESS installation. In the decentralized BESS case, the benefit of selling active power was non-existent because the active power generated from the PV system was totally stored and used by the customers. In addition, the benefit of CO2 emission reduction, which is obtained from a reduction of coal-fired power plant operation, was non-existent in this case since the energy stored in the decentralized BESS was supposed to be used at each bus and was not related to the operation of coal-fired power plants.
The NPV of utility was used as an objective function to analyze the cost-benefit of the project over a particular period. To obtain the present value of benefits, all benefits, as well as the costs for operation and maintenance, were multiplied by the factor except the system upgrade cost and the capital cost. is the inflation rate and is the discount rate of each country. is the number of years that the benefits and costs were considered. The detail of each benefit obtained from an installation BESS are explained as follows.
2.7.1. The Benefit of Selling Active Power
The benefit of selling active power was obtained from selling the stored active power in BESS owned by the utility to the customer [
22]. The purchase price of the active power to charge the BESS is normally lower than the selling price of discharge energy stored energy in BESS. In this paper, the charged energy of BESS included the PV output and active power from the upper grid. The PV output for charging the BESS was the excess energy from the load at each bus, and this energy was charged according to the operation strategy of BESS. After that, the charged energy would be sold in the periods when there is no power generation from PV systems. This benefit can be calculated as follows:
where
, and
are the active power discharged by BESS at time
, the active power purchased from PV output at time
, the active power purchased from upper grid at time
, the average electricity price of grid, the price of purchasing PV output, and the purchase price of electricity from the upper grid at time
, respectively. In addition, the efficiency of the PV systems is assumed to be decreased by 0.5% per year [
23]. The growth of the load is 4.51% per year [
11]. The electricity purchase prices of the upper grid are shown in
Table 2.
2.7.2. The Benefit of Loss Reduction
Normally, an installation of BESS in the distribution system can yield a reduction of power loss of the distribution system. Accordingly, this can provide a benefit to the investor. The benefit of loss reduction can be written as follows [
10]:
where
is the active power loss in the distribution system before the BESS installation at time
, and
is the active power loss in the distribution system after BESS installation at time
.
2.7.3. The Benefit of System Upgrade Deferral
Generally, the system upgrade is certainly required in case the capacity limitation of the transformer is reached. However, the installation of BESS can reduce the load on the transformer during the peak period, as well as flatten the overall load demand; then, it can delay the period required for system upgrade. The benefit of a system upgrade deferral was computed as below [
10].
where
and
are the average investment costs for a system upgrade in Thailand and the fixed rate for converting cost into the annuitized cost.
2.7.4. The Benefit of CO2 Emission Reduction
Frequently, the operation of the coal-fired power plants is utilized to compensate for the electricity demand during the peak period. These power plants normally cause the emission of CO
2, which is a massive cause of global climate change. Since the implementation of BESS in the distribution system can be used to supply the electrical power during the peak period, the operation of the coal-fired power plants can be decreased. The cost of saving emissions of CO
2,
, can be expressed in Equation (12):
where
and
are the total energy charged and discharged by the BESS (kWh), respectively.
and
are the coal consumption rate of power plants for supplying the energy during peak shaving and routine period, respectively. Then, the profit of a reduction in CO
2 emission was calculated by Equation (13):
where
is the cost of reduced emissions of CO
2.
2.7.5. The Benefit of Construction Deferral of a Coal-Fired Power Plant
Since an operation of BESS can stably supply the stored active power from PV output to the distribution system, the electrical demand can be increasingly compensated by an installation of BESS. Accordingly, the construction of a coal-fired power plant can be deferred. It is noted that there has not yet been literature considering this benefit in the BESS installation. The construction deferral benefit of coal-fired power plants was obtained as an economic benefit, as shown in Equation (14):
where
is the cost savings from a construction deferral of a coal-fired power plant for 1 kWh BESS in 1 year, and
is the average capacity of BESS of 3 seasons that is used to store PV output (kWh).
2.8. Problem Formulation
In order to maximize the benefit of the BESS implementation, we considered three cases of BESS installation, including the centralized BESS case, centralized BESS with LV capacitor placement case, and decentralized BESS case. The objective function for each case was also proposed, aiming to maximize the total NPV of utility, as follows:
Case 1: Centralized BESS installation
Case 2: Centralized BESS installation with LV capacitor placement
Case 3: Decentralized BESS installation
In this case, since the BESS was installed at the location where the customer’s PV systems were located, the size and location of the BESS would not be determined in solving the optimization problem. Also, the customers were responsible for the installation cost of BESS. However, the utility still earned the benefit from the BESS installation, in this case, in terms of loss reduction, system upgrade deferral, and construction deferral of a coal-fired power plant. The total NPV of utility for this case can be written as follows:
where
, and
are total NPV of the utility of centralized BESS case, total NPV of the utility of centralized BESS with LV capacitor case, total NPV of the utility of decentralized BESS case and planning horizon, respectively. The planning horizon of 10 years was assumed, according to the conditioned duration of the solar energy purchasing project in Thailand [
24]. The detail of parameters related to all benefits is listed in
Table 3.
2.9. Optimal Sitting and Sizing of BESS
In this paper, the optimal sitting and sizing of BESS were determined by solving the optimization problem aiming to obtain the maximum benefit. It is noted that those parameters were studied only in the case of centralized BESS and centralized BESS with an LV capacitor. The SSA was performed as the main optimization algorithm; meanwhile, the suitability of SSA was discussed by comparing the results to those obtained by the GA. The parameters of SSA used in this study included the population size of 200, iteration of 100, and controlling parameter
, where
x = 3,
l is the current iteration, and
L is the maximum number of iterations [
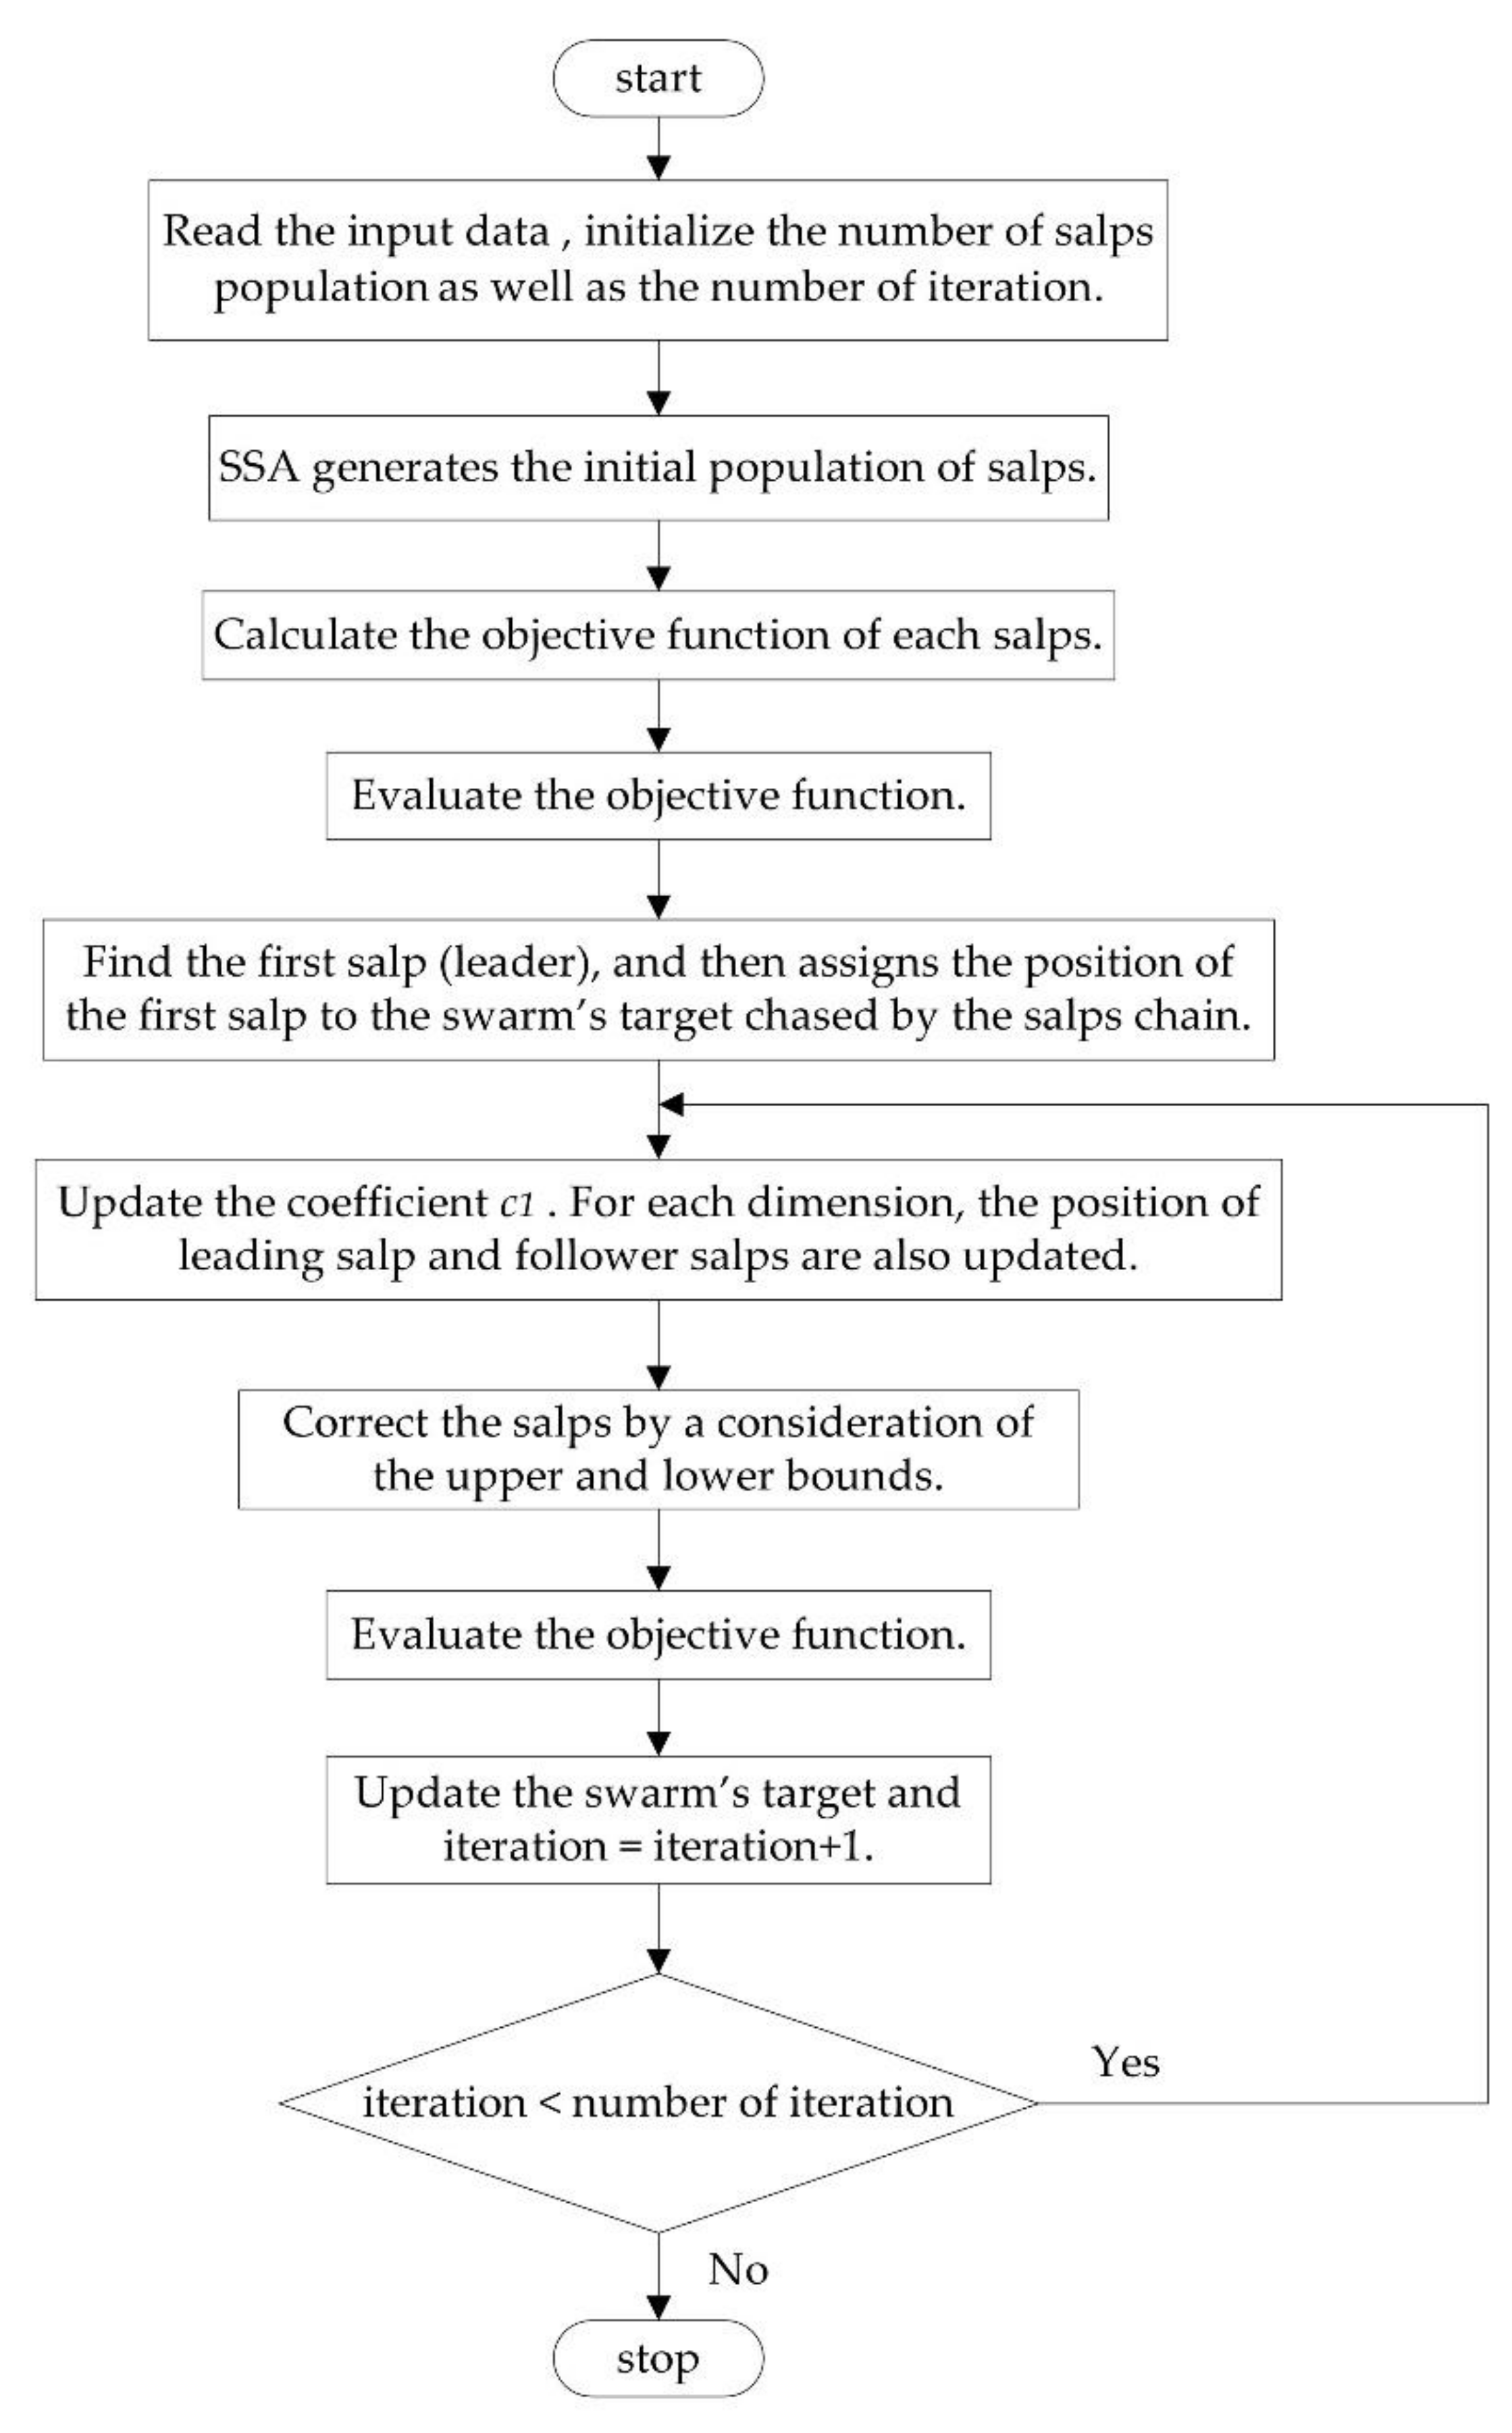
16]. The upper and lower bound of bus locations were 2 and 41. The pre-assigned size of BESS for 3 seasons generated by SSA was 200–800 kWh. The pre-assigned size of BESS on the sunny day was 450–800 kWh. In the case of the centralized BESS with an LV capacitor, the upper and lower bounds of the bus location were 2 and 41, while the sizes of LV capacitors were 5, 10, and 20 kvar. The optimization problem was solved by SSA for 5 runs, and then, the best result was collected. The procedure for finding the optimal sitting and sizing of BESS is summarized in the following steps:
Read the input data of the optimization problem, initialize the number of salps population, as well as the number of iterations.
SSA generates the initial population of salps, including the location and the pre-assigned size of BESS for 3 seasons and the sunny day. In the case of installing centralized BESS with LV capacitor placement, the location and size of the LV capacitor are generated as an initial population in this step.
Run the power flow analysis of 3 seasons and the sunny day. Evaluate the active power dispatched by BESS by applying the iterative method to each salp.
Supply the active power obtained in Step 3 into the distribution system, and then run the power flow analysis of each salp.
Calculate the rated power, rated inverter size, and size of BESS for 3 seasons and the sunny day of each salp.
The maximum size of BESS for 3 seasons and the sunny day are set as the size of BESS.
Calculate the number of a system upgrade.
Calculate the total NPV of utility.
Evaluate the objective function of each salp.
Find the first salp (leader) with the best fitness, and then, assign the position of the first salp to the swarm’s target chased by the salps chain.
Update the coefficient . For each dimension, the position of the leading salp and follower salps are also updated.
Correct the salps by a consideration of the upper and lower bounds.
Repeat Steps 3 to 8, and then evaluate the objective function of each salp.
Update the swarm’s target.
Check the terminating condition. If an iteration is below the maximum number of iterations, go to Step 10. Repeat Steps 10 to 14 until the maximum number of iterations is reached. Then, end the process with the obtained optimal solution.
The above procedures can be summarized in the following flow chart, as shown in
Figure 4.
In addition, the parameters of GA included the string length of 10, a population size of 200, iteration of 100, crossover rate of 0.95, and mutation rate of 0.18. The upper and lower bound of the BESS location, the pre-assigned size of BESS for 3 seasons, the capacitor location, and the sizes of LV capacitors were similar to those used in SSA.
2.10. Technical Constraints
The technical constraints regarding the proposed objective function are given below.
Voltage constraint:
Line overload constraint:
Power flow balance: , where is the voltage magnitude at bus and time , and are the minimum and maximum limitations of voltage magnitude, respectively. is the current magnitude of branch , is the maximum limitation of current magnitude of branch . and are the active and reactive power of distributed generation (DG), respectively. and are the active and reactive power dispatched by BESS, respectively. and are the active and power of the line loss, respectively. and are the active and reactive power demand of bus, respectively. and are the active and reactive power load on the transformer, respectively. is the reactive power of the capacitor.
3. Case Study
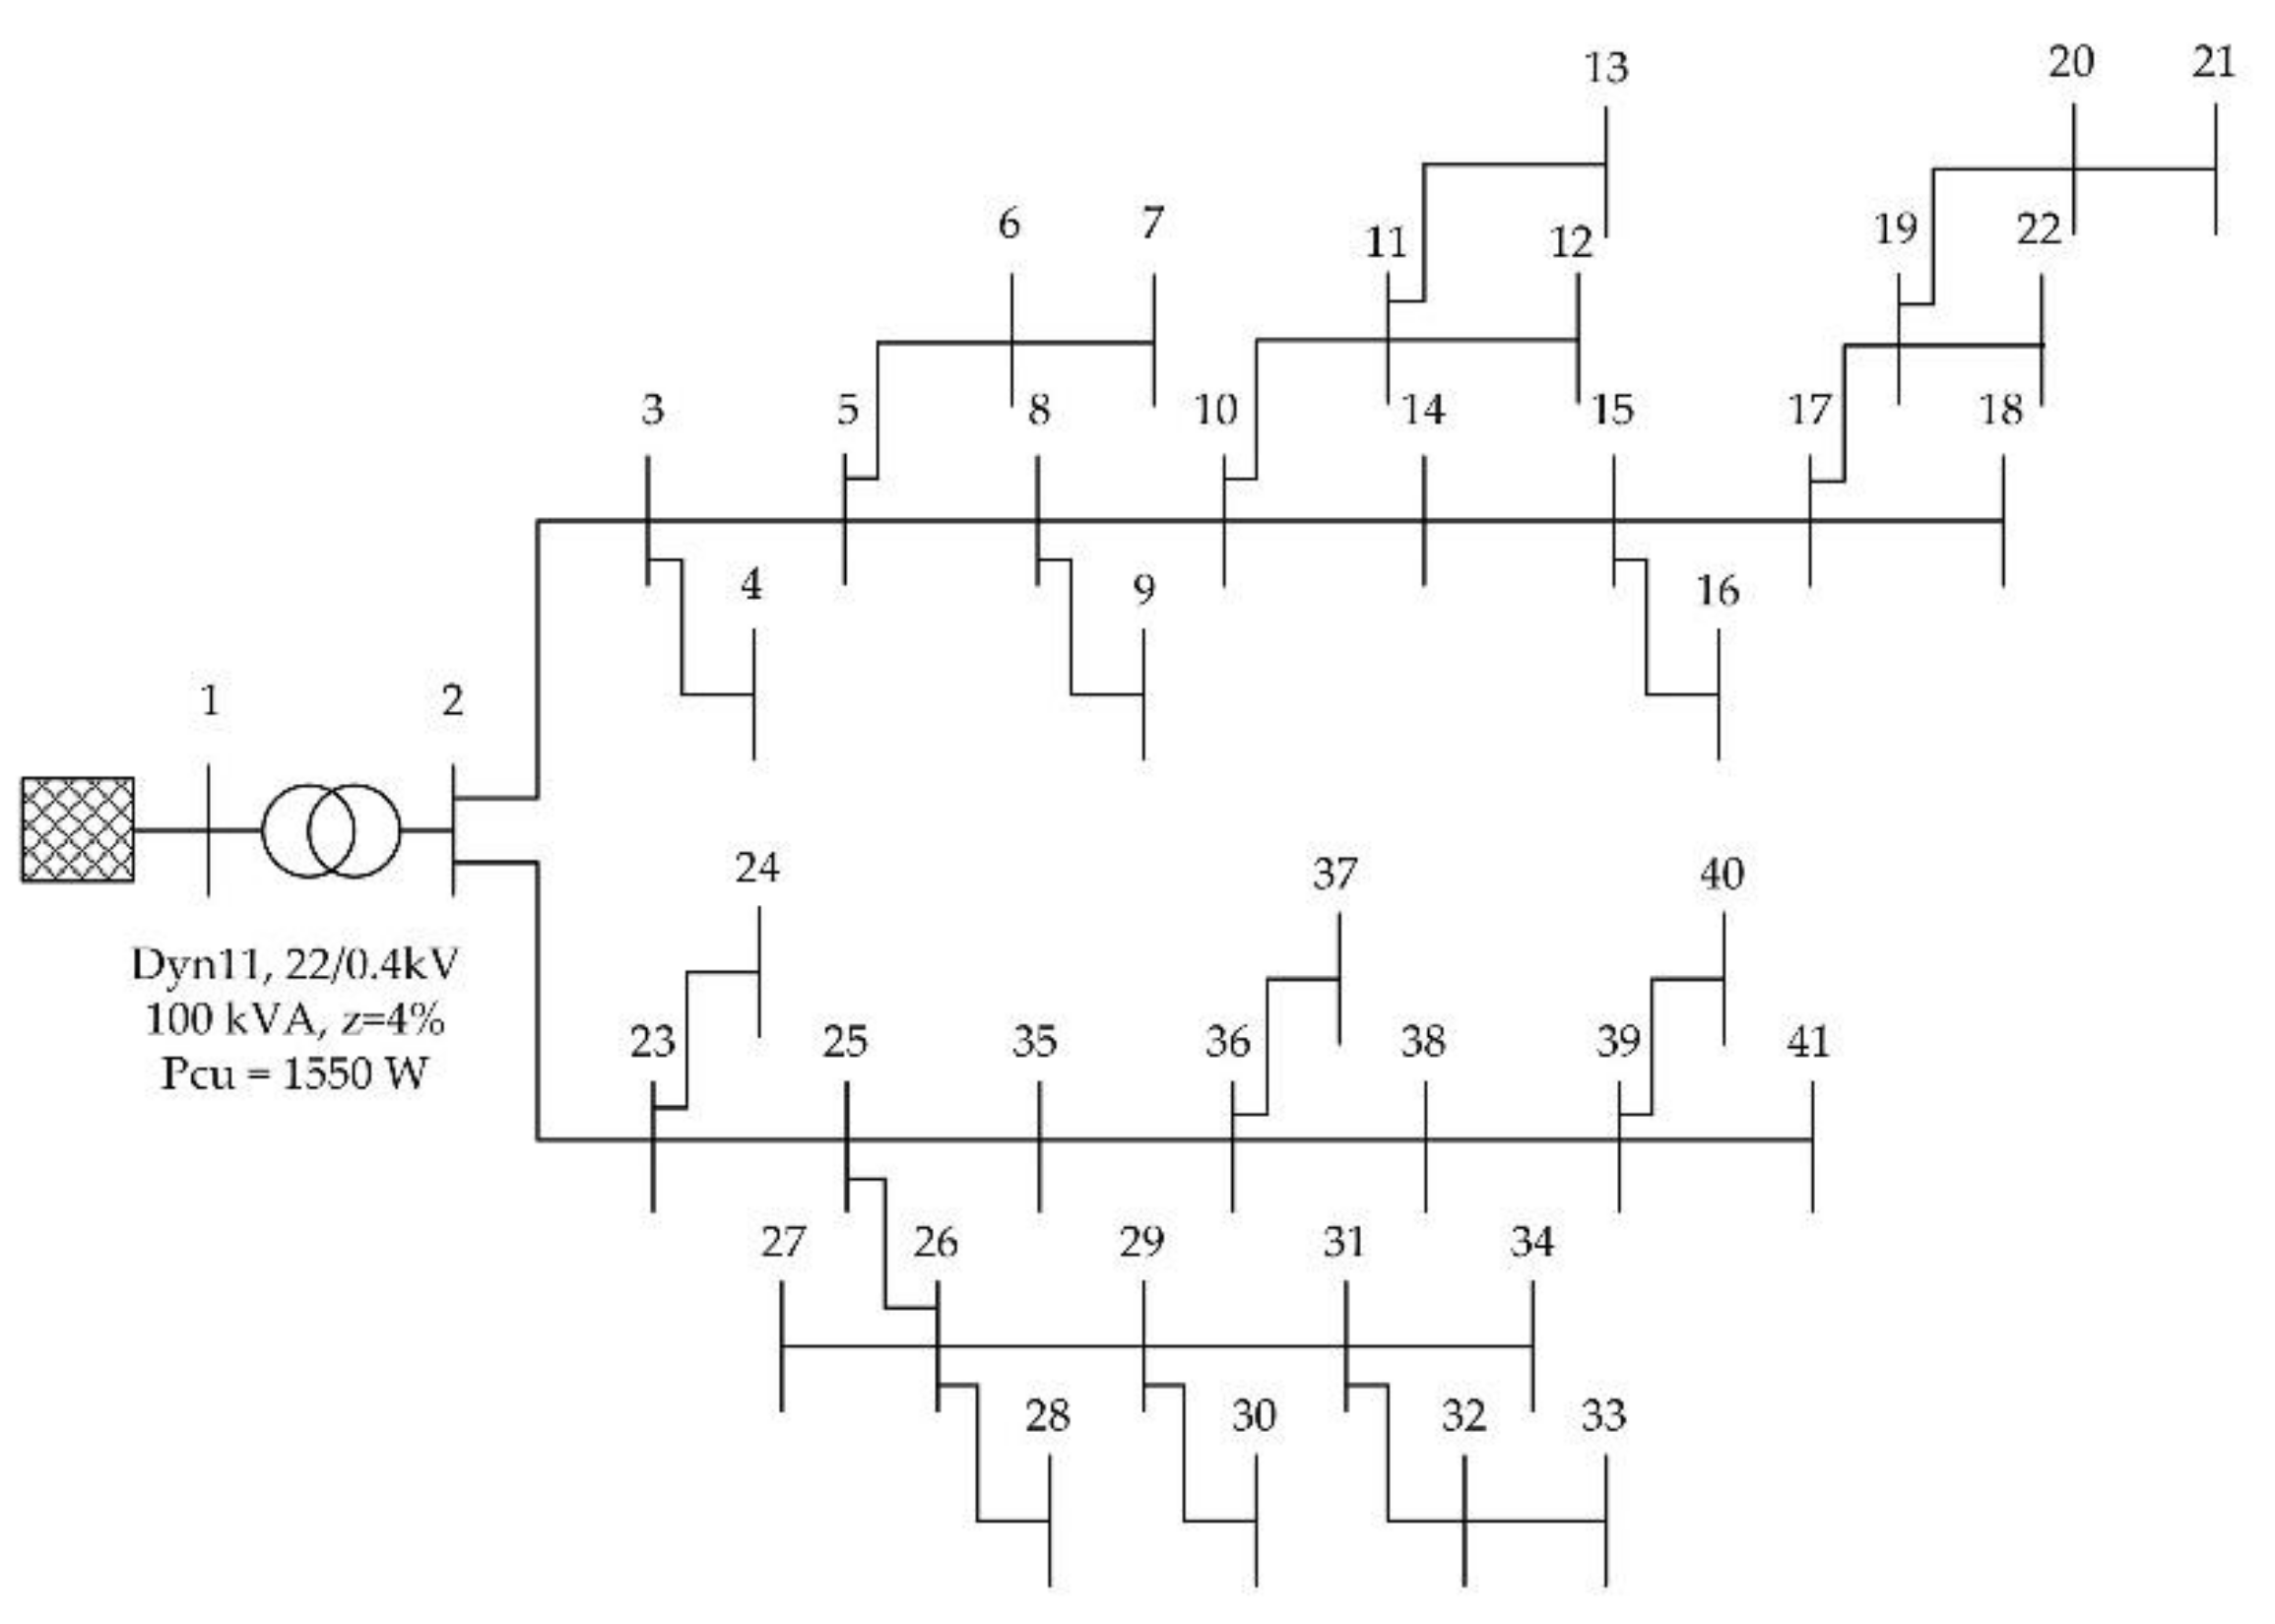
The 41 buses practical radial LV distribution system located at Ratchaburi province, Thailand, was focused on as the test system, as shown in
Figure 5. All buses in the system were connected to the medium voltage system through the transformer with 100 kVA, 3 phase, 22 kV/0.4 kV. The peak load profile of three seasons, including the winter, the summer, and the rainy season, are shown in
Table A1, where the bus data can be obtained from [
11]. Bus number 1 was selected to be the slack bus, with the initial conditions including the voltage magnitude of 1.01 p.u. and an angle of 0 degrees. The limitation of the upper and lower voltage magnitude was 1.05 p.u. and 0.95 p.u., respectively, according to the PEA standard [
25]. All loads and PV systems connected to the distribution system were assumed to be a three-phase balance. The average load factor of the distribution system was 0.78. The rated PV systems of 5 kW with a power factor of 1 was assumed. The PV systems were installed at all load connected buses. The number of days for one year was 365 days, including 120 days of winter (85 workdays and 35 holidays), 92 days of the summer (65 workdays and 27 holidays), and 153 days of the rainy season (110 workdays and 43 holidays). In addition, calculating all the benefits and the costs throughout a year was represented by 72 h in which hours 1 to 24 represented the winter, hours 25 to 48 represented the summer, and hours 49 to 72 represented the rainy season.
In particular, the base case in this work is defined as the conventional distribution system where a high PV penetration level of 155% was integrated, and the PV systems were assumed to be installed at all load-connected buses. The penetration level is normally calculated by a ratio of PV output (kW) to transformer capacity (kVA). Since it is challenging to manage the high PV penetration level of 155% in the focused distribution system, we purposely aimed to handle this situation by using an installation of a centralized BESS, centralized BESS with LV capacitor placement, and decentralized BESS in the distribution system. The total NPV of utility was used as the indicator, indicating the benefit.
4. Results and Discussion
The parameters of the distribution system for the base case, the case with only centralized BESS installation, installation of centralized BESS simultaneously with an LV capacitor, and decentralized BESS installation, are shown in
Table 4. The high PV penetration of 155% was integrated into the distribution system for all cases. For the base case, it was shown that the maximum voltage
of the distribution system was 1.0504 p.u., which violated the system standard. Meanwhile, the reverse power flow
to the upper grid of 87,138 kWh occurred over the planning horizon. Then, it was necessary to eliminate the reverse power flow because it could cause overvoltage and reduce the power quality of the distribution system. Accordingly, we proposed three cases of BESS installation classifications in order to handle the reverse power flow in the system, as well as to maximize the NPV of utility. The discussions are given as follows.
Firstly, the suitability of SSA is discussed as follows: From
Table 4, it is obviously seen that SSA can provide higher NPV of utility in the cases of centralized BESS and centralized BESS with LV capacitor placement. The reason is due to the better procedure for finding the solution of SSA compared to GA. During the solution finding of SSA, there is a procedure for updating the leading salp with respect to the best fitness (the swarm’s target). And then, the leading salp will always explore and exploit the space around it. On the other hand, the solutions of GA were updated by a random process without a target. Then, the SSA is more suitable for optimizing the NPV in this particular optimization problem than the GA.
From the results, it is seen that no reverse power flow occurred in the distribution system for all cases of BESS implementation. This was because the BESS was installed, aiming to store the reversed energy, and then the stored energy would be supplied to the system in the other periods when there is no electricity generation from the PV system. The maximum voltage of the system was also within the standard for all cases. When considering the total NPV of utility, it was shown that the installation of centralized BESS provided the lowest total NPV of the utility of –11,384 USD. The optimal sizing and sitting of BESS, in this case, were 623.77 kWh and bus 6, respectively. When an addition optimal LV capacitor was installed, the total NPV of utility increased from −11,384 to −4289 USD, i.e., 62.32% improvement. The optimal BESS sizing and sitting, in this case, were 624.87 kWh and bus 10, respectively. The optimal size and location of the LV capacitor were 20 kvar and bus 32, respectively. Remarkably, installation of a decentralized BESS could provide the maximum total NPV of 33,862 USD. The sizing and location of BESS, in this case, are detailed in
Table A2. From the analysis, it was found that the investment cost of BESS installation had a highly influential impact on the NPV. In this particular case, an installation of decentralized BESS could provide a higher benefit than the other cases because the investment cost of the storage system was the responsibility of the customer and was not included in the calculation of the NPV of utility.
For the difference between the case with an installation of centralized BESS and the case where both centralized BESS and an LV capacitor were installed, it was found that the installation of a capacitor could significantly improve the total NPV of utility. This is because the capacitor normally supplies the reactive power load to the system, which could further reduce the total load of the transformer. Accordingly, the capacity limitation of the transformer was extended, yielding an extension of the planning horizon. As can be seen from the system upgrade parameter, the upgrade is not required in the case where the centralized BESS and LV capacitor were simultaneously installed. Whereas, if the system upgrade was required once during the planning horizon for the other cases, then the cost for the system upgrade was included in the total cost for those cases. From considering only the profits, it was found that the installation of centralized BESS and centralized BESS with an LV capacitor could provide higher profit than the decentralized BESS installation around 63.01%. This was because the decentralized BESS installation could only obtain benefits from loss reduction, system upgrade deferral, and construction deferral of a coal-fired power plant, whereas the cases with centralized BESS could obtain all benefits.
For the effect of BESS installation on the load factor, it was found that the average load factor after the BESS installation was higher than the average load factor before the BESS installation for the three proposed cases. This was because the excess energy that existed in the base case was stored by BESS. This stored energy was supplied to the system in the other specific periods, then the load profile of the system after the installation of BESS was more flattened than the base case. It was also indicated that the load factor after the installation of centralized BESS was higher than that of the decentralized BESS installation. The reason was that an operation strategy of the centralized BESS could be controlled by the utility, aiming to flatten the load profile. On the other hand, the operation of decentralized BESS was utilized only for the purpose of storing excess energy.
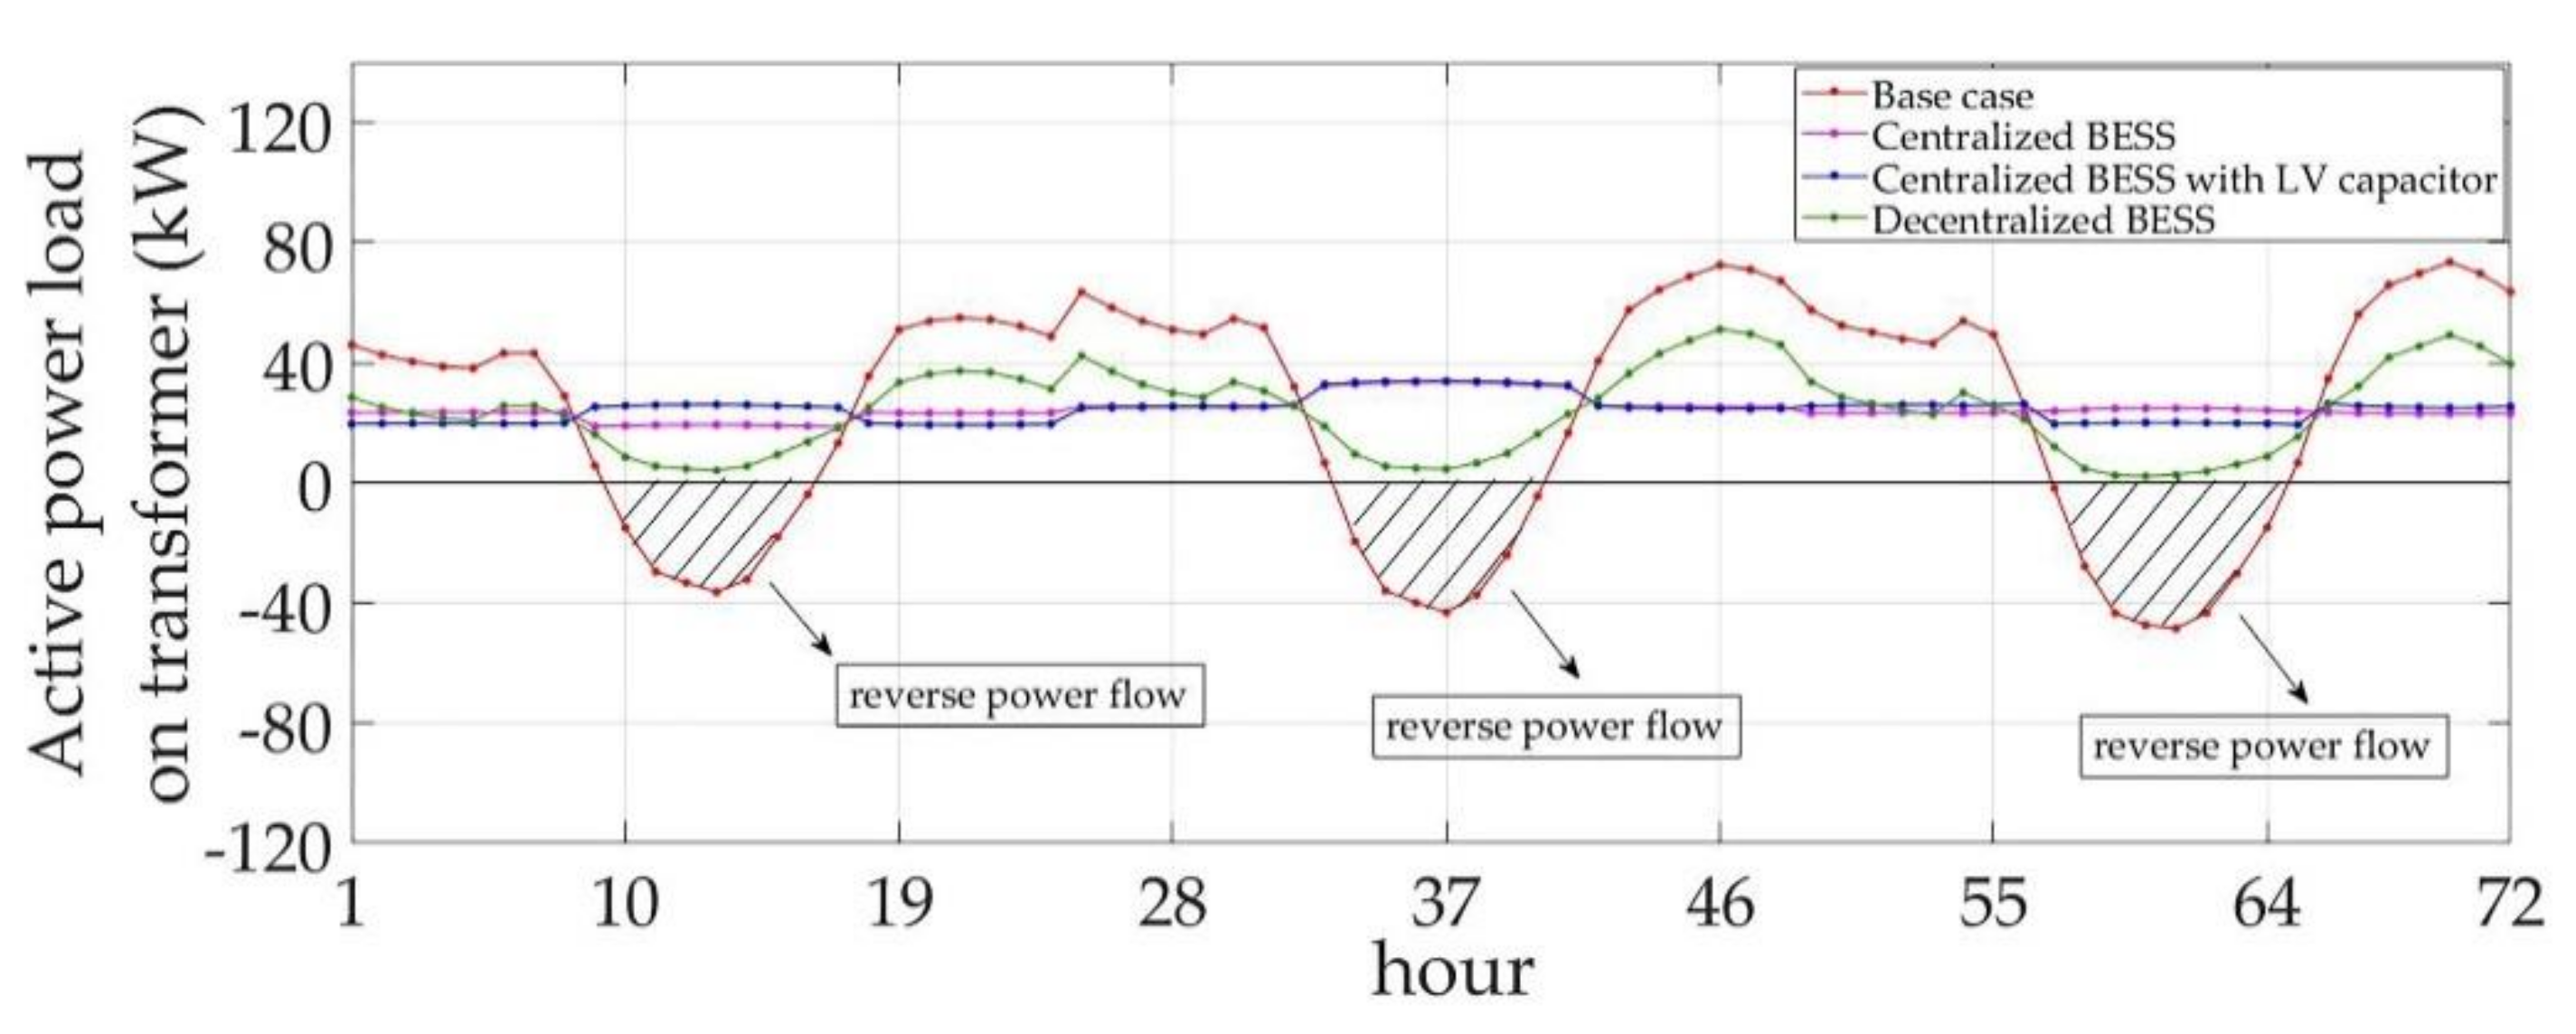
Figure 6 shows the load on the transformer for three seasons of the base case, the case with only centralized BESS installation, the case in which the centralized BESS with an LV capacitor were simultaneously installed, and the case with decentralized BESS. The winter was represented by hours 1 to 24, the summer was represented by hours 25 to 48, and the rainy season was represented by hours 49 to 72. The negative value of the load indicates the excess energy reversed to the upper grid. For the base case, it is seen that there was an existence of excess energy, which could cause the overvoltage in the distribution system. When the BESS was implemented, the results indicated that the excess energy was totally eliminated for all cases where the load on the transformer became more flattened than the base case. The load on the transformer of the centralized BESS case was similar to the centralized BESS with the LV capacitor case. Also, the load on the transformer of both centralized BESS cases was more flattened than the decentralized BESS case. This was because the stored energy of both centralized BESS cases could be explicitly supplied to the system in a specific period to control the flattening of the load profile. On the other hand, the stored energy of the decentralized BESS case was used to serve the electricity demand of the customer, and it was unable to be utilized for flattening the load profile in this case. Then, an installation of both centralized BESS cases could yield a better load factor of the distribution system than the decentralized BESS case. It was also noticed that the larger alternation of load on the transformer of the decentralized BESS case could cause poor impacts on the system in terms of reducing the transformer capacity limitation. As a result, a system upgrade will be required within a shorter period than for the centralized BESS cases.
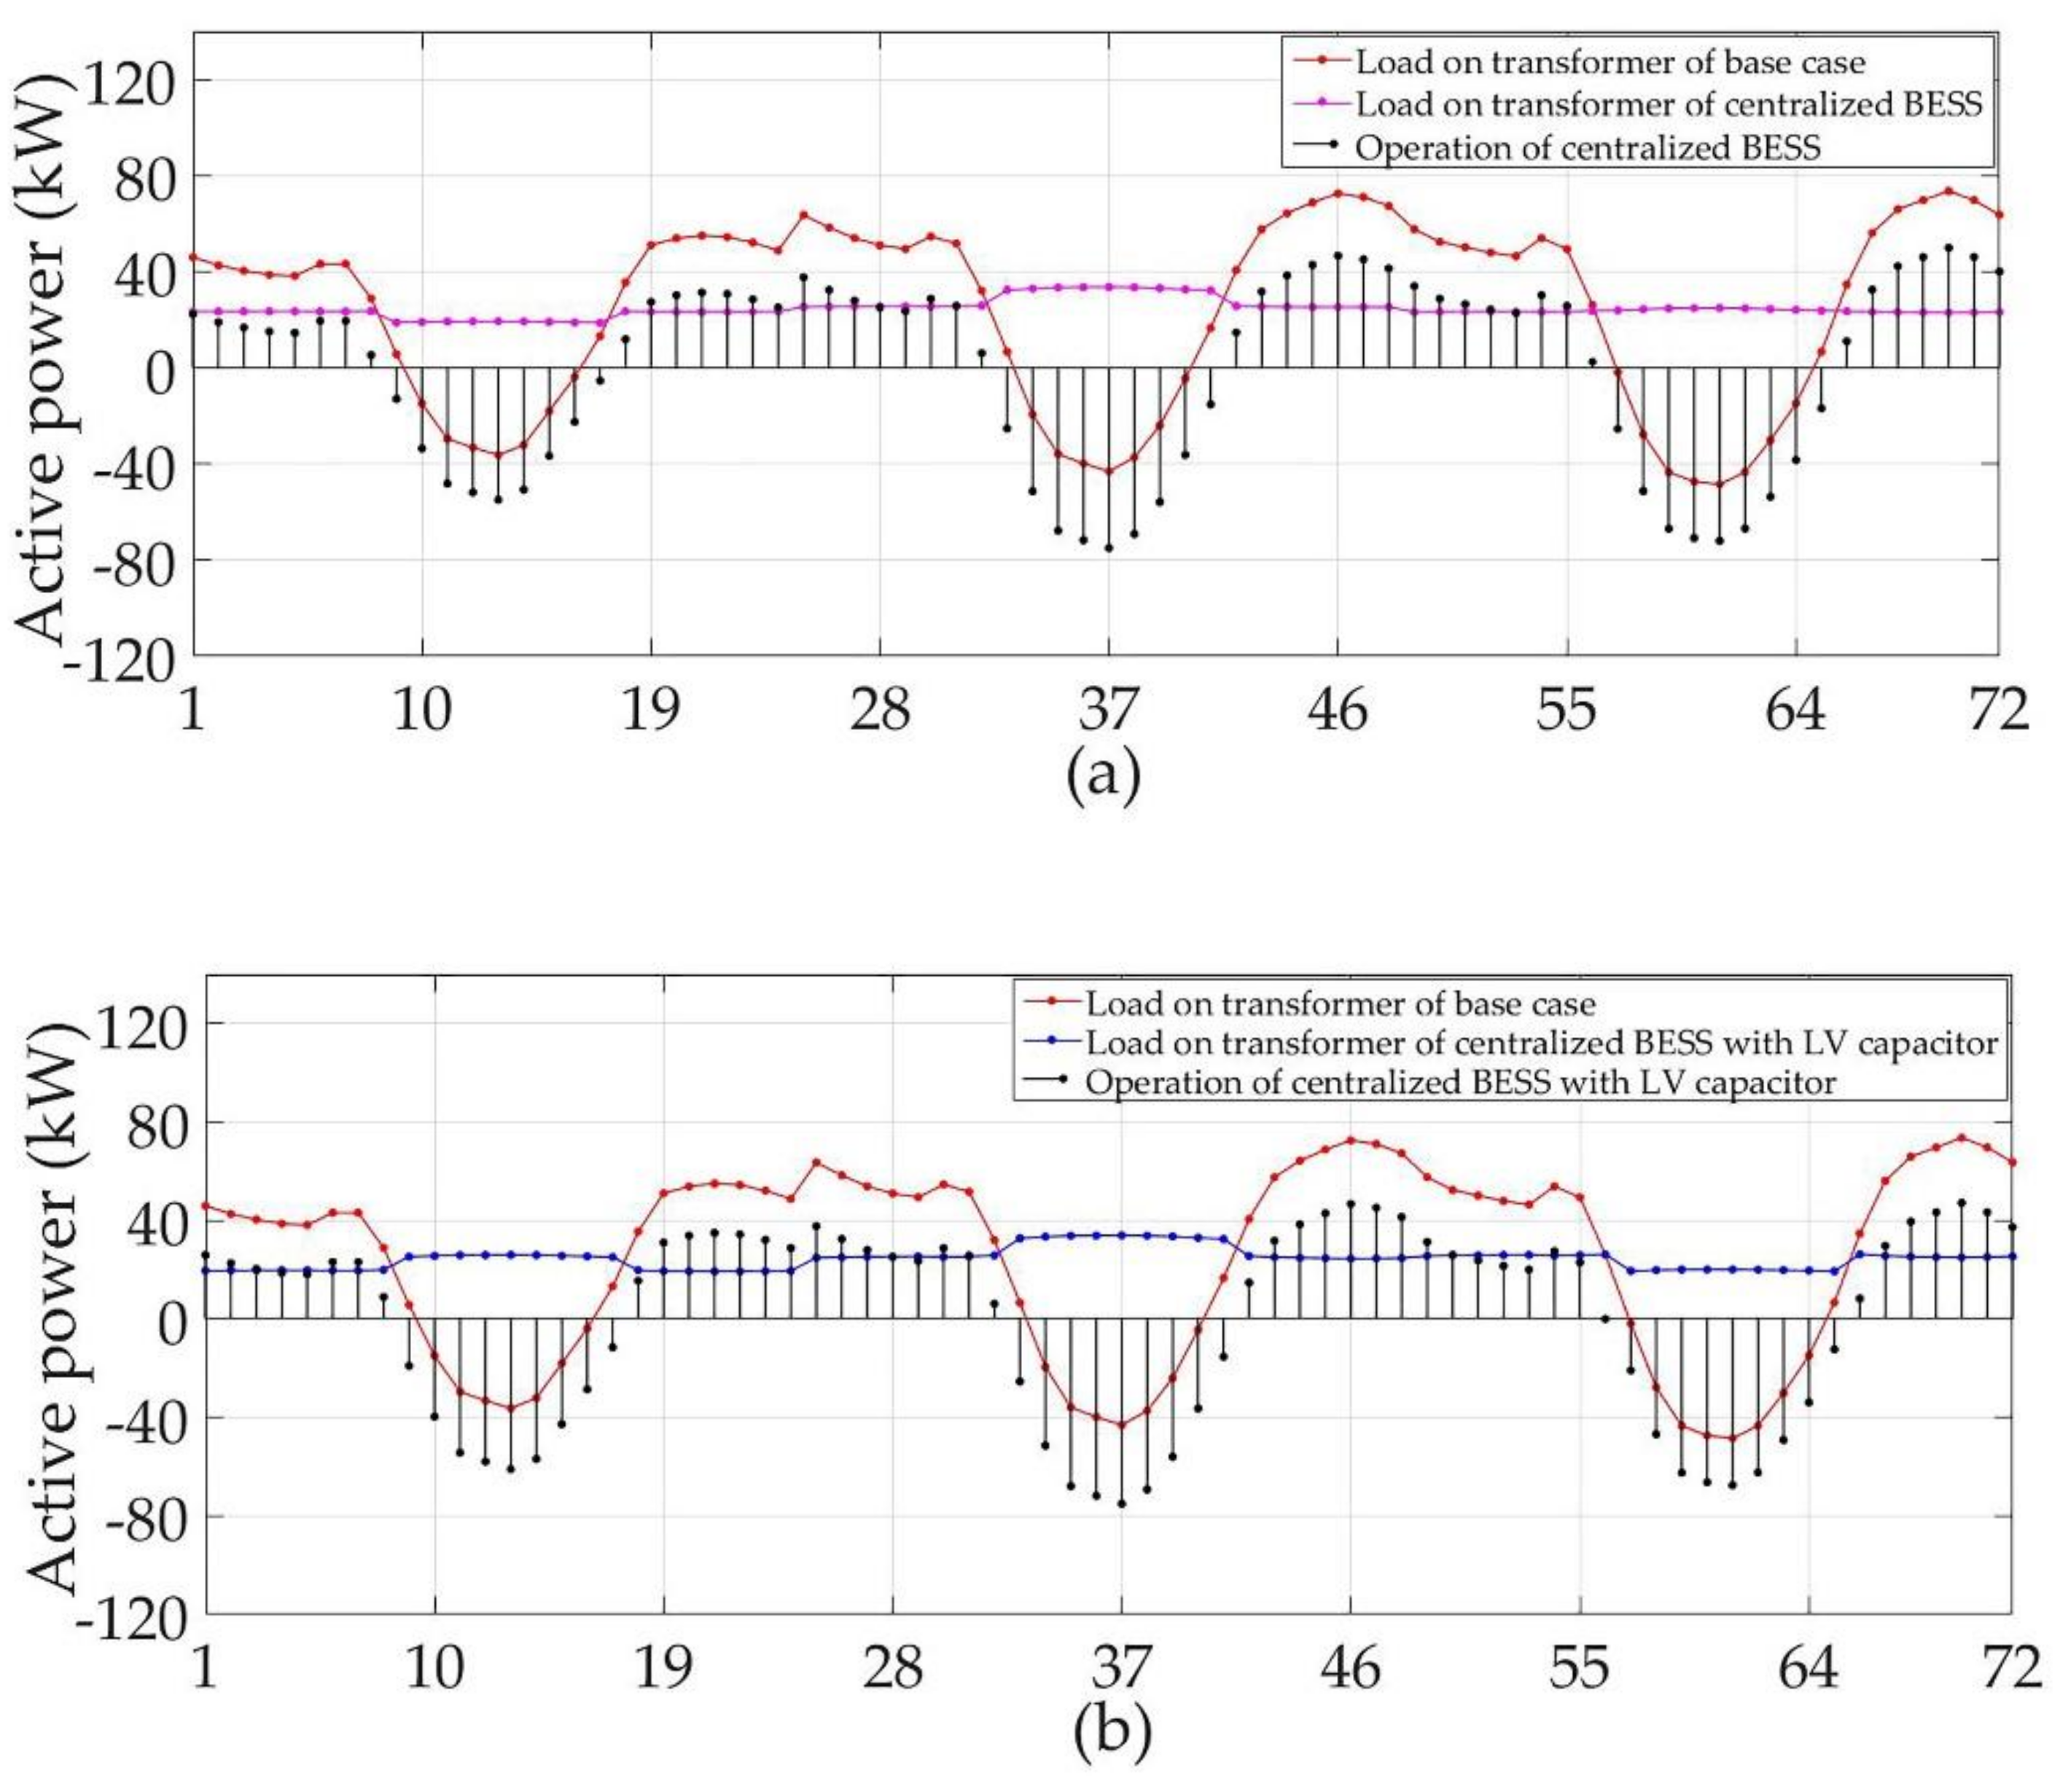
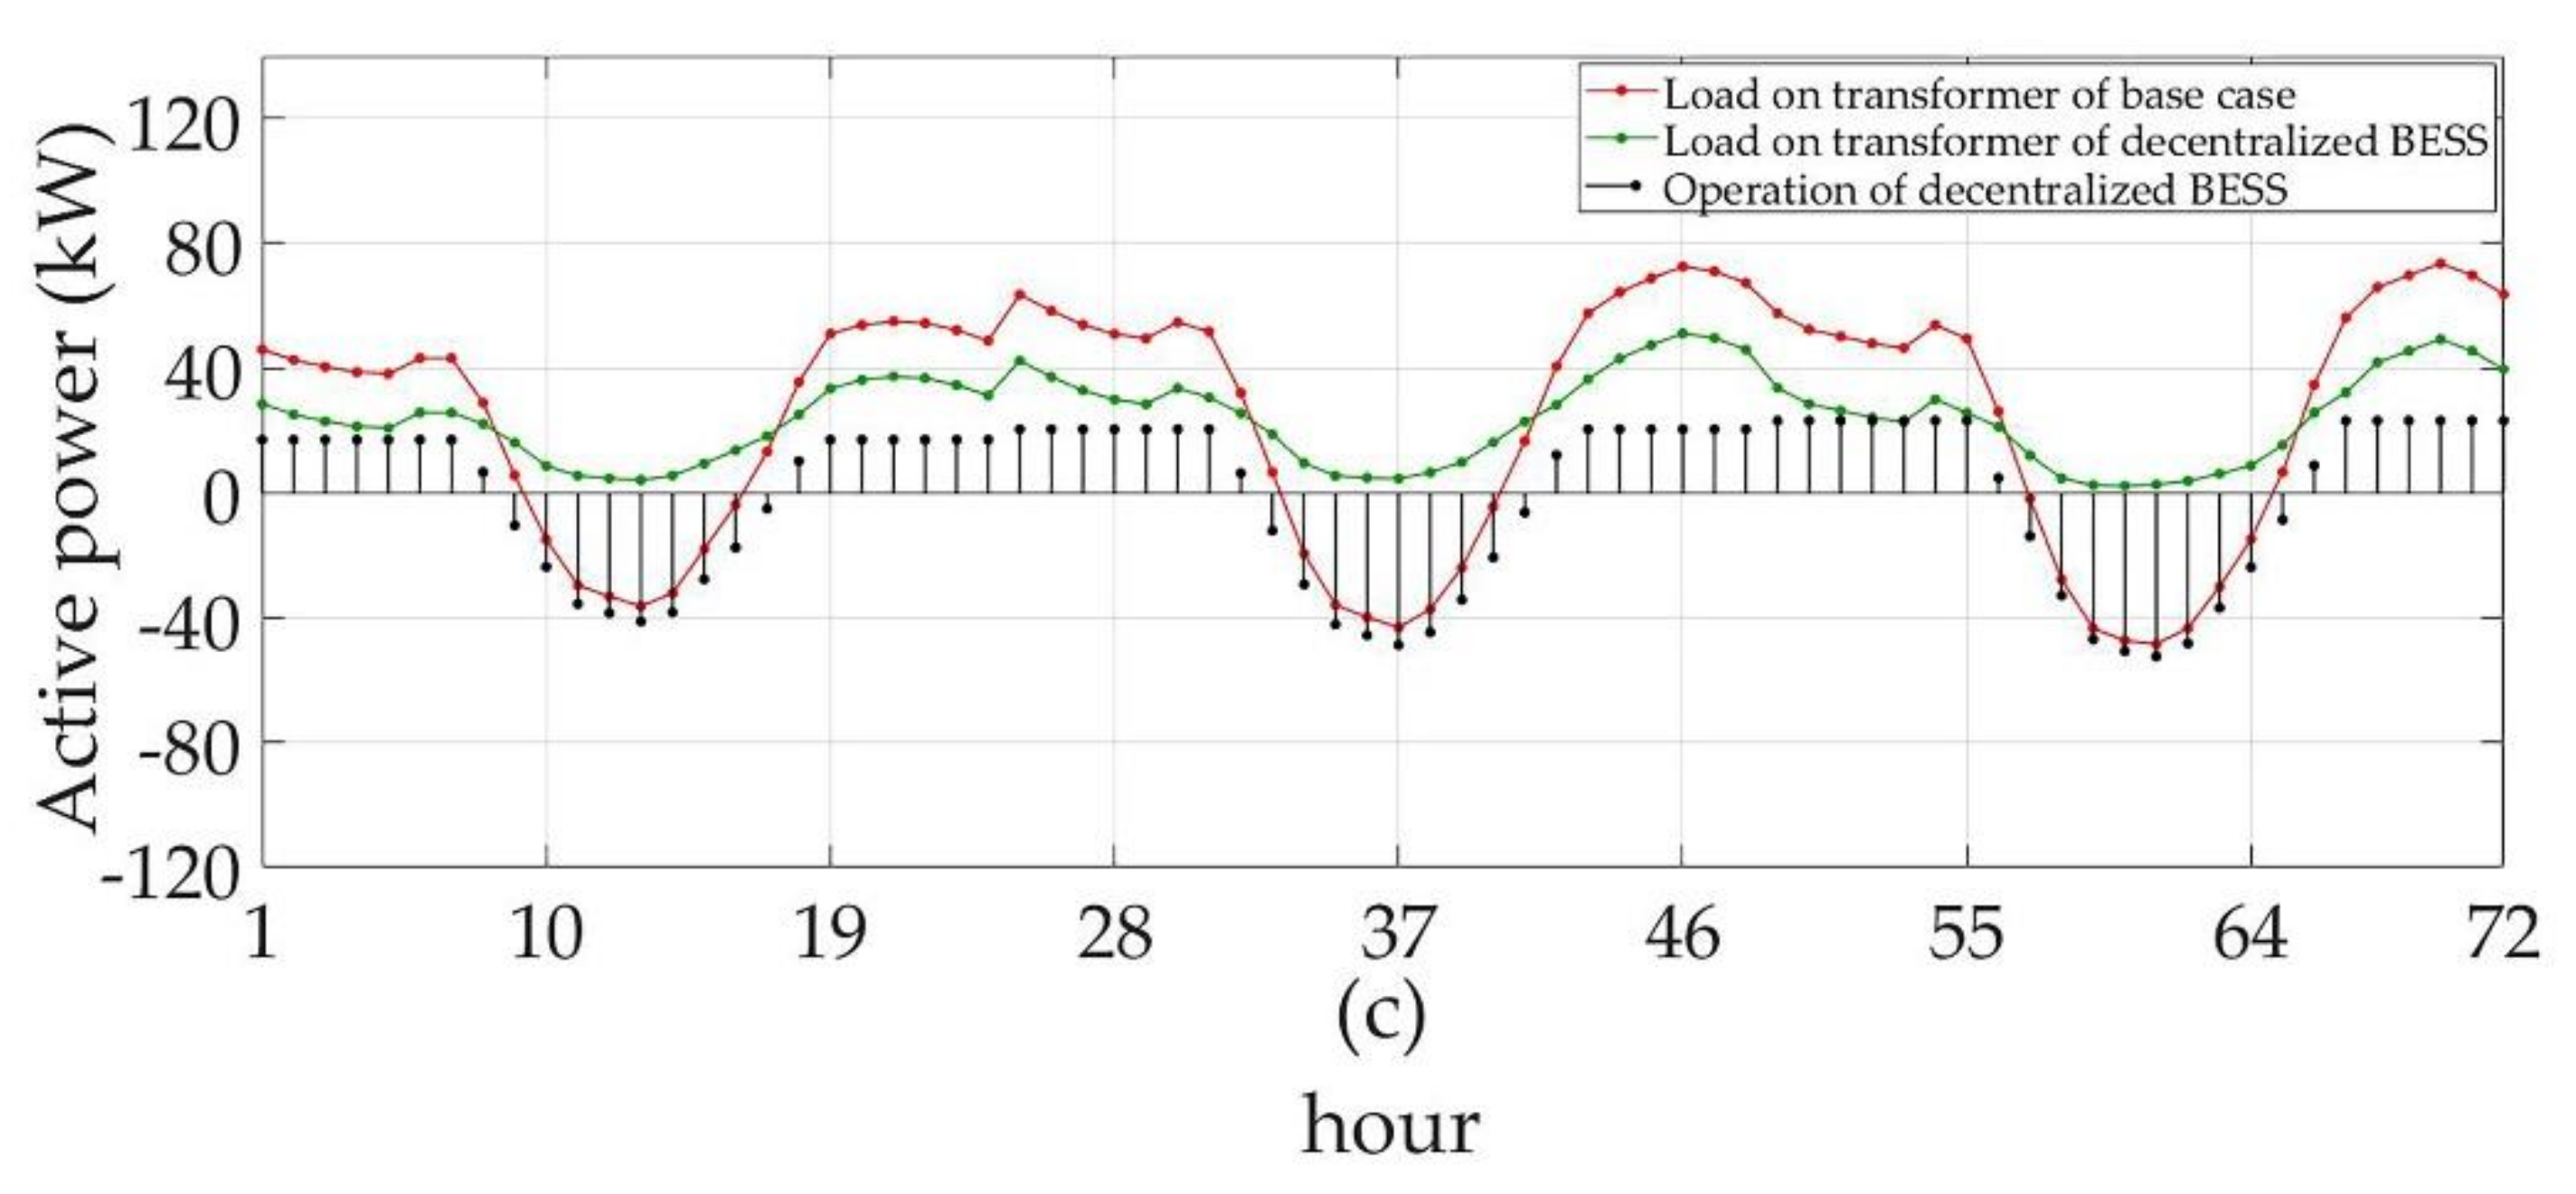
Figure 7a–c shows an operation of BESS for three cases, including centralized BESS, centralized BESS with an LV capacitor, and decentralized BESS installation. The positive and negative sign of the BESS operation represents the situation of discharging and charging the BESS, respectively. The excess energy exists during the period when the PV output exceeds the electricity demand of the system. When the BESS was implemented, the excess energy was totally eliminated through charging the BESS, according to the charging strategy shown in the figures. And then, the discharging BESS operation indicated an injection of stored energy into the system. The difference in the BESS operation for each case was indicated in the figures. In addition, it is also seen that the active power charged by the centralized BESS must be more than the reverse power flow since the active power from the upper grid has to be utilized for charging the battery in order to flatten load profile, as proposed in the operation strategies.
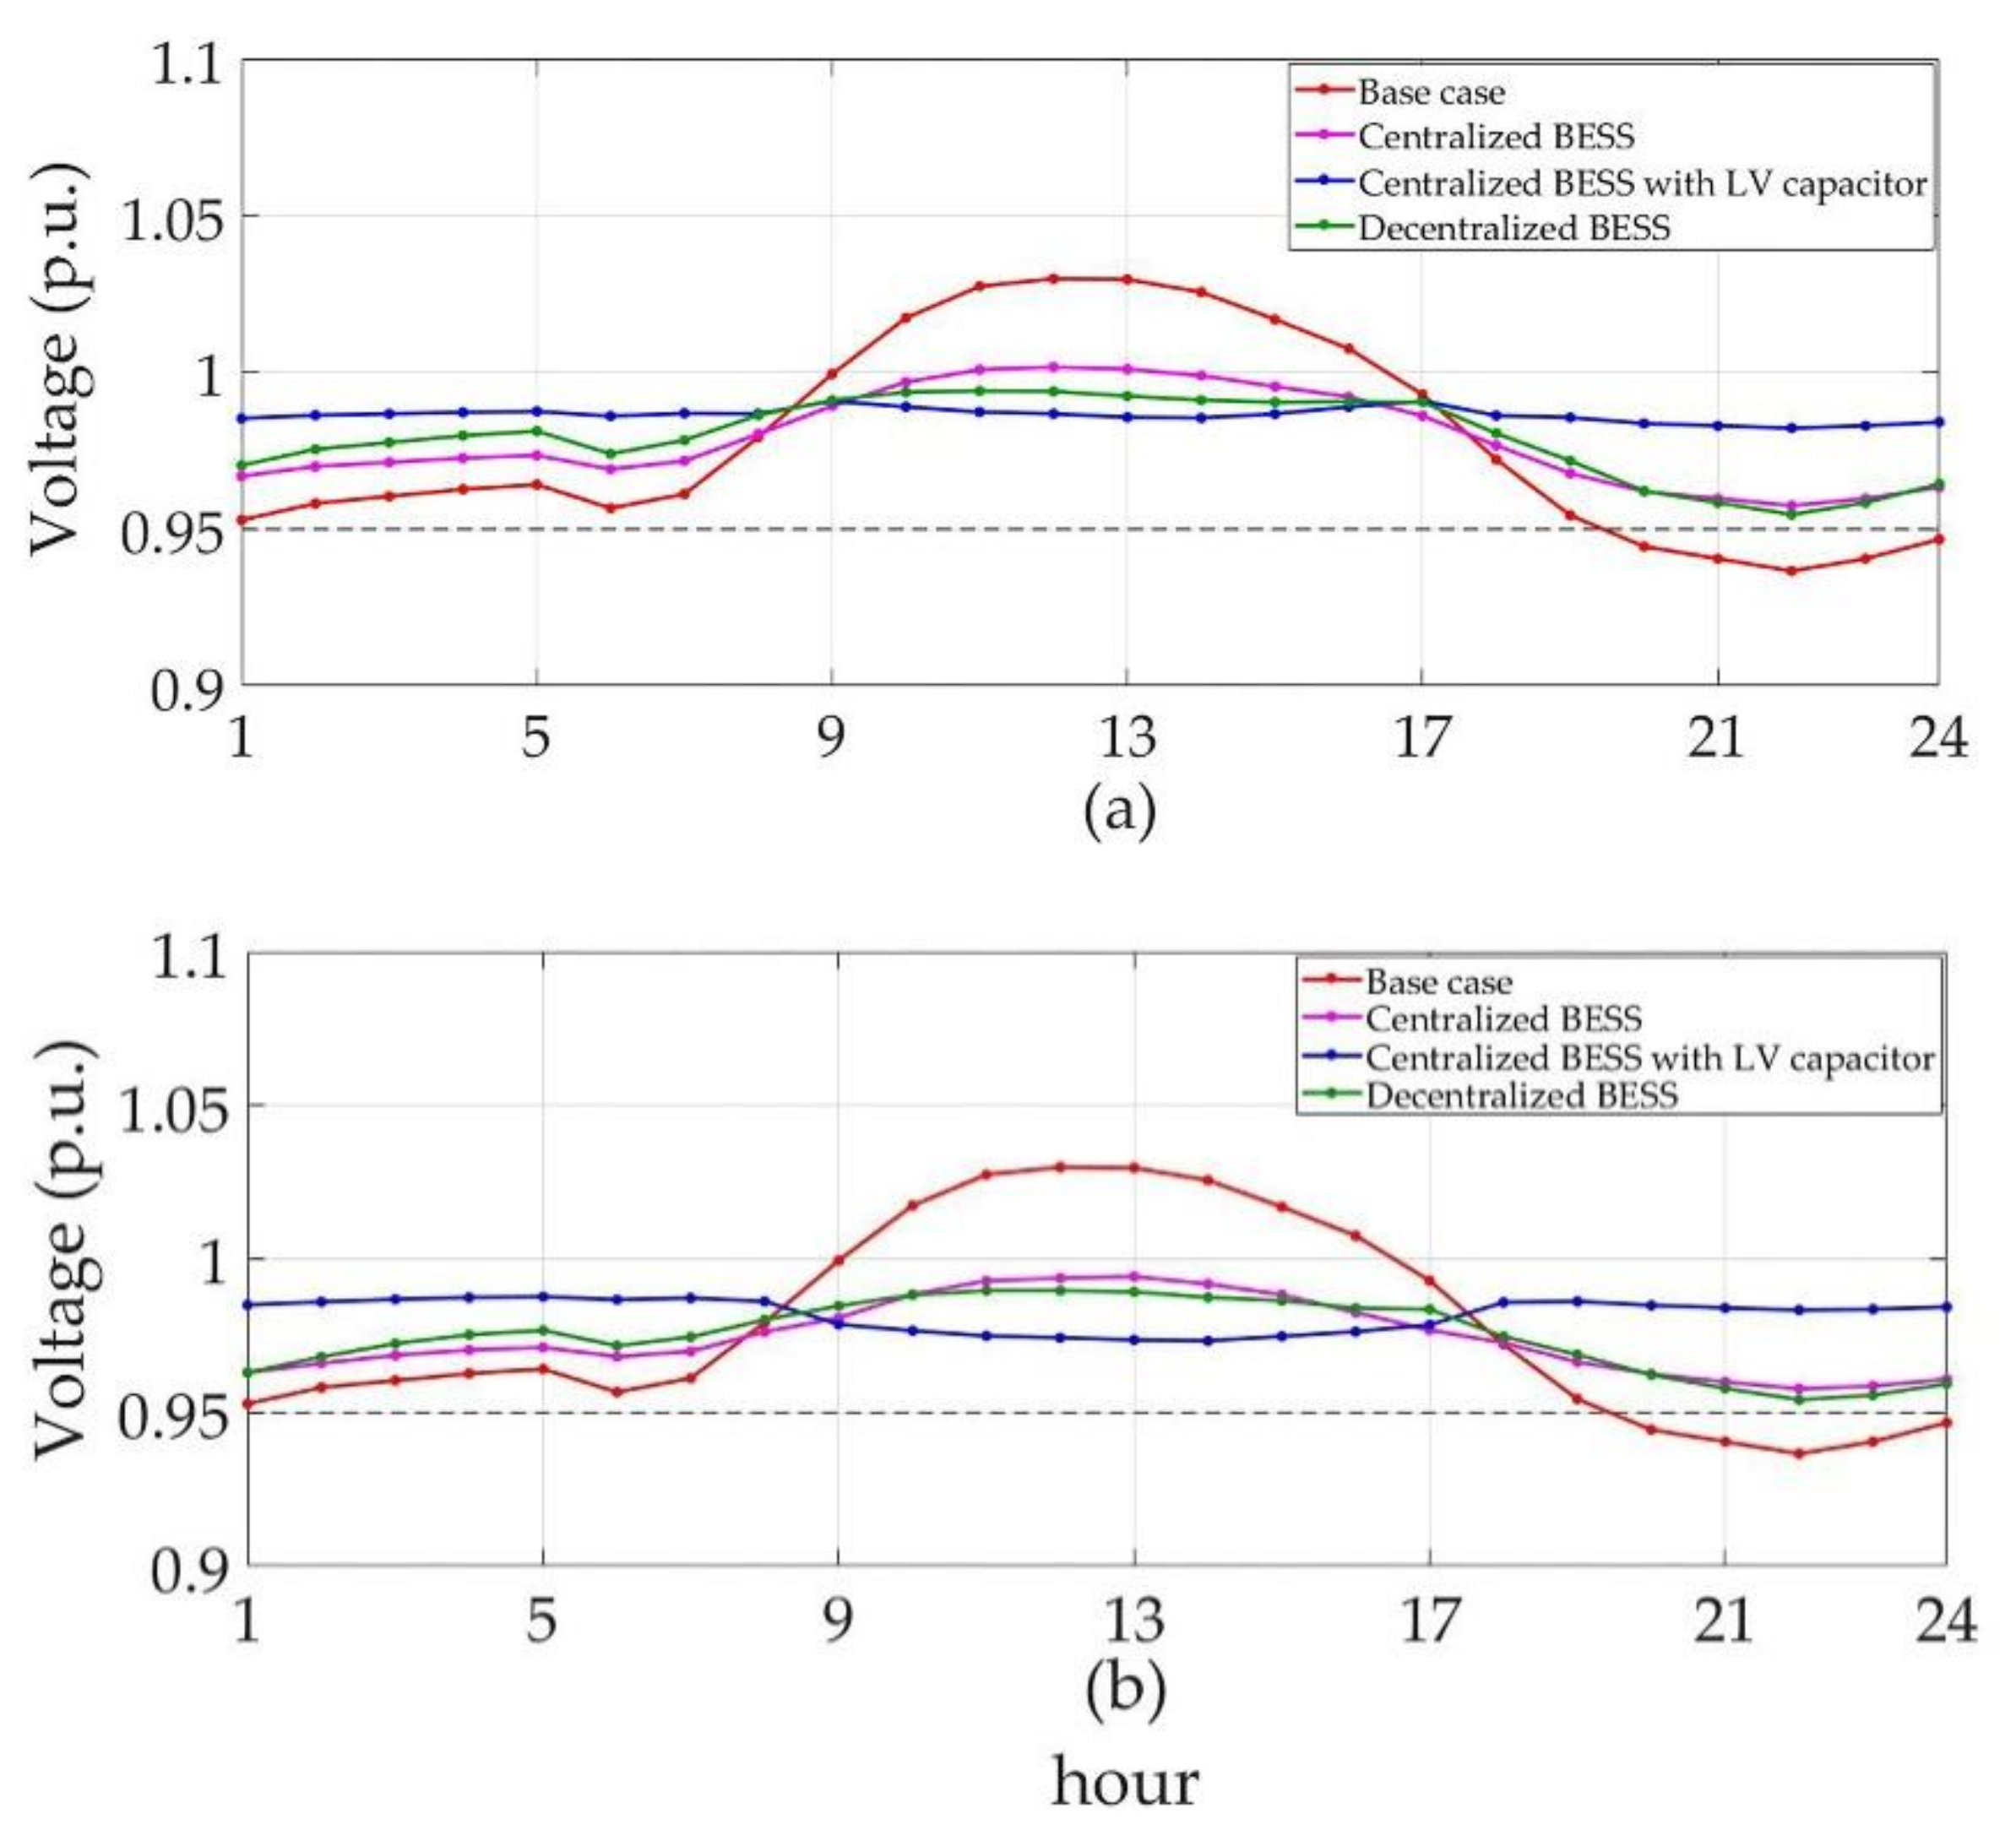
Figure 8a,b shows an example of the voltage magnitude of the distribution system before and after the installation of BESS at bus 21 of the rainy season and summer, respectively. For the base case, the voltage magnitude of those buses could be reduced to 0.9366 p.u. for the rainy season and 0.9383 for the summer, which was beyond the limitation. After the implementation of BESS, the results showed that the voltage magnitude became within the limitation for all cases. The reason is that the BESS normally supplies the active power to the distribution system, which can increasingly compensate for the load during the specific period. Therefore, the voltage magnitude of the system can be increased. From the results, it was found that the installation of centralized BESS with an LV capacitor could provide a better overall voltage magnitude than the other cases. This was because an additional reactive power injected from the LV capacitor could improve the voltage magnitude profile of the system.
From the overall results, it was found that the installation of BESS can be utilized to handle the distribution system during the situation in which very high PV penetration is integrated. Installation of centralized BESS with an LV capacitor would provide higher benefits than a case in which only centralized BESS is installed. Moreover, the installation of the decentralized BESS case would provide the highest total NPV since the customer is responsible for the investment cost in this case. The load on the transformer and the voltage profile of the system can be significantly improved by the installation of BESS for all cases. Consequently, the decentralized BESS installation is selected as the most profitable implementation for the utility regarding this particular distribution system.


