Article

N-Doped Porous Carbon from Sargassum spp. as Efficient Metal-Free Electrocatalysts for O2 Reduction in Alkaline Fuel Cells

1
Unidad de Energía Renovable, Centro de Investigación Científica de Yucatán, Mérida, Yucatán 97302, Mexico
2
Fuel Cell Laboratory, Arizona State University, Mesa, AZ 85212, USA
3
División de Ciencias e Ingeniería, Universidad de Quintana Roo, Chetumal, Quintana Roo 77019, Mexico
4
Departamento de Física Aplicada, Cinvestav Unidad-Mérida, Mérida, Yucatán 97310, Mexico
5
Unidad de Energía Renovable, Centro de Investigación Científica de Yucatán, Consejo Nacional de Ciencia y Tecnología, Mérida, Yucatán 97302, Mexico
*
Authors to whom correspondence should be addressed.
Submission received: 16 November 2018 / Revised: 5 January 2019 / Accepted: 10 January 2019 / Published: 23 January 2019
(This article belongs to the Special Issue Sustainable Energy Systems)

Abstract

:
This work reports the synthesis of N-doped porous carbon (NPC) with a high surface area from Sargassum spp. as a low-cost alternative for electrocatalyst production for the oxygen reduction reaction (ORR). Sargassum spp. was activated with potassium hydroxide at different temperatures (700, 750, and 800 °C) and then doped with pyridine (N700, N750, and N800). As a result of the activation process, the 800 °C sample showed a high surface area (2765 m2 g−1) and good onset potential (0.870 V) and current density (4.87 mA cm−2). The ORR performance of the electrocatalysts in terms of their current density was N800 > N750 > N700 > 750 > 800 > 700, while the onset potential decreased in the following order: N800 > 800 > 750 > 700 > N700 > N750. The fuel cell performance of the membrane electrode assembly (MEA) prepared with electrocatalyst synthesized at 750 °C and doped with pyridine was 12.72 mW cm−2, which was close to that from Pt/C MEA on both the anode and cathode (14.42 mW cm−2). These results indicate that NPCs are an alternative to the problem of Sargassum spp. accumulation in the Caribbean due to their high efficiency as electrocatalysts for ORR.

1. Introduction

Fuel cells are considered an environment-benign technology providing solutions to a range of environmental challenges, such as harmful levels of local pollutants, in addition to providing economic benefits due to their high efficiency [1], the main challenges for fuel cells are to demonstrate reliability and reduce capital cost [2]. Fuel cells (FCs) use a continuous stream of gaseous and/or liquid fuels and oxidizers to electrochemically generate electrical output power [3]. Alkaline fuel cells (AFCs) are excellent, efficient performers with excellent reliability and length of life [4]; their overall reaction is 2H2 + O2 → 2H2O + electric energy + heat. In an AFC anode, the hydrogen is catalytically oxidized, 2H2 + 4OH → 4H2O + 4e, while, at the cathode, the oxygen is reduced, O2 + 2H2O + 4e → 4OH [5]. The oxygen reduction reaction (ORR) is the primary target for overpotential reduction in AFCs [6,7]. No single polycrystalline metal catalyzes the ORR as effectively as Pt [8], but its high cost presents a barrier for AFC commercialization. Due to their earth abundance and almost zero cost, the use of biomass-derived materials may be a promising alternative for the development of high-performance and multifunctional electrocatalysts on a large scale to promote AFC commercialization.
In previous years, vegetal and animal origin biomasses such as moss [9], lotus stem [10], oil seed [11], luffa sponge fibers [12], amaranthus [13], pomelo peel [14], brewer’s yeast [15], okara [16], fish [17], chicken feather [18], porcine blood [19,20], olive oil [21] and waste leather scraps [22,23] have been reported as carbon and heteroatom precursors for the synthesis of electrocatalysts, as they have been found to enhance ORR performance. Additionally, through chemical treatments, such as activation and doping, physicochemical and electrochemical properties can be tuned. Specifically, KOH activation agents that promote microporosity [24] have been used to synthesize electrocatalysts towards ORR [12,22,23]. On the other hand, doping with heteroatoms is one of the most effective methods to tailor the electronic properties of carbon nanomaterials [25], when doping the carbonaceous framework with heteroatoms, electronegativities and atom sizes could lead to alteration of the electron densities, resulting in the formation of active centers for ORR and contributing to an improvement in the electrochemical stability [26]. Among heteroatoms, nitrogen has been the most studied (through doping agents such as melamine [27], hidrazine [28], dopamine [10]) because its atomic radius is similar to that of C with one more electron in its valence shell, so n-type electronic modification is created within the carbon lattice, leading to enhanced electron–donor interactions or the basic properties of N-doped carbon materials [29]. There are many nitrogen species associated with ORR performance improvement. First, pyridinic species (N1), which refers to N atoms at the edges of graphene planes, where each N is bonded to two carbon atoms and donates one p-electron to the aromatic π system, then pyrrolic ones (N2) where N atoms are integrated into five membered heterocyclic rings, which are bonded to two carbon atoms and contribute two p-electrons to the π system, finally quaternary (N3) N atoms are those substituting carbon atoms within the graphene layer [8].
Sargassum spp. is a brown alga (class Cyclosporeae; order Fucales; family Fucaceae; genus Sargassum) whose proximate composition includes 14.33% moisture, 6.55% protein, 1.90% lipid, 18.50% ash, 58.72% carbohydrate, and 17.00% fiber [30]. The Sargasso Sea is one of the main distribution areas of the so-called gulf-weed; here, it forms a holopelagic population and maintains itself by vegetative growth only [31]. During June 2011, pelagic Sargassum began washing ashore along the Caribbean, Gulf of Mexico, West African, and Brazilian coastlines in unprecedented quantities [32]. Studies inferred that dissolved organic nutrients from this weed may have been taken up and contributed to the development and persistence of blooms during the macroalgal bloom period in 2012 [33]. However, green tides along the coasts of the Yellow Sea also reached their record by 2013, when a major event reportedly occurred [34]. Later, the total biomass dry weight collected from Atalaia beach was 53.9 tons for the 2014 events and 301.26 tons for 2015. This confirmed the intensity of the algal bloom along the Northern Brazilian coast in 2015, where around 3243 tons of Sargassum spp. wet weight were stranded [35]. Later, in 2016, after a severe algal bloom, Chilean aquaculture experienced extreme mortalities of 40 million farmed salmon, which caused a financial loss of US $800 million [36]. This year, Sargassum has already arrived at the Mexican Caribbean coasts; however, a new, unexplored opportunity has arisen for this sustainable and Earth-abundant source to be used as an opportunity for fuel cell commercialization, rather than simply being an economical threat.
In 2016, Liu et al. extracted sodium alginate from seaweeds, mixed it with graphene and FeCl3 solution and calcinated it at 700 °C in NH3 to prepare an aerogel with physicochemical properties of ID/IG = 0.95 and 465 m2 g−1 surface area as well as an ORR performance by the four electron-transfer pathways of −4.5 mA cm−2 [37]. Further, our metal-free electrocatalyst approach appeared in the study performed by Song et al., where pyrolyzed seaweeds (Undaria pinnatifida) were exposed to a N2 flow for 5 h at 1000 °C, followed by 3 M HCl acid treatment for 24 h. When the nitrogen content was 1.8 wt % in the bulk, this process resulted in a surface area of 1218 m2 g−1; however, it is noteworthy that quantities of 27.0%, 21.0% and 43.5% of N1, N2 and N3 were found, respectively. Additionally, the ORR performance was 0.972 V vs. Ag/AgCl (onset potential) and 4.5 mA cm−2 (current density) at 1600 rpm in KOH [38]. In this work, we proposed a feasible synthesis route using Sargassum spp. as a sustainable and Earth-abundant carbon source for the synthesis of NPC as metal-free electrocatalysts for alkaline fuel cell applications.

2. Experimental Method

2.1. Metal-Free Electrocatalyst Synthesis

Electrocatalysts were prepared according to the method reported previously by Perez–Salcedo K. Y. et al. [39], but pyrolysis was performed in an argon atmosphere at three different temperatures, meaning that the activated samples were denoted as 700, 750, and 800. After activation, doping treatment was performed with pyridine (C5H5N, Sigma-Aldrich, 99.8%, Saint Louis, MO, USA) as a nitrogen source. N-doped samples were labeled as N700, N750, and N800. The synthesis process and nomenclature is summarized in Table 1.

2.2. Physical Characterization

Morphological characterization was carried out by scanning electron microscopy (SEM) in a JSM-6360LV, JEOL, Mundelein, IL, USA, equipment. Samples were dried and coated with a gold film in a sputter coater instrument. Additionally, electrocatalysts were analyzed by energy dispersive spectroscopy (EDS). The Brunauer–Emmett–Teller (BET) surface area was characterized in BET equipment (Bel MicrotracBel, Belsorp-max, Osaka, Japan) by degassing the samples at 200 °C for 6 h. The elemental analysis was carried out using an Organic Elemental Analyzer (Thermo Scientific, 2000, Milan, Italy); the measurements were repeated in duplicate with the mean value reported. Structural properties were characterized by Raman spectroscopy in an equipment (DXR xi, Thermo Scientific, Madison, WI, USA) with a He-Ne gas laser (λ = 633 nm). X-ray diffraction (XRD) patterns were obtained with a Bruker D2 Phaser apparatus (D2 Phaser, Bruker, Karlsruhe, Germany) with a step size of 0.0101 2θ degrees and 4.75 step per s, in a range from 9.99 to 99.99 2θ degrees. Finally, surface elemental analysis was conducted by X-ray photoelectron spectroscopy (XPS) using a spectrophometer (K-Alpha, Thermo Scientific, East Grinstead, UK) equipped with an Al-Kα X-ray source at 12 kV; spectra calibration was done using C1s at 284.5 eV as a reference.

2.3. Electrochemical Measurements

Electrochemical experiments were carried out in a conventional three-electrode test cell at room temperature using a PAR Bistat Potentiostat (Princeton Applied Research, Oak Ridge, TN, USA) connected to a rotating disk electrode set-up. A mixture of 15 μL Nafion (5 wt %) solution, 500 μL 2-propanol, and 10 mg electrocatalysts was sonicated in an ultrasonic bath for 40 min, and commercial 10% platinum was also prepared for comparison purposes. Thirty microliters of catalytic ink dispersion was dropped onto the polished glassy carbon substrate (5 mm diameter). Cyclic voltammetry (CV) was performed from 1.2 V to 0.0 V vs. the reversible hydrogen electrode (RHE) potential window at a 20 mV s−1 scan rate for 3 cycles in N2-saturated 0.5 M KOH electrolyte; an activation treatment was performed at a 50 mV s−1 scan rate for 40 cycles before all measurements. ORR performance was studied using the rotary disk electrode (RDE) technique in O2 saturated 0.5 M KOH, and all background current was corrected by subtracting the data obtained in N2-saturated electrolyte under the same measurement conditions. Linear sweep voltammetry (LSV) experiments at 200, 400, 800, 1200, 1600, and 2000 rpm rotation rates were conducted from 1.2 V to 0.0 V vs. the RHE potential window at a 5 mV s−1 scan rate using a coiled platinum wire as the counter electrode and Ag/AgCl (KCl saturated) as the reference electrode.

2.4. Fuel Cell Studies

Membrane electrode assembly (MEA) performance was evaluated using a Greenlight Test Station (G40 Fuel cell system, Hydrogenics, Vancouver, BC, USA). The MEA, gas diffusion layer (GDL), and gasket were assembled in the single cell, with each bolt under uniform torque (4.5 N m). Single cells were tested at 30 °C with humidified hydrogen and oxygen at the anode and cathode, respectively, at a 0.5 L min−1 flow rate, under atmospheric pressure, and in 100% relative humidity. The GDL and MEA were fabricated as described below.
For GDL, a 15 × 15 cm carbon paper substrate (0.40 mm thickness non-woven, GD07508G, Hollingsworth & Vose Company, Walpole, MA, USA) was coated in equipment (Easycoater equipment, EC26) with a homogeneous suspension made of 843.75 mg pure carbon black (nano-chain Pureblack carbon, grade 205-110, Superior Graphite Co.), 281.25 mg vapor-grown carbon fiber (VGCF, Showa Denka, Toyama, Japan) and 270 mg sodium dodecyl sulfate (SDS, Fisher Scientific, Pittsburgh, PA, USA) dispersed in 13.5 mL of water and mixed by sonicating for 30 min and stirring for 1 h at 60 rpm. Then, 30 wt % of polytetrafluoroethylene (PTFE, TE-3859 from DuPont Fluoroproducts, Wilmington, DE, USA) was added to the mixture. Bubbles were avoided during the coating process. The coated substrate was dried at room temperature overnight and sintered at 350 °C for 30 min. Then, it was washed with distilled water for 30 min.
MEA was obtained by coating both sides of the anion exchange membrane (FAA-3-50, Fumatech BWT, Bietigheim-Bissingen, Germany), and this was kept in 1 M KOH solution overnight to replace Br with OH. To prepare the anode catalyst layer, a catalyst ink of 50 mg 46 wt % Pt/C (TKK, Tanaka Kikinzoku Group, Tokyo, Japan), 0.2 mL water, 1.2 MeOH, 0.8 mL tetrahydrofuran (THF), and 0.1 mL FAA-3 was made. The mixture was sonicated in an ultrasonic water bath for 10 min and stirred for 10 s (repeated three times). The ink was spray-coated onto the 5 cm2 active area membrane and dried at room temperature. For the cathode catalyst layer, ink was prepared by mixing 50 mg electrocatalyst powder in 1.2 MeOH, 0.8 mL THF, and 0.1 mL FAA-3. The mixture was treated ultrasonically for 10 min and stirred for 10 s (repeated three times), and then the membrane was coated. Commercial Pt/C was also spray-coated to allow a fuel cell performance comparison.

3. Results and Discussion

3.1. Physicochemical Characterization

Elemental analyses of C, H, N, and S weight percentages were performed to obtain a better understanding of the electrocatalysts’ compositions. The results including the standard deviations from the triple measurements for each electrocatalyst are summarized in Table 2. It can be observed that after activation treatment at 700, 750, and 800 °C, nitrogen disappeared. This was because macroalgae have a low nitrogen ratio, which can result in nitrogen loss during pyrolysis treatment as NH3, N2O, or even HCN, as reported by composting algae studies [40]. After C5H5N doping, a low amount of nitrogen was incorporated to the material, which, according to previous studies, can be tuned by manipulating the solvothermal treatment temperature. On the other hand, seaweeds contain sodium alginate [41] and high amounts of calcium carbonate (CaCO3) [39], therefore, the samples pyrolyzed at the highest temperature (800 and N800) showed the highest post-pyrolysis carbon amount (68.86 and 80.95 wt %, respectively) among all samples. Finally, the sulfur content was low for the 700 and 750 samples, lower than the detection limit for 800, and dropped to zero after doping treatment for all three sample types. It is noteworthy that these carbon and sulfur contents are in agreement with the amounts found from the EDS results discussed below.
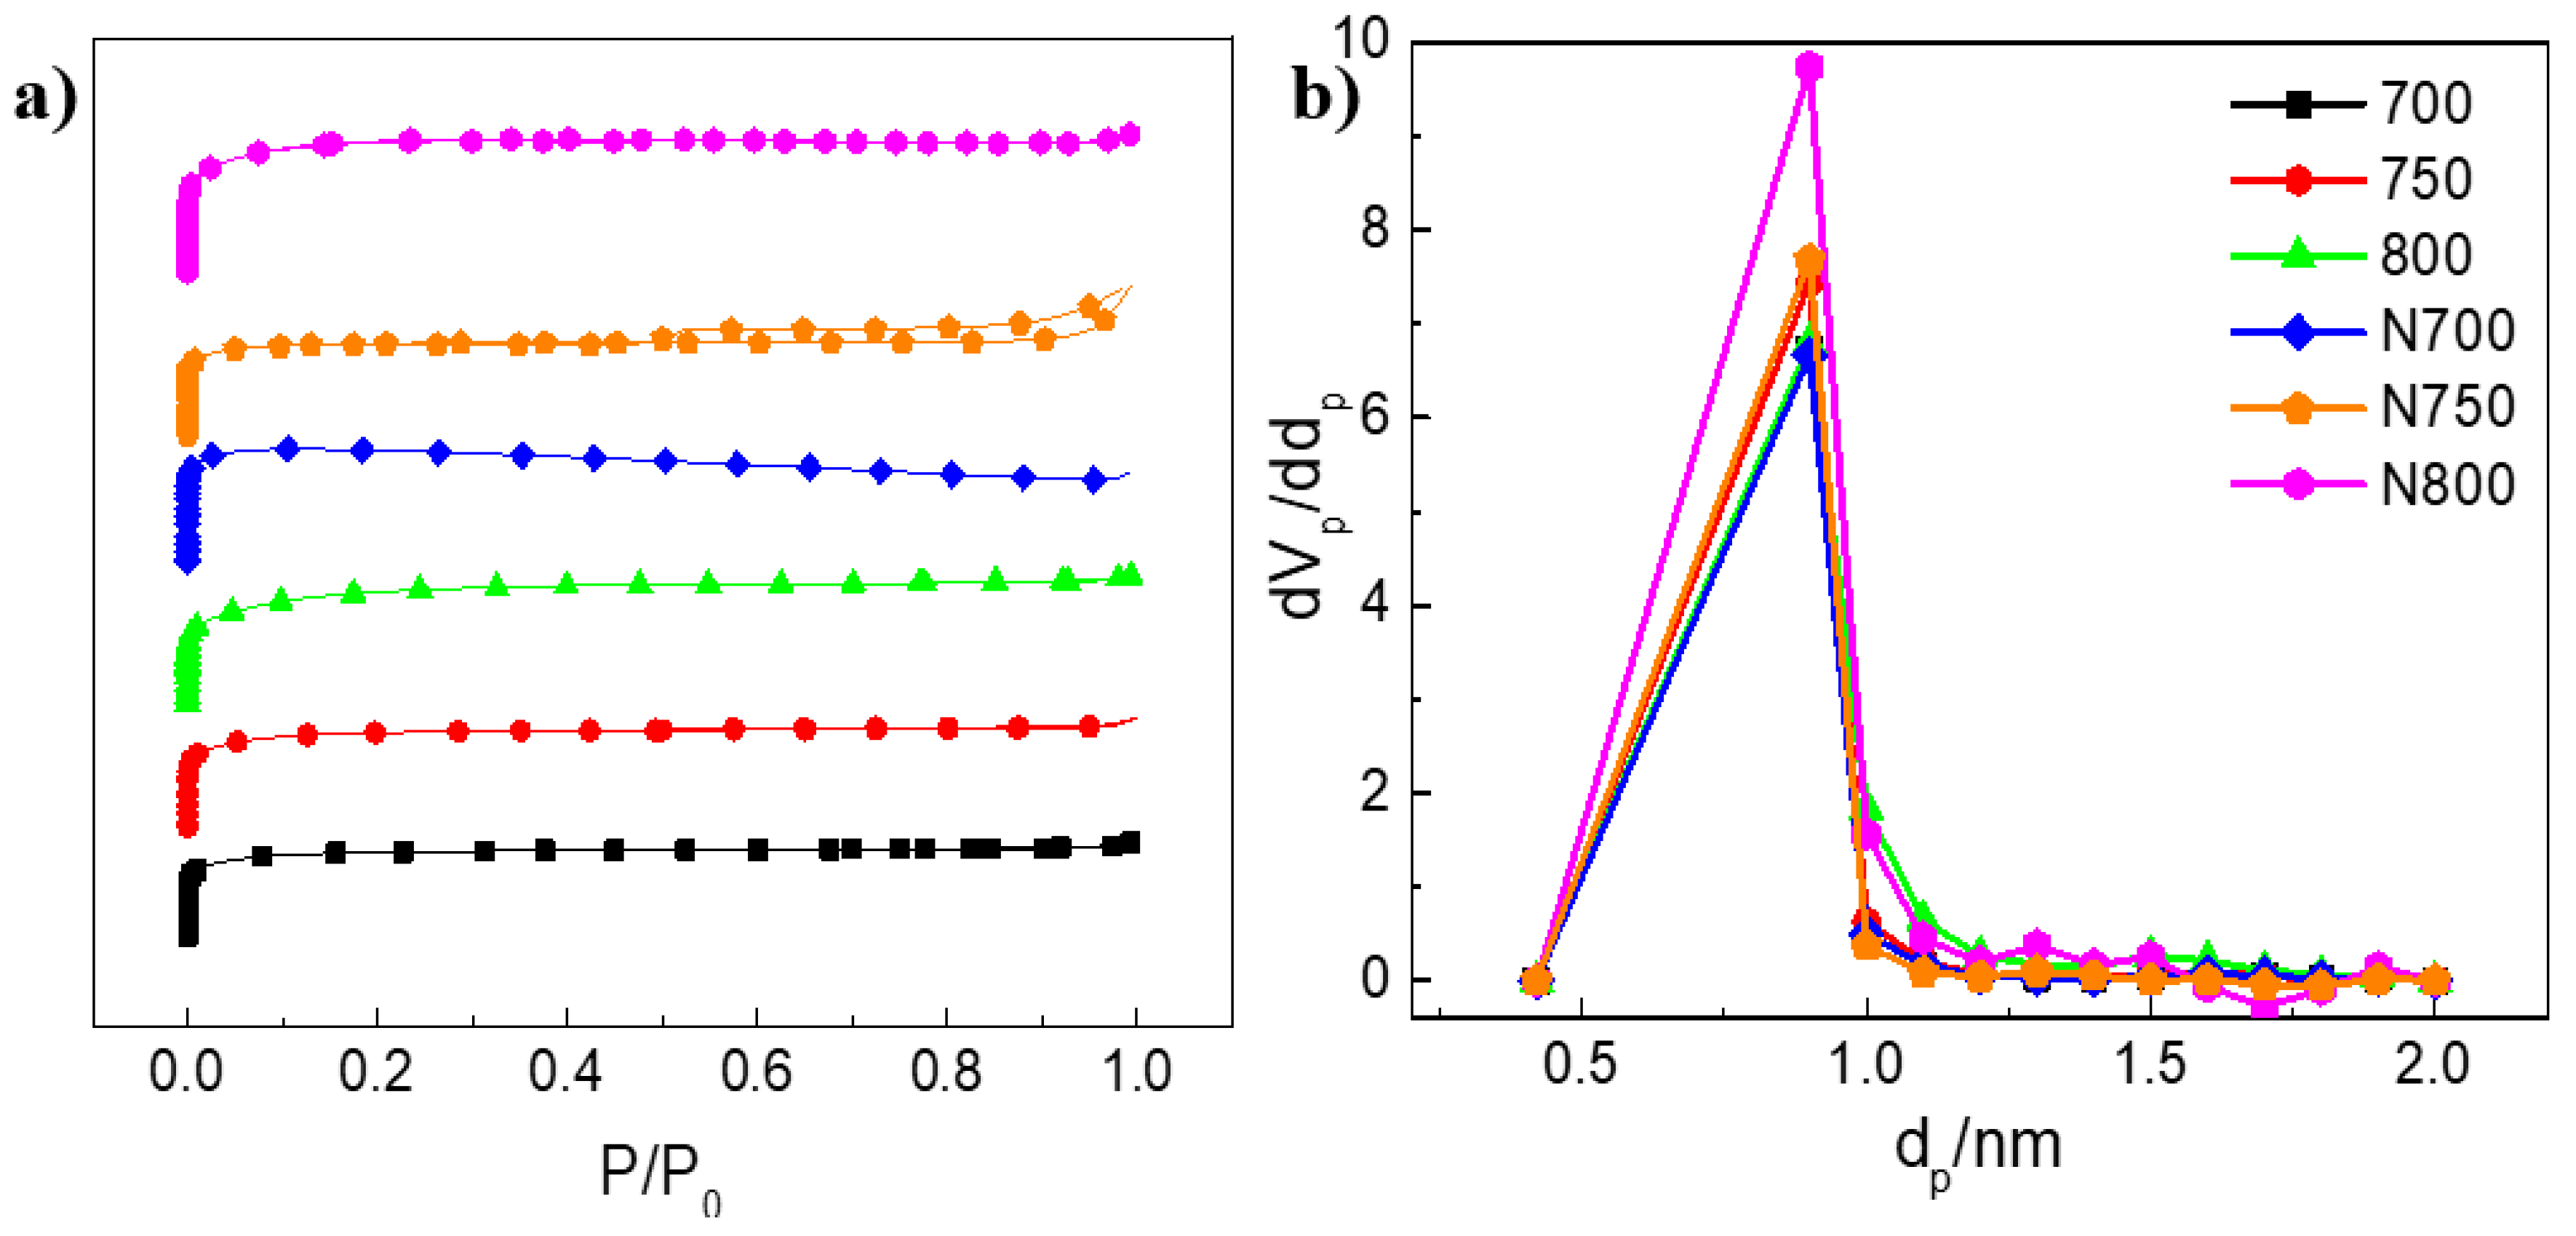
The electrocatalysts’ N2 adsorption–desorption isotherms are presented in Figure 1a. They exhibit a type I shape associated with microporous solids. In particular, N750 shows type H3 hysteresis, which is typical in solids consisting of aggregates or particle agglomerates forming slit-shaped pores with a nonuniform size and/or shape [42]. The MP plot shown in Figure 1b confirms the electrocatalysts’ microporosity with the majority of micropores being between 0.5 and 1.0 nm. The isotherms’ textural properties are summarized in Table 3. The synthesized electrocatalysts had high BET surface areas, which suggests a greater availability of active sites for the ORR to occur. As expected, the BET surface area increased with each heat treatment; N800 showed the highest surface area (2765 m2 g−1) because the acid treatment removed any alkaline or inorganic residue when cleaning its structure. To the best of our knowledge, this is the highest surface area reported for electrocatalysts from biomass wastes used for ORR performance studies.
The electrocatalysts mesoporous structures are given in Figure 2a–f. In accordance with the surface area results, the micrographs show similar highly porous structures. It can be seen that after doping treatment, such pore structures remained, but Figure 2e,f clearly display some agglomerates and fragments that could have been formed due to the doping treatment. EDS spectra confirmed the presence of inorganic compounds (2.29 wt % calcium, 1.29 wt % chloride, 0.96 wt % sodium, 0.86 wt % potassium and 0.66 wt % magnesium) in the raw Sargassum spp. which were completely removed after activation and doping treatment. Moreover, the carbon content increased after chemical treatments from 53.67 wt % in raw seaweed to 83.85, 85.42, 85.89, 83.20, 87.29, and 88.12 wt % for 700, 750, 800, N700, N750, and N800, respectively. The sulfur content decreased after doping treatment, confirming the CHNS elemental analysis results. On the other hand, 0.06, 0.03, 0.04, 0.13, 0.17, 0.16 wt % chloride was found in 700, 750, 800, N700, N750, and N800, respectively.
Furthermore, the Raman spectra were studied to understand the structure and quality of the carbon materials. D- and G-band existence was confirmed for the 700, 750, 800, N700, N750, and N800 samples. As presented in Figure 3a, the D-band (1354 cm−1) corresponds to a defective sp3-phase and the G-band (1588 cm−1) to an ordered sp2-phase [26]. The D-band was present more often than the G-band for all electrocatalysts and structural properties, and defective sites were determined through the D-band and G-band relationship (ID/IG), providing information regarding the surface defects. In particular, sample 700 presented a lower index (ID/IG = 1.35 ± 0.03), indicating that it had fewer sp3 carbon defects and more sp2 carbon. Sample 750 showed a slightly superior index (ID/IG = 1.44 ± 0.03), suggesting that the number of defects increased as the chemical treatments were applied. Finally, sample 800 was the most disordered sample (ID/IG = 1.47 ± 0.03), providing evidence that the disorder degree was affected by the temperature. Likewise, N-doped electrocatalysts showed an enhancement in D-band intensity, leading to higher ID/IG indices of 1.40 ± 0.01, 1.45 ± 0.01, and 1.44 ± 0.02 for N700, N750, and N800, respectively. Finally, the amorphous nature of the electrocatalysts was confirmed in Figure 3b by the amorphous carbon diffraction patterns.
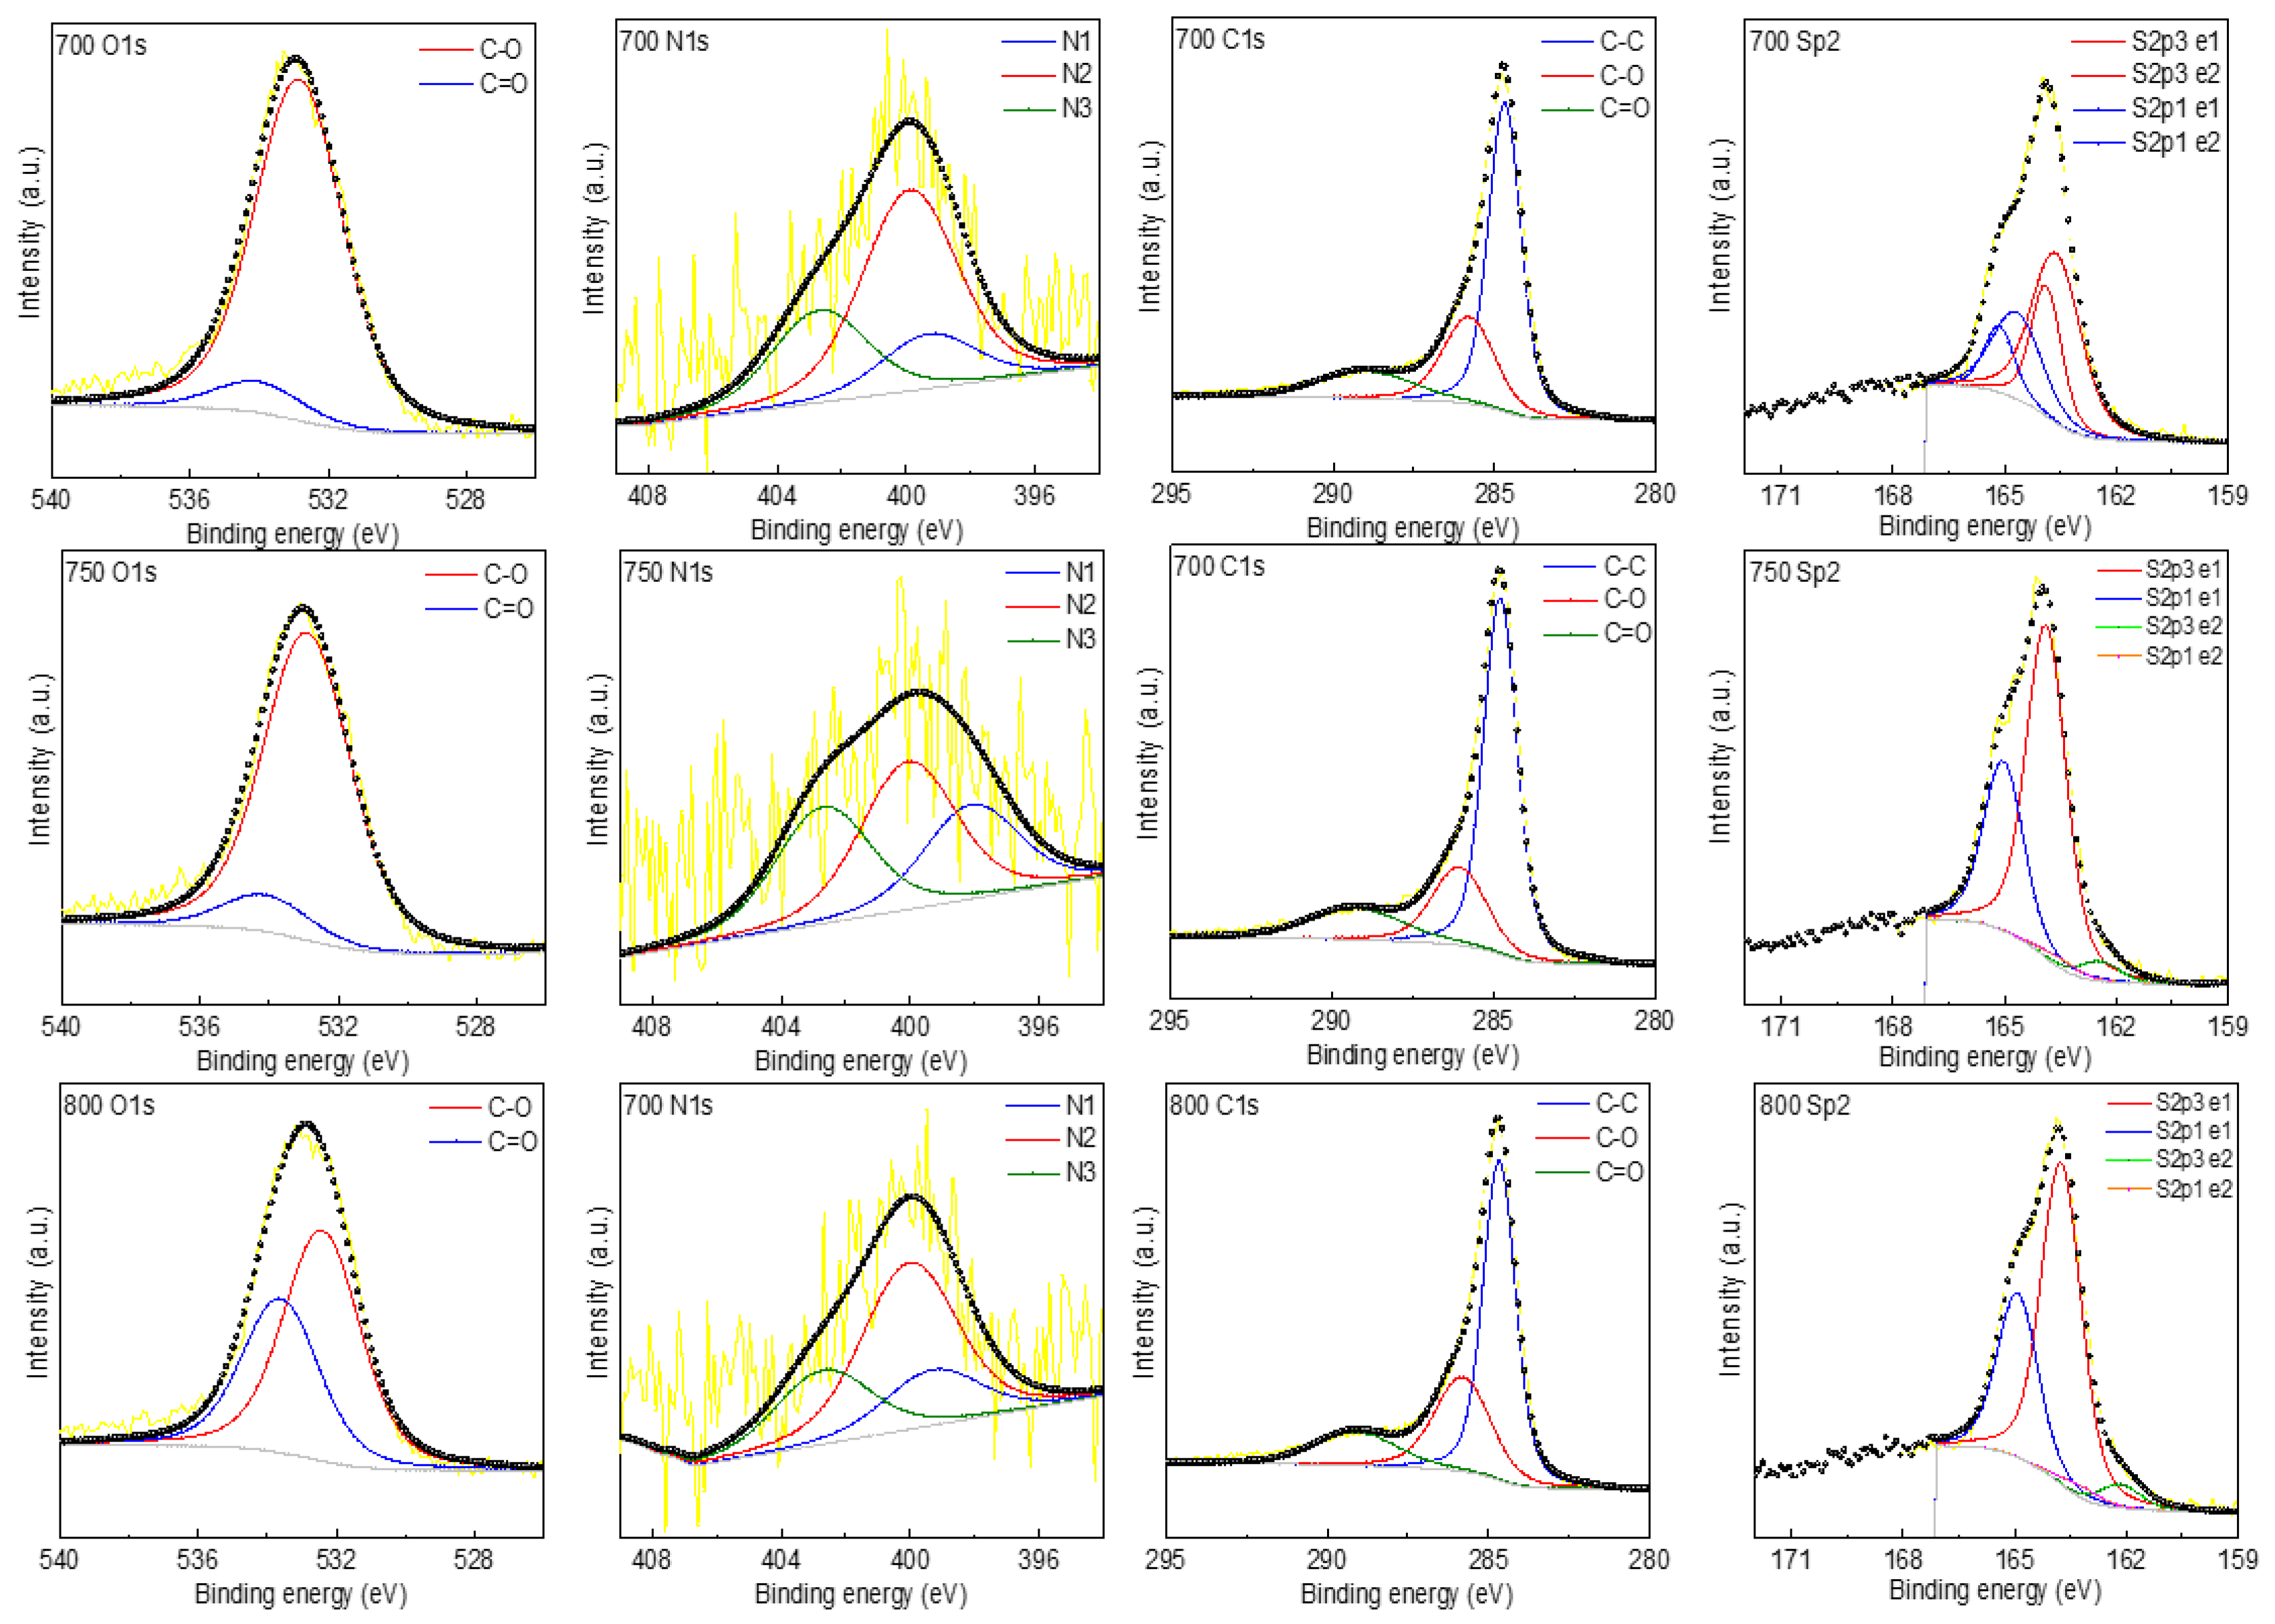
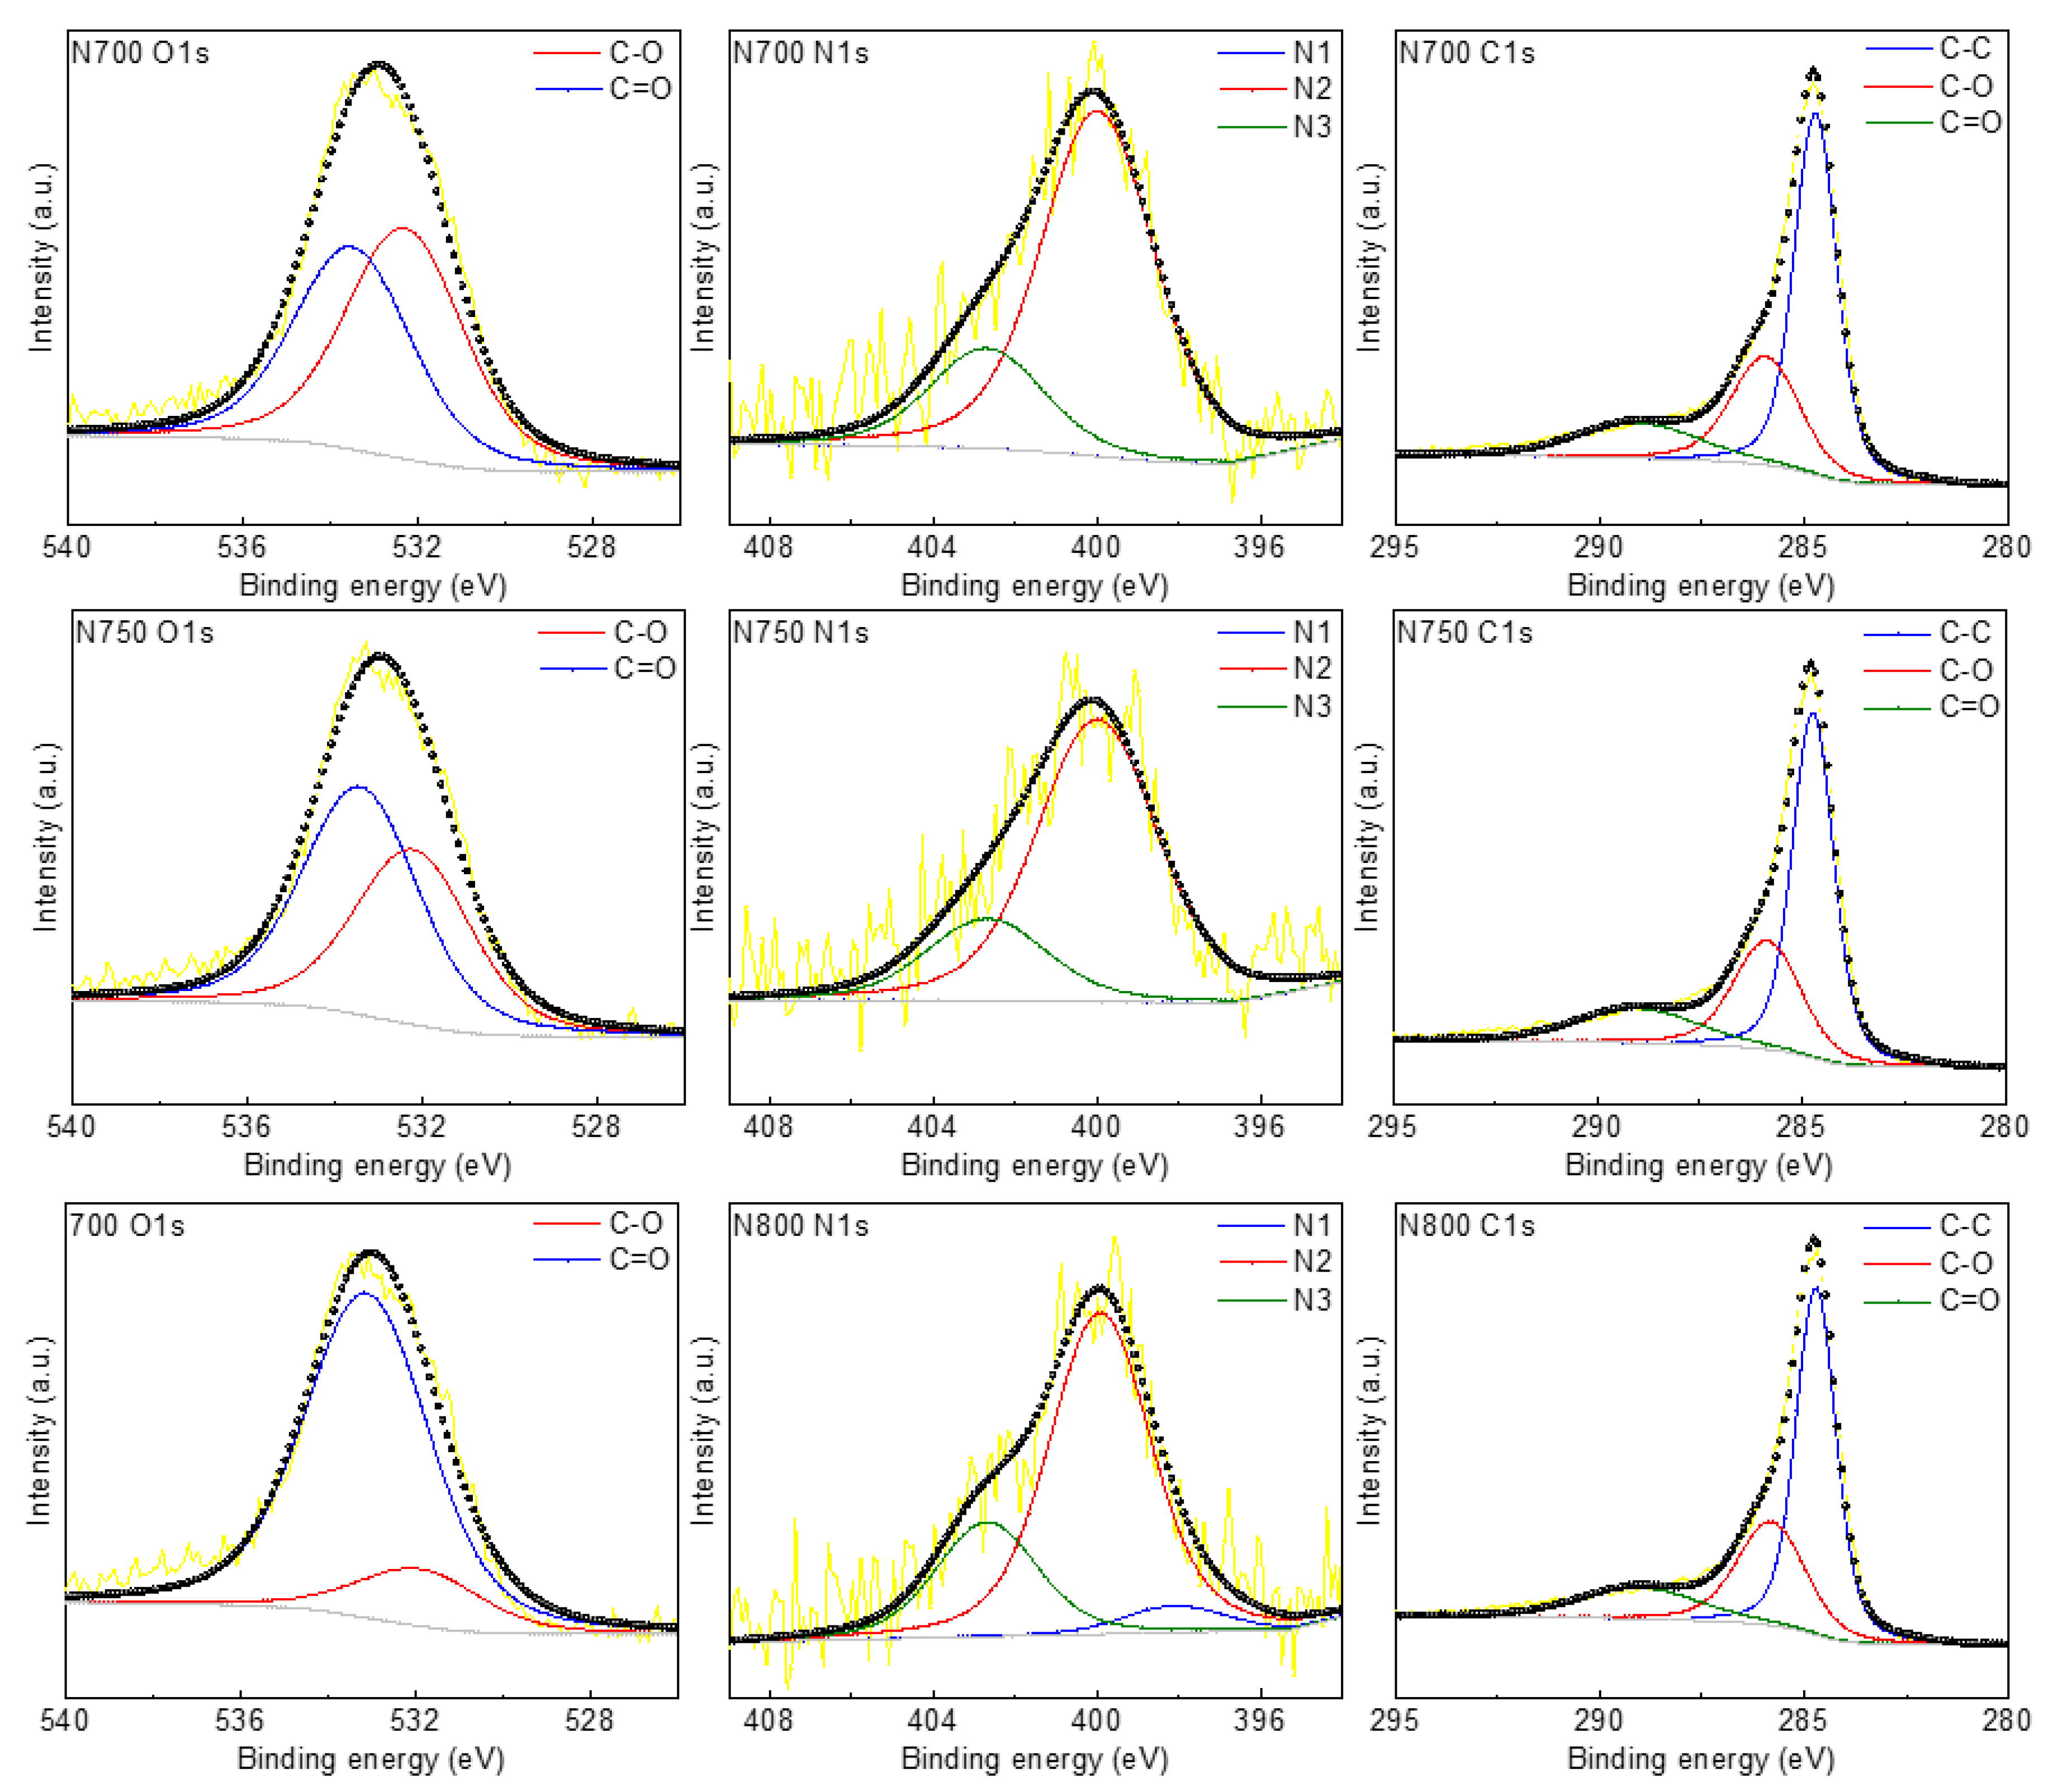
XPS studies were carried out to investigate the surface composition and chemical bonding of the electrocatalysts. The atomic concentrations of carbon, oxygen, nitrogen and sulphur were obtained from the survey and are summarized in Table 4. High-resolution spectra were obtained for C1s, N1s, and O1s and are shown in Figure 4 and Figure 5. The fitting was done at 284.5 eV using C1s as a reference. Carbon was the most abundant element with 90.16, 89.63, 87.32, 89.08, 90.94, and 93.06 wt % for 700, 750, 800, N700, N750, and N800, respectively. C1s peaks located at 284.5 ± 0.2 eV corresponded to C=C/C–C [43], while peaks at 285.9 ± 0.1 and 287.2 ± 0.1 eV were assigned to amorphous carbon and sp2 carbon atoms bonded to oxygen, respectively [44]. The peaks located at 288.6 and 290.0 eV were assigned to C–O bonds (O–C–O/C=O and O–C=O, respectively), and the peak at 291.5 ± 0.1 was related to the π–π* shake-up satellite, which is common in high-temperature treated carbons [44]. High-resolution spectra for N1s showed peaks which were assigned as follows: N1 from 398.1 to 399.3 eV; N2 from 399.8 to 401.2 eV, and N3 from 401.1 to 402.7 eV [23]. Pyridine treatment eliminated the sulphur from doped samples and changed the nitrogen-bond type. Originally, all samples presented N1, but, after C5H5N treatment, the nitrogen shifted to N2 and N3, while the N1 type disappeared.

3.2. Electrochemical Characterization

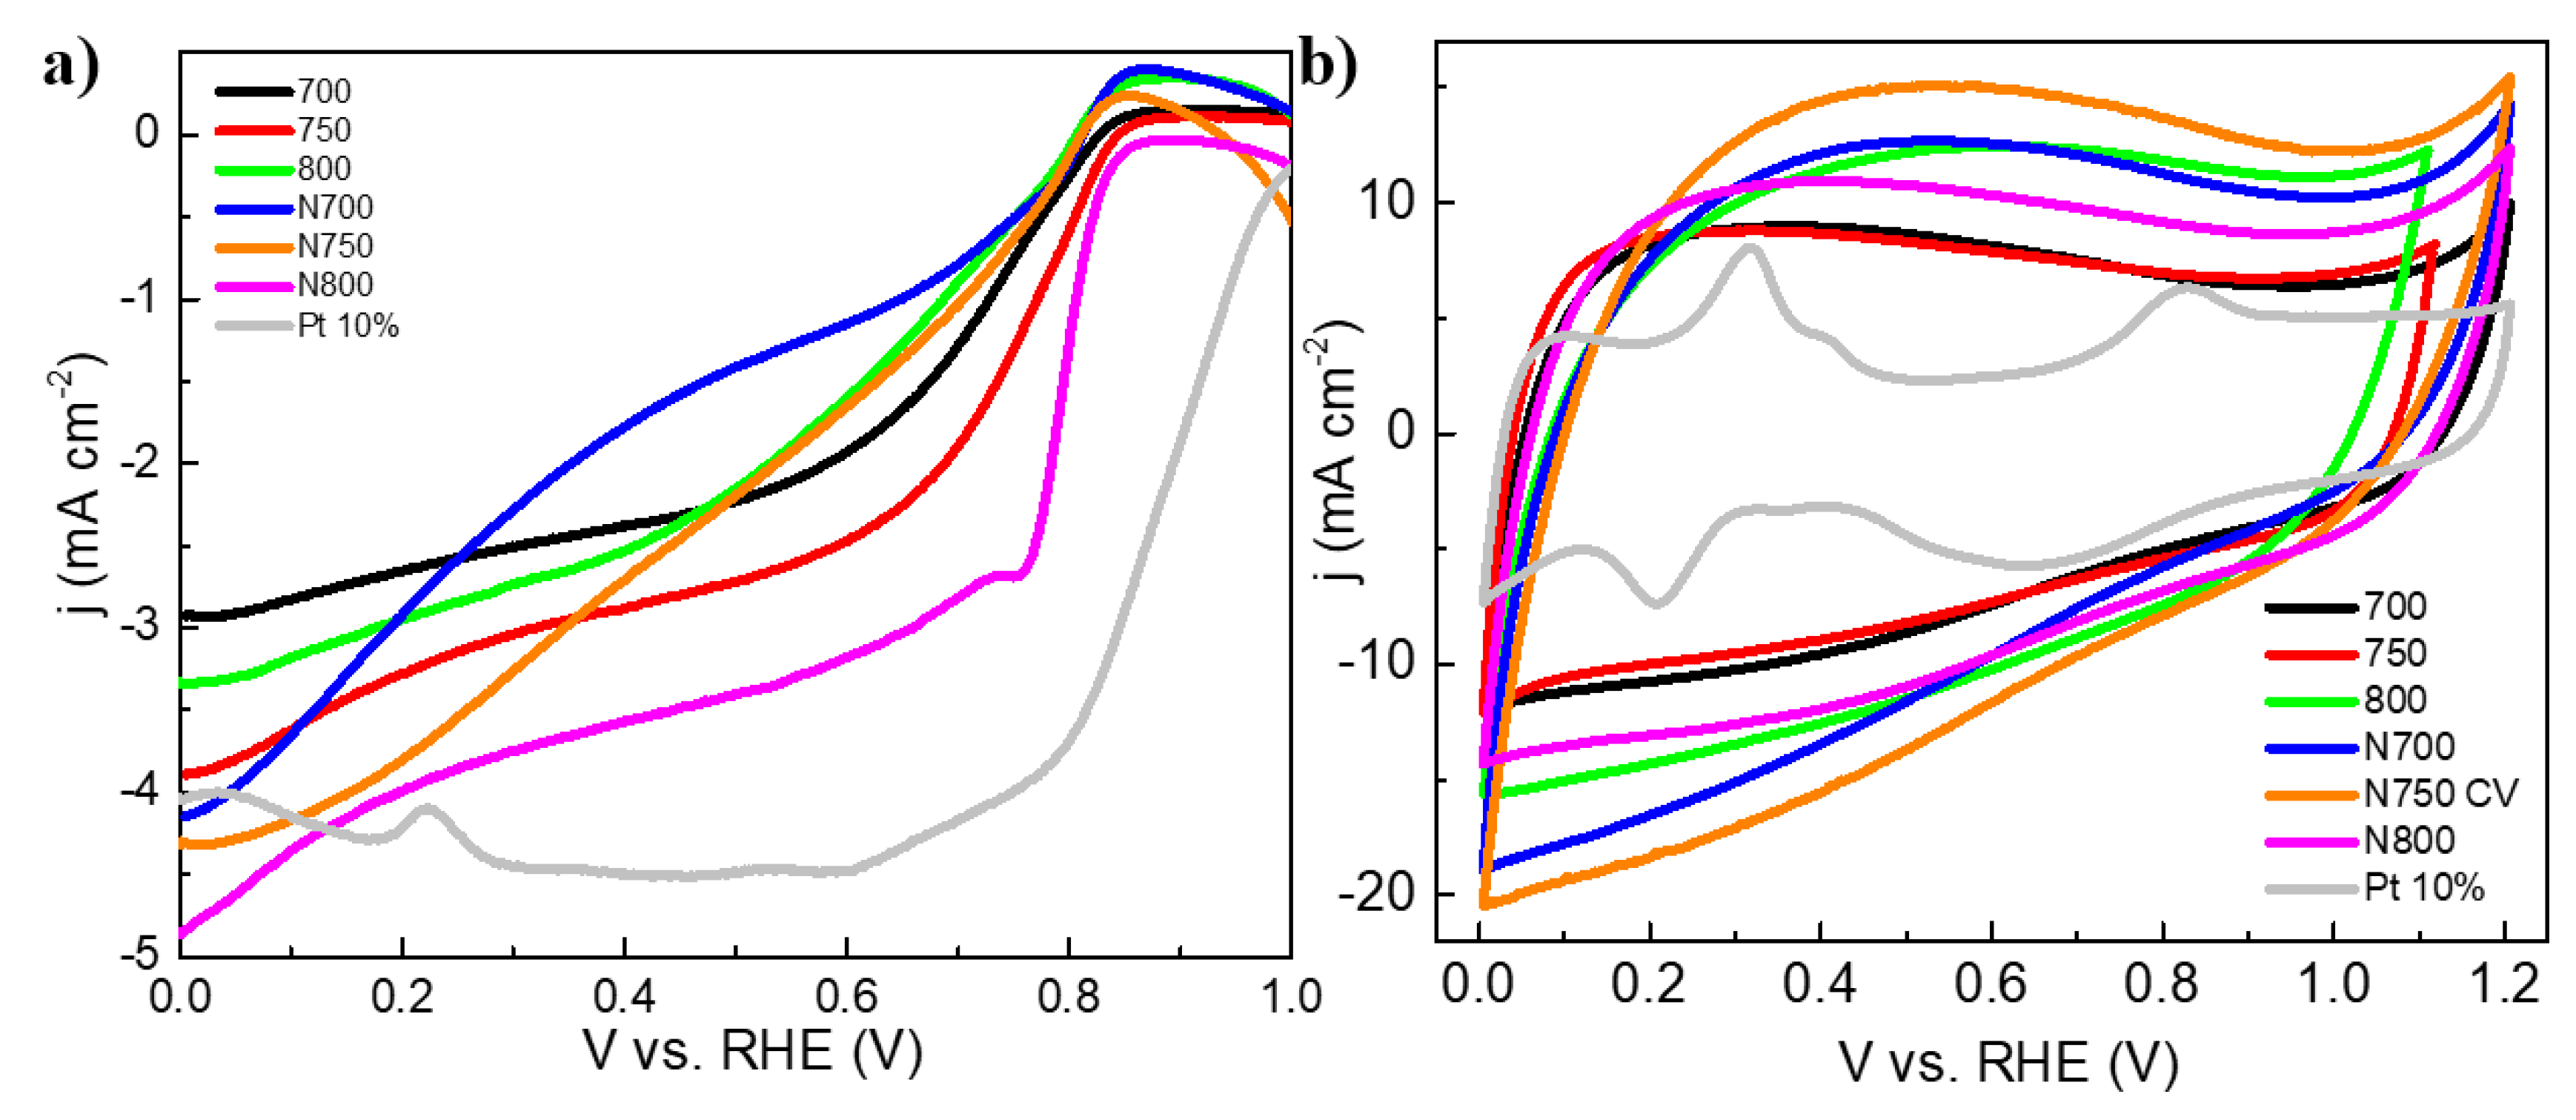
The electrocatalytic activity of the as-prepared NPC was studied using the rotating disk electrode (RDE) technique with linear sweep voltammetry (LSV) in a three-electrode system. Figure 6a shows the ORR polarization curves catalyzed by 700, 750, 800, N700, N750, N800, and 10% commercial Pt/C in O2-saturated alkaline electrolyte (0.5 M KOH) at a 5 mV s−1 scan rate and 2000 rpm. All measurements were performed at room temperature under the same conditions and catalyst load, and the background currents were subtracted. Current density values were determined at 0.0 V and the onset potential, as reported in literature [45]; these are summarized in Table 5. In the LSV data, it is noteworthy that the current density increased in parallel with the rotation rate, but none of the samples reached the plateau of the diffusion limiting current
The ORR polarization plots show that the pyrolysis temperature played an important role in the ORR activity. Both undoped and N-doped electrocatalysts exhibited good performance for the ORR. As expected, slower ORR kinetics were shown at the lowest temperature for the 700 sample, whose cathode reduction peak appeared at 0.827 V leading to a maximum current of 2.93 mA cm−2. In addition, the doping of sample 700 improved its performance, as revealed by the N700 current density value (4.15 mA cm−2); however, it exhibited a more negative potential (0.812 V), which could be associated with physicochemical properties, such as its low nitrogen content.
In addition, when the catalysts were synthesized at 750 °C, the current density improved as compared with samples at 700 °C. Specifically, it increased by 33% (3.89 mA cm−2), probably due to its larger surface area and nitrogen content, and increase in disorder, as studied by Raman spectroscopy, while its onset potential remained constant (0.828 V). In the same way, doping of the 750 sample improved its current density to 4.32 mA cm−2, but its N750 onset potential shifted to a more negative value (0.811 V).
Finally, at the highest temperature, more positive onset potentials were shown by the 800 and N800 samples. In particular, the N800 sample showed a well-defined curve and the best ORR activity, possibly as a result of having the highest surface area among all samples.
In brief, the electrocatalyst activity order in terms of the current density was N800 > N750 > N700 > 750 > 800 > 700, while the onset potential decreased in the following order: N800 > 800 > 750 > 700 > N700 > N750.
In general, the ORR performance of the electrocatalysts was attributed to their structures, namely, the increase in active sites, which facilitate oxygen diffusion and electron transport.
The results of the electrocatalyst cyclic voltammetry (CV) assessment in N2-saturated alkaline electrolyte (0.5 M KOH) at a 20 mV s−1 scan rate under room temperature conditions are presented in Figure 6b. All samples exhibited a pseudo-rectangular shape, which is associated with good charge propagation throughout the porous carbon framework, as well as good electronic conductivity and an accessible porous structure [46].
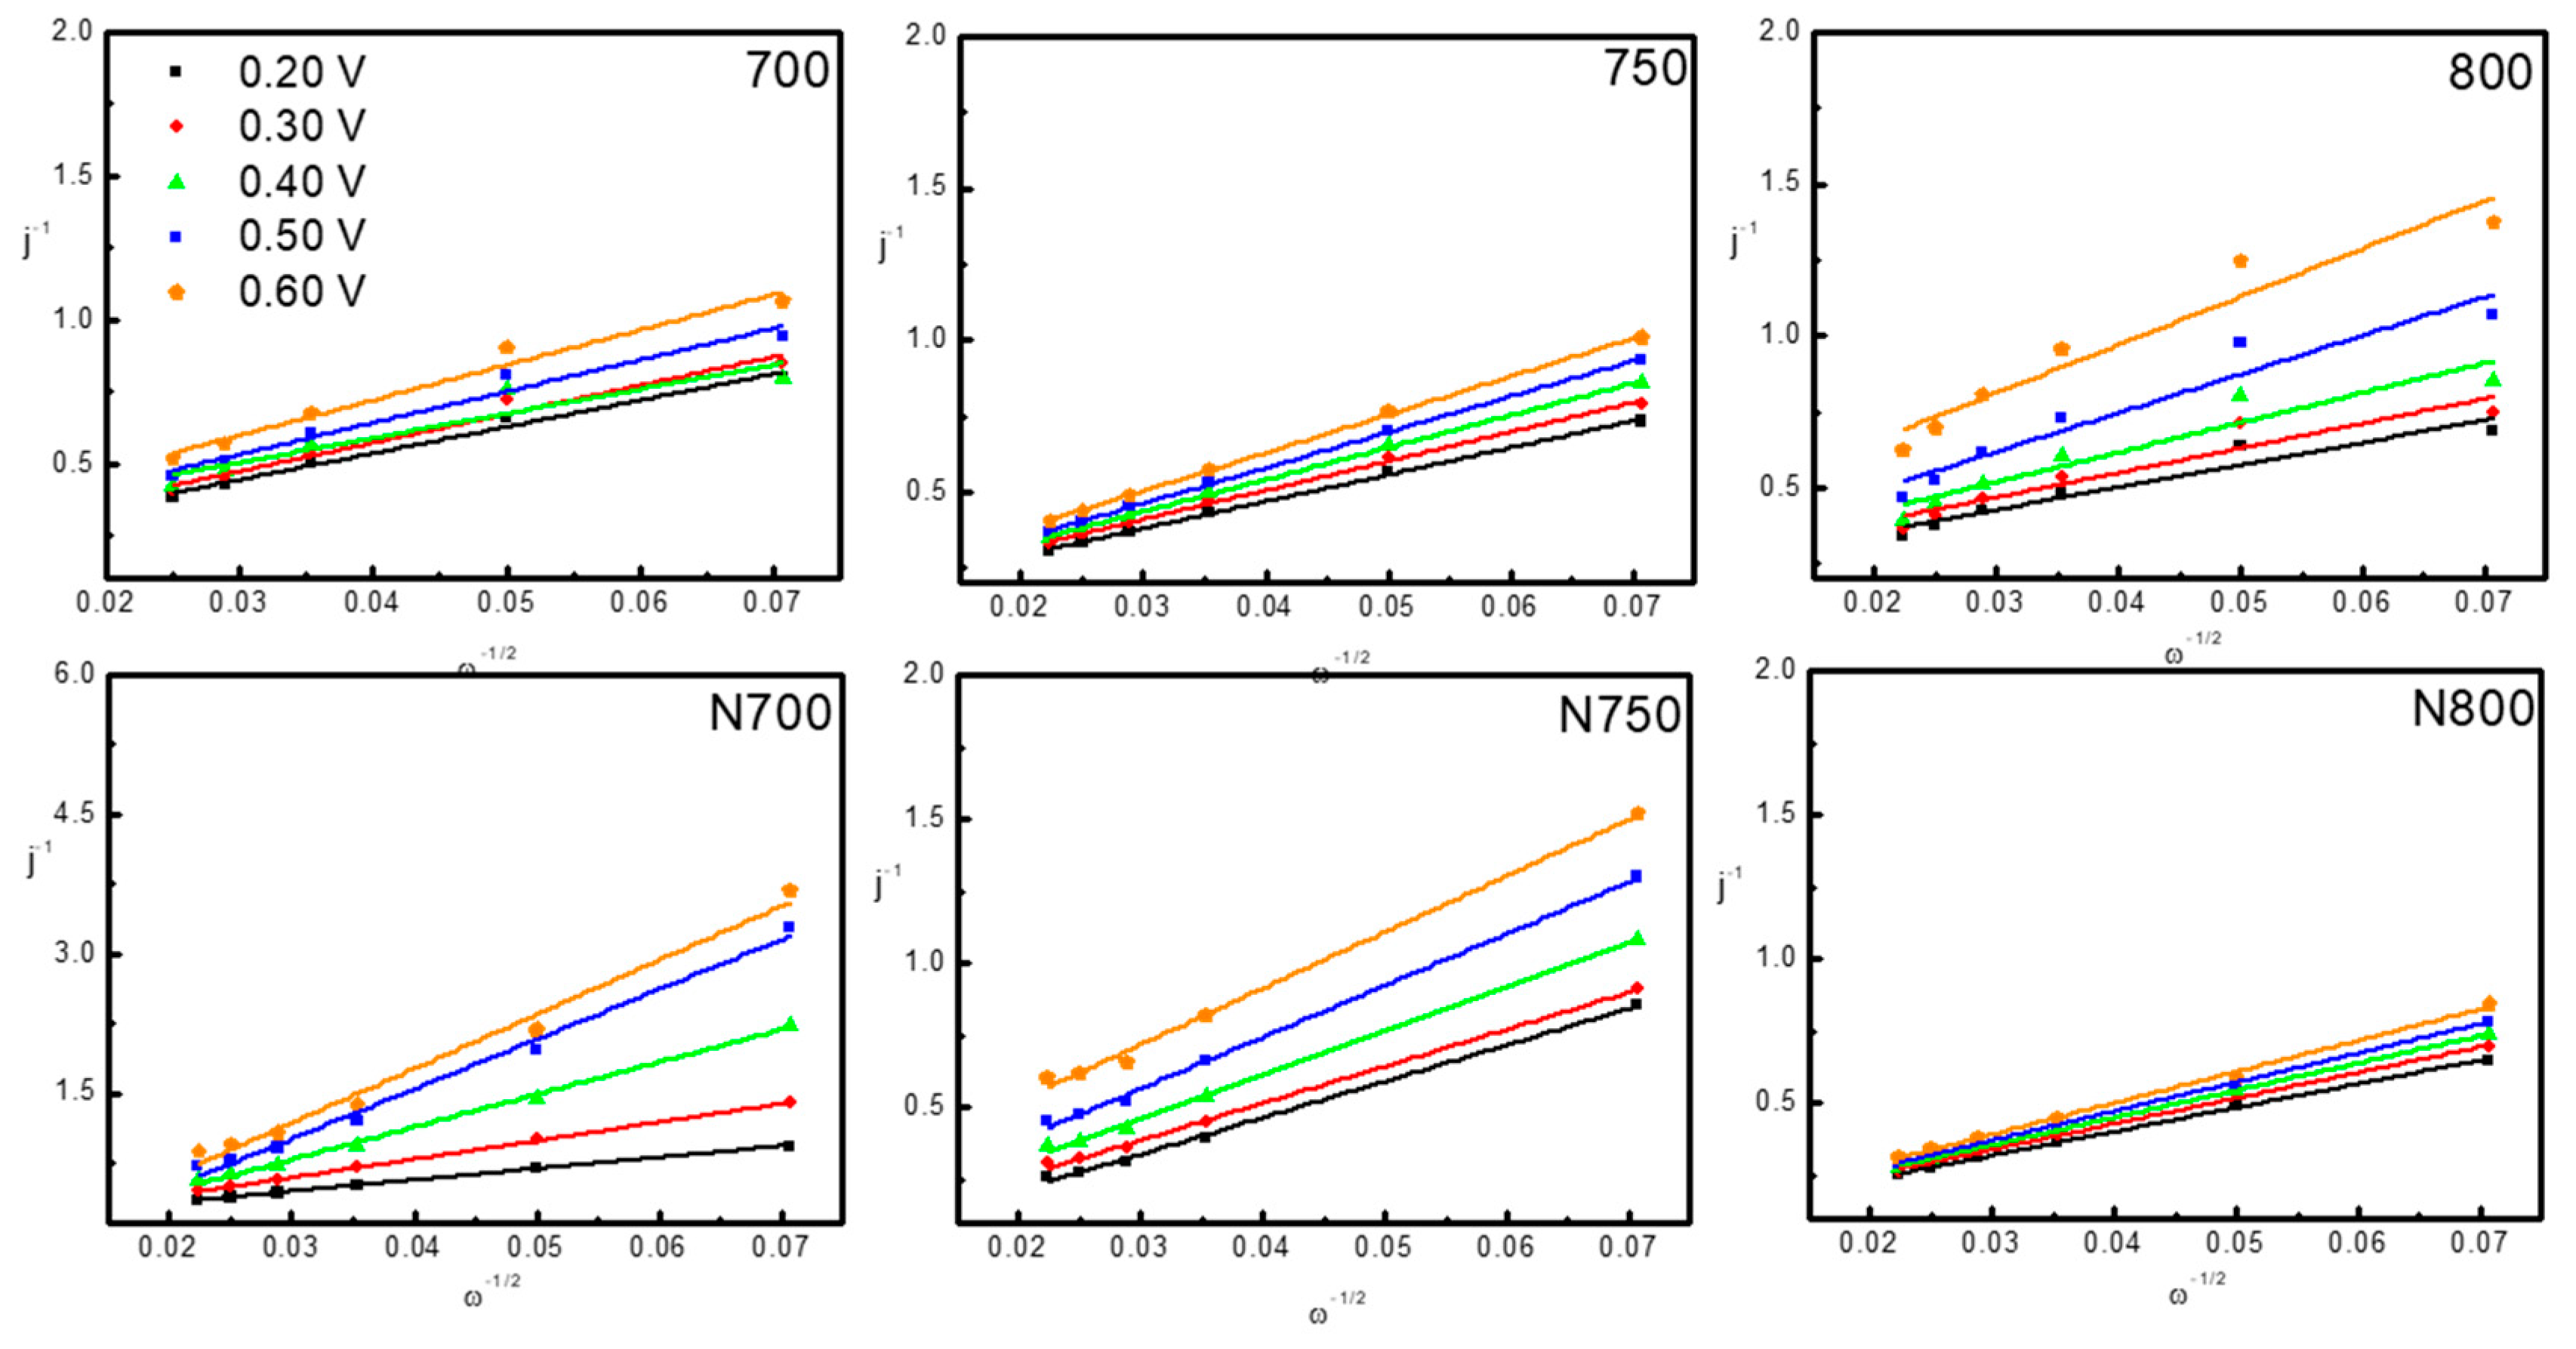
The K-L plots shown in Figure 7 were obtained from RDE polarization curve data recorded at various rotation rates (200, 400, 800, 1200, 1600, 2000 rpm) applying j 1 = j k 1 + B 1 ω 1 / 2 , where j is the absolute measured current density (mA cm−2), jk is the kinetic current, ω is the electrode rotation rate (rpm), and B is determined from the K-L graph slopes.
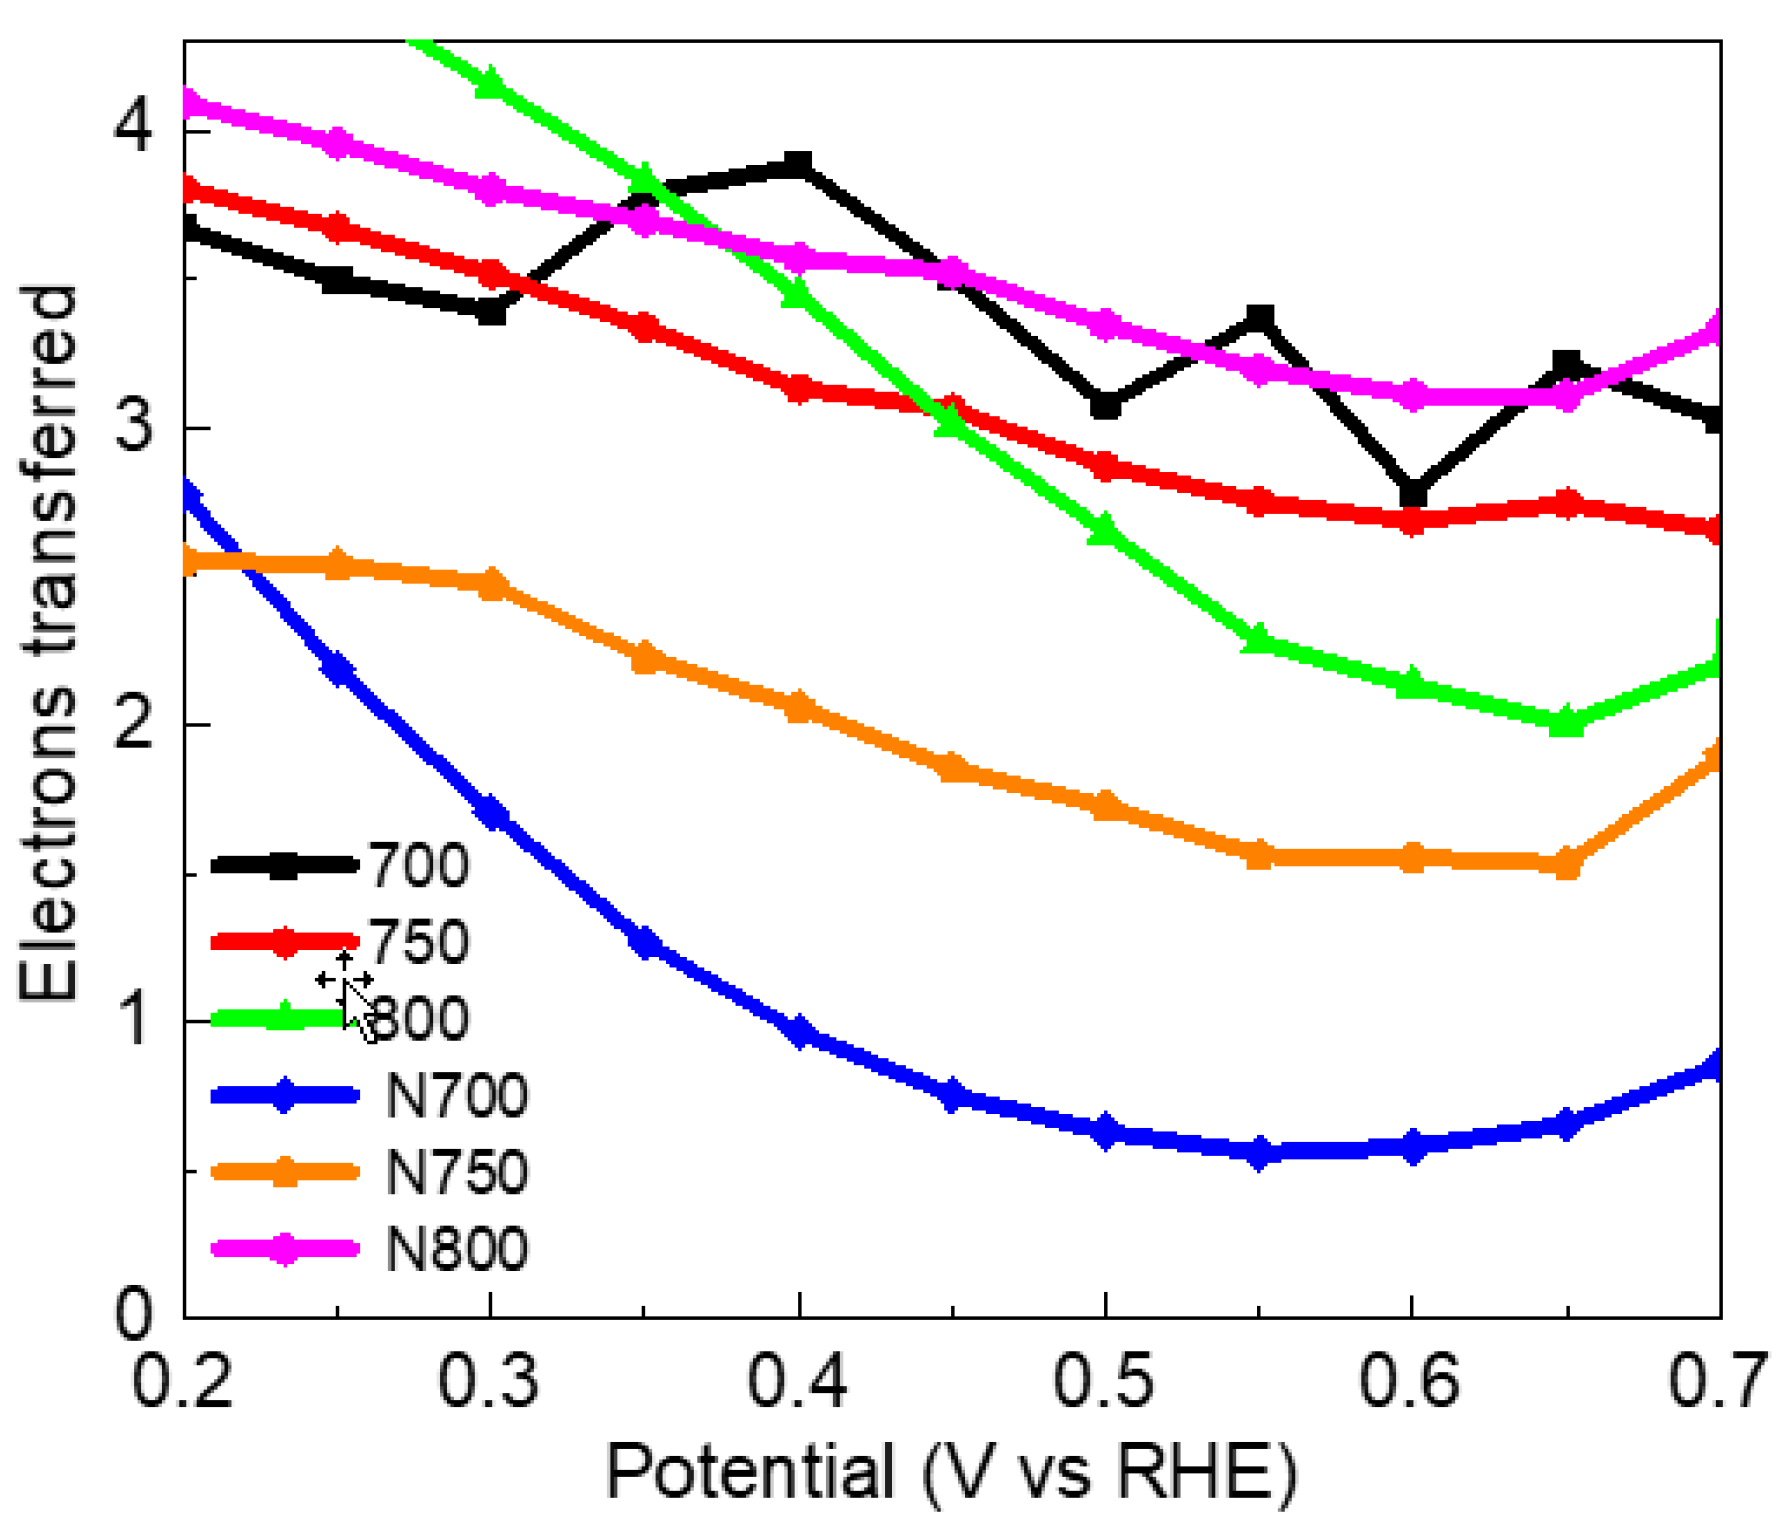
Based on the K-L plot slopes and the intercepts obtained from 0.2 to 0.6 V vs. RHE (V vs. RHE), Figure 8 shows the electron-transfer numbers (n) calculated from the B = 0.2 n F D 0 2 / 3 v 1 / 6 C 0 equation, where n is the total number of transferred electrons per O2 molecule, F is the Faraday constant (96,485 C mol−1), D0 is the O2 diffusion coefficient (1.9 × 10⁻⁵ cm2 s−1), C0 is the O2 global concentration (1.0 × 10⁻⁶ mol cm−3) [47], and υ is the electrolyte kinetic viscosity (0.01 cm2 s−1) [10].
According to the slopes of the K-L plots, the averaged ORR electron transfer numbers were 3.4, 3.1, 3.5, 1.2, 2.2, and 3.7 for 700, 750, 800, N700, N750, and N800, respectively. There was a first-order dependence between 700, 750, 800, and N800 ORR kinetics and potentials from 0.2 to 0.5 V vs. RHE that proceeded mainly through a four-electron reduction pathway (2H2O + O2 + 4e → 4OH). For these electrocatalysts, as the potential increased, the number of transferred electrons decreased to around 3.5; hence, both electron pathways coexisted for these materials. In contrast, the N700 and N750 kinetics reactions followed a mechanism closer to a two-electron transfer at potentials lower than 0.55 V.
A brief comparison of the yield vs. other doped biomasses is provided in Table 6 for more insights.

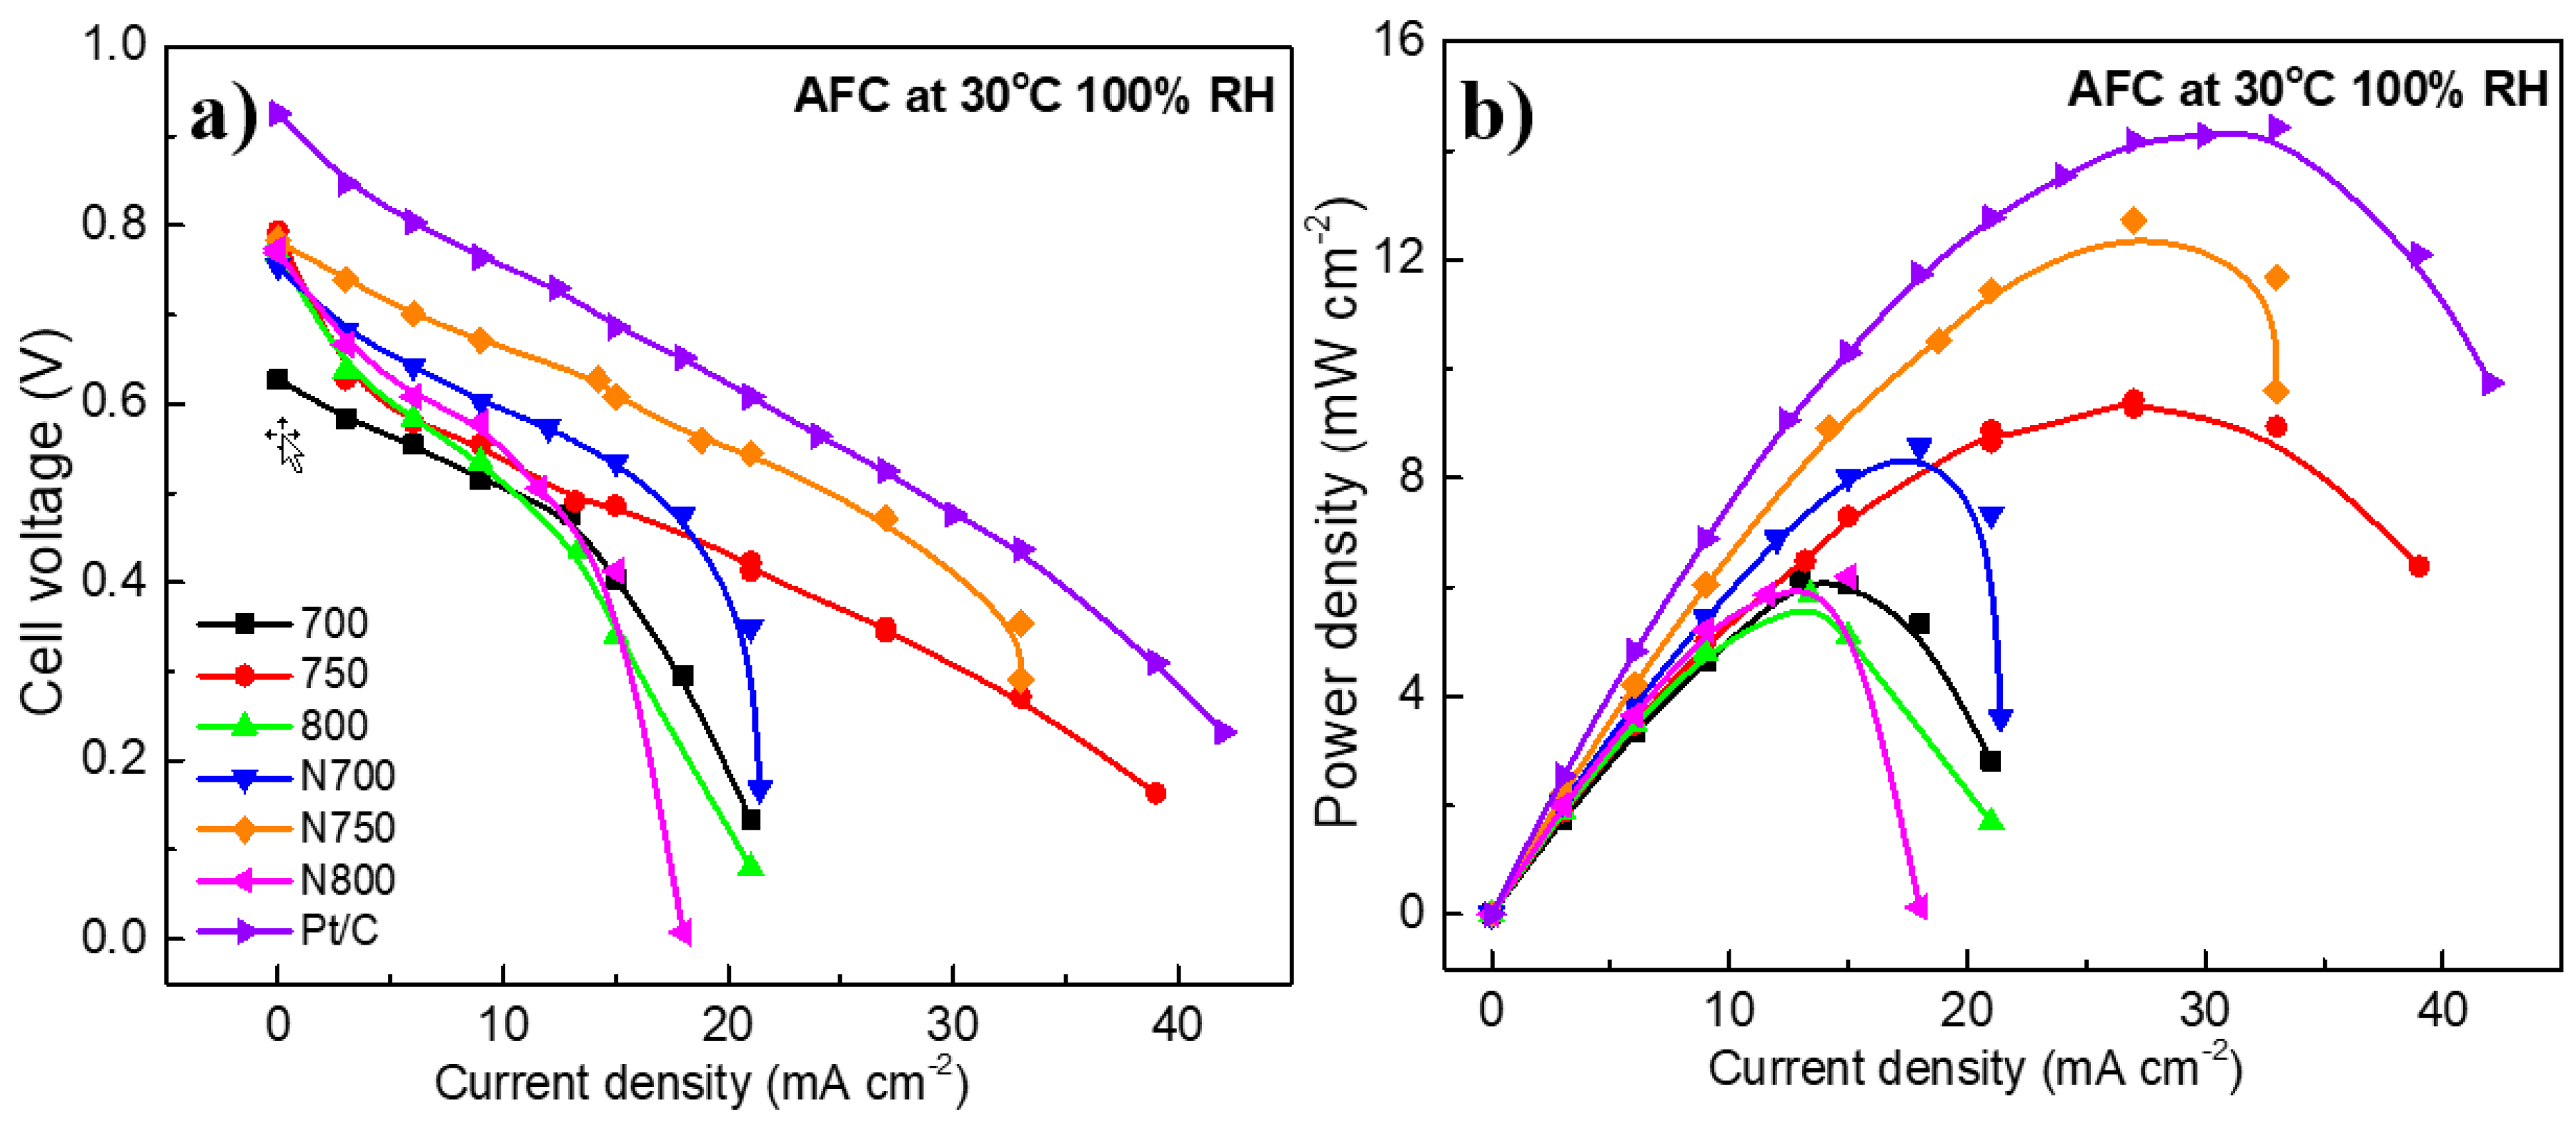
3.3. Fuel Cell Studies

Figure 9 presents the fuel cell polarization and power density curves from MEA with NPC at 30 °C and 100% relative humidity using H2 and O2 gases prepared as described above. A correlation parameter brief for each cathode is provided in Table 7. The anode loadings were 0.4 mg Pt cm−2 (34 wt % Pt, 40 wt % C, and 25% ionomer), while, at the cathode, they were 4, 1, 4, 2, 2, and 2 mg cm−2 (75 wt % electrocatalysts and 25% ionomer) for 700, 750, 800, N700, N750, and N800, respectively. All samples outperformed the 700 sample’s onset potential, indicating higher activity because of the N-doping effect and the pyrolysis temperature increase. The doping of the 700 sample influenced its polarization curve shape, as N700 demonstrated a higher activity (peak power 9.427 m2 g−1 and 0.793 V) than the 700 sample. Both 750 and N750 showed similar OCVs, but different peak power densities. At 0.8 V, N750 performed slightly better than 750, but in the mass transport area, 750 had the best performance. Although 800 and N800 had the highest temperatures, and N800 had the highest BET surface area (2675.4 mA cm−2), they exhibited a mass transfer limitation at a low potential (starting at 0.55 V), whereas samples at 700 and 750 °C did not. It is noteworthy that low loading cathodes (750 = 1.14 mg cm−2 and N750 = 1.59 mg cm−2) exhibited the best performance, so further electrode optimization must be performed, as both anode and cathode catalyst loading must be constant in order to get comparable results.
To summarize, the performance improved as the temperature increased from 700 to 750 °C, but further temperature increase reduced the power density. Additionally, the doping treatment favored the power density for each temperature, so that the maximum power density of the MEA prepared from NPC was 12.72 mW cm−2 from N700, which was close to that from Pt/C MEA on both the anode and cathode (14.42 mW cm−2). The performance of N750 is attributed to its graphitic nitrogen (22.4 wt %) content, high surface area (2594.3 m2 g−1), and high disorder structure, as studied by Raman spectroscopy. Compared to the Pt/C current density (42 mA cm−2), 750 and N750 were shown to be competitive, and their low production costs make them an efficient catalyst for AFC.

4. Conclusions

Electrocatalysts were synthesized by KOH activation and C5H5N doping of Sargassum spp. The surface area and pore volume decreased in the following order: 800 > N800 > 750 > N750 > 700 > N700. Chemical treatments performed with N700 allowed the surface area to increase from 60 m2 g−1 to 2513, 2594, and 2675 m2 g−1 for N700, N750, and N800, respectively.
The ORR performance of the electrocatalysts in terms of their current density was N800 > N750 > N700 > 750 > 800 > 700, while the onset potential decreased in the following order: N800 > 800 > 750 > 700 > N700 > N750. N800 presented the best ORR performance with the highest onset potential (0.870 V) and current density at 0.0 V vs. RHE (4.87 mA cm−2); this current density value is higher than commercial 10% Pt/C (4.0 mA cm−2). The fuel cell performance of the MEA prepared with an electrocatalyst synthesized at 750 °C and doped with C5H5N was 12.72 mW cm−2, which was close to that from Pt/C MEA on both the anode and cathode (14.42 mW cm−2). The performance was attributed to the high surface area, nitrogen content, defective structure, and graphitic nitrogen species found in Sargassum spp., which indicates that NPCs are an alternative to the problem of Sargassum spp. accumulation in the Caribbean due to their high efficiency as electrocatalysts for ORR.

Author Contributions

investigation, A.M.K. and B.E.; methodology, A.M.K.; writing—original draft preparation, K.Y.P.-S. and X.S.; writing—review and editing, K.Y.P.-S. and X.S.; funding acquisition, A.M.K. and R.B.; resources, P.Q.

Funding

This research received no external funding.

Acknowledgments

The authors want to thank the Consejo Nacional de Ciencia y Tecnología (CONACYT) for the grants 253986, 254667 and 2266. The authors thank Santiago González, Alejandro May, Martin Baas, Tanit Toledano, Wilian Cauich and Mónica Ruiz for technical support. XPS measurements were performed at LANNBIO Cinvestav Mérida, under support from projects FOMIX-Yucatán 2008-108160 CONACYT LAB-2009-01-123913, 292692, 294643, 188345, 204822, 292692, and 294643.

Conflicts of Interest

The authors declare no conflicts of interest.

References

  1. Zaidi, J.; Matsuura, T. Polymer Membranes for Fuel Cells; Springer Science & Business Media: Berlin, Germany, 2010; ISBN 9780387735320. [Google Scholar]
  2. Srinivasan, S. Fuel Cells: From Fundamentals to Applications; Springer Ebook Collection/Chemistry and Materials Science 2005–2008; Springer Science & Business Media: Berlin, Germany, 2006; ISBN 9780387251165. [Google Scholar]
  3. Garche, J.; Dyer, C.K.; Moseley, P.T.; Ogumi, Z.; Rand, D.A.J.; Scrosati, B. Encyclopedia of Electrochemical Power Sources; Elsevier Science: Amsterdam, The Netherlands, 2013; ISBN 9780444527455. [Google Scholar]
  4. De Geeter, E.; Mangan, M.; Spaepen, S.; Stinissen, W.; Vennekens, G. Alkaline fuel cells for road traction. J. Power Sources 1999, 80, 207–212. [Google Scholar] [CrossRef]
  5. Sollogoub, C.; Guinault, A.; Bonnebat, C.; Bennjima, M.; Akrour, L.; Fauvarque, J.F.; Ogier, L. Formation and characterization of crosslinked membranes for alkaline fuel cells. J. Membr. Sci. 2009, 335, 37–42. [Google Scholar] [CrossRef]
  6. Penner, S.S. Assessment of Research Needs for Advanced Fuel Cells; Elsevier Science: Amsterdam, The Netherlands, 2013; ISBN 9781483190976. [Google Scholar]
  7. Larminie, J.; Dicks, A. Fuel Cell Systems Explained; John Wiley & Sons Ltd.: Chichster, UK, 2003; ISBN 047084857X. [Google Scholar]
  8. Ge, X.; Sumboja, A.; Wuu, D.; An, T.; Li, B.; Goh, F.W.T.; Hor, T.S.A.; Zong, Y.; Liu, Z. Oxygen Reduction in Alkaline Media: From Mechanisms to Recent Advances of Catalysts. ACS Catal. 2015, 5, 4643–4667. [Google Scholar] [CrossRef]
  9. Zhou, L.; Fu, P.; Wen, D.; Yuan, Y.; Zhou, S. Self-constructed carbon nanoparticles-coated porous biocarbon from plant moss as advanced oxygen reduction catalysts. Appl. Catal. B Environ. 2016, 181, 635–643. [Google Scholar] [CrossRef]
  10. Weththasinha, H.A.B.M.D.; Yan, Z.; Gao, L.; Li, Y.; Pan, D.; Zhang, M.; Lv, X.; Wei, W.; Xie, J. Nitrogen doped lotus stem carbon as electrocatalyst comparable to Pt/C for oxygen reduction reaction in alkaline media. Int. J. Hydrogen Energy 2017, 42, 20560–20567. [Google Scholar] [CrossRef]
  11. Konwar, L.J.; Sugano, Y.; Chutia, R.S.; Shchukarev, A.; Mäki-Arvela, P.; Kataki, R.; Mikkola, J.P. Sustainable synthesis of N and P co-doped porous amorphous carbon using oil seed processing wastes. Mater. Lett. 2016, 173, 145–148. [Google Scholar] [CrossRef]
  12. Li, J.; Wang, S.; Ren, Y.; Ren, Z.; Qiu, Y.; Yu, J. Nitrogen-doped activated carbon with micrometer-scale channels derived from luffa sponge fibers as electrocatalysts for oxygen reduction reaction with high stability in acidic media. Electrochim. Acta 2014, 149, 56–64. [Google Scholar] [CrossRef]
  13. Gao, S.; Geng, K.; Liu, H.; Wei, X.; Zhang, M.; Wang, P.; Wang, J. Transforming organic-rich amaranthus waste into nitrogen-doped carbon with superior performance of the oxygen reduction reaction. Energy Environ. Sci. 2015, 8, 221–229. [Google Scholar] [CrossRef]
  14. Wang, N.; Li, T.; Song, Y.; Liu, J.; Wang, F. Metal-free nitrogen-doped porous carbons derived from pomelo peel treated by hypersaline environments for oxygen reduction reaction. Carbon N. Y. 2018, 130, 692–700. [Google Scholar] [CrossRef]
  15. Wang, G.; Peng, H.; Qiao, X.; Du, L.; Li, X.; Shu, T.; Liao, S. Biomass-derived porous heteroatom-doped carbon spheres as a high-performance catalyst for the oxygen reduction reaction. Int. J. Hydrogen Energy 2016, 41, 14101–14110. [Google Scholar] [CrossRef]
  16. Wang, R.; Wang, H.; Zhou, T.; Key, J.; Ma, Y.; Zhang, Z.; Wang, Q.; Ji, S. The enhanced electrocatalytic activity of okara-derived N-doped mesoporous carbon for oxygen reduction reaction. J. Power Sources 2015, 274, 741–747. [Google Scholar] [CrossRef]
  17. Guo, C.; Hu, R.; Liao, W.; Li, Z.; Sun, L.; Shi, D.; Li, Y.; Chen, C. Protein-enriched fish “biowaste” converted to three-dimensional porous carbon nano-network for advanced oxygen reduction electrocatalysis. Electrochim. Acta 2017, 236, 228–238. [Google Scholar] [CrossRef]
  18. Fang, Y.; Wang, H.; Yu, H.; Peng, F. Electrochimica Acta From chicken feather to nitrogen and sulfur co-doped large surface bio-carbon fl ocs: An ef fi cient electrocatalyst for oxygen reduction reaction. Electrochim. Acta 2016, 213, 273–282. [Google Scholar] [CrossRef]
  19. Guo, C.; Liao, W.; Li, Z.; Chen, C. Exploration of the catalytically active site structures of animal biomass-modified on cheap carbon nanospheres for oxygen reduction reaction with high activity, stability and methanol-tolerant performance in alkaline medium. Carbon N. Y. 2015, 85, 279–288. [Google Scholar] [CrossRef]
  20. Zheng, J.; Guo, C.; Chen, C.; Fan, M.; Gong, J.; Zhang, Y.; Zhao, T.; Sun, Y.; Xu, X.; Li, M.; et al. High content of pyridinic- and pyrrolic-nitrogen-modified carbon nanotubes derived from blood biomass for the electrocatalysis of oxygen reduction reaction in alkaline medium. Electrochim. Acta 2015, 168, 386–393. [Google Scholar] [CrossRef]
  21. Elmouwahidi, A.; Vivo-Vilches, J.F.; Pérez-Cadenas, A.F.; Maldonado-Hódar, F.J.; Carrasco-Marín, F. Free metal oxygen-reduction electro-catalysts obtained from biomass residue of the olive oil industry. Chem. Eng. J. 2016, 306, 1109–1115. [Google Scholar] [CrossRef]
  22. Lardizabal-Guitierrez, D.; González-Quijano, D.; Bartolo-Pérez, P.; Escobar-Morales, B.; Rodríguez-Varela, F.J.; Alonso-Lemus, I.L. Communication—Synthesis of Self-Doped Metal-Free Electrocatalysts from Waste Leather with High ORR Activity. J. Electrochem. Soc. 2016, 163, H15–H17. [Google Scholar] [CrossRef]
  23. Alonso-Lemus, I.L.; Rodriguez-Varela, F.J.; Figueroa-Torres, M.Z.; Sanchez-Castro, M.E.; Hernandez-Ramírez, A.; Lardizabal-Gutierrez, D.; Quintana-Owen, P. Novel self-nitrogen-doped porous carbon from waste leather as highly active metal-free electrocatalyst for the ORR. Int. J. Hydrogen Energy 2016, 1–8. [Google Scholar] [CrossRef]
  24. Yoon, S.-H.; Lim, S.; Song, Y.; Ota, Y.; Qiao, W.; Tanaka, A.; Mochida, I. KOH activation of carbon nanofibers. Carbon N. Y. 2004, 42, 1723–1729. [Google Scholar] [CrossRef]
  25. Fujimoto, Y. Formation, energetics, and electronic properties of graphene monolayer and bilayer doped with heteroatoms. Adv. Condens. Matter Phys. 2015, 2015. [Google Scholar] [CrossRef]
  26. Li, Z.; Gao, Q.; Qian, W.; Tian, W.; Zhang, H.; Zhang, Q.; Liu, Z. Ultrahigh Oxygen Reduction Reaction Electrocatalytic Activity and Stability over Hierarchical Nanoporous N-doped Carbon. Sci. Rep. 2018, 8, 1–8. [Google Scholar] [CrossRef] [PubMed]
  27. Liu, F.; Peng, H.; You, C.; Fu, Z.; Huang, P. Electrochimica Acta High-Performance Doped Carbon Catalyst Derived from Nori Biomass with Melamine Promoter. Electrochim. Acta 2014, 138, 353–359. [Google Scholar] [CrossRef]
  28. Lardizábal-G, D.; Verde-Gómez, Y.; Alonso-Lemus, I.; Aguilar-Elguezabal, A. Nitrogen self-doped electrocatalysts synthesized by pyrolysis of commercial polymer fibers for oxygen reduction reaction. Int. J. Hydrogen Energy 2015, 40, 17300–17307. [Google Scholar] [CrossRef]
  29. Vivekananthan, J.; Masa, J.; Chen, P.; Xie, K.; Muhler, M.; Schuhmann, W. Nitrogen-doped carbon cloth as a stable self-supported cathode catalyst for air/H2-breathing alkaline fuel cells. Electrochim. Acta 2015, 182, 312–319. [Google Scholar] [CrossRef]
  30. Solarin, B.B.; Bolaji, D.A.; Fakayode, O.S.; Akinnigbagbe, R.O. Impacts of an invasive seaweed Sargassum hystrix var. fluitans (Børgesen 1914) on the fisheries and other economic implications for the Nigerian coastal waters. IOSR J. Agric. Vet. Sci. 2014, 7, 1–6. [Google Scholar] [CrossRef]
  31. Niermann, U. Distribution of Sargassum natans and some of its epibionts in the Sargasso Sea. Helgoländer Meeresuntersuchungen 1986, 40, 343–353. [Google Scholar] [CrossRef]
  32. Schell, J.M.; Goodwin, D.S.; Siuda, A.N. Recent Sargassum Inundation Events in the Caribbean. Oceanography 2015, 28, 8–11. [Google Scholar] [CrossRef]
  33. Li, H.; Zhang, Y.; Han, X.; Shi, X.; Rivkin, R.B.; Legendre, L. Growth responses of Ulva prolifera to inorganic and organic nutrients: Implications for macroalgal blooms in the southern Yellow Sea, China. Sci. Rep. 2016, 6, 1–11. [Google Scholar] [CrossRef] [PubMed]
  34. Jacobs, A. With Surf like Turf, Huge Algae Bloom Befouls China Coast. The New York Times. 2013. Available online: http://www.nytimes.com/2013/07/06/world/asia/ (accessed on 21 August 2018).
  35. Sissini, M.N.; de Barros Barreto, M.B.B.; Széchy, M.T.M.; de Lucena, M.B.; Oliveira, M.C.; Gower, J.; Liu, G.; de Oliveira Bastos, E.; Milstein, D.; Gusmão, F.; et al. The floating Sargassum (Phaeophyceae) of the South Atlantic Ocean—Likely scenarios. Phycologia 2017, 56, 321–328. [Google Scholar] [CrossRef]
  36. Buck, B.H.; Troell, M.F.; Krause, G.; Angel, D.L.; Grote, B.; Chopin, T. State of the Art and Challenges for Offshore Integrated Multi-Trophic Aquaculture (IMTA). Front. Mar. Sci. 2018, 5. [Google Scholar] [CrossRef] [Green Version]
  37. Liu, L.; Yang, X.; Ma, N.; Liu, H.; Xia, Y.; Chen, C.; Yang, D.; Yao, X. Scalable and Cost-Effective Synthesis of Highly Efficient Fe2N-Based Oxygen Reduction Catalyst Derived from Seaweed Biomass. Small 2016, 12, 1295–1301. [Google Scholar] [CrossRef] [PubMed]
  38. Song, M.Y.; Park, H.Y.; Yang, D.-S.; Bhattacharjya, D.; Yu, J.-S. Seaweed-Derived Heteroatom-Doped Highly Porous Carbon as an Electrocatalyst for the Oxygen Reduction Reaction. ChemSusChem 2014, 1755–1763. [Google Scholar] [CrossRef] [PubMed]
  39. Pérez-Salcedo, K.Y.; Alonso-Lemus, I.L.; Quintana, P.; Mena-Durán, C.J.; Barbosa, R.; Escobar, B. Self-doped Sargassum spp. derived biocarbon as electrocatalysts for ORR in alkaline media. Int. J. Hydrogen Energy 2018. [Google Scholar] [CrossRef]
  40. Han, W.; Clarke, W.; Pratt, S. Composting of waste algae: A review. Waste Manag. 2014, 34, 1148–1155. [Google Scholar] [CrossRef] [PubMed]
  41. Brotosudarmo, T.H.P. Analysis of pigment composition of brown seaweeds collected from Panjang Island. Philipp. J. Sci. 2017, 146, 323–330. [Google Scholar]
  42. Leofanti, G.; Padovan, M.; Tozzola, G.; Venturelli, B. Surface area and pore texture of catalysts. Catal. Today 1998, 41, 207–219. [Google Scholar] [CrossRef]
  43. Yu, W.; Wang, H.; Liu, S.; Mao, N.; Liu, X.; Shi, J.; Liu, W.; Chen, S.; Wang, X. N, O-codoped hierarchical porous carbons derived from algae for high-capacity supercapacitors and battery anodes. J. Mater. Chem. A 2016, 4, 5973–5983. [Google Scholar] [CrossRef]
  44. Guo, C.; Liao, W.; Li, Z.; Sun, L.; Chen, C. Easy conversion of protein-rich enoki mushroom biomass to a nitrogen-doped carbon nanomaterial as a promising metal-free catalyst for oxygen reduction reaction. Nanoscale 2015, 7, 15990–15998. [Google Scholar] [CrossRef]
  45. Wang, R.; Wang, K.; Wang, Z.; Song, H.; Wang, H.; Ji, S. Pig bones derived N-doped carbon with multi-level pores as electrocatalyst for oxygen reduction. J. Power Sources 2015, 297, 295–301. [Google Scholar] [CrossRef]
  46. Ferrero, G.A.; Preuss, K.; Fuertes, A.B.; Sevilla, M.; Titirici, M.M. The influence of pore size distribution on the oxygen reduction reaction performance in nitrogen doped carbon microspheres. J. Mater. Chem. A 2016, 4, 2581–2589. [Google Scholar] [CrossRef] [Green Version]
  47. Davis, R.E.; Horvath, G.L.; Tobias, C.W. The Solubility and Diffusion Coefficient of Oxygen in Potassium Hydroxide Solutions. Electrochim. Acta 1967, 12, 287. [Google Scholar] [CrossRef]
  48. Guo, C.Z.; Liao, W.L.; Chen, C.G. Design of a non-precious metal electrocatalyst for alkaline electrolyte oxygen reduction by using soybean biomass as the nitrogen source of electrocatalytically active center structures. J. Power Sources 2014, 269, 841–847. [Google Scholar] [CrossRef]
Figure 1. (a) Electrocatalysts’ nitrogen adsorption—desorption isotherms and (b) micropore size distribution of electrocatalysts based on the micropore (MP) method.
Energies 12 00346 g001
Figure 2. SEM images for electrocatalysts (a) 700; (b) 750; (c) 800; (d) N700; (e) N750, and (f) N800.
Energies 12 00346 g002
Figure 3. (a) Raman spectra and (b) XRD patterns of electrocatalysts synthesized from Sargassum spp. at different temperatures.
Energies 12 00346 g003
Figure 4. High resolution X-ray photoelectron spectroscopy spectra in the C1s, N1s, and O1s regions for undoped samples (700, 750, and 800).
Energies 12 00346 g004
Figure 5. High resolution X-ray photoelectron spectroscopy spectra in the C1s, N1s, and O1s regions for doped samples (N700, N750, and N800).
Energies 12 00346 g005
Figure 6. (a) Linear sweep voltammetry (LSV) assessment of metal-free electrocatalysts at 2000 rpm and a 5 mV s−1 scan rate in O2-saturated 0.5 M KOH solution and (b) cyclic voltammetry (CV) in N2-saturated alkaline electrolyte (0.5 M KOH) at a 20 mV s−1 scan rate.
Energies 12 00346 g006
Figure 7. K-L plots of J−1 vs. ω−1/2 obtained from electrocatalysts (through Linear sweep voltammetry).
Energies 12 00346 g007
Figure 8. Electron-transfer numbers obtained from K-L plots for each synthesized electrocatalyst.
Energies 12 00346 g008
Figure 9. (a) Fuel cell polarization and (b) power density curves at 30 °C and 100% relative humidity using H2 and O2 gases.
Energies 12 00346 g009
Table 1. Nomenclature to identify the synthesized electrocatalysts.
NomenclatureDescription
700Grounded and washed raw sample (RS) impregnated at 1:2 RS/KOH ratio for 1 h, pyrolyzed in Ar@700 °C and 2 M HCl acid washing at 95 °C
750Grounded and washed raw sample (RS) impregnated at 1:2 RS/KOH ratio for 1 h, pyrolyzed in Ar@750 °C and 2 M HCl acid washing at 95 °C
800Grounded and washed raw sample (RS) impregnated at 1:2 RS/KOH ratio for 1 h, pyrolyzed in Ar@800 °C and 2 M HCl acid washing at 95 °C
N700700 sample doped with C5H5N in autoclave at 180 °C for 24 h
N750750 sample doped with C5H5N in autoclave at 180 °C for 24 h
N800800 sample doped with C5H5N in autoclave at 180 °C for 24 h
Table 2. Analysis of elemental CHNS composition (wt %) of the electrocatalyst bulk.
SampleNitrogen (wt %)Carbon (wt %)Hydrogen (wt %)Sulphur (wt %)
7000.00 ± 0.0058.95 ± 0.013.49 ± 0.310.36 ± 0.28
7500.00 ± 0.0067.37 ± 0.692.48 ± 0.180.53 ± 0.07
8000.00 ± 0.0068.86 ± 0.363.62 ± 0.380.00 ± 0.00
N7000.87 ± 0.0774.58 ± 0.082.77 ± 0.220.0 ± 0.0
N7500.71 ± 0.0174.8 ± 0.691.99 ± 0.280.0 ± 0.0
N8000.79 ± 0.0280.95 ± 1.781.37 ± 0.090.0 ± 0.0
Table 3. Textural properties of the synthetized samples from Sargassum spp.
Electro-CatalystsSurface Area Correlation CoefficientMean Pore Diameter Pore Volume (P/P0 = 0.990)
(m2 g−1)r(nm)(cm3 g−1)
70017900.99991.800.8057
75019750.99981.850.9116
80022630.99991.921.0886
N70025130.99991.210.7576
N75025940.99992.541.2437
N80026750.99981.761.1765
Table 4. X-ray photoelectron spectroscopy (XPS) data of the chemical surface composition of electrocatalysts before (700, 750, and 800) and after C5H5N doping (N700, N750, and N800).
Elemental Composition from XPS (at.%)Nitrogen Chemical States. Relative Concentration (%) and Binding Energy (eV)
SampleC1sO1sS2pN1sN1 PyridinicN2 PyrrolicN3 Graphitic
70090.166.832.240.7715.8 (399.3)57.4 (399.9)26.7 (402.7)
75089.636.882.221.2725.5 (398.1)41.5 (400.06)33.0 (402.7)
80087.328.113.121.4519.1 (399.3)56.2 (400.02)24.7 (402.7)
N70089.088.270.002.65-- (--)77.3 (399.98)22.7 (402.7)
N75090.947.220.001.84-- (--)77.6 (400)22.4 (402.7)
N80093.066.190.000.75-- (--)73.7 (399.93)26.3 (402.7)
Table 5. Electrocatalytical parameters of the oxygen reduction reaction (ORR) performance.
ElectrocatalystsCurrent Density (mA cm−2 at 0.0 V)Onset Potential (V vs. RHE)
7002.930.827
7503.890.828
8003.340.843
N7004.150.812
N7504.320.811
N8004.870.870
10% Pt4.031.010
Table 6. Comparison among doped biomass used for electrocatalysts synthesis for ORR in alkaline media.
Carbon SourceSample CHNSXPS N1sORR Test Conditions Onset Potential (V vs. RHE)Current Density at 0.2 V vs. RHE (mA cm−2)Reference
Sample N (%) N1N2N3KOHRPMmV s−1
soybeansFe/C-SOYB-A4.63147220.11600---0.7902.5[48]
zpig blood N-CNT(800)2.85233140.1160050.9103.4[20]
moss TMC9004.43732260.11100100.9354.8[9]
RS7000.01657270.5200050.8272.7This work
RS7500.02642330.5200050.8283.3This work
RS8000.01956250.5200050.8432.9This work
RSN7000.9077230.5200050.8122.9This work
RSN7500.7078220.5200050.8113.8This work
RSN8000.8074260.5200050.8704.0This work
Table 7. Fuel cell parameters for electrocatalysts tested at 30 °C and 100% relative humidity using H2 and O2 gases.
Sample Imax (mA cm−2)OCV (V vs. RHE)Pmax (mW cm−2)
700210.6276.189
750390.7939.427
800210.7845.856
N700210.7548.570
N750330.78412.723
N800180.7746.189
Pt 10%420.92514.422

