Study on the Cooling Effect of Attached Fins on PV Using CFD Simulation

Department of Architectural Engineering, Pusan National University, 2 Busandaehak-ro 63, Geomjeong-gu, Busan 46241, Korea
*
Author to whom correspondence should be addressed.
Energies 2019, 12(4), 758; https://0-doi-org.brum.beds.ac.uk/10.3390/en12040758
Submission received: 14 January 2019
/
Revised: 18 February 2019
/
Accepted: 18 February 2019
/
Published: 25 February 2019
(This article belongs to the Special Issue Photovoltaic Modules)
Abstract
:The issue of efficiency decrease according to temperature increase is a pending problem in the PV market. Several active and passive technologies have been suggested but few quantitative studies on the estimation of the cooling effect have been carried out. In this study, a CFD (computational fluid dynamics) simulation model was developed to analyze a passive cooling technology using fins attached to the back of the PV module. Furthermore, a method to improve airflow at the back of the PV module by forming slits in the frame was analyzed. The simulation model reproduced the indoor test that uses a solar simulator and the cooling performance was analyzed according to the shape of the fins and the presence of slits. In the simulation results, the surface temperature and expected electrical efficiency without cooling were 62.78 °C and 13.24% respectively under nominal operating cell temperature conditions. Moreover, the temperature reduced by approximately 15.13 °C because the fins attached at the bottom of the PV module increased the heat transfer area with airflow. Thus, the electrical efficiency according to the PV module temperature was predicted as 14.39%. Furthermore, when slits were installed between the fins, they increased the airflow velocity and accelerated the formation of turbulence, thereby improving the cooling performance of the fins. The simulation results showed that the temperature could be further reduced by approximately 8.62 °C at a lower air velocity. As the fins and slits can also reduce the non-uniformity of the temperature, they are expected to supplement the efficiency and durability reduction of the PV modules caused by the hot spot phenomenon. In addition, it was shown that slits in the frame could further improve the cooling performance of the fins at a low-velocity airflow.
1. Introduction
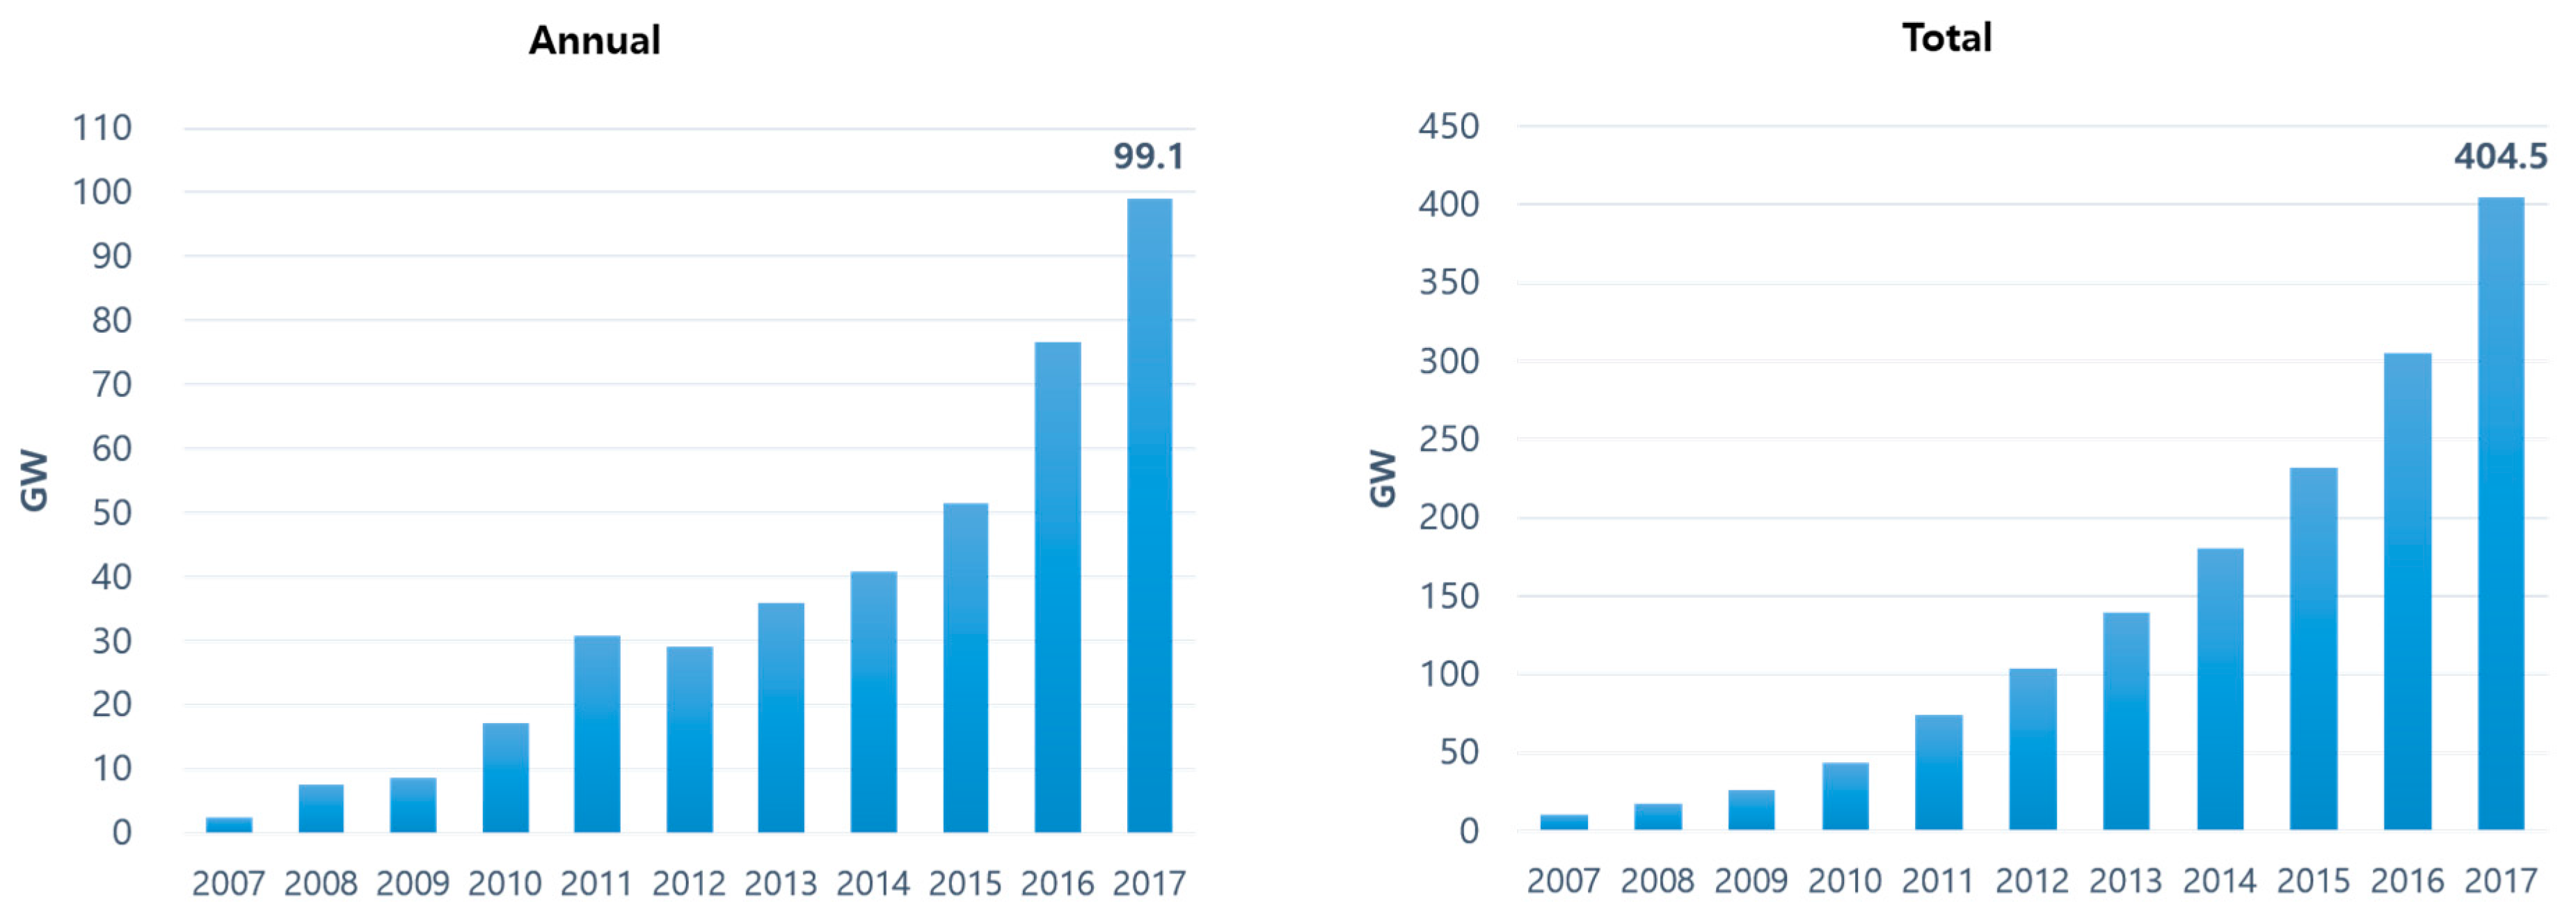
Policy efforts and support to reduce carbon dioxide emissions worldwide have been recently made due to the problems of increasing energy demands and primary energy depletion [1]. South Korea has encouraged the development and distribution of renewable energy sources to achieve the obligatory renewable energy supply rate of 30% compared to the expected energy consumption by buildings until 2020 (Table 1). In particular, the implementation of zero energy building (ZEB) for the energy independence of buildings is attracting attention to reduce energy demands in the building sector. The ZEB implementation requires an increase in the energy efficiency and energy production of the building itself [2]. Particularly, the energy production of buildings using renewable energy facilities is an important element. Among the representative renewable energy facilities applied to buildings, PV systems are the sources of abundant energy. They are sources of renewable energy with ever increasing installation cases because they are highly applicable to buildings (Figure 1). However, it is difficult to secure the economic efficiency of PV systems due to limited installation areas in buildings, and installation and maintenance costs. Therefore, studies on the performance improvement of PV systems have been actively conducted to advance their grid parity and increase their penetration rate.
Elements that affect the performance of PV systems include the efficiency of the cell, shadow on the panel, and solar radiation. Studies have been conducted to improve the performance of PV systems considering these elements. Although flexible thin film Si-based solar cells have been beneficial for application and high power conversion efficiencies, the balance between the cell efficiency and robustness of flexible photovoltaic cells remains a pending issue. Bahabry et al. [5] demonstrated that corrugated architecture silicon cells achieved a bending radius of 140 μm of the back contacts with a power conversion efficiency of 17.2% on a wafer scale (127 × 127 mm2). Furthermore, the shading effect due to trees, clouds, and buildings affects the performance of the photovoltaic solar panel. Sathyanarayana et al. [6] investigated the correlation between the short circuit current and performance of the photovoltaic panel under uniform shading conditions. The results indicated that the short circuit current and power output decreased with shading. The performance of the photovoltaic panel can be improved by applying the maximum power point tracking (MPPT) control. However, the classical perturb and observe (P and O) tracker is not adequate under the ramp change of the irradiation level. Abdel-Salam et al. [7] proposed a modified P and O-based MPP tracking method that showed a higher performance of the tracking speed, efficiency, and tracking accuracy compared to the classical P and O method.
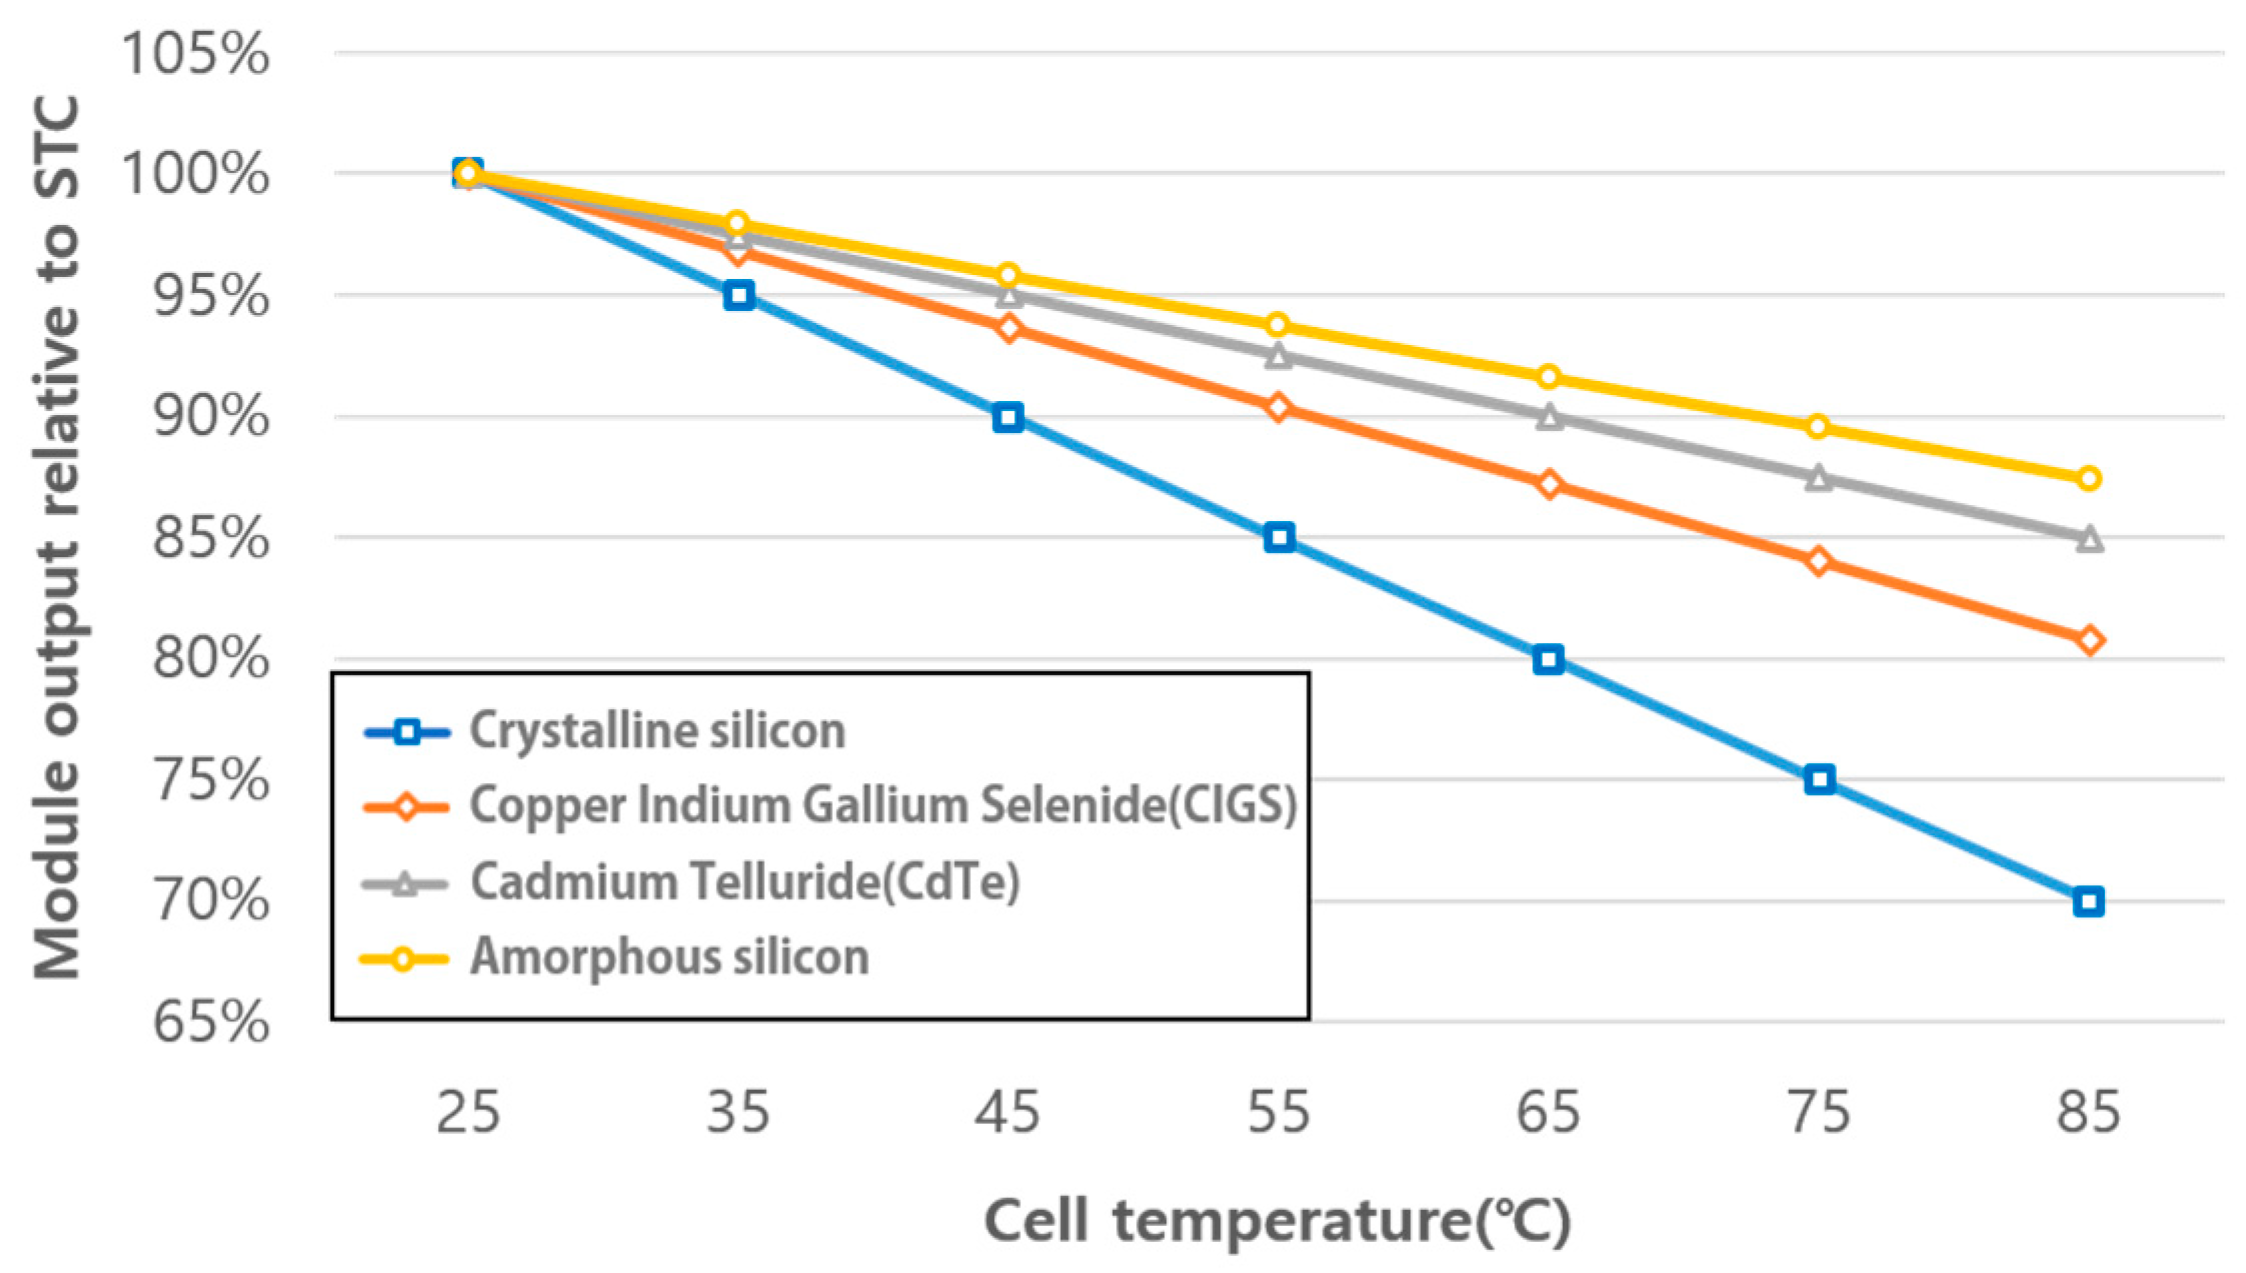
On the other hand, Figure 2 shows that the power of the PV module decreases as the cell temperature increases. In other words, the cell efficiency can be increased by cooling the PV module. Therefore, many cooling methods have been proposed to improve the performance of the PV module. The cooling methods of the PV module may be divided into passive and active methods.
Active cooling methods are useful under high-temperature conditions that require effective cooling performance of PV modules. Teo et al. [9] carried out the computational fluid dynamics (CFD) simulation and experiments to find out the cooling performance of the parallel array of air ducts attached to the back of the PV module. As a result, the solar cell achieved a higher efficiency of 12%–14% with cooling compared to the efficiency of 8%–9% without cooling. Moharram et al. [10] conducted an experiment to demonstrate the cooling effect by spraying water on PV modules. It was found that the proposed system reduced the cell temperature, and the panel surface could be cleaned in hot and dusty regions. D’Angola et al. [11] analyzed the performance of a PV system with active cooling in which fluid is pumped on the back of the module. In order to find the best compromise between the PV power gain and the pump consumption in terms of flow rate, simulation of a thermal-electric-hydraulic model considering the power losses of the circulation pump was carried out. It was found that the net power gain of the cooling considering the pump consumption was possible through the complete model.
Passive cooling methods have an advantage that no additional power is required. A scale analysis and numerical study on PV modules that involved an open-air channel were conducted by Mittelman et al. [12]. In addition, Ebrahimi [13] developed a new cooling technology that used natural vapor as a coolant to extract heat from PV modules. It was suggested that PV modules could be installed in places with natural vaporization such as rivers and canals.
The other cooling method includes a technology that uses a cooling fin attached to the back of a PV module to enhance the convective heat transfer coefficient. Koundinya [14] proposed a finned heat pipe integrated with a solar module. It was found from the CFD results that the maximum decrease in the solar module was 20 °C. Elsafi [15] developed a mathematical model to predict the performance of a photovoltaic/thermal (PV/T) system according to different fin configurations. The simulation results indicated that the use of a cooling fin was beneficial to improve the performance of the PV/T system. Nehari [16] conducted a two-dimensional (2D) numerical simulation to analyze the length of the internal fins inside the PV-PCM system. It was clear that the fins reduced significantly the increase in the PV temperature. In addition, the PV module was more cooled as the length of the fins was 25, 30, 25 mm. Hasan [17] presented a theoretical and experimental study of the cooling technology using fins attached to the back side of the PV panel. The results indicated that the fins dropped dramatically the temperature of the PV panel by about 5.7%. The technology using cooling fins is neither high-tech nor creative. In addition, the cooling effect could be obtained easily using this technology and can be applied to PV modules that are already installed. However, the simulation analysis of cooling fins considering the airflow around the PV module and solar irradiation simultaneously has been rarely carried out. Therefore, in this study, in order to analyze the fin effect on heat transfer, a simulation model was developed under the condition of airflow around a PV module using CFD.
2. Research Methodology
The performance of a PV module is measured under standard conditions such as standard test conditions (STC) and nominal operating cell temperature (NOCT). The estimation of PV performance is performed under the STC (ambient temperature of 25 °C and irradiance of 1000 ). Using the electrical efficiency () of STC. The electrical efficiency () can be calculated using Equation (1) when the temperature of the PV module is T [18]. The temperature coefficient () is determined by the material of the PV module. It can be observed that an increase in the temperature of the PV module decreases the electrical efficiency. This indicates that the performance of the PV module can be improved using cooling technology.
Meanwhile, the IEC 61215/61646 norms, which considers more realistic conditions than STC, defined NOCT as the temperature of a PV module at standard reference environment (SRE: ambient temperature () of 20 °C, an irradiance of 800 , and wind speed of 1 m/s). Moreover, under the conditions of G irradiance and , the temperature of the PV module () can be calculated using Equation (2) by applying NOCT [19].
The International Electrotechnical Commission (IEC) provides a standard procedure for measuring NOCT under the following conditions.
- (1)
- The test modules are open circuited.
- (2)
- Reject all data when the irradiance is below 300 .
- (3)
- Wind speeds during the measurement are limited to between 0.25 m/s and 1.75 m/s.
- (4)
- Ambient temperature ranges between 5 °C and 35 °C.
The aim of this study was to analyze the module temperature reduction effect of the cooling fins considering the standard conditions for performance assessment to improve the power generation efficiency of a PV module. However, the simulation models of previous studies that analyzed the temperature of a PV module based on CFD seldom considered the airflow around a PV module directly. Therefore, the indoor test of a PV module was simulated under the NOCT condition using the CFD simulation (Figure 3). The simulation model considered the airflow around a PV module. Using this model, the reduction in the temperature of the PV module according to the shape of the cooling fin was analyzed.
In this research, the prediction of the electrical efficiency was performed using PV temperature obtained from the simulation result. In order to analyze indirectly an unglazed photovoltaic module, a theoretical model, which integrates both thermal and electrical aspects, has been developed by Spertino et al. [19] However, the calculation of the electrical efficiency is complicated to apply to this simulation. In this paper, the estimation of the electrical efficiency considering the PV temperature was simply carried out with Equation (1) as the thermal analysis on the cooling effect of fins was focused.
3. CFD Simulation
3.1. CFD Simulation Model
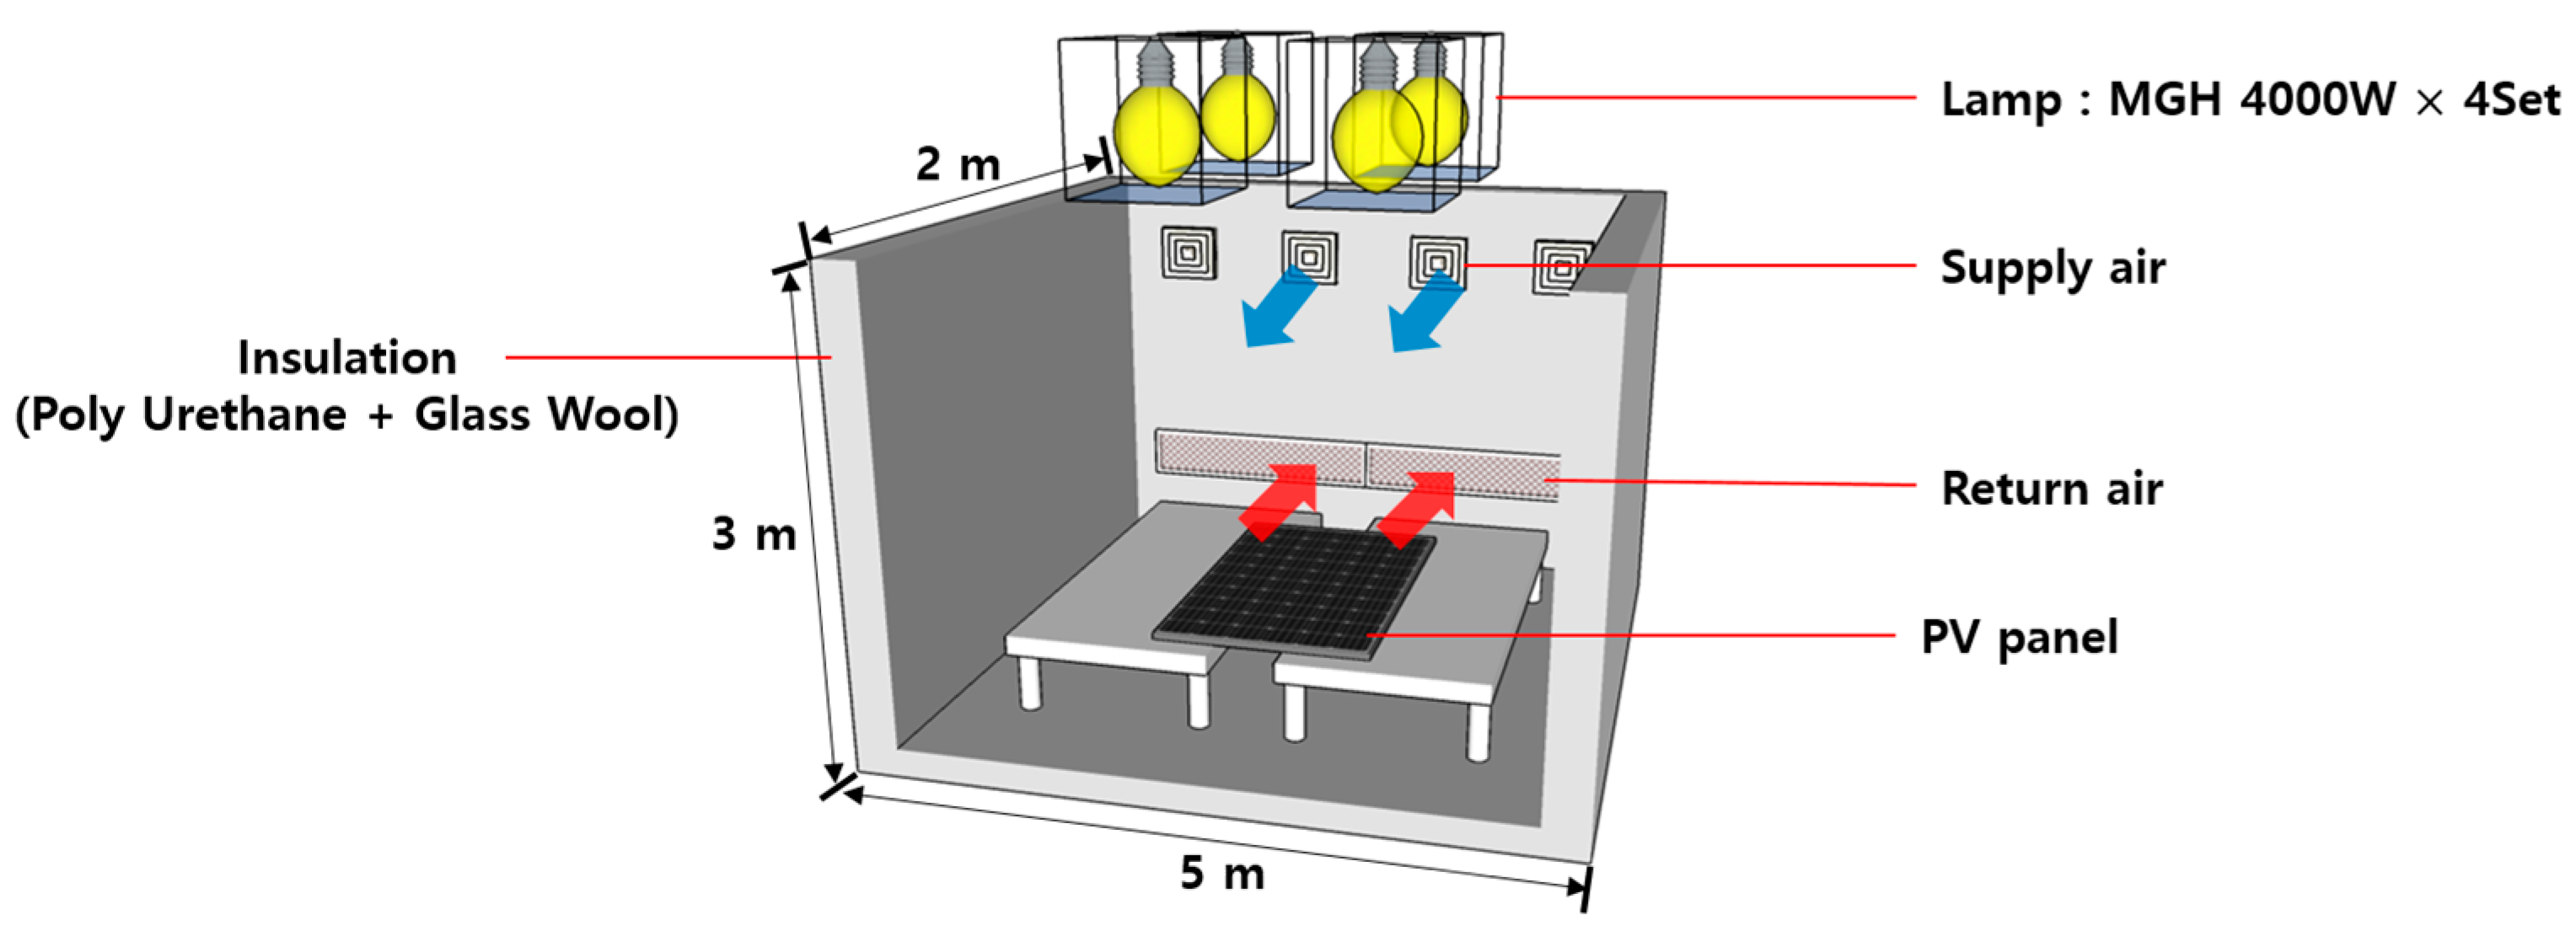
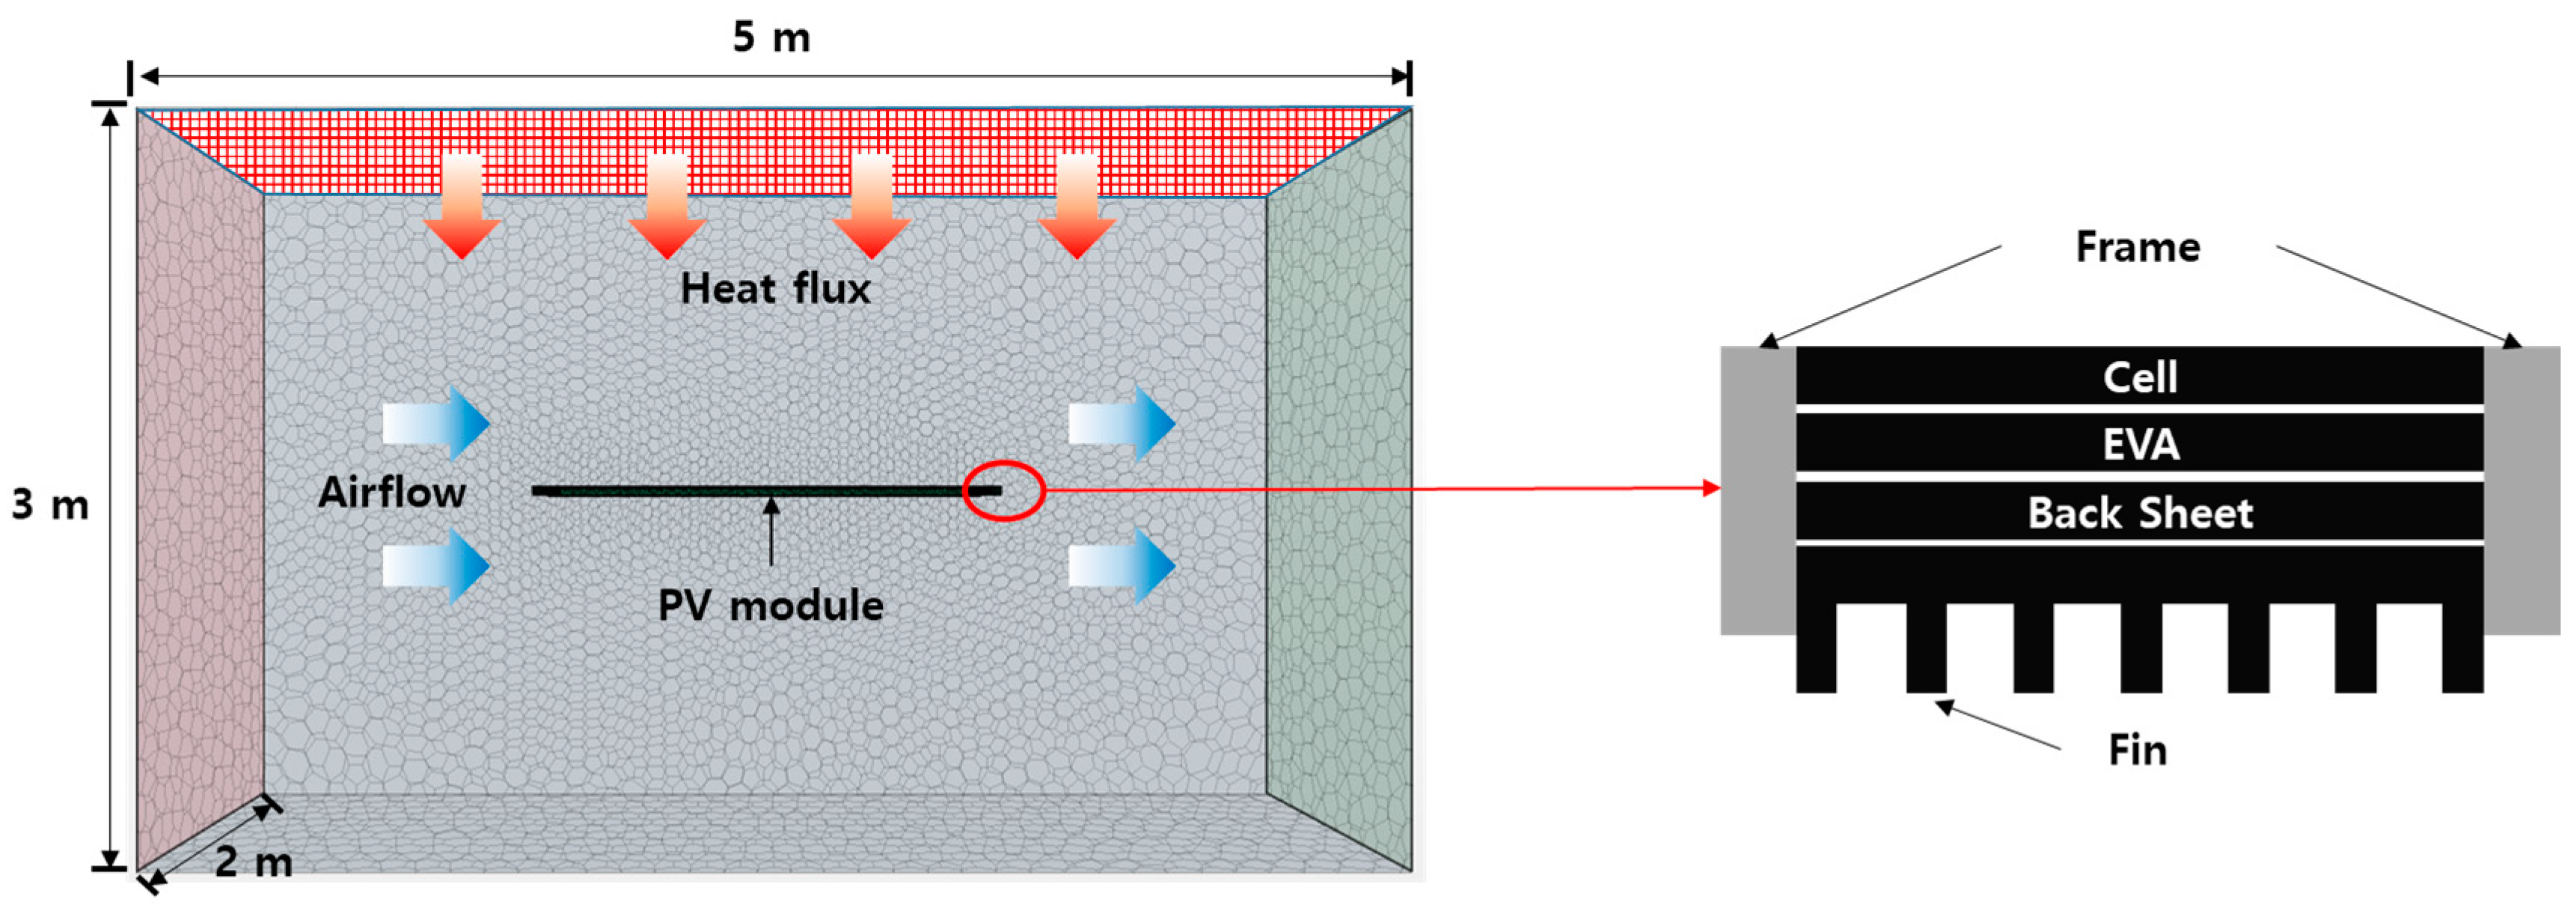
To analyze the cooling performance of the cooling fins attached at the bottom of the PV module, -, which is a commercial CFD simulation platform for conducting a physical analysis of fluid flow and heat transfer, was used. The simulation model was constructed to analyze the effect of the airflow around the PV module by referring to the indoor test that used a solar simulator. The PV module was inserted into a domain (air) of dimension 2 m × 3 m × 5 m (Figure 4). Moreover, the physical conditions were based on the three-dimensional steady state, and the spatial grid used was the polyhedral mesher capable of multi-region conformal meshing. In addition, the prism layer, which is essential for the boundary layer analysis of the turbulent flow field, was applied to air (Table 2).
The PV module implemented through simulation consisted of cells, EVA (ethylene vinyl acetate), a back sheet, and fins, except glass. In other words, the effects of transmission bodies, such as glass and EVA, on the transmissivity of solar irradiance were ignored. The two sides of the domain were set as the velocity inlet and pressure outlet for the airflow. On the top surface, the heat flux was set as the boundary condition (Figure 4 and Table 3). The values of the heat flux and velocity were set to 600 and 0.5 m/s, which were in the effective range under the NOCT condition (Table 3). In addition, the interface of each layer was assumed to be in full contact, and the contact resistance was set to 0 . Table 4 shows the thermal properties of each component entered into the simulation of the PV module.
3.2. Simulation Cases
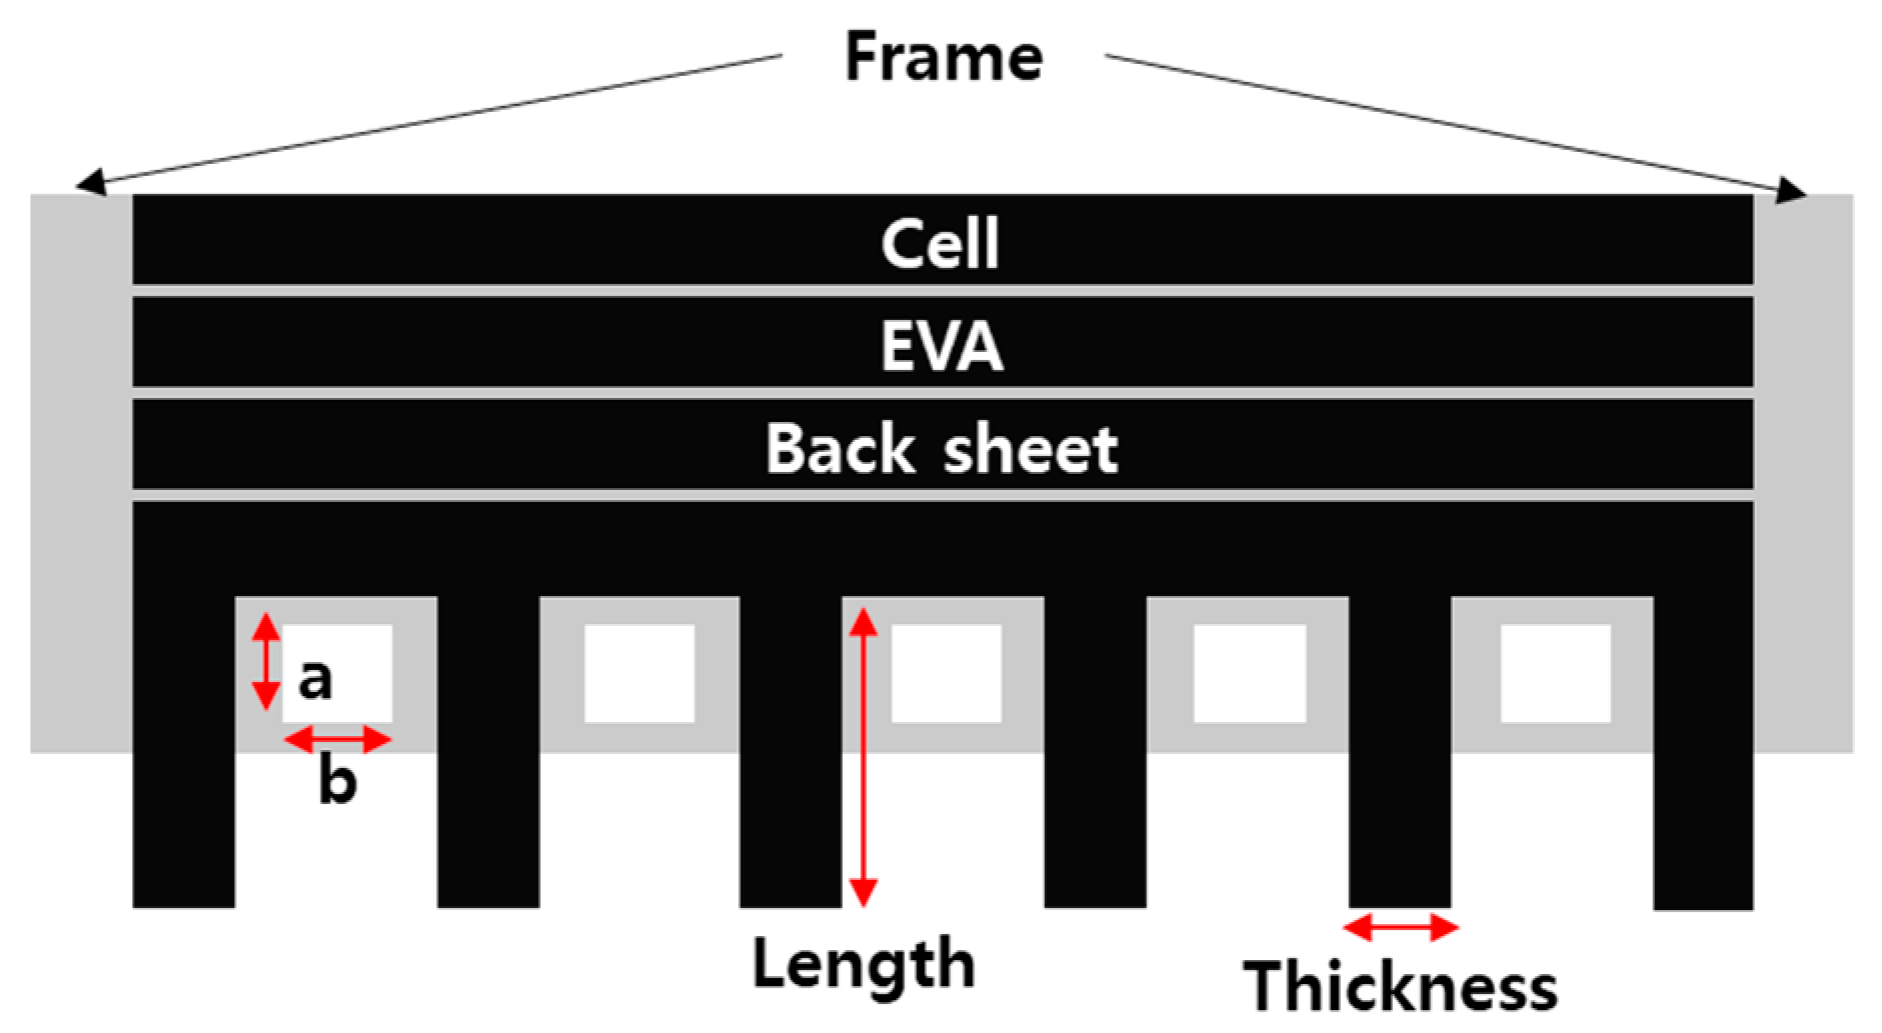
In this study, a parameter study was conducted according to the shape of the fins to analyze the cooling performance of the fins attached at the bottom of the PV module. In addition, a simulation model with slits, which can improve the cooling performance of the fins through the formation of active airflow distribution at the bottom of the fins and module, was also considered. Therefore, a parameter study was conducted according to the length, thickness, and a number of fins, and the shape of the slits (Table 5 and Figure 5).
4. Results
This study focused on the analysis of the cooling effect of fins in non-uniform temperature of the PV panel. In the simulation, the analysis model was made by means of the finite element method (FEM) and the temperature of all elements was calculated by the simulation tool. The efficiency of the temperature was estimated in all simulation cases by average the temperature.
4.1. Results Without Cooling
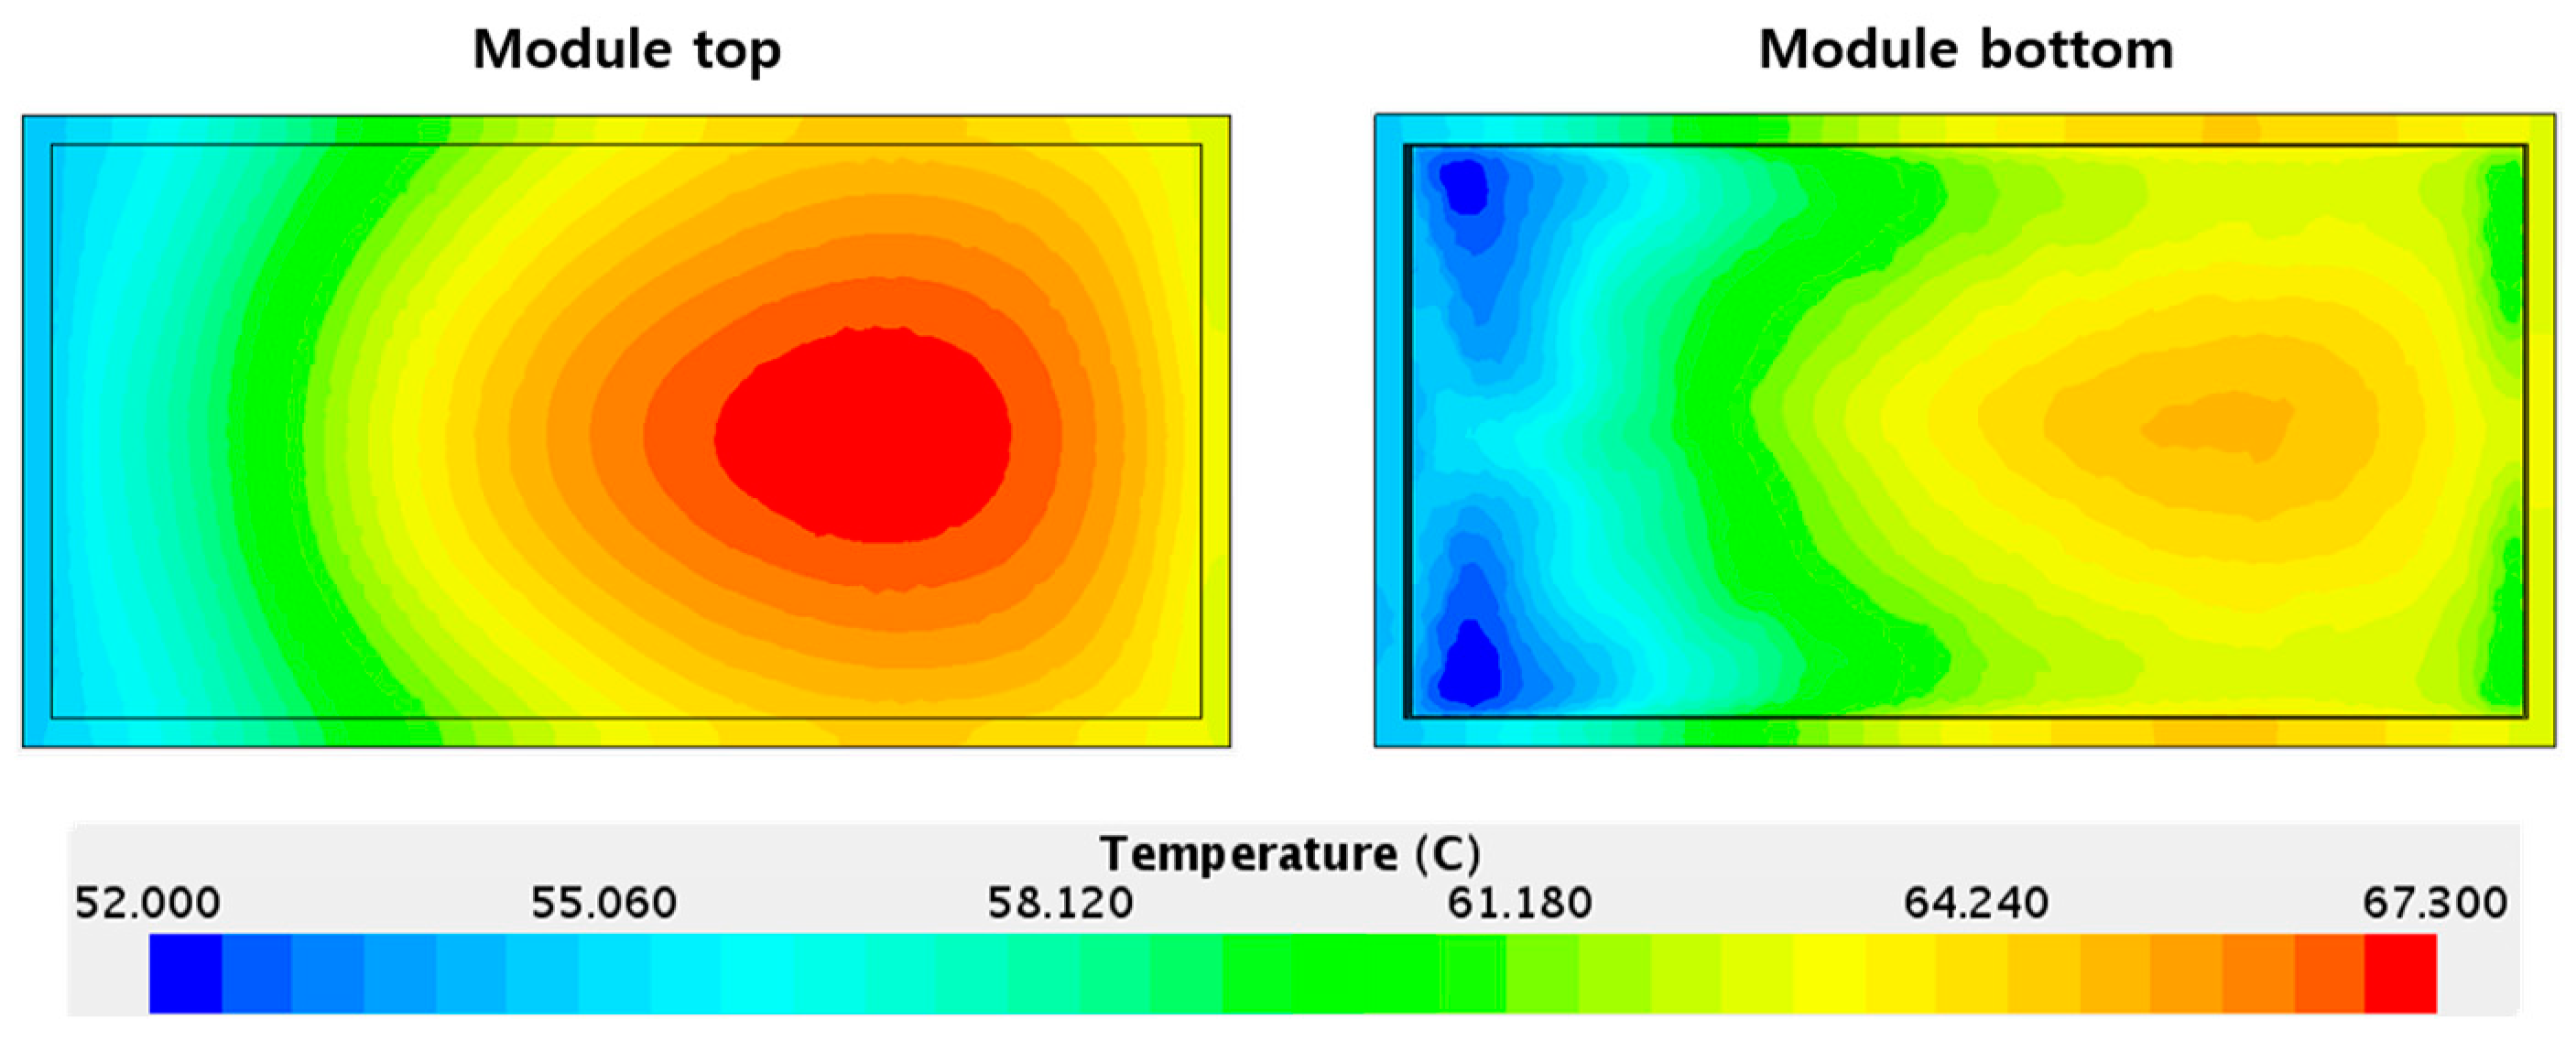
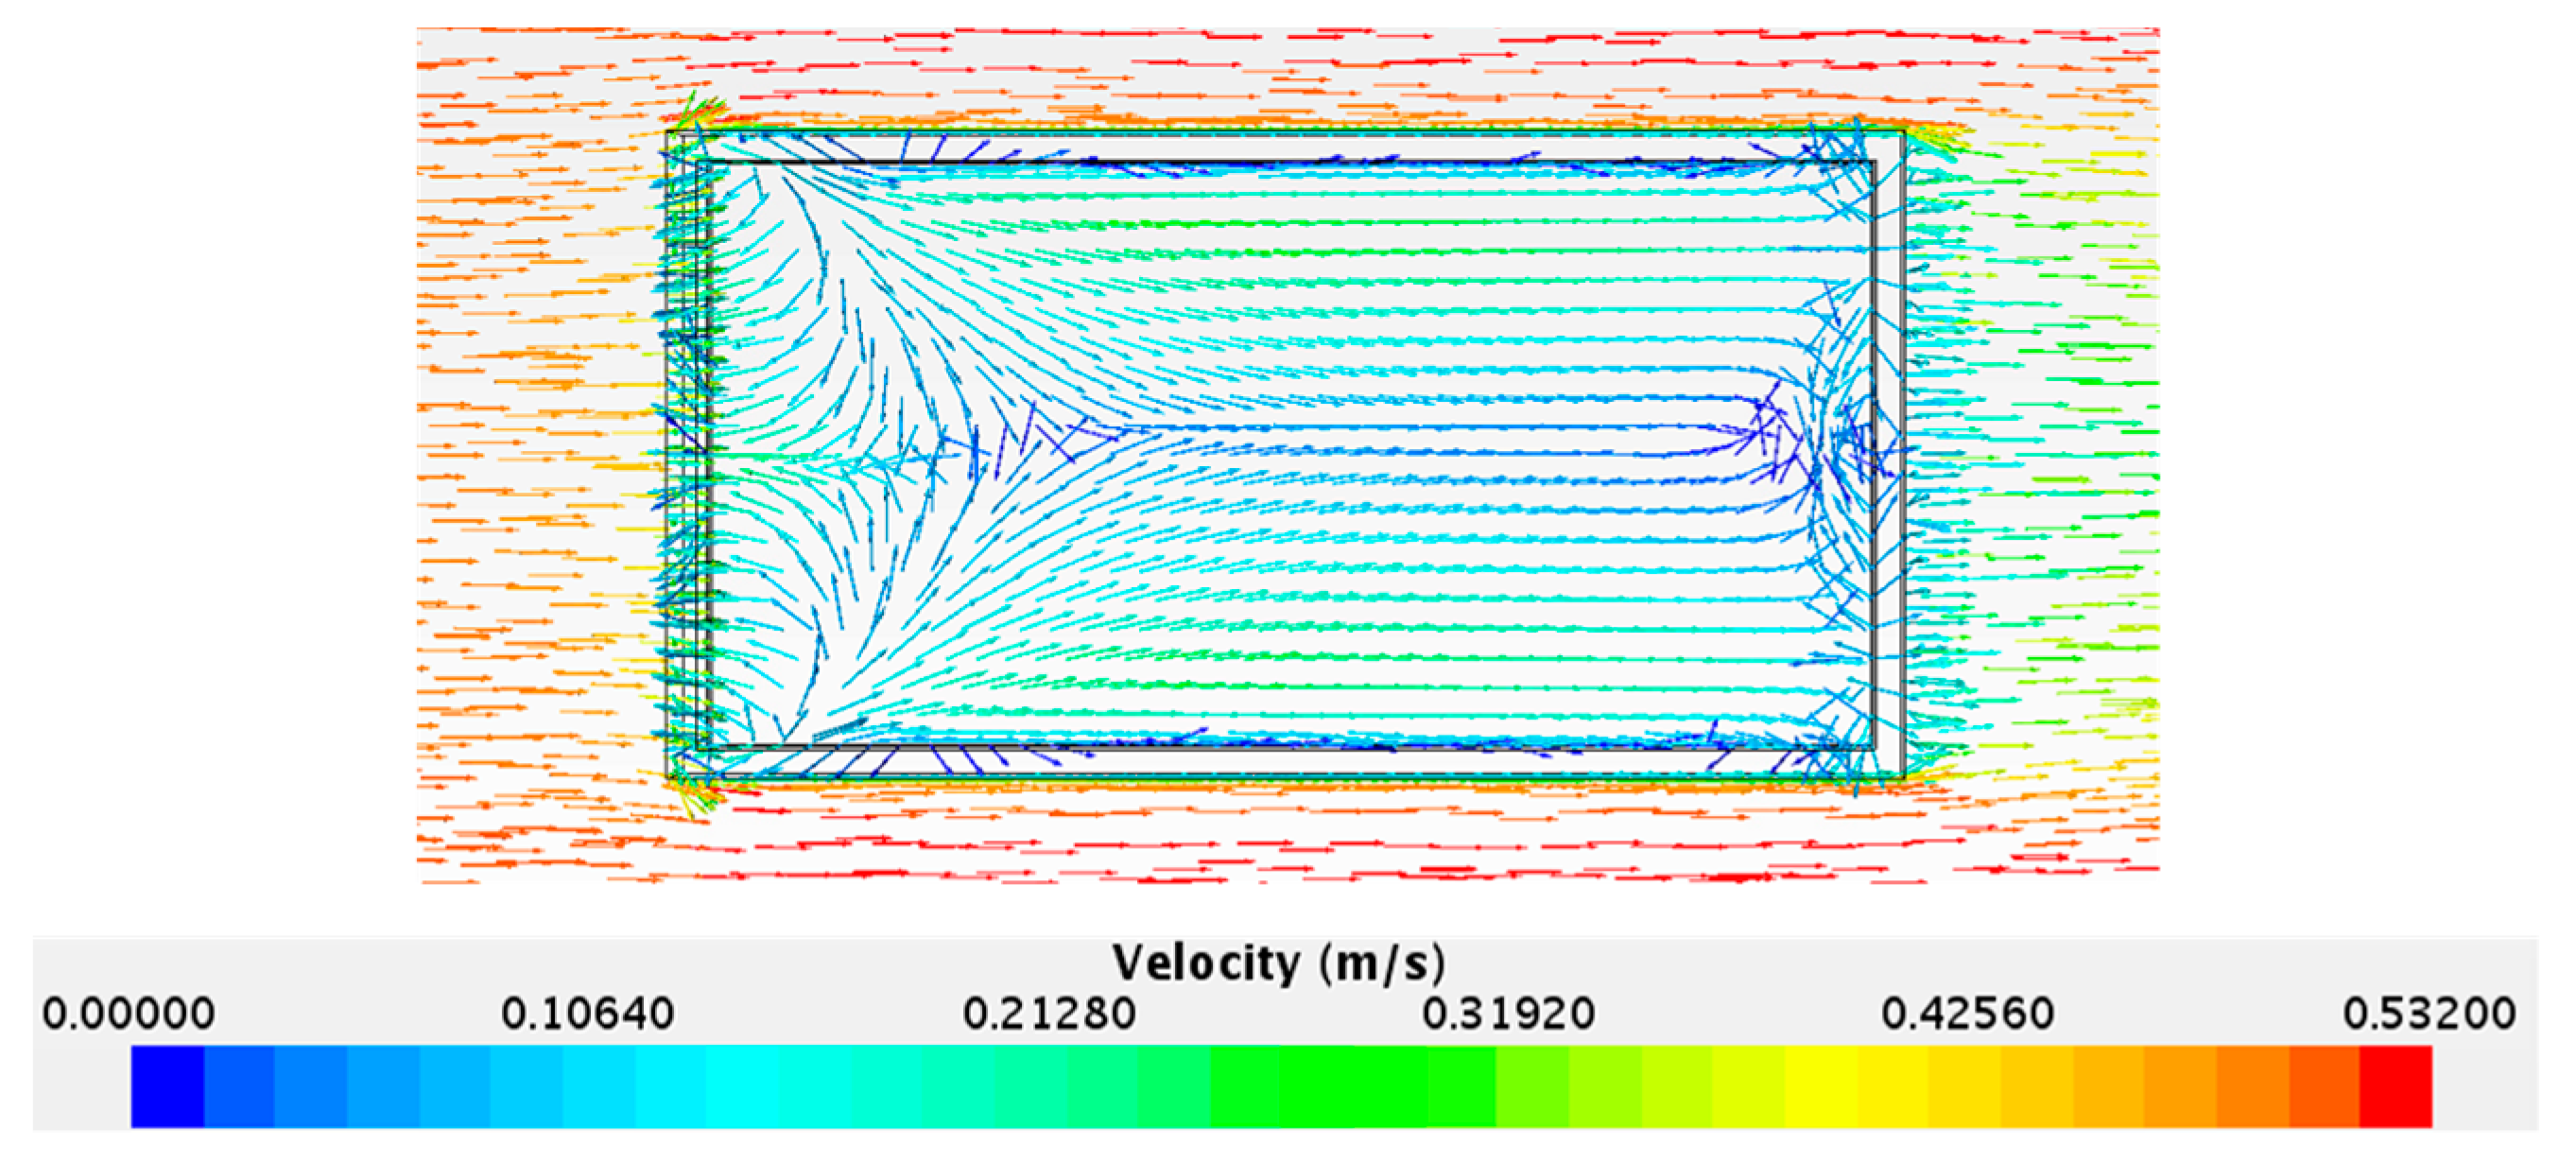
In the simulation results of the case without cooling, the average and maximum temperatures at the top of the module were 62.78 °C and 67.29 °C. The right side of the module showed higher temperatures owing to the influence of the airflow, and many relatively low temperatures were distributed in the left corner (Figure 6). Low temperatures were found in the corner because the convective heat transfer was structurally active, and turbulence was formed even though the velocity was the lowest (Figure 6 and Figure 7).
4.2. Results with Cooling
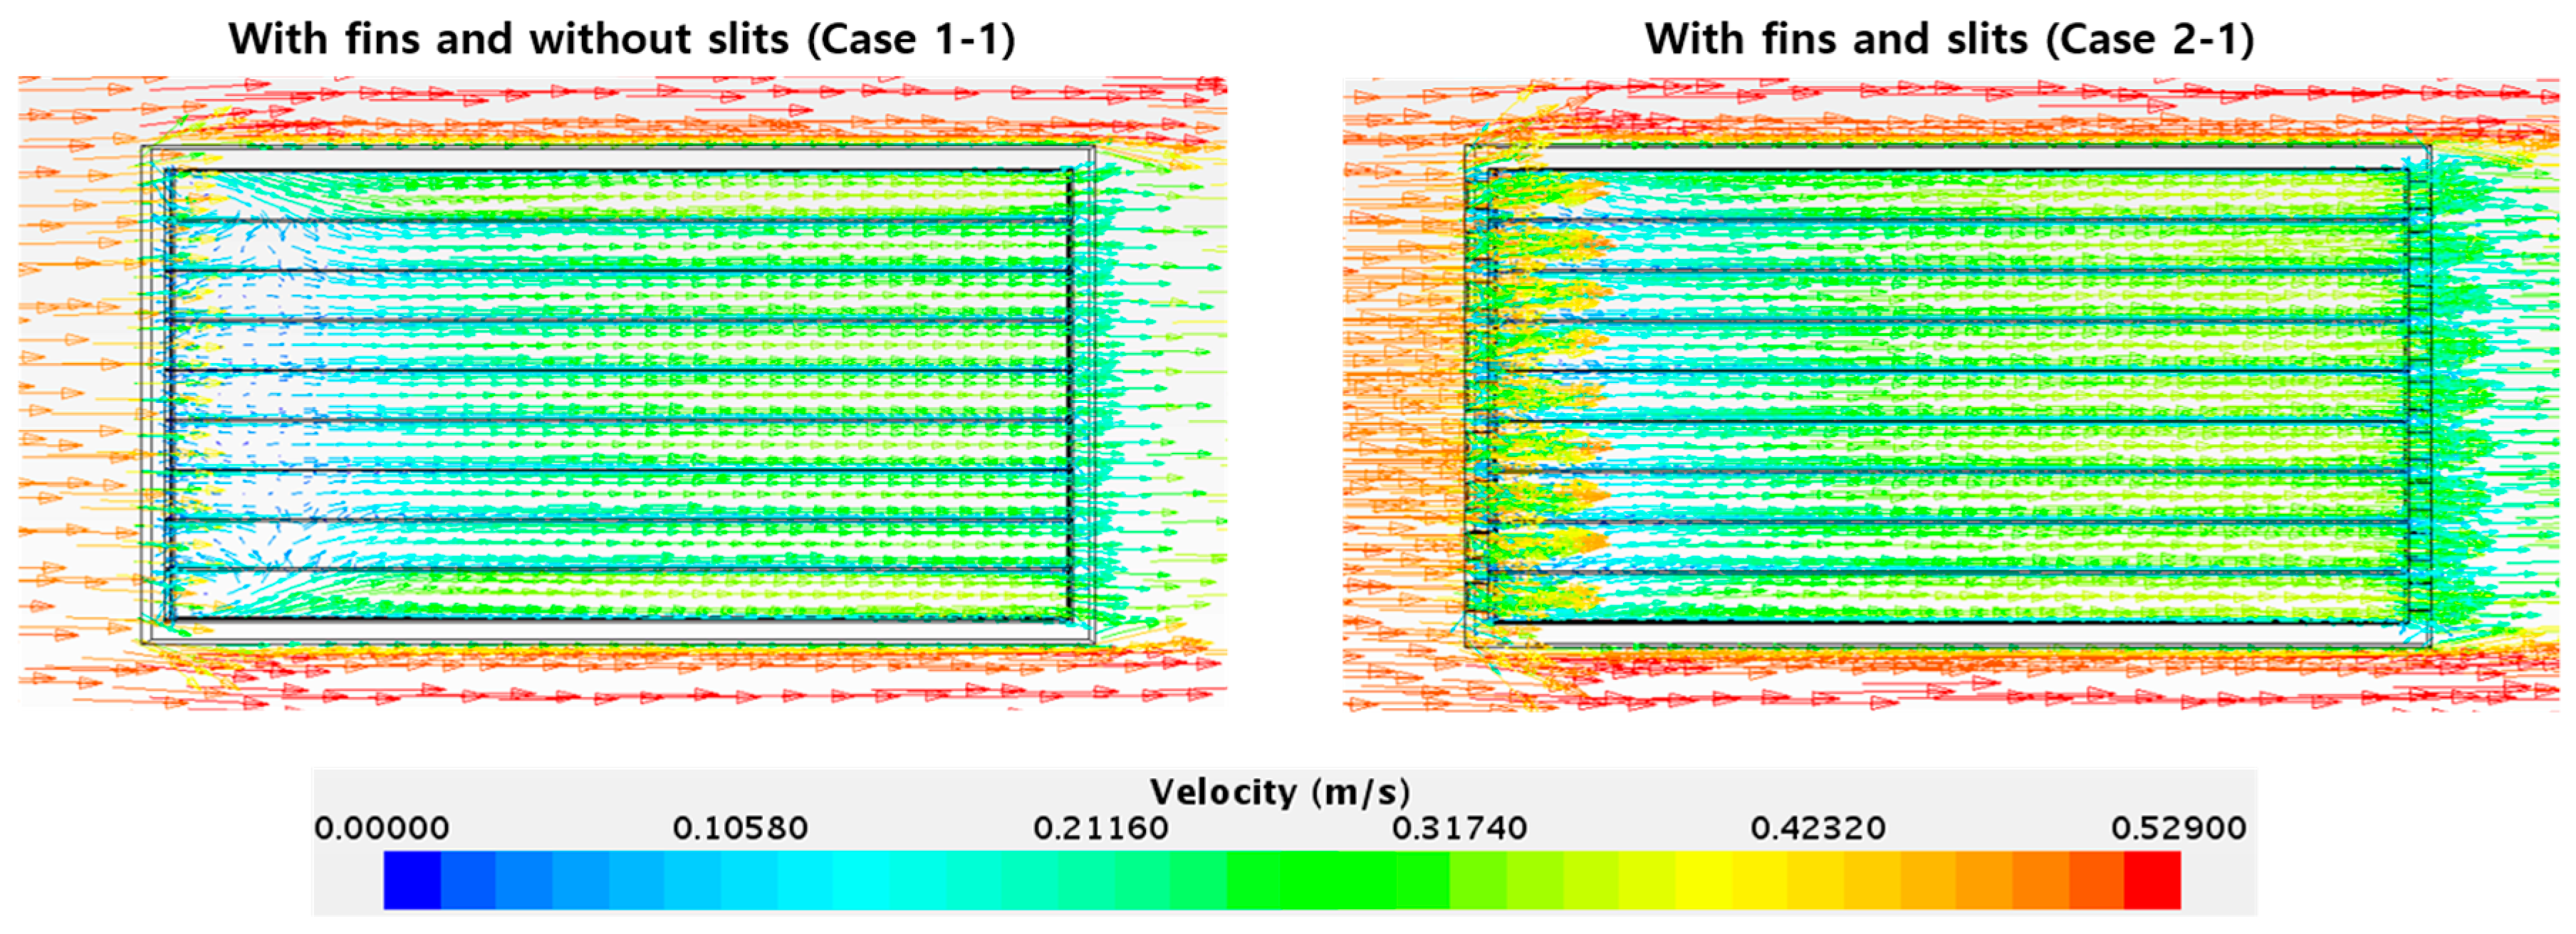
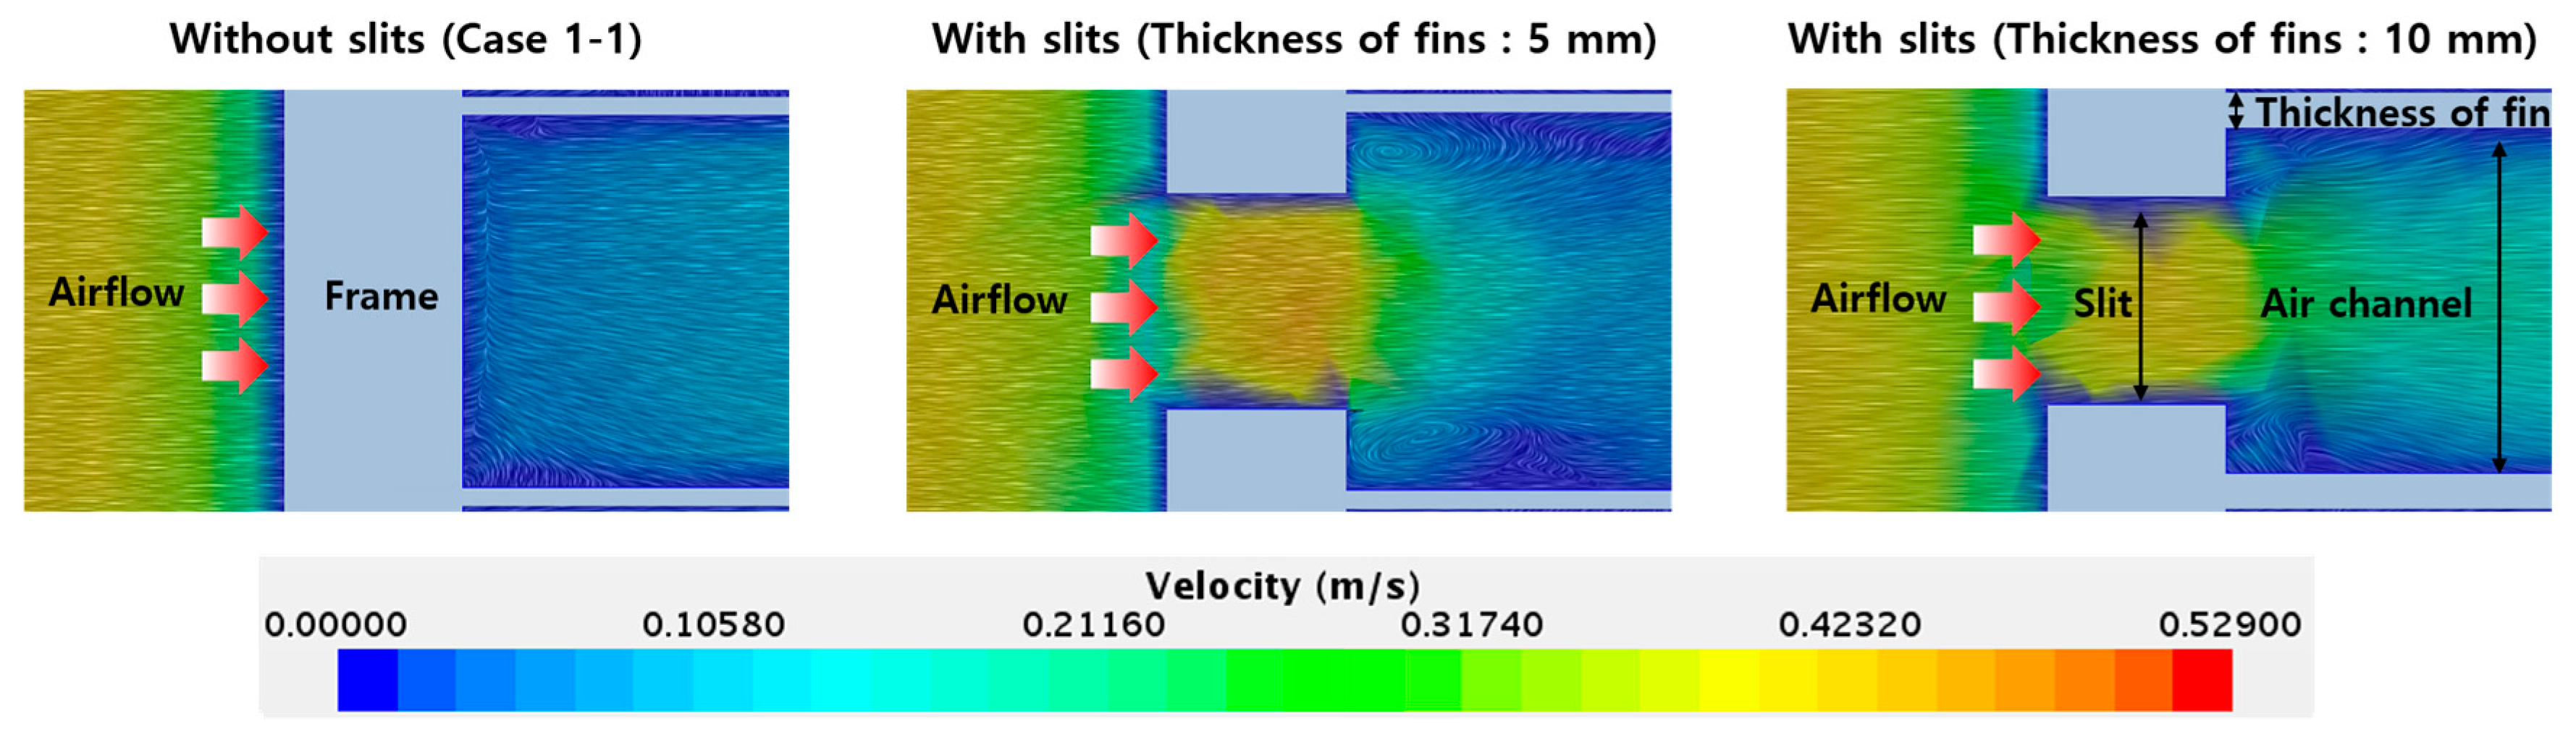
The CFD simulation results show that the installation of the fins affected the airflow and temperature distribution at the bottom of the PV module (Figure 8 and Figure 9). It was found that the installation of the fins reduced the average temperature of the PV module by more than 14 °C. In particular, the case without cooling exhibited a temperature difference of approximately over 15 °C at the top of the module, however, the temperature difference was reduced to less than 4.6 °C when the fins were installed. After the installation of the fins, the airflow distribution at the bottom of the module was more linear than the case without fins. Moreover, when the slits were formed, the airflow that passed through the slits exhibited a faster velocity distribution (Figure 8).
4.2.1. Analysis of the Results According to Configuration of the Fins
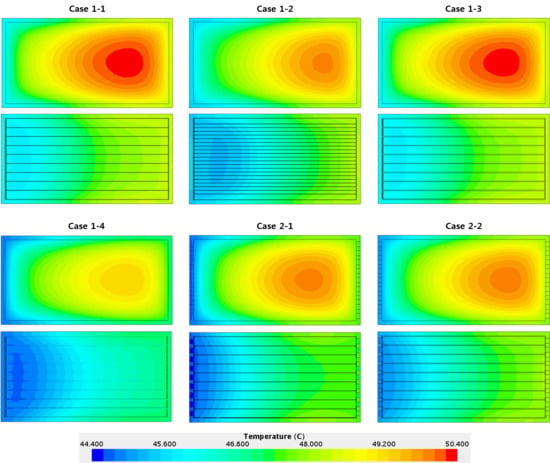
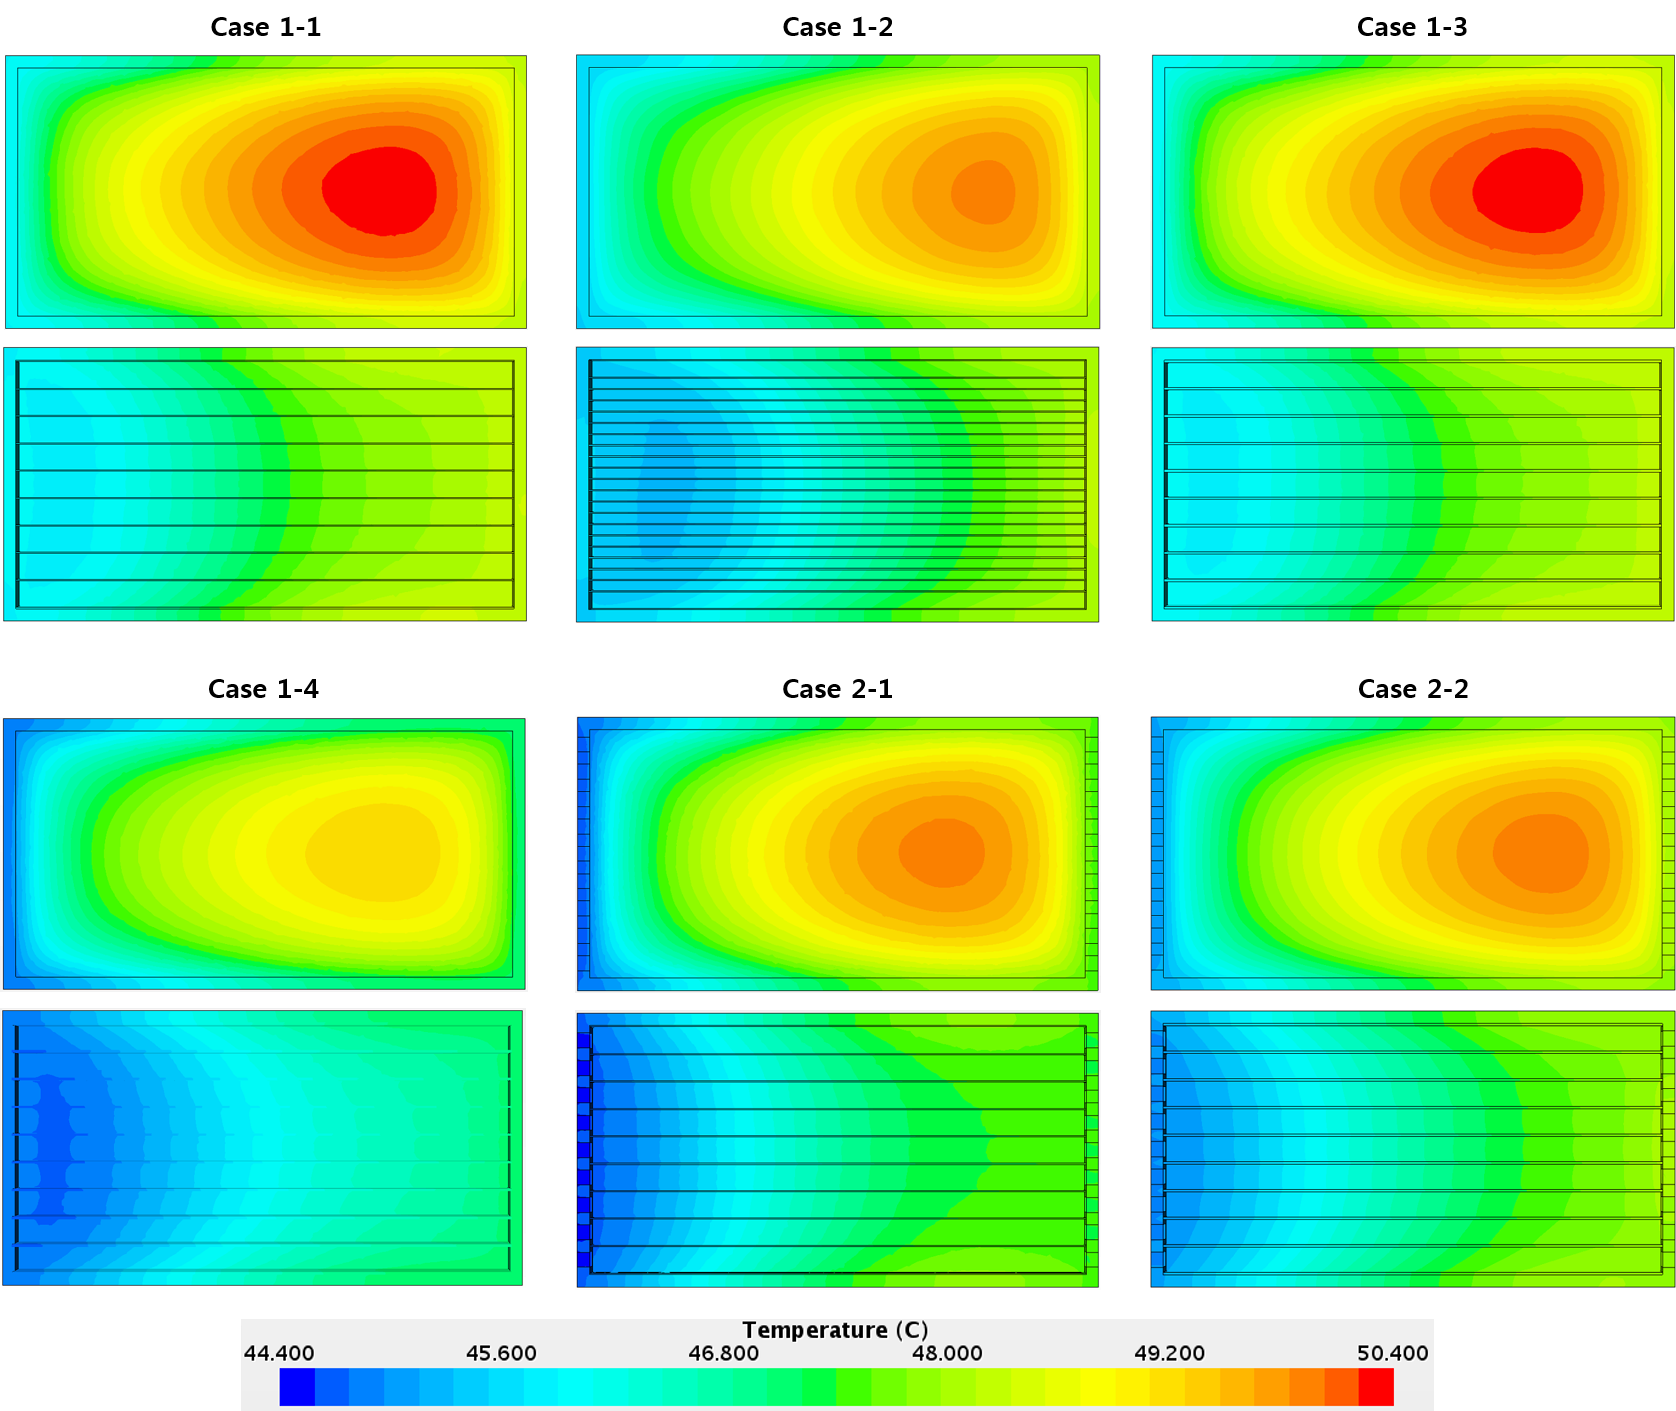
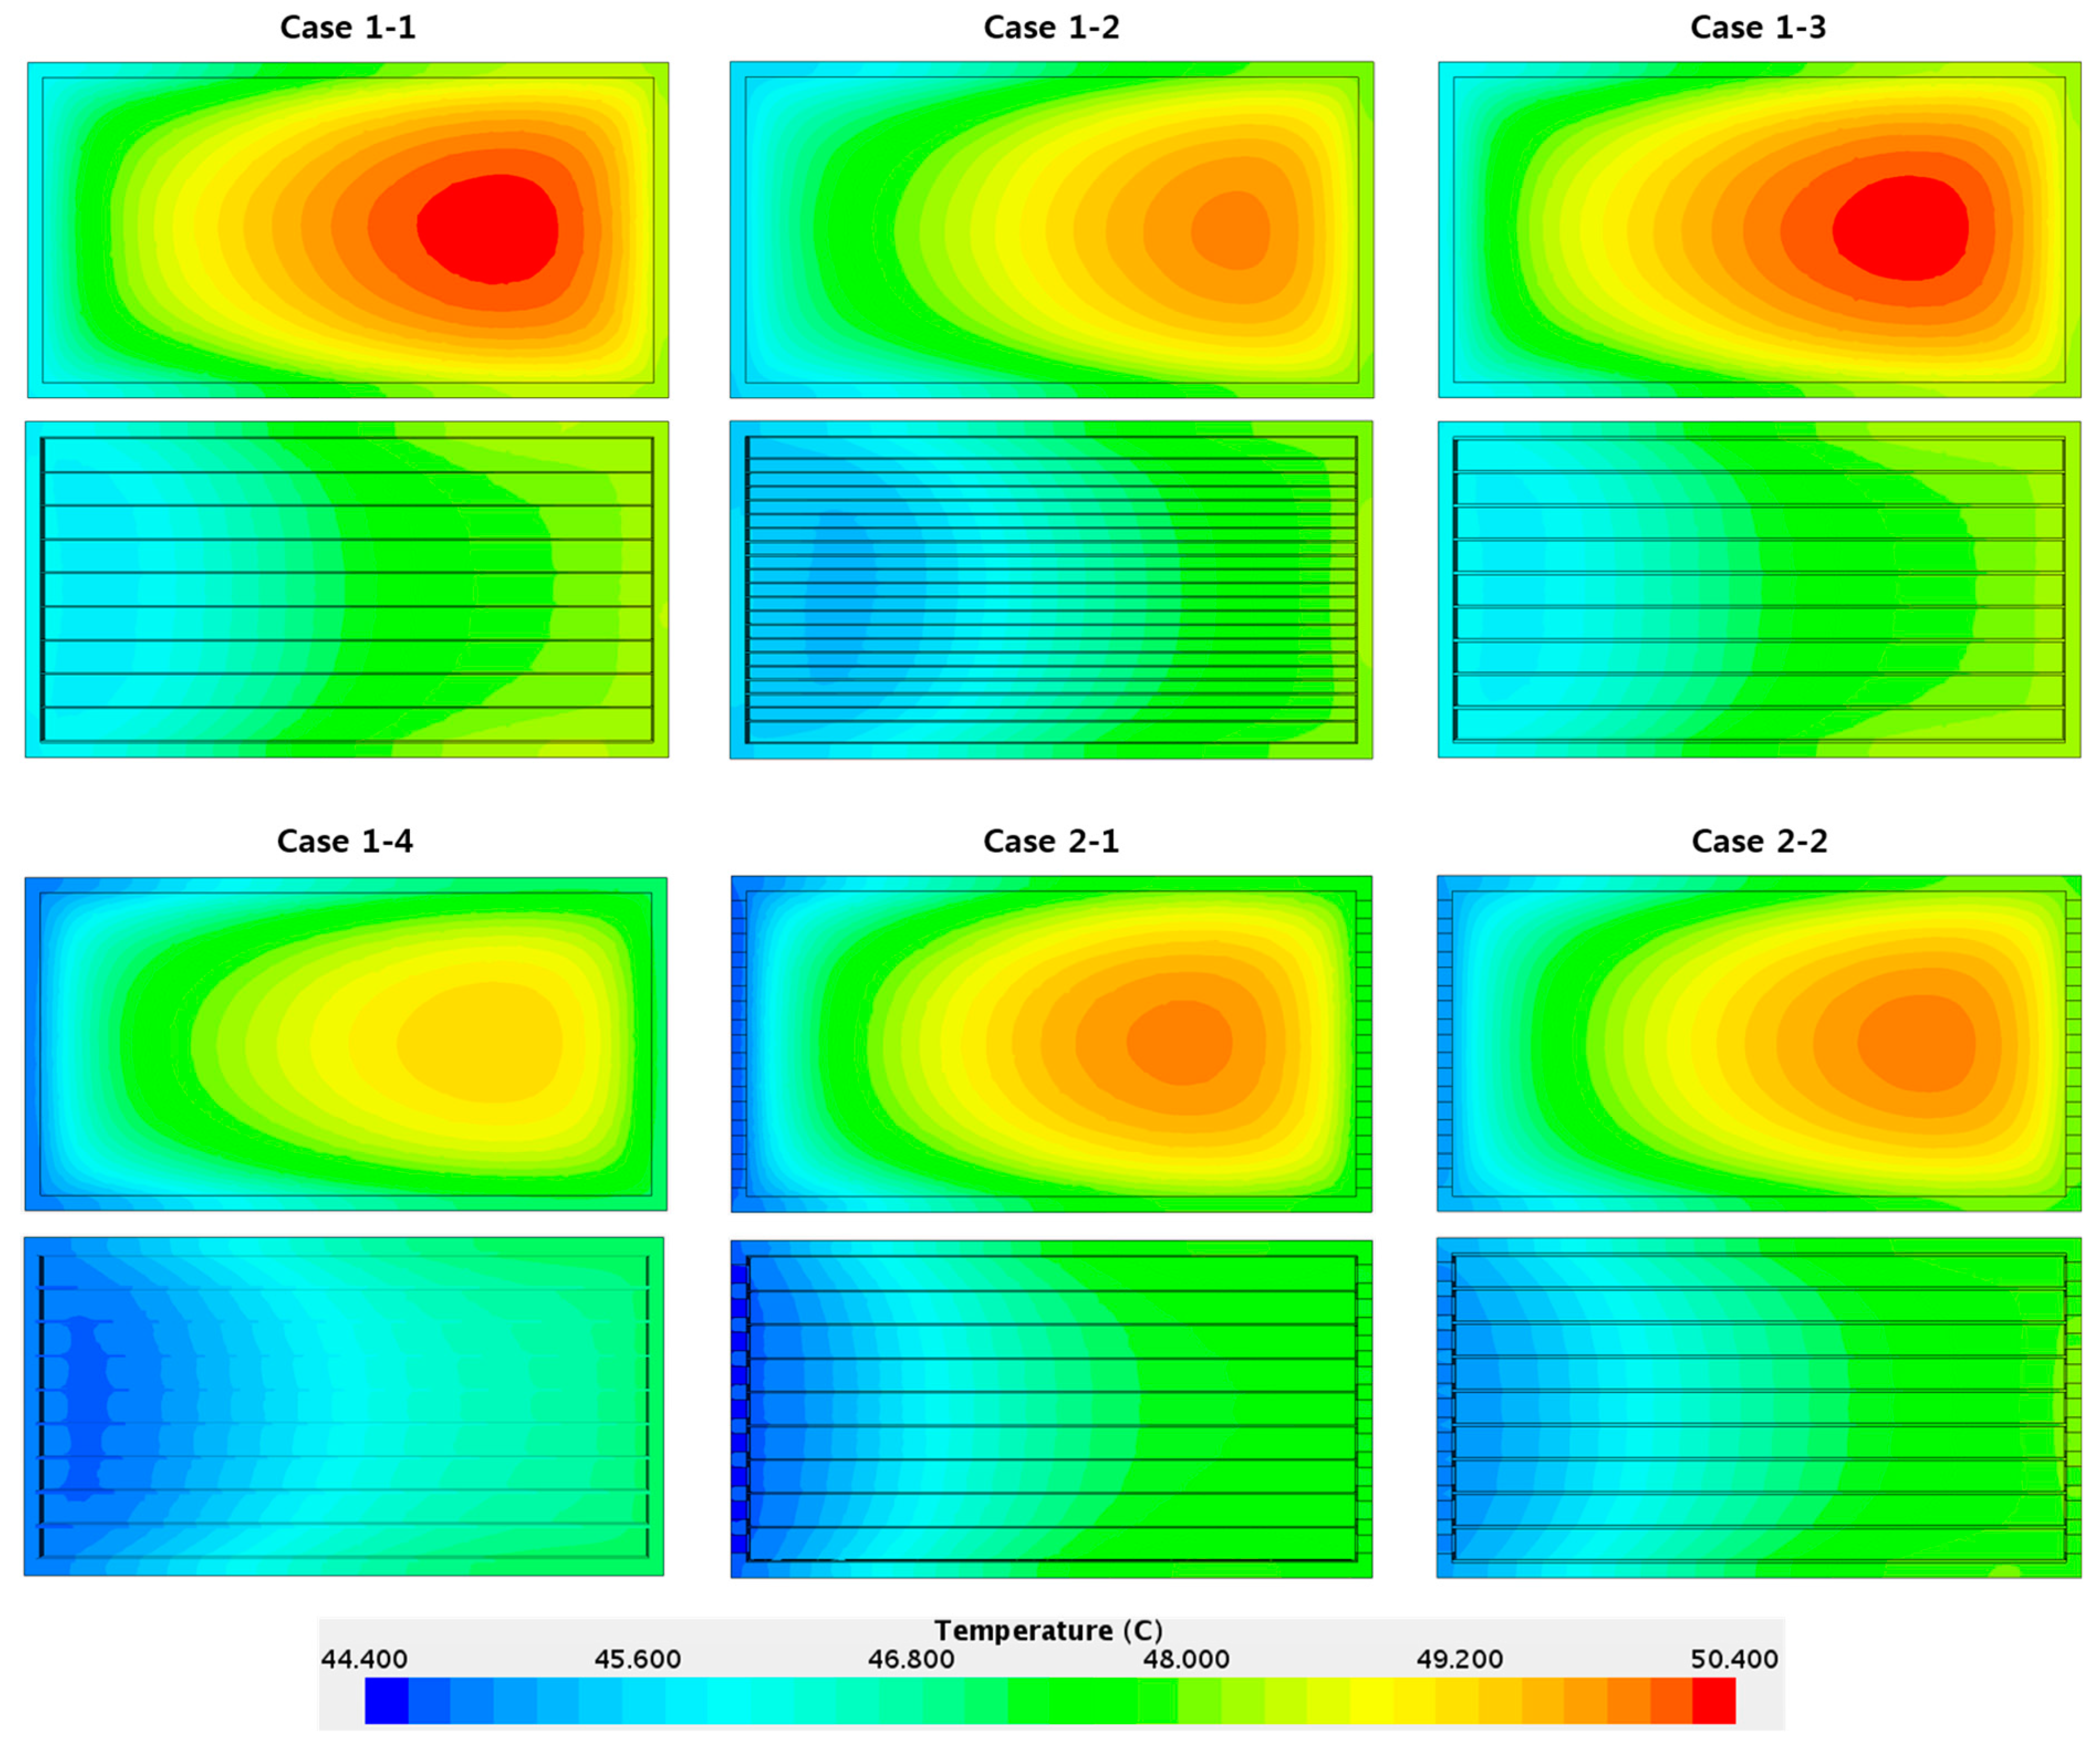
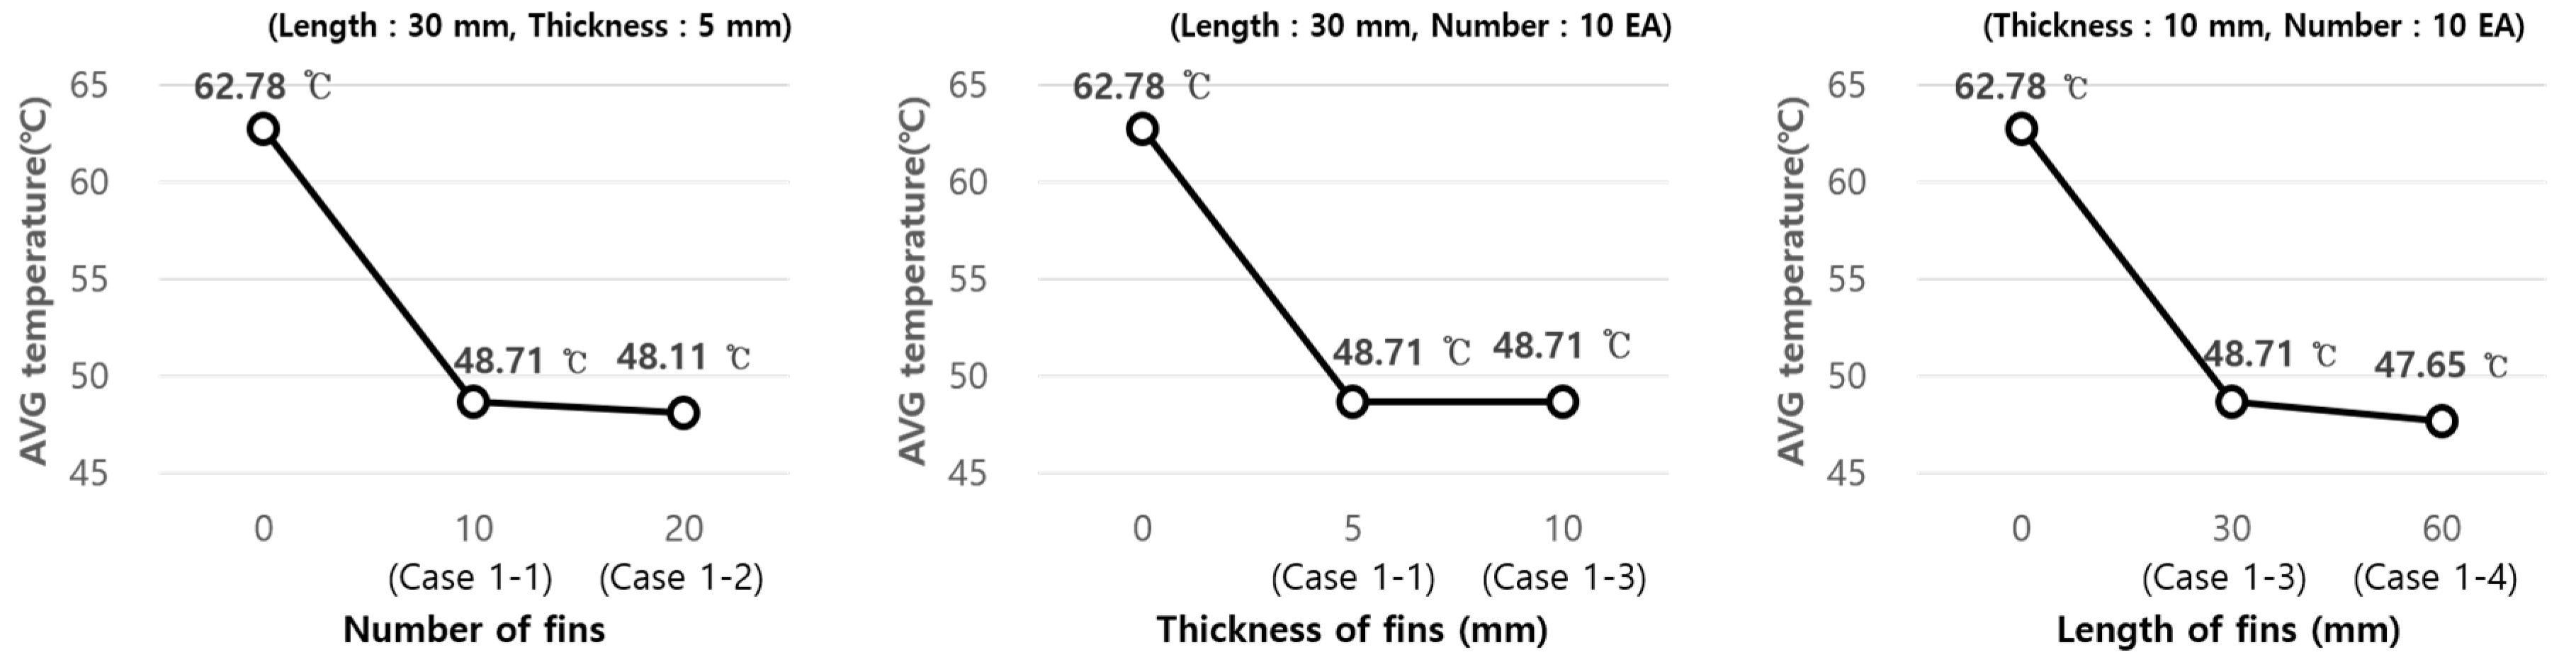
The cooling effect of the fins was slightly different depending on the shape (number, thickness, and length) (Figure 10). The simulation results show that the increase in the surface area of the fins improves the convective heat transfer of the fins. In particular, the cooling effect achieved by varying the length of the fins was magnificent, and it was possible to achieve a lower temperature of 15.13 °C than the case without cooling (Cases 1–4). This indicates that the area exposed to air has a larger effect on the cooling performance than the area in contact with the bottom of the module under the same mass.
4.2.2. Analysis of the Results According to the Presence of the Slits
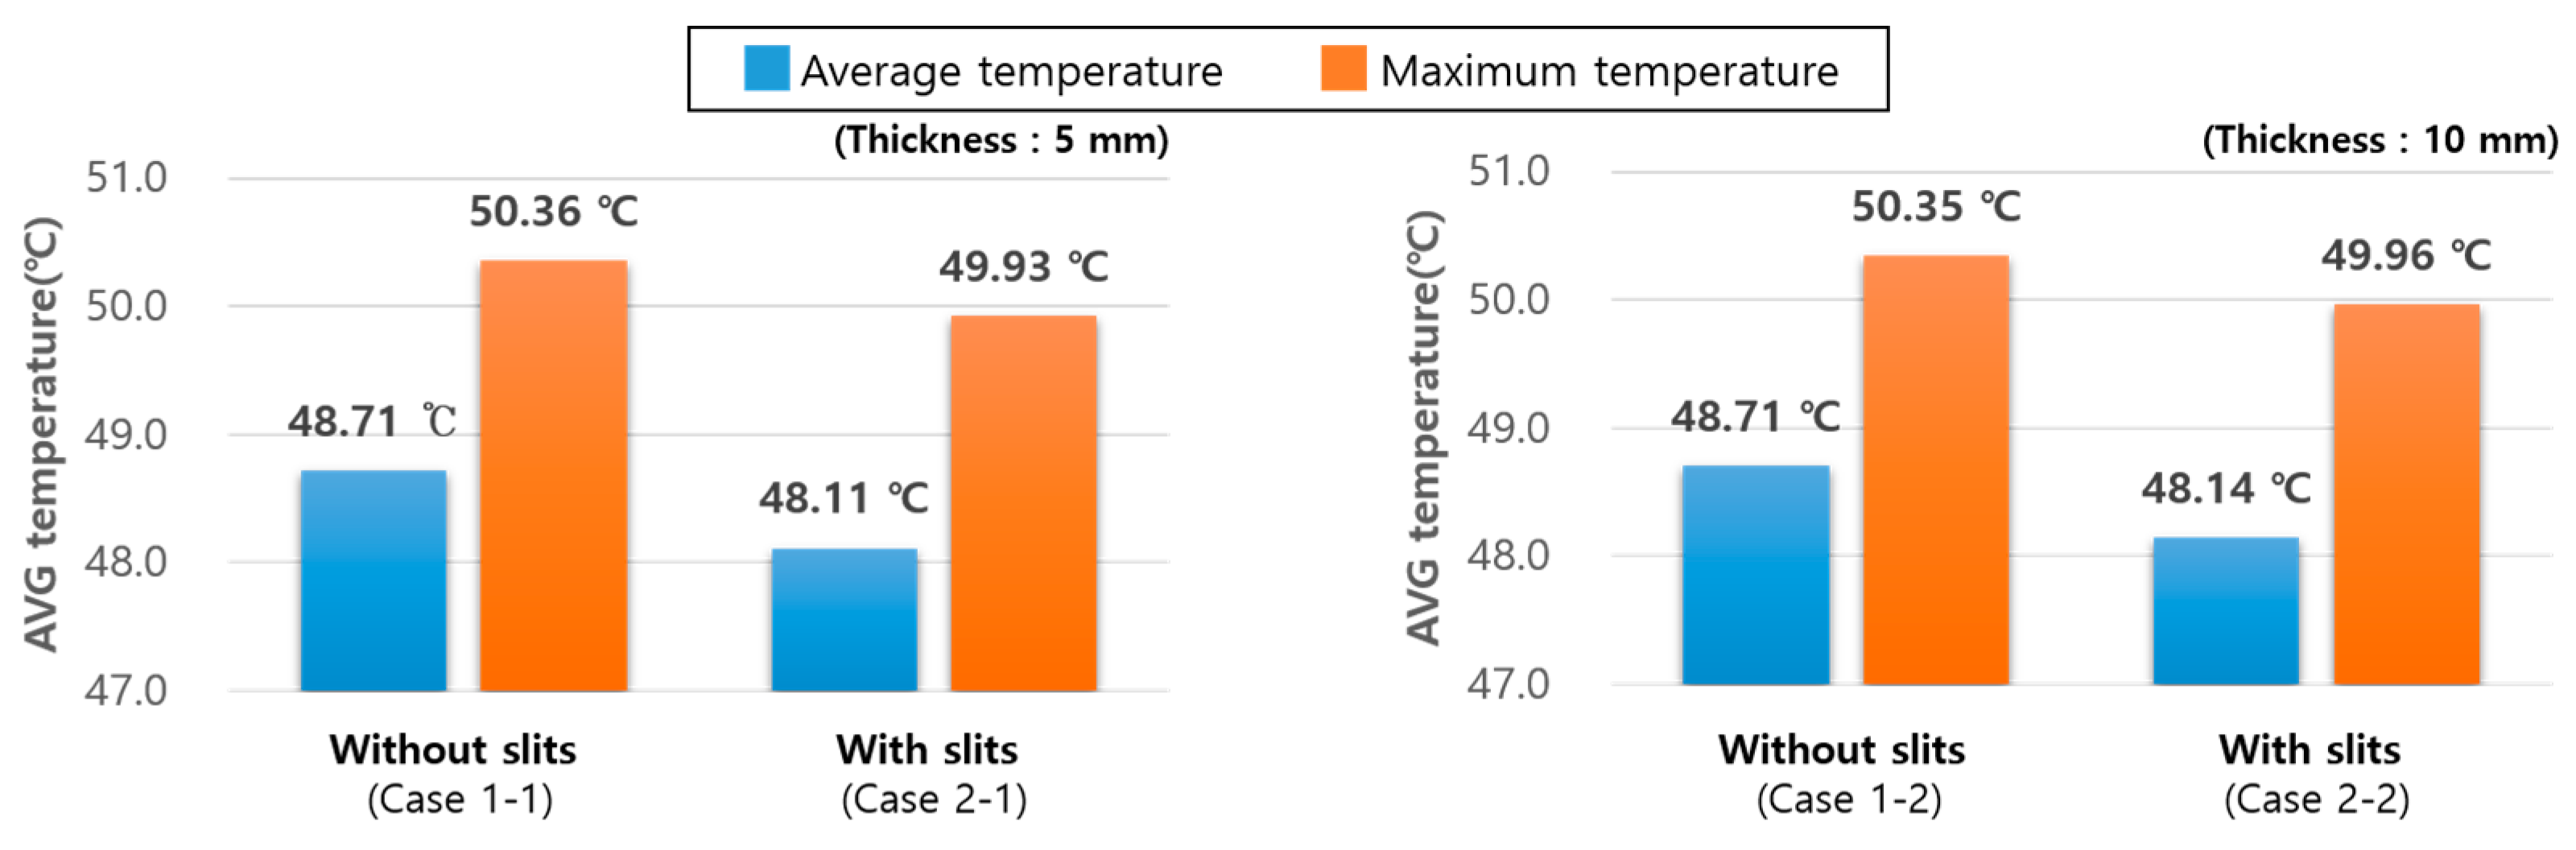
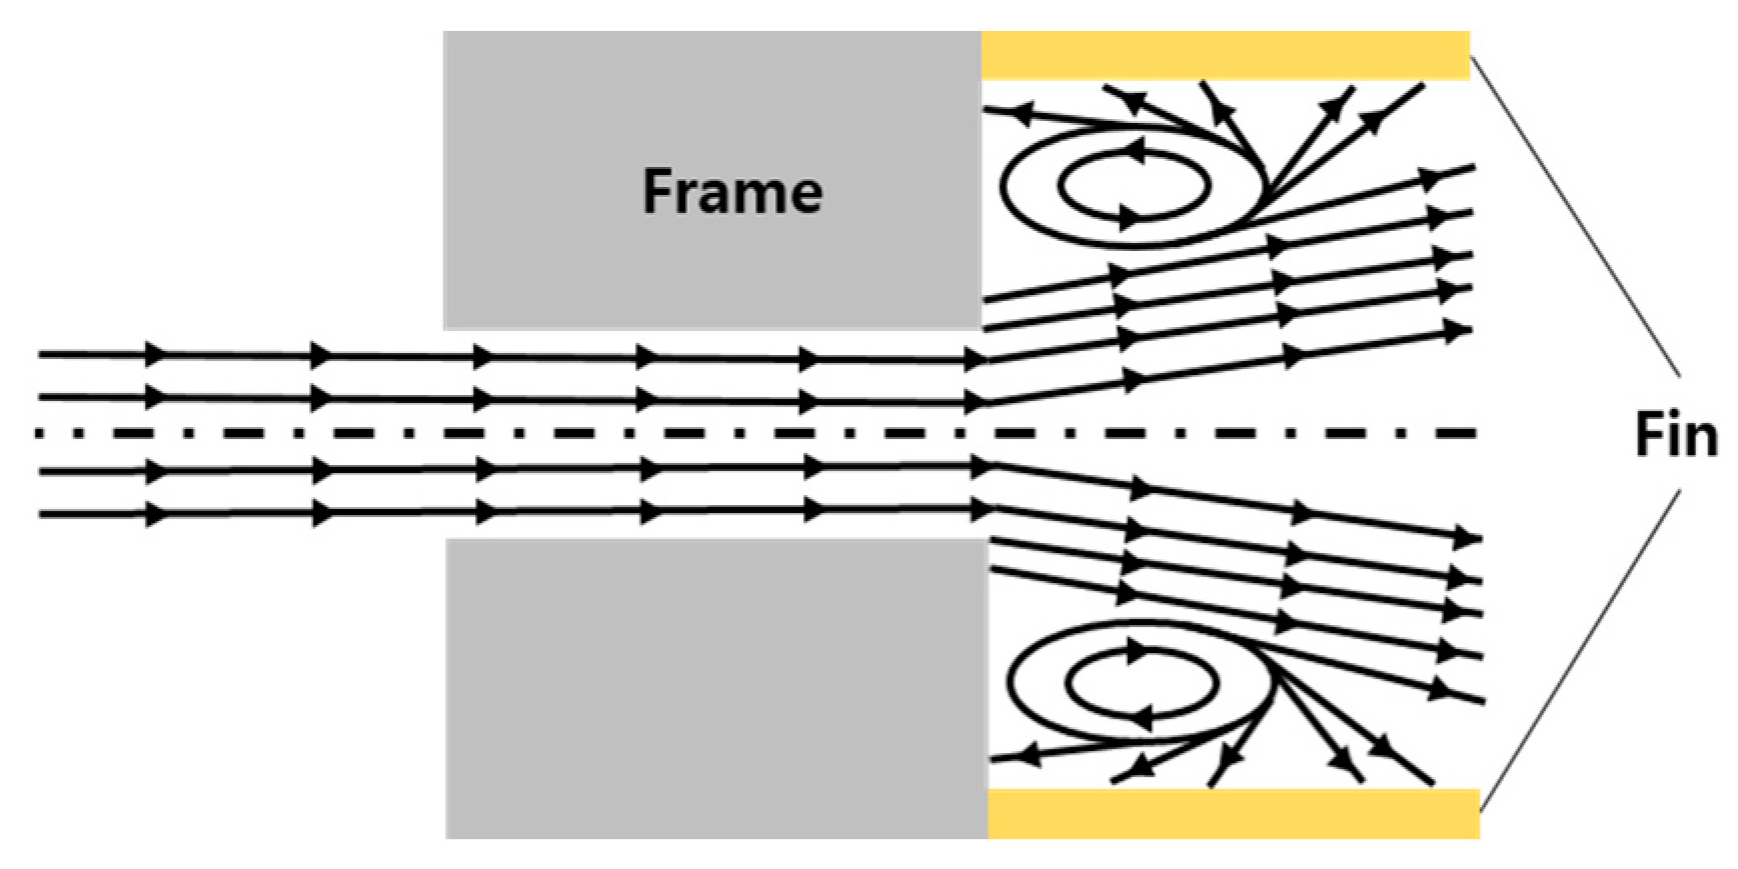
When slits were formed between the fins, the possibility of the improvement in the cooling performance was analyzed through simulation (Figure 11). When the thicknesses of the fins were 5 mm and 10 mm, the temperature on an average reduced by 0.6 °C and 0.56 °C, respectively. This occurred because the area of the slits was smaller than the air channel between the fins at the bottom of the module, thereby making an effect like that of a diffuser, accelerating the formation of turbulence around the fins, and increasing the velocity of the airflow that passed through the slits (Figure 12 and Figure 13). In the simulation results, the cooling effect of the module was more effective when the thickness was 5 mm than it was 10 mm, and the temperature further decreased at the inlet where the air was introduced. This indicates that the increase in the difference in area between the air channel and slits has a large influence than the increase in the surface area of the fins.
4.2.3. Analysis of the Temperature Change According to Air Velocity
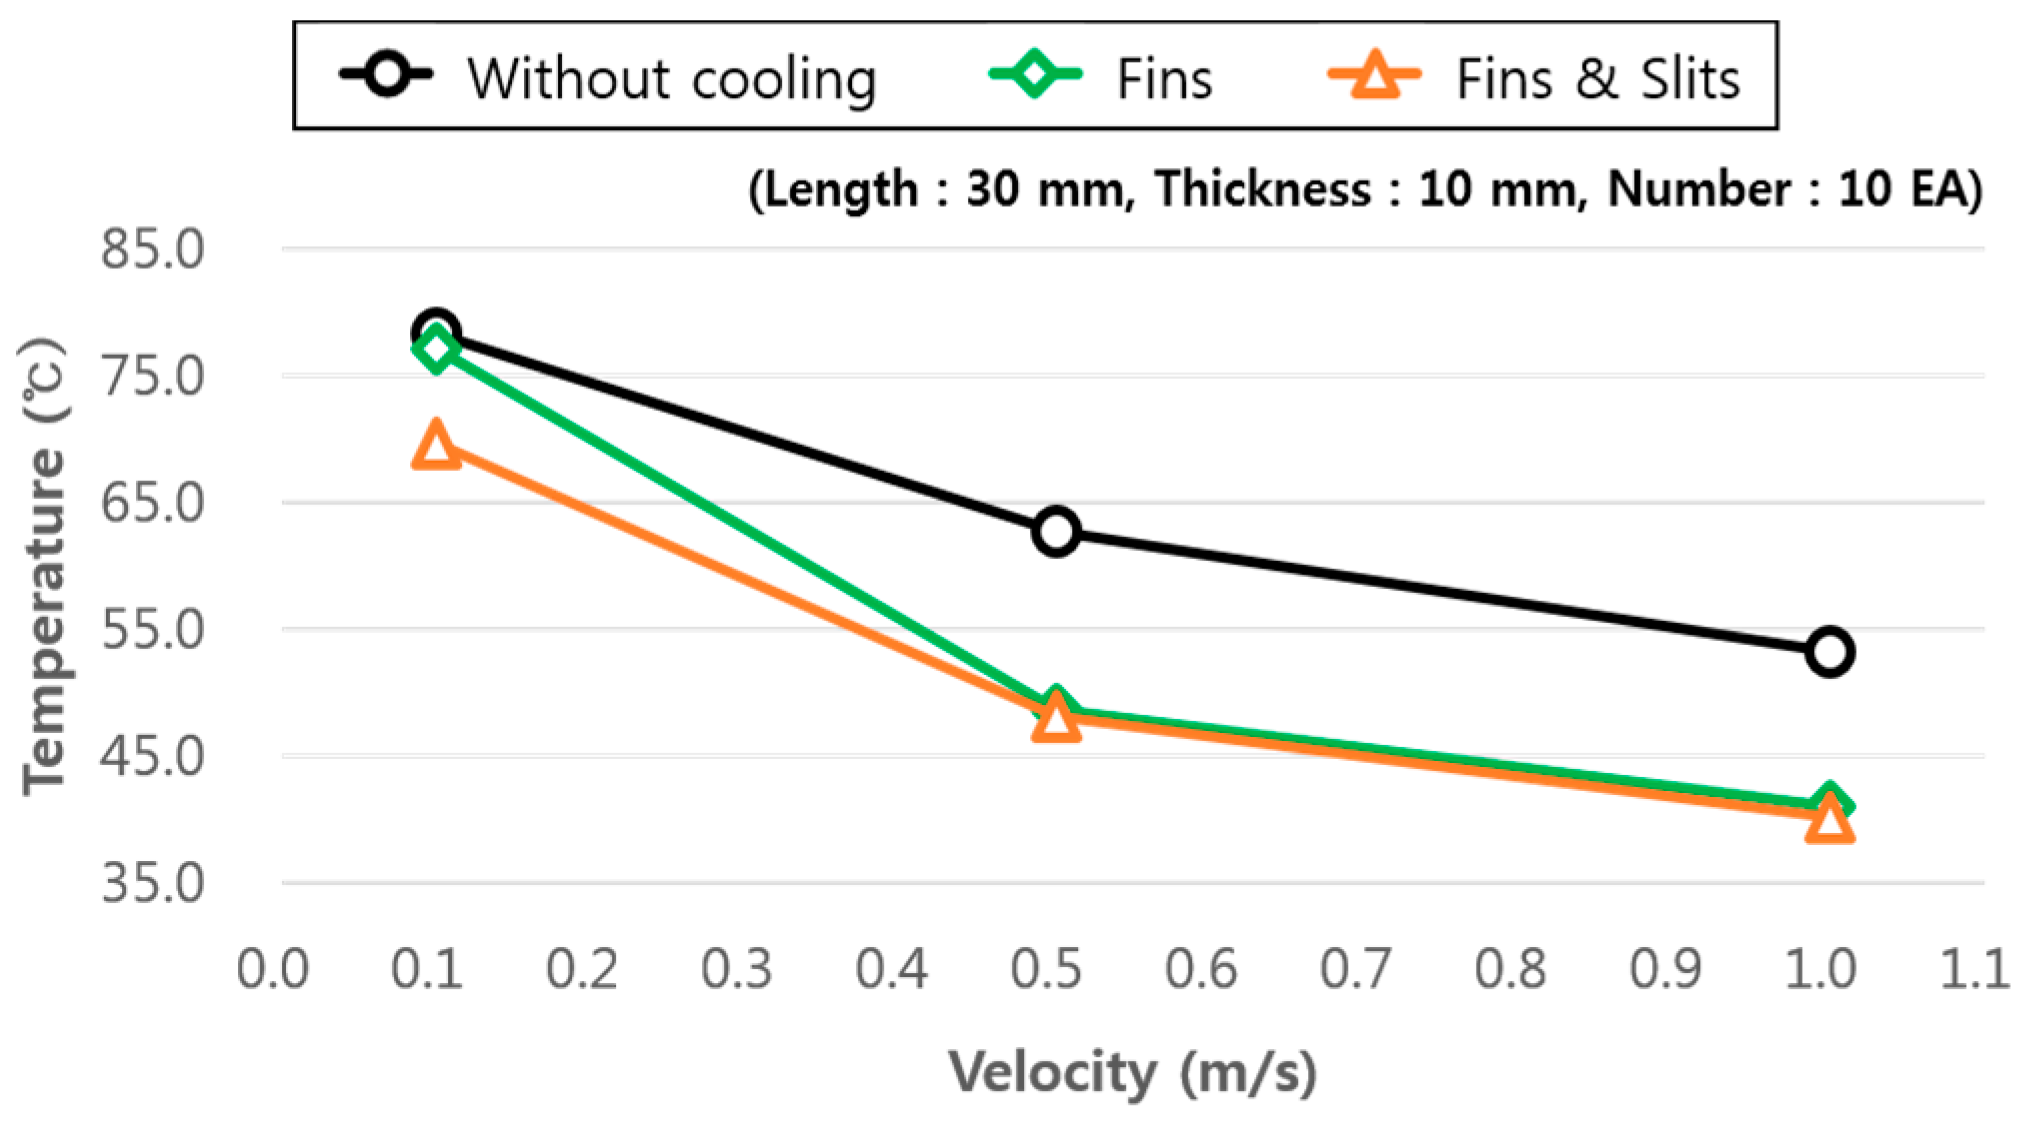
In order to quantitatively estimate cooling effect according to air velocity, the additional simulation was conducted in the condition of 0.1, 0.5, 1.0 m/s of velocity. In the cases with cooling (Cases 1–3 and Cases 2–2, all of the conditions except the presence of slits and wind velocity were the same. Figure 14 shows that the temperature of the PV module decreases as the velocity increases. Especially, in the condition of 0.1 m/s, only the temperature reduction was 1.21 °C with fins but was 8.62 ℃ with fins and slits. In addition, the additional reduction by the slits was less than 1 °C when the velocity was 0.5 and 1.0 m/s. In other words, it was clear that airflow and turbulence greatly influenced the cooling performance under the condition of low velocity by the slits.
4.3. Prediction of Electrical Efficiency
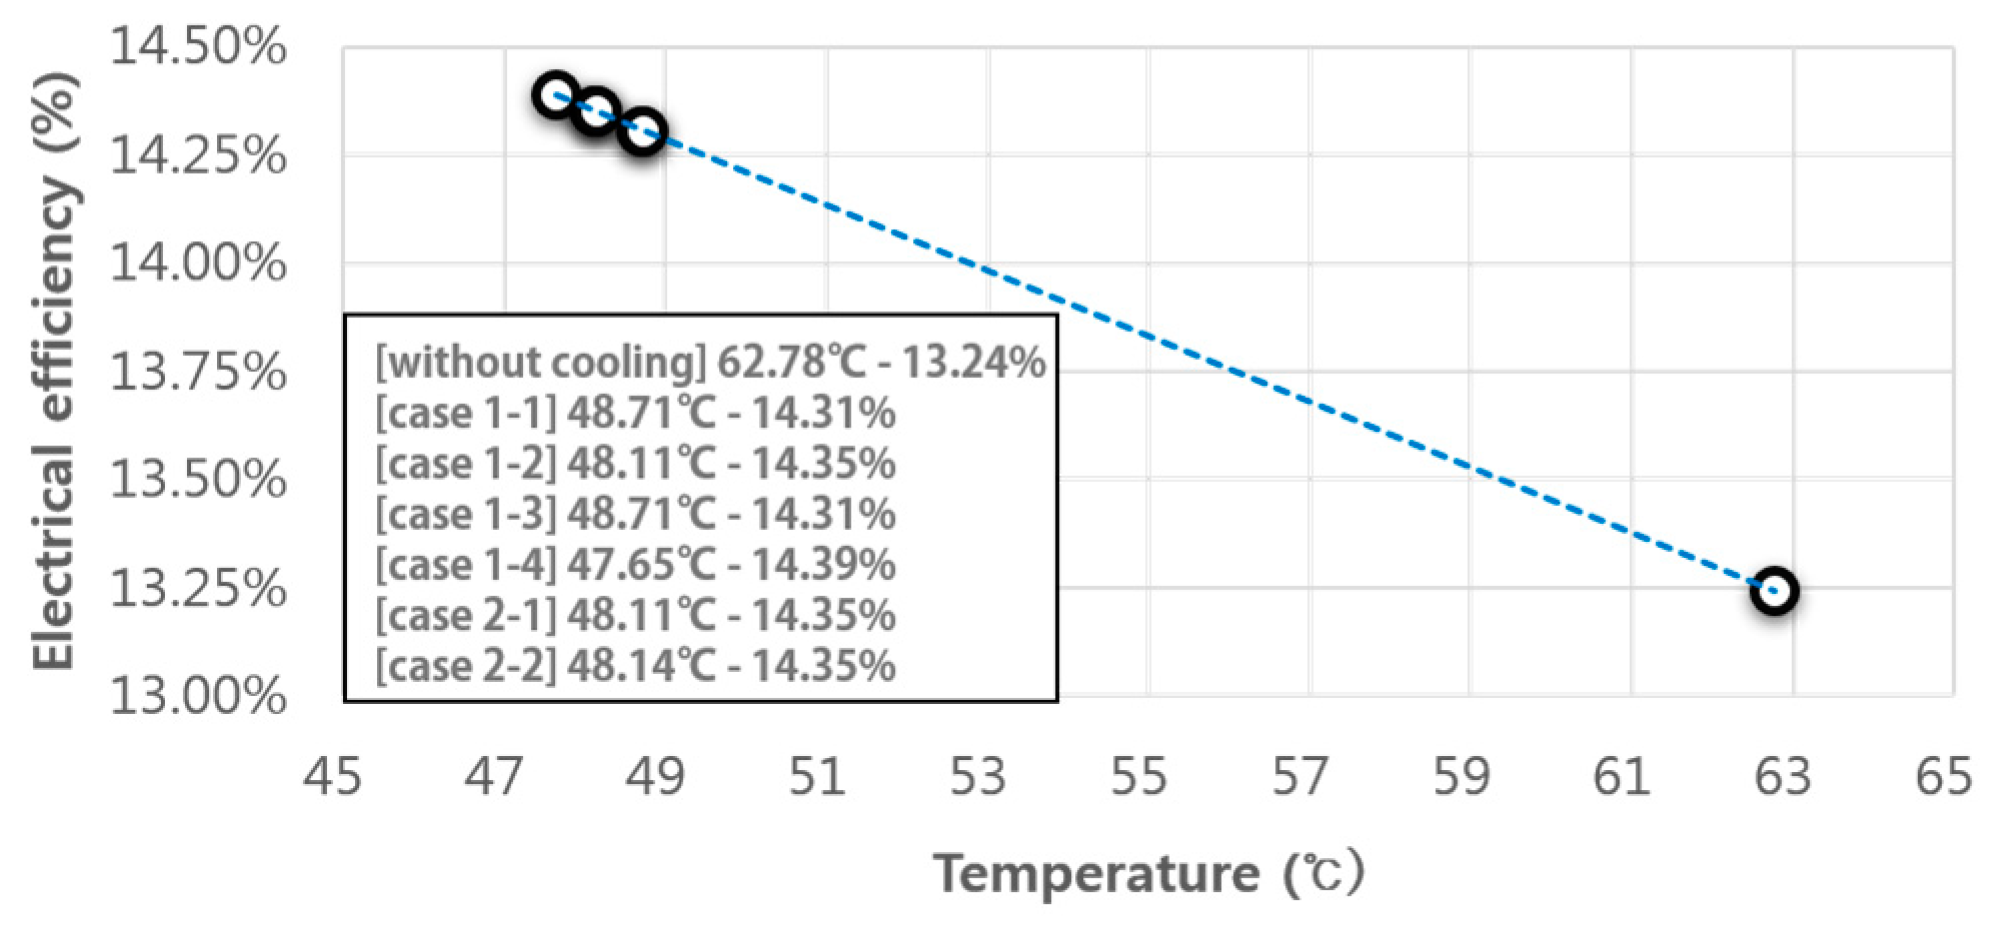
Several researchers suggested methods to predict electrical efficiency. Spertino et al. [21] developed a theoretical integration model for the thermal and electrical aspects to estimate PV cell temperature. However, the CFD simulation focused on the thermal aspect to analyze the cooling effect of fins in this study. Therefore, to grasp more simply the contribution of the temperature decrease due to the cooling effect of the fins to the improvement of the electrical efficiency, the research methodology expressed in Equation (1) was used. The electrical efficiency was predicted by substituting the PV module temperature, which was obtained through the CFD simulation and specifications (Table 6) into Equation (1). The electrical efficiency was increased by more than 7.44% due to the cooling effect of the fins, and the maximum increase was 7.96%. In other words, when the temperature of the PV module was reduced by 1 °C, the electrical efficiency increased by 0.47%, and when the temperature was reduced by 15.13 °C, the efficiency increased by approximately 7.96% (Figure 15).
5. Conclusions
In general, electrical efficiency decreases as the temperature of a PV module increases. The application of cooling technologies has been examined for the purpose of increasing the electrical efficiency by reducing the overheating of a PV module. However, the active cooling system requires additional power for cooling, and additional facilities incur maintenance cost. On the other hand, the passive cooling system can secure a certain level of cooling performance without additional power and maintenance cost once it is installed. In this study, the cooling effect of a passive cooling technology that can reduce the temperature of the PV module using fins and slits was analyzed, and its contribution in achieving a high electrical efficiency was predicted. The CFD simulation was performed for the analysis. The results of this study are summarized as follows.
(1) It was confirmed that the temperature of the PV module can be reduced by approximately 15 °C using cooling fins. Moreover, the increase in the efficiency caused by the decrease in the temperature was calculated using a linear model that represents the correlation between the temperature and efficiency of the module. As a result, the efficiency of the module without cooling fins was 13.26%, and increased by approximately 7.96% due to the cooling effect of the fins, reaching 14.39% (under the conditions of 600 and 0.5 m/s).
(2) In the simulation results, the parameter study results showed that the cooling performance did not change significantly due to the shape of the fins. In particular, it is necessary to develop fins that do not cause structural problems due to their structural characteristics and can secure the ease of fabrication for PV modules because the increase in the length of the fins may cause serious structural problems under the fast wind speed conditions. Moreover, it is important that the fins can be installed in the existing PV modules without difficulty.
(3) Slits that have a smaller area than the air channel at the bottom of a PV module can have an effect like that of a diffuser. The simulation results showed that it was possible to improve the cooling performance of the fins by promoting the formation of turbulence at the bottom of the module, resulting in the temperature reduction by approximately 0.6 °C. In other words, the cooling performance of fins can be further improved by the installation of slits instead of securing the heat transfer area by increasing the thickness of the fins. Especially, the effect of slits is sufficient in the condition of lower air velocity. The cell temperature further reduces by 8.62 °C due to the slits. Therefore, the application of slits is economical and can have structural benefits because it does not require an increase in the material and weight of fins to secure the cooling performance.
(4) The hot spot phenomenon, which involves overheating while the reverse bias is forced because the solar radiation incident on the cells in a PV module is not uniform, may seriously affect the electrical efficiency and durability of a PV module [22]. In this study, it was found that the surface temperature of the PV module was relatively uniformly distributed due to the cooling effect of the fins. In other words, it is confirmed that the overheating and non-uniformity of the surface temperature by hot spot can be improved simultaneously by installing fins.
Author Contributions
The authors J.K. and Y.N. carried out CFD simulation and wrote the full manuscript. The author J.K. constructed the simulation model and analyzed simulation results. The author Y.N. reviewed results and whole manuscript.
Funding
This research was financially funded by the Ministry of Trade, Industry, and Energy (MOTIE), and the Korea Institute for Advancement of Technology (KIAT) through the International Cooperative R&D program (N062000014 _ Economic Solution for Trigeneration System).
Conflicts of Interest
The authors declare no conflict of interest.
References
- BP Energy Outlook. BP Energy Economics; BP: London, UK, 2018. [Google Scholar]
- A Common Definition for Zero Energy Buildings; U.S. Department of Energy: Washington, DC, USA, September 2015.
- Korea Energy Agency. Renewable Energy Heat Obligationl; Korea Energy Agency: Ulsan, South Korea, 2018. [Google Scholar]
- Global Market Outlook for Solar Power/2018–2022; Solar Power Europe: Brussels, Belgium, June 2017.
- Bahabry, R.R.; Kutbee, A.T.; Khan, S.M.; Sepulveda, A.C. Corrugation Architecture Enabled Ultraflexible Wafer-Scale High-Efficiency Monocrystalline Silicon Solar Cell. Adv. Energy Mater. 2018, 8, 170–221. [Google Scholar] [CrossRef]
- Sathyanarayana, P.; Ballal, R.; Lakshmi Sagar, P.S.; Kumar, G. Effect of Shading on the Performance of Solar PV Panel. Energy Power 2015, 5, 1–4. [Google Scholar]
- Abdel-Salam, M.; El-Mohandes, M.-T.; Goda, M. An improved perturb-and-observe based MPPT method for PV systems under varying irradiation levels. Sol. Energy 2018, 171, 547–561. [Google Scholar] [CrossRef]
- Seng, A.K. Handbook for Solar Photovoltaic (PV) Systems; Energy Market Authority & Building and Construction Authority: Singapore, 2010.
- Teo, H.G.; Lee, P.S.; Hawlader, M.N.A. An active cooling system for photovoltaic modules. Appl. Energy 2012, 90, 309–315. [Google Scholar] [CrossRef]
- Moharram, K.A.; Abd-Elhady, M.S.; Kandil, H.A.; El-Sherif, H. Enhancing the performance of photovoltaic panels by water cooling. Ain Shams Eng. J. 2013, 4, 869–877. [Google Scholar] [CrossRef] [Green Version]
- D’Angola, A.; Zaffina, R.; Emescu, D.; Di Loe, D.; Fracastoro, G.V.; Sperino, F. Best compromise of net power gain in a cooled photovolataic system. In Proceedings of the 2016 51st International Universities Power Engineering Conference, Coimbra, Portugal, 6–9 September 2016. [Google Scholar]
- Mittelman, G.; Alshare, M.; Davidson, J.H. A model and heat transfer correlation for rooftop integrated photovoltaics with a passive air cooling channel. Sol. Energy 2009, 83, 1150–1160. [Google Scholar] [CrossRef]
- Ebrahimi, M.; Rahimi, M.; Rahimi, A. An experimental study on using natural vaporization for cooling of a photovoltaic solar cell. Int. Commun. Heat Mass Transf. 2015, 65, 22–30. [Google Scholar] [CrossRef]
- Koundinya, S.; Krishnan, A.S. Computational Study of Cooling of PV solar panel using finned heat pipe technology. Int. J. Mech. Eng. Technol. 2014, 5, 216–223. [Google Scholar]
- Elsafi, A.; Gandhidasan, P. Performance of a Photovoltaic or Thermal Double-Pass Solar Air Heater with Different Fin Configurations. J. Clean Energy Technol. 2015, 3, 28–33. [Google Scholar] [CrossRef]
- Taieb, N.; Mohamed, B.; Driss, N. Effect of the Fins Length for the Passive Cooling of the Photovoltaic Panels. Period. Polytech. Mech. Eng. 2016, 60, 89–95. [Google Scholar] [Green Version]
- Ibtisam, A.H. Enhancement the Performance of PV Panel by Using Fins as Heat Sink. Eng. Technol. J. 2018, 36, 798–805. [Google Scholar]
- Zondag, H.A.; Vries, D.W.; Van Hendel, W.G.J.; Van Zolingen, R.J.C.; Van Steenhoven, A.A. The yield of different combined PV–thermal collector designs. Sol. Energy 2003, 74, 253–269. [Google Scholar] [CrossRef]
- Krauter, S.; Preiss, A. Comparison of Module Temperature Measurement Methods. In Proceedings of the IEEE Photovoltaic Specialist Conference (PVSC), Philadelphia, PA, USA, 7–12 June 2009. [Google Scholar]
- Abe, K.-I.; Ohya, Y. An investigation of flow fields around flanged diffusers using CFD. J. Wind Eng. Ind. Aerodyn. 2009, 92, 315–330. [Google Scholar] [CrossRef]
- Spertino, F.; D’angola, A.; Enescu, D.; Di Leo, P.; Fracastoro, G.V.; Zaffina, R. Thermal-electrical model for energy estimation of a water cooled photovoltaic module. Sol. Energy 2016, 133, 119–140. [Google Scholar] [CrossRef]
- Rossi, D.; Omaña, M.; Giaffreda, D.; Metra, C. Modeling and Detection of Hotspot in Shaded Photovoltaic Cells. IEEE Trans. Very Large Scale Integr. (VLSI) Syst. 2015, 23, 1031–1039. [Google Scholar] [CrossRef] [Green Version]
Figure 1.
Global annual and total solar PV installed capacity (2007–2017) [4].
Figure 1.
Global annual and total solar PV installed capacity (2007–2017) [4].

Figure 2.
The effect of cell temperature on PV module performance [8].
Figure 2.
The effect of cell temperature on PV module performance [8].

Figure 3.
Solar simulator for indoor test (International Eletrotechnical Commission standard).

Figure 4.
Schematic diagram of the simulation model.

Figure 5.
The configuration of fins and slits.

Figure 6.
Temperature distribution of the case without cooling.

Figure 7.
Velocity distribution of module bottom (the case without cooling).

Figure 8.
Velocity distribution of the cases with cooling.

Figure 9.
Temperature distribution of the cases with cooling.

Figure 10.
Variation of PV temperature as a function of fins.

Figure 11.
Variation of PV temperature as a function of slits (Length: 30 mm, Number: 10EA).

Figure 12.
Schematic view of airflow around a diffuser [20].
Figure 12.
Schematic view of airflow around a diffuser [20].

Figure 13.
Vector of velocity with and without the slits.

Figure 14.
Variation of the cell temperature as a function of air velocity.

Figure 15.
Variation of electrical efficiency as a function of PV temperature.


Table 1.
Obligation of renewable energy supply rate in the building section (South Korea) [3].
Table 1.
Obligation of renewable energy supply rate in the building section (South Korea) [3].
| Year | 2011–2012 | 2013 | 2014 | 2015 | 2016 | 2017 | 2018 | 2019 | 2020– |
|---|---|---|---|---|---|---|---|---|---|
| Introduction rate (%) | 10 | 11 | 12 | 15 | 18 | 21 | 24 | 27 | 30 |
Table 2.
Physical conditions.
| Space | Time | Fluid | Flow | Equation of State | Viscous Regime | Reynolds-Averaged Turbulence |
|---|---|---|---|---|---|---|
| Three-dimensional | Steady | Air | Segregated | Constant density | Turbulent |
Table 3.
Numerical factors of simulation conditions.
| Heat Flux | Velocity Inlet | Ambient Temperature | Initial Temperature | Contact Resistance |
|---|---|---|---|---|
| 600 | 0.5 m/s | 26.84 °C | 26.84 °C | 0 |
Table 4.
Thermal properties.
| Components | Thickness (mm) | Thermal Conductivity (W/m∙K) | Heat Capacity (J/kg∙℃) | |
|---|---|---|---|---|
| Cell (Si) | 10 | 148 | 2330 | 677 |
| EVA | 10 | 0.35 | 960 | 2090 |
| Frame (Al) | 60 | 237 | 2702 | 903 |
| Back sheet | 1 | 0.2 | 1200 | 1250 |
| Fin (Cu) | 3 | 400 | 8900 | 385 |
Table 5.
Parameter study conditions.
| Case | Fin | Slit (mm) | |||
|---|---|---|---|---|---|
| Length (mm) | Thickness (mm) | Number | a | b | |
| Without cooling | - | - | - | - | |
| 1-1 | 30 | 5 | 10 | ||
| 1-2 | 20 | ||||
| 1-3 | 10 | 10 | |||
| 1-4 | 60 | 10 | |||
| 2-1 | 30 | 5 | 10 | 10 | 60 |
| 2-2 | 10 | ||||
Table 6.
PV module specifications.
| Type | Max power | Temperature Coefficient | |
|---|---|---|---|
| Mono-crystalline silicon | 290 W | 16.1% | 0.0047 |
© 2019 by the authors. Licensee MDPI, Basel, Switzerland. This article is an open access article distributed under the terms and conditions of the Creative Commons Attribution (CC BY) license (http://creativecommons.org/licenses/by/4.0/).
Share and Cite
MDPI and ACS Style
Kim, J.; Nam, Y. Study on the Cooling Effect of Attached Fins on PV Using CFD Simulation. Energies 2019, 12, 758. https://0-doi-org.brum.beds.ac.uk/10.3390/en12040758
AMA Style
Kim J, Nam Y. Study on the Cooling Effect of Attached Fins on PV Using CFD Simulation. Energies. 2019; 12(4):758. https://0-doi-org.brum.beds.ac.uk/10.3390/en12040758
Chicago/Turabian StyleKim, Jaemin, and Yujin Nam. 2019. "Study on the Cooling Effect of Attached Fins on PV Using CFD Simulation" Energies 12, no. 4: 758. https://0-doi-org.brum.beds.ac.uk/10.3390/en12040758
Note that from the first issue of 2016, this journal uses article numbers instead of page numbers. See further details here.