Energy Embedded in Food Loss Management and in the Production of Uneaten Food: Seeking a Sustainable Pathway

 ,
, 

Abstract
:1. Introduction
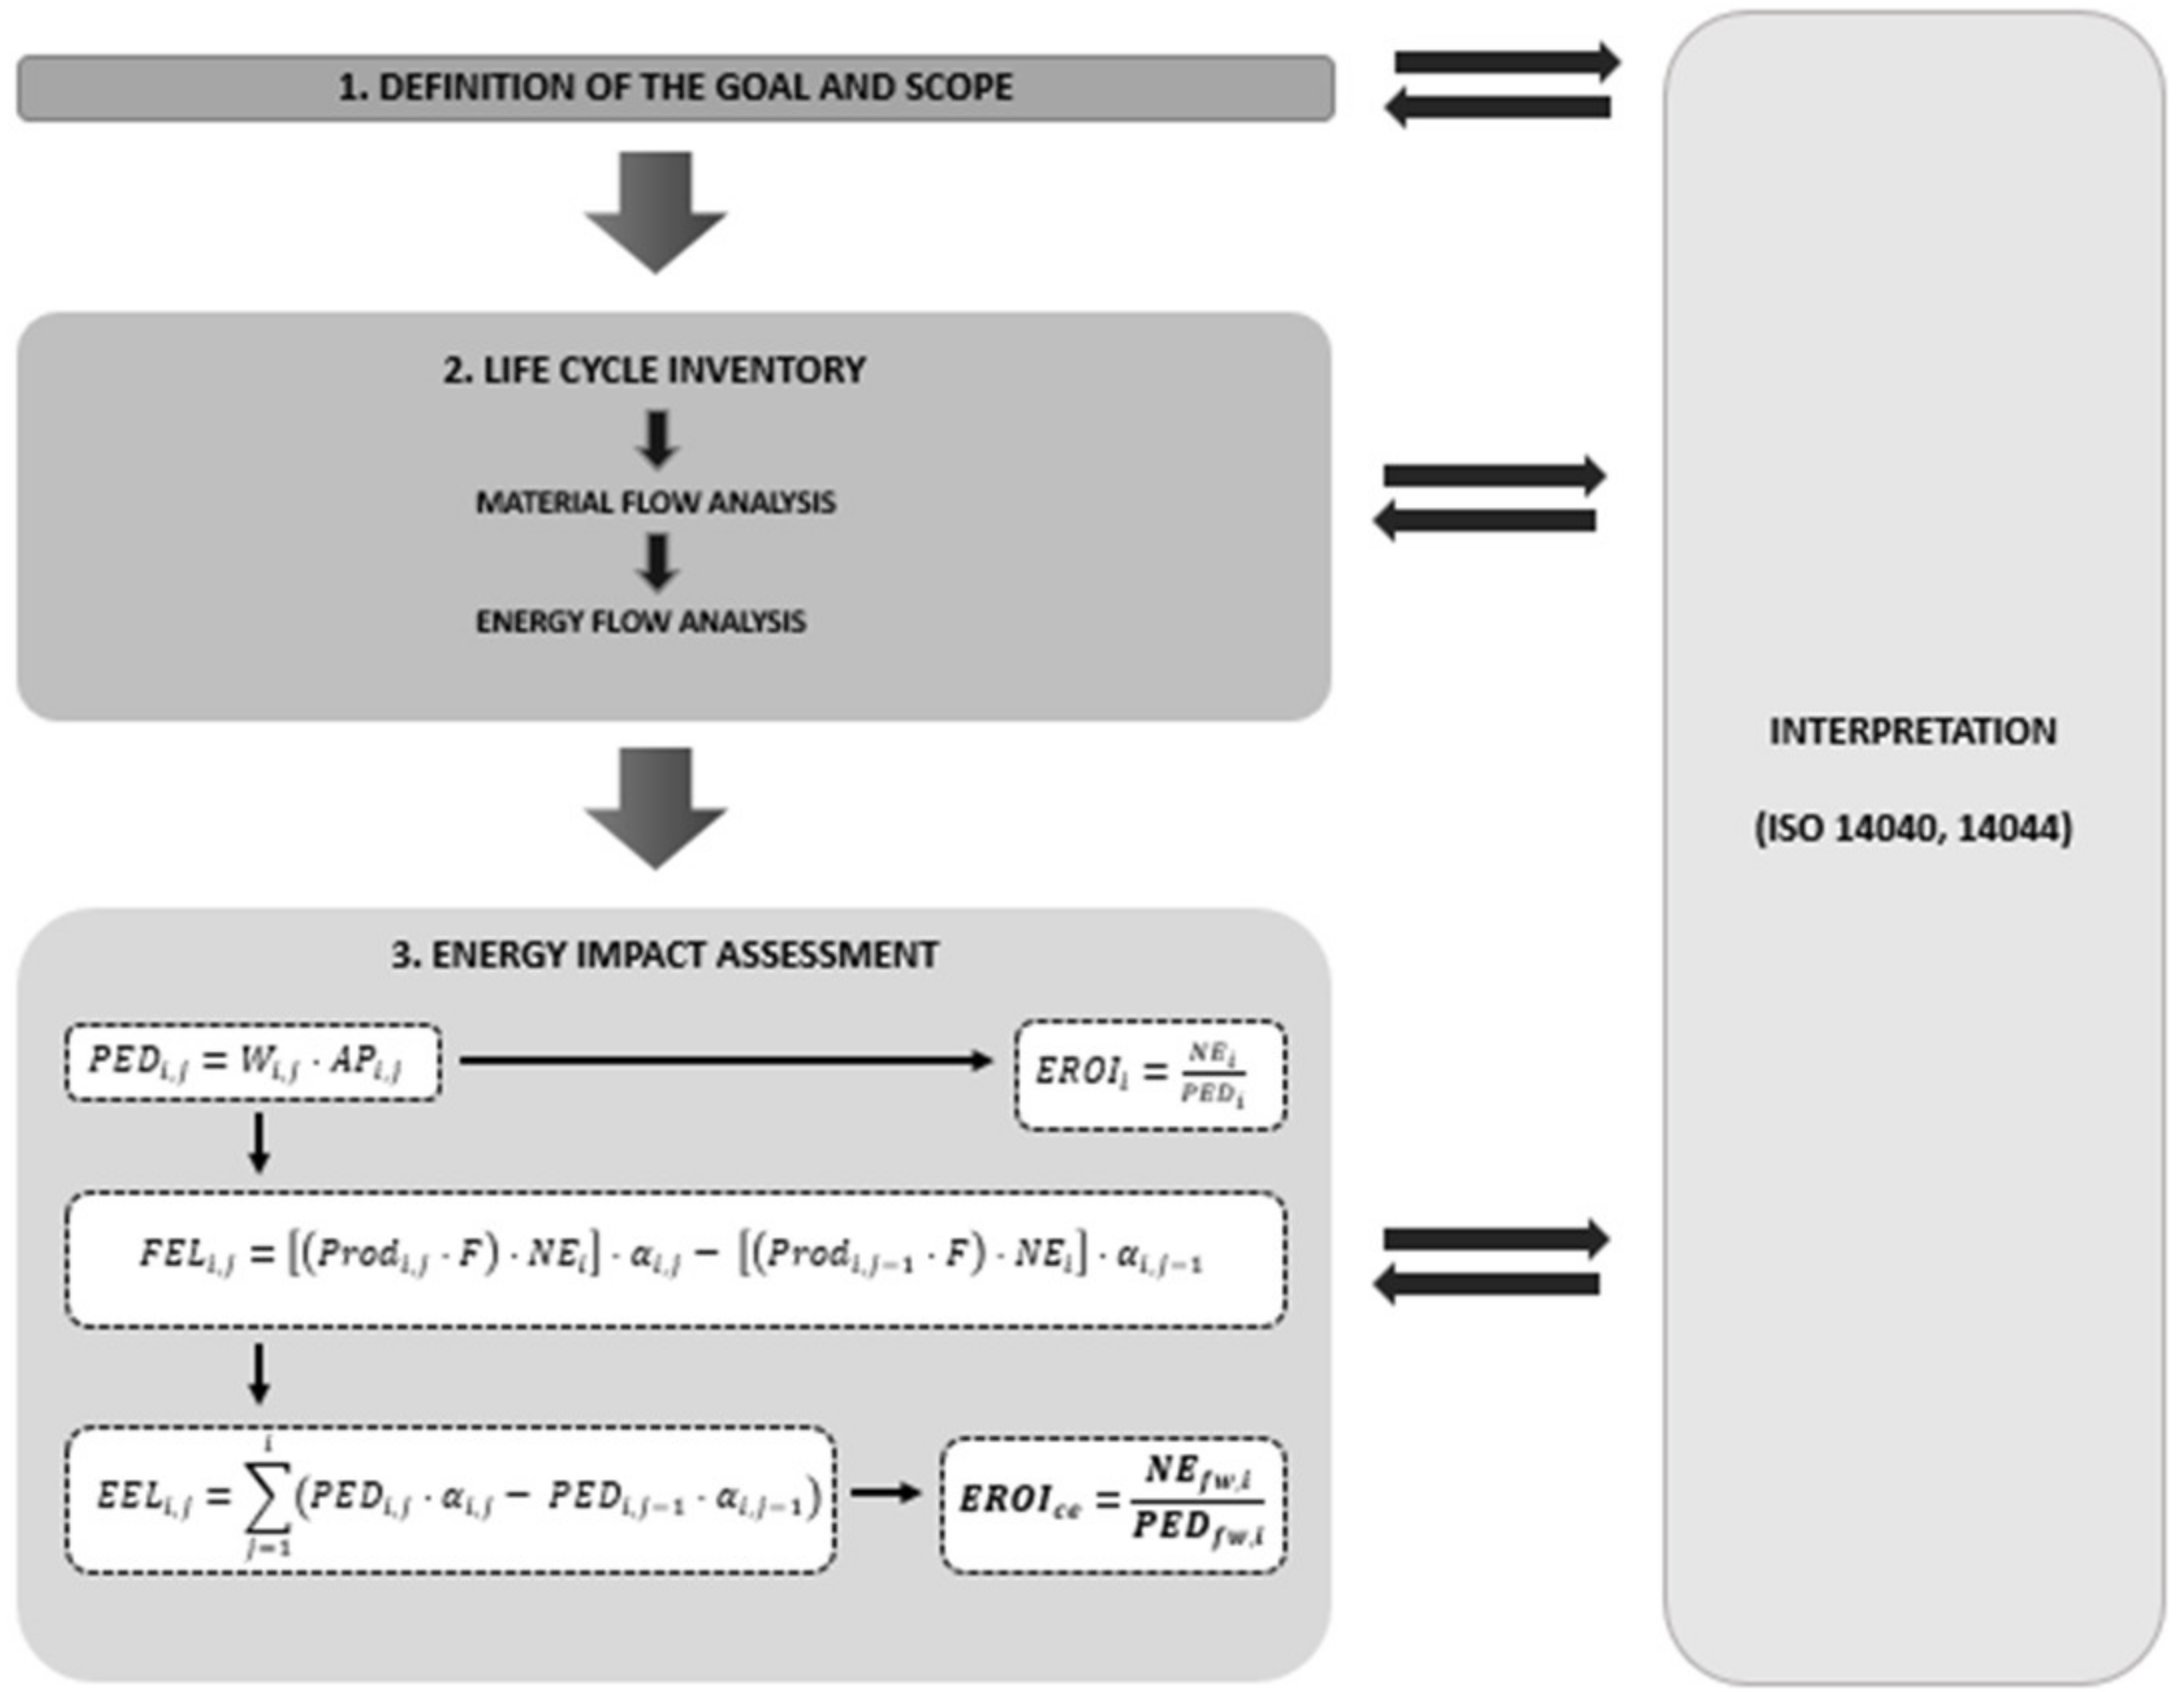
2. Methodology
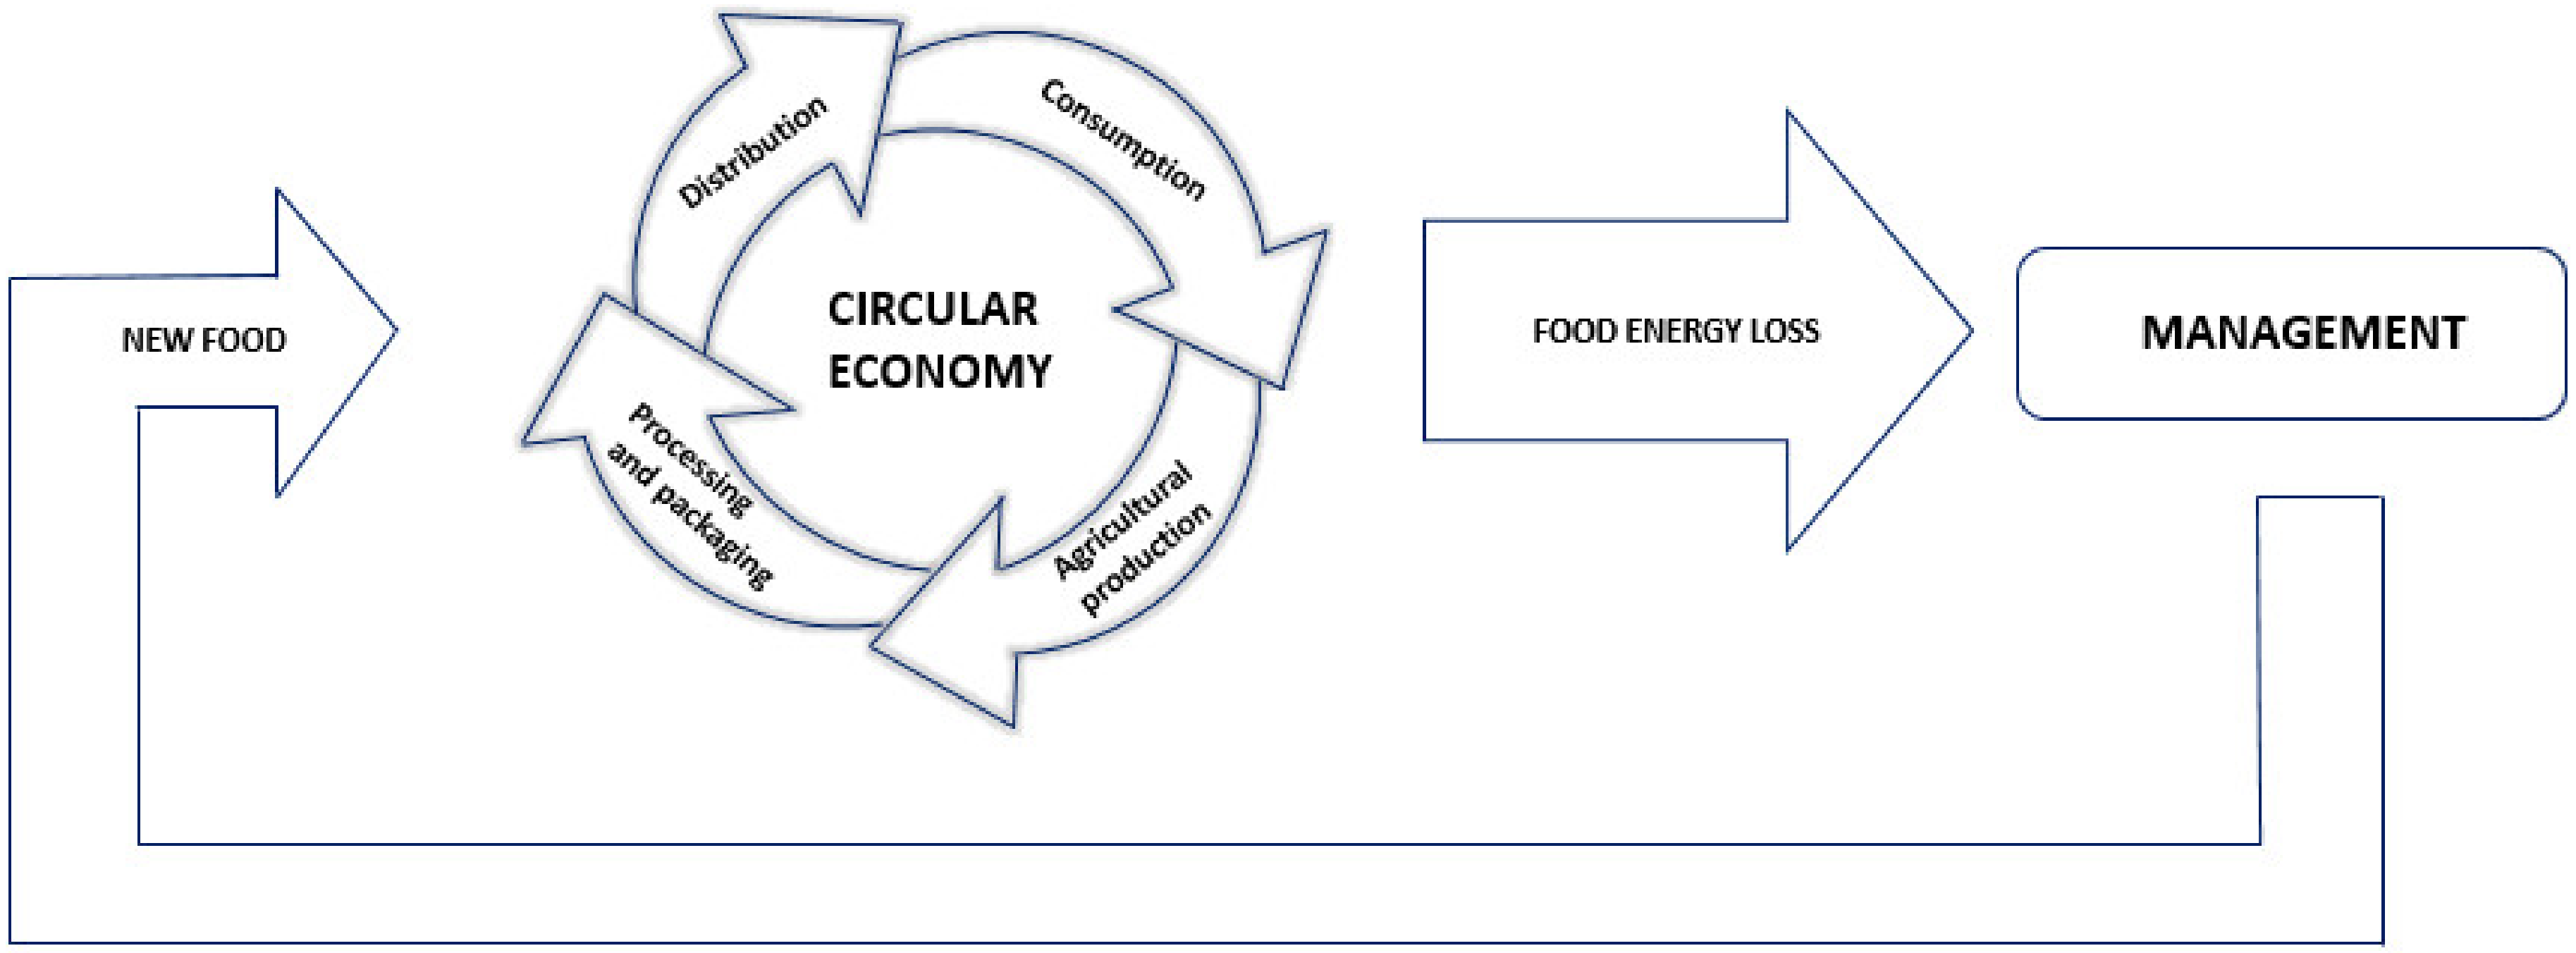
2.1. Goal and Scope
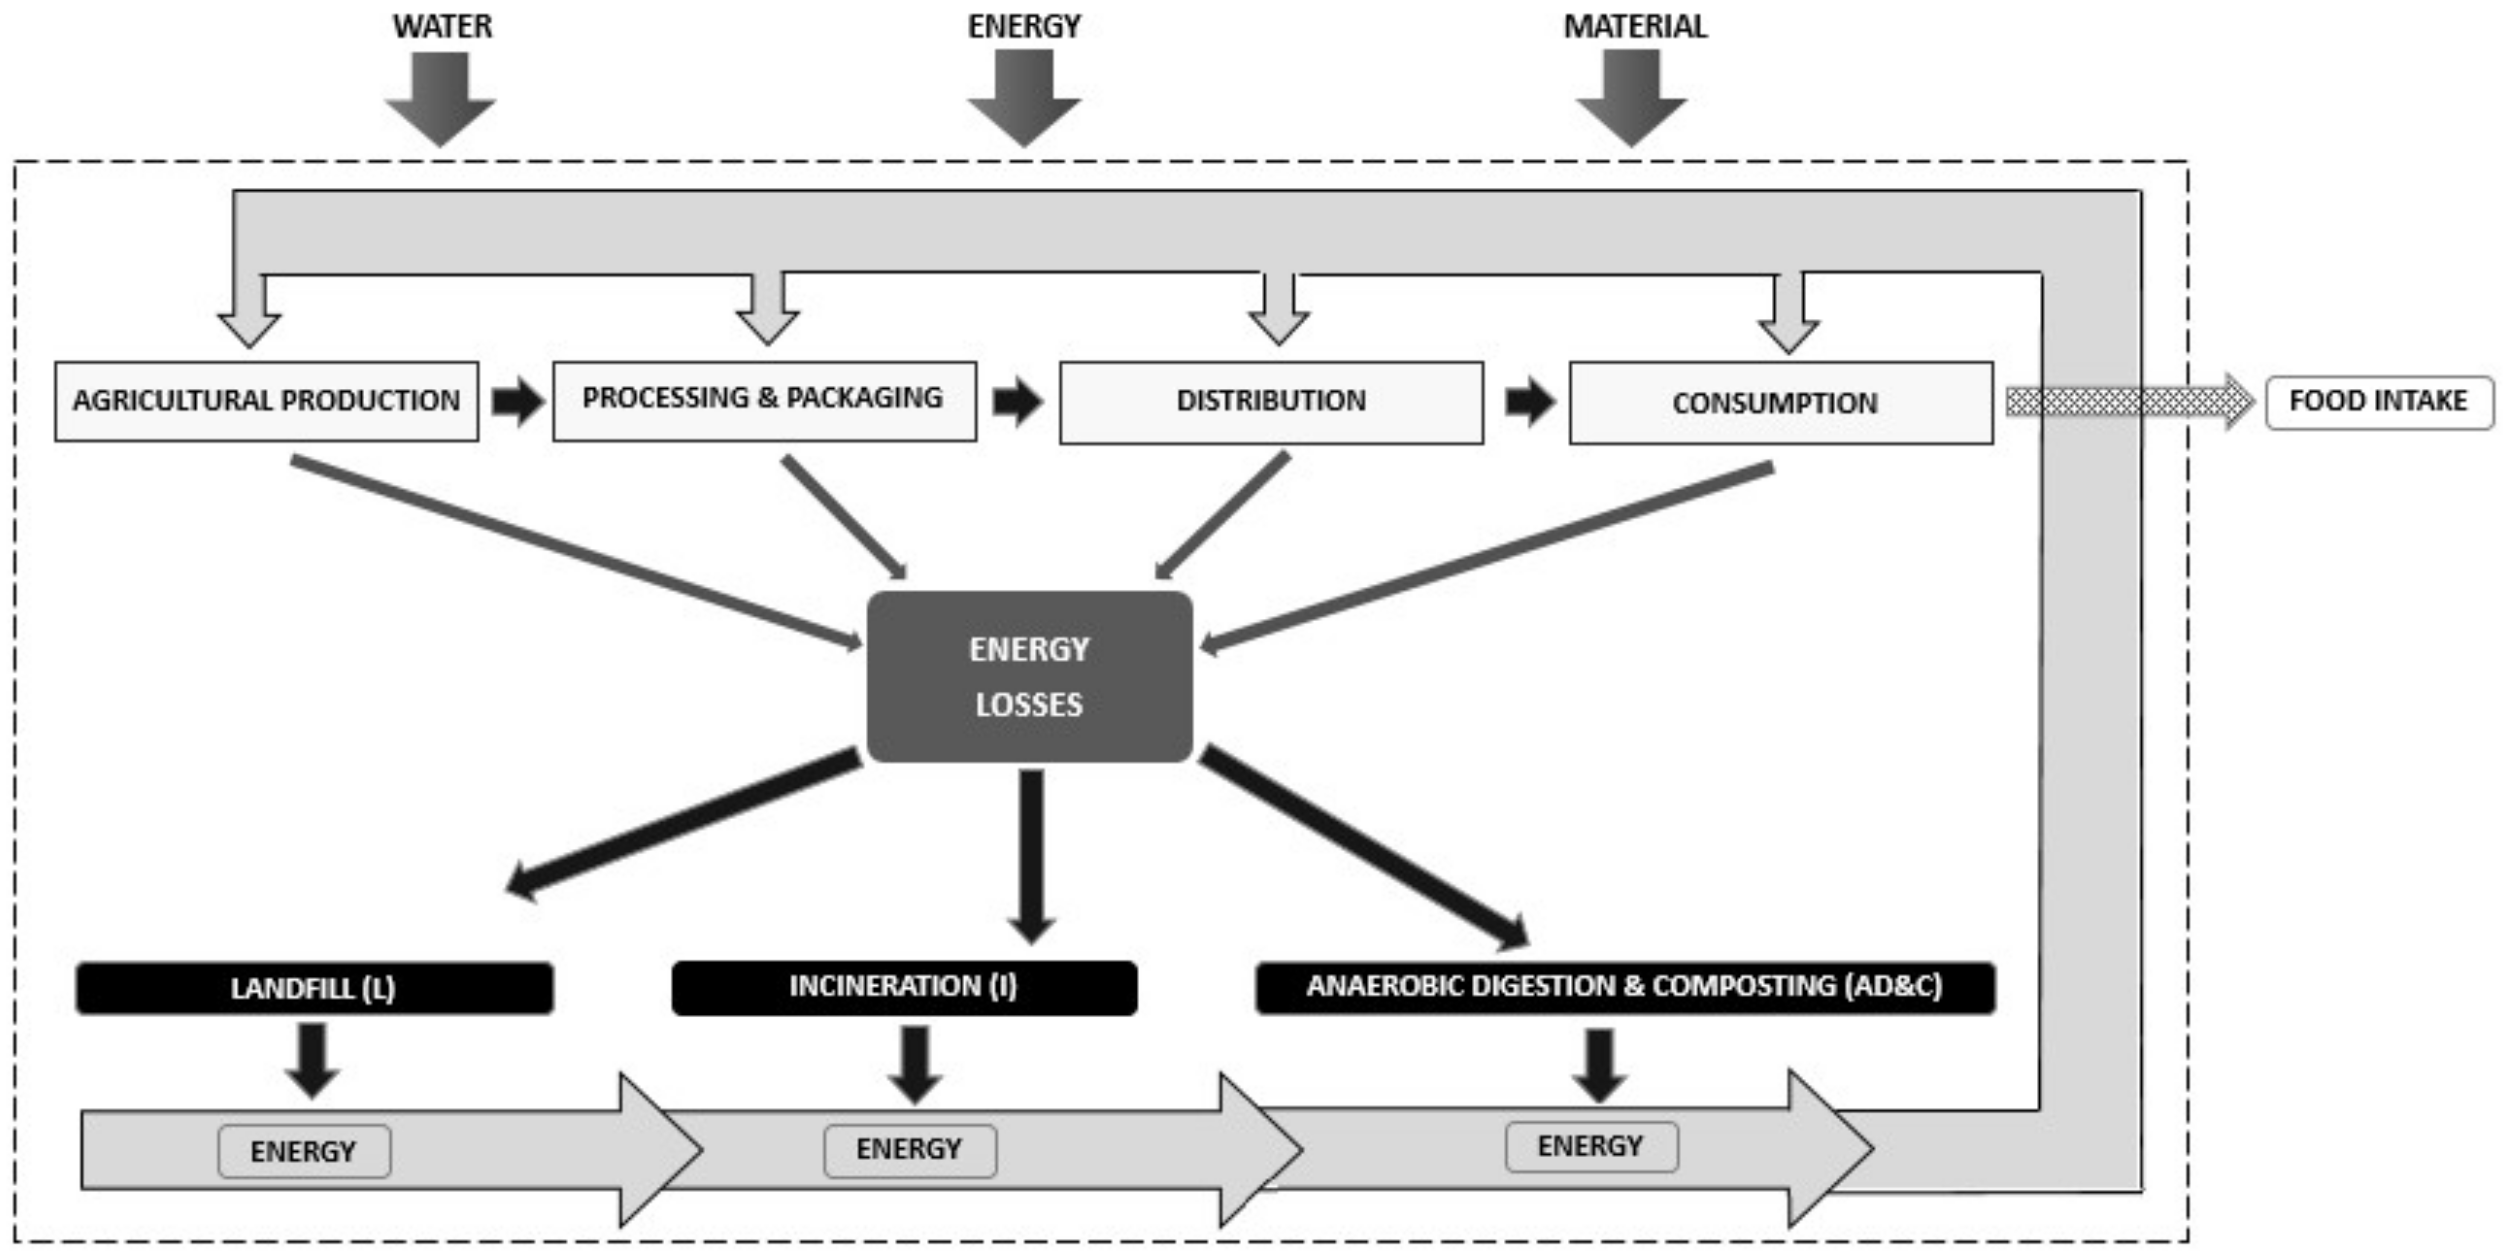
2.2. Function, Functional Unit and System Boundaries
2.3. Allocations
2.4. Life Cycle Inventory
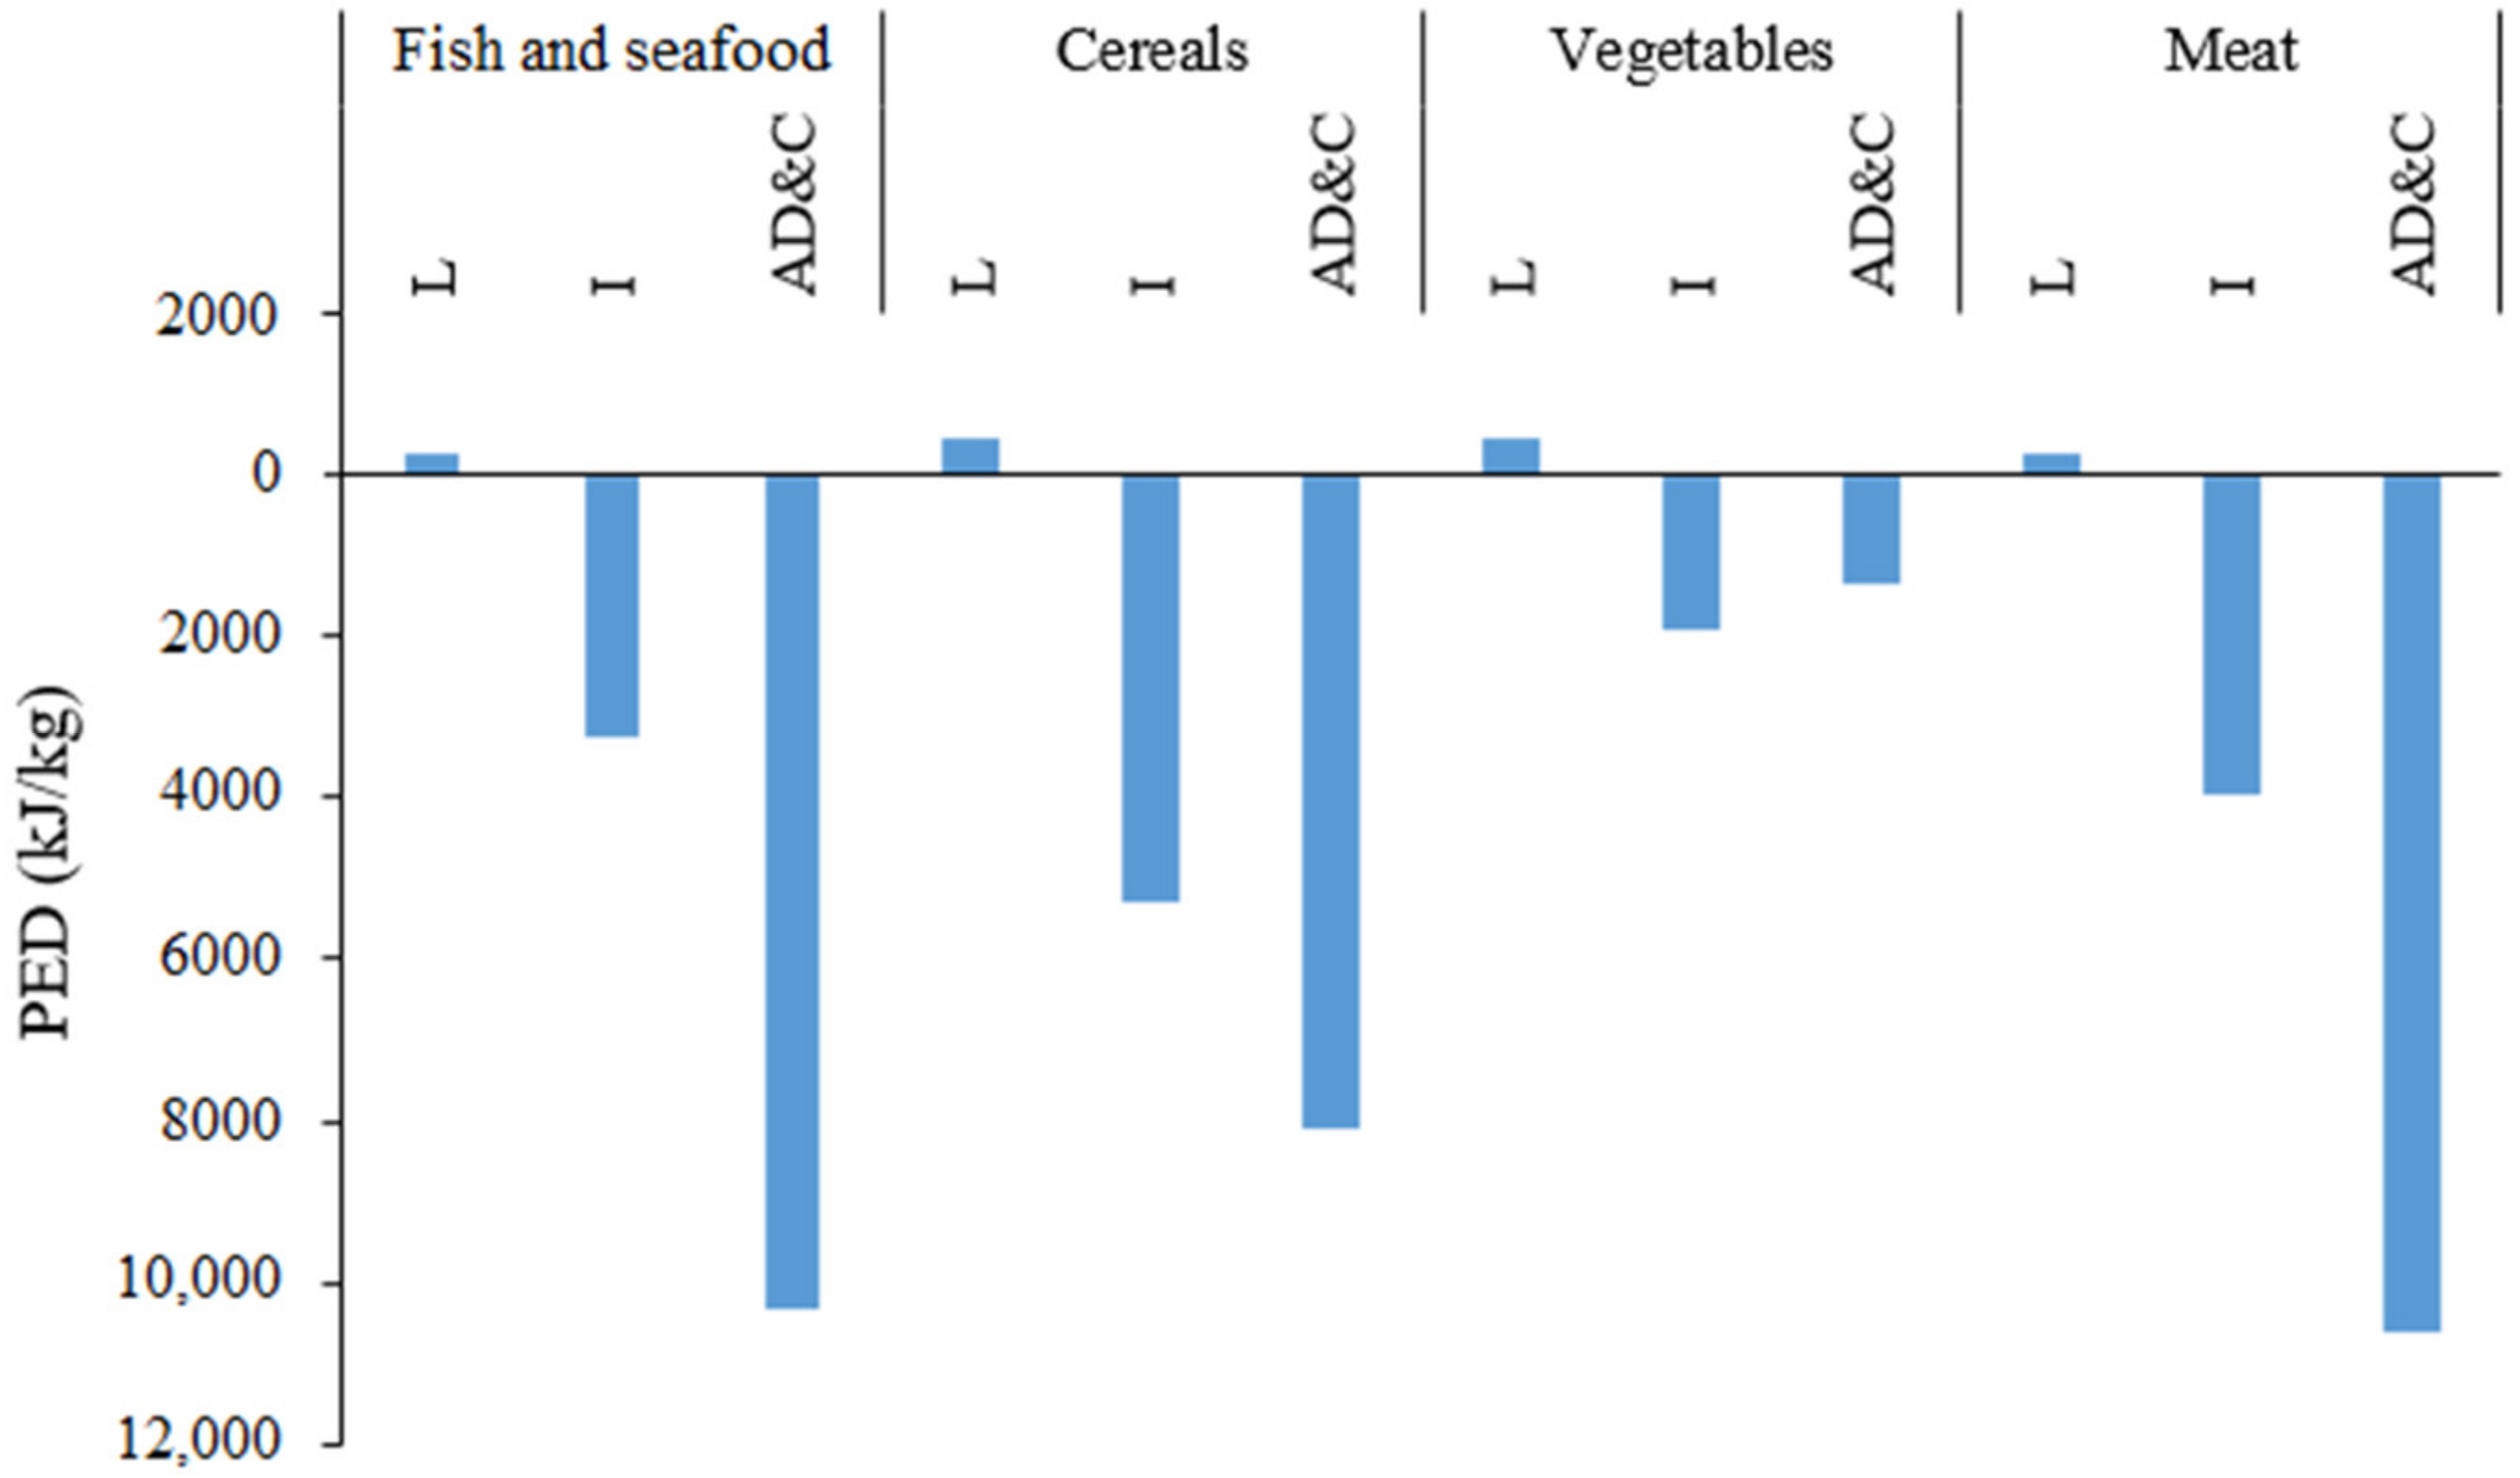
2.5. Assessment of Food Loss Management Scenarios
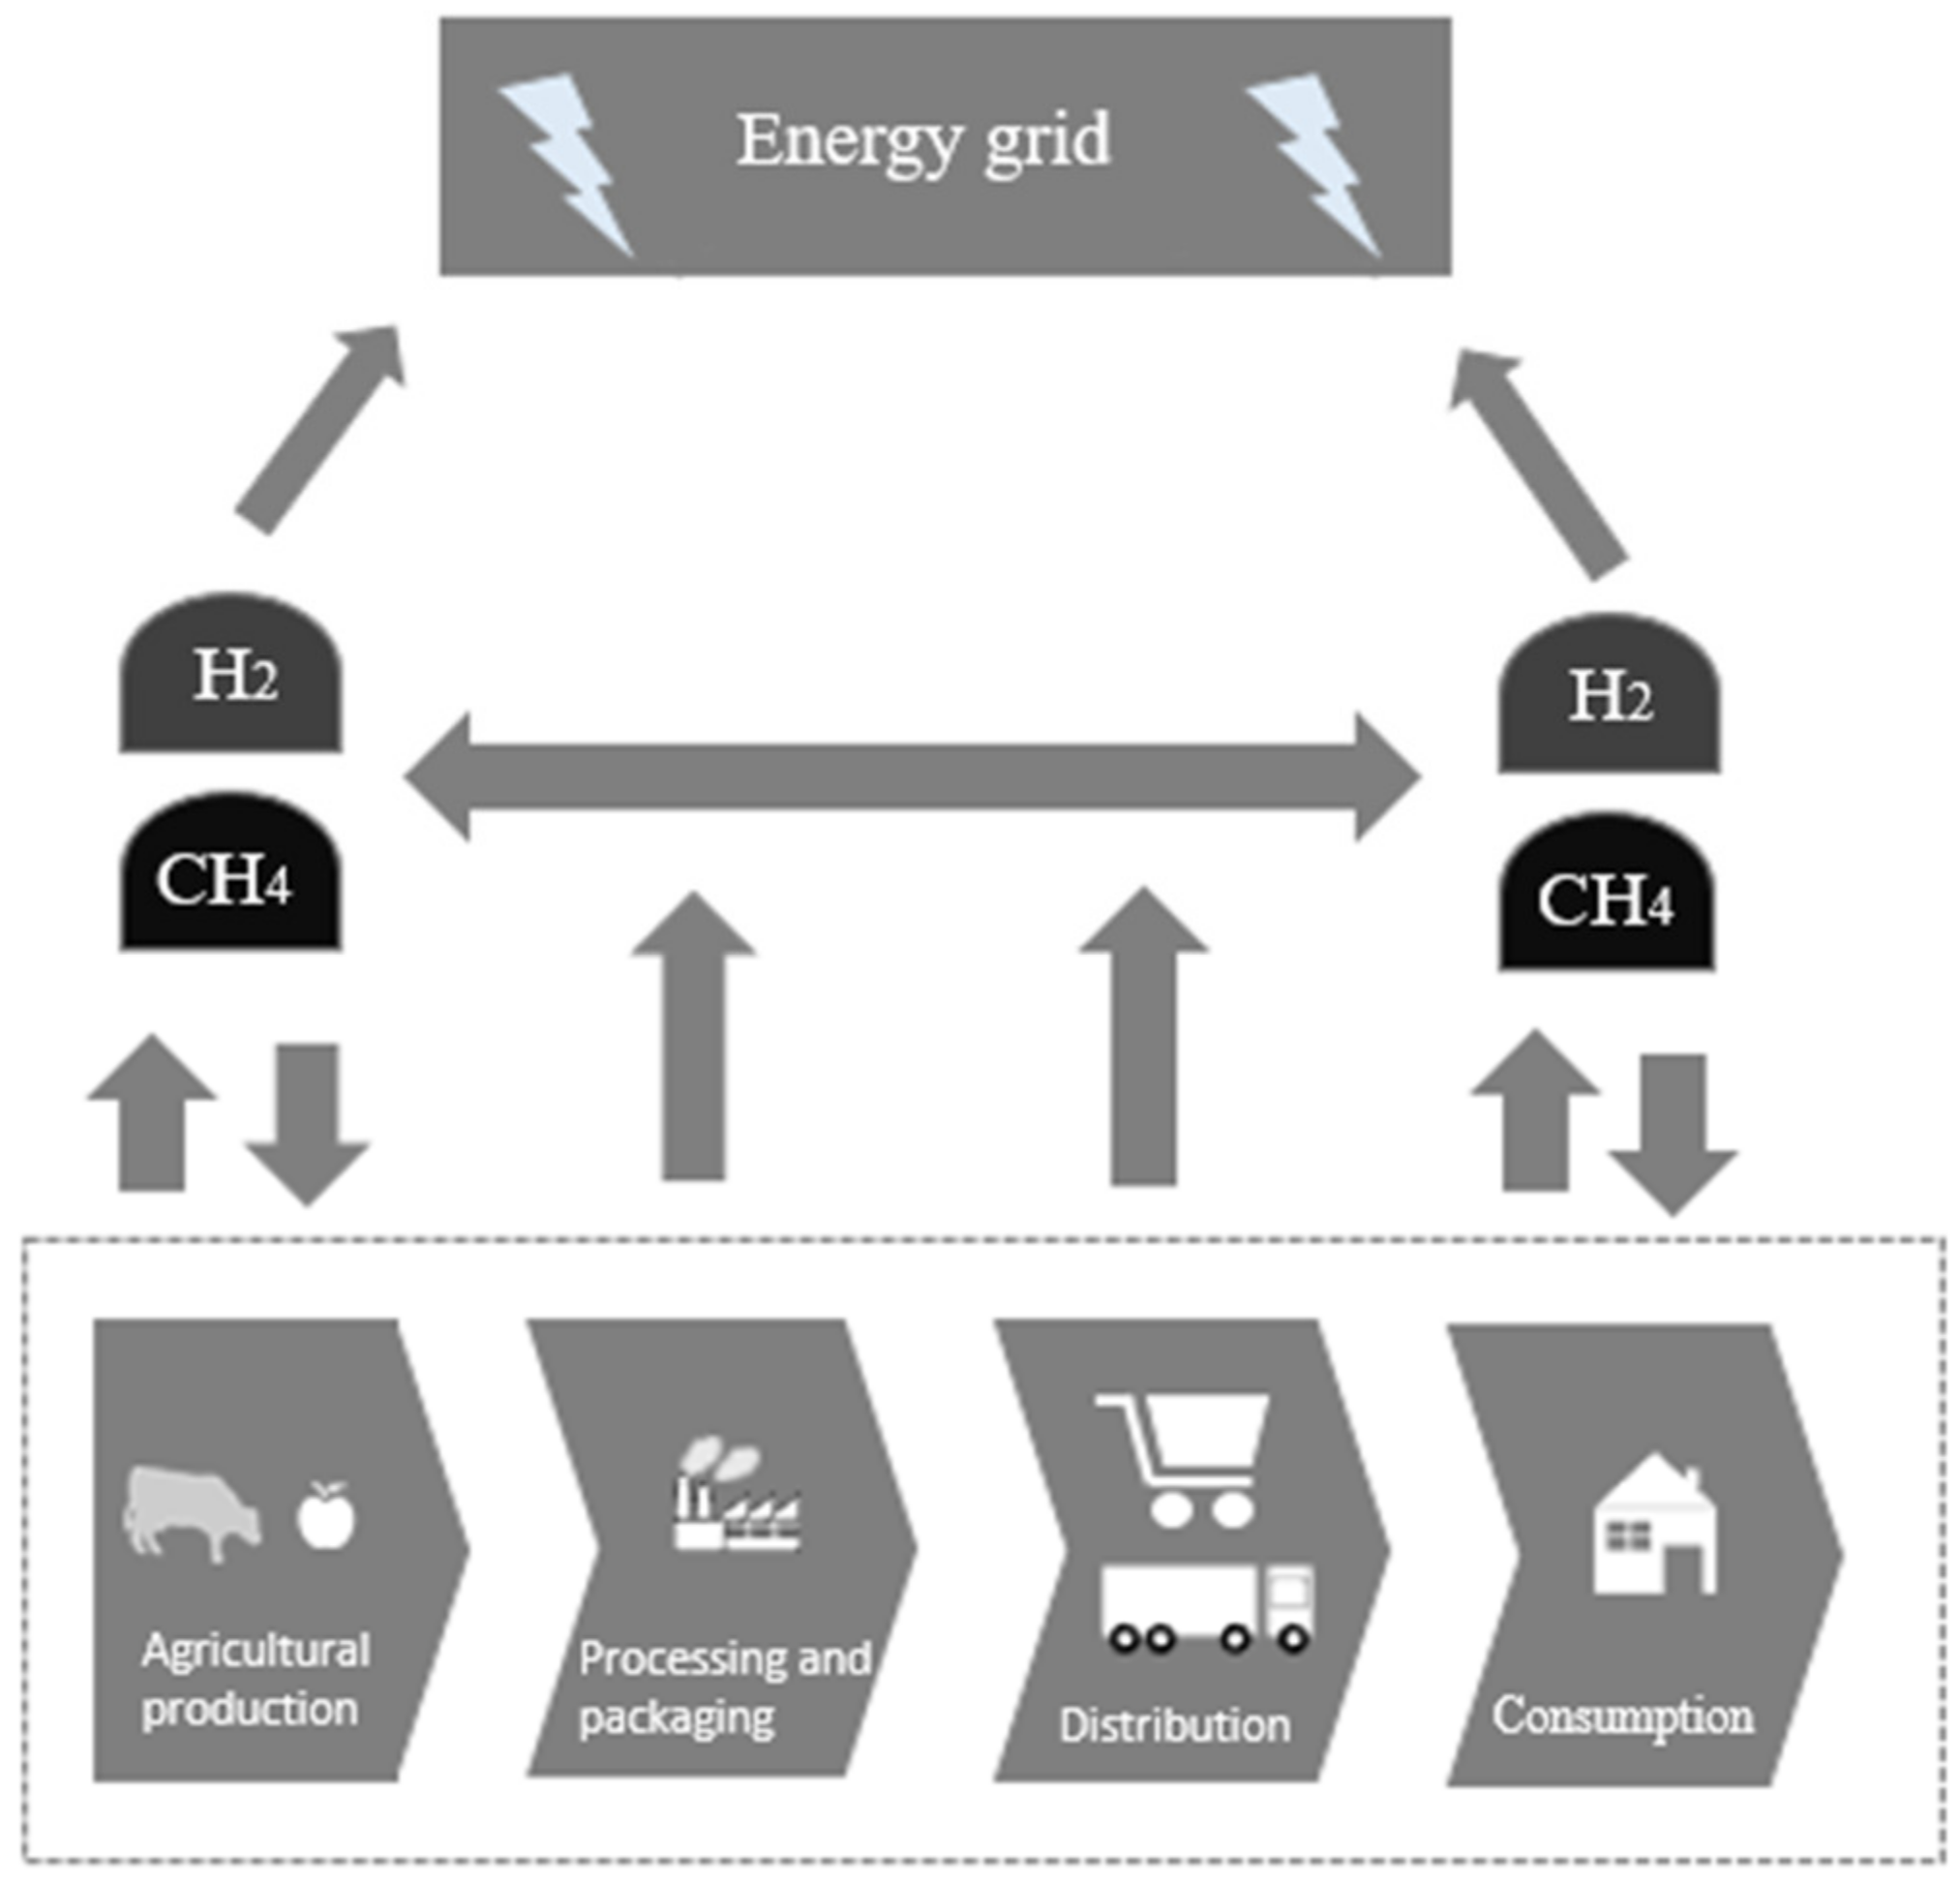
2.6. Material and Energy Flow Analysis
2.7. Energy Impact Assessment
3. Results
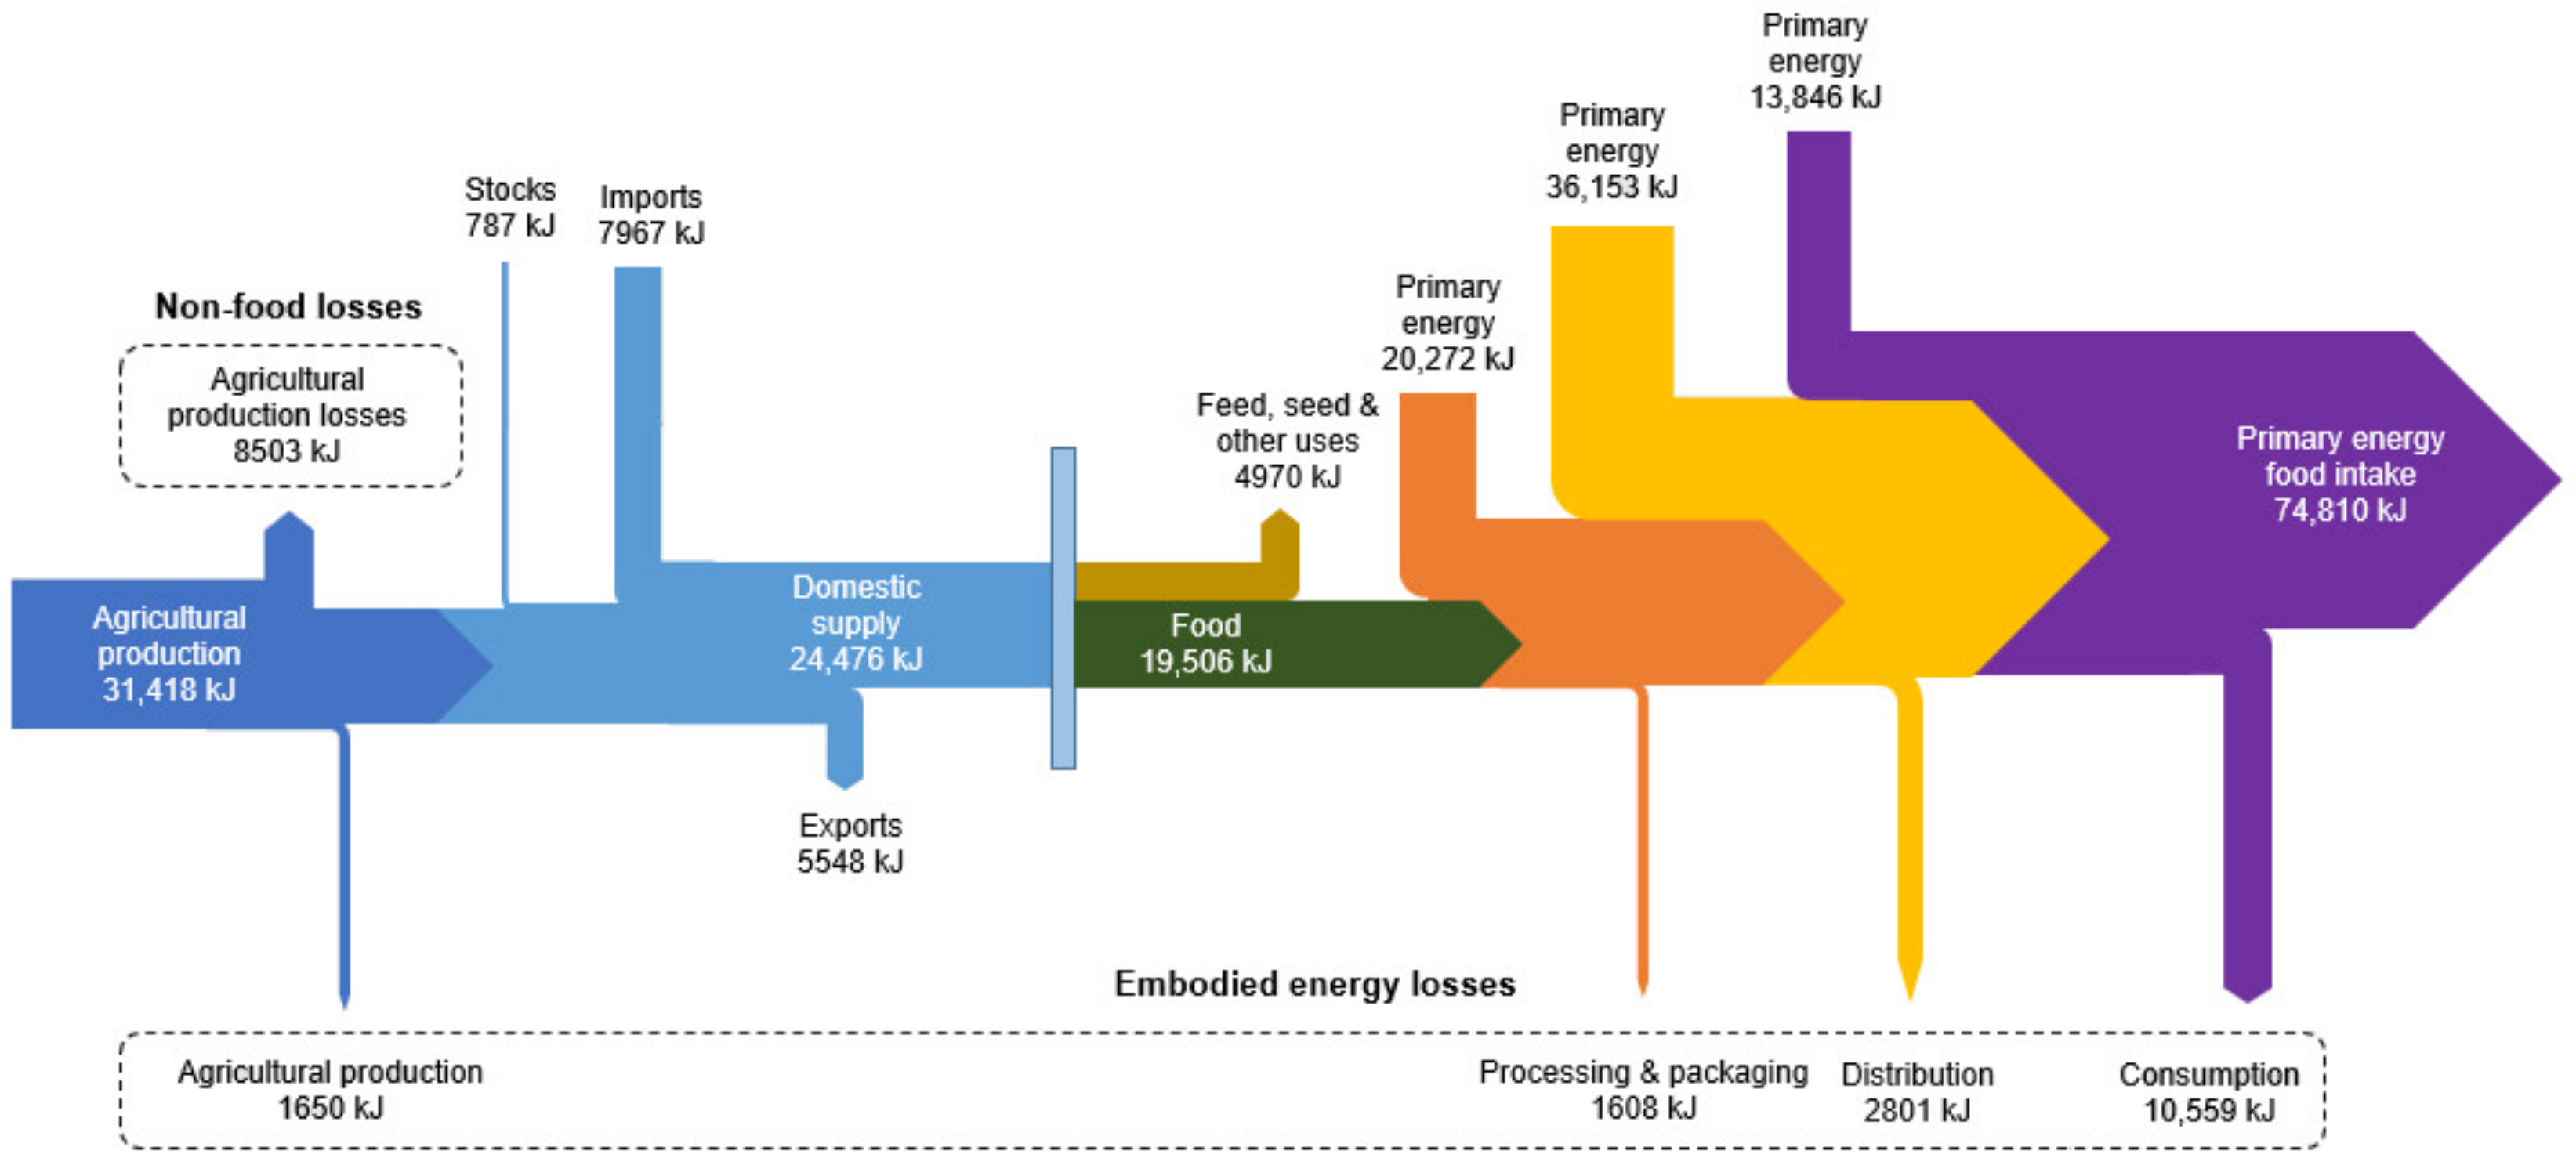
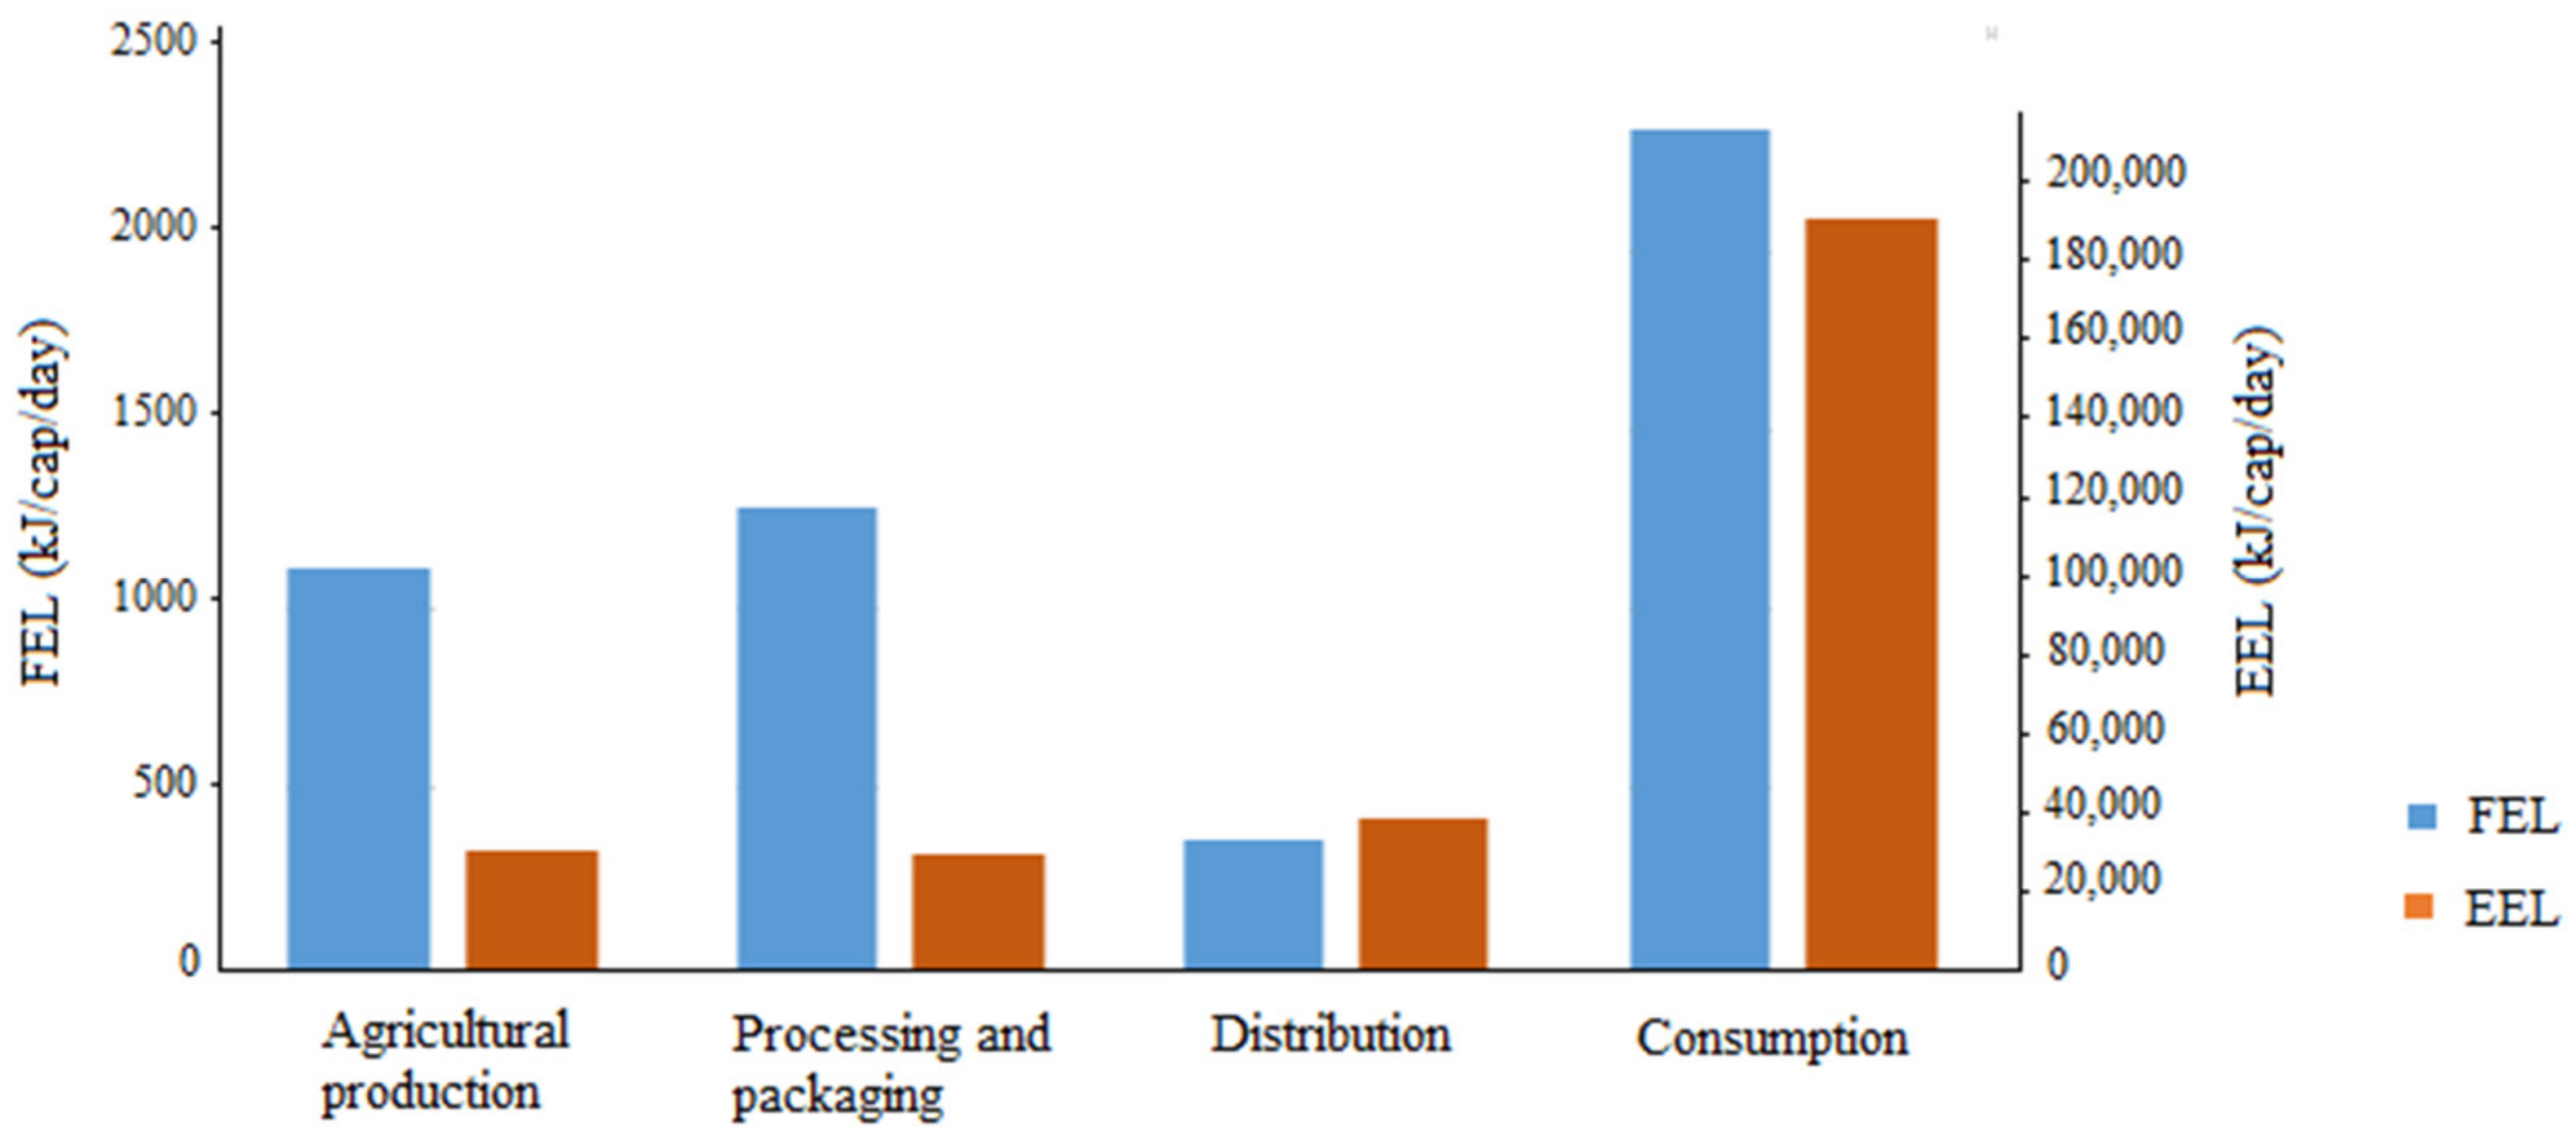
3.1. Energy Flow Analysis
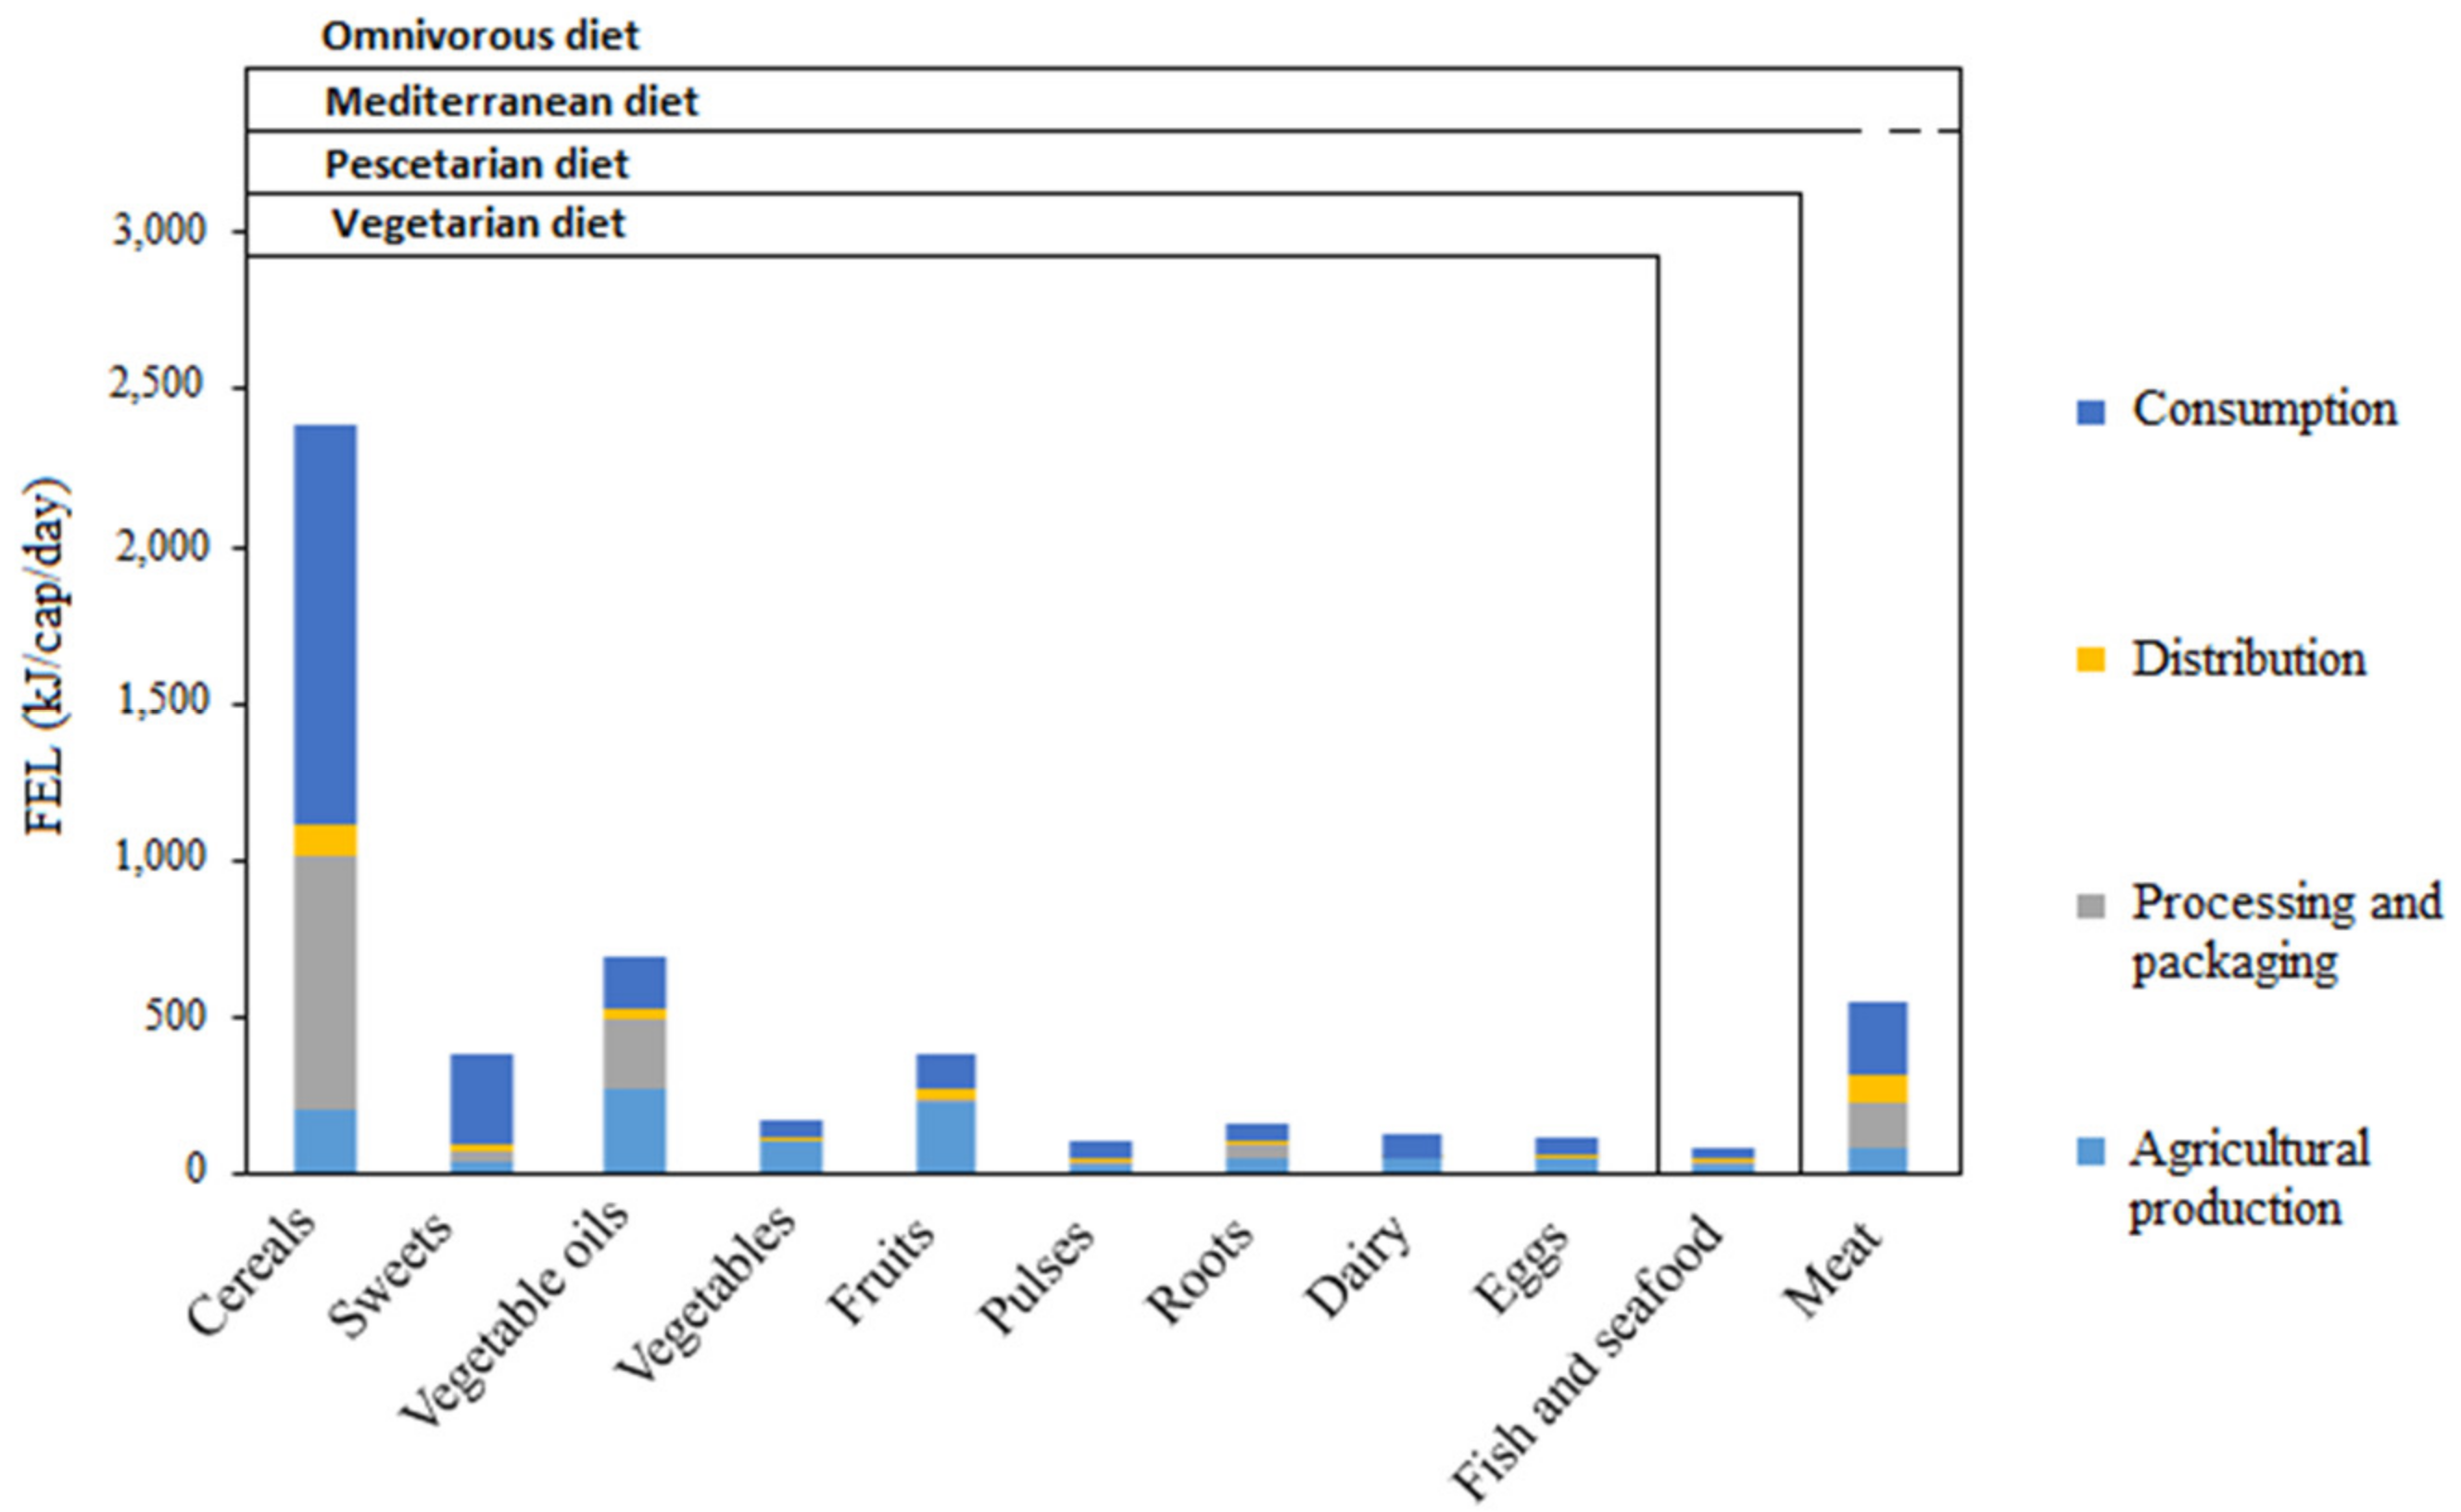
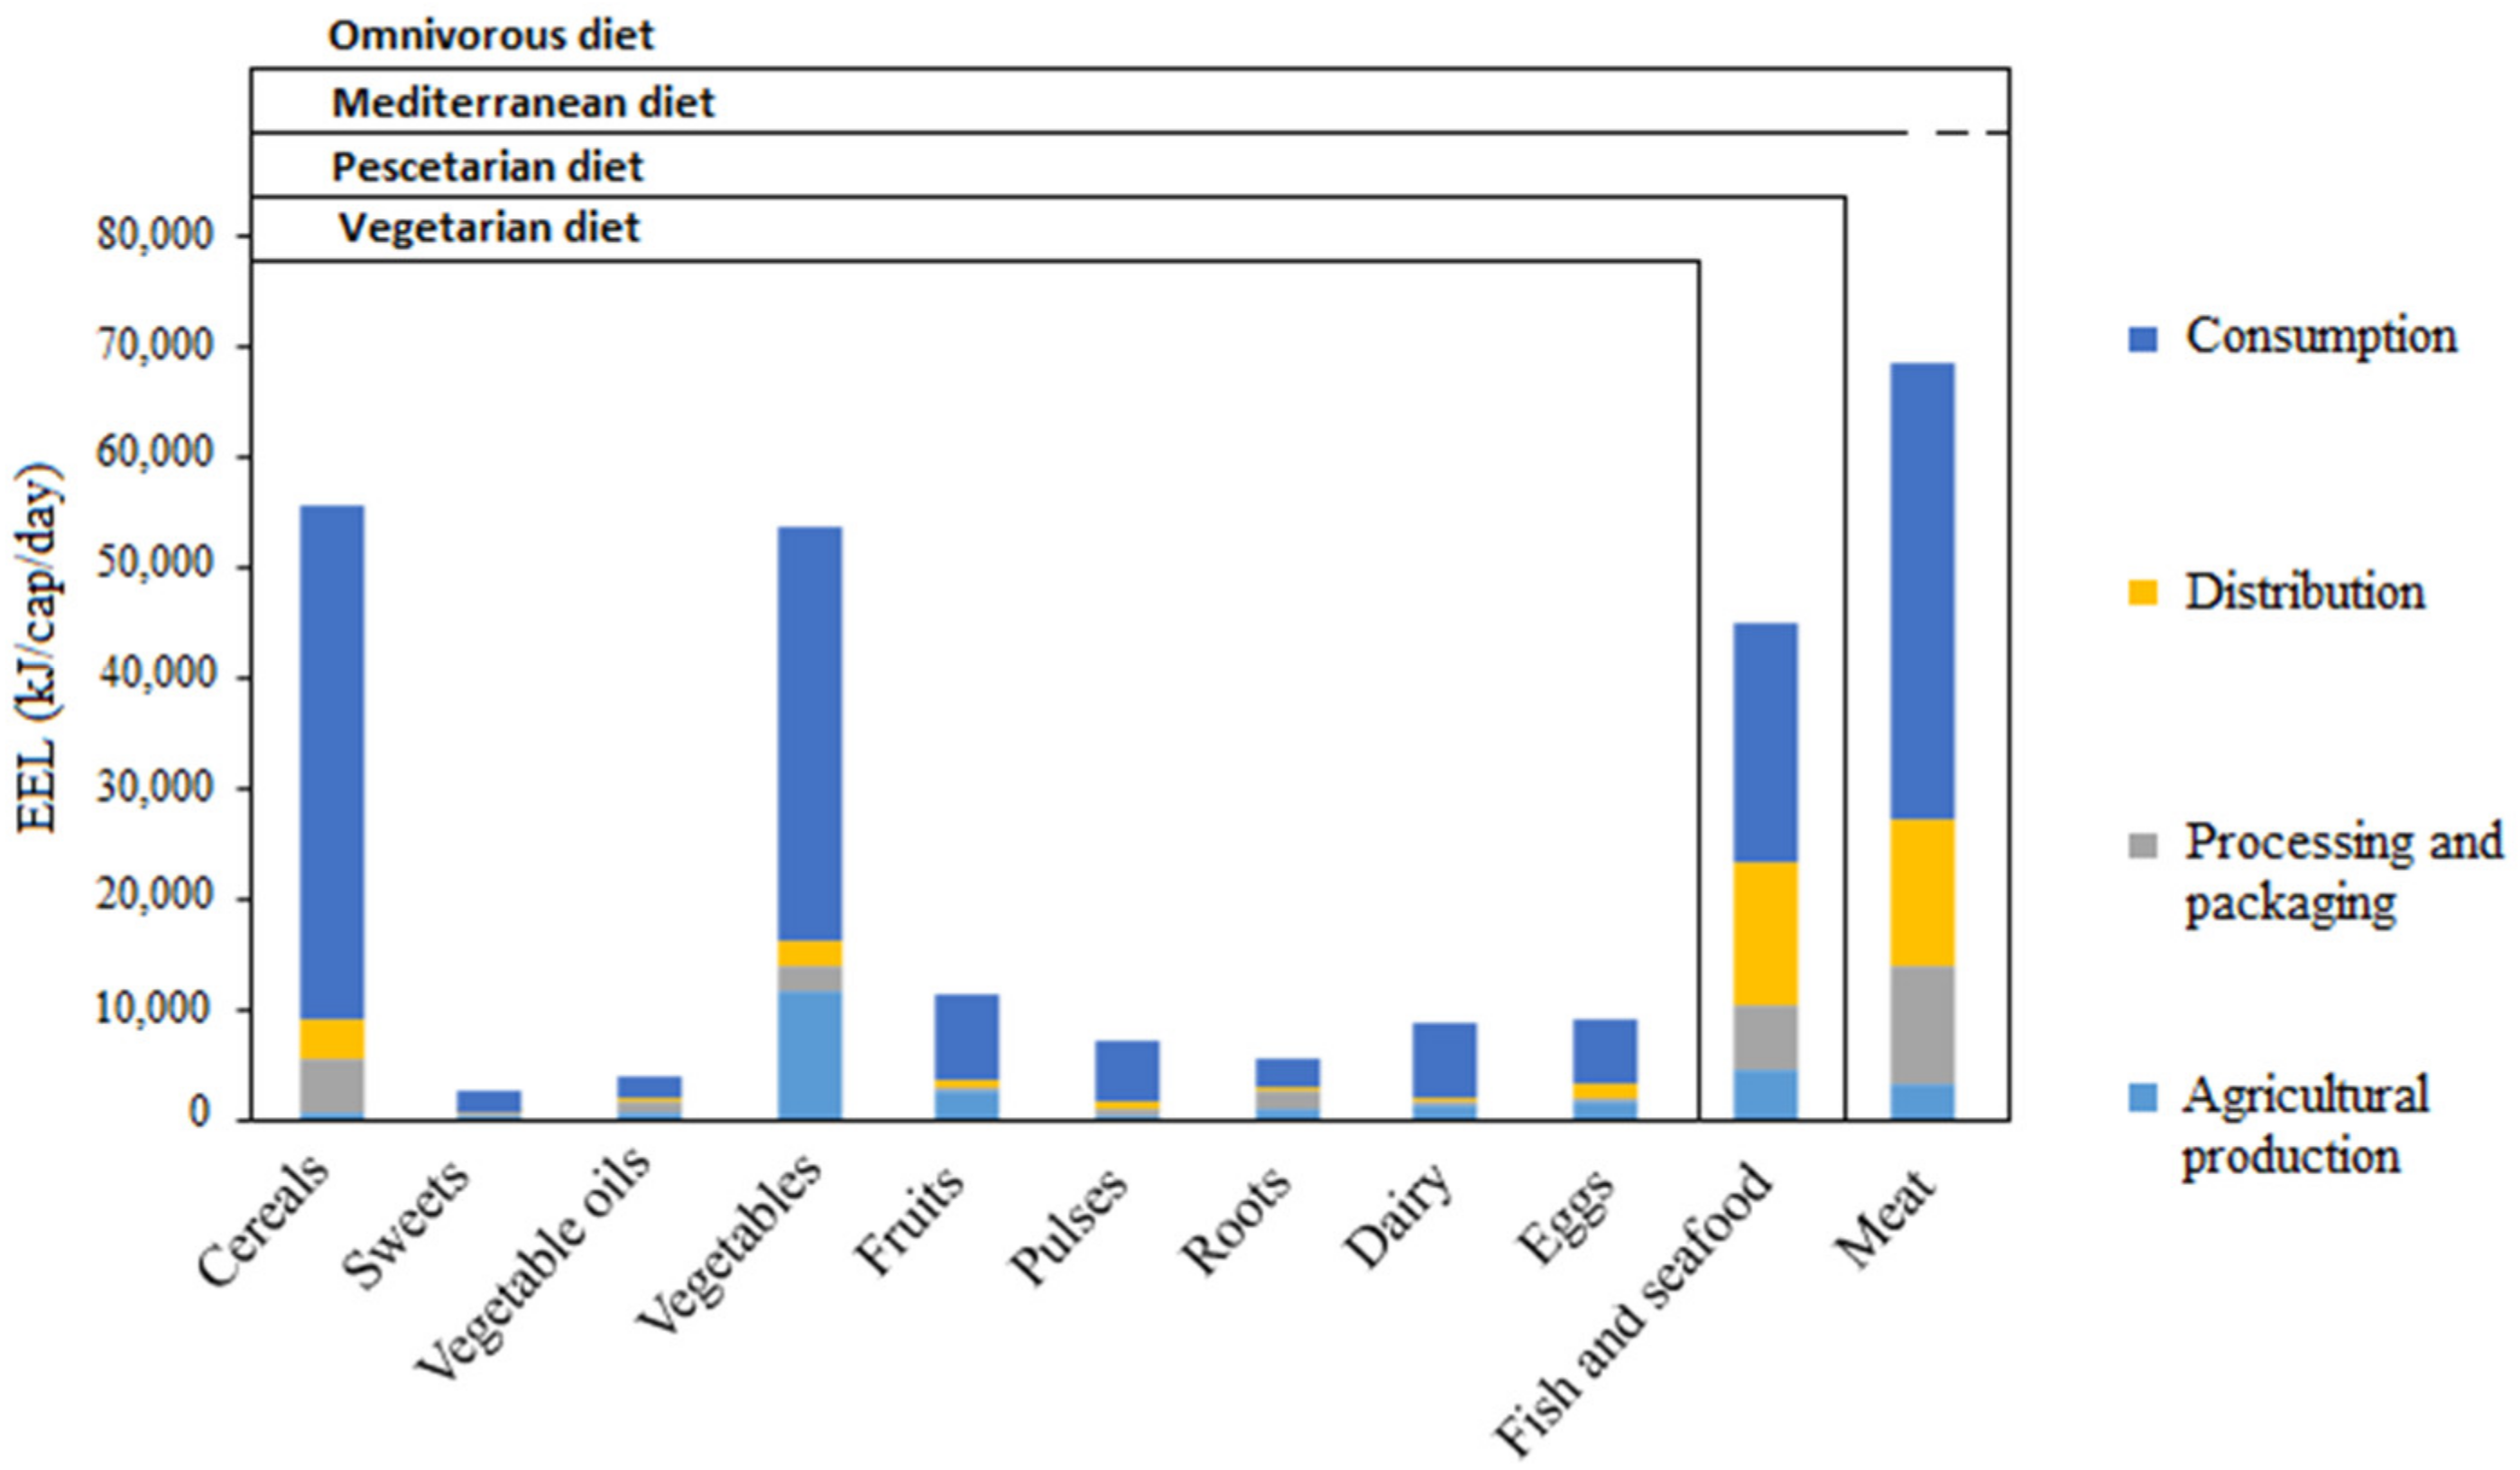
3.2. Energy Food Losses Quantification
3.3. Nutritional Assessment of the Energy Food Loss
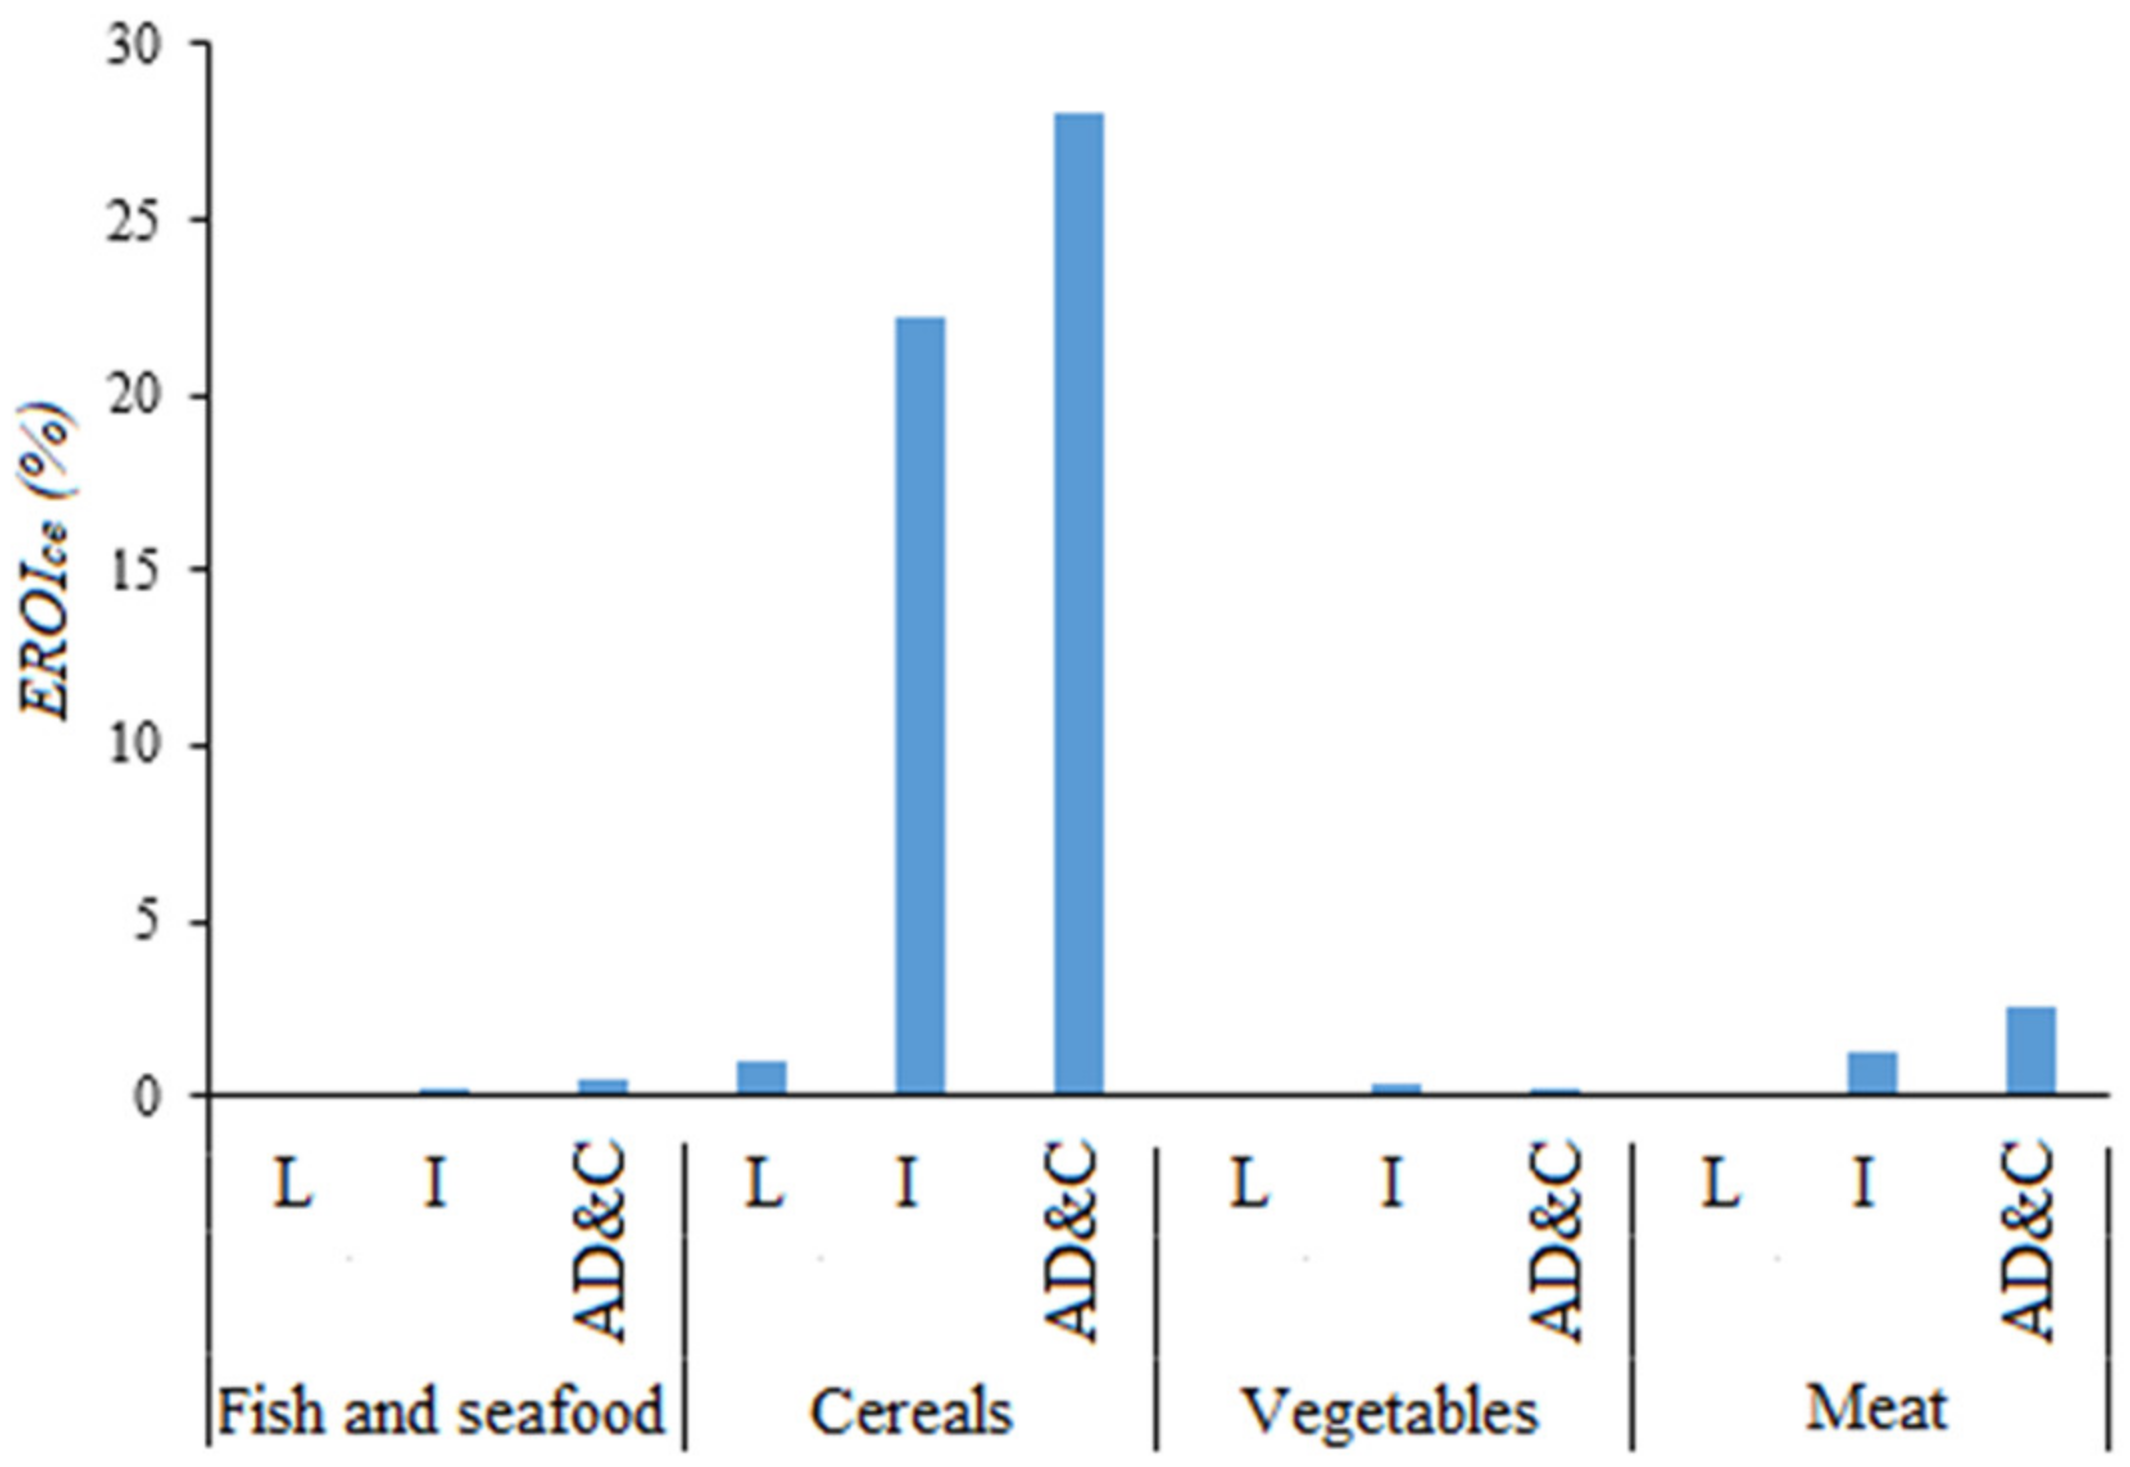
3.4. Energy Return on Investment–Circular Economy Index
4. Discussion
5. Conclusions
Supplementary Materials
Author Contributions
Funding
Acknowledgments
Conflicts of Interest
Abbreviations
| AD&C | Anaerobic Digestion and Composting |
| EEL | Embodied Energy Loss |
| EROI | Energy Return On Investment |
| EROIce | Energy Return On Investment—Circular Economy Index |
| FEL | Food Energy Loss |
| FL | Food Loss |
| I | Incineration with energy recovery |
| L | Landfill with biogas recovery |
| PED | Primary Energy Demand |
References
- Carlsson-Kanyama, A.; Ekström, M.; Shanahan, H. Food and life cycle energy inputs: Consequences of diet and ways to increase efficiency. Ecol. Econ. 2003, 44, 293–307. [Google Scholar] [CrossRef]
- Infante-Amate, J.; González de Molina, M. “Sustainable de-growth” in agriculture and food: An agro-ecological perspective on Spain´s agri-food system (year 2000). J. Clean. Prod. 2013, 38, 27–35. [Google Scholar] [CrossRef]
- Pimentel, D.; Pimentel, M.H. Food, Energy and Society, 3rd ed.; CRC Press, Taylor and Francis Group: Boca Raton, FL, USA, 2008. [Google Scholar]
- Martinez-Alier, J. The EROI of agriculture and its use by the Via Campesina. J. Peasant Stud. 2011, 38, 145–160. [Google Scholar] [CrossRef]
- Cuellar, D.; Webber, E. Wasted Food, Wasted Energy: The Embedded Energy in Food Waste in the United States. Environ. Sci. Technol. 2010, 44, 6464–6469. [Google Scholar] [CrossRef] [PubMed]
- Lin, B.; Chappell, M.; Vandermeer, J.; Smith, G.; Quintero, E.; Bezner-Kerr, R.; Griffith, D.; Ketcham, S.; Latta, S.; McMichae, P.; et al. Effects of industrial agriculture on global warming and the potential of small-scale agroecological techniques to reverse those effects. CAB Rev. Perspect. Agric. Vet. Sci. Nutr. Nat. Resour. 2011, 6, 020. [Google Scholar]
- Vittuari, M.; De Menna, F.; Pagani, M. The Hidden Burden of Food Waste: The Double Energy Waste in Italy. Energies 2016, 9, 660. [Google Scholar] [CrossRef]
- Markussen, M.V.; Østergård, H. Energy Analysis of the Danish Food Production System: Food-EROI and Fossil Fuel Dependency. Energies 2013, 6, 4170. [Google Scholar] [CrossRef]
- Tanczuk, M.; Skorek, J.; Bargiel, P. Energy and economic optimization of the repowering of coal-fired municipal district heating source by a gas turbine. Energy Convers. Manag. 2017, 149, 885–895. [Google Scholar]
- Food and Agriculture Organization of the United Nations (FAO). FAO Climate-Smart; FAO: Rome, Italy, 2011. [Google Scholar]
- European Commission. Commission Staff Working Document. European Research and Innovation for Food and Nutrition Security; European Commission: Brussels, Belgium, 2016. [Google Scholar]
- OECD. Improving Energy Efficiency in the Agro-Food Chain, OECD Green Growth Studies; OECD Publishing: Paris, France, 2017. [Google Scholar]
- Garcia-Herrero, I.; Hoehn, D.; Margallo, M.; Laso, J.; Bala, A.; Batlle-Bayer, L.; Fullana, P.; Vazquez-Rowe, I.; Gonzalez, M.J.; Durá, M.J.; et al. On the estimation of potential food waste reduction to support sustainable production and consumption policies. Food Policy 2018, 80, 24–38. [Google Scholar] [CrossRef]
- FAO. The State of Food Insecurity in the World. Meeting the 2015 International Hunger Targets: Taking Stock of Uneven Progress; FAO: Rome, Italy, 2015. [Google Scholar]
- Department of Economic and Social Affairs, Population Division, United Nations. Probabilistic Population Projections based on the World Population Prospects: The 2017 Revision; United Nations: New York, NY, USA, 2017. [Google Scholar]
- Kummu, M.; De Moel, H.; Porkka, M.; Siebert, S.; Varis, O.; Ward, P.J. Lost food, wasted resources: Global food supply chain losses and their impacts on freshwater, cropland, and fertiliser use. Sci. Total Environ. 2012, 4438, 477–489. [Google Scholar] [CrossRef] [PubMed]
- MAGRAMA. Spanish Strategy “More Food, Less Waste”; Program to Reduce Food Loss and Waste and Maximize the Value of Discarded Food; MAGRAMA: Madrid, Spain, 2013. [Google Scholar]
- Corrado, S.; Sala, S. Food waste accounting along global and European food supply chains: State of the art and outlook. Waste Manag. 2018, 79, 120–131. [Google Scholar] [CrossRef] [PubMed]
- Infante-Amate, J.; Aguilera, E.; González de Molina, M. La gran Transformación del Sector Agroalimentario Español, Un Análisis Desde la Perspectiva Energética (1960–2010); Working Papers Sociedad Española de Historia Agraria: Santiago de Compostela, Spain, 2014. [Google Scholar]
- Canning, P.; Charles, A.; Huang, S.; Polenske, K.R. Water and Energy Use in the U.S. Food System; U.S. Department of Agriculture, Economic Research Service: Washington, D.C., USA, 2010. [Google Scholar]
- United Nations. The Sustainable Development Goals Report; United Nations: New York, NY, USA, 2018. [Google Scholar]
- European Commission. Communication from the Commission to the European Parliament, the Council, the European Economic and Social Committee and the Committee of the Regions. The Role of Waste-to-Energy in the Circular Economy; European Commission: Brussels, Belgium, 2017. [Google Scholar]
- Papargyropoulou, E.; Lozano, R.; Steinberger, J.K.; Wright, N.; Bin Ujang, Z. The food waste hierarchy as a framework for the management of food surplus and foodwaste. J. Clean. Prod. 2014, 76, 106–115. [Google Scholar] [CrossRef]
- Cristobal, J.; Castellan, V.; Manfredi, S.; Sala, S. Prioritizing and optimizing sustainable measures for food waste prevention and management. Waste Manag. 2018, 72, 3–16. [Google Scholar] [CrossRef] [PubMed]
- ISO 14040 Environmental Management—Life Cycle Assessment—Principles and Framework; ISO: Geneva, Switzerland, 2006.
- ISO 14044 Environmental Management—Life Cycle Assessment—Requirements and Guidelines; ISO: Geneva, Switzerland, 2006.
- Gustavsson, J.; Cederberg, C.; Sonesson, U.; Emanuelsson, A. The Methodology of the FAO Study: “Global Food Losses and Food Waste–Extent, Causes and Prevention”—FAO, 2011; The Swedish Institute for Food and Biotechnology (SIK): Göteborg, Sweden, 2013. [Google Scholar]
- FAO. Save Food: Global Initiative on Food Loss and Waste Reduction. Definitional Framework of Food Loss; Working Paper; FAO: Rome, Italy, 2014. [Google Scholar]
- Margallo, M.; Aldaco, R.; Irabien, A.; Carrillo, V.; Fischer, M.; Bala, A.; Fullana, P. Life cycle assessment modelling of waste-to-energy incineration in Spain and Portugal. Waste Manag. Res. 2014, 32, 492–499. [Google Scholar] [CrossRef] [PubMed]
- Manfredi, S.; Cristobal, J. Towards more sustainable management of European food waste: Methodological approach and numerical application. Waste Manag. Res. 2016, 34, 957–968. [Google Scholar] [CrossRef] [PubMed]
- Righi, S.; Oliviero, L.; Pedrini, M.; Buscaroli, A.; Della-Casa, C. Life Cycle Assessment of management systems for sewage sludge and food waste: Centralized and decentralized approaches. J. Clean. Prod. 2013, 44, 8–17. [Google Scholar] [CrossRef]
- Thinkstep. Gabi 6 Software and Database on Life Cycle Assessment; Thinkstep: Leinfelden-Echterdingen, Germany, 2017. [Google Scholar]
- Ministry of Agriculture, Fishery, Food and Enviroment, MAPAMA. Informes de Consumo de Alimentación en España; MAGRAMA: Madrid, Spain, 2015. [Google Scholar]
- Instituto de Diversificación y Ahorro de Energía (IDAE). Memoria Annual; IDAE: Sevilla, Spain, 2015. [Google Scholar]
- Asociación Española de Industriales de Plásticos (ANAIP). La Plasticultura en España; ANAIP: Madrid, Spain, 2015. [Google Scholar]
- Spanish Association of Pulp, Paper and Cardboard Manufacturers. Available online: http://www.aspapel.es/ (accessed on 5 July 2018).
- INFOPACK. Packaging and Industrial Labelling Magazine. Available online: http://www.infopack.es/es (accessed on 4 July 2018).
- DataComex. Spanish Statistics on International Trade. Available online: http://datacomex.comercio.es/ (accessed on 5 July 2018).
- Bedca Database. Spanish Food Composition Database. Available online: http://www.bedca.net/ (accessed on 15 June 2018).
- USDA Food Composition Databasesp; USDA: Washington DC, USA, 2018.
- Vinyes, E.; Asin, L.; Alegre, S.; Muñoz, P.; Boschmonart, J.; Gasol, C.M. Life Cycle Assessment of apple and peach production, distribution and consumption in Mediterranean fruit sector. J. Clean. Prod. 2017, 149, 313–320. [Google Scholar] [CrossRef]
- Roibás, L.; Elbehri, A.; Hospido, A. Carbon footprint along the Ecuadorian banana supply chain: Methodological improvements and calculation tool. J. Clean. Prod. 2016, 112, 2441–2451. [Google Scholar] [CrossRef]
- Laso, J.; Hoehn, D.; Margallo, M.; García-Herrero, I.; Batlle-Bayer, L.; Bala, A.; Fullana-i-Palmer, P.; Vázquez-Rowe, I.; Irabien, A.; Aldaco, R. Assessing Energy and Environmental Efficiency of the Spanish Agri-Food System Using the LCA/DEA Methodology. Energies 2018, 11, 3395. [Google Scholar] [CrossRef]
- Eriksson, M.; Strid, I.; Hansson, P. Carbon footprint of food waste management options in the waste hierarchy—A Swedish case study. J. Clean. Prod. 2015, 93, 115–125. [Google Scholar] [CrossRef]
- Carlsson, M.; Uldal, M. Substrathandbok för Biogasproduktion [Substrate Handbook for Biogas Production]; Rapport SGC 200; Svenskt Gastekniskt Center: Malmö, Swedish, 2009. [Google Scholar]
- Padeyanda, Y.; Jang, Y.-C.; Ko, Y.; Yi, S. Evaluation of environmental impacts of food waste management by material flow analysis (MFA) and life cycle assessment (LCA). Mater. Cycles Waste Manag. 2016, 18, 493–508. [Google Scholar] [CrossRef]
- Pelletier, N.; Audsley, E.; Brodt, S.; Garnett, T.; Henriksson, P.; Kendall, A.; Krammer, K.J.; Murphy, D.; Nemecek, T.; Troell, M. Energy Intensity of Agriculture and Food Systems. Annu. Rev. Environ. Resour. 2011, 36, 223–246. [Google Scholar] [CrossRef]
- Popkin, B.M. Reducing Meat Consumption Has Multiple Benefits for the World’s Health. Arch. Intern. Med. 2009, 169, 543. [Google Scholar] [CrossRef] [PubMed]
- Berners-Lee, M.; Hoolohan, C.; Cammack, H.; Hewitt, C.N. The relative greenhouse gas impacts of realistic dietary choices. Energy Policy 2012, 43, 184–190. [Google Scholar] [CrossRef]
- David, A.; Govil, T.; Kumar, T.A.; McGeary, J.; Farrar, K.; Kumar, S.R. Thermophilic Anaerobic Digestion: Enhanced and Sustainable Methane Production from Co-Digestion of Food and Lignocellulosic Wastes. Energies 2018, 11, 2058. [Google Scholar] [CrossRef]
- Wang, J. Decentralized biogas technology of anaerobic digestion and farm ecosystem: Opportunities and challenges. Front. Energy Res. 2014, 2, 10. [Google Scholar] [CrossRef]
- Arushanyan, Y.; Björklund, A.; Eriksson, O.; Finnveden, O.; Söderman, M.L.; Sundqvist, J.O.; Stenmarck, A. Environmental Assessment of Possible Future Waste Management Scenarios. Energies 2017, 10, 247. [Google Scholar] [CrossRef]
- Kibbler, K.; Reinhart, D.; Hawkins, C.; Motlagh, A.; Wright, J. Food waste and the food-energy-water nexus: A review of food waste management alternatives. Waste Manag. 2018, 74, 52–62. [Google Scholar] [CrossRef] [PubMed]
- Bernstad, A.; La Cour, J. Review of comparative LCAs of food waste management systems—Current status and potential improvements. Waste Manag. 2012, 32, 2439–2455. [Google Scholar] [CrossRef] [PubMed]
- De Souza, G.C.; Rodrigues da Silva, M.D.; Gonçalves, S.E. Construction of Biodigesters to Optimize the Production of Biogas from Anaerobic Co-Digestion of Food Waste and Sewage. Energies 2018, 11, 870. [Google Scholar]
- Raha, D.; Mahanta, P.; Clarke, M.L. The implementation of decentralised biogas plants in Assam, NE India: The impact and effectiveness of the Nationa Biogas and Manure Management Programme. Energy Policy 2014, 68, 80–91. [Google Scholar] [CrossRef]
- Kelebe, H.E.; Olorunnisola, A. Biogas as an alternative energy source and a waste management strategy in Northern Ethiopia. Biofuels 2016, 7, 479–487. [Google Scholar] [CrossRef]
- Girotto, F.; Peng, W.; Rafieenia, R.; Cossu, R. Effect of Aeration Applied During Different Phases of Anaerobic Digestion. Waste Biomass Valoriz. 2016, 9, 161–174. [Google Scholar] [CrossRef]
- De Laurentiis, V.; Corrado, S.; Sala, S. Quantifying household waste of fresh fruit and vegetables in the EU. Waste Manag. 2018, 77, 238–251. [Google Scholar] [CrossRef] [PubMed]
- Lundie, S.; Peters, G.M. Life cycle assessment of food waste management options. J. Clean. Prod. 2005, 13, 275–286. [Google Scholar] [CrossRef]
- Walker, M.; Theaker, H.; Yaman, R.; Poggio, D.; Nimmo, W.; Bywater, A.; Blanch, G.; Pourkashanian, M. Assessment of micro-scale anaerobic digestion for management of urban organic waste: A case study in London, UK. Waste Manag. 2017, 61, 258–268. [Google Scholar] [CrossRef] [PubMed]
- Latouche, S. Le pari de la Décroissance; Fayard: Paris, France, 2006. [Google Scholar]
- European Commission. Communication from the Commission to the European Parliament, the Council, the European Economic and Social Committee and the Committee of the Regions. Closing the Loop—An EU Action Plan for the Circular Economy; COM (2015) 614 Final; European Commission: Brussels, Belgium, 2015. [Google Scholar]
- European Commission. Communication from the Commission to the European Parliament, the Council, the European Economic and Social Committee, and the Committee of the Regions. Innovating for Sustainable Growth: A Bioeconomy for Europe; COM (2012) 60 Final; European Commission: Brussels, Belgium, 2012. [Google Scholar]


| Food Category | PED (kJ/cap/day) | Energy Provided to Consumer (kJ/cap/day) | EROI (%) |
|---|---|---|---|
| Eggs | 5426 | 574 | 10.6 |
| Meat | 28,002 | 1901 | 6.8 |
| Fish and seafood | 16,243 | 209 | 1.3 |
| Dairy | 7230 | 938 | 13.0 |
| Cereals | 13,922 | 3827 | 27.5 |
| Sweets | 799 | 490 | 61.3 |
| Pulses | 2511 | 226 | 9.0 |
| Vegetable oils | 3674 | 2202 | 60.0 |
| Vegetables | 16,894 | 268 | 1.6 |
| Fruits | 3535 | 540 | 15.3 |
| Roots | 1691 | 318 | 18.8 |
| Total | 99,926 | 11,493 | 11.5 |
| Food Category | FEL | EEL | ||
|---|---|---|---|---|
| (kJ/cap/day) | (%) | (kJ/cap/day) | (%) | |
| Eggs | 113 | 2 | 521 | 3 |
| Meat | 553 | 11 | 4027 | 26 |
| Fish and seafood | 80 | 2 | 2650 | 17 |
| Dairy | 126 | 3 | 510 | 4 |
| Cereals | 2386 | 46 | 3259 | 21 |
| Sweets | 398 | 8 | 159 | 1 |
| Pulses | 96 | 2 | 421 | 3 |
| Vegetable oils | 687 | 13 | 233 | 2 |
| Vegetables | 176 | 3 | 3143 | 20 |
| Fruits | 381 | 7 | 661 | 4 |
| Roots | 155 | 3 | 331 | 2 |
| Total | 5151 | 100 | 15,915 | 100 |
© 2019 by the authors. Licensee MDPI, Basel, Switzerland. This article is an open access article distributed under the terms and conditions of the Creative Commons Attribution (CC BY) license (http://creativecommons.org/licenses/by/4.0/).
Share and Cite
Hoehn, D.; Margallo, M.; Laso, J.; García-Herrero, I.; Bala, A.; Fullana-i-Palmer, P.; Irabien, A.; Aldaco, R. Energy Embedded in Food Loss Management and in the Production of Uneaten Food: Seeking a Sustainable Pathway. Energies 2019, 12, 767. https://0-doi-org.brum.beds.ac.uk/10.3390/en12040767
Hoehn D, Margallo M, Laso J, García-Herrero I, Bala A, Fullana-i-Palmer P, Irabien A, Aldaco R. Energy Embedded in Food Loss Management and in the Production of Uneaten Food: Seeking a Sustainable Pathway. Energies. 2019; 12(4):767. https://0-doi-org.brum.beds.ac.uk/10.3390/en12040767
Chicago/Turabian StyleHoehn, Daniel, María Margallo, Jara Laso, Isabel García-Herrero, Alba Bala, Pere Fullana-i-Palmer, Angel Irabien, and Rubén Aldaco. 2019. "Energy Embedded in Food Loss Management and in the Production of Uneaten Food: Seeking a Sustainable Pathway" Energies 12, no. 4: 767. https://0-doi-org.brum.beds.ac.uk/10.3390/en12040767