Article

Development and Field Demonstration of a Gamified Residential Demand Management Platform Compatible with Smart Meters and Building Automation Systems

1
Department of Electrical Engineering, Istanbul Technical University, 34469 Istanbul, Turkey
2
R&D Division, MAKEL Companies Group, 34522 Istanbul, Turkey
3
Centre for Power and Energy Systems (CPES), INESC TEC, 4200-465 Porto, Portugal
*
Author to whom correspondence should be addressed.
Submission received: 21 February 2019 / Revised: 4 March 2019 / Accepted: 6 March 2019 / Published: 8 March 2019
(This article belongs to the Section A1: Smart Grids and Microgrids)

Abstract

:
Demand management is becoming an indispensable part of grid operation with its potential to aid supply/demand balancing, reduce peaks, mitigate congestions and improve voltage profiles in the grid. Effective deployments require a huge number of reliable participators who are aware of the flexibilities of their devices and who continuously seek to achieve savings and earnings. In such applications, smart meters can ease consumption behavior visibility, while building automation systems can enable the remote and automated control of flexible loads. Moreover, gamification techniques can be used to motivate and direct customers, evaluate their performance, and improve their awareness and knowledge in the long term. This study focuses on the design and field demonstration of a flexible device-oriented, smart meter and building automation system (BAS) compatible with a gamified load management (LM) platform for residential customers. The system is designed, based on exploratory surveys and systematic gamification approaches, to motivate the customers to reduce their peak period consumption and overall energy consumption through competing or collaborating with others, and improving upon their past performance. This paper presents the design, development and implementation stages, together with the result analysis of an eight month field demonstration in four houses with different user types in Istanbul, Turkey.

1. Introduction

Utility operators tend to prefer load management (LM) in grid operation, mainly because of arising power system challenges with increasing occurrence rate and severity. The market penetration of renewables (causing changes in daily net load curves), expanding use of EVs, continuous increase in peak demand, and rising concerns about carbon emissions, have made demand management a noteworthy alternative to high cost peaking plants and the periodical avoidance of renewables. In the US, according to 2016 sectoral statistics, demand response (DR) programs saved more than 1.3 million MWh of energy, reduced peaks by 11 GW, reached 9 million customers (87% of whom are residential) and provided around $1 billion in incentives [1]. The highest amount of energy savings was achieved by residential participators (1 million MWh).
Unlike conventional grid service providers, LM is not the primary objective of flexible device owners and participation is mostly voluntary. The main goals and expectations in demand management programs from the perspective of program managers are to reach high participation rates, have experienced, reliable and long-term participators and to evaluate participator performance in detail. On the other hand, from the standpoint of customers, financial and social motivators, the preservation of comfort, and personalized offers come to the fore. There are currently 10 demand response (DR) program types, consisting of time-based and incentive-based options [2]. Even though programs offer profitable rates, customers may not participate as much as expected. A survey conducted in 2010 with 9108 individuals from seventeen countries indicates that 28% have information about the programs and only 9% have enrolled [3]. Furthermore, 14% (in Netherlands) to 43% (in Sweden) of the respondents do not understand enough the actions that can be taken to optimize their electricity consumption. A countrywide survey study in Turkey revealed that 72% of people using a time of use (ToU) tariff do not change their consumption habits in response to different pricing rates [4]. Therefore, there is need for research and development regarding demand management platforms, which will provide financial opportunities together with social motivators, aiming to improve awareness about sustainable management performance over time [5]. Gamification is one of the promising approaches that can be used for these purposes.
Gamification is the concept of using game elements and game design techniques in non-game environments. The major aims of gamification are to foster engagement, maintain loyalty, improve awareness and promote behavioral change. There are numerous adoptable game elements such as dynamics, mechanics and components in different applications. On the contrary, there are real-world conditions (in terms of time, rewards, actions, rules) that limit gamification processes. Gamification has received increasing attention from several sectors to attain initially extrinsic; but in the long-term intrinsic motivation. It is preferred not only for digital services and products, but also for education, banking, healthcare services and engineering.
There is an increasing number of inspiring studies in the literature and examples in the field about customer-friendly LM platforms. These works can be categorized into five types and sorted in order from research to application. These categories include increasing visibility through user interfaces without gamification [6], integration of fundamental gamification elements [7], gaming-dominant studies tied with smart meter data [8], pilot demonstration projects [9] and sectoral gamified examples with continuous incentives [10]. The current studies have a number of gaps to be investigated. While the studies on increasing consumption visibility without gamification do not proactively motivate consumers to change their behavior, works on the integration of fundamental gamification elements usually have short field trials. Moreover, gaming-dominant studies that integrate smart meter data generally have the drawbacks of focusing on overall consumption reduction and not seeking sustainable game participation. Besides, most of the scientific demonstration activities do not provide manual or automated control of flexible devices in the field through their game. Additionally, sectoral examples usually do not publish the methodologies and approaches that they use during development and performance evaluation procedures. In addition, in a large group of the related works, the organized events have the same length (such as monthly or hourly), therefore further research is needed to explore the customer acceptance of different event durations.
This study aims to contribute to this steadily growing area of research by:
  • investigating the implementation of device-specific goals with different durations (the fulfillment of which can also be automatically evaluated by the developed platform) to promote behavioral changes;
  • exploring progressive LM complexity in different levels of the gamified user platform;
  • integrating both manual and automated flexible device control options into gamified application;
  • seeking continuous user participation in the long term;
  • providing details of the gamified platform development methodology based on systematic gamification approaches rather than a deterministic implementation;
  • utilizing comprehensive indicators for performance evaluation;
  • field testing of the developed solutions in four residential buildings with twelve customers for an eight month period.
Section 2 presents some of the related works and identifies the contributions of this study. The third section of the paper explains the development process, while the fourth section includes a field demonstration with post-deployment updates and an analysis of results. The last section concludes the paper by discussing the main findings and providing implications for future research.

2. Related Work

There are numerous studies on the gamification of energy consumption management in buildings published in recent years.
A gaming dominant study with real-world meter data integration was presented in [11]. Apart from other works, this study explored several game modes based on individual play as well as competition and resource management. Impacts were analysed using overall energy consumption changes (considering the impact of outside temperature) and interviews.
A distinctive study can be found in [12], presenting a mobile application to reduce energy and heat consumption through team competition and detailed task assignment. Field demonstration results were analysed based on the overall changes in electricity and heat consumption data in addition to interviews with participants.
A noteworthy study is [13], in which the development of the gamified system was linked to motivation methodologies. Feedback, prizes, ranking, teams and a digital game with building blocks were provided as components. Participants received buildings blocks in an online game, based on their savings in the real world. However, impact analysis of the study was highly dependent on surveys, as customers individually reported what they had done to save energy.
Another important study in this area can be found in [7], which focused on achieving additional incentives by increasing demand flexibility (demand shifting to different time periods), in addition to energy consumption reduction. Rescheduling options with different flexibilities were awarded by different points, providing a social comparison with other users and offering several levels. As a drawback compared to other studies, only the user-friendliness of the system was tested with twelve experimental users.
The study presented in [14] implemented numerous gamification elements (feedback, tasks, points, lottery and levels) to reduce overall electricity consumption and increase awareness in a student hall. Due to field implementation challenges, overall energy consumption in some building sections was monitored. The gamified application was used for three weeks and impact evaluation was done through surveys. Design and development stages were not explained in detail and links to related methodologies and approaches were not clearly described.
A study for residential energy conservation was presented in [15], including feedback, tasks and teams. Overall energy consumption was monitored in several houses during system demonstration for thirteen weeks. The energy consumption of active users of the platform was compared with their historical data. However, impact analysis was mainly based on overall energy consumption without device-level breakdown.
The work in [16] contributed to the area of study by using smart plugs for appliance-level consumption data collection and providing remote on/off control over the gamified system, aiming to reduce consumption in a commercial building. Points, rewards and competition were used as gamification elements in an eight-week-long field trial following a four-week-long baseline monitoring phase. Detailed appliance level consumption comparisons were made to highlight relative savings. On the other hand, the role of adopted gamification elements on savings was not quantitatively discussed in details using the consumption data and platform usage records.
A summary of the related works is provided in Table 1. The related works mainly targeted consumption savings in houses, except [7] in which demand flexibilities are aimed to be improved in order to achieve financial incentives. Dominantly overall consumption of the whole building or a building section is monitored, while device-level consumption monitoring is conceptually studied in [7] and demonstrated in the field in [16]. The longest trial period was thirteen weeks in [15], while in most of the other works it did not exceed one month. A few gamification elements were used per study and impact analysis did not go beyond interviews, surveys and consumption comparisons. Moreover, design and development stages were not described in detail with adopted gamification methodologies.
Starting from 2017, some review papers have been published providing a general overview, categorizing the related works and highlighting their main gaps.
A review of twenty-five studies was presented in [17], dividing gamification-based studies into two categories as digital game world dominant examples with some integration with the real world and games that are fully integrated in the real world. The same study stated that most of the papers have “poorly described methodologies” and a “limited use of validated measures to quantify outcomes”.
The review in [18] with ten reviewed studies pointed out that most of the studies focused on usability and game structure without any evaluation, while several studies relied on self-reported data and interviews, making it challenging to clearly evaluate the impacts of gamified solutions. It was also indicated that an integration of sensors and meters can allow non-invasive data collection. Advantages of using several meters and high resolution data (30 s) collection were presented with a campus-wide field application in [19] identifying day, night and random peaks of several buildings. In [20], energy consumption data was contextually separated and abnormal consumption behaviors were detected using heuristics.
Our study addresses the gaps identified in [17,18] by explaining the systematic development of a fully real world integrated gamified platform in detail with the adopted methodologies. Moreover, detailed analysis is conducted using several measures, collected through device-level meters with high resolution (5 min), building automation system sensors (event-triggered instant data transfer and recording) and platform integrated digital activity logs (event-triggered instant data recording) to quantify the outcomes.
Another review study [21], categorized game elements for residential energy application as information provision (statistics, messages, tip), rewarding system (bill discounts, virtual currency, prizes), social connection (competition, collaboration, community), user interface (dashboard, leaderboard, progress bar, message box, notification, degree of control) and performance status (points, badges, levels). According to their review, only five out of nineteen studies used elements from all the categories. A similar gap was pointed out by the critical review study in [22] with fifty seven mobile applications. The study emphasized that an average of 2.1 out of 10 potential gamification components were used (badges and rewards are preferred in only 4% of the studies) and only one study included all the determined thirteen behavior constructs linked to six energy-related behavior theories (Utility Maximization, Behavioral Economics, Diffusion of Innovation, Cognitive Dissonance Theory, Theory of Planned Behavior and Value, Belief, Norm Theory). The authors stated that the more sophisticated elements of game design can be used for more engagement and intrinsic motivation.
Our study contributes to the literature by exploring device-level demand flexibilities, using a wide range of gamification elements, describing systematic gamified system development in detail with adopted methodologies, demonstrating in the field for sixteen weeks and quantitatively analysing impacts in details to highlight correlation between gamified platform usage and load management performance.

3. Gamified Residential Demand Management Platform Development

This section explains the development stage of the gamified platform under three subcategories, namely, determination of flexible device management options, evaluation of management potential and adaptation of gamification elements. This paper concentrates on the adaptation of gamification techniques into LM applications. Approaches preferred for visual representation of the platform to users are out of the scope of this study.

3.1. Determination of Flexible Device Management Options

LM options for flexible devices in residential buildings can be clustered into three main categories. These are thermostatically controlled load management options, programmable load management options, curtailable load management options.
Thermostatically controlled loads (TCLs), (refrigerators, air conditioners, etc.) are involved with keeping the temperature of a closed mass inside tolerable limits (deadband). There are two manually deployable management options that can be suggested to platform users. The first option, “temperature set point modification”, is mainly based on adjusting the set point of a TCL to a higher (for coolers) or a lower value (for heaters) to decrease the consumption during a whole event period. “Real-time interruption” is the second option, based on stopping the device or changing its temperature set point very temporarily, just for a couple of seconds to interrupt an ongoing active cooling or heating cycle and not consuming energy until device’s temperature reaches deadband limits again.
The devices that follow a predefined program during their active operation time to fulfill a specific task (washing machine, dishwasher, etc.) are categorized as programmable loads. They are usually expected to complete their assignment in a time period that is longer than the operation cycle and suitable for their users. There are five appropriate management options for this type of load: early on, delayed operation, temporary stopping, use of a different program and use of a lower setting.
The “early on” option aims to move a portion of consumption to an earlier time period. “Delayed operation” aims to shift the whole consumption to a later time range. Unlike the early on option, there is no risk of consumption crossing with the event period due to unexpected delays. “Temporary stopping” can be applied at suitable points of the operation cycle and with a duration that will not critically affect the fulfillment of the device purpose (washing, drying, etc.). Usually, interruption times (up to 15 min for washing machines and dishwashers, while up to 30 min for clothes dryers) are rather smaller than load management event times (usually one hour or more) and can only postpone a limited portion of consumption [23]. As a possible drawback, some devices may cause extra consumption after interruption. Another option, “use of a different program”, is based on selecting a program with lower consumption or lower demand peaks. “Use of a lower setting” as the last option, is the methodology of choosing a lower temperature for washing the dishes in a dishwasher or reducing the spinning speed of a washing machine, resulting in rather smaller, but still profitable changes in load profiles.
Curtailable loads in the scope of this study are lighting systems. Two options were considered for managing them: dimming and grouped switching. Dimming is used to reduce energy consumption in real-time without considerably affecting user comfort. Grouped switching involves switching off some of the lights and can be applied where several pieces of lighting equipment are placed homogeneously. However, it should be noted that using low energy-consuming LED lamps radically decreases the share of lighting in the total consumption. Nevertheless, some residential buildings have numerous lighting devices mainly in living rooms and corridors representing a considerable management potential. Therefore, consumption monitoring prior to system implementation is an important step to ensure that a solution with adequate functionality is deployed in the field.
Building automation systems allow users to control heating/cooling systems and lighting equipment remotely and automatically. The designed platform allows automatic control of these loads at scheduled times (peak periods) by getting user confirmation through the developed interface. If the users activate the automated dimming function, the system can dim the lights down to 70% at peak periods automatically every day. A 70% dimming level is a specified base reduction amount that can provide considerable savings in energy bills, while not significantly affecting users’ comfort. The users can also define their own dimming levels/temperature set points to achieve more savings. On the other hand, programmable loads can only be managed manually.
The options for each type of load are sorted according to their management benefits, considering operational characteristics and pricing tariff (ToU tariff for residential customers in Turkey) in the field (Table 2).
For programmable loads, the most profitable option for users is to run the devices during the cheapest period and later than the peak period (at night, from 22.00 to 06.00 the next day) of the day (delayed operation). The users, who do not prefer running the devices at late night hours, can run at a relatively less cheap period, earlier than the peak period (early operation). However, if the users are not willing to change the operation time, they can either use a shorter/less energy consuming washer/dryer program or choose lower settings (temperature or spinning speed). The last option is to temporarily stop an ongoing cycle for a tolerable time range. The options explained in this section do not necessarily have to be deployed individually. Instead, some of them can be combined to achieve higher management performance. Use of shorter programs and lower settings are options that can be combined with the others.
In the gamified platform, the demand management options are presented with brief descriptions to make customers get to know, choose among and implement any of them with their free will.

3.2. Evaluation of Demand Management Potential

Demand management potential of a building is calculated by considering the achievable predictable changes in the demand profile of flexible devices, in the case of successful deployment of the most suitable management options.
For thermostatically controlled loads, considering temperature sensor sensitivities of appliances in the market, it is assumed that their operation can be intervened after 1 °C of difference in the temperature of their thermal mass, shifting approximately half of an active operation cycle (heating for heaters and cooling for coolers) to an earlier period (normal pricing according to ToU tariff of Turkey) than peak period and shifting half of another active operation cycle to a later period (cheap pricing) with another intervention [25,26].
For programmable loads (dishwasher, washing machine and clothes dryer), management potential is calculated considering shifting peak period consumptions to the cheapest periods.
For curtailable loads, peak period consumptions are assumed to be curtailed up to 50% (the highest curtailment target given in the related tasks of the developed gamified platform).
The whole energy management potential (in kWh) of a house ( E p o t o v e r a l l ) with N flexible loads, can be calculated by taking the sum of each of the flexible-device based management potentials ( E p o t i ) as formulated in (1).
E p o t o v e r a l l = i = 1 N E p o t i
The percentage of management potential of a flexible device in the overall energy management potential of the whole house can also be represented using the formula given in (2) as a useful tool to show users which devices offer higher potential.
E p e r c e n t a g e o v e r a l l = E p o t i E p o t o v e r a l l × 100

3.3. Adaptation of Gamification Elements

Two widely known design frameworks were combined to have a suitable six-step approach for the LM platform [27,28]. The steps include the definition of objectives, determination of target behaviors, description of player goals, division of activity cycles, game economy and the deployment of appropriate tools.
Three main objectives were defined at the first stage, namely, to decrease the percentage of peak period energy consumptions in monthly total consumptions, to reduce monthly total energy consumption of a household, and to achieve savings in monthly energy bills.
The second stage is devoted to the determination of target behaviors to achieve the objectives defined in step one. The behaviors are determined as shifting peak period consumption to other periods, activation of automated control option (for devices that can be remotely controlled through the building automation system), regular checking of overall and flexible device-based consumption profiles and reading informative pages about related power system challenges and the impacts of LM. A commonly preferred behavioral model is considered for a gamified platform design to shape the content of the following steps [29]. Fogg’s behavior model defines a path from an existing behavior to a target behavior using three main factors: motivation, ability, and prompts (trigger). Each of these factors should reach sufficient levels to make a person take action. The core motivators are pleasure/pain (instant reactions), hope/fear (outcome expectations) and acceptance/rejection (social behavior). Abilities are factors such as time, money, physical effort, brain cycles (thinking effort), social deviance (difference from general rules of society) and non-routine (difference from routine jobs), which should be kept simple enough to make a person reach a target behavior. Finally, triggers are sparks (for people with low motivation, targeting a core motivation), facilitators (for people with high motivation, but low ability—simplifying a task) and signals (when there is both motivation and ability, just for reminding behavior change).
The third step is the description of player goals that will engage different types of player. There are two widely accepted related studies, one for categorizing game players and the other for gamified system users. Bartle [30] defined four main gamer types. “Achievers” seek for success and rewards, while “Explorers” want to discover new, unknown or rare things. “Socializers” are attracted by social interactions with other players rather than the game itself, while “Killers” enjoy competition and beating other players. Gamified system user types are further explored in another study, resulting in six user types [31]. Two of these types, “Socializer” and “Achiever”, are the same as the ones indicated in Bartle’s study. One of the other four, “Players”, like extrinsic rewards and expend effort to win them. “Philanthropists” are motivated by purpose without expecting a reward. “Free Spirits” like to express themselves, create and explore in game environment independently. The last type is “Disruptors”, who tend to make positive or negative changes in game environment as well as test and push system boundaries further. Gamification elements are also designed considering the core drives defined in the “Octalysis” framework for human motivation [32]. “Meaning” (feeling lucky, chosen, playing for a greater purpose), “Accomplishment” (progressing, skill development, overcoming challenges), “Empowerment” (engagement in creative processes with feedback and being asked for responding back) are categorized as “White Hat Gamification Core Drives” making users feel powerful and satisfied, feeling in control of their actions. Conversely, there are “Black Hat Gamification Core Drives” consisting of “Scarcity” (limited in number, open for specific groups), “Unpredictability” (not knowing what is going to happen next) and “Avoidance” (temporary opportunities, loss of progress). There are also “Ownership” (virtual goods, collection sets, avatar) and “Social Influence” (mentorship, acceptance, social interactions, groups). A gamification study may not include all the eight core drives, but it should implement the ones that are selected effectively.
An exploratory survey study is conducted with 309 individuals covering different demographic characteristics at different cities in Turkey, prior to development of the platform to observe expectations, preferences and concerns from a gamified demand management platform. Details of the study can be found in [4]. The survey is conducted mainly because of varying motivation factors based on demographic characteristics of the society and diversities due to cultural differences of countries. According to the results of the study, each proposed gamification option (consisting of teaming up with friends, consecutive participation rewarding, competition with friends, competition with individuals, leaderboards, side missions with additional points) has acceptance above 18% up to 41%. Most of the respondents selected more than one option. The same study showed that 45% can spare time weekly, while 40% prefer rare participation monthly and 15% can use the system everyday regularly.
Considering the mentioned player types, exploratory survey, gamification user types and motivators, the described player goals of the platform are reading daily tips, accomplishing daily-weekly and monthly individual tasks, accomplishing weekly-monthly team tasks in collaboration with other team members, earning points, competing with other players and teams through leaderboards, reaching higher levels, winning badges by completing achievements, reading monthly energy reports and using an internal messaging system. Some of the elements have interconnections, details of which are described in the following paragraphs.
Daily tips are used to inform the customers briefly about the gamified platform, management options and impacts of their energy consumption. The gamified LM platform has individual tasks, clustered under two groups, as LM related tasks and platform usage related tasks. Player skills and game challenges are aimed to be balanced in every stage of user experience. A highly skilled player facing a low level of challenge could become bored (not engaged); while an amateur player, dealing with difficult objectives may become exhausted and leave playing [33]. For this reason, the tasks are clustered according to their complexity under different levels. Initial tasks aim to introduce the main sections of the platform to the users, so as to make them familiar with the fundamentals. The tasks assigned at higher levels gradually get harder, relying on the development of player skills over time.
The developed gamified platform has four levels, which can be reached by accomplishing goals and earning points. Three of the levels (level 1, 2 and 4) are in accordance with the commonly accepted stages of user flow [34], namely on-boarding, habit building (scaffolding) and mastery. An additional level (the third level) is added, allowing the users to collaborate with others through teams and team tasks. As the users reach higher levels, more challenging tasks are included in the assignment pool offering more points. From the perspective of LM, the tasks related with the refrigerator thermostat set point control and whole house consumption are only assigned at higher levels due to their complexity. On the other hand, some repetitive simple tasks from lower levels are still assigned at higher levels to provide short periods of relaxation as indicated in [35]. A group of load management tasks take into account users’ past statistics to define consumption thresholds, directing users to dynamically compete with themselves. Points given for accomplishing individual tasks are named as “Green Leaves” to remind the environmental positive impact of energy management activities and more points are given for fulfilling harder tasks.
Teams have tasks with a similar content to individual tasks (about LM and platform usage). However, the targets of team tasks mostly require the contribution of more than one user. In order to evaluate and represent team success separately from individual tasks, a different point unit “golden leave” is used.
The platform has two leaderboards, one for individual success and one for team success. The individual success-based leaderboard relies on individual points (green leaves) earned from successfully completed individual tasks. On the other hand, the team success-based leaderboard is based on team points (golden leaves) earned from accomplished team tasks.
Apart from individual tasks and team tasks, certain achievement targets with no deadlines are defined. For targets with repetitive tasks, progression bars are used to show users the current status of achievement completion. The achievement targets are mainly for motivating explorer type users who seek to discover distinctive parts of the game. The users earn non-competitive memorials, named as badges, in return for completing achievements.
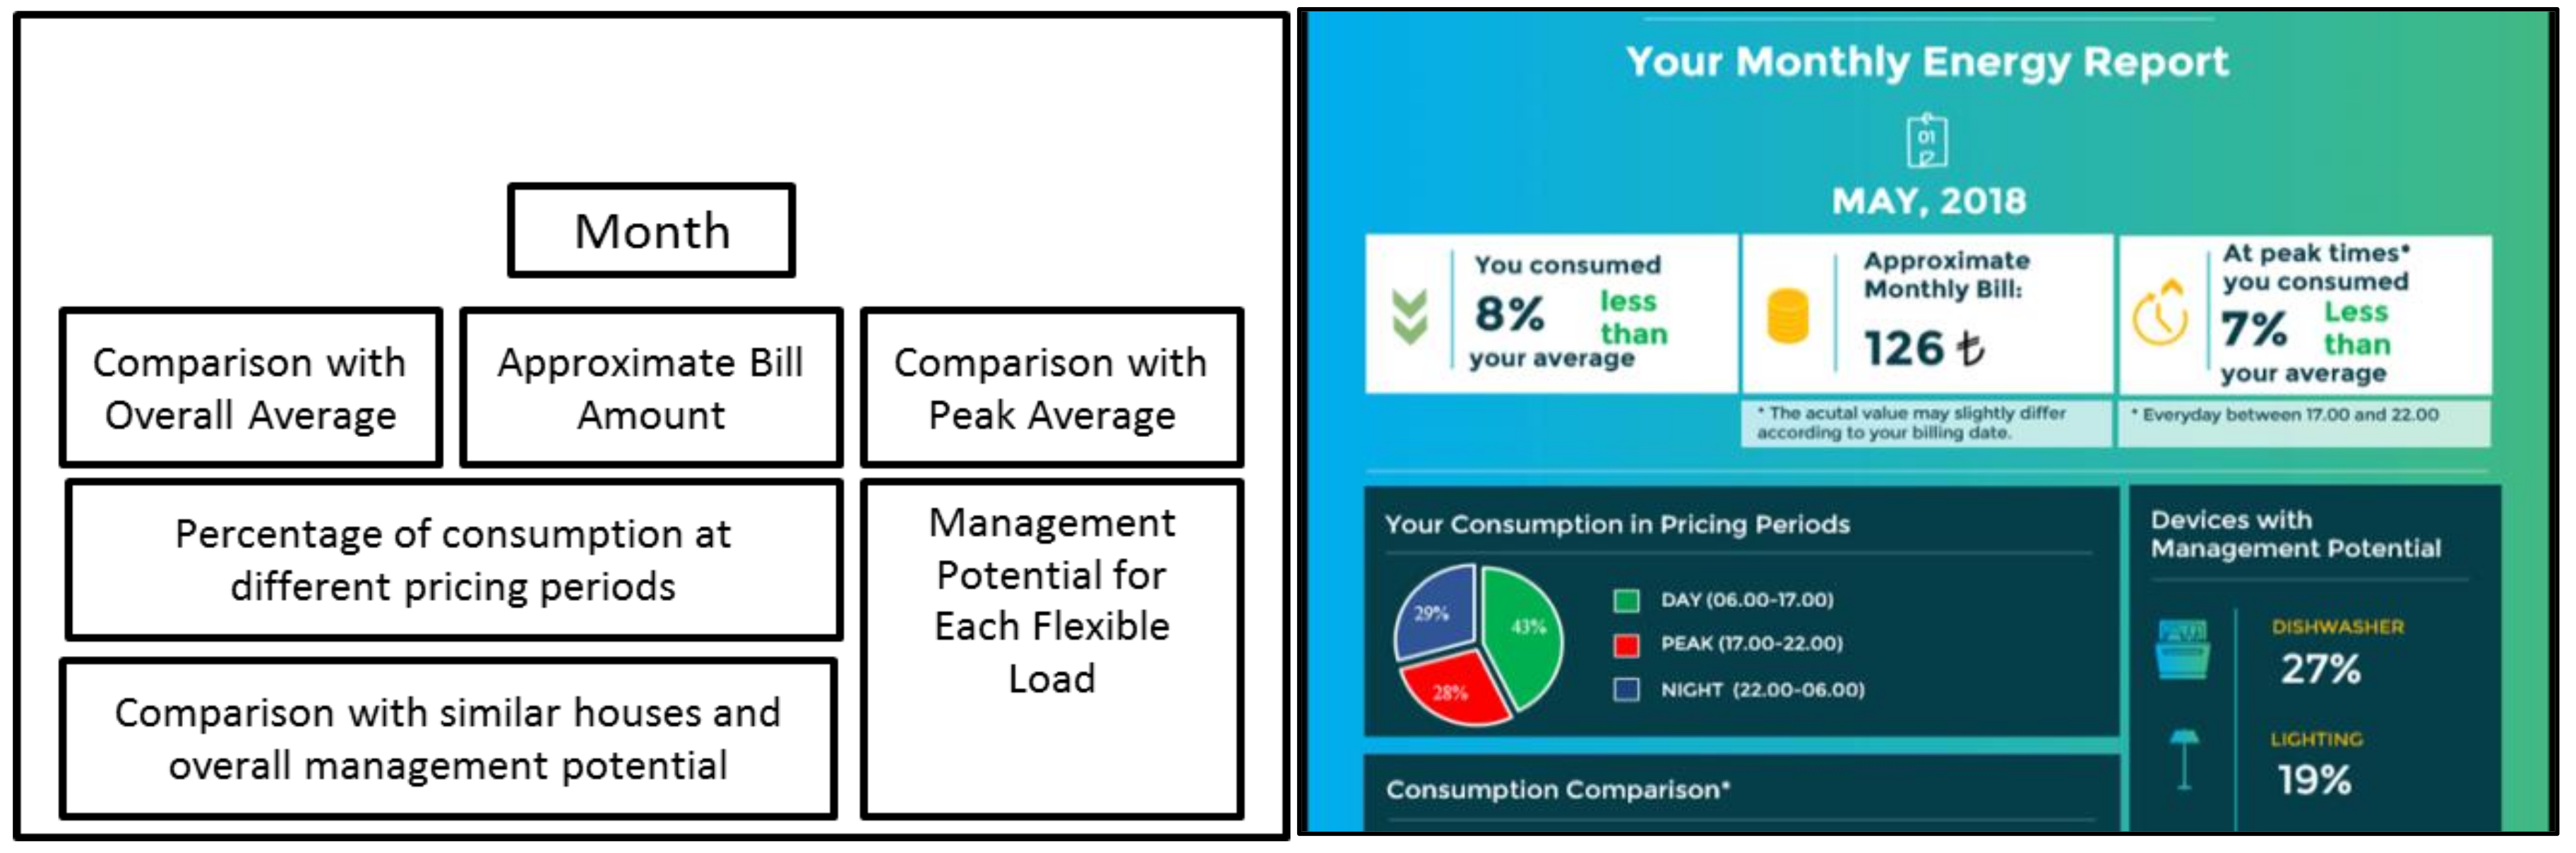
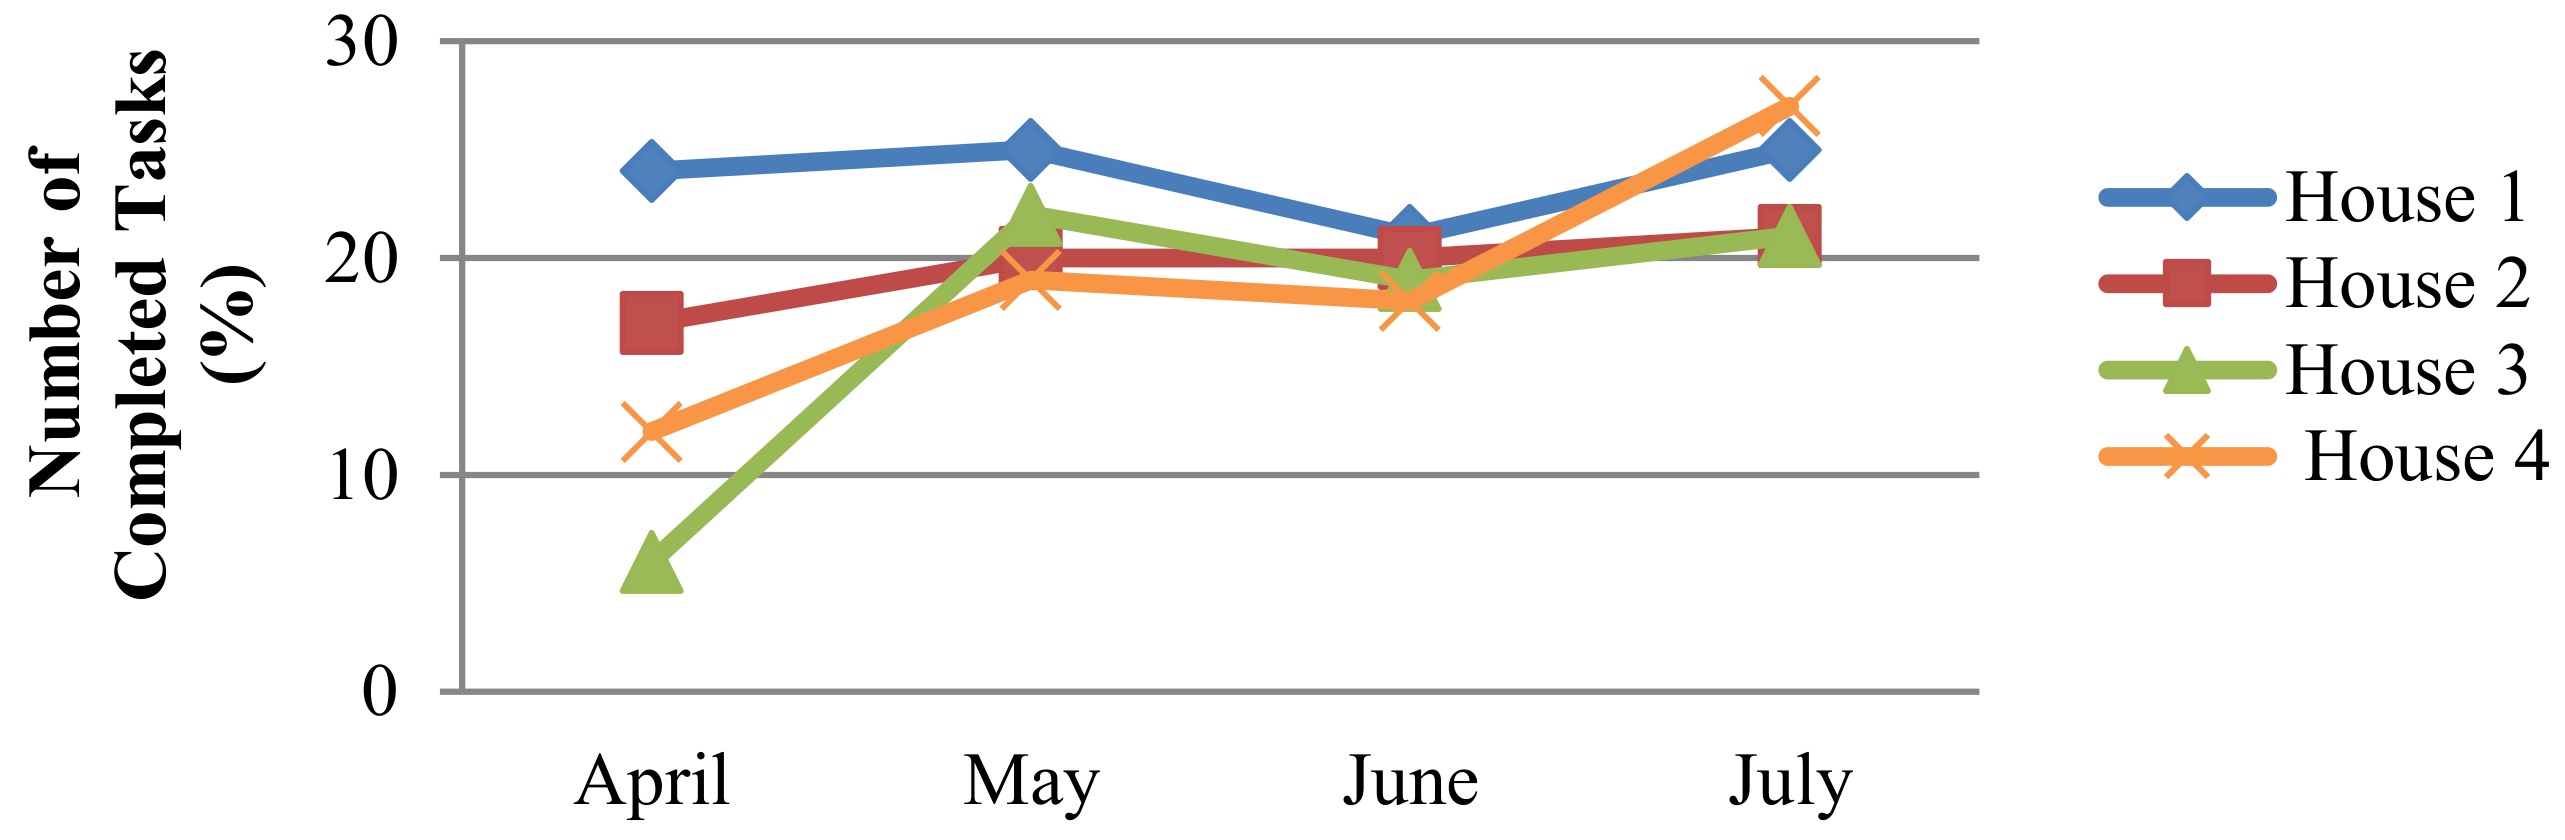
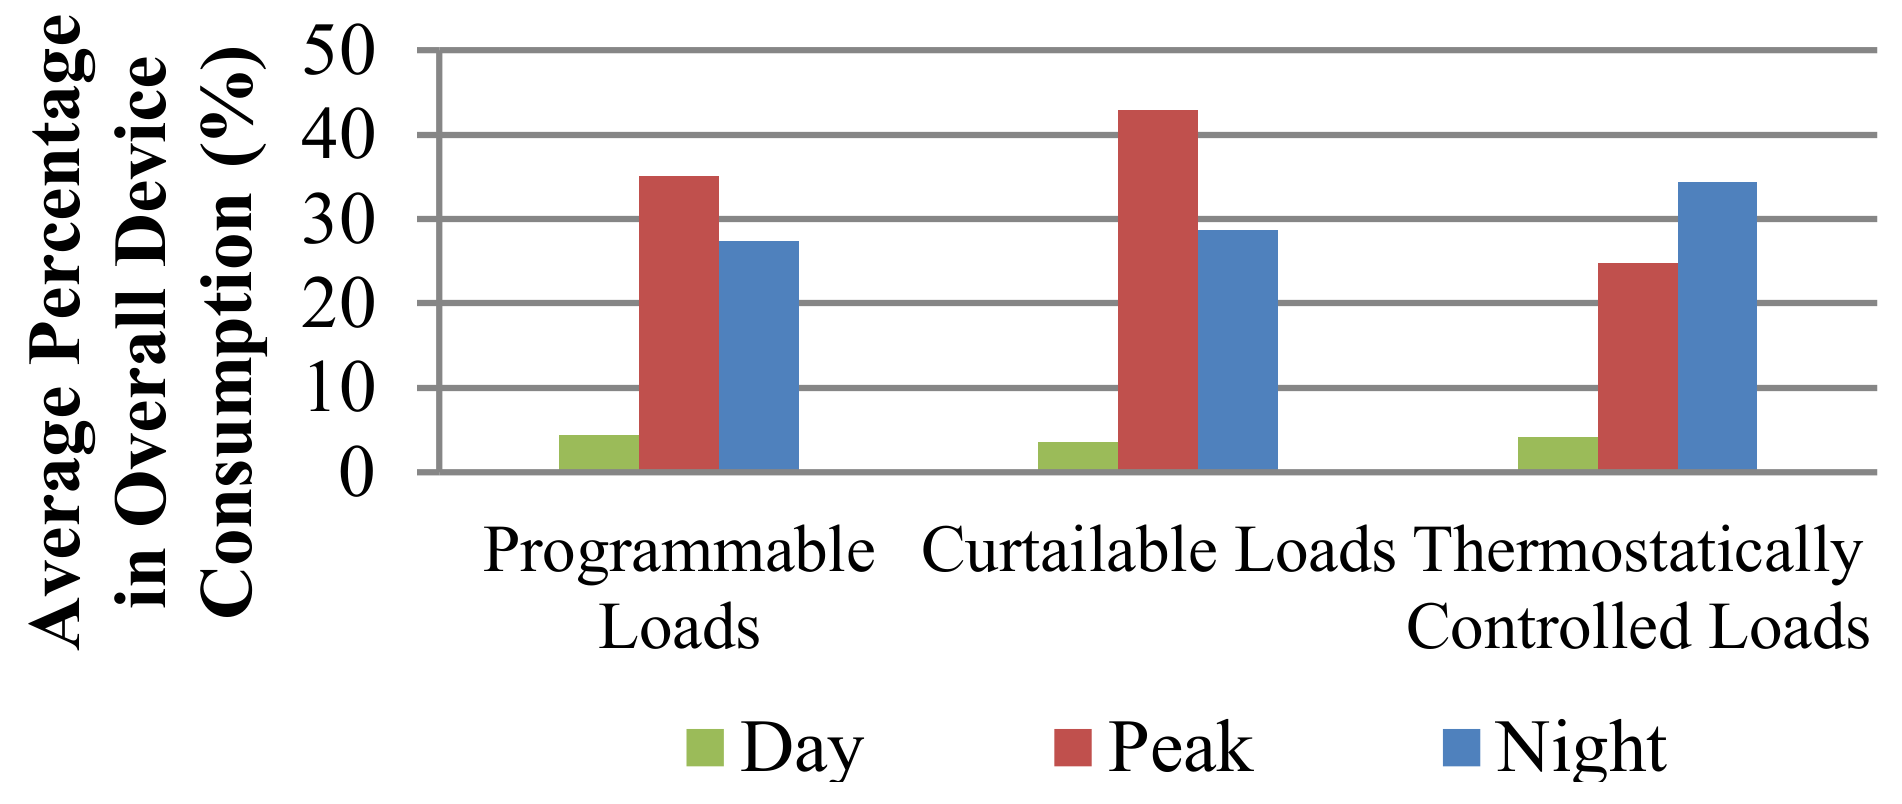
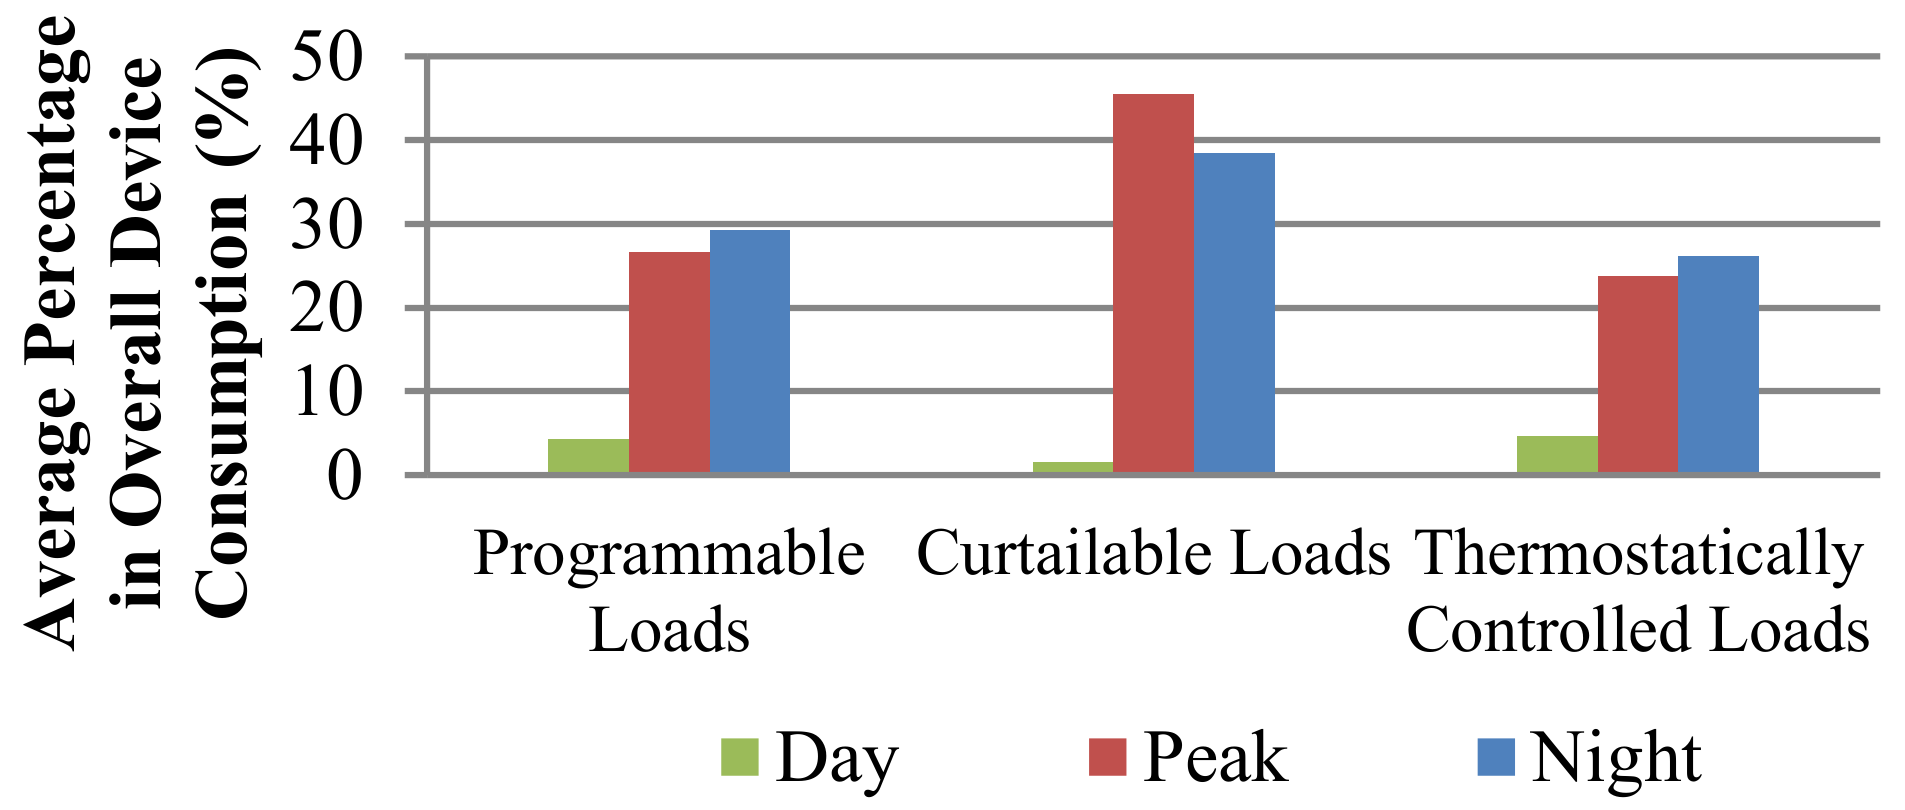
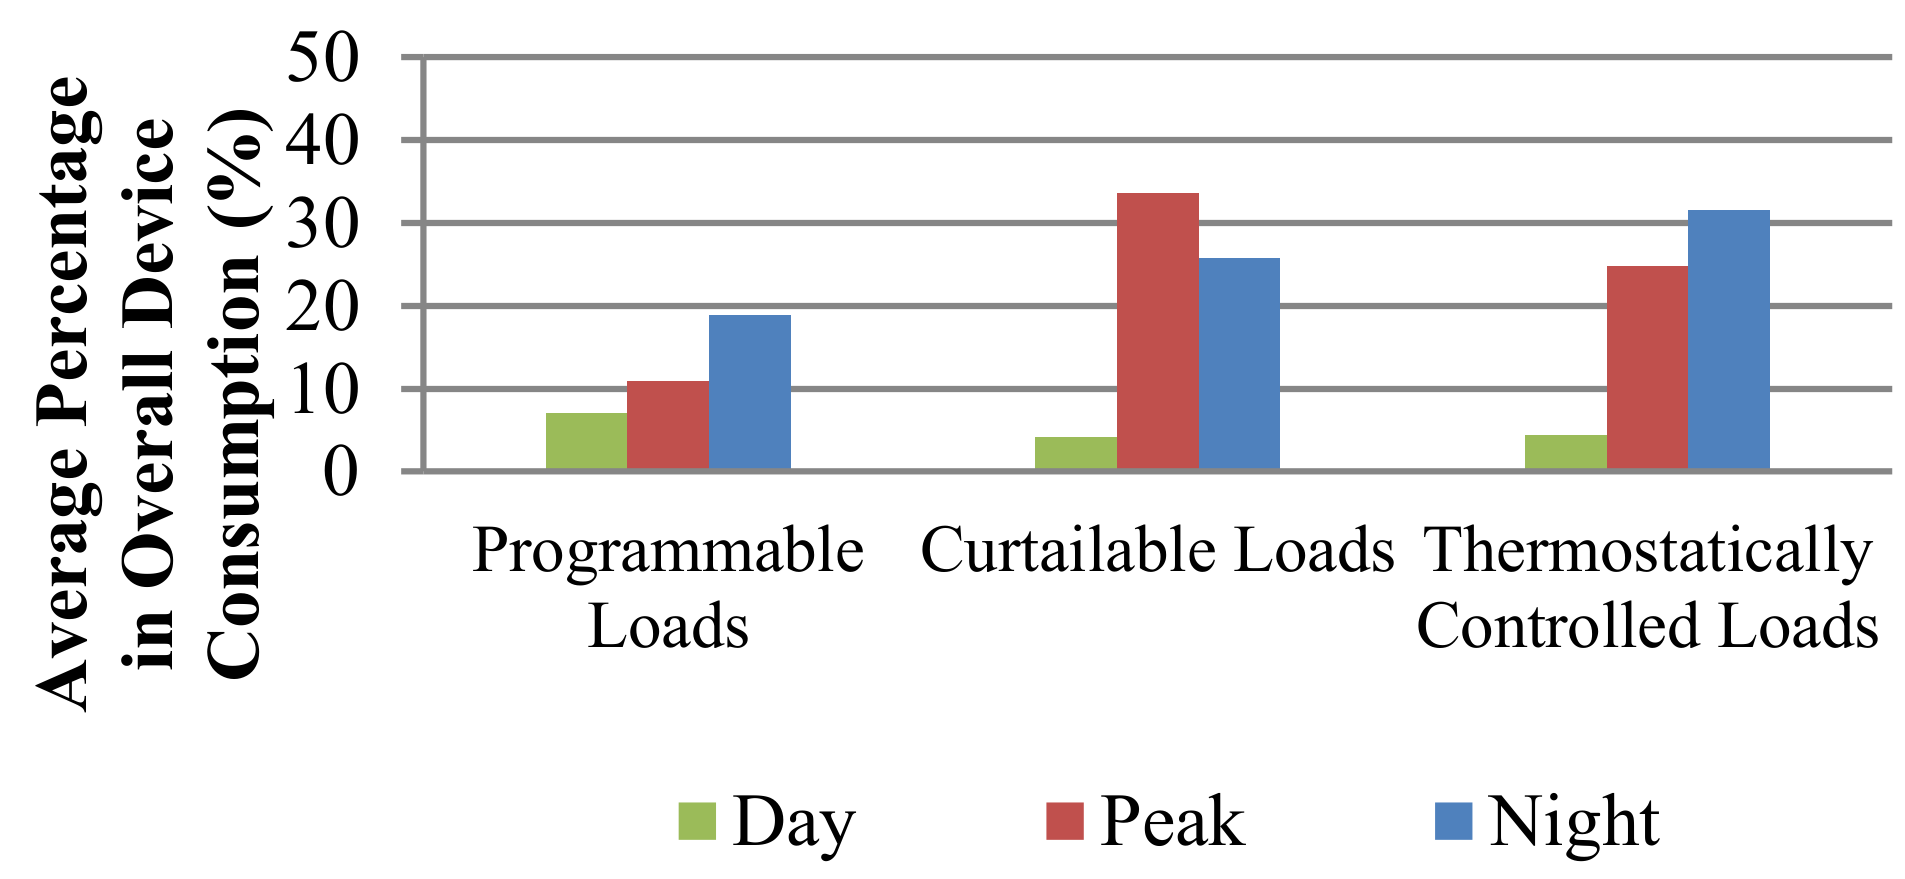
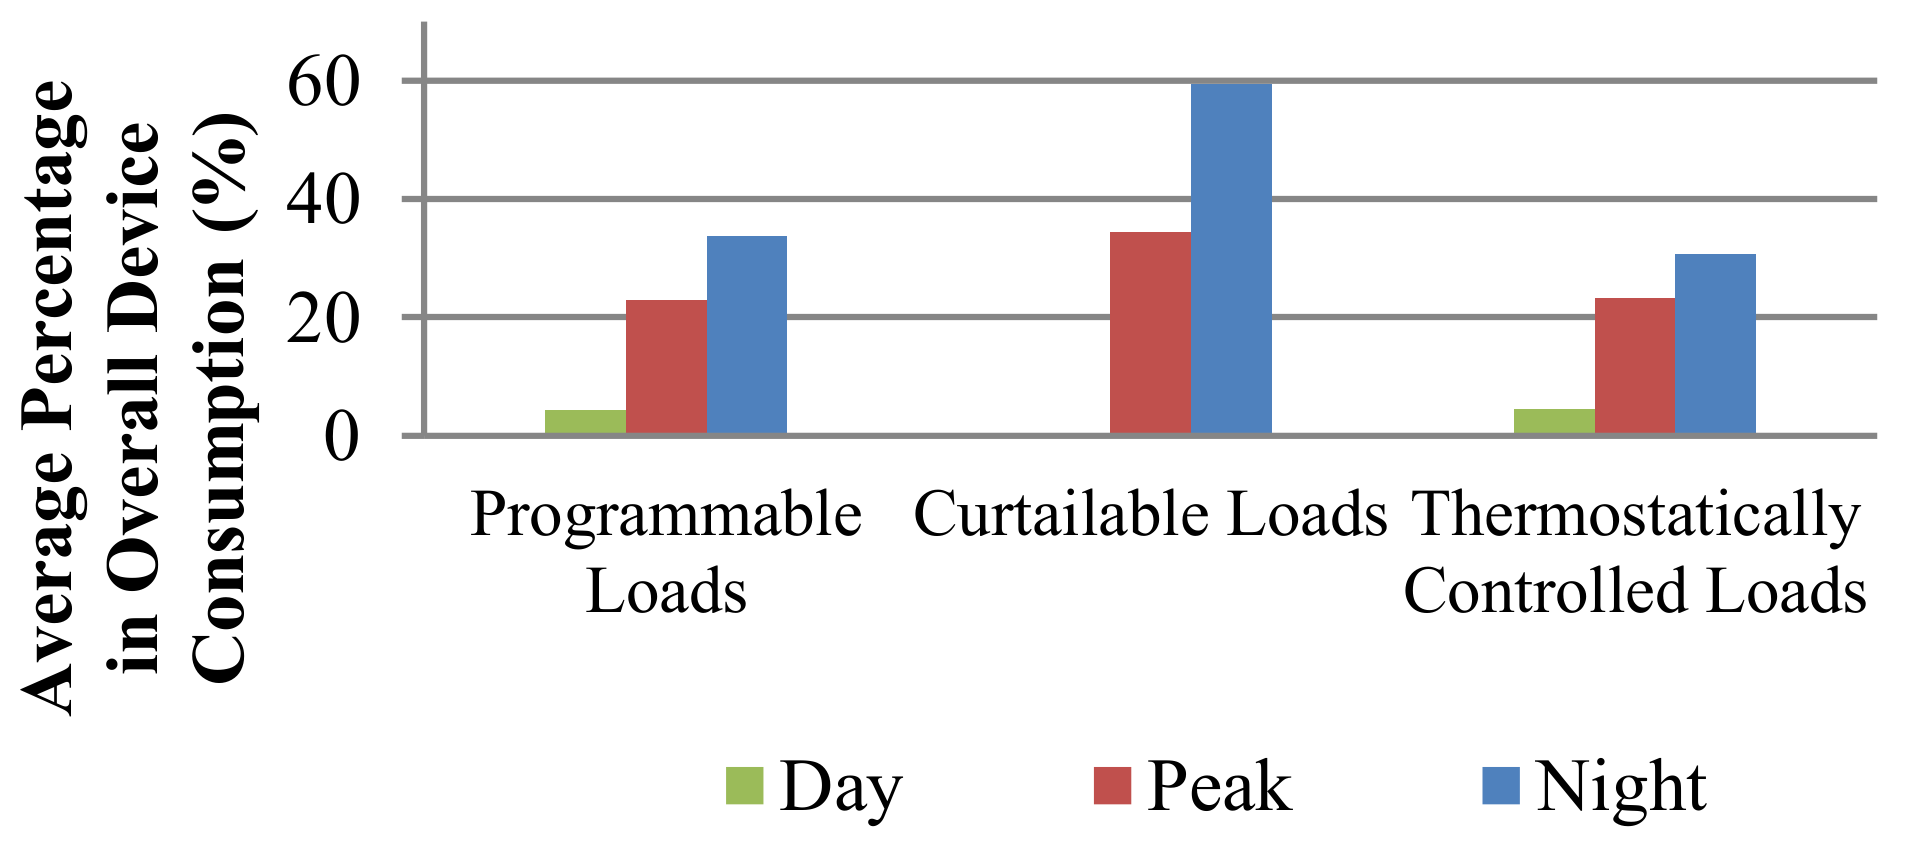
At the end of each month, a detailed monthly energy report is provided to each user. The report compares the last month’s peak period and overall consumption with the average of previous months, shows the consumption percentages of pricing periods in the user’s energy tariff, compares peak period consumptions with of other similar houses, shows management potential per device and per house (Figure 1). Moreover, the report has a second page, in which the monthly gamified platform statistics (earned points, completed tasks) of the user are presented. The same page highlights prominent monthly user successes such as the fastest completed tasks, the tasks that helped saving energy the most and many others.
In order to improve user awareness with respect to LM, four informative pages and a user guide section are prepared to explain the positive impacts of LM on electricity bill savings, CO2 emission reductions, grid operation and utilization of renewable energy. The user guide section also has content about LM options for different flexible load types explained in Section 3.1 of this paper. An internal messaging system informs users about tasks that are successfully completed and new levels that are reached. The same system also allows users to send messages to system administrator or members in their team.
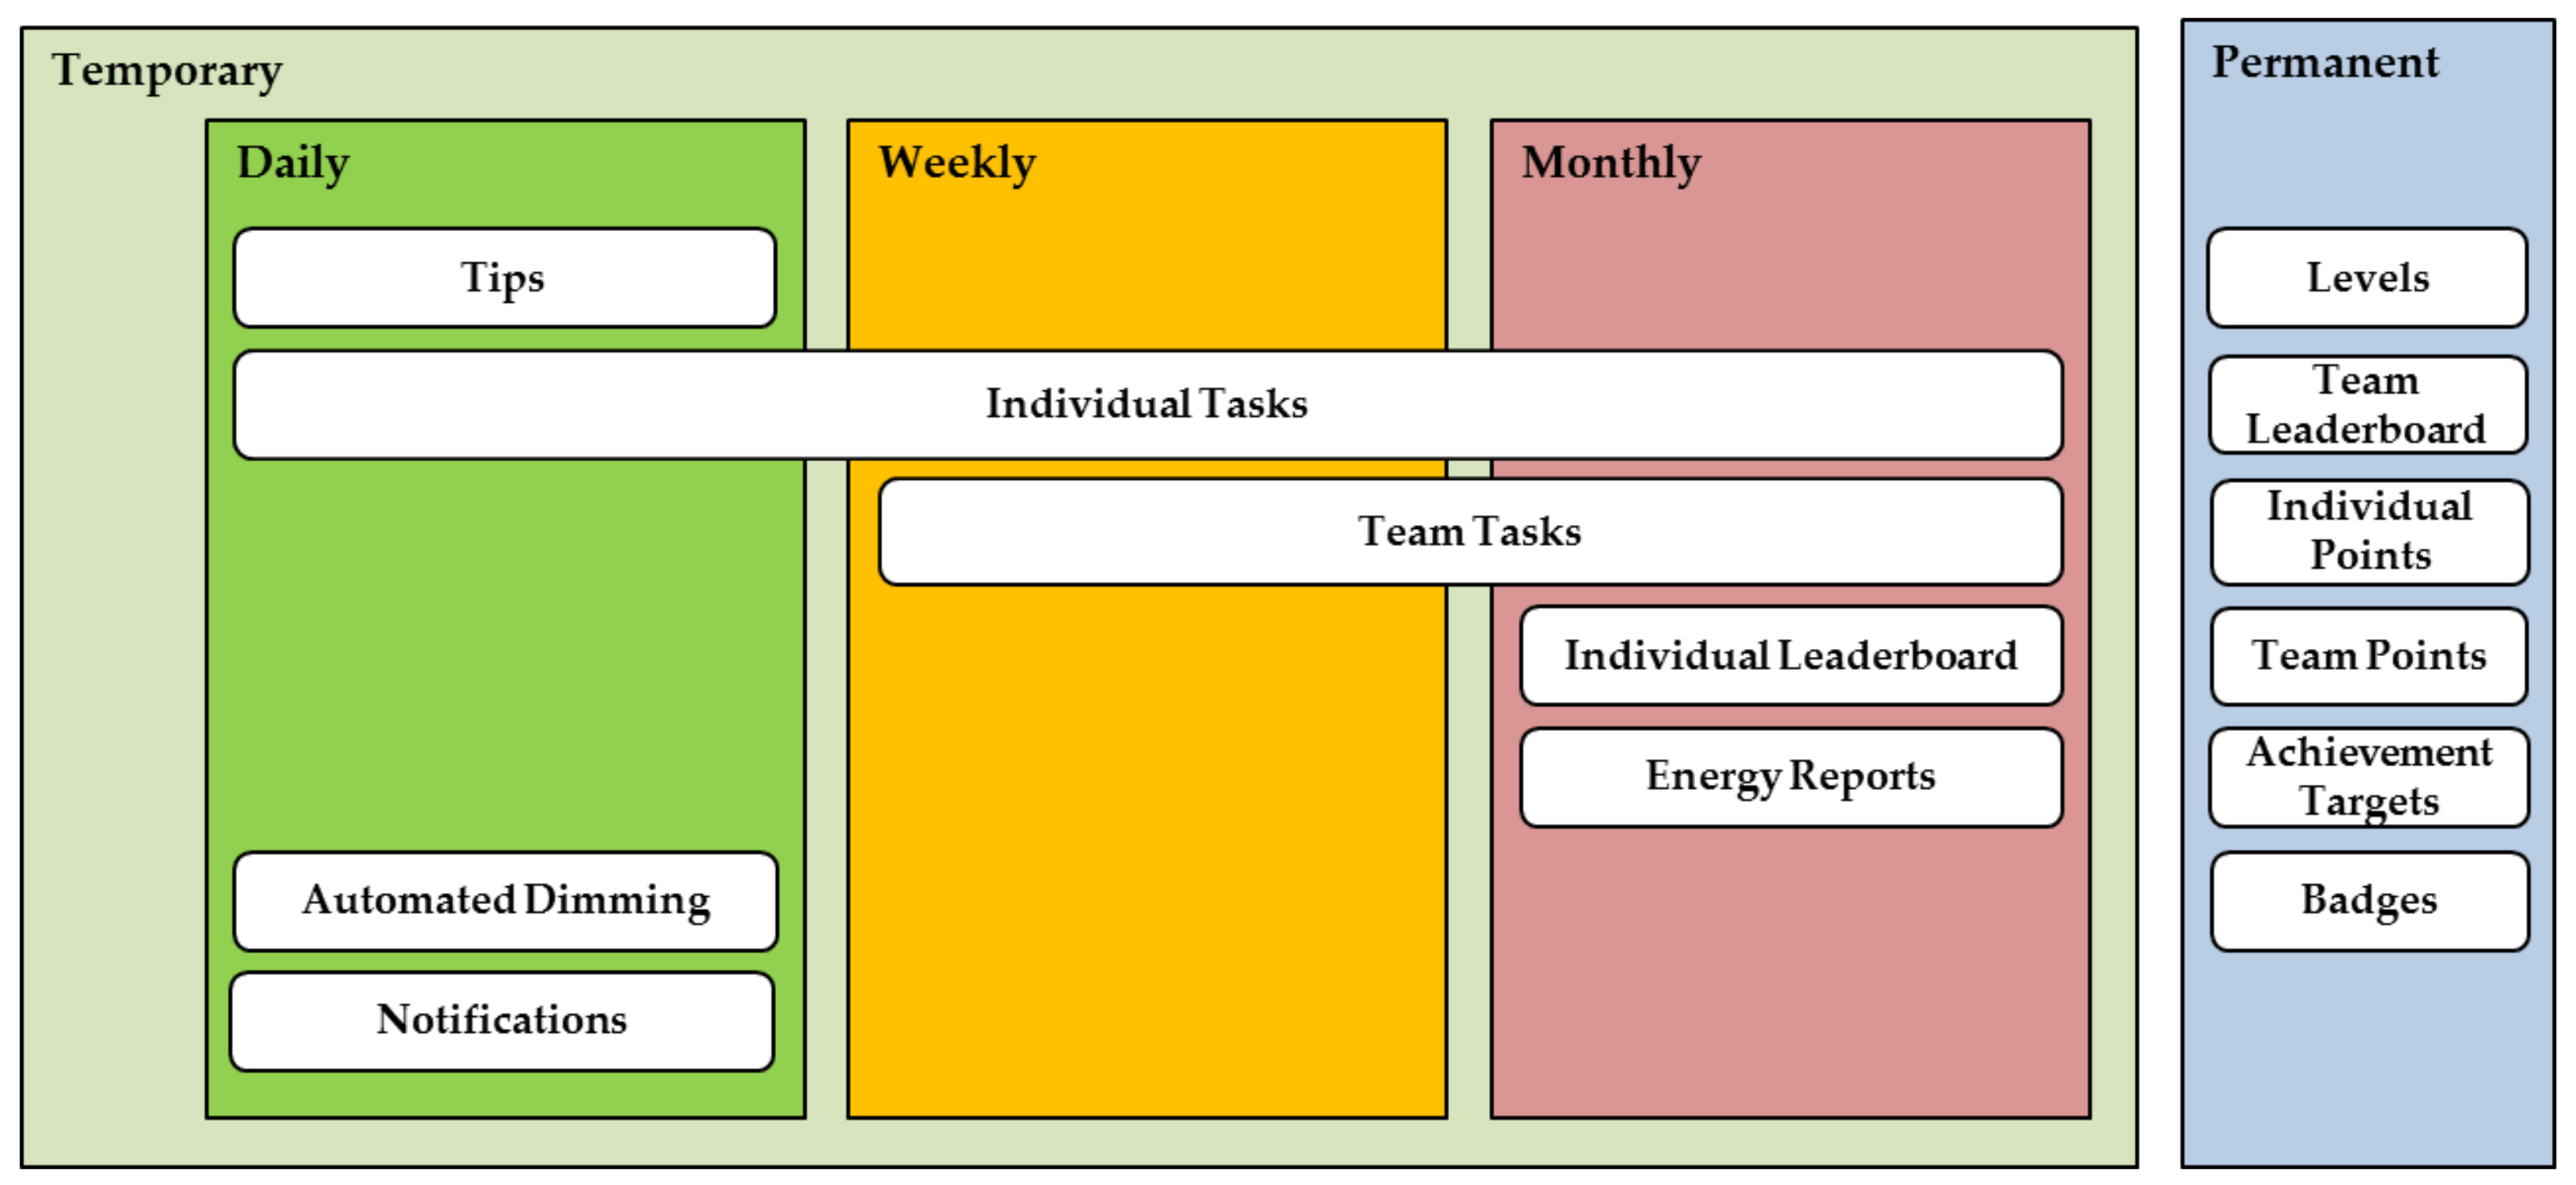
Activity cycles are divided at the fourth step of design (Figure 2). Tips are updated daily, and individual tasks have daily, weekly and monthly cycles to engage both the frequent and the rare users. On the other hand, team tasks have only weekly and monthly cycles providing enough time for team members to collaborate. An individual points-based leaderboard has a monthly cycle to provide a new and fair competition environment to all users, whereas the team leaderboard does not have a cycle and team points are never deleted because of slower dynamics of team competitions. Every week, the overall consumption and peak period consumption are compared with the previous week for each user. Additionally, the number of completed individual tasks and earned points during the last week are provided to every user. A detailed report summarizing consumption statistics, energy costs and gamified platform successes is prepared monthly for each user. Furthermore, energy management potential together with its equivalent in typical device operation hours (using lights or watching TV), bill savings and carbon emission equivalents (in terms of kg of CO2 and car driving equivalent based on [36]) are calculated monthly and provided to users.
Game economy as the fifth step of platform design and consists of individual team points gained from individual tasks. Team points that can be earned by completing team tasks and badges that are unlocked by reaching achievement targets. Moreover, a reduction in monthly energy bills is also considered as a part of the game economy for platform users.
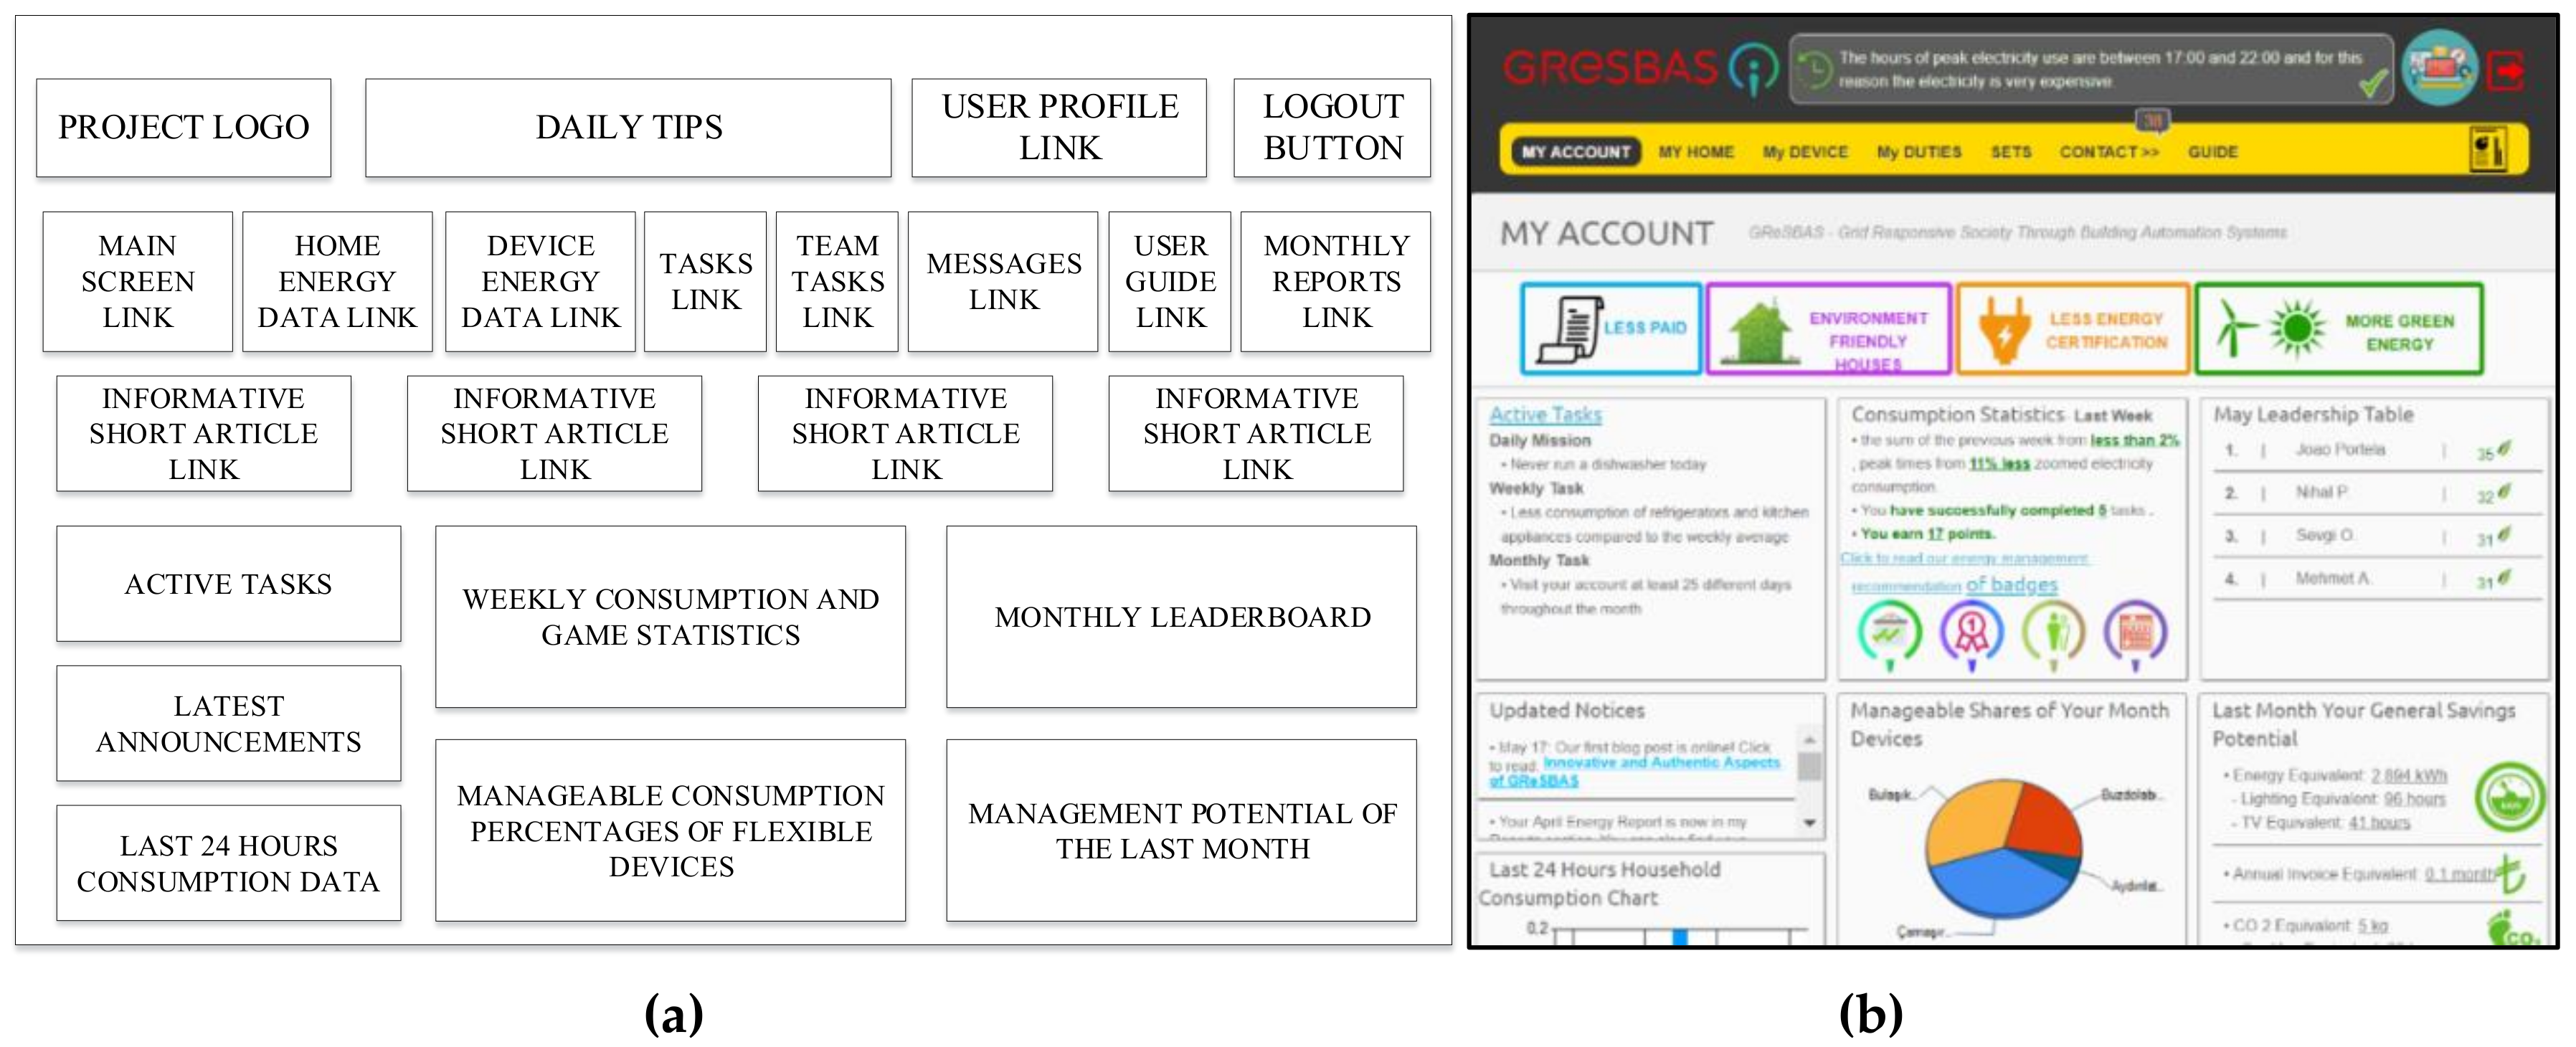
The last stage is the deployment of appropriate tools. All the data is stored in an MSSQL database with the aid of an object relational mapping (ORM) tool ADO.NET Entity Framework, while modular C# programing packages operate in parallel to make periodical checks of task evaluation, level progression, achievement completion, and related rewarding with points and badges without the need of any administrator intervention. The web platform serves as the user interface using ASP.NET framework and C# (Figure 3a,b) hosted in an Internet Information Services (IIS) web server. In user residences, a KNX home automation system with an IP gateway allows control access to automatically manageable devices such as lights and air conditioners together with their control data [37]. Energy consumption of flexible devices and the whole building are collected using the smart metering solutions of an industrial partner [38].
The relation of the gamified demand management platform elements with Fogg’s Behavior Model, Bartle’s Player Types, Gamification User Types (defined in [31]), Octalysis Framework Core Motivators and exploratory survey findings is provided in Table 3.

4. Field Implementation and System Adaptation

The field implementation section consists of three subsections. At first, the consumption behavior of customers is monitored, highlighting overall and flexible device-based energy consumption per pricing period of the ToU tariff. Then, the gamified management platform implementation is explained including post-deployment updates. Finally, demonstration results are analyzed and compared with those of the monitoring period data. For the evaluation of the impact of platform usage on LM performance, the participators are categorized as active users and rare users with respect to their frequency of usage of the platform. Monthly platform usage statistics and individual task successes are illustrated in Figure 4 and Figure 5, respectively. As can be seen from Figure 4, House 1 used the platform frequently in the first three months, while House 4 participated actively especially in the second and fourth months. On the other hand, House 2 and House 3 used the system rather rarely, below 8 days per month.
However, according to Figure 5, they maintain task accomplishment success above 50% (17 out of 35 tasks assigned monthly) together with the other two houses, after the second application month. Overall, House 1 and House 4 are tagged as active users, while House 2 and House 4 are selected as rare users of the platform.

4.1. Adaptation of Gamification Elements

The consumption routines of the houses were monitored for four months, from December 2017 to March 2018. The main purpose is to have reference values that can be compared with the results of gamified management application stage. In all the houses, washing machines are monitored individually through smart meters. However, due to common and usual field restrictions, other flexible loads are monitored together with some non-manageable loads.
In all houses, dishwashers and ovens were supplied through the same electrical wire, while refrigerators shared another wire with the other kitchen appliances. Moreover, living room illumination were monitored and controlled together with corridor lights. However, these limitations did not have significant negative impacts on gamified LM, because the tasks usually asked users to reduce their overall or peak period consumption based on the past statistics. Moreover, lighting system tasks were based on dimming, the success of which can be directly evaluated using building automation system dimmer command logs. Overall monthly consumptions per house differed up to 20%, while monthly peak period consumption differences reached to 16%, both with 10% average.
The percentages of peak period consumption in overall consumption were calculated as a complementary indicator (Table 4). Much smaller variations for monthly values of this indicator were observed, all below 8% with a 3% average. This indicator was found a better way of representing monthly peak period consumption behavior of the customers. Still, there might be external factors during the gamified application stage, which influenced peak period consumption percentages. For this reason, overall energy consumption and peak period consumption percentages for each manageable device group were chosen as possible useful indicators. Figure 6 and Figure 7 show the average percentage of energy consumption during each pricing period for each load group for active users and for rare users, respectively.

4.2. Gamified Management Platform Application

The gamified management platform was taken into service at the beginning of April 2018 and user behavior changes were monitored until the end of July 2018. Some managerial modifications were needed during the demonstration period.
The first was about the difference between the game progression of frequent users (House 1 and 4) and rare users (House 2 and House 3). Normally at level three of the gamified application, the users are placed in teams and in order to reach level four, they need to accomplish one team task. Consequently, active users reached level three much earlier than rare users and each of them were placed in a team. However, team tasks can mostly be achieved by contributions from more than one user. Therefore, active users needed to collaborate with rare users to continue in the game. In order to prevent active users from getting stuck at level three, the teams are opened for every user at any level. Otherwise, there would be only one active user per team and these users would not be able to collaborate and complete team tasks to reach the fourth level, until rare users reach level three and join their teams. The second, upon active and frequent user suggestions, the contents of e-mail notifications were extended to include daily, weekly, monthly tasks. On the other hand, in order not to spam the rare users, these notifications were kept optional in the settings, which can be activated or canceled at any time by each user individually. Moreover, in order to effectively encourage users, the customers that are motivated by reduction in their negative impact on the environment are placed in the team related to environment preservation. Again, upon user suggestions, the goals that are found to be demotivating for the consumers (daily tasks about intentionally consuming more at cheap pricing periods) are deactivated and not assigned any more.

4.3. Result Analysis

Changes in energy consumption behavior of the consumers along the four months of gamified application period are analyzed highlighting the relations with device management and task accomplishment success. Energy consumptions are illustrated in Table 5. Monthly overall consumptions of rare users were reduced by 12%, while no visible changes were recorded for active users. Peak period consumption of both user groups was reduced by around 12%. On the other hand, the percentage of peak period consumption was reduced by 2.67% for active users. However, these changes also include the consumption of non-flexible loads, which are not targeted by the gamified application. Consumption percentages of the flexible loads for each pricing period are shown in Figure 8 and Figure 9, respectively. Active users reduced peak period consumptions by 24% for programmable loads. On the other hand, rare users managed to reduce peak period consumptions by only 3% for programmable loads. Thermostatically, load peak period consumption did not differ for both user groups.
The gamified application offers load reduction through dimming, rather than shifting for curtailable loads (lighting appliances). For this reason, total and peak period consumption amounts of lighting appliances are compared with the consumption during the monitoring period. For the curtailable loads, active users reduced their peak period consumption by 9%, while rare users reduced it by 11%. However, these reductions also include the impact of seasonal changes with daylight durations and the frequency of residents to spend time outside the building. The relation of these differences with the gamified application is discussed with a further analysis. In order to reveal the correlation between the gamified application and energy consumption changes, types of successfully accomplished tasks were investigated for each consumer in each demonstration month. Clear relations were observed.
House 1, one of the active users of the gamified platform, kept the percentage of peak period consumptions in the range of 23%–27%, which is better than the minimum of the corresponding monitoring period consumption (31%).
House 4, the most active platform user of the fourth month, managed to reduce the percentage of its peak period consumption by 2% below the minimum of monitoring period only in that month. Other correlations between the task accomplishments and achieved consumption reductions are provided in Table 6.
As can be observed from Table 5, active users achieved consistent peak period demand reductions above 24% together with task accomplishment for programmable loads. Considerable increases can be seen in both task successes and demand reductions for curtailable loads of active users in Table 5. Therefore, lighting loads related tasks and demand reductions seem to be highly correlated. On the other hand, rare users achieved rather lower peak period reductions with lower task completion rates for both programmable and curtailable loads compared to active users. Among monthly values for rare users, there are some inconsistent demand difference relations with task accomplishment. In summary, active users of the platform are more successful at accomplishing tasks and achieving higher demand reductions especially for the peak periods. On the other hand, rare users still performed visible changes in their peak period consumption, especially during the first month. However, they could not maintain it during the following months since they did not use the platform actively. The results show that the best achievement for active users is provided for curtailable loads where both the total consumption and the peak period consumption are strongly correlated with the number of completed tasks.

5. Conclusions

This study has proposed the design, development and field demonstration of a gamified demand management platform with device-specific goals, compatible with building automation systems and smart meters. The design stage is explained in detail, stating the relations between the adopted gamification elements and systematic gamification methodologies, including an exploratory survey. Field demonstration activities are presented under three subsections: monitoring, application and analysis.
Considerable behavioral changes related to the peak period consumption of washing machines and dishwashers were observed in all houses after implementation of the gamified platform. Correlated savings with lighting devices were recorded in houses that are successful at lighting-based goals and use of the automated dimming option. On the other hand, refrigerator and kitchen device consumptions did not differ compared to the monitoring period, due to the complexity of management actions considering temperature setting adjustment and the relatively lower percentage of achievable savings. Regular and sustainable platform usage is recorded in House 1 and House 4, while House 2 and House 3 used the system rarely, but still performed visible changes in their demand profiles.
Future studies will investigate the maintenance of behavioral changes in the longer term, exploration of international gamified events (based on competition and collaboration using different themes) including commercial customers and an investigation of alternative intrinsic and extrinsic motivators (such as donation, more personalized suggestions, online store with promotional products to spend game points, black hat gamification).

Author Contributions

Conceptualization and methodology M.A.Z., K.B.O. and H.G.; validation Z.A. and J.C.P.; supervision A.B., M.B., U.K. and F.J.S.; project administration A.O., writing—original draft preparation M.A.Z., K.B.O. and H.G.; writing—review and editing A.B., F.J.S., M.B., U.K. and A.O.

Funding

This research is funded as a part of “Grid Responsive Society through Building Automation Systems-GReSBAS” project supported under the framework of ERA-Net Smart Grids Plus by “The Scientific and Technological Research Council of Turkey (TUBITAK – Project No: 115E816)” from Turkey and by FCT – Fundação para a Ciência e a Tecnologia (Portuguese Foundation for Science and Technology), under the project reference SmartGP/0003/2015.

Conflicts of Interest

The authors declare no conflict of interest.

References

  1. U.S. Energy Information Administration. Electric Power Sales, Revenue, and Energy Efficiency Form EIA-861 Detailed Data Files. 2017. Available online: https://www.eia.gov/electricity/data/eia861/ (accessed on 17 December 2018).
  2. Cappers, P.; Macdonald, J.; Page, J.; Potter, J.; Stewart, E. Future Opportunities and Challenges with Using Demand Response as a Resource in Distribution System Operation and Planning Activities. 2016. Available online: https://emp.lbl.gov/sites/all/files/lbnl-1003951.pdf/ (accessed on 12 September 2018).
  3. Accenture. Understanding Consumer Preferences in Energy Efficiency. 2010. Available online: https://www.accenture.com/t20160811T002327__w__/us-en/_acnmedia/Accenture/next-gen/insight-unlocking-value-of-digital-consumer/PDF/Accenture-Understanding-Consumer-Preferences-Energy-Efficiency-10-0229-Mar-11.pdf/ (accessed on 16 August 2018).
  4. Zehir, M.A.; Erpaytoncu, S.; Yilmaz, E.; Balci, D.; Batman, A.; Bagriyanik, M. Analysis of consumer expectations, preferences and concerns on deployment of demand response in Turkey. In Proceedings of the 10th International Conference on Electrical and Electronics Engineering (ELECO), Bursa, Turkey, 30 November–2 December 2017; pp. 1262–1266. [Google Scholar]
  5. Paoe, A.; Bacher, J.P. The impact of building occupant behavior on energy efficiency and methods to influence it: A review of the state of the art. Energies 2018, 11, 953. [Google Scholar] [CrossRef]
  6. Killerud, W. Smart Grid, Smart Users: The User Experience and Impact of a Persuasive Mobile Electricity Managing Assistant. 2014. Available online: https://brage.bibsys.no/xmlui/bitstream/handle/11250/278524/14-02188-3%20Masteravhandling%20-%20Smart%20grid%20smart%20users%20-%20 Killerud%20William.pdf%20223116_1_1.pdf?sequence=1 (accessed on 27 January 2018).
  7. Gnauk, B.; Dannecker, L.; Hahmann, M. Leveraging gamification in demand dispatch systems. In Proceedings of the 2012 Joint EDBT/ICDT Workshops, Berlin, Germany, 30 March 2012; pp. 103–110. [Google Scholar]
  8. Reeves, B.; Cummings, J.J.; Scarborough, J.K.; Yeykelis, L. Increasing Energy Efficiency with Entertainment Media: An Experimental and Field Test of the Influence of a Social Game on Performance of Energy Behaviors. Environ. Behav. 2013, 47, 102–115. [Google Scholar] [CrossRef]
  9. Personal Energy Administration Kiosk Application: An ICT-Ecosystem for Energy Savings Through Behavioral Change, Flexible Tariffs and Fun (PEAKapp) 2017. Deliverable D1.4 Documentation of Functionalities—Serious Game Specification. Available online: http://www.peakapp.eu/wp-content/uploads/2017/01/D-1.4-Documentation-of-Functionalities-%E2%80%93-Serious-Game-Specification.pdf/ (accessed on 14 November 2018).
  10. Ohmconnect. What Is an Ohmhour? 2017. Available online: https://www.ohmconnect.com/ blog-post/what-is-an-ohmhour/ (accessed on 26 September 2018).
  11. Gustafsson, A.; Bång, M.; Svahn, M. Power explorer: A casual game style for encouraging long term behavior change among teenagers. In Proceedings of the International Conference on Advances in Computer Enterntainment Technology, Athens, Greece, 29–31 October 2009; pp. 182–189. [Google Scholar]
  12. Gustafsson, A.; Katzeff, C. Evaluation of a pervasive game for domestic energy engagement among teenagers. Comput. Entertain. 2009, 7, 1–54. [Google Scholar] [CrossRef]
  13. Geelen, D.; Keyson, D.; Boess, S.; Brezet, H. Exploring the use of a game to stimulate energy saving in households. J. Des. Res. 2012, 10, 102–120. [Google Scholar] [CrossRef]
  14. Lee, G.E.; Xi, Y.; Brewer, R.S.; Johnson, P.M. Makahiki: An Open Source Game Engine for Energy Education and Conservation. In Proceedings of the Foundations of Digital Games, Raleigh, NC, USA, 29 May–1 June 2012; pp. 1–8. [Google Scholar]
  15. Castri, R.; Wemyss, D.; Cellina, F.; Luca, V.D.; Frick, V.; Lobsiger-Kägi, E.; Binachi, P.G.; Carabias, V. Triggering Electricity-Saving Through Smart Meters: Play, Learn and Interact Using Gamification and Social Comparison. In Proceedings of the 1st Energy-Feedback Symposium “Feedback in energy demand reduction: Examining evidence and exploring opportunities”, Edinburg, UK, 4–5 July 2016; pp. 248–256. [Google Scholar]
  16. Hafer, M.; Howley, W.; Chang, M.; Ho, K.; Tsau, J.; Razavi, H. Occupant engagement leads to substantial energy savings for plug loads. In Proceedings of the IEEE Conference on Technologies for Sustainability, Phoenix, AZ, USA, 12–14 November 2017; pp. 1–6. [Google Scholar]
  17. Johnson, D.; Horton, E.; Mulchany, R.; Foth, M. Gamification and serious games within the domain of domestic energy consumption: A systematic review. Renew. Sustain. Energy Rev. 2017, 73, 249–264. [Google Scholar] [CrossRef]
  18. Morganti, L.; Pallavicini, F.; Cadel, E.; Candelieri, A.; Archetti, F.; Mantovani, F. Gaming for Earth: Serious games and gamification to engage consumers in pro-environmental behaviours for energy efficiency. Energy Res. Soc. Sci. 2017, 29, 95–102. [Google Scholar] [CrossRef]
  19. Sial, A.; Jain, A.; Singh, A.; Mahanti, A. Profiling Energy Consumption in a Residential Campus. In Proceedings of the CoNEXT on Student Workshop, Sydney, Australia, 2 December 2014; pp. 15–17. [Google Scholar]
  20. Siak, A.; Sing, A.; Mahanti, A.; Gong, M. Heuristics-Based Detection of Abnormal Energy Consumption. In Proceedings of the Smart Grid Innovative Frontiers in Telecommunications, Auckland, New Zealand, 23–24 April 2018; pp. 21–31. [Google Scholar]
  21. AlSkaif, T.; Lampropoulos, I.; van den Broek, M.; van Sark, W. Gamification-based framework for engagement of residential customers in energy applications. Energy Res. Soc. Sci. 2018, 44, 187–195. [Google Scholar] [CrossRef]
  22. Beck, A.L.; Chitalia, S.; Rai, V. Not so gameful: A critical review of gamification in mobile energy applications. Energy Resarch Soc. Sci. 2019, 51, 32–39. [Google Scholar] [CrossRef]
  23. Smart Domestic Appliances in Sustainable Energy Systems (Smart A) Project 2009. Smart Domestic Appliances Supporting the System Integration of Renewable Energy. Available online: https://ec.europa.eu/energy/intelligent/projects/sites/iee-projects/files/projects/documents/e-track_ii_final_brochure.pdf (accessed on 17 September 2018).
  24. Energy Market Regulatory Authority. Elektrik Faturalarina Esas Tarife Tablolari. 2019. Available online: http://www.epdk.org.tr/Detay/Icerik/3-1327/elektrik-faturalarina-esas-tarife-tablolari/ (accessed on 10 January 2019).
  25. Zehir, M.A.; Bagriyanik, M. Demand side management by controlling refrigerators and its effects on consumers. Energy Convers. Manag. 2012, 64, 238–244. [Google Scholar] [CrossRef]
  26. Zehir, M.A.; Batman, A.; Bagriyanik, M. Review and comparison of demand response options for more effective use of renewable energy at consumer level. Renew. Sustain. Energy Rev. 2016, 56, 631–642. [Google Scholar] [CrossRef]
  27. Werbach, K.; Hunter, D. For the Win: How Game Thinking Can Revolutionize Your Business; Wharton Digital Press: Philadelphia, PA, USA, 2012; ISBN 978-161-363-023-5. [Google Scholar]
  28. Burke, B. Gamify: How Gamification Motivates People to Do Extraordinary Things, 1st ed.; Gartner Inc.: Massachusetts, MA, USA, 2014; ISBN 978-193-713-485-3. [Google Scholar]
  29. Fogg, B.J. A behavior model for persuasive design. In Proceedings of the 4th International Conference on Persuasive Technology, Claremont, CA, USA, 26–29 April 2009; pp. 1–7. [Google Scholar]
  30. Bartle, R. Hearts, clubs, diamonds, spades: Players who suit MUDs. J. Mud Res. 1996, 1, 1–19. [Google Scholar]
  31. Tondello, G.F.; Wehbe, R.R.; Diamond, L.; Busch, M.; Marczewski, A.; Nacke, L.E. The Gamification User Types Hexad Scale. In Proceedings of the Annual Symposium on Computer-Human Play (CHI PLAY), Austin, TX, USA, 16–19 October 2016; pp. 229–243. [Google Scholar]
  32. Chou, Y. Actionable Gamification—Beyond Points, Badges and Leaderboards; Octalysis Media: Milpitas, CA, USA, 2015; ISBN 978-151-174-404-1. [Google Scholar]
  33. Csikszentmihalyi, M. Finding Flow: The Psychology of Engagement with Everyday Life; HarperCollins: New York, NY, USA, 1996; ISBN 978-046-502-411-7. [Google Scholar]
  34. Elliot, A.J.; Dweck, C.S.; Yeager, D.S. Handbook of Competence and Motivation; The Guildford Press: New York, NY, USA, 2018; ISBN 978-146-252-960-5. [Google Scholar]
  35. Marczewski, A. Flow & Gamification: A Misunderstanding. Available online: https://www.gamified.uk/2014/07/08/flow-gamification-misunderstanding/ (accessed on 14 October 2018).
  36. US Environmental Protection Agency. Greenhouse Gas Equivalencies Calculator. 2018. Available online: https://www.epa.gov/energy/green house-gas-equivalencies-calculator/ (accessed on 9 January 2019).
  37. MAKEL Company. Smart Home Products. 2018. Available online: http://makel.com.tr/en/makel-smart-home/products/ (accessed on 15 October 2018).
  38. MAKEL Company. Electricity Meters. 2018. Available online: http://makel.com.tr/en/electricity -meters/ (accessed on 15 October 2018).
Figure 1. Sectional illustration and screenshot of the main page of a monthly energy report.
Energies 12 00913 g001
Figure 2. Categorization of activity cycles of the gamified platform.
Energies 12 00913 g002
Figure 3. Sectional illustration (a) and screenshot (b) of the main screen.
Energies 12 00913 g003
Figure 4. Monthly platform usage statistics.
Energies 12 00913 g004
Figure 5. Monthly task accomplishment statistics (%).
Energies 12 00913 g005
Figure 6. Average percentage of flexible device consumptions in ToU tariff pricing periods for active users of the platform during the monitoring period.
Energies 12 00913 g006
Figure 7. Average percentage of flexible device consumptions in ToU tariff pricing periods for rare users of the platform during the monitoring period.
Energies 12 00913 g007
Figure 8. Average percentage of flexible device consumptions in ToU tariff pricing periods for active users of the platform during the application period.
Energies 12 00913 g008
Figure 9. Percentage of flexible device consumptions in ToU tariff pricing periods for rare users of the platform during the application period.
Energies 12 00913 g009
Table 1. Summary of related works on gamified energy monitoring and management platforms.
Authors and YearTargetMonitoringGamification ElementsTestingImpact Analysis
Gustafsson, Bång, Svahn, 2009 [11]Electricity saving in householdOverall consumption, server logs, outside temperature logsFeedback, individual competition1-week trial with 15 teenagers from 12 to 14 years oldOverall consumption change with outside temperature, interview
Gustafsson, Katzef, 2009 [12]Electricity and heat saving in householdOverall consumption Feedback, team competition, tasks, tips10-day trial with 6 familiesOverall change in electricity and heat consumption, interview
Geelen, Keyson, Boess, Brezet, 2012 [13]Electricity saving in householdOverall consumption Feedback, team competition2-week monitoring and 4-week trial with 20 student housesOverall consumption change, survey
Gnauk, Dannecker, Hahmann, 2012 [7] Additional incentives with increasing flexibility in householdDevice level consumption (conceptual)Points, levels, individual competitionUse and practicality test with 12 test usersSurvey
Lee, Xu, Brewer, Johnson, 2012 [14]Electricity saving in student hallBuilding section level consumptionFeedback, tasks, points, levels, lottery3-week trial at 4 dormitories with 250 studentsSurvey
Castri et al., 2016 [15]Electricity saving in householdOverall consumptionFeedback, tasks teams13-week trial with 46 active householdsOverall consumption change of active users, survey
Hafer et al., 2017 [16]Electricity saving in commercial buildingDevice-level consumptionPoints, rewards, competition8-week trial in a commercial building with 14 active participantsDevice-level consumption change, survey
Table 2. ToU tariff rates in Turkey [24].
Pricing PeriodsPricing Ratio Compared to Single Rate TariffTime
Day (Normal)0.9906.00–17.00
Peak (Expensive)1.7817.00–22.00
Night (Cheap)0.4422.00–06.00
Table 3. Relation of gamification elements with Fogg’s Behavior Model, Game Player Types, Gamification User Types, Octalysis Framework gamification core motivators and the exploratory survey findings.
Related Gamified Platform ElementsFogg’s Behavior ModelGame Player TypesGamification User TypesOctalysis Framework Gamification MotivatorsExploratory Survey Findings
MotivationAbilityPromptsAchieverExplorerSocializerKillerPlayerPhilantrophistFree SpiritDisruptorMeaningAccomplishmentEmpowermentOwnershipSocial InfluenceScarcityAvoidanceUnpredictabilityTeam Up with FriendsConsecutive ParticipationCompetition with FriendsCompetition with IndividualsLeaderboards with Top Place RewardsSide Missions with Additional Points
Daily tips++++++
Automated Dimming Mode++
Individual Tasks ++++++++
Individual Points+++++++++
Team Tasks +++++++++++++
Team Points+++++++++++
Levels++++++++
Monthly Leaderboard of Individuals+++++++++++++
Team Leaderboard++++++++++
Monthly Energy Reports+++++++++++
Internal Messaging System+++++++
Achievement Targets+++++++++
Badges++++++++++
User Guide+++++++
+: Related to. −: Not Related to.
Table 4. Average monthly energy consumption of each house for the monitoring period.
ConsumptionActive UsersRare Users
Average Monthly Overall Energy Consumption (kWh)304.45677.10
Average Monthly Peak Period Energy Consumption (kWh)88.20178.76
Average Percentage of Normal Period Consumptions (%)39.4640.32
Average Percentage of Peak Period Consumption (%)28.1726.30
Average Percentage of Cheap Period Consumption (%)31.7433.38
Table 5. Average monthly energy consumption of each house with comparisons.
ConsumptionActive UsersDifference Compared to Monitoring PeriodRare UsersDifference Compared to Monitoring Period
Average Monthly Overall Energy Consumption (kWh)304.04−0.41591.36−85.74
Average Monthly Peak Period Energy Consumption (kWh)77.45−10.75157.74−21.02
Average Percentage of Normal Period Consumptions (%)44.414.9540.07−0.25
Average Percentage of Peak Period Consumption (%)25.50−2.6727.991,69
Average Percentage of Cheap Period Consumption (%)30.09−1.6531.93−1.45
Table 6. Flexible-device based task accomplishments and achieved energy consumption reductions.
Load TypeMonthsNumber of Completed Related TasksOverall Consumption Difference (%)Peak Period Consumption Difference (%)
Active Users—Programmable Loads12−14−27
23−15−36
33−10−32
45−17−24
Correlation with the Related Tasks0.540.43
Active Users—Curtailable Loads17−40−51
27−40−55
39−45−70
Correlation with the Related Tasks10.97
Passive Users—Programmable Loads13−23−16
21−28−9
3085
Correlation with the Related Tasks0.670.93
Passive Users—Curtailable Loads11−45−16
23−72−14
30−58−1
Correlation with the Related Tasks0.670.67

