Representative Sampling Implementation in Online VFA/TIC Monitoring for Anaerobic Digestion


1
bwe Energiesysteme GmbH Co. KG, Zeppelinring 12-16, 26127 Friesoythe, Germany
2
Department of Engineering Science, University of Applied Sciences Aschaffenburg, Würzburger Str. 45, D-63743 Aschaffenburg, Germany
3
Faculty for Agricultural and Environmental Sciences, University of Rostock, Justus-von-Liebig-Weg 6, D-18059 Rostock, Germany
*
Author to whom correspondence should be addressed.
Energies 2019, 12(6), 1179; https://0-doi-org.brum.beds.ac.uk/10.3390/en12061179
Submission received: 25 February 2019
/
Revised: 20 March 2019
/
Accepted: 22 March 2019
/
Published: 26 March 2019
Abstract
:This paper describes an automatic sampling system for anaerobic reactors that allows taking representative samples following the guidelines of Gy’s (1998) theory of sampling. Due to the high heterogeneity degree in a digester the sampling errors are larger than the analysis error, making representative sampling a prerequisite for successful process control. In our system, samples are automatically processed, generating a higher density of data and avoiding human error by sample manipulation. The combination of a representative sampling system with a commercial automate titration unit generates a robust online monitoring system for biogas plants. The system was successfully implemented in an operating biogas plant to control a feeding-on-demand biogas system.
1. Introduction
Online monitoring in anaerobic digestion is fundamental for the technical and economic optimization of the process. At the time of writing there was no commercial unit for online measurement of anaerobic digestion that includes a representative sampling procedure. Most devices concentrate on analytical measurement itself. It is assumed that a digester sample is representative without involving an adequate sampling [1,2,3]. Research is focused on the evaluation of the capacity and required time to detect a generated instability. Representative sampling is required because digestates are characterized by a mixture of different substrates like energy crops, manure or organic wastes at different stages of fermentation (Constitution Heterogeneity, CH). Moreover, the mixing system in Continuous Stirring Tank Reactors (CSTR) is not designed to generate a complete homogeneous mixture, but to increase the contact of the substrate with the bacteria [4]. In addition, optimum mixing conditions are difficult to achieve in the practice, as the agitation performance is based on visual monitoring of the fermentation surface and there is no information on the layers below. In [5] with the help of Computational Fluid Dynamics a digester with central stirrer was evaluated showing large particle speed variations and agglomeration at the top and bottom of the tank. Similar sedimentation patterns were measured in operating digesters with Biobeta® Sediment Check [6]. There is a higher concentration of acetic acid near to the substrate feeding point decreasing with distance [7] and a non-uniform distribution of the particle size [8]. These results show that there is a degree of spacial segregation inside the digester (Distribution Heterogeneity, DH).
Both aspects (CH and DH) are the main reasons why it is necessary to pay attention to the sampling methodology to ensure that the sample is representative of the digester. Errors generated by sampling can be 100 times larger than sample analysis errors [1].
The theory of sampling (TOS) [1] defines a correct sampling procedure as: any part of the lot must have the same, non-zero probability of ending up in the sample while elements foreign to the lot must have zero probability of ending in the sample. Based on this definition it is evident that the traditional practice of taking a sample from a valve located at the wall of the digester does not fulfill this probability conditions [2].
Currently the number of measurements is limited in most plants to one measurement per day, enough to characterize a continuously fed digester, but insufficient for a biogas plant providing balanced power with feeding-on-demand. This kind of feeding will demand an online supervision of the biological process due to the continuous changes of the quality and quantity of the substrates.
The objective of this paper is to present a sample device that automatically collects a representative sample of a digester following the guidelines of sampling theory. The system also prepares the sample for further analysis. As the samples are taken and processed automatically, possible bias generated by the operator is avoided and a higher density of data can be generated.
2. Materials and Methods
2.1. Parameter and Measurement Principle for the Sample Analysis
Digester conditions are normally characterized by chemical parameters [9]. Common online measurements are pH and Redox potential [10], however sensors for this provide very limited insight into the dynamics of the microbiological process [3], and for that reason are not often used in practical applications.
The characterization of intermediate metabolites in an anaerobic digestion process is standard practice for the characterization of biological process stability [10,11,12]. The parameters most used to determine the stability of the anaerobic digestion process are total Volatile Fatty Acids (VFA), concentration of each specific acid (especially acetic and propionic), alkalinity and hydrogen concentration in the liquid phase. Other parameters like pH are less sensitive to VFA concentration changes in a well buffered anaerobic digester [13].
There are publications on biogas process online measurements using different measurement principles [3,14]. Some of them describe indirect, non-invasive measurements implying an elaborate calibration and interpretation such as the use of Raman spectroscopy [15,16], Near Infrared Spectroscopy (NIRS) [17,18] and Mid Infrared Spectroscopy (MIR) [19]. Dissolved hydrogen in the liquid phase has been successfully measured using an extractor located in the substrate providing an interphase between extraction gas and aqueous medium [20,21].
An alternative is using direct invasive measurement which requires taking and preparing samples and sending them to a measurement device. Titration is one of the most used methods to determine the VFA [22,23] and the alkalinity ratio VFA/TIC (Total inorganic Carbon), in German literature the parameter is called FOS/TAC (Flüchtige Organische Säuren/Total Anorganic Carbon) [13,24]. VFA can also be estimated by spectrofluorimetry [25]. The measurement of individual VFA is normally done by chromatography such as HPLC (High Pressure liquid Chromatography), Gas Chromatography or GC Mass spectrometry [21,26].
Following the Theory of Sampling (TOS) guidelines, NIRS has been successfully used to determine total VFA, individual volatile acids and dry matter. Representative sampling in this reference is obtained with a dedicated recirculation loop [17,27,28].
Of the aforementioned analytical measurements the most widely used in commercial power plants is the titrimetric determination of VFA/TIC ratio, because it is simple, inexpensive and robust.
VFA/TIC is an empiric method and it is not standardized. Its numerator indicates VFA accumulation and denominator TIC or buffer capacity. Buffer capacity measures the resistance to a pH change that can be generated by VFA accumulation.
Values less than 0.3 are considered as an indicator for a stable anaerobic process [10]. However maximum allowed values depends on the feeding substrates. For agricultural biogas plants values between 0.4 and 0.6 are still considered as characteristic for a stable system [29].
A problem with VFA/TIC analysis is that it does not provide an estimation of the individual fatty acids because they have a similar acid dissociation constant , (see [13]), and the concentration of individual fatty acids provides more knowledge of process stability [9,26,30]. An increase in total VFA can be interpreted as organic overload or a kinetic uncoupling between acid producers and consumers which is typical for stress situations [3,11]. In both cases actions should be taken to avoid a reactor failure. A stable system can, however, have high levels of VFA. For this reason it is important to consider relative changes and not single values [9].
A complicating issue is that the results depend on the sampling method and sample preparation. Samples should be filtered or centrifuged before analysis because titrant consumption increases with the solid contents generating a possible overestimation of the VFA [31]. In most commercial plants samples are simply filtered without defining a minimum particle size. This, and differences in sampling practice, results in samples with a high heterogeneity making the results not reproducible. For the titration itself, there are autotitrators on the market which avoid errors generated by manual titration.
Most autotitrators on the market use the direct titration of the sample from initial pH to two pH end points. Due to its simplicity and accuracy this procedure is also recommended by [32] when the composition of the sample is not known.
The TIC value is estimated with the amount of acid required to reach pH 5.0, and VFA content with the additional acid required to reach pH 4.4, . Between starting pH and pH 5 buffer chemical substances like carbonate, phosphate and ammonium are present and also a fraction of the Volatile fatty acids. Between pH 5.0 and pH 4.4 mainly the VFA are present with a fraction of the buffer chemical compounds [13].
2.2. Theory of Sampling Guidelines (TOS)
The TOS guidelines describe seven unit sampling operations [33,34] that must be followed in order to implement a correct sampling procedure. The sampling operations described here were used for the design of the sampling device in this project.
- Operation 1 Transformation of lot dimensionality. This step is necessary to transform a digester, a 3 dimensional object, which is difficult to sample, into a 1 dimensional object. This is done by pumping the material through a pipe of which the length of one dimension is much larger than the other two. If the pipe is connected back to the digester a re-circulation loop is generated. In principle all the contents of the digester will pass through the pipe if the substrate is pumped often enough.Taking a sample from a digester is equivalent to taking a cross section of the flow through the pipe. The main problem here is taking an exact cross section. In [35] it is proposed to take a sample with a side valve in a vertical up flow in which the substrate is flowing at high speed, generating a turbulent flow implying a high degree of mixing, resulting in a homogeneous cross section. The sample taken with this procedure does not fully comply with the TOS because the cross section of the pipe is not completely extracted (delimitation error) and the homogenization assumption cannot be verified. In [15] it is proposed to install a dedicated re-circulation loop with a small pipe diameter and a low capacity pump. The sample is taken when a three way valve located at the vertical pipe is turned towards a side connection, and the volume is determined by the flow rate and time that the valve remains in the side position. In case there is more than one digester, each of them will require a separate re-circulation loop.
- Operation 2 Characterization of 0-Dimenstional (0-D) sampling variation. This should be used when there is no space correlation between the samples or when the correlation is not known. For this analysis it is not relevant whether the samples are taken continuously or discontinuously. The characterization is done by repetition of the sampling procedure and the calculation of the variance .
- Operation 3 Characterization of 1-D (process) variation by variography. In this case, there is a space correlation of the samples taken at consecutive intervals. A characterization is done with a variogram to detect the process variation frequency and is then used to modify the sampling frequency in order to avoid the risk of underestimating the process variation [33].
- Operation 4 Homogenization by mixing or blending. In order to reduce the heterogeneity it is important to agitate the digester before sampling. In every step of the sampling procedure each composite sample (defined as the addition of different subsamples or increments) should be well-mixed before being sent to the next step.
- Operation 5 Composite sampling. Due to the heterogeneous characteristics of the substrates it is necessary to generate a sample with as many increments (subsamples) as possible.
- Operation 6 Particle size reduction. The constitution heterogeneity of the substrate can only be achieved with a particle reduction or with comminution or filtration.
- Operation 7 Representative mass-reduction. A digester has a typical volume of m and the sample required for the analytical measurement has a volume of m. For that reason it is important that every mass reduction procedure done follows TOS guidelines in order to be representative.
Procedures to generate the sample must be correct to obtain a representative sample. The sample itself cannot provide the information as to whether it is representative or not.
2.3. Design of Experimental Setup
The device was installed at a commercial biogas plant with an installed electrical capacity of 250 kW. The plant was fed with an average of 12 ton of maize silage in ten feedings daily at 0, 4, 6, 8, 11, 13, 15, 17, 19 and 21 h and 1 feed of 7.5 m pig manure at 8 a.m. The plant has been in operation since 2011 with over 8600 h at full capacity. It has 1 digester with a total volume of 1977 m and 1 storage tank with a volume of 2761 m. The plant has a central pump of 22 kW with a nominal capacity of 90 m/h. The pump manifold is in PVC with an internal diameter of 150 mm. The sampling device was connected at an up-flow pipe located at the pressure side of the pump manifold. A sketch of the device is given in the following diagram. This sampling device is under patent [36].
The circulation loop required to reduce digester dimensionality is generated at the existing pump manifold (Operation 1), see Figure 1. At the manifold each tank has a connection at both suction and pressure sides of the pump. This configuration generates a circulation when the substrate is pumped from the digester to a tank, which can be the same digester. The advantage is that all the digesters connected to the pump manifold can be sampled, requiring no additional investment, and the sample can be taken while substrate is being pumped as a part of the normal operation without generating any additional cost or work to the operator.
It was decided to take subsamples from a side valve located at an up-flow vertical pipe even though a well-mixed cross section cannot be assumed, given a Reynolds number , within the characteristic range of laminar flow. This number was calculated using speed , pipe diameter as a characteristic dimension , digestates density at 40 °C of a plant fed with maize silage of and dynamic viscosity based on the apparent viscosity at a shear rate of [37]. At the side valve is not possible to take a definite substrate cross section and, due to the flow characteristics, there could be a heterogeneous horizontal distribution in the pipe. An alternative to a side valve would have been to install a three way valve at the pump manifold [28]; but due to the high capacity of the pump, the valve could have been easily damaged, causing a high risk of spillage, and for those reasons was not selected.
In Figure 1, side valve Vent_PE1 was installed as near as possible to the vertical pipe to reduce the risk that substrate from previous samples gets trapped, generating an error in the next sample. The sample point is located at the center of the vertical up-flow pipe. Before any sample is taken the pump will operate for a certain time to purge the system and guarantee a fresh sample from the digester. The sampling process is divided into the following steps:
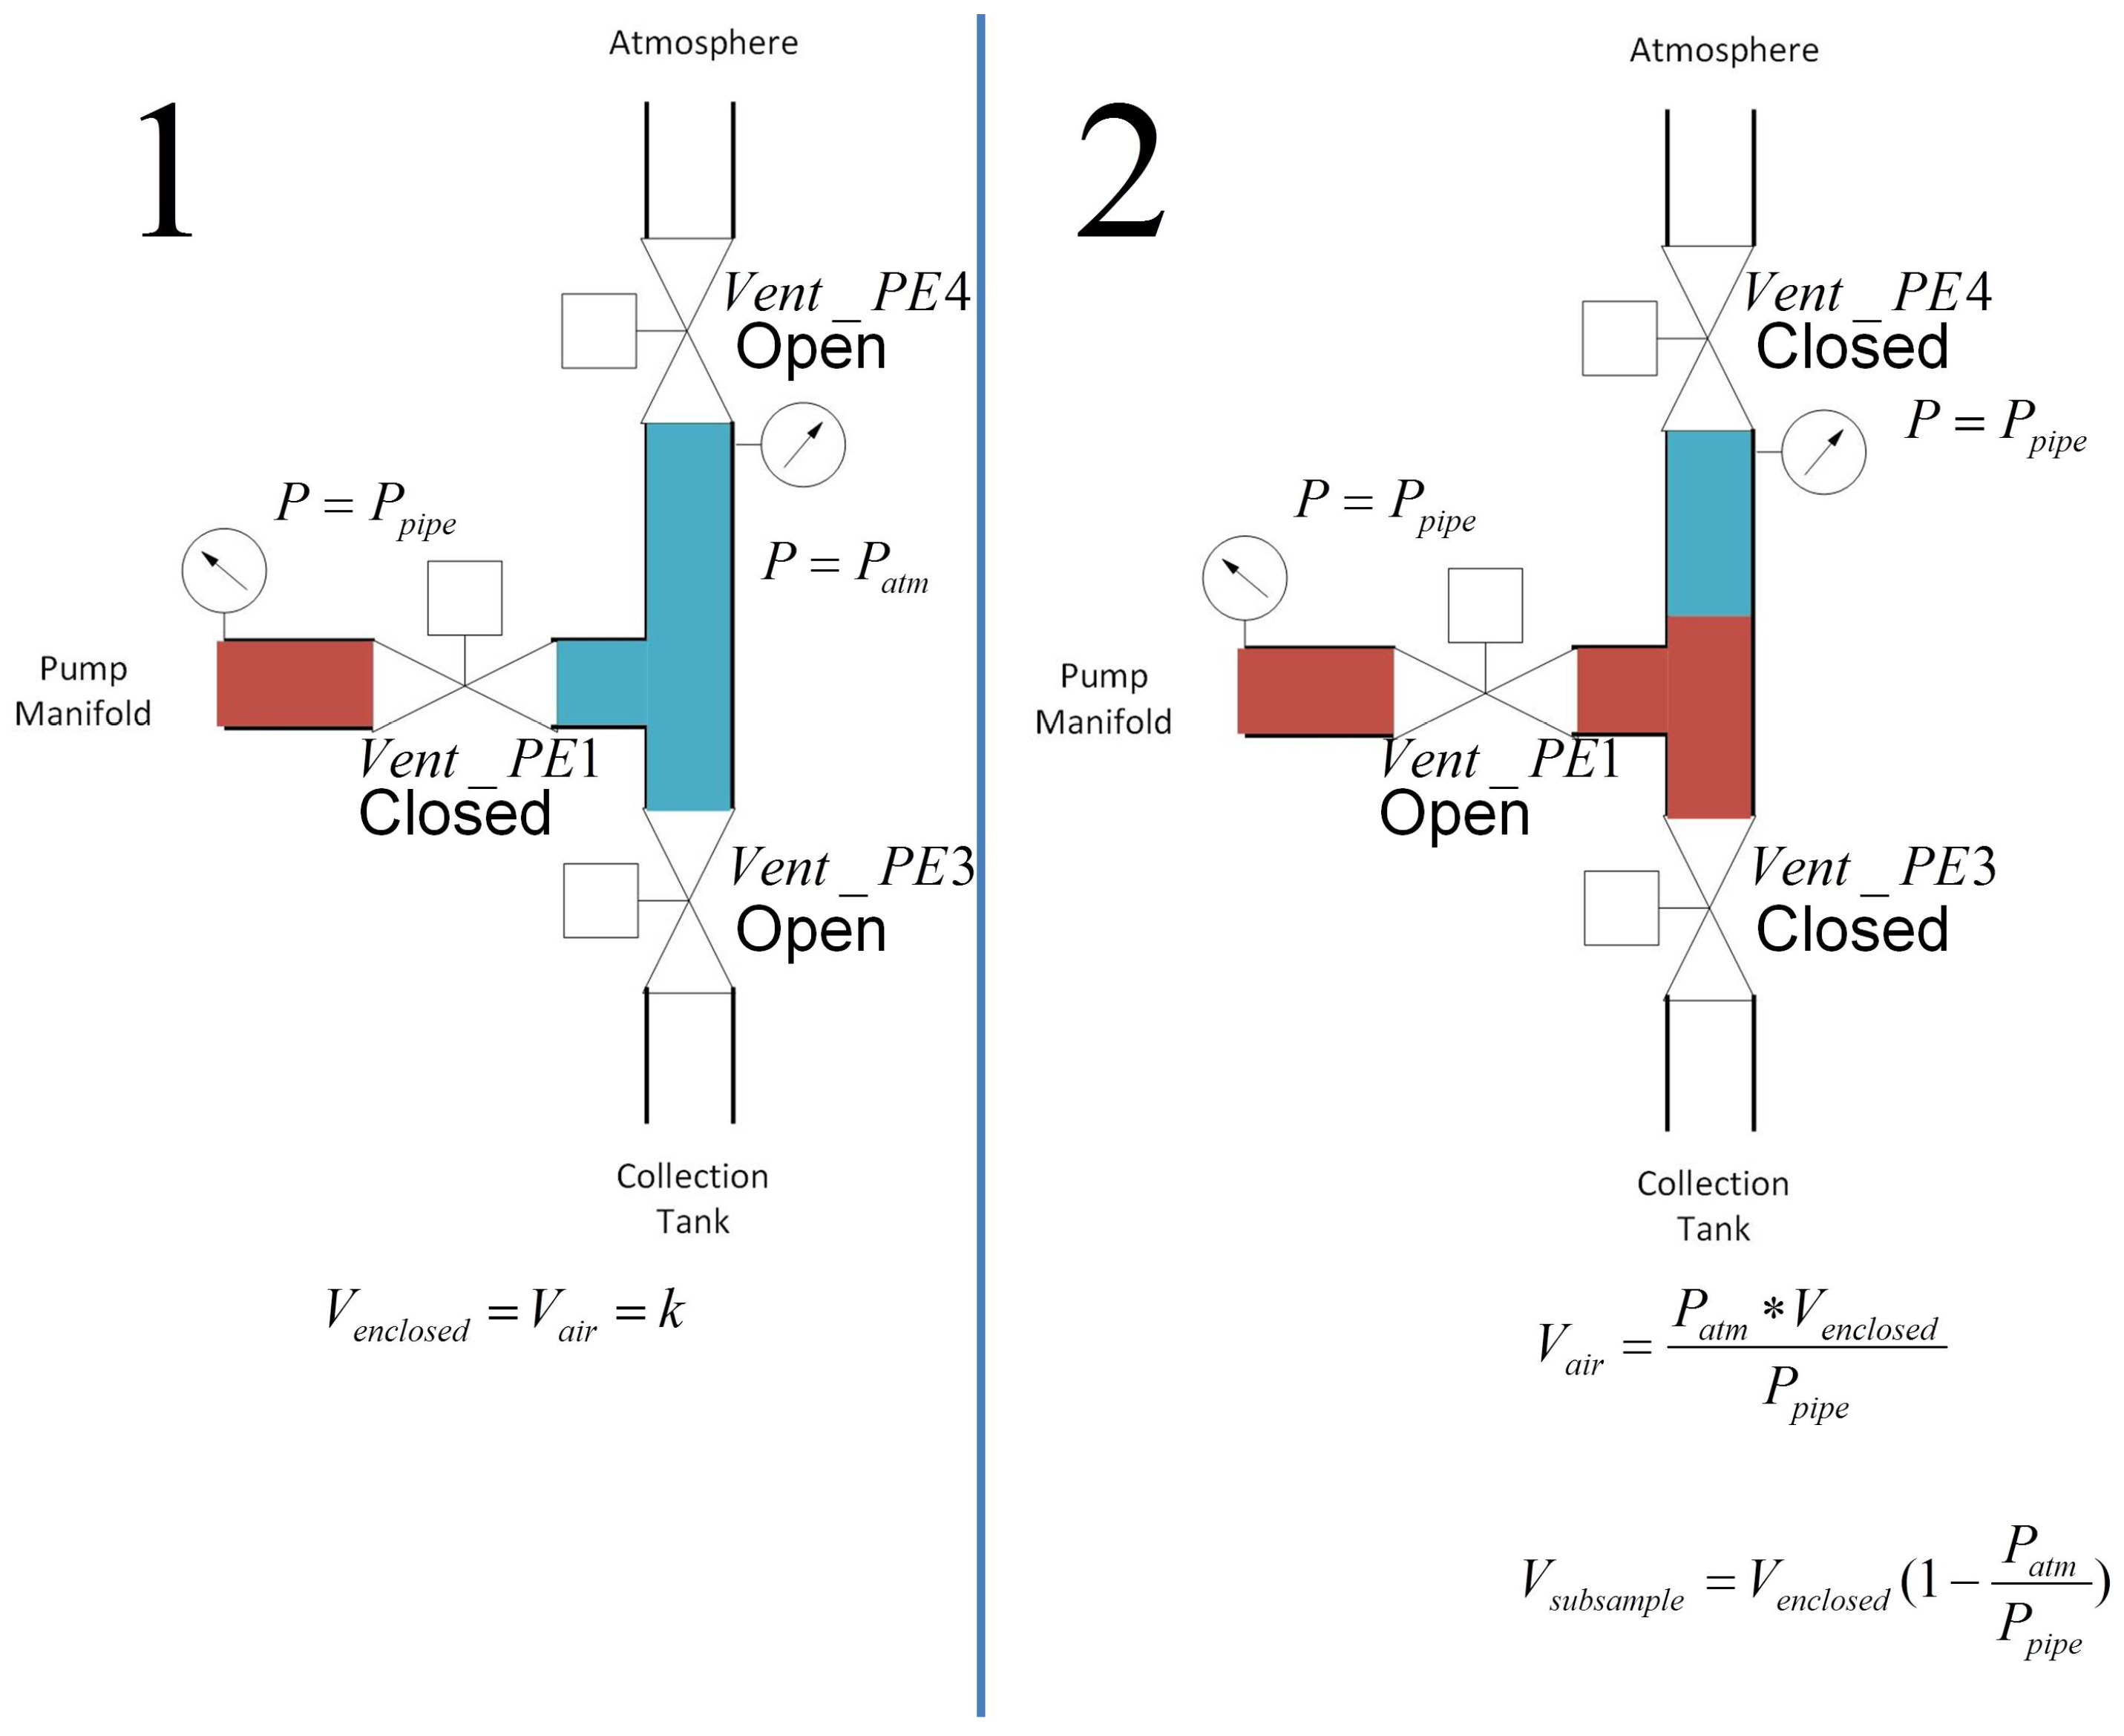
• Step 1 Dosing sample: From n equal digestates volumes a defined subsample volume is extracted (Operation 7). Subsample volume is determined by the air volume between three valves. A side valve connected to the up flow pipe Vent_PE1, a bottom valve connected to a collecting tank Vent_PE3, and a top valve connected to a drain at atmospheric pressure Vent_PE4, see Figure 1. At the beginning of the sampling procedure the air captured between the three valves is at atmospheric pressure and all the valves are closed. While substrate is pumped through the up flow pipe, the valve Vent_PE1 is opened and due to its higher pressure, material flows into the fix volume, compressing the captured air until its pressure is at the same as in the pipe. At this time no more substrate can enter the sampling unit, and the Vent_PE1 is closed. The subsample volume is defined by the pressure in the pipe, which is fixed and depends on the pumping system, atmospheric pressure (considered constant at the sampling time) and the air volume captured that can be varied according to the requirements of the sampling procedure, see Figure 2 and Figure 3.
Subsample volume can be calculated with Equation (4), where is the volume inside the valves Vent_PE3, Vent_PE1 and Vent_PE4, is the atmospheric pressure and is the pressure at the pipe.
Valve Vent_PE3 located at the top of the collecting tank (which is at atmospheric pressure) is opened in the next step and the substrate moves to this tank due to the pressure difference. After some time the drain valve Vent_PE4 is opened releasing pressure until the system pressure is equal to the atmospheric pressure generating the condition for the next sample. This procedure is repeated n times generating a composite sample (Operation 5) with a volume
Both parameters, number of samples n, and subsample volume , can be varied to find the configuration that generates the lowest variance . Variance was calculated as the space correlation between the samples is not known (Operation 2 and 3).
• Step 2 Mixing: once the samples are collected, they are mixed to decrease heterogeneity (Operation 4). The sample is mixed with the help of compressed air, normally available at biogas plants to operate the pneumatic valves or to secure the gas membranes. The valve is located at the bottom of the collecting tank Vent_DL_TANK and is protected with a non-return valve.
Compressed air is bubbled through generating a well-mixed substrate. This procedure is repeated several times. Once the sample is well-mixed the valve located at the bottom of the collecting tank Vent_PE2 is opened allowing the sample to move to the filter.
dissolved in the sample generates an overestimation in the VFA as it increases the titrant consumption. In back titration, pH is reduced and then air is added to the sample for s to reduce . Using air for mixing may removes dissolved in the sample and also strips some VFA, decreasing the VFA content [32].
Nevertheless this procedure was used for its simplicity and ease of cleaning. VFA underestimation generated by mixing with air could not be quantified but is assumed to be small as pH is not reduced before the mixing and the mixing time is much smaller compared with the back titration ( s). Air pressure was set to and the time of exposure of the sample to compressed air minimized using visual inspection of the mixing quality.
• Step 3 Filtering: Due to the high solids content in different degradation states it is necessary to centrifuge or filter the sample in order to increase the repeatability of the analytical measurements [13,21]. Filtering the sample was chosen as sample pre-treatment (Operation 6). The filter unit is divided in two stages: The first has a mesh of 0.5 mm, the second of 0.1 mm.
Material flows to the first stage, but due to the large amount of solids, the pressure loss is high and only a small amount of sample passes through the filter. Valve Vent_PE3 is closed and compressed air is pumped through the valve Vent_DL_TANK increasing the pressure and allowing a larger amount of the sample to pass through the first filter. The same procedure is then repeated between the first and second sieve, this time opening the valve Vent_DL_FILTER.
The resultant sample has a guaranteed particle size smaller than 0.1 mm. Before the sample is pumped to the titration cell the generated over-pressure is released by opening the adjacent valves to avoid affecting pumping volumes.
• Step 4 Analytical measurement: The filtered sample is collected and then transferred to the measurement device with a positive displacement pump. In this case an autotitrator was used to determine VFA/TIC ratio but the sample can be sent to any measurement device such as NIRS, Raman or another device. Titration was done with the autotritator TitroLine® 6000 from SI Analytics using the existing routine for VFA/TIC. The routine is based on two-pH points titration to pH 5 and 4.4.
In [32] it was pointed out that titration volume could affect titration results. Accuracy depends on the level of VFA and the titration volume. It is suggested small volumes for high VFA levels and large volumes for low VFA.
Titration volume was fixed for all the measurements as VFA levels are not known in advance and the levels could change over time depending on the digester situation. Small titration volume was selected due to the characteristics of the sampling and pre-treatment and to minimized the consumption of reactants as many samples can be taken per day.
In a customized titration cell with agitator, the dosing system pumps 5 mL of filtered sample then dilutes this with 20 mL of distilled water
Titration starts automatically and results are saved in a data base. When the titration is finished the dosing system cleans the cell and keeps the electrode submerged in a KCL-solution (3 mol/L) to preserve it for the next titration.
• Step 5 Cleaning: After the sample is collected and filtered the sampling unit must be cleaned. The cleaning process is divided into several steps to guarantee that the sampling unit is clean and dry for the next sample. Tank tap water is re-pressurized and used to flush sample remnants into the digester when opening the valve Vent_PE1.
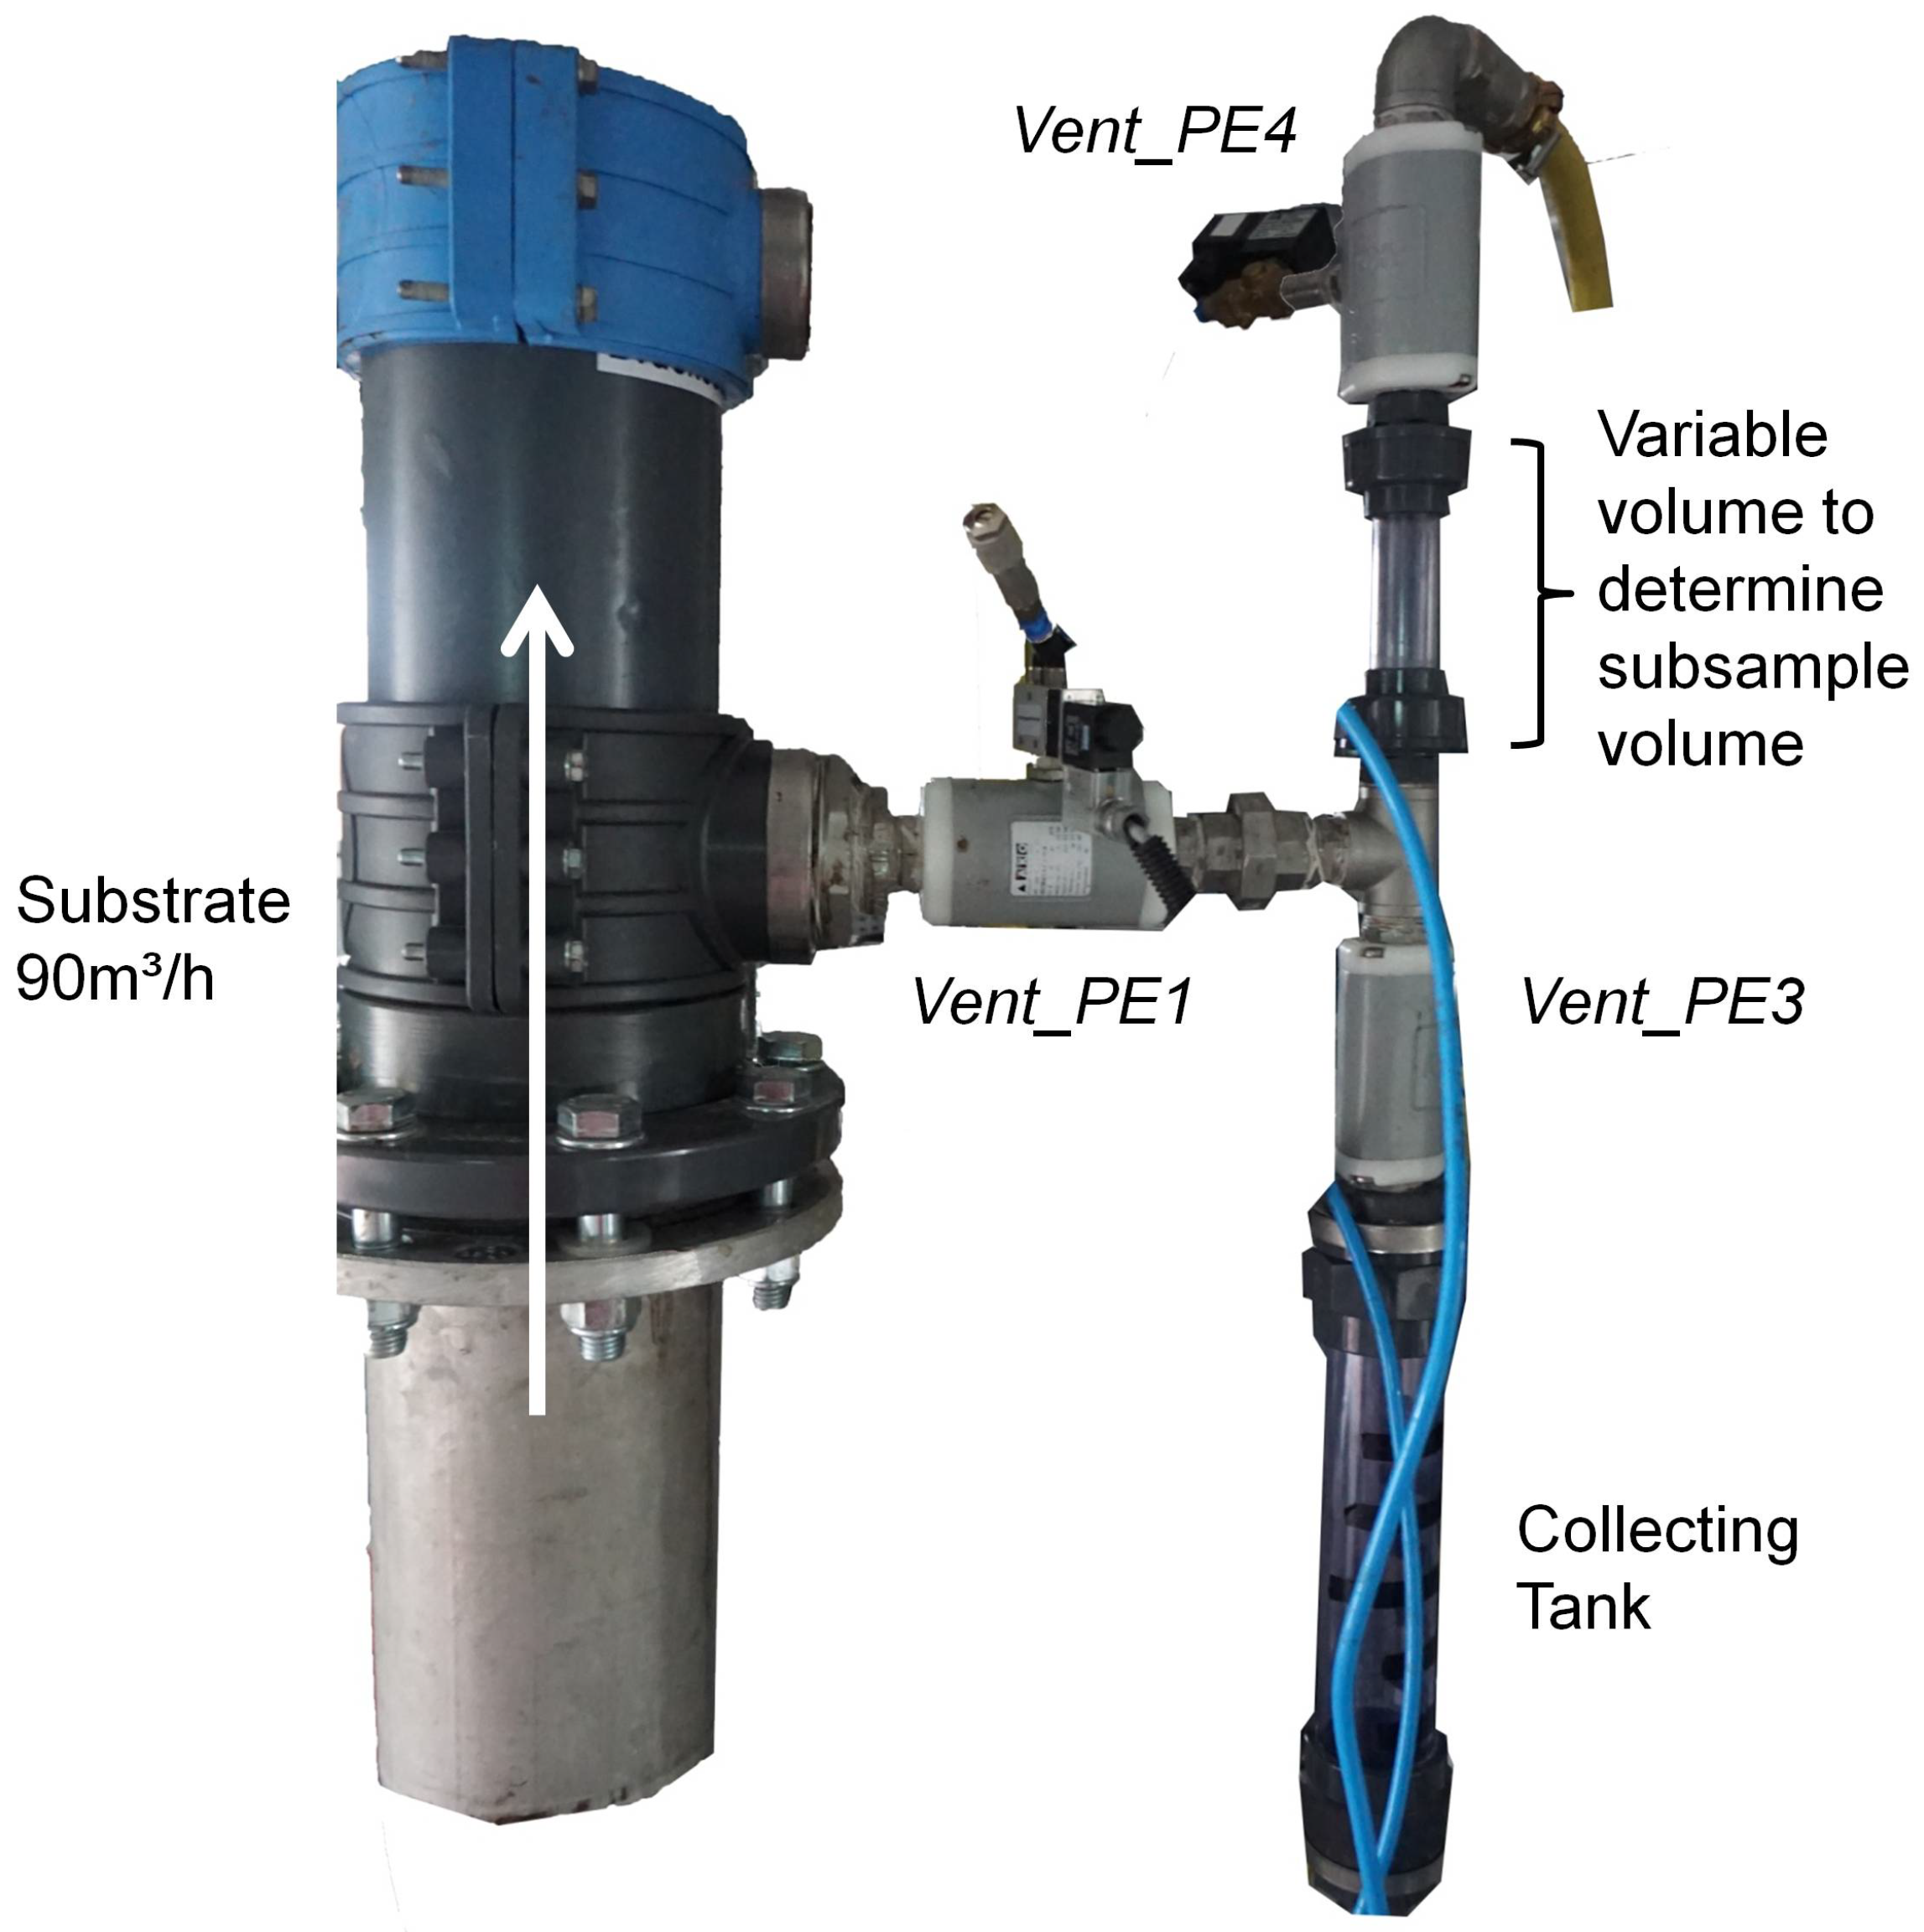
Filtration elements have a dedicated cleaning circuit opening valves Vent_ABFLUSS for mesh 0.5 mm and Vent_ABFLUSS_1 for mesh 0.1 mm. After cleaning, compressed air from valve Vent_DL_TANK transports the water remaining to the drain. This is important to avoid contamination of the next sample. The sampling system installed at the research plant is presented in Figure 4.
2.4. Sampling Conditions
Determination of the sampling parameters was based on the following conditions:
Max volume of composite sampling: This volume is limited by the size of the collection tank located under valve Vent_PE3 which in the setup has a volume of 1.1 L. The maximum sample volume was fixed at 600 mL to avoid sample loss when the sample is mixed with compressed air.
Duration of sampling procedure: It is important to guarantee long term implementation of the sampling device, so that no additional work is generated for the operator. For this reason sampling collection must happen during normal pumping operations. This means that no additional pumping is required only to generate a measurement.
According to the feedstock fed, approx 16 m³ of digestate are generated daily and must be pumped from digester to storage tank. The central pump requires about 10.5 min for this task. The digestate was pumped 4 times a day to generate 4 measurements per day and attempt to cover the system behavior. For any sampling procedure the maximum available pumping time was fixed at 2.5 min. Before taking a sample, the central pump operates for 40 s to ensure that the pump manifold contains only a fresh sample. A subsample is taken every 20 s while digestate is pumped. This means that from every 0.5 m³ pumped digestate a subsample is extracted. Depending on the number of subsamples the duration of the sampling procedure is 120 s for 4 or 140 s for 5 subsamples.
The total sampling procedure including sample collection, preparation titration and cleaning takes about 25 min. The minimum time between two measurements was fixed at 30 min.
2.5. Determination of Sampling Parameters
Before the device was used to monitor the biogas plant it was necessary to determine the combination of sampling parameters, number of samples n, and subsample that generates the lowest sampling error.
The main issue here is that the measurements are done in a dynamic system. Concentration of VFA in a digester depends on many factors including interaction of different bacteria groups and archaea, operating conditions, feeding scheme and the addition of new microorganism (manure feeding).
Dealing with a dynamic system has the consequence that the difference between two measurements could not be only originated by the sampling and measuring system but also result from internal changes in the digester itself.
To determine the sampling parameters configuration it is necessary to assume that the digester state is constant in a short time interval. In that way consecutive measurements should provide the same result and difference can be explained by sampling and analytical error. Standard deviation was selected to measure the spread of the measurements around their mean.
Before a sample was taken the agitation system in the digester was run for 5 min.
Two V_subsample configurations with a composite sample volume V_sample of 120 mL and 96 mL were tested, see Figure 2. The following configurations were tested:
- 5 subsamples of 120 mL. Total volume 600 mL
- 4 subsamples of 120 mL.Total volume 480 mL
- 5 subsamples of 96 mL.Total volume 480 mL
A summary of the sampling parameters for the configuration with 5 subsamples of 120 mL is presented in Figure 5. Composite sampling itself is only 0.024% of the pumped volume, but the initial sample covered approximately 0.126% of digester volume. This value is in the sampling range from 0.1–1% described as typical for this digester volume by [2].
2.6. Feeding on Demand
It has been shown by [26,38,39,40,41] that flexible biogas production can be generated by modifying the feeding program of the plant. The benefits of a flexible biogas production are saving the existing gas storage capacity for over-production events from other renewable energies like wind or solar or increasing the ability to deliver a high variable load profile.
Modification in the feeding program can generate process imbalances that must be detected on time to avoid large disturbances on the biological process and the possible economical lost. At the commercial plant where the online monitoring was installed the feeding program of maize silage was modified from feeding almost every 2 h to every 12 h. This modification was based on the findings in [41,42], where most of the gas yield dynamic changes were found in the first 12 h. The idea behind this was to increase the biogas production to match the two electricity cost peaks presented in the yearly average electricity prices from the Day Ahead Auction of the EPEX (European Power Exchange SE). Feeding modifications were monitored with the online monitoring device.
3. Results
3.1. Sampling Parameters
To set the process parameters a series of measurements described in Section 2.5 were developed. The aim of the analysis was to identify the configuration with the least standard deviation.
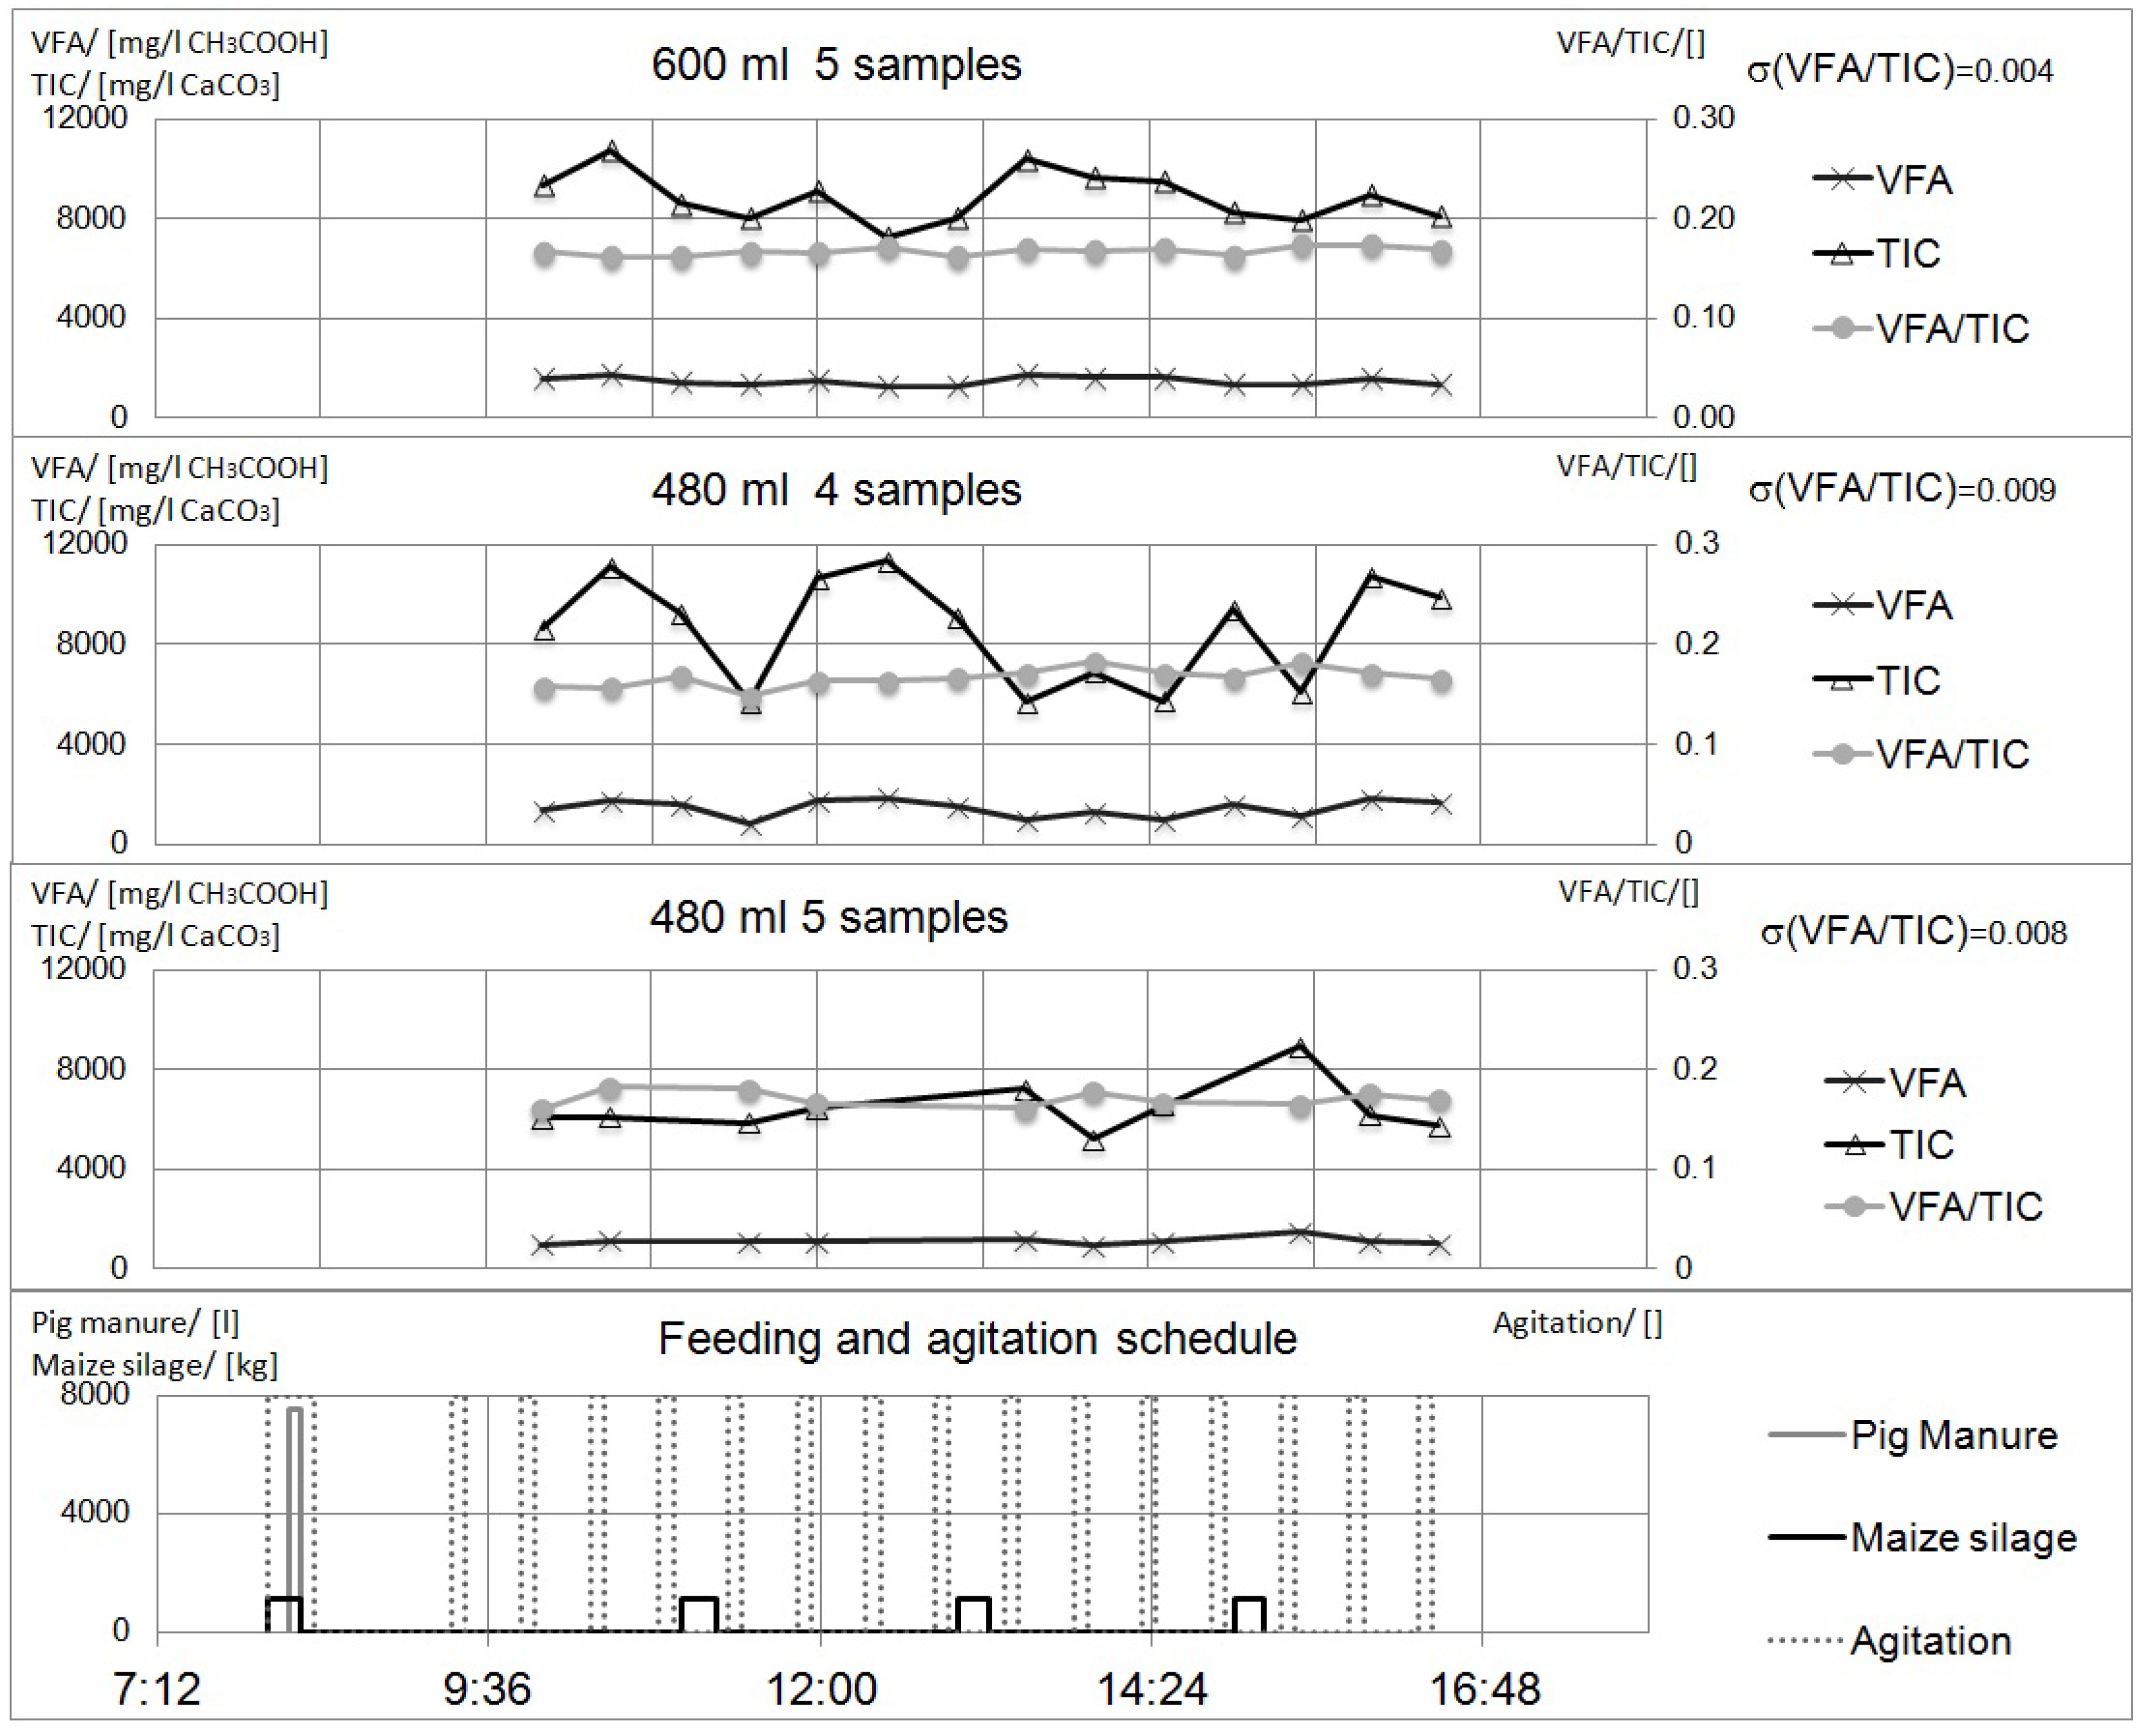
In Figure 6 the results of the measurements are given for different subsample volumes and number of subsamples. The lowest graphic presents the feeding and agitation schedule. It could be seen that the measured values for VFA and TIC are varying up to 50% while the VFA/TIC ratio is almost constant. VFA/TIC stable results are characteristic for a stable biological process.
For each configuration the average, standard deviation, (relative standard deviation) as well as maximum and minimum VFA/TIC relations are given, see Table 1. It could be seen that each configuration presents a low variation and average values are quite close to each other. The configuration with the largest sample volume can be identified as it has the lowest variation of all the measurements.
3.2. Measurements in the Commercial Plant
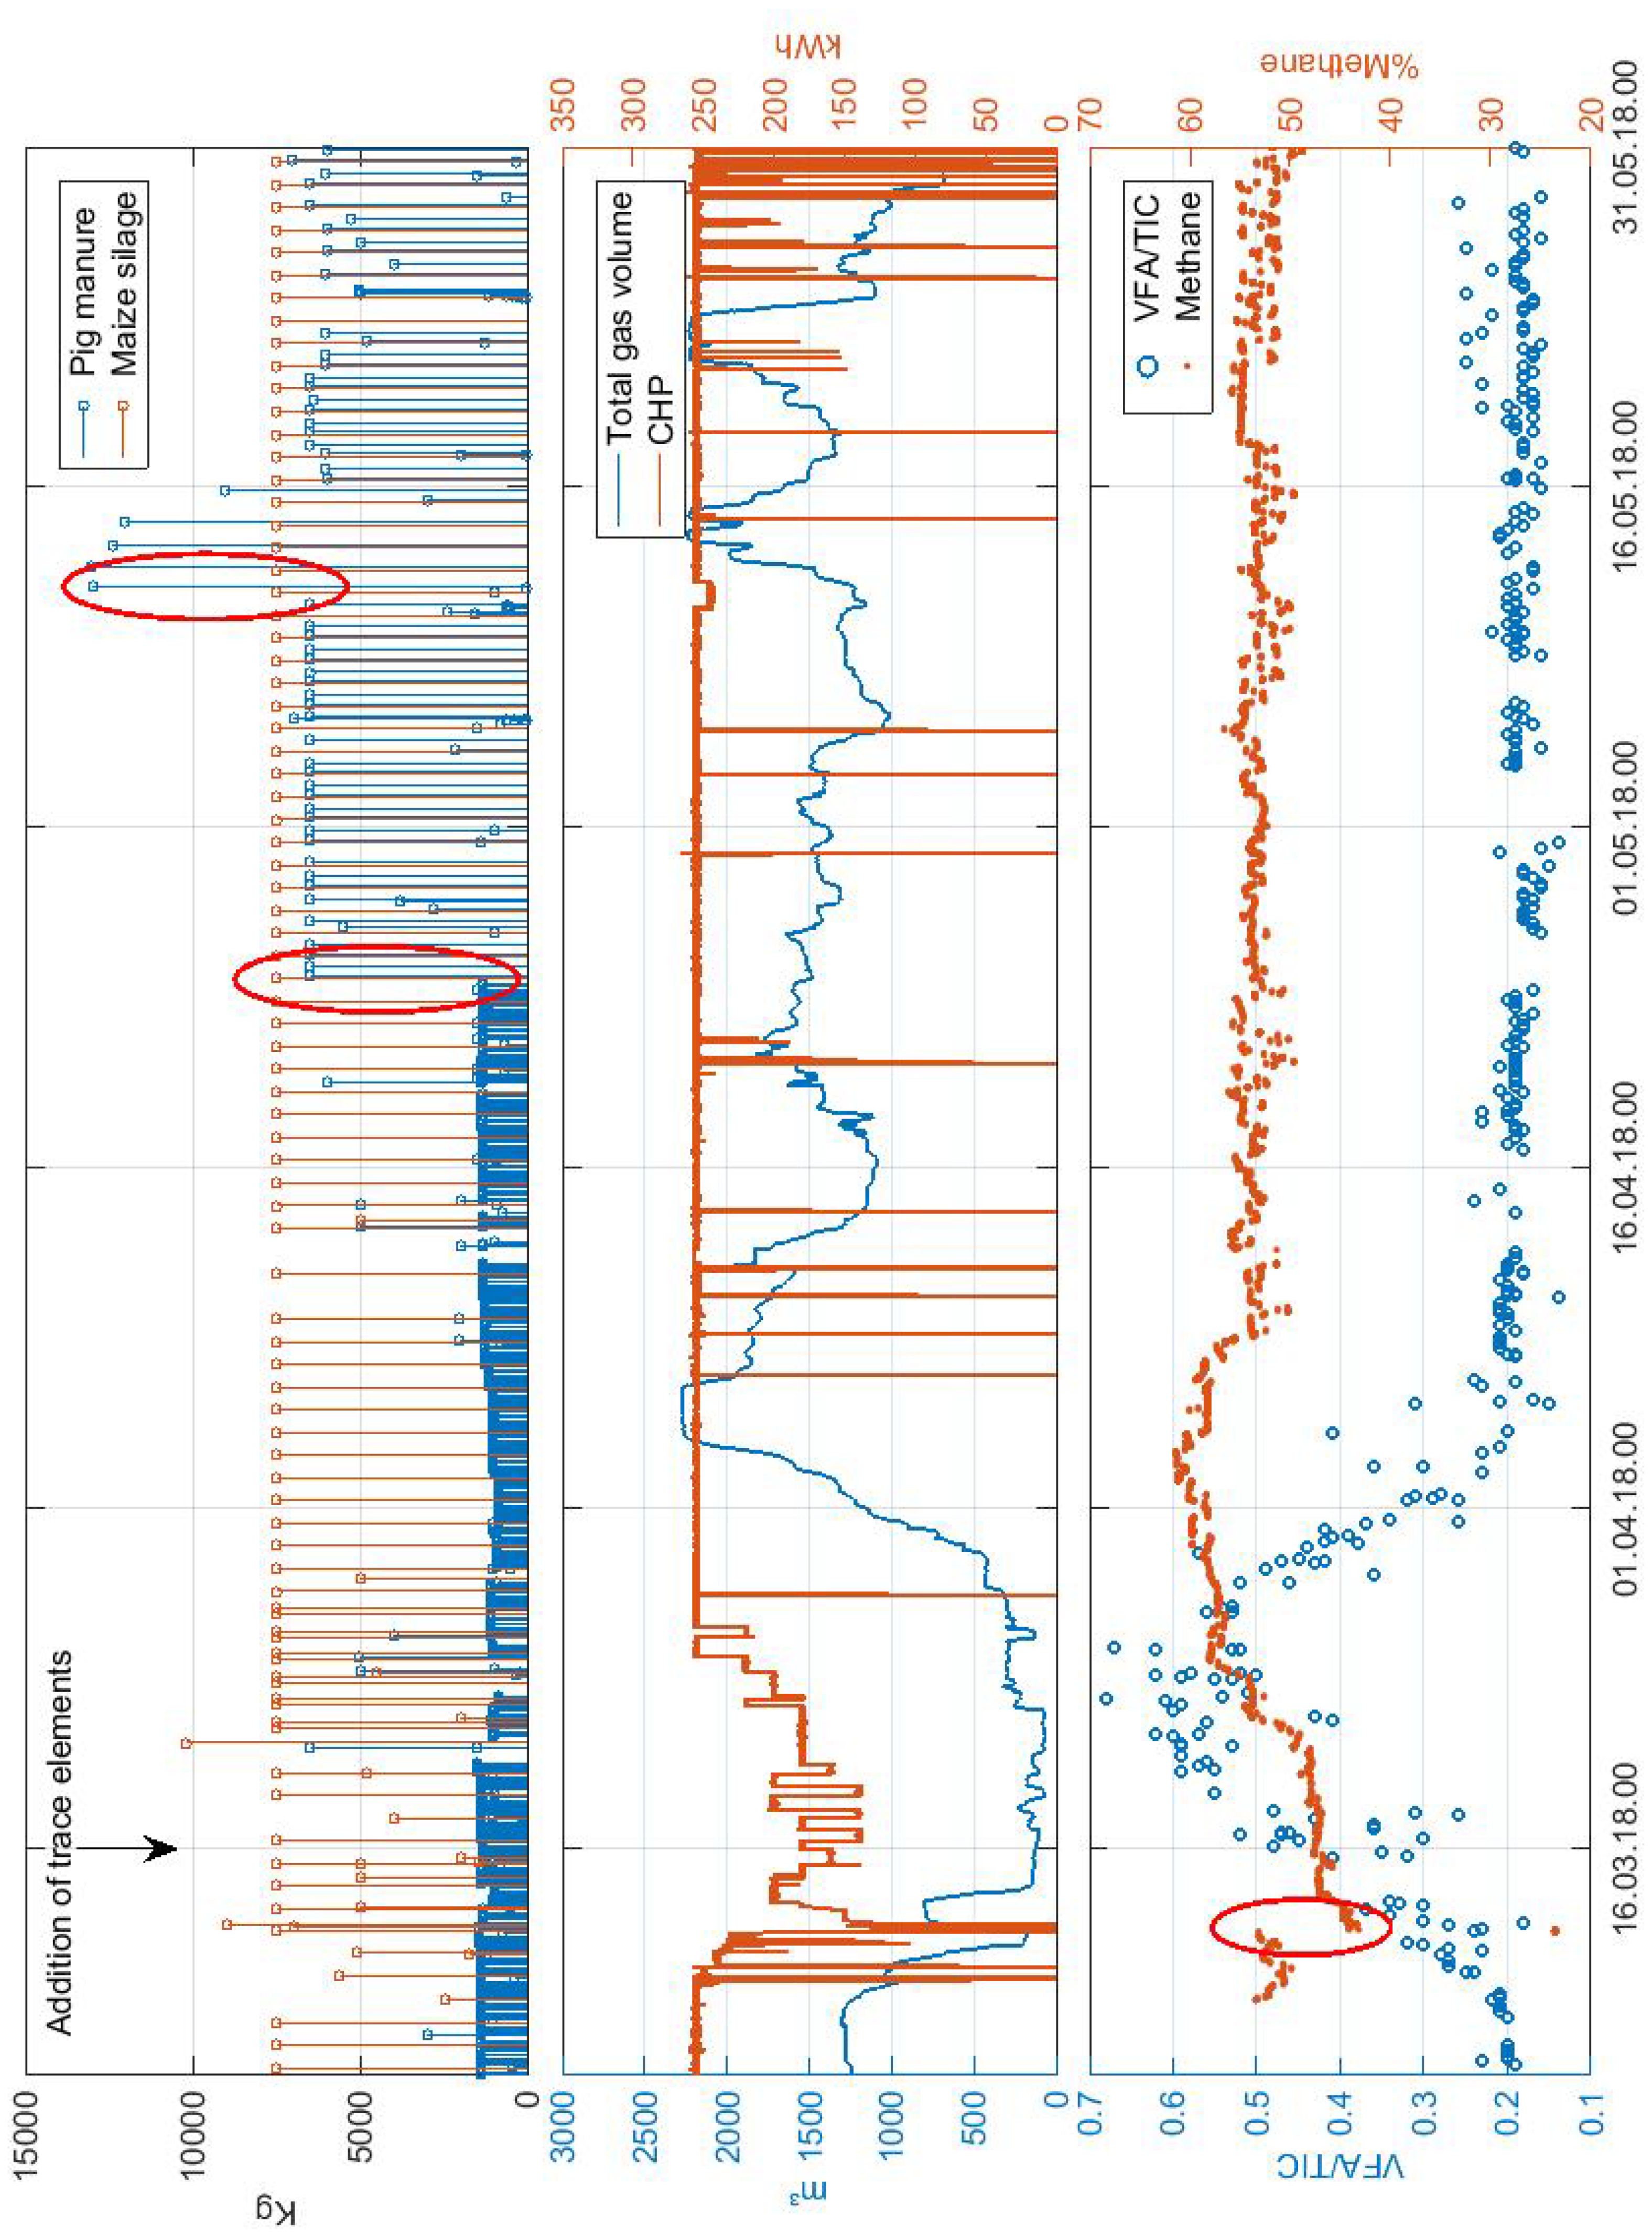
The biogas plant studied, described in Section 2.3, has been operating for 7 years without any serious biological process imbalance (based on the information supplied by the operator). In the two year supervision period of this work only 1 disturbance of the biological process occurred. Data from three months online monitoring is presented in Figure 7. This period was selected because it includes the process disturbance, recovery period and the change from constant feeding to feeding on demand during which online monitoring was in place to detect whether feeding modification negatively affects the biological process. Methane concentration was measured at the gas pipe just before the CHP unit using an Extox IMC 4D with an infrared absorption transmitter.
Before the imbalance period feeding was kept constant and the plant was operating at its design parameters. Maize silage dry matter was measured daily, showing no changes that explain the disturbance. Heating and agitation systems were working correctly.
A first variation of VFA/TIC was detected on 9 March 2018, which initially was assumed to be a failure in the online system, due to the characteristically stable operation of the plant. To examine this problem, gas analysis was put in operation on 9 March 2018 and, as concentration was in a normal range, no special attention was given to the VFA/TIC increase.
VFA/TIC values kept increasing in subsequent days and as the reason for the imbalance was not known, a sample was taken at 12 March 2018 to verify the measurements of the online monitoring and check if there was a shortcoming of trace elements. On the same day the plant owner agreed to reduce feeding because the gas storage was empty. Lab results for acetic acid arrived on 13 March 2018 showing a significant increase confirming the results obtained by the online monitoring, see Table 2.
The gas analyzer was calibrated on 13 March 2018 and methane concentration was 45%, indicating a process imbalance evidenced in the gas composition change with a higher percentage and a decrease of conversion of intermediate metabolites to .
On 16 March 2018 a solution containing Co and Ni (800 g CoCl·6HO+NiCl·6HO at 24.7%weight in Co and Ni ) was added, as it is known that agricultural plants often have a deficiency of both. Trace elements analysis was ready on the 22 March 2018, showing slightly lowered levels of cobalt.
The biogas plant was fed with almost the same quantity as before the process imbalance but with a lower gas yield, meanwhile the VFA/TIC value kept increasing. The plant owner resisted reducing feeding despite our recommendation. Pig manure feed was increased with the aim of increasing buffer capacity, due to its high nitrogen content generating short term reduction of VFA/TIC.
On 20 March 2018 the VFA/TIC level stabilized at a high level, and methane concentration started to rise, indicating an improvement of the biological process. Manure quantity was doubled in order to keep the system stable.
A second sample was sent to the lab on 26 March 2018 to verify online measurement. Lab results confirmed online results showing a large accumulation of VFA.
After the 27 March 2018 VFA/TIC started to decrease with an increase of methane concentration up to 60%, atypical for this kind of plant, clearly signaled by the conversion of acetic acid into methane. The gas yield increased and feeding was reduced because gas storage had reached its maximum. VFA/TIC returned to its normal level of 0.2 as did methane concentration.
On 25 April 2018 a control sample was taken confirming the recovery of the system and the results of the online monitoring which had remained constant since 9 April 2018.
The feeding program was modified on 23 April 2018 from feeding almost every 2 h to every 12 h. As the system was stable and with the aim of concentrating the biogas production to match price peaks the feeding program was then modified on 11 May 2018 to one feeding per day.
As the engine in the test plant operates at constant power, a match between gas production and consumption was not achieved. For that reason gas storage capacity went to high levels (over 90%) and the feeding had to be modified again on the 15 May 2018 to avoid gas loss.
4. Discussion
4.1. Sampling Parameters
VFA/TIC value is quite constant which makes it adequate for the characterization of the system. VFA and TIC on the other hand have large variations which do not correspond to variations in the digester conditions or feeding and make both parameters unsuitable for system characterization, see Figure 6. The source of these variations is presumed to be the difficulty of obtaining exactly the same sample volume of mL in every measurement. A larger sample will have a larger VFA (>) and a larger TIC (>) which will be misinterpreted as the device is calibrated for a fixed sample volume.
In Equations (1) and (2) in Section 2.1 the direct effect of sample volume variation can be seen. This is minimized when the ratio VFA/TIC is calculated using Equation (3). In the configuration with the lowest standard deviation, the difference between the maximum and minimum acid consumption from start pH to pH 5 is approx 3 mL. Assuming an extreme scenario in which this difference is only generated by the sample volume, maximum variation of VFA/TIC will be , about 15% of the mean value, but not in a range which could prevent identification of a process disturbance. Calculated values have lower variation, see Table 1.
Another possible source for variation in TIC and VFA are the remaining sampling errors due to incomplete fulfillment of TOS for practical reasons, see Section 2.2 and the assumption that digester conditions are static in the measurement interval.
Sampling device can only take a sample at the same time it means that the configuration comparison must be done with measurements from different days. Three different configurations were measured. Operating conditions, agitation and feeding schedule were kept constant. Digester conditions still could vary over time due to substrate characteristics. Maize is collected from a silo at which different varieties are located and is exposed to weather conditions which could also generate changes of the dry matter.
As expected, the configuration with the largest subsample volume (120 mL) and maximum number of subsamples (5) has the lowest standard deviation of the VFA/TIC value. All configurations are precise and characterized by low Relative Standard deviation , implying that any of the configurations can be used. Based on the theory of sampling guidelines, Section 2.2, the configuration with the largest sample volume was selected.
Measurements require a repetition to confirm the selected configuration and validate the results, but due to the operational expenditure to the biogas plant was not possible. This was not seen as critical due to the consistency of the mean values and their low , see Table 1.
Whether a sample is representative or not cannot be assessed from the sample itself, but requires knowledge of the sampling procedure in which it has been produced [2]. It is expected that a sample generated from the mixture of subsamples taken over a pumped volume of 2.5 m of the digester is more representative than a sample taken from the tank wall, because of heterogeneity of digester contents. However, it is also possible that digester heterogeneity requires a larger pumped volume to truly represent the digester situation. With the imposed restriction of 4 samples per day a larger pumped volume would not be possible because it involves the central pump operating only for sampling purposes which will not be accepted by the plant operator in the long term. Without modifying plant operation a sample representativity improvement can be achieved by increasing the sample volume with a larger collecting tank.
Sample representativity can also be increased by implementing on the secondary sampling a representative mass reduction. At the current configuration the 5 mL titration volume is obtained from the filtered sample and send it to the titration cell without involving a composite sampling. It is assumed that the filtered sample is homogeneous and for that reason can be directly pumped.
4.2. Measurements in the Commercial Plant
The reason for the process disturbance is still not clear but it seems to be related to low cobalt levels, see Table 2. Addition of trace elements did not produce an immediate reaction in the biogas production; for that reason it is possible that the imbalance was generated by another source or the bacteria simply required a longer time to recover.
Online monitoring enables identification of the current state of the process, with VFA/TIC changes giving an indication of the stability of the system. VFA/TIC are not directly related with the concentration or function of methanogenic bacteria. This was observed in the period between 20 to 25 March 2018 in which a high activity of methanogenic archaea converted VFA to methane, but VFA/TIC values were high, oscillating around 0.55. For that reason, behavior trends and not single value are to be considered in system monitoring.
VFA/TIC kept constant at the feeding transition on the 23 April 2018 from 1.3 ton almost every 2 h to 6.5 tons every 12 h. The same result was achieved in the transition on 11 May 2018 to 13 tons every 24 h.
5. Conclusions
The system presented enables the representative sampling from heterogeneous liquid systems, e.g., biogas slurry, where the sample size is of the population/set. The proof of suitability of the system was given in a 2 years operational phase on an agricultural biogas plant. Process stability, especially when operating the biogas plant by feeding-on-demand, could be analyzed on a high frequency and reliability.
External lab results validated the indication given by online monitoring, allowing a high density of data to check the process evolution. The results are available immediately allowing a faster reaction time without waiting the 2 or 3 days required by the laboratory.
The sampling device was configured to determine the sampling parameters with the lowest standard deviation. It was found that the configuration with the largest subsample volume and maximum number of increments minimized this deviation. Other configurations are also accurate, making them also suitable, but to agree with sampling theory the larger sample volume was selected.
The dynamic nature of the biogas plant reduced comparability of the sampling configurations between the sampling days. For optimal comparability of the different configurations a sampling device for each configuration must be installed at the pump manifold and operated simultaneously to minimize the effect of working in a dynamic system.
For the supervision of the biological process the ratio VFA/TIC was used, as its value was almost constant in all the measurements. In view of a commercial application the main lessons learned are to improve pump accuracy and implement a continuous volume measurements to reduce error generated by differences in titration volume and also to allow comparison of VFA and TIC.
The analytical measurement implemented used an automatic titration unit, but other parameters like Redox potential or dissolved hydrogen in the liquid phase can also be measured. Comparison of these will allow determination of the fastest, most precise and most valid parameter.
6. Patents
Wilches, C. Vorrichtung zum Entnehmen zumindest einer Biomase-Probe aus wenigstens einem Fermenter insbesondere einer Biogasanlage. DE 10 2016 110 482, 7 June 2016.
Author Contributions
C.W. developed main idea of the current study, performed and interpreted the analysis, and wrote the manuscript. M.V. helps with the mechanical and electrical construction of the sampling device. K.H. reviewed the paper, providing general supervision guidance and support writing process and M.N. reviewed the paper, providing general supervision and guidance. All authors have read and approved the final manuscript.
Funding
This research was funded by German Federal Ministry of Economic Affairs and Energy in the frame of a ZIM program (Zentrales Innovationsprogramm Mittelstand) biomastec – Raman-Spektro, grant number 16KN 0177337.
Conflicts of Interest
The authors declare no conflict of interest. The funders had no role in the design of the study; in the collection, analyses, or interpretation of data; in the writing of the manuscript, or in the decision to publish the results.
Abbreviations
The following abbreviations are used in this manuscript:
| CSTR | Continuous Stirring Tank Reactors |
| VFA | Volatile Fatty Acids |
| TIC | Total Inorganic Carbon |
| TOS | Theory of Sampling |
| NIRS | Near Infrared Spectroscopy |
| CHP | Combined Heat and Power |
References
- Gy, P. Sampling for Analytical Purposes; Wiley: Chichester, UK, 1999; p. 153. [Google Scholar]
- Holm-Nielsen, J.B.; Dahl, C.K.; Esbensen, K.H. Representative sampling for process analytical characterization of heterogeneous bioslurry systems—A reference study of sampling issues in PAT. Chemom. Intell. Lab. Syst. 2006, 83, 114–126. [Google Scholar] [CrossRef]
- Madsen, M.; Holm-Nielsen, J.B.; Esbensen, K.H. Monitoring of anaerobic digestion processes: A review perspective. Renew. Sustain. Energy Rev. 2011, 15, 3141–3155. [Google Scholar] [CrossRef]
- Ward, A.J.; Hobbs, P.J.; Holliman, P.J.; Jones, D.L. Optimisation of the anaerobic digestion of agricultural resources. Bioresour. Technol. 2008, 99, 7928–7940. [Google Scholar] [CrossRef] [PubMed]
- Hennig, T.; Dudlik, A.; Deerberg, G. Simulation der Strömung in Fermentern von Biogasanlagen1. Chem. Ing. Tech. 2011, 83, 331–339. [Google Scholar] [CrossRef]
- Stocker, G. Biobeta Sediment Check: Eine Praxisgeprobte Innovation zur Ermittlung von Ablagerungen in Gasdichte Behältern (Europäische Patentanfrage); Biogas 2018; ProFair Consult + Project GmbH: Hildesheim, Germany, 2018; pp. 125–131. [Google Scholar]
- Lemmer, A.; Naegele, H.J.; Sondermann, J. How Efficient are Agitators in Biogas Digesters? Determination of the Efficiency of Submersible Motor Mixers and Incline Agitators by Measuring Nutrient Distribution in Full-Scale Agricultural Biogas Digesters. Energies 2013, 6, 6255–6273. [Google Scholar] [CrossRef]
- Naegele, H.J.; Monch-Tegeder, M.; Haag, N.L.; Oechsner, H. Effect of substrate pretreatment on particle size distribution in a full-scale research biogas plant. Bioresour. Technol. 2014, 172, 396–402. [Google Scholar] [CrossRef] [PubMed]
- Boe, K.; Batstone, D.J.; Steyer, J.P.; Angelidaki, I. State indicators for monitoring the anaerobic digestion process. Water Res. 2010, 44, 5973–5980. [Google Scholar] [CrossRef] [PubMed]
- Drosg, B. Process Monitoring in Biogas Plants; IEA Bioenergy: Paris, France, 2013; p. 40. [Google Scholar]
- Ahring, B.K.; Sandberg, M.; Angelidaki, I. Volatile Fatty Acids as indicators of Process Inbalance in anaerobic digesters. Appl. Microbiol. Biotechnol. 1995, 43, 559–565. [Google Scholar] [CrossRef]
- Méndez-Acosta, H.O.; Palacios-Ruiz, B.; Alcaraz-González, V.; González-Álvarez, V.; García-Sandoval, J.P. A robust control scheme to improve the stability of anaerobic digestion processes. J. Process Control. 2010, 20, 375–383. [Google Scholar] [CrossRef]
- Sun, H.; Wu, S.; Dong, R. Monitoring Volatile Fatty Acids and Carbonate Alkalinity in Anaerobic Digestion: Titration Methodologies. Chem. Eng. Technol. 2016, 39, 599–610. [Google Scholar] [CrossRef]
- Jimenez, J.; Latrille, E.; Harmand, J.; Robles, A.; Ferrer, J.; Gaida, D.; Wolf, C.; Mairet, F.; Bernard, O.; Alcaraz-Gonzalez, V.; et al. Instrumentation and control of anaerobic digestion processes: A review and some research challenges. Rev. Environ. Sci. Bio/Technol. 2015, 14, 615–648. [Google Scholar] [CrossRef]
- Bakeev, K.A. Process Analytical Technology: Spectroscopic Tools and Implementation Strategies for the Chemical and Pharmaceutical Industries, 2nd ed.; Wiley: Chichester, UK, 2010; p. 576. [Google Scholar]
- Petry, R.; Schmitt, M.; Popp, J. Raman Spectroscopy-A Prospective Tool in the Life Sciences. ChemPhysChem 2003, 4, 14–30. [Google Scholar] [CrossRef]
- Holm-Nielsen, J.B. Process Analytical Technologies for Anaerobic Digestion Systems: Robust Biomass Characterisation, Process Analytical Chemometrics, and Process Optimisation. Ph.D. Thesis, Aalborg University, Esbjerg, Denmark, 2008. [Google Scholar]
- Krapf, L.C.; Heuwinkel, H.; Schmidhalter, U.; Gronauer, A. The potential for online monitoring of short-term process dynamics in anaerobic digestion using near-infrared spectroscopy. Biomass Bioenergy 2013, 48, 224–230. [Google Scholar] [CrossRef]
- Falk, H.M.; Reichling, P.; Andersen, C.; Benz, R. Online monitoring of concentration and dynamics of volatile fatty acids in anaerobic digestion processes with mid-infrared spectroscopy. Bioprocess Biosyst. Eng. 2015, 38, 237–249. [Google Scholar] [CrossRef]
- Schelter, M.; Zosel, J.; Berthold, W. Measurement of Dissolved Gases in Anaerobic Biogenic Media. In Proceedings of the Sensor Test Conferences, Nuremberg, Germany, 7–9 June 2011. [Google Scholar]
- DBFZ. Collection of Methods for Biogas: Methods to Determine Parameters for Analysis Purposes and Parameters that Describe Processes in the Biogas Sector. Available online: https://www.energetische-biomassenutzung.de/fileadmin/media/6_Publikationen/07_MMS_Biogas_en_web.pdf (accessed on 26 March 2019).
- Feitkenhauer, H.; Sachs, J.; Meyer, U. On-line titration of volatile fatty acids for the process control of anaerobic digestion plants. Water Res. 2002, 36, 212–218. [Google Scholar] [CrossRef]
- Weiland, P. Biogas production: Current state and perspectives. Appl. Microbiol. Biotechnol. 2010, 85, 849–860. [Google Scholar] [CrossRef]
- Molina, F.; Ruiz-Filippi, G.; Garcia, C.; Lema, J.M.; Roca, E. Pilot-Scale Validation of a New Sensor for On-Line Analysis of Volatile Fatty Acids and Alkalinity in Anaerobic Wastewater Treatment Plants. Environ. Eng. Sci. 2009, 26, 641–649. [Google Scholar] [CrossRef]
- Palacio-Barco, E.; Robert-Peillard, F.; Boudenne, J.L.; Coulomb, B. On-line analysis of volatile fatty acids in anaerobic treatment processes. Anal. Chim. Acta 2010, 668, 74–79. [Google Scholar] [CrossRef]
- Pind, P.F.; Angelidaki, I.; Ahring, B.K. A new VFA sensor technique for anaerobic reactor systems. Biotechnol. Bioeng. 2003, 82, 54–61. [Google Scholar] [CrossRef]
- Lomborg, C.J.; Holm-Nielsen, J.B.; Oleskowicz-Popiel, P.; Esbensen, K.H. Near infrared and acoustic chemometrics monitoring of volatile fatty acids and dry matter during co-digestion of manure and maize silage. Bioresour. Technol. 2009, 100, 1711–1719. [Google Scholar] [CrossRef]
- Ihunegbo, F.N.; Madsen, M.; Esbensen, K.H.; Holm-Nielsen, J.B.; Halstensen, M. Acoustic chemometric prediction of total solids in bioslurry: A full-scale feasibility study for on-line biogas process monitoring. Chemom. Intell. Lab. Syst. 2012, 110, 135–143. [Google Scholar] [CrossRef]
- Weiland, P.; Rieger, C. Prozessstörungen frühzeitig erkennen. Biogas J. 2006, 4, 18–20. [Google Scholar]
- Wang, L.H.; Wang, Q.; Cai, W.; Sun, X. Influence of mixing proportion on the solid-state anaerobic co-digestion of distiller’s grains and food waste. Biosyst. Eng. 2012, 112, 130–137. [Google Scholar] [CrossRef]
- Sun, H.; Guo, J.; Wu, S.; Liu, F.; Dong, R. Development and validation of a simplified titration method for monitoring volatile fatty acids in anaerobic digestion. Waste Manag. 2017, 67, 43–50. [Google Scholar] [CrossRef] [PubMed]
- Lützhøft, H.C.H.; Boe, K.; Fang, C.; Angelidaki, I. Comparison of VFA titration procedures used for monitoring the biogas process. Water Res. 2014, 54, 262–272. [Google Scholar] [CrossRef]
- Petersen, L.; Minkkinen, P.; Esbensen, K.H. Representative sampling for reliable data analysis: Theory of Sampling. Chemom. Intell. Lab. Syst. 2005, 77, 261–277. [Google Scholar] [CrossRef]
- Petersen, L.; Esbensen, K.H. Representative process sampling for reliable data analysis—A tutorial. J. Chemom. 2005, 19, 625–647. [Google Scholar] [CrossRef]
- Smith, P.L. A Primer for Sampling Solids, Liquids, and Gases: Based on the Seven Sampling Errors of Pierre Gy; ASA-SIAM Series on Statistics and Applied Probability; Society for Industrial and Applied Mathematics and American Statistical Association: Philadelphia, PA, USA; Alexandria, VA, USA, 2001; Volume 8, p. 98. [Google Scholar]
- Wilches, C. Vorrichtung zum Entnehmen Zumindest Einer Biomase-Probe aus Wenigstens Einem Fermenter Insbesondere Einer Biogasanlage. German Patent DE 10 2016 110 482, 7 June 2016. [Google Scholar]
- Schneider, N. Density and Viscosity of Biomass from Agricultural Biogas Plants. Ph.D. Thesis, Ruhr Universität Bochum, Bochum, Germany, 2018. [Google Scholar]
- Nacke, T.; Göller, A. Schlussbericht zum Vorhaben. Verbundvorhaben: Automatisierte Prozessführung von Biogasanlagen auf Basis der Online-Massebilanzierung der Prozessubstrate und Gaserträge; IBA: Leipzig, Germany, 2012. [Google Scholar]
- García-Gen, S.; Rodríguez, J.; Lema, J.M. Optimisation of substrate blends in anaerobic co-digestion using adaptive linear programming. Bioresour. Technol. 2014, 173, 159–167. [Google Scholar] [CrossRef]
- Mauky, E.; Jacobi, H.F.; Liebetrau, J.; Nelles, M. Flexible biogas production for demand-driven energy supply–feeding strategies and types of substrates. Bioresour. Technol. 2015, 178, 262–269. [Google Scholar] [CrossRef]
- Mauky, E.; Weinrich, S.; Nägele, H.J.; Jacobi, H.F.; Liebetrau, J.; Nelles, M. Model Predictive Control for Demand-Driven Biogas Production in Full Scale. Chem. Eng. Technol. 2016, 39, 652–664. [Google Scholar] [CrossRef]
- Mauky, E.; Weinrich, S.; Jacobi, H.F.; Nägele, H.J.; Liebetrau, J.; Nelles, M. Demand-driven biogas production by flexible feeding in full-scale - Process stability and flexibility potentials. Anaerobe 2017, 46, 86–95. [Google Scholar] [CrossRef] [PubMed]
Figure 1.
Process diagram sampling device.

Figure 2.
Subsample dosing. 1: Valves position before taking subsample. 2: Valves position after taking the sample. (red = digestate, blue = air).
Figure 2.
Subsample dosing. 1: Valves position before taking subsample. 2: Valves position after taking the sample. (red = digestate, blue = air).

Figure 3.
Physical construction of the three valves Vent_PE1, Vent_PE3 and Vent_PE3 to define subsample volume according to the enclosed air volume, .
Figure 3.
Physical construction of the three valves Vent_PE1, Vent_PE3 and Vent_PE3 to define subsample volume according to the enclosed air volume, .

Figure 4.
Above left: Sampling system installed at the research plant. Marked sample collection. Above right: Dosing unit and titrator. Below: Visualization for the operator (key: a. Connection pump manifold; b. Collecting Tank; c. Pressure air; d. Drain; e. Watter; f. Venting; g. Peristaltic dosing pump; h. Titration cell; i. Peristaltic pump; j. Distilled water; k. KCL-solution).

Figure 5.
Sampling parameters.

Figure 6.
Configurations comparison. Lowest graphic presents corresponding feeding and agitation schedule.
Figure 6.
Configurations comparison. Lowest graphic presents corresponding feeding and agitation schedule.

Figure 7.
Three months online monitoring. On the abscissa time is given in days and on the ordinate the following aspects are given. Left: presents the digester feeding. Two feeding transition of maize silage can be identified from 1300 kg almost every 2 h to 6500 kg every 12 h and later 13,000 kg once a day. Middle: presents gas storage volume and CHP electrical generation. Generated power was reduced due to the low gas storage levels. Right: presents results of online monitoring and methane content. Process disturbance can be identified by the increase of the VFA/TIC. Calibration of the gas analyzer is marked showing a difference in the methane content from 53% to 45%.


Table 1.
Configuration comparison VFA/TIC parameters.
| Configuration | Max x | Min x | |||
|---|---|---|---|---|---|
| 5 subsamples of 120 mL | 0.004 | 0.167 | 2.4% | 0.173 | 0.162 |
| 4 subsamples of 120 mL | 0.009 | 0.167 | 5.5% | 0.183 | 0.148 |
| 5 subsamples of 96 mL | 0.008 | 0.170 | 4.7% | 0.183 | 0.160 |
Table 2.
Lab results biological supervision including trace elements concentration from the last 2 years. Lowest Cobalt concentration is found on the 12 March 2018. Dry Matter method (VDLUFA I, A 2.1.1; 1991 (mod.)), Acetic acid equivalent method (VDLUFA II, 3.2.6, 1995), Ni, Co, Mo, Se method (DIN EN ISO 17294-2; 2005-02 (mod.)).
| Date | 16 August 2016 | 7 June 2017 | 12 March 2018 | 26 March 2018 | 25 April 2018 |
|---|---|---|---|---|---|
| Dry Matter/[%] | 6.6 | 8.7 | 7.4 | 7 | |
| Acetic acid equivalent/[g/kg] | |||||
| Ni/[mg/kg] | |||||
| Co/[mg/kg] | |||||
| Mo/[mg/kg] | |||||
| Se/[mg/kg] |
© 2019 by the authors. Licensee MDPI, Basel, Switzerland. This article is an open access article distributed under the terms and conditions of the Creative Commons Attribution (CC BY) license (http://creativecommons.org/licenses/by/4.0/).
Share and Cite
MDPI and ACS Style
Wilches, C.; Vaske, M.; Hartmann, K.; Nelles, M. Representative Sampling Implementation in Online VFA/TIC Monitoring for Anaerobic Digestion. Energies 2019, 12, 1179. https://0-doi-org.brum.beds.ac.uk/10.3390/en12061179
AMA Style
Wilches C, Vaske M, Hartmann K, Nelles M. Representative Sampling Implementation in Online VFA/TIC Monitoring for Anaerobic Digestion. Energies. 2019; 12(6):1179. https://0-doi-org.brum.beds.ac.uk/10.3390/en12061179
Chicago/Turabian StyleWilches, Camilo, Maik Vaske, Kilian Hartmann, and Michael Nelles. 2019. "Representative Sampling Implementation in Online VFA/TIC Monitoring for Anaerobic Digestion" Energies 12, no. 6: 1179. https://0-doi-org.brum.beds.ac.uk/10.3390/en12061179
Note that from the first issue of 2016, this journal uses article numbers instead of page numbers. See further details here.