LCOE Analysis of Tower Concentrating Solar Power Plants Using Different Molten-Salts for Thermal Energy Storage in China


School of Mechanical Engineering and Automation, Harbin Institute of Technology, Shenzhen 518055, China
*
Author to whom correspondence should be addressed.
Energies 2019, 12(7), 1394; https://0-doi-org.brum.beds.ac.uk/10.3390/en12071394
Submission received: 11 March 2019
/
Revised: 5 April 2019
/
Accepted: 8 April 2019
/
Published: 11 April 2019
(This article belongs to the Special Issue Selected Papers from the 9th Edition of the International SOLARIS Conference)
Abstract
:In recent years, the Chinese government has vigorously promoted the development of concentrating solar power (CSP) technology. For the commercialization of CSP technology, economically competitive costs of electricity generation is one of the major obstacles. However, studies of electricity generation cost analysis for CSP systems in China, particularly for the tower systems, are quite limited. This paper conducts an economic analysis by applying a levelized cost of electricity (LCOE) model for 100 MW tower CSP plants in five locations in China with four different molten-salts for thermal energy storage (TES). The results show that it is inappropriate to build a tower CSP plant nearby Shenzhen and Shanghai. The solar salt (NaNO3-KNO3, 60-40 wt.%) has lower LCOE than the other three new molten-salts. In order to calculate the time when the grid parity would be reached, four scenarios for CSP development roadmap proposed by International Energy Agency (IEA) were considered in this study. It was found that the LCOE of tower CSP would reach the grid parity in the years of 2038–2041 in the case of no future penalties for the CO2 emissions. This study can provide support information for the Chinese government to formulate incentive policies for the CSP industry.
1. Introduction
Concentrating solar power (CSP) technology is one of the most promising renewable energy-based electricity generation technologies to deal with the increasing demand of power consumption and environmental sustainability. It can generate renewable electricity from direct sunlight and produce nearly no greenhouse gas emissions. In addition, compared to photovoltaic (PV) cells, the CSP systems can deliver dispatchable electricity regardless of the weather conditions by integrating with thermal energy storage (TES) units. In recent years, the Chinese government has vigorously promoted the development of CSP technology. The construction of CSP plants in China has increased at a great rate since starting in 2013 [1]. The installed capacity was about 29.3 MWe by the end of 2017, which was an increase of 3.53% over that in 2016. Meanwhile, the global installation capacity increase rate was 2.3% [2].
For the commercialization of CSP technology, the low cost of the electricity generation is one of the major obstacles. Among different types of CSP technologies, the solar power tower technology can achieve higher operating temperature compared to the parabolic trough and linear Fresnel technologies. It can yield greater efficiency of thermal-to-electric conversion in the power block and result in lower cost for TES [1]. As a key factor to evaluate the economic feasibility of CSP systems, the electricity generation cost needs to be appropriately estimated [3,4]. Hernández-Moro and Martínez-Duart [5,6] established a mathematic model of the levelized cost of electricity (LCOE) for estimating the electricity generation cost of CSP plants. The future evolution (2010–2050) of the LCOEs based on the International Energy Agency (IEA) roadmaps for the cumulative installed capacity was predicted. It was found that the predicted LCOEs strongly depended, not only on the particular values of the cumulative installed capacity function in the targeted years, but also on the specific curved time-paths followed by the function. Parrado et al. [7] used the LCOE model to develop an economic analysis for a 50 MW CSP plant with five new storage materials in northern Chile between 2014 and 2050. The results showed those new molten-salts could reduce the storage costs in CSP plants, especially the molten-salt composed of Ca(NO3)2-NaNO3-KNO3 (48-7-45 wt.%). Additionally, a comparison for different locations in three countries (Chile, Spain and USA) was made which indicated that northern Chile had great potential to implement CSP plants. Hinkley et al. [8] summarized the costs of CSP plants deployed internationally and estimated the expected costs of trough and tower technologies in Australia. They found that there was significant potential to reduce the LCOE through operation at higher temperatures, which would improve the efficiency of a CSP plant. Dieckmann et al. [9] evaluated the future technical innovations and cost reduction potential for the parabolic trough and solar tower CSP technologies based on current research and development activities, ongoing commercial developments, and growth in the market scale. They calculated the LCOEs of those two technologies in 2015 and 2025 and found that the values matched very well to the published power purchase agreements (PPA) for the NOOR II and III power plants in Morocco when accounting for favorable financing conditions. The results also indicated that financing conditions were a major cost driver and offered potential for further cost reduction. Simsek et al. [10] analyzed the effects of incentives and financial conditions on the LCOE and government cost for both parabolic trough and solar tower CSP projects in Chile. The results showed that the debt fraction and discount rate indicated sensitivities on both the LCOE and government cost. In contrast, debt interest rate only showed significant sensitivity on the LCOE.
However, the research of electricity generation cost analysis for CSP systems in China, particularly for the tower systems, are quite limited. As such, the electricity generation cost of CSP systems in China was reported to be approximately triple in comparison with the current feed-in tariff [6,11,12,13]. Zhao et al. [13] used a LCOE model to conduct a sensitivity analysis to examine the influences of investment over the construction period, annual operation and maintenance cost, annual electricity production, and the discount rate on the LCOE based upon a 50 MW parabolic trough CSP plant with 4 h TES in Erdos, Inner Mongolia. Furthermore, the impacts of incentive policies such as preferential loans, tax support, and zero land cost for CSP plants were also analyzed. They indicated that the LCOE could be reduced to 1.173 RMB kWh−1 when those incentive policies functioned in parallel. Zhu et al. [14] studied and benchmarked the electricity cost of parabolic trough, tower, and dish CSP technologies in China by applying a LCOE model using plant-specific data in a national CSP database while cooperating with local CSP experts. The results showed that the LCOEs of 2014 for different CSP plants were in a range of 1.2–2.7 RMB kWh−1 and tower CSP might be the most promising CSP technology in China. Li et al. [15] presented an integration analysis of geographic assessment, technical, and economic feasibility of the parabolic trough, tower, and dish Stirling CSP systems to investigate their development potential under Chinese conditions in the period of 2010–2050. The analysis demonstrated that China had sufficient potential for the utilization of parabolic trough and tower systems. Wu et al. [16] analyzed the effects of solar multiples and full load hours of heat storage on the generated electricity, net efficiency and LCOE of a Chinese demonstration trough CSP plant. The results showed that there existed the optimal solar multiples and full load hours of heat storage to reach the lowest LCOE and realize the highest economic benefit. Yang et al. [17] adopted the static payback period, net present value, net present value rate, and internal rate of return to calculate and discuss the cost-benefit of different CSP technologies based on the related data and design parameters of the first CSP demonstration projects in China. From the project perspective, a vast majority of CSP projects had a strong economic feasibility under the current technical level, policy, and resource endowment of China. The larger TES capacity usually could lead to a good cost-benefit. From the perspective of technologies, the cost-benefit of solar tower CSP technology was better than that of parabolic trough and linear Fresnel CSP technologies. And the influence of technology type on the cost-benefit of CSP was more important than that of TES capacity. Ren et al. [18] developed a cost-benefit model, which covers the multiple indices of the total investment payback period, net present value per unit installed capacity, internal rate of return, and LCOE, to analyze the economic benefit of CSP industry in China. They found that the generated energy, DNI, construction costs, and loans ratio had significant effects on the economic performance of CSP industry, while the influences of operation-maintenance costs and interest rate were relatively smaller but still should not be ignored.
Selecting the most appropriate sites is very critical for CSP implementation in China. Many geographic conditions need to be considered such as solar resource, water resource, energy demand, and power grid accessibility [15,19]. In addition, considering that no specific policies for the CSP industry have been enacted yet in China [13], more data about the CSP electricity cost is necessary for policy makers to make decisions. Thus, this paper conducted an economic analysis by applying a LCOE model for 100 MW tower CSP plants (shown in Figure 1) in China with four different molten-salts for TES. In view of the geographic conditions, five locations with various direct normal irradiance (DNI) were selected. The calculations of both the present (2017) value of LCOE and its future evaluation for the period (2018–2050) under four scenarios proposed by the IEA (i.e. Blue Map [20], Global Outlook Advanced [21], Global Outlook Moderate [21], and Roadmap [22]) were presented. The time when the CSP grid parities would be attained was estimated. Moreover, effects of the land cost, TES capacity, learning rate, discount rate, lifetime, degradation rate, operation-maintenance cost, and insurance cost on the LCOE were also investigated.
2. LCOE Model for CSP Systems
The LCOE is one of the most frequently used characteristics to evaluate the electricity generation cost of different technologies, which calculates the cost of electricity during the lifetime and takes into account the time value of money and the risks. It is equal to the sum of all the discounted costs incurred during the lifetime of the project divided by the units of discounted energy produced over the entire lifetime [24] and can be expressed as follows:
where all the symbols in the equation are summarized in Table 1. The numerator includes the capital cost of the system, land cost, operation and maintenance cost, and insurance cost. The denominator also shows the sum of the real electricity generated during the lifetime of the plant divided by the discount rate. The initial costs of the plant are considered as being paid up-front in this model, thereafter the capital and land costs do not have to be discounted. However, the operation and maintenance and insurance costs should be discounted as they are paid annually throughout the lifetime of the plant, which can be evaluated at a constant percentage of the total cost of the system. In addition, the annual electricity production can be directly calculated based on the available solar resource in cooperation with the tracking factor, performance factor, and degradation rate.
2.1. Capital Cost of the CSP System
Several studies demonstrated that reduction in the capital costs of CSP plants can be characterized by the learning curves [25,26] and the cost of a system installed in a certain year, Ct, can be described as a function of the global cumulative installed capacity expressed as follows [6]:
where Qt is the global cumulative installed capacity in a certain year (GW); Q0 is the cumulative installed capacity in the reference year (GW); LR is the learning rate (%); C0 is the capital cost of the CSP system installed in the reference year (RMB W−1). In this paper, the year of 2017 was taken as the reference year and the capital cost of the LCOE present value was determined by C0 which was calculated by System Advisor Model (SAM) of National Renewable Energy Laboratory (NREL) [23].
2.2. Cumulative Installed Capacity
The global cumulative installed capacity by the end of 2017 was reported to be 5.133 GW [2]. In order to evaluate the future cumulative installed capacity during the years of 2018–2050, four scenarios of CSP development roadmap proposed by IEA are used and listed in Table 2. According to Hernández-Moro et al. [6] and Li et al. [15], the logistic function of an S-shaped curve can describe the objectives of cumulative installed capacity for Blue Map scenario and a 3-order polynomial equation can fit the objectives for the other scenarios as follows:
where t is the year and the parameters of r, M and ki (i = 1, 2, 3) are also summarized in Table 2. It should be noticed that the values calculated by Equation (3) were only used for the years of 2018–2050 (shown in Figure 2) when estimating the future evolution of LCOE, while Qt equaling to Q0 was used at the year of 2017 to calculate the present value of LCOE. It can be seen that the Global Outlook Advanced scenario is the most ambitious because it considers all useful policies to CSP technology, along the lines of the industry’s recommendations, from around the world. The objective of cumulative installed capacity continues to grow fast and reaches 1524 GW by 2050. The Blue Map scenario has the greatest increase of the cumulative installed capacity during 2025 to 2040, but the objective has seen little growth after 2045 and reaches 630 GW by 2050 which is less than half of the Global Outlook Advanced scenario.
2.3. Learning Rate
2.4. Land Cost
Many geographic conditions need to be considered while selecting a potential location for installing a tower CSP plant in China, including solar resource, water resource, energy demand, and power grid accessibility [15,19]. Water is a major concern in deciding on the cooling mode. Adopting the dry cooling technology would increase the investment of 7%–9% and reduce the electricity output by 5% [31]. The energy demand is another crucial factor for site selection. The eastern region of China has the most population and the highest energy demand. However, the northwestern part has the highest DNI.
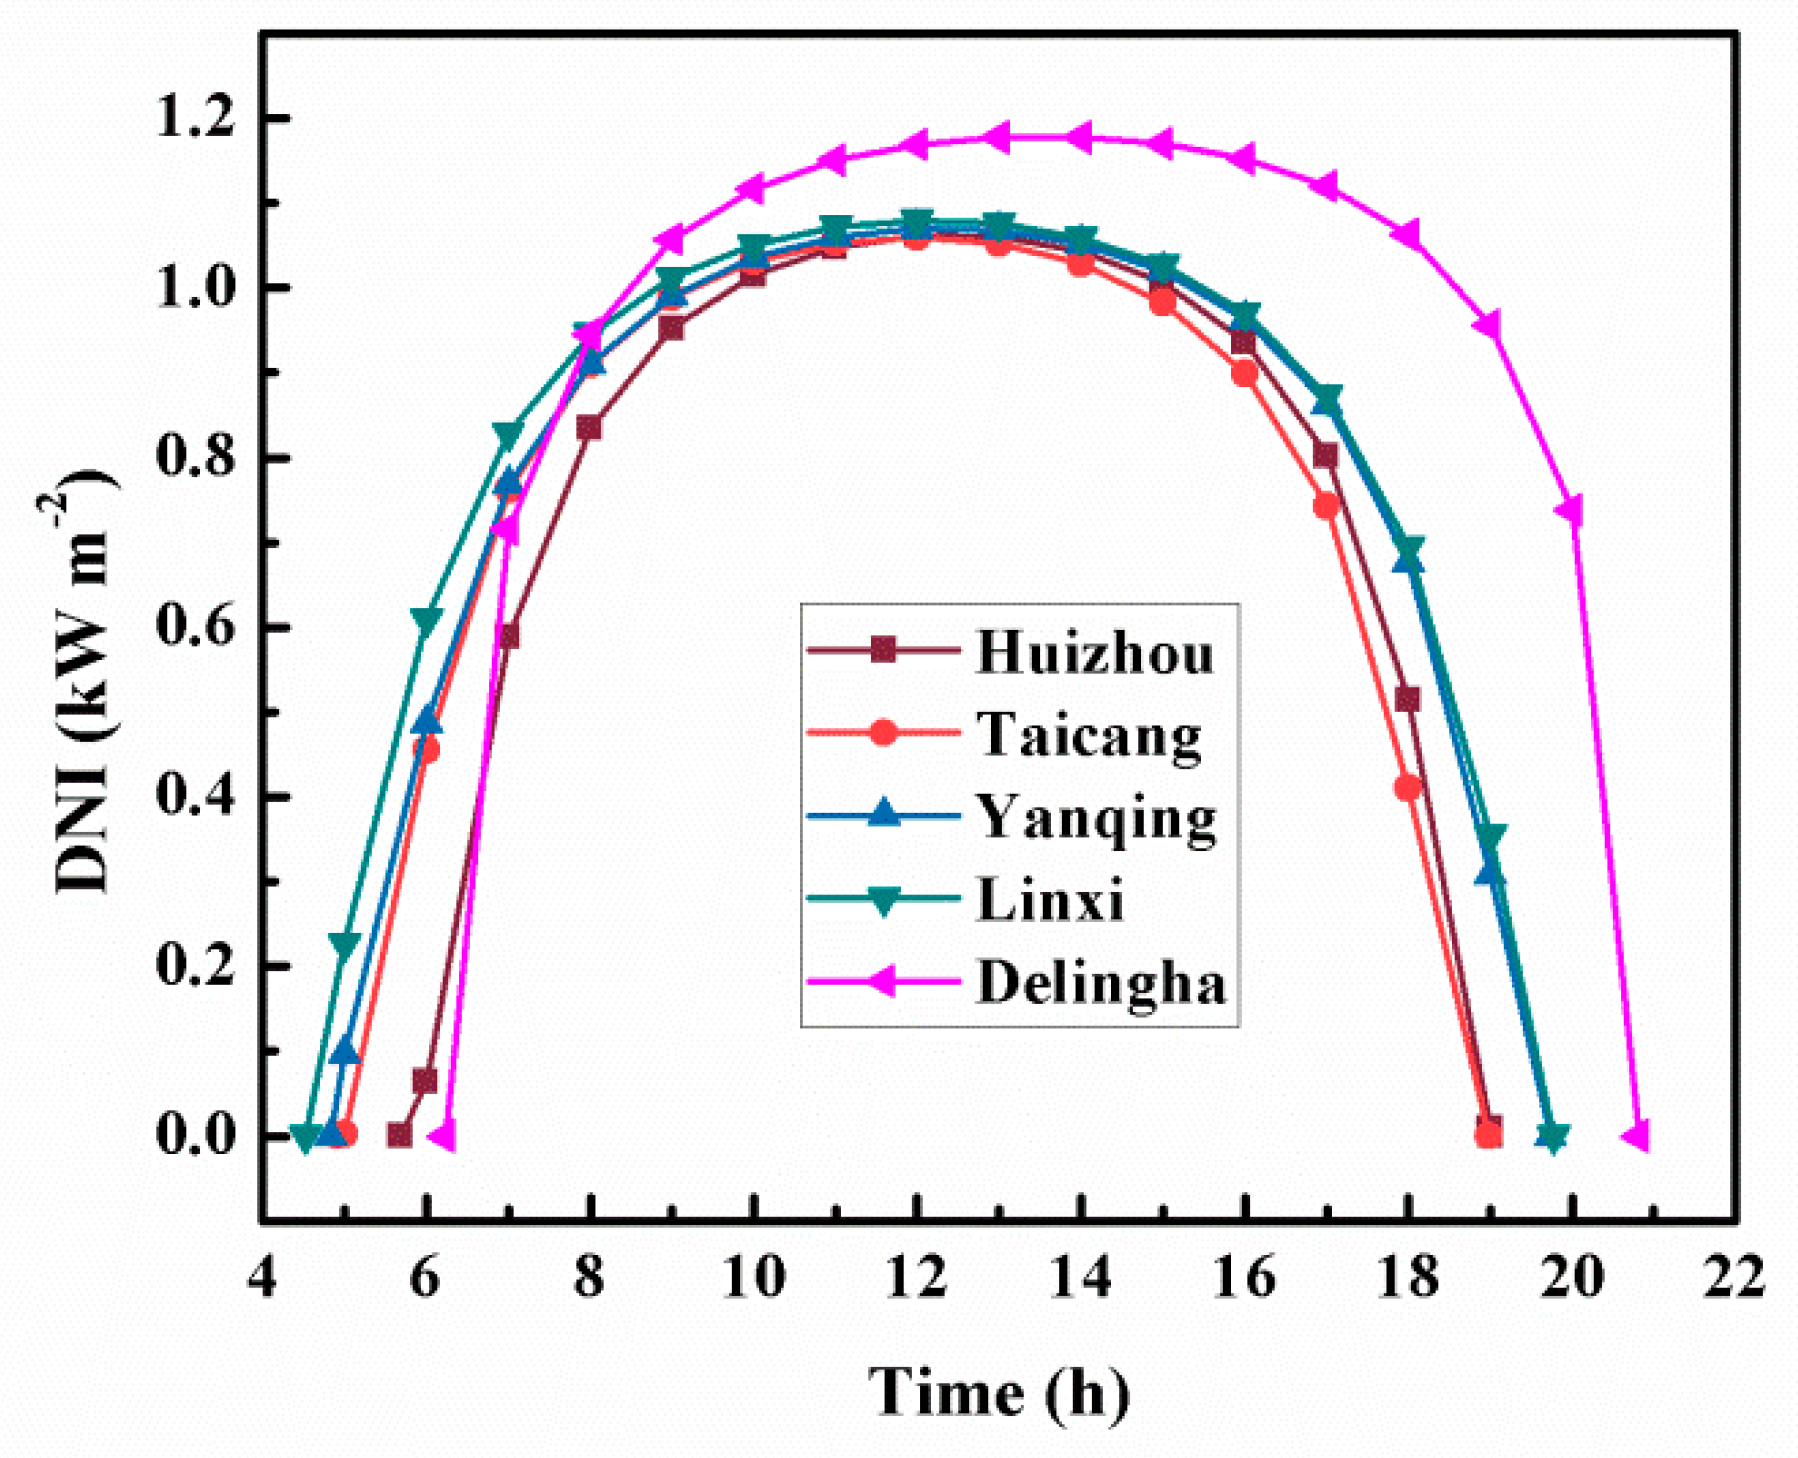
In this study, five locations with different DNI values were selected to assess the potential for installing tower CSP plants in China, which are Huizhou near Shenzhen, Taicang near Shanghai, Yanqing in Beijing, Linxi in Inner Mongolia, and Delingha in Qinghai (as shown in Figure 3). Four of them are located in eastern China where the electricity demand is relatively high, near cities with grid transmission, and sufficient water resources in order to analyze the economic feasibility of building tower CSP plants in this region, particularly near the most developed cities of China. Delingha was taken as a reference site where the annual DNI is near the bottom threshold of 2000 kWh m−2 year−1 for installing any form of the CSP systems to achieve a reasonable economic performance [32]. It can be observed from Figure 3 that Huizhou and Taicang have relatively low DNI among all the five locations. Since DNI is the most important energy input data for CSP systems in SAM, the specific DNI for those locations are calculated by the method based on the air mass which is introduced later. Then, the land areas required to build a tower CSP plant of 100 MW in different locations was calculated by SAM and shown in Table 3. It can be seen that the land price and unit land costs of Huizhou and Taicang were much higher than the other three locations.
2.5. Operation and Maintenance Cost
The operation and maintenance cost of CSP plants is lower than that of traditional power plants since fuel consumption is not necessary in CSP plants. This expense refers to the salary and welfare for the staff, the costs of water used for cooling and cleaning, plant operation costs, and field maintenance costs. The annual operation and maintenance cost was taken as 2% of the capital investment of the system, based on the reported values [6,33,34].
2.6. Insurance Cost
Since the CSP plants have relatively high technological risks in contrast with the conventional power plants, an insurance policy should be considered. The insurance cost includes fixed assets insurance and other insurance which can be assumed as 0.5% of the capital investment of the system [35].
2.7. Solar Resource
The DNI is strongly affected by the composition of atmosphere and the weather corresponding to a specific location. The DNI on the earth’s surface between sunrise and sunset can be calculated according to the following experimentally determined equation [36]:
where h is the location altitude above sea level (m) and AM is the air mass. AM is defined as [37]:
where α is the solar elevation angle which can be calculated as a function of the solar declination angle, δ, local latitude, ϕ, and solar hour angle, γ, [38]:
The DNIs of summer solstice in Huizhou, Taicang, Yanqing, Linxi, and Delingha were calculated by the above mentioned method and shown in Figure 4. It can be seen that the DNI at Linxi is higher than that at the other locations except for the reference site Delingha.
Then, the annual DNI, S, as the integral of DNI along a year can be calculated as follows:
where t1 and t2 indicate the beginning and end of the year, respectively. The annual DNI of Huizhou, Taicang, Yanqing, Linxi, and Delingha are shown in Table 4. It indicates that the annual DNI in Delingha is much higher than other sites. The annual DNIs in Taicang and Huizhou are even lower than 800 kWh m−2 year−1.
2.8. Tracking Factor
As the CSP systems can only use DNI, the tracking system is critical for CSP plants. For tower systems, azimuth-altitude dual axis solar tracking mechanisms are employed for the heliostat. Hence, the tracking accuracy to the sunlight is high and the tracking factor is one [33].
2.9. Performance Factor
The performance factor can be calculated as follows:
For CSP systems, the utilized solar resource approximates to the DNI. And the electricity production per installed watt can be obtained by dividing the annual electrical output to the power of the plant. The electrical output was estimated by SAM, which was not characterized by the solar field but by the power of the turbines. In addition, since value of the performance factor is relevant to TES, the range of 0–10 h of TES capacity was evaluated.
2.10. Degradation Rate
Because of degradation, the annual electrical output of CSP systems would be slightly diminished. The recommended value of degradation rate was 0.2% mainly owing to the degradation of turbines [7].
2.11. Discount Rate
The discount rate is used to consider the time value of money and the risk of the investment. According to IEA [34], the discount rate is between 10% and 15% for CSP systems. A conservative value of 10% was adopted in the present paper.
2.12. Lifetime of the System
3. Results and Discussion
On the basis of the LCOE model described above, the economic analysis of 100 MW tower CSP plants in five locations in China with four different molten-salts for TES was estimated. Calculation results of both the LCOE present value in 2017 and its future evolution over the period of 2018–2050 under four scenarios proposed by the IEA were also presented. Moreover, the specific time when CSP grid parities can be attained was estimated and influences of the land cost, TES capacity, learning rate, discount rate, lifetime, degradation rate, operation-maintenance cost, and insurance cost on the LCOE were examined. As the reference, a 100 MW plant using solar salt (NaNO3-KNO3, 60-40 wt.%) with 6 h TES in Delingha was used in this study. Unless otherwise stated, the values for the input parameters of Equation (1) were used as specified in Table 1.
Table 5 shows the initial costs and LCOE present values for different locations under reference conditions. It can be seen that the initial costs of Huizhou and Taicang were much higher than that of Delingha which is mainly due to expensive land cost. The influence of land cost on the LCOE is illustrated in Figure 5. The x axis shows the percentage of the land cost reduction. It was found that the land cost affected the LCOE significantly for Huizhou and Taicang as their land costs accounted for 38.8% and 30.8% of their total initial capital investment, respectively. Furthermore, the LCOE in Huizhou and Taicang was still higher than 6 RMB kWh−1 even if the land cost dropped to zero. It was mainly because the DNI in both locations is less than 800 kWh m−2 year−1, which makes the capacity factor relatively low. Thus, it is inappropriate to install a tower CSP plant nearby Shenzhen and Shanghai regardless of the land cost. It can also be observed from Figure 5 that the land cost had a slight influence on the LCOE of CSP plants in Yanqing, Linxi, and Delingha. Yanqing is the selected location of the first pilot CSP plant in Beijing and the land cost is quite low. The LCOE of Linxi had the lowest value of 2.33 RMB kWh−1 because of its highest DNI among the four selected locations at the eastern of China. Therefore, it can be concluded that the major factor resulting in low LCOE for different locations is the high DNI, which leads to more produced energy, higher capacity factor, and more efficient TES.
The TES unit is an important sub-system of CSP plants which guarantees dispatchable electricity supply. Moreover, high heat transfer fluid (HTF) operating temperature in a CSP plant is beneficial because it can improve the heat to electricity conversion efficiency. The U.S. Department of Energy (DOE) suggested that the appropriate HTF candidates must be thermally stable at temperatures up to 720 °C [41]. In the present study, four molten-salt eutectic mixtures were selected as the energy storage media to estimate the corresponding LCOE. Except for solar salt which was selected as the reference, the other three salts all have the temperature of thermal stability higher than 715 °C and show the potential to be used in commercial CSP plants which has been reported in previous studies [42,43,44,45,46]. Their thermophysical properties and TES costs are listed in Table 6 [1,42,43,44,45,46,47]. It can be seen that the chloride-salt mixture (NaCl-KCl-ZnCl2, 8.1-31.3-60.6 wt.%) has the lowest TES cost due to the lowest salt price and largest density. And the TES costs of the fluoride-salt mixture (LiF-NaF-KF, 29.3-11.7-59 wt.%) and carbonate-salt mixture (Li2CO3-Na2CO3-K2CO3, 32.1-33.4-34.5 wt.%) are much higher since their salt prices are more than three times of the prices of solar salt and chloride-salt mixture.
Figure 6 and Figure 7 indicate the effect of TES capacity on the performance factor and LCOE present value using different salt mixtures as the energy storage media under reference conditions. It can be found that the performance factor of solar salt which has a much lower temperature of thermal stability is higher than that of the fluoride-salt mixture and chloride-salt mixture. The chloride-salt mixture with the lowest performance factor has the highest LCOE when the CSP system has no TES. Since a larger capacity TES unit improves the performance factor of CSP systems as confirmed by other studies [48,49] then the LCOE of all molten-salts decreases as the capacity of TES increases. However, when the performance factor no longer improves along with the increasing TES capacity, then LCOE goes up, thereafter, as the cost of the TES rises. Thus, there is an optimal capacity of TES resulting in the lowest LCOE. The LCOE of the chloride-salt mixture reduces sharply before the TES capacity reaches the optimal value because of its comparably lowest salt price. As such, the increasing trends of the LCOEs of the fluoride-salt and carbonate–salt mixtures are more remarkable when the TES capacity is higher than the optimal value due to their high costs. The solar salt has the lowest LCOE among those four molten-salts regardless of the TES capacity.
Figure 8 shows the evolution of the LCOE between 2017 and 2050 at four different scenarios under reference conditions. It can be deduced that the future cost of tower CSP electricity decreases as the global cumulative installed CSP capacity increases during the period of 2018-2050. Moreover, the future LCOE in the Blue map scenario presents a slower reduction than the other three scenarios, particularly in the initial years, owing to the lower objectives of the CSP installation capacity. However, the difference of the LCOE at different scenarios becomes quite small in 2050. The LCOE of tower CSP systems are 0.72, 0.64, 0.70, and 0.67 RMB kWh−1 in 2050 and represents 49.88%, 44.02%, 47.94%, and 46.14% of its present value in 2017 for Blue map scenario, Global outlook advanced scenario, Global outlook moderate scenario, and Roadmap scenario, respectively.
Figure 8 also illustrates the time when the electricity cost of tower CSP plants will reach the grid parity under reference conditions. Since more than three quarters of the electricity is generated by coal-fired power plants in China [34], the cost evolution of coal-fired electricity was used as the grid parity in this study. The cost of electricity produced by coal-fired power plants is 0.41 RMB kWh−1 [50] which is only considered the production costs and would increase linearly in the future with an annual conservative growth rate of 2.7% [15]. In addition, considering the CO2 emissions by the coal-fired power plants, the carbon emission prices of 162.5 RMB ton−1 CO2 [51] and 325 RMB ton−1 CO2 [20] were added to estimate the grid parities with an emission factor of 0.9 kg CO2 kWh−1 [34,52,53]. According to Figure 8, the time when the grid parities of tower CSP systems would be achieved are summarized in Table 7. It can be observed that the LCOE of tower CSP would reach the grid parity in the years of 2038–2041 in the case of no future penalties for CO2 emissions. And the grid parity would bring forward about 7–8 years for the carbon emission price of 162.5 RMB ton−1 CO2 and about 13–14 years for the carbon emission price of 325 RMB ton−1 CO2.
In order to evaluate the influence of learning rate on the LCOE for tower CSP systems, the LCOE in the year of 2050 with the learning rate ranging from 5% to 20% under reference conditions are estimated at four scenarios and shown in Figure 9. It illustrates that the LCOE reduces as the learning rate increases and the reduction rates are 66.4%, 71.8%, 68.2%, and 69.9% for Blue map scenario, Global outlook advanced scenario, Global outlook moderate scenario, and Roadmap scenario, respectively. The result indicates that this parameter has a significant effect on the economic feasibility of tower CSP plants.
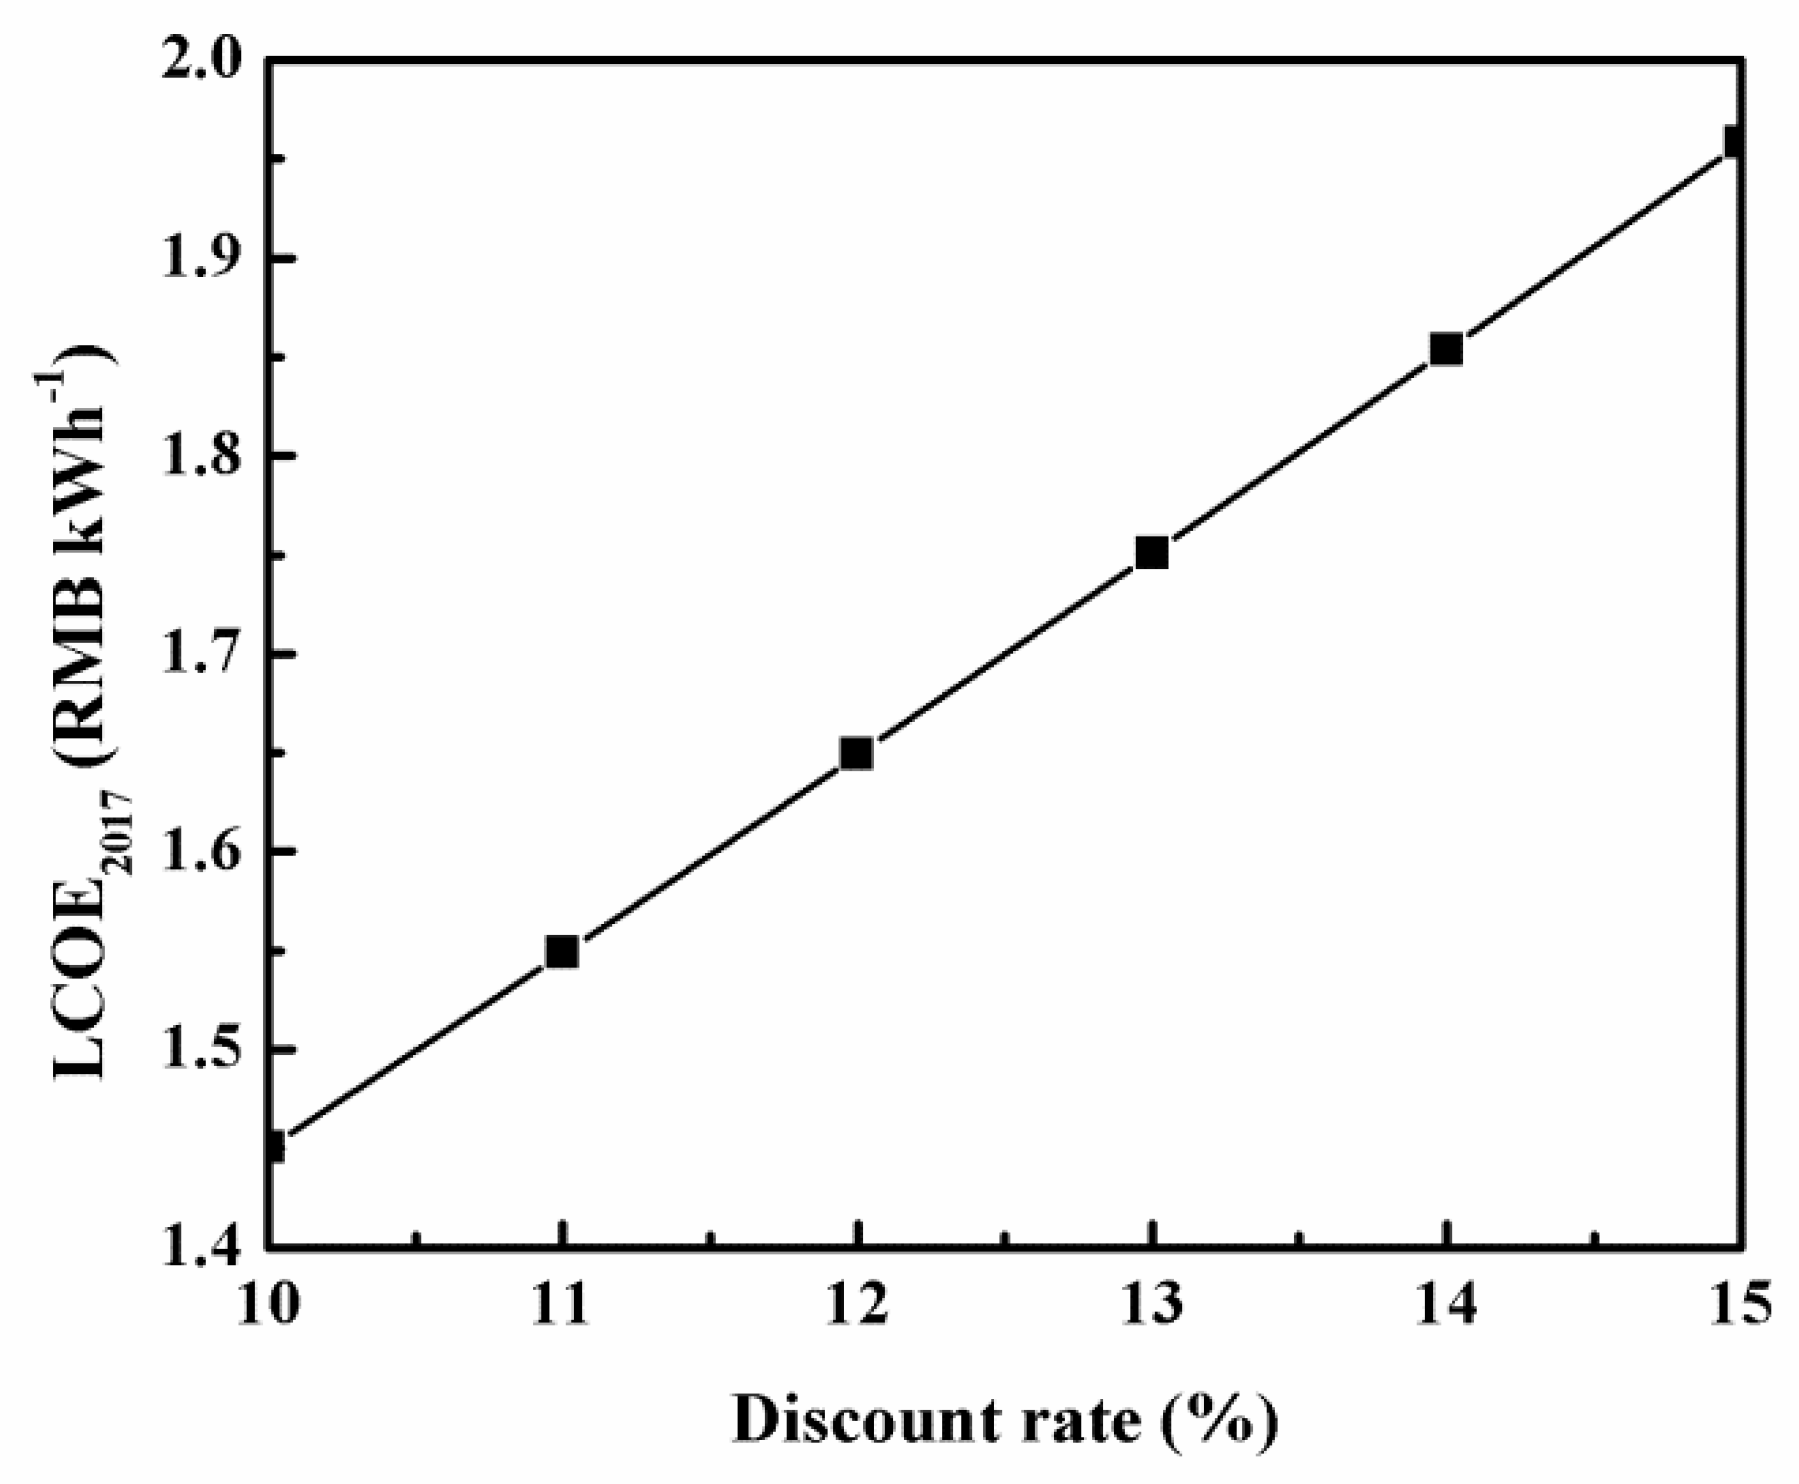
Some studies in the literature [49,54,55] claimed that the discount rate is one of the most significant variables affecting the LCOE of the CSP systems, which reflects the risk-adjusted opportunity of capital investment. Figure 10 shows that the present value of LCOE under reference conditions rises about 35% when the discount rate increases from 10% to 15%. Although the discount rate for the CSP technology is relatively high for now, it is expected to decline in the future as CSP markets develop and the related technologies become more mature.
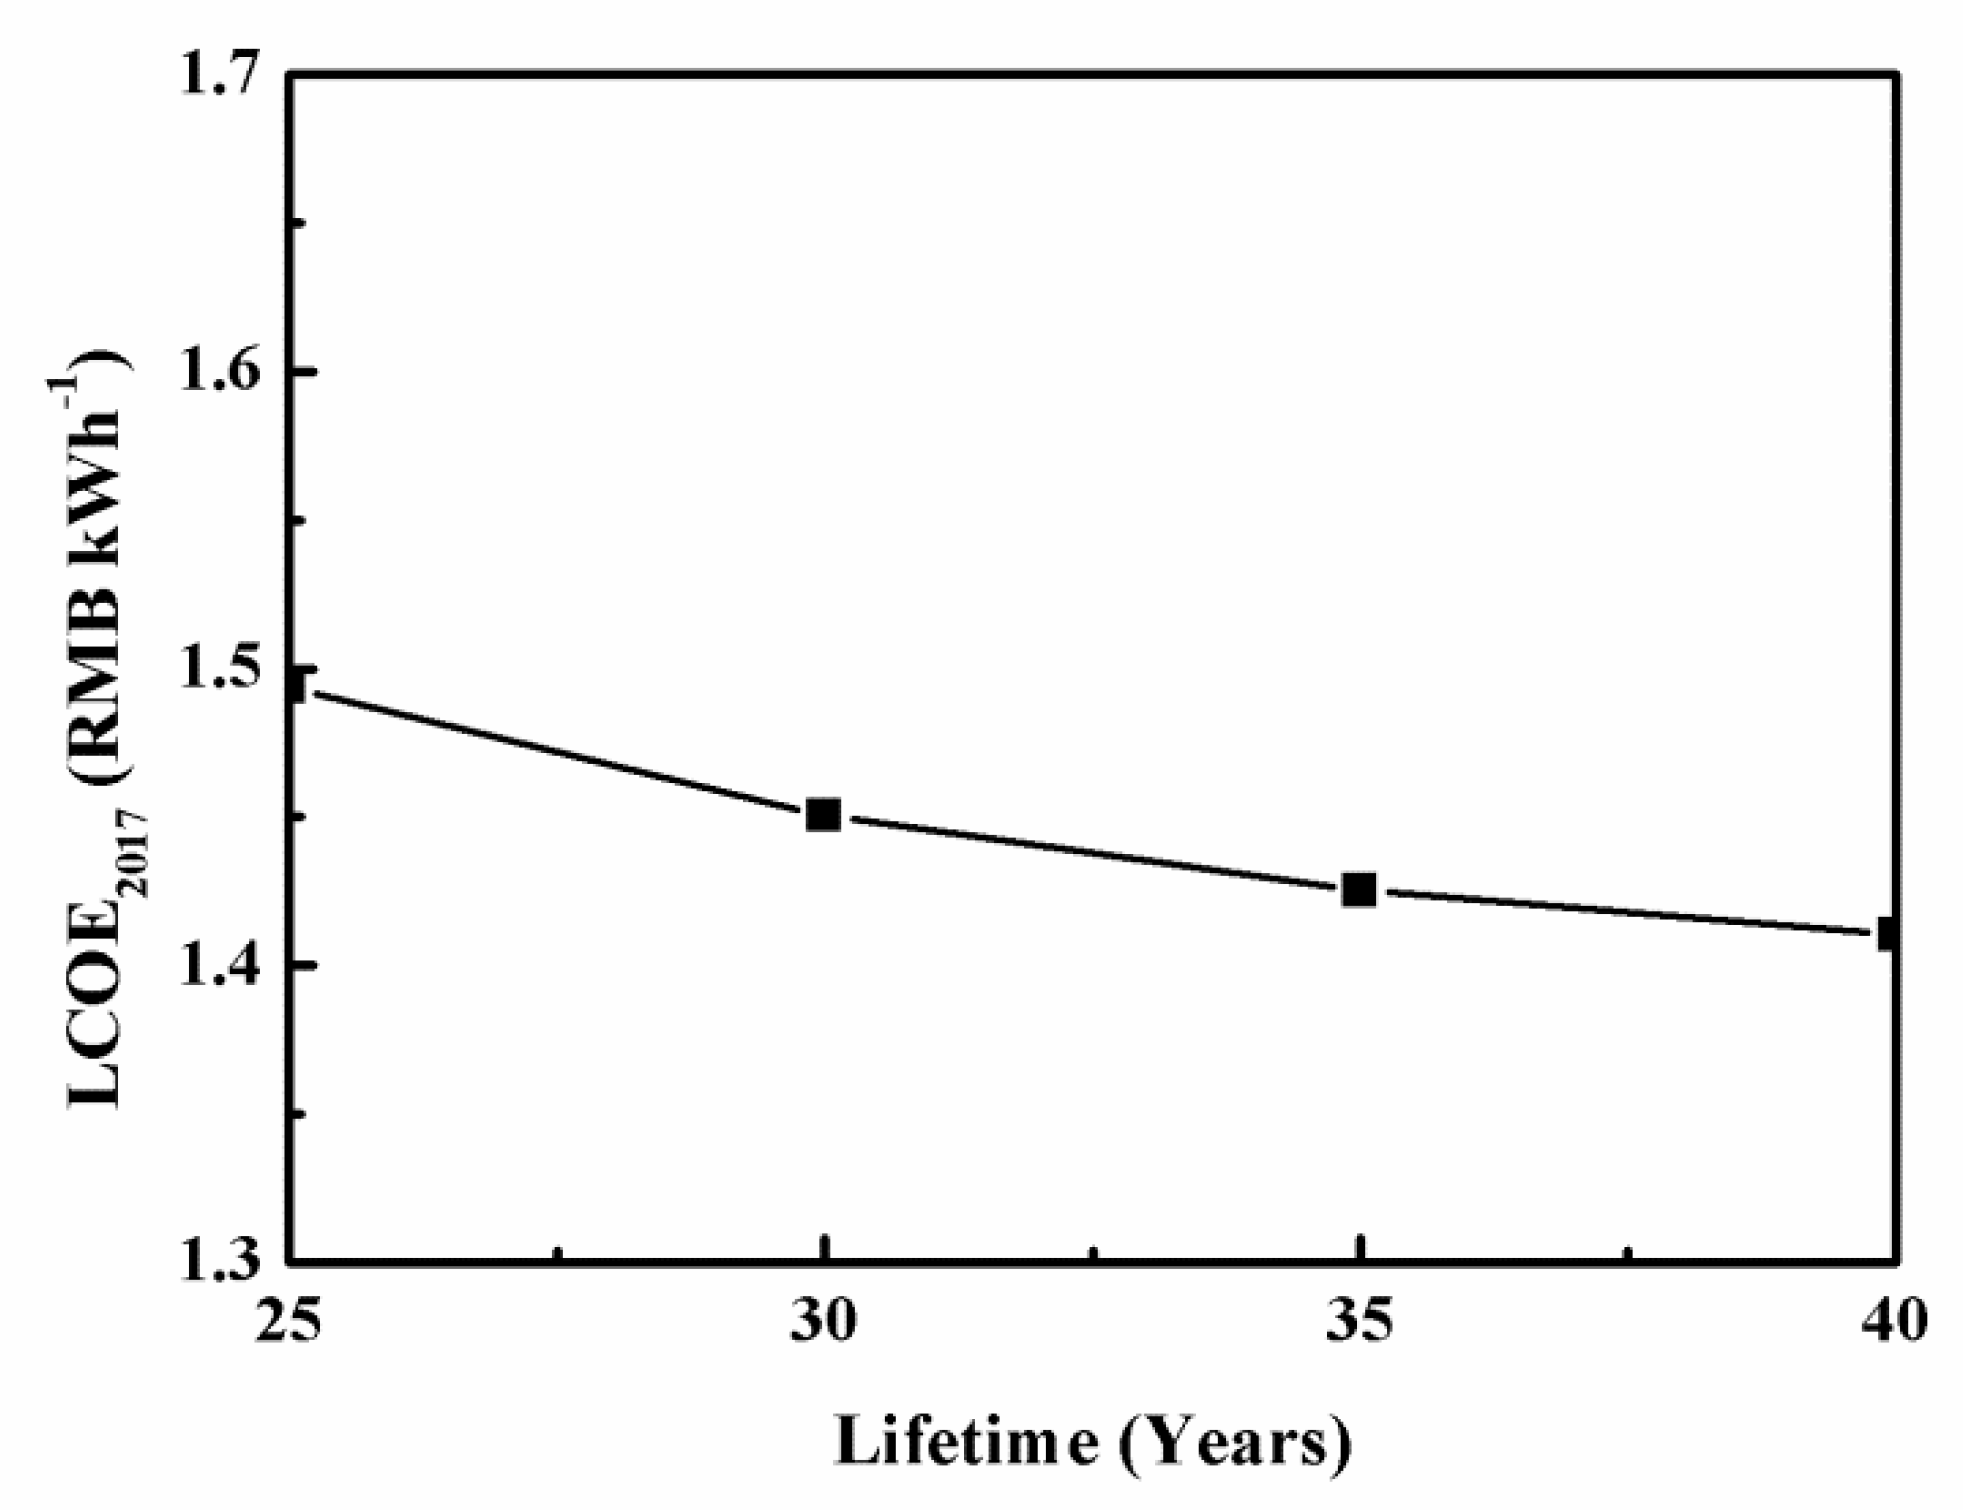
In order to study the sensitivity of the LCOE with the lifetime of tower CSP plants, the LCOE present value in different lifetime expectations under reference conditions were estimated and shown in Figure 11. It can be seen that the LCOE is less sensitive to the lifetime. As the life time increases from 25 to 40 years, the LCOE only reduces by 5.6%.
Figure 12 displays the impacts of degradation rate, operation-maintenance cost, and insurance cost on the LCOE for tower CSP systems. The variables are changed within the range of −20% to 20% with an interval of 5% around reference conditions. It can be seen that the effect of operation-maintenance cost is greater than that of other two factors and the influence of the degradation rate is the smallest. One way to reduce the operation-maintenance cost is to improve the level of management and use high quality CSP equipment.
4. Conclusions
In order to provide support information for the Chinese government to formulate incentive policies for the CSP industry, we have presented the economic analysis based on the LCOE model for 100 MW tower CSP plants in the locations of Huizhou near Shenzhen, Taicang near Shanghai, Yanqing in Beijing, Linxi in Inner Mongolia, and Delingha in Qinghai in China with four molten-salt eutectic mixtures of the chloride-salt mixture (NaCl-KCl-ZnCl2, 8.1-31.3-60.6 wt.%), fluoride-salt mixture (LiF-NaF-KF, 29.3-11.7-59 wt.%), carbonate-salt mixture (Li2CO3-Na2CO3-K2CO3, 32.1-33.4-34.5 wt.%), and solar salt (NaNO3-KNO3, 60-40 wt.%) as the energy storage media. Major conclusions were summarized as follows:
- (1)
- It is inappropriate to build a tower CSP plant nearby Shenzhen and Shanghai. Even if the land costs drop to zero, the LCOEs would be still higher than 6 RMB kWh−1 mainly owing to the relatively low DNI of less than 800 kWh m−2 year−1. The impact of DNI on the LCOE is much more significant than the other influence factors.
- (2)
- There is an optimal capacity of TES resulting in the lowest LCOE for a certain tower CSP plant, as the performance factor increases with the increasing TES capacity and then becomes stable. The solar salt has the lowest LCOE among those four molten-salts regardless of the TES capacity.
- (3)
- The LCOE of tower CSP would reach the grid parity in the years of 2038–2041 in the case of no future penalties for the CO2 emissions based on the four scenarios for CSP development roadmap proposed by IEA. As such, the grid parity would be brought forward about 7–8 years for the carbon emission price of 162.5 RMB ton−1 CO2 and about 13–14 years for the carbon emission price of 325 RMB ton−1 CO2.
- (4)
- The LCOE of the tower CSP systems is significantly affected by the learning rate and discount rate, yet it is less sensitive to the lifetime. Moreover, the impact of operation-maintenance cost is greater than that of insurance cost and degradation rate.
Incentive policy is a crucial force for the rapid development of the CSP industry and reducing the LCOE of CSP plants. Further studies can be conducted to evaluate the impacts of incentive policies for CSP projects in China, such as investment and production taxes credit, cash incentives, sales, or use tax reduction and different depreciation modes.
Author Contributions
Conceptualization, X.Z. and X.X.; methodology and investigation, X.Z.; resources and data curation, W.L.; writing—original draft preparation, X.Z.; writing—review and editing, X.X.; supervision, W.X.; project administration, X.X.; funding acquisition, X.Z. and X.X.
Funding
This research was funded by National Natural Science Foundation of China, grant number 51706056 and China Postdoctoral Science Foundation, grant number 2018M631927.
Conflicts of Interest
The authors declare no conflict of interest.
References
- Mehos, M.; Turchi, C.; Vidal, J.; Wagner, M.; Ma, Z.; Ho, C.; Kolb, W.; Andraka, C.; Kruizenga, A. Concentrating Solar Power Gen3 Demonstration Roadmap; National Renewable Energy Laboratory (NREL): Golden, CO, USA, 2017.
- CSPPLAZA. Global CSP Installed Capacity Increased to 5133 MW by the End of 2017 (Beijing, China). 2018. Available online: http://www.cspplaza.com/article-11387-1.html (accessed on 24 January 2018).
- Zhao, Z.; Li, Z.; Xia, B. The impact of the CDM (clean development mechanism) on the cost price of wind power electricity: A China study. Energy 2014, 69, 179–185. [Google Scholar] [CrossRef] [Green Version]
- Frisari, G.; Stadelmann, M. De-risking concentrated solar power in emerging markets: The role of policies and international finance institutions. Energy Policy 2015, 82, 12–22. [Google Scholar] [CrossRef]
- Hernández-Moro, J.; Martínez-Duart, J. CSP electricity cost evolution and grid parities based on the IEA roadmaps. Energy Policy 2012, 41, 184–192. [Google Scholar] [CrossRef]
- Hernández-Moro, J.; Martínez-Duart, J. Analytical model for solar PV and CSP electricity costs: Present LCOE values and their future evolution. Renew. Sustain. Energy Rev. 2013, 20, 119–132. [Google Scholar] [CrossRef]
- Parrado, C.; Marzo, A.; Fuentealba, E.; Fernández, A. 2050 LCOE improvement using new molten salts for thermal energy storage in CSP plants. Renew. Sustain. Energy Rev. 2016, 57, 505–514. [Google Scholar] [CrossRef]
- Hinkley, J.; Hayward, J.; Curtin, B.; Wonhas, A.; Boyd, R.; Grima, C.; Tadros, A.; Hall, R.; Naicker, K. An analysis of the costs and opportunities for concentrating solar power in Australia. Renew. Energy 2013, 57, 653–661. [Google Scholar] [CrossRef]
- Dieckmann, S.; Dersch, J.; Giuliano, S.; Puppe, M.; Lüpfert, E.; Hennecke, K.; Pitz-Paal, R.; Taylor, M.; Ralon, P. LCOE reduction potential of parabolic trough and solar tower CSP technology until 2025. AIP Conf. Proc. 2017, 1850, 160004. [Google Scholar]
- Simsek, Y.; Mata-Torres, C.; Guzmán, A.M.; Cardemil, J.M.; Escobar, R. Sensitivity and effectiveness analysis of incentives for concentrated solar power projects in Chile. Renew. Energy 2018, 129, 214–224. [Google Scholar] [CrossRef]
- Du, F.; Xie, H. Economics analysis of solar thermal power and recommendations on industry-based incentive policies (in Chinese). Adv. New Renew. Energy 2013, 1, 197–207. [Google Scholar]
- Si, J. Technical and economic route of concentrating solar power generation in China. China Power Enterp. Manag. 2015, 15, 54–57. (In Chinese) [Google Scholar]
- Zhao, Z.; Chen, Y.; Thomson, J. Levelized cost of energy modeling for concentrated solar power projects: A China study. Energy 2017, 120, 117–127. [Google Scholar] [CrossRef]
- Zhu, Z.; Zhang, D.; Mischke, P.; Zhang, X. Electricity generation costs of concentrated solar power technologies in China based on operational plants. Energy 2015, 89, 65–74. [Google Scholar] [CrossRef] [Green Version]
- Li, Y.; Liao, S.; Rao, Z.; Liu, G. A dynamic assessment based feasibility study of concentrating solar power in China. Renew. Energy 2014, 69, 34–42. [Google Scholar] [CrossRef]
- Wu, W.; Huang, J.; Liu, X. Analysis on the optimal solar multiples and full load hours of heat storage for trough high temperature molten salt concentated solar power (CSP) plant. In Proceedings of the 2017 6th International Conference on Energy and Environmental Protection (ICEEP 2017), Zhuhai, China, 29–30 June 2017. [Google Scholar] [CrossRef]
- Yang, S.; Zhu, X.; Guo, W. Cost-benefit analysis for the concentrated solar power in China. J. Electr. Comput. Eng. 2018, 2018, 1–11. [Google Scholar] [CrossRef]
- Ren, L.; Zhao, X.; Zhang, Y.; Li, Y. The economic performance of concentrated solar power industry in China. J. Clean. Prod. 2018, 205, 799–813. [Google Scholar]
- Azoumah, Y.; Ramdé, E.; Tapsoba, G.; Thiam, S. Siting guidelines for concentrating solar power plants in the Sahel: Case study of Burkina Faso. Sol. Energy 2010, 84, 1545–1553. [Google Scholar] [CrossRef]
- International Energy Agency (IEA). Energy Technology Perspectives 2008: Scenarios and Strategies to 2050; International Energy Agency, IEA/OECD: Paris, France, 2008; pp. 1–650. [Google Scholar]
- Richter, C.; Teske, S.; Short, R. Concentrating Solar Power Global Outlook 09; Greenpeace International: Amsterdam, The Netherlands; European Solar Thermal Electricity Association (ESTELA): Brussels, Belgium; IEA SolarPACES: Tabernas, Spain, 2009. [Google Scholar]
- International Energy Agency (IEA). Technology Roadmap-Concentrating Solar Power; International Energy Agency, IEA/OECD: Paris, France, 2010; pp. 1–52. [Google Scholar]
- National Renewable Energy Laboratory (NREL). System Advisor Model (SAM). Available online: https://sam.nrel.gov/ (accessed on 5 September 2017).
- National Renewable Energy Laboratory (NREL). Simple Levelized Cost of Energy (LCOE) Calculator Documentation. Available online: https://www.nrel.gov/analysis/tech-lcoe-documentation.html (accessed on 1 April 2019).
- Grübler, A.; Nakićenović, N.; Victor, D. Dynamics of energy technologies and global change. Energy Policy 1999, 27, 247–280. [Google Scholar] [CrossRef] [Green Version]
- Nemet, G. Beyond the learning curve: Factors influencing cost reductions in photovoltaics. Energy Policy 2006, 34, 3218–3232. [Google Scholar] [CrossRef]
- Carpenter, S.; Kemp, S.; Robillard, P. Cost Reduction Study for Solar Thermal Power Plants; Enermodal Engineering Limited: Kitchener, ON, Canada; Marbek Resource Consultants Ltd.: Ottawa, ON, Canada, 1999. [Google Scholar]
- Laitner, J. LBD technology data. Spreadsheet; US Environmental Protection Agency: Washington, DC, USA, 2002.
- Papineau, M. An economic perspective on experience curves and dynamic economies in renewable energy technologies. Energy Policy 2006, 34, 422–432. [Google Scholar] [CrossRef]
- Winkler, H.; Hughes, A.; Haw, M. Technology learning for renewable energy: Implications for South Africa’s long-term mitigation scenarios. Energy Policy 2009, 37, 4987–4996. [Google Scholar] [CrossRef]
- United States Department of Energy (DOE). Concentrating Solar Power Commercial Application Study: Reducing Water Consumption of Concentrating Solar Power Electricity Generation. 2017. Available online: http://www.eere.energy.gov/solar/pdfs/csp_water_study.pdf (accessed on 24 January 2018).
- Malagueta, D.; Szklo, A.; Borba, B.; Soria, R.; Aragãoa, R.; Schaeffer, R.; Dutra, R. Assessing incentive policies for integrating centralized solar power generation in the Brazilian electric power system. Energy Policy 2013, 59, 198–212. [Google Scholar] [CrossRef]
- Purohit, I.; Purohit, P. Techno-economic evaluation of concentrating solar power generation in India. Energy Policy 2010, 38, 3015–3029. [Google Scholar] [CrossRef]
- International Energy Agency (IEA). Energy Technology Perspectives 2010: Scenarios and Strategies to 2050; International Energy Agency, IEA/OECD: Paris, France, 2010; pp. 1–706. [Google Scholar]
- Viebahn, P.; Lechon, Y.; Trieb, F. The potential role of concentrated solar power (CSP) in Africa and Europe-A dynamic assessment of technology development, cost development and life cycle inventories until 2050. Energy Policy 2011, 39, 4420–4430. [Google Scholar] [CrossRef]
- PVCDRM. Available online: http://www.pveducation.org/pvcdrom/properties-of-sunlight/air-mass (accessed on 29 September 2017).
- Kasten, F.; Young, A. Revised optical air mass tables and approximation formula. Appl. Opt. 1989, 28, 4735–4738. [Google Scholar] [CrossRef]
- Woolf, H. On the Computation of Solar Elevation Angles and the Determination of Sunrise and Sunset Times; National Meteorological Center: Suitland, MD, USA, 1968.
- Nezammahalleh, H.; Farhadi, F.; Tanhaemami, M. Conceptual design and techno-economic assessment of integrated solar combined cycle system with DSG technology. Sol. Energy 2010, 84, 1696–1705. [Google Scholar] [CrossRef]
- Caldés, N.; Varela, M.; Santamaría, M.; Sáez, R. Economic impact of solar thermal electricity deployment in Spain. Energy Policy 2009, 37, 1628–1636. [Google Scholar] [CrossRef]
- Office of Energy Efficiency and Renewable Energy, Department of Energy. Concentrating Solar Power: Advanced Projects Offering Low LCOE Opportunities; DE-FOA-0001186; 2014. Available online: https://www.energy.gov/eere/solar/concentrating-solar-power-advanced-projects-offering-low-lcoe-opportunities-csp-apollo (accessed on 24 January 2018).
- Salanne, M.; Simon, C.; Turq, P.; Madden, P. Heat-transport properties of molten fluorides: Determination from first-principles. J. Fluorine Chem. 2009, 130, 38–44. [Google Scholar] [CrossRef]
- An, X.; Cheng, J.; Yin, H.; Xie, L.; Zhang, P. Thermal conductivity of high temperature fluoride molten salt determined by laser flash technique. Int. J. Heat Mass Trans. 2015, 90, 872–877. [Google Scholar] [CrossRef]
- Khokhlov, V.; Korzun, I.; Dokutovich, V.; Filatov, E. Heat capacity and thermal conductivity of molten ternary lithium, sodium, potassium, and zirconium fluorides mixtures. J. Nucl. Mater. 2011, 410, 32–38. [Google Scholar] [CrossRef]
- Liu, T.; Liu, W.; Xu, X. Properties and heat transfer coefficients of four molten-salt high temperature heat transfer fluid candidates for concentrating solar power plants. In IOP Conference Series: Earth and Environmental Science; IOP Publishing: Bristol, UK, 2017; Volume 93, p. 012023. [Google Scholar]
- Zavoico, A. Solar Power Tower Design Basis Document, Revision 0; Office of Scientific & Technical Information Technical Reports; Sandia National Laboratories: Albuquerque, NM, USA; Livermore, CA, USA, July 2001. [CrossRef]
- Vignarooban, K.; Xu, X.; Arvay, A.; Hsu, K.; Kannan, A. Heat transfer fluids for concentrating solar power systems–a review. Appl. Energy 2015, 146, 383–396. [Google Scholar] [CrossRef]
- Poullikkas, A.; Hadjipaschalis, I.; Kourtis, G. The cost of integration of parabolic trough CSP plants in isolated Mediterranean power systems. Renew. Sustain. Energy Rev. 2010, 14, 1469–1476. [Google Scholar] [CrossRef]
- Krishnamurthy, P.; Mishra, S.; Banerjee, R. An analysis of costs of parabolic trough technology in India. Energy Policy 2012, 48, 407–419. [Google Scholar] [CrossRef]
- Staley, B.; Goodward, J.; Rigdon, C.; MacBride, A. Juice from Concentrate: Reducing Emissions with Concentrating Solar Thermal Power; World Resources Institute: Washington, DC, USA, 2009; Available online: http://pdf.wri.org/juice_from_concentrate.pdf (accessed on 24 January 2018).
- Price Water House Coopers (PwC). 100% Renewable Electricity: A Roadmap to 2050 for Europe and North Africa. 2010. Available online: http://www.pwc.com/sustainability (accessed on 24 January 2018).
- Pacca, S.; Sivaraman, D.; Keoleian, G. Parameters affecting the life cycle performance of PV technologies and systems. Energy Policy 2007, 35, 3316–3326. [Google Scholar] [CrossRef]
- Bhawan, S.; Puram, R. CO2 Baseline Database for the Indian Power Sector. Version 6.0; Central Electricity Authority, Ministry of Power, Government on India, 2014. Available online: http://www.cea.nic.in/reports/planning/cdm_co2/user_guide_ver6.pdf (accessed on 24 January 2018).
- International Renewable Energy Agency (IRENA). Renewable Energy Technologies: Cost Analysis Series. Volume 1, Power Sector, Issue 2/5, Concentrating Solar Power. 2012. Available online: http://www.irena.org/DocumentDownloads/Publications/RE_Technologies_Cost_Analysis-CSP.pdf (accessed on 24 January 2018).
- Mathur, A.; Agrawal, G.; Chandel, M. Techno-economic analysis of solar parabolic trough type energy system for garment zone of Jaipur city. Renew. Sustain. Energy Rev. 2013, 17, 104–109. [Google Scholar] [CrossRef]
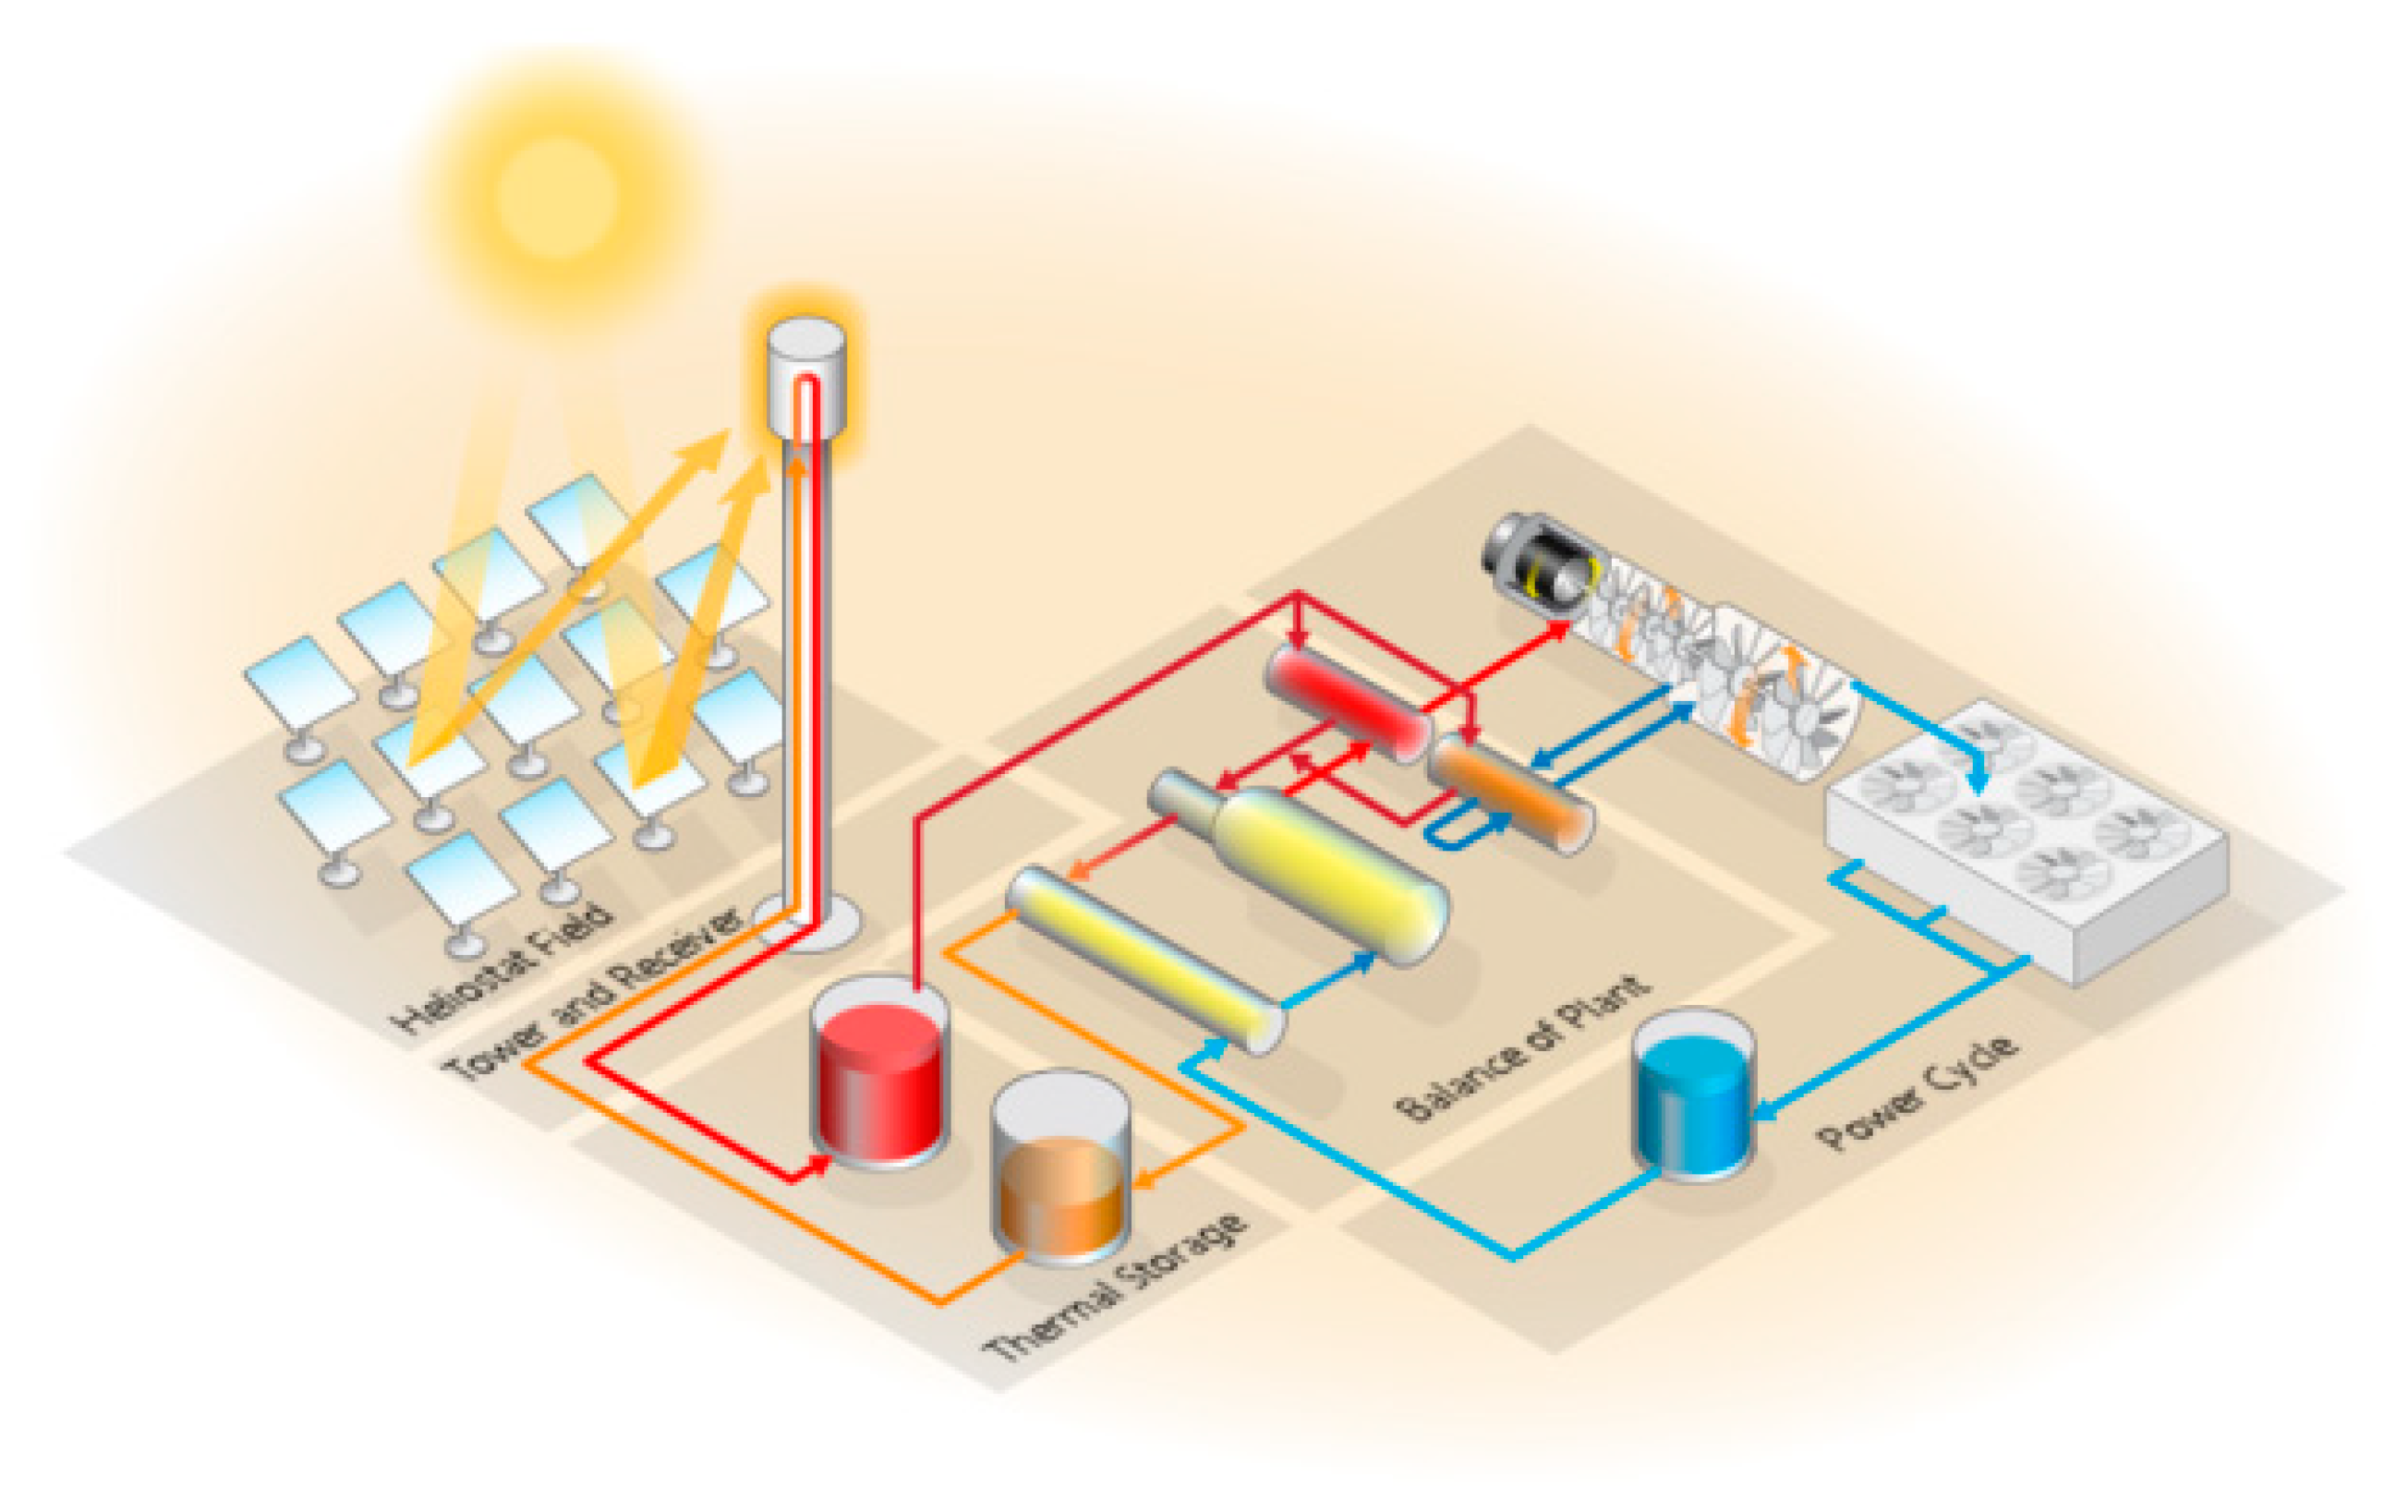
Figure 1.
Operating principle of a typical tower concentrating solar power (CSP) plant [23].
Figure 1.
Operating principle of a typical tower concentrating solar power (CSP) plant [23].

Figure 2.
Fitting curves about cumulative installed capacity of CSP systems for four IEA scenarios in the years of 2018–2050.
Figure 2.
Fitting curves about cumulative installed capacity of CSP systems for four IEA scenarios in the years of 2018–2050.

Figure 3.
Direct normal irradiation data for China (© 2017 The World Bank, Solar resource data: Solargis).
Figure 3.
Direct normal irradiation data for China (© 2017 The World Bank, Solar resource data: Solargis).

Figure 4.
Direct normal irradiances (DNIs) of summer solstice in different locations.

Figure 5.
Effect of land cost on the LCOE for five different sites.

Figure 6.
Influence of TES capacity on the performance factor for four different molten-salts.

Figure 7.
Influence of TES capacity on the LCOE for four different molten-salts.

Figure 8.
Future evolution of the LCOE for tower CSP systems and grid parities at four scenarios (solid line: tower CSP plants; dash line: coal-fired power plants).
Figure 8.
Future evolution of the LCOE for tower CSP systems and grid parities at four scenarios (solid line: tower CSP plants; dash line: coal-fired power plants).

Figure 9.
Effect of learning rate on the LCOE for four scenarios.

Figure 10.
Influence of discount rate on the LCOE.

Figure 11.
Effect of lifetime on the LCOE.

Figure 12.
Sensitivity analysis of degradation rate, operation-maintenance cost, and insurance cost.
Figure 12.
Sensitivity analysis of degradation rate, operation-maintenance cost, and insurance cost.


Table 1.
Parameters and their values of the levelized cost of electricity (LCOE) model.
| Symbol | Description | Value | Units |
|---|---|---|---|
| LCOEt | Levelized cost of electricity of a tower CSP system installed in the year t between 2017 and 2050 | Calculated by Equation (1) | RMB kWh−1 |
| Ct | Capital cost of the system installed in the year t between 2017 and 2050 | Calculated by Equation (2) | RMB W−1 |
| L | Land cost | In Table 3 | RMB W−1 |
| V | Operation-maintenance cost | 2 | % |
| I | Insurance cost | 0.5 | % |
| S | DNI | Calculated by Equation (7) | kWh m−2 year−1 |
| TF | Tracking factor | 100 | % |
| η | Performance factor | Calculated by Equation (8) | m2 W−1 |
| DR | Degradation rate | 0.2 | % |
| r | Discount rate | 10 | % |
| N | Lifetime of the system | 30 | years |
Table 2.
Cumulative installed capacity objectives of CSP systems in International Energy Agency (IEA) scenarios and the parameters of their fitting functions.
Table 2.
Cumulative installed capacity objectives of CSP systems in International Energy Agency (IEA) scenarios and the parameters of their fitting functions.
| Scenario | Blue Map | Global Outlook Advanced | Global Outlook Moderate | Roadmap | |
|---|---|---|---|---|---|
| Objectives (GW) | 2010 | 0.82 | 0.82 | 0.82 | 0.82 |
| 2020 | 20 | 84 | 69 | 148 | |
| 2030 | 250 | 342 | 231 | 337 | |
| 2050 | 630 | 1524 | 831 | 1089 | |
| Parameters | R = 0.32; M = 630 | k1 = 0.0059; k2 = 0.6972; k3 = 0.7565 | k1 = −0.0002; k2 = 0.4759; k3 = 2.0815 | k1 = 0.0104; k2 = −0.1016; k3 = 14.6982 | |
Table 3.
Land costs for a tower CSP plant of 100 MW in different locations.
| Location | Land Area (m2 W−1) | Land Price (RMB m−2) | Land Cost (RMB W−1) |
|---|---|---|---|
| Huizhou | 0.0546 | 335 | 18.3 |
| Taicang | 0.0554 | 252 | 13.97 |
| Yanqing | 0.0573 | 70.8 | 4.05 |
| Linxi | 0.0566 | 84 | 4.75 |
| Delingha | 0.0513 | 25.5 | 1.31 |
Table 4.
Annual DNIs of different locations.
| Location | Huizhou | Taicang | Yanqing | Linxi | Delingha |
|---|---|---|---|---|---|
| S (kWh m−2 year−1) | 795.7 | 762.9 | 1189.9 | 1668.1 | 2080.5 |
Table 5.
Initial costs and LCOE present values for different locations in China.
| Location | System Cost (RMB W−1) | Land Cost (RMB W−1) | LCOE2017 (RMB kWh−1) | Capacity Factor (%) |
|---|---|---|---|---|
| Huizhou | 31.48 | 18.3 | 9.28 | 7.6 |
| Taicang | 31.45 | 13.97 | 8.49 | 7.7 |
| Yanqing | 31.38 | 4.05 | 3.5 | 15.1 |
| Linxi | 31.24 | 4.75 | 2.33 | 23 |
| Delingha | 30.6 | 1.31 | 1.45 | 33.3 |
Table 6.
Thermal properties and thermal energy storage (TES) costs of selected molten-salts.
| Molten-Salt | NaNO3-KNO3 | LiF-NaF-KF | Li2CO3-Na2CO3-K2CO3 | NaCl-KCl-ZnCl2 |
|---|---|---|---|---|
| Composition by wt.% | 60-40 | 29.3-11.7-59.0 | 32.1-33.4-34.5 | 8.1-31.3-60.6 |
| Melting point (°C) | 220 | 454 | 400 | 229 |
| Thermal stability (°C) | 600 | 850 | 715 | 850 |
| Density (kg m−3) | 1708.4-1950.1 | 1851.6-2116.5 | 1959.7-2069.4 | 1946.2-2275.5 |
| Heat capacity (kJ kg−1 K−1) | 1.48-1.55 | 1.28-1.82 | 1.61 | 0.9-0.92 |
| Viscosity (mPa s) | 0.99-5.78 | 1.64-12.38 | 6.11-45.09 | 3.48-29.63 |
| Thermal conductivity (W m−1 K−1) | 0.33-0.40 | 0.05-0.27 | 0.45-0.49 | 0.30-0.38 |
| Salt price (RMB kg−1) | 5.80 | 16.66 | 15.02 | 4.68 |
| TES cost (RMB kWht−1) | 156.00 | 316.79 | 490.15 | 111.69 |
Table 7.
Time when the grid parities of tower CSP systems would be achieved.
| Scenario | Time When LCOE Equals to the Grid Parity | ||
|---|---|---|---|
| 0 RMB ton−1 CO2 | 162.5 RMB ton−1 CO2 | 325 RMB ton−1 CO2 | |
| Blue map | 2040 | 2032 | 2028 |
| Global outlook advanced | 2038 | 2031 | 2025 |
| Global outlook moderate | 2041 | 2033 | 2027 |
| Roadmap | 2040 | 2031 | 2024 |
© 2019 by the authors. Licensee MDPI, Basel, Switzerland. This article is an open access article distributed under the terms and conditions of the Creative Commons Attribution (CC BY) license (http://creativecommons.org/licenses/by/4.0/).
Share and Cite
MDPI and ACS Style
Zhuang, X.; Xu, X.; Liu, W.; Xu, W. LCOE Analysis of Tower Concentrating Solar Power Plants Using Different Molten-Salts for Thermal Energy Storage in China. Energies 2019, 12, 1394. https://0-doi-org.brum.beds.ac.uk/10.3390/en12071394
AMA Style
Zhuang X, Xu X, Liu W, Xu W. LCOE Analysis of Tower Concentrating Solar Power Plants Using Different Molten-Salts for Thermal Energy Storage in China. Energies. 2019; 12(7):1394. https://0-doi-org.brum.beds.ac.uk/10.3390/en12071394
Chicago/Turabian StyleZhuang, Xiaoru, Xinhai Xu, Wenrui Liu, and Wenfu Xu. 2019. "LCOE Analysis of Tower Concentrating Solar Power Plants Using Different Molten-Salts for Thermal Energy Storage in China" Energies 12, no. 7: 1394. https://0-doi-org.brum.beds.ac.uk/10.3390/en12071394
Note that from the first issue of 2016, this journal uses article numbers instead of page numbers. See further details here.