1. Introduction
Ethanol can be considered a proper alternative fuel for spark ignition (SI) engines because it shows several physical and combustion properties similar to gasoline and it can be produced from renewable energy sources. While most ethanol today is produced from grain starch (in US), sugar cane (in Brazil), and rapeseed oil (Europe) [
1], industry is adopting new technologies to process different types of waste biomass materials, corn, and barley to produce new low-carbon bio fuels that can achieve renewable energy targets for the transport sector.
In the European Union, the market petrol may contain up to 10% ethanol by volume (E10). So far, E10 petrol has only been introduced in Finland, France, Germany, and Belgium, whereas the other countries continue to use E5. One of the EU objectives is to have 10% of transport fuel provided from renewable sources by 2020. New generation biofuels are required to reduce the greenhouse gas intensity deriving from fuels; for this reason, the EU sets rigorous sustainability criteria in order to avoid the process of indirect land use change (Directive 2018/2001).
Ethanol in SI engines increases the combustion performance, mainly due to higher flame speed and oxygen content. The latent heat of evaporation of ethanol is 2–3 times higher than that of gasoline; this cools the air entering into the engine and increases volumetric efficiency and power density. Moreover, the higher auto-ignition temperature, latent heat of vaporization, and research octane number of ethanol could reduce engine knock tendency [
2].
Despite these advantageous characteristics, neat ethanol is not easily used as transport fuel mainly because its low heating value and low volatility make cold starting very challenging, especially in cold climates.
The most common way to overcome this problem is to blend ethanol with a much more volatile fuel such as gasoline.
Ethanol-gasoline blends were extensively studied in engine research [
3,
4], the results showed that ethanol-gasoline blended fuels provide higher engine efficiency, compared to neat gasoline.
However, low levels of ethanol can induce gasoline to evaporate more easily, thus low-level ethanol blends can increase evaporative emissions in vehicles.
For this reason, car manufacturers have developed flexible fuel vehicles able to run with ethanol levels ranging from 0% to 85%. These vehicles are currently very popular in Brazil and in Sweden and their future popularity will mainly depend on the strategy adopted to promote the market share of biofuels.
Greater ethanol percentages are commonly used in Brazil and the United States aiming to reduce the dependence on fossil fuels and improve the engine performance [
5]. E85 (15% gasoline plus 85% ethanol by volume) is generally the mixture with the greatest amount of bioethanol that can be found in the United States with more than 3000 fueling stations [
6]. E85 has an octane number of 106, quite lower than pure ethanol but still higher than gasoline (95).
Such a high-level of gasoline–ethanol blend is less volatile than gasoline and low-level ethanol blends and results in lower evaporative emissions. On the other hand, in comparison to gasoline, ethanol requires a higher fuel/air ratio for stoichiometric combustion and it shows a lower LHV. This means that ethanol fuel needs higher fuel mass flow and thus a longer injection pulse width, leading to greater cylinder wall and piston wetting tendencies.
Usually, gasoline and ethanol are externally mixed in a definite blending ratio before the use as fuel. However, a novel port dual-injection strategy can offer greater flexibility: different quantities of two different fuels can be separately and simultaneously injected into the intake manifold allowing for different mixing ratios. The blending proportion of alternative and fossil fuels can be instantly changed according to the engine request and in-vehicle fuel availability. Therefore, the port dual-injection strategy offers an alternative approach to meet stringent emissions targets and future biofuel legislation [
7,
8].
At the present time, there is no information about the impact that the mixture formation can have on performance, combustion, and emissions. For this reason, in this paper the pre-blended PFI strategy and the equivalent port dual-injection were compared for E85.
Performance and emissions were studied in different SI engines fueled with E85 in terms of thermal efficiency, carbon monoxide (CO), oxides of nitrogen (NOx), carbon dioxide (CO
2), and unburned hydrocarbons (HC) [
9,
10]. Many researchers reported that blended ethanol fuel in SI engine decreased HC and CO, remarkably. However, the changes in CO
2 and NOx were very dependent on the kind of engine and on operating condition. It is generally accepted that ethanol blended fuel exhibits higher particulate mass (PM) and particles number (PN) emissions than that of gasoline in direct injection (DI) SI engines, mainly due to the lower evaporation characteristics of ethanol at ambient temperature below 300 K. Anyway, some researchers showed that PM emissions from DI engines can either increase or decrease with ethanol content depending on fuel injection timing [
11]. This result indicates that engine-out particles emissions from ethanol-blended gasoline are still not nearly as well understood as those for diesel or gasoline [
12]. It was consistently reported [
13] that in SI-PFI vehicles the addition of ethanol caused a decrease in the number of particles and a significant reduction in PM mass emissions. Even if the particle formation could be influenced by mixture formation, at the present time, no studies have been carried out on the influence of the injection strategy (port dual fuel and single injection) on particle emission.
The purpose of this investigation is to assess the effects of ethanol-gasoline injection mode on performance and exhaust emissions of a downsized PFI twin-cylinder turbocharged engine. Ethanol was supplied into the intake manifold through a fuel injection system separated from that for the gasoline (dual-fuel, DF) and in blend with gasoline (mixed). The ratio between ethanol and gasoline mass was fixed at 0.85. The initial reference conditions were set running the engine, fueled with full gasoline at the knock limited spark advance (KLSA) boundary, a spark timing sweep was carried out at lean, stoichiometric, and reach conditions.
2. Experimental Setup
The experiments were carried out on a PFI twin-cylinder SI engine whose main characteristics are reported in
Table 1. Further information can be found in [
14]. The engine was equipped with an electro-hydraulic intake variable valve actuation system (VVA) that allows managing the combustion air with a limited throttling of the intake duct at part load. A waste-gated Mitsubishi turbocharger, with a dump-valve for surge control on the compressor, could attain boost pressures up to 2.4 bar. The air was constantly supplied to the engine at 293 ± 1 K by an air conditioning unit. Piezo-quartz pressure transducers (accuracy of ±0.1%) were installed within both cylinders to detect instantaneous in-cylinder pressure signals that were acquired through AVL INDICOM. Afterwards, ensemble averages were performed on 270 consecutive cycles. Furthermore, the boost pressure at the compressor outlet and the turbine inlet pressure were acquired through piezo-resistive low-pressure indicating sensors. Thermocouples were installed to monitor intake and exhaust temperatures, primarily to check the maximum gas temperature allowed by the turbine blades.
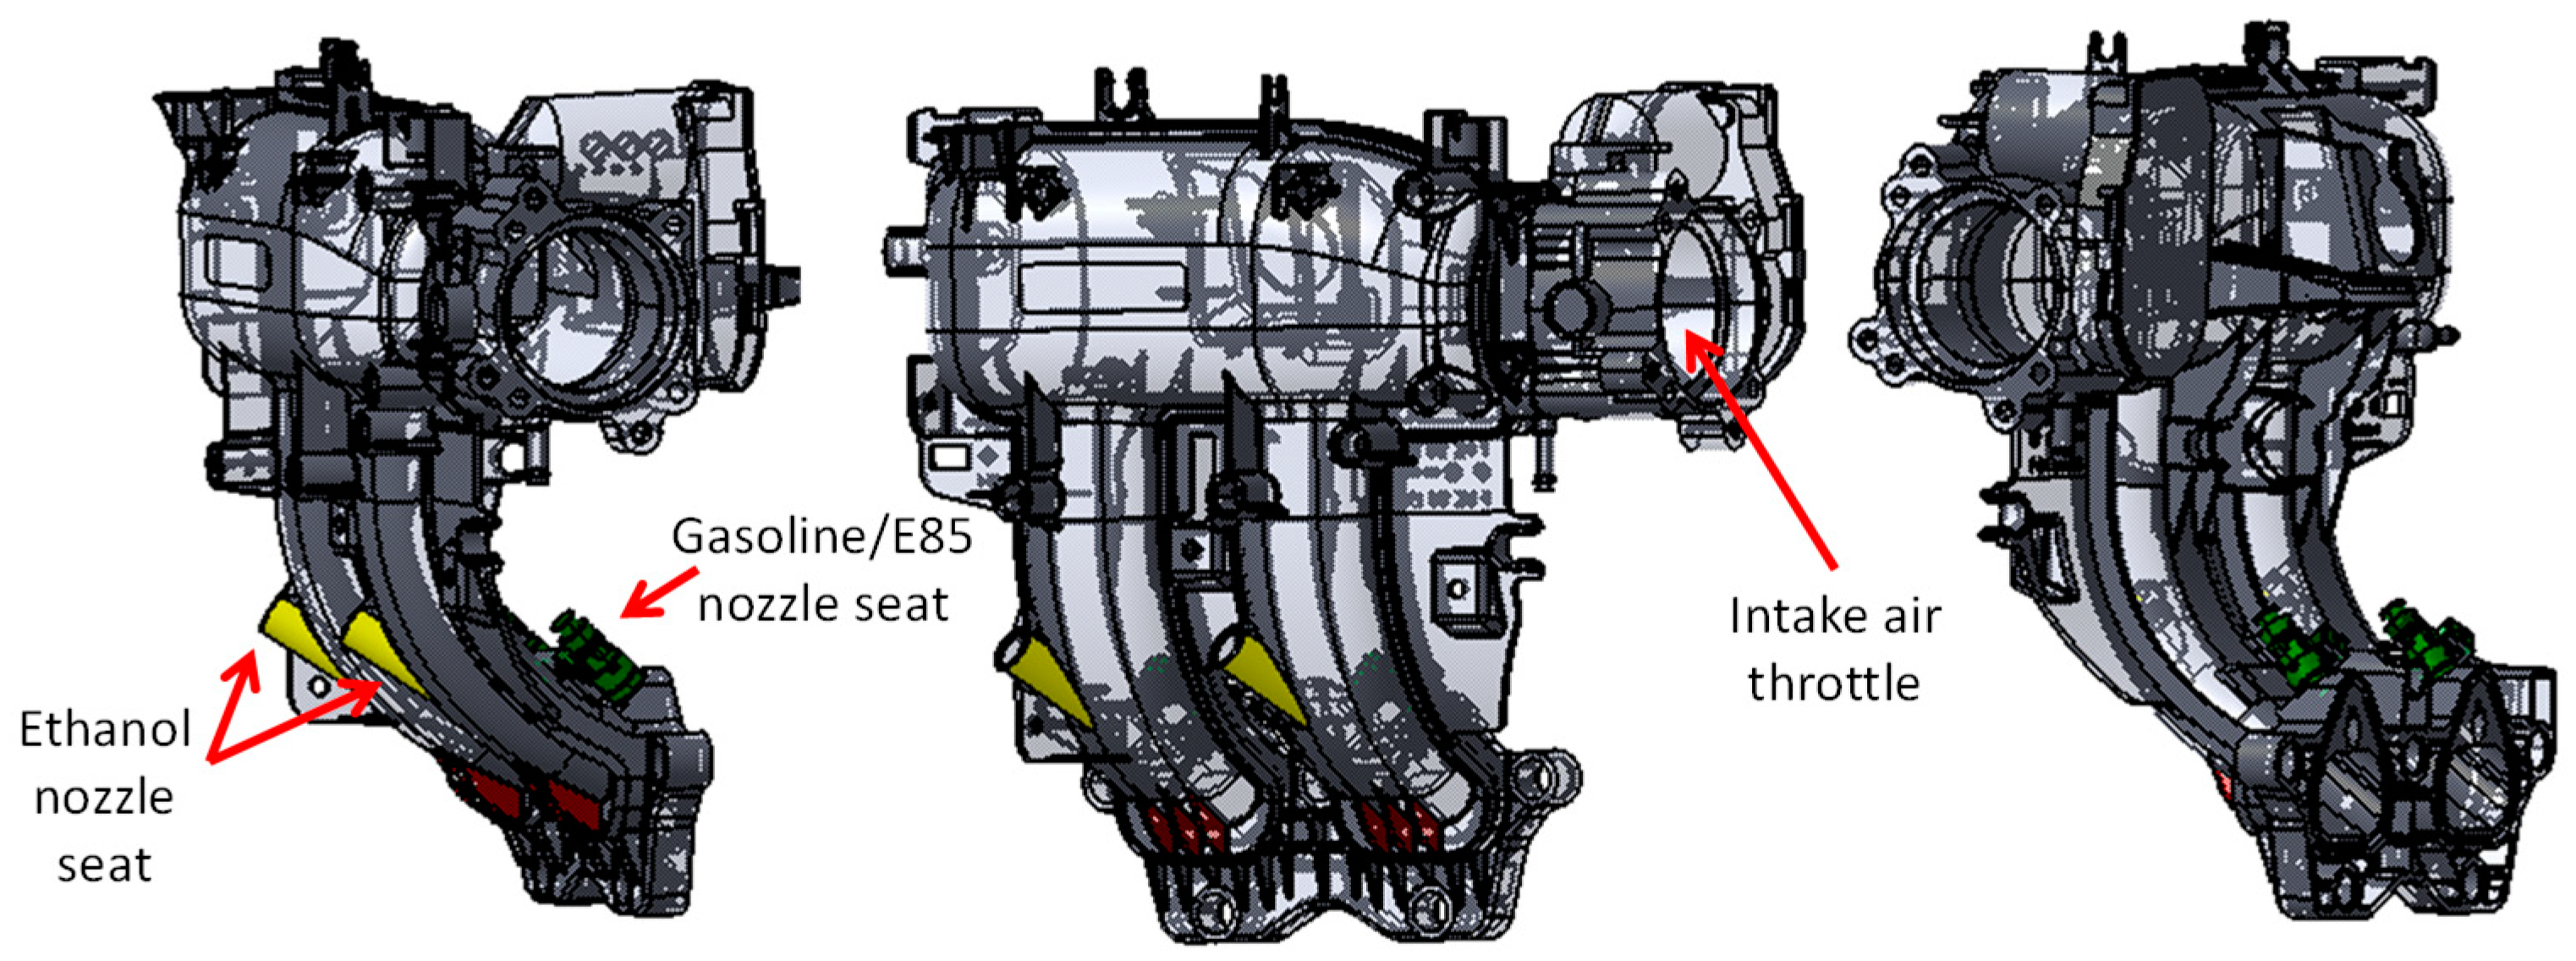
In this paper, we investigated two different fuel injection approaches: mixed fuel port injection and dual-fuel injection. The schematic of experiment setup is shown in
Figure 1.
In the first case (mix mode) ethanol and gasoline were externally mixed and then injected in the intake manifold through the standard gasoline injectors. Compared to the second case (dual mode), ethanol was injected by two solenoid injectors installed in the runners, upstream of the standard gasoline ones. The ethanol injection system included an external pump and a rail to accumulate a proper amount of alcohol, the system was controlled by an external driver that also allowed handling the injection timing and interval. The injection pressure was kept constant at 4 bar.
For each injection mode, the injection interval was adjusted to keep the same energy content at λ value set by ECU standard map. Then, the fuel amount was modified in order to reach the chosen λ value taking into account the different ethanol properties compared to gasoline.
Table 2 shows a number of selected properties which are relevant to the analysis performed in this paper, they are given for 1.0 bar ambient pressure and are obtained from scientific literature [
15,
16].
The engine was controlled by a prototype driver managed by a software tool developed within LabView environment able to switch from the commercial ECU to external control. In this way, the main engine parameters—such as spark advance (SA), fuel injection timing, and interval—of both ethanol and gasoline could be handled and monitored. The other engine parameters, based on manufacturer-developed logics, such as valve and turbocharger strategies were controlled by the standard ECU map. The in-cylinder pressure data were acquired selecting a high sampling resolution of 0.1 CAD within the angular window between −90 and 90 CAD ATDC, for combustion analysis assuming a polytropic thermodynamic process. Outside of the former angular interval, the sampling resolution was set at 1 CAD.
Exhaust gas emissions were sampled by a ultra-violet gas analyzer (UV Limas 11, ABB, Zürich, Switzerland) for NOx and cold extractive IR gas analyzer (URAS, ABB, Zürich, Switzerland) for CO, CO
2 and O
2 while a FID analyzer (Siemens, Munich, Germany) was used for THC. An electrical low-pressure impactor (–ELPI, Dekati Ltd., Kangasala, Finland) was used to measure total particle number (PN) and size distribution in the range 7 nm–10 µm. PN sampling was carried out upstream of the three-way catalyst by using a double stage diluter (FPS, Dekati Ltd., Kangasala, Finland) which controlled the dilution temperature at 150 °C and the dilution ratio at 30. PN size distribution acquired by ELPI was also used to estimate the particulate mass, assuming the soot density as 1 g/cm
3. In order to minimize the artifacts associated with ELPI currents, only particles with aerodynamic diameters lower than 1 µm were considered for PM estimation (PM1) [
17].
Engine Test Conditions
Tests were carried out at 3000 rpm considering as reference 17.5 bar of net IMEP, corresponding to high load condition. The net IMEP was estimated by the in-cylinder pressure over the complete engine cycle, computed as the difference between the gross IMEP (in-cylinder pressure over compression and expansion strokes) and pumping mean effective pressure (PMEP), evaluated over intake and exhaust strokes. This condition was chosen to keep the maximum allowable turbine inlet temperature (TIT) below 950 °C and the average maximum in-cylinder pressure below 85 bar (±5 bar) to preserve the engine components from mechanical failure. To this aim, the maximum boost level was automatically controlled in the range 1.85–2.0 bar, acting on the waste-gate valve opening.
Tests were carried out at ethanol to gasoline fraction of 0.85 and the relative air-fuel ratio (λ) was swept from rich (0.9) to stoichiometric (1) and lean condition (1.1) to this aim, the fuel injection amount was fine monitored to realize the correct air/fuel ratio, estimated by the exhaust lambda sensor meter, based on the changing oxygen mass, located at the exhaust upstream of the three-way catalyst. The initial spark timing was set according to the standard ECU map corresponding to the KLSA under full gasoline operation. Then, E85 was used and the spark timing was swept out up to the new KLSA. These conditions were repeated for both injection modes. The overall test matrix is illustrated in
Table 3.
3. Results and Discussion
3.1. Effects of Ethanol–Gasoline Injection Mode on Engine Combustion and Performance
As already mentioned in the previous section, the selected reference condition corresponded to full gasoline, rich case (λ = 0.90, SA = −11 CAD ATDC, IMEP = 17.5 bar), according to the ECU standard engine map, related to the most advanced SA without knock. To illustrate the effect of ethanol injection mode on combustion and performance, the main engine parameters were acquired at rich conditions as shown in
Table 4.
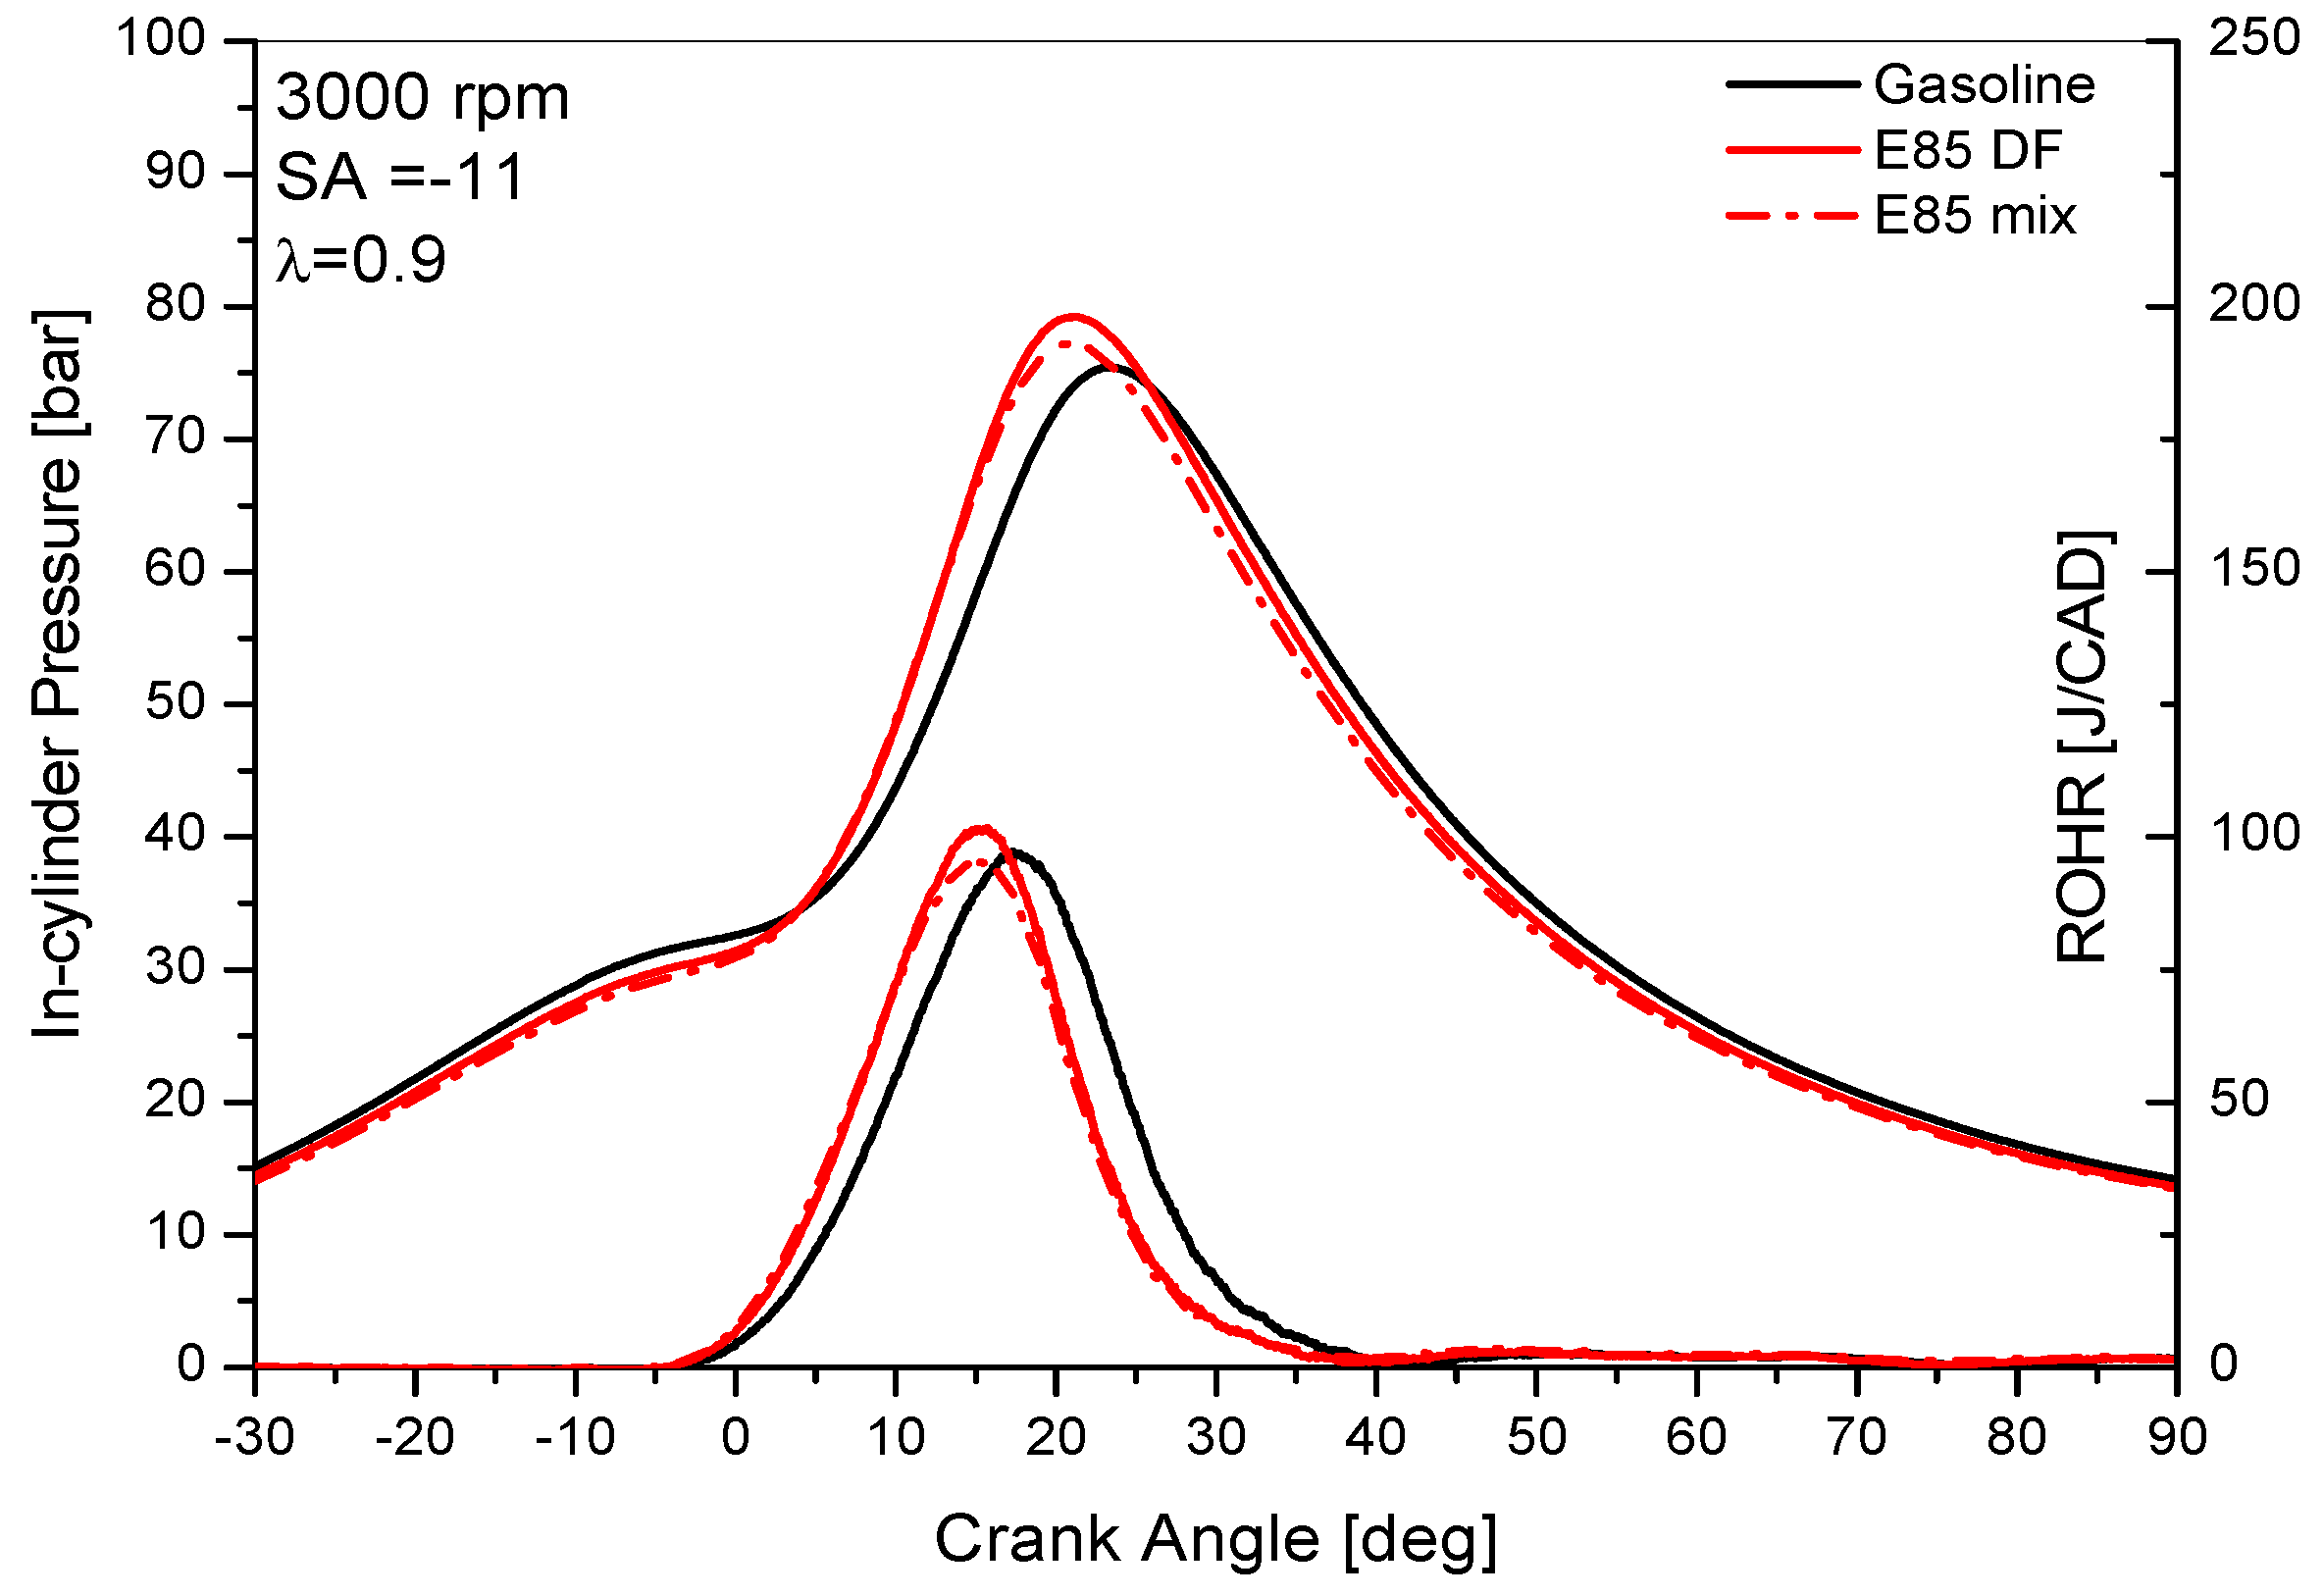
With E85, the IMEP slightly diminishes if compared with gasoline, as well as the turbine inlet temperature even if the thermal efficiency remains almost unvaried (~0.31). Looking at the combustion parameter, E85 leads to a faster combustion than gasoline with higher and earlier in-cylinder peak pressure closer to the TDC. These results are well-illustrated in
Figure 2 which reports the in-cylinder pressure and rate of heat release profiles.
In the compression stroke, the pressure for E85 is lower than gasoline. This is due to E85 having a higher latent heat of vaporization. In addition, the slight difference between the two injection modes can be explained by fuel evaporation rate. More in details, unblended gasoline evaporates faster than the gasoline in the blend. Thus, when dual fuel injection is used, less liquid fuel is introduced in the combustion chamber if compared to mix mode and a lower amount of heat is subtracted to the air (temperature and pressure are higher for E85 DF).
E85 speeds up the rate of heat release triggering higher in-cylinder peak temperature and pressure with an advanced combustion. A slight IMEP reduction for E85 can be explained through the ROHR analysis. Even if gasoline shows a lower peak, a larger amount of heat is released during the expansion stroke.
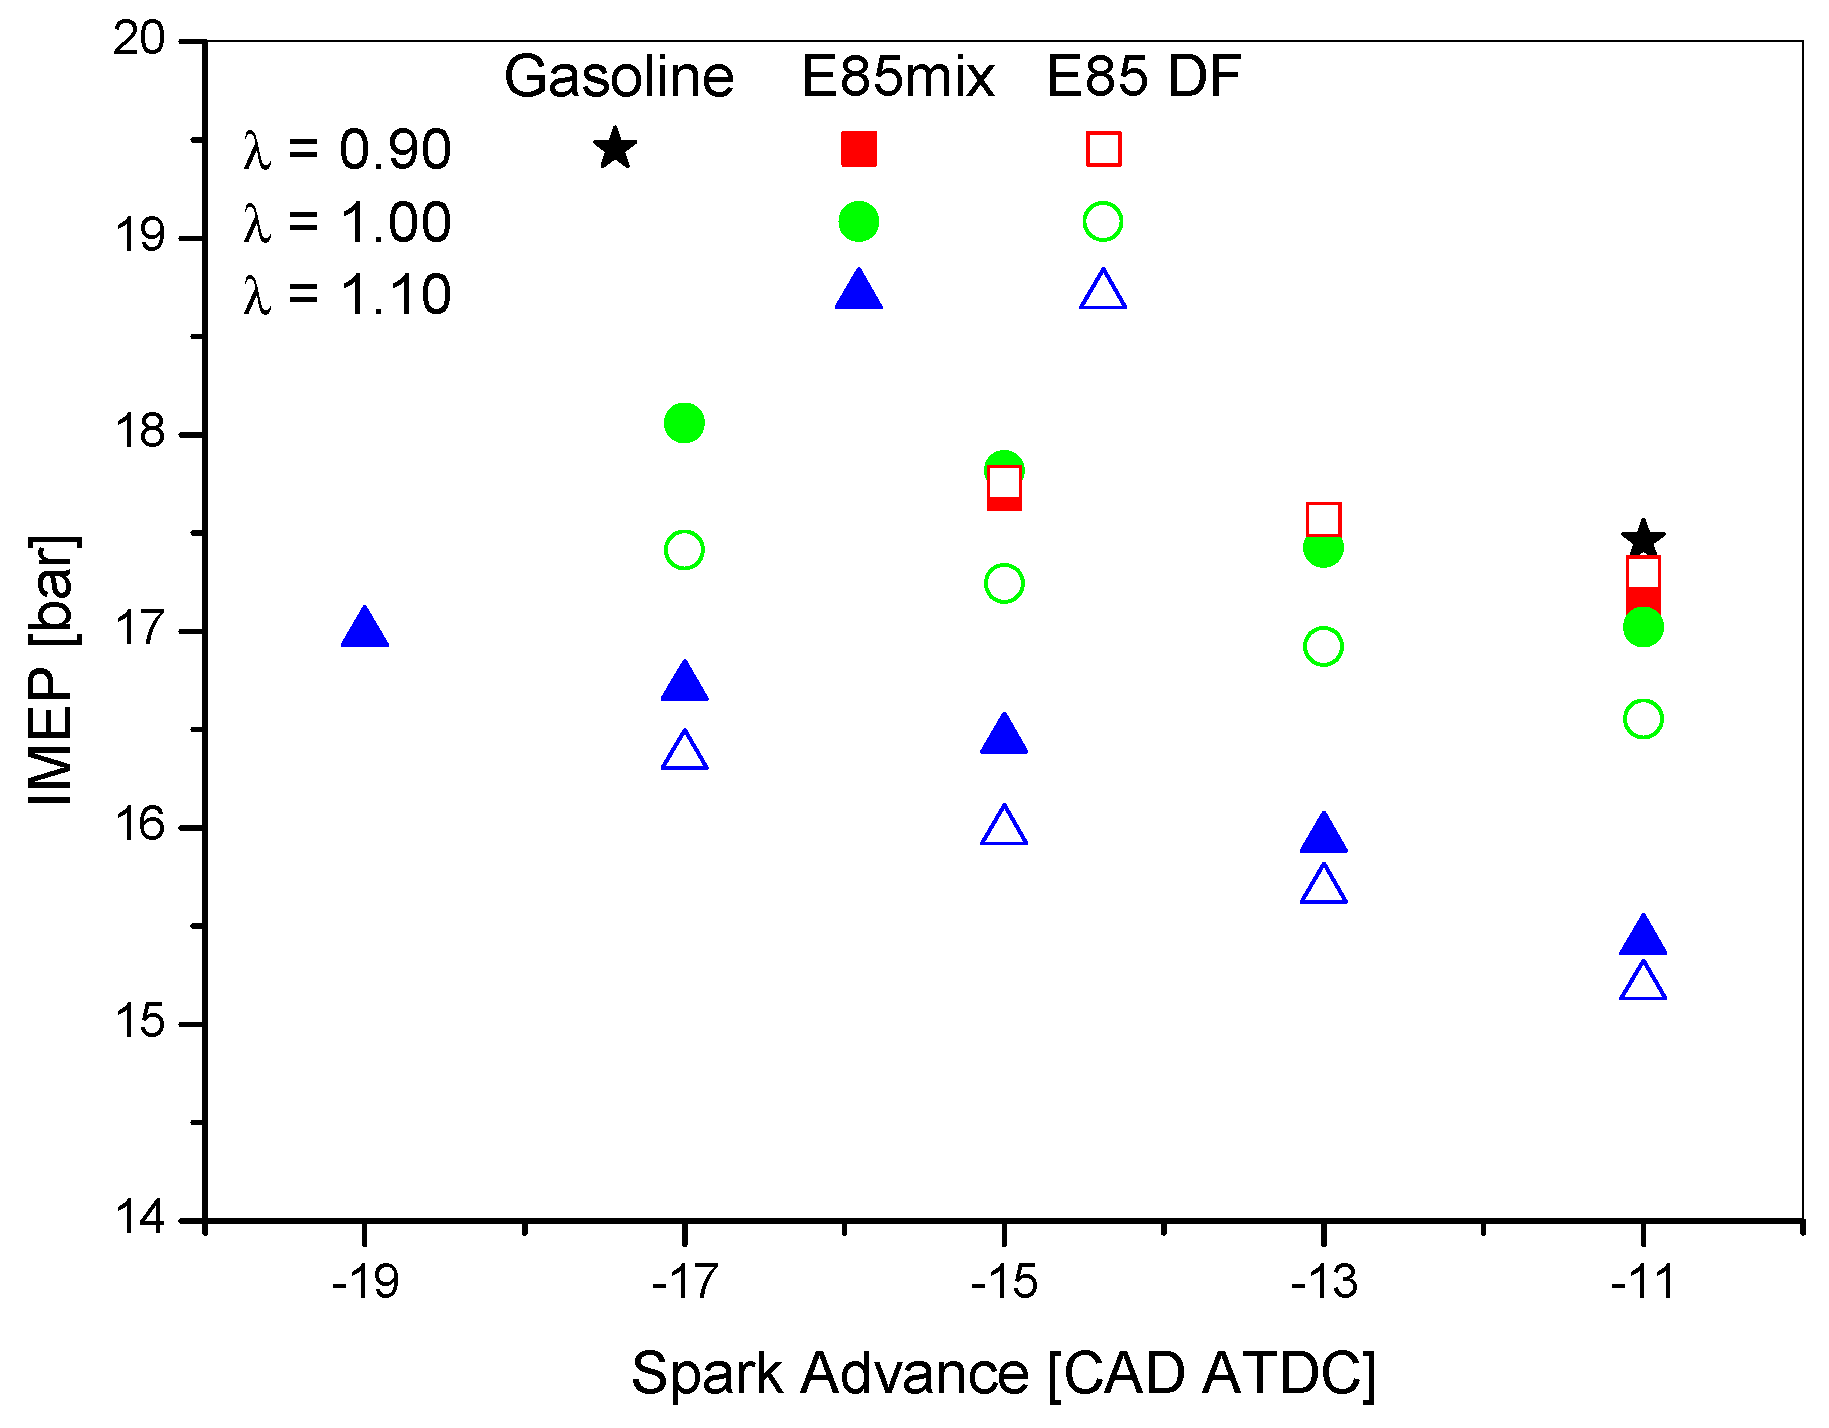
The following sections illustrate results of engine performance and exhaust emissions obtained at rich, stoichiometric, and lean conditions for the two injection modes, as a result of the spark timing sweep up to the new knock limited condition. The effect of injection mode on IMEP at the different spark timings is displayed in
Figure 3. The plot reports the reference condition (black solid star) and the three relative air-to-fuel ratios (λ = 0.9, 1, and 1.1). The effect of charge cooling combined with the inherent chemical anti-knock capability of ethanol allows to set advanced spark timings compared to the full gasoline case and even stoichiometric and lean conditions. The IMEP is reduced when switching from rich to stoichiometric and lean conditions at a fixed SA. Anyway, the load can be recovered by advancing the spark timing considering that E85 allows extending the knock limit up to −19. On the other side, the increase in the in-cylinder peak pressure above the threshold value (~90 bar) inhibits more advanced spark timings to protect engine components from mechanical breakdown. For all the conditions, the standard deviation of IMEP value is lower than 3%.
Very low IMEP levels were measured for λ = 1.1. At fixed spark advance, the IMEP was higher for the mixed blend compared with the dual injection except for the rich case where the two values were almost overlapped. The best engine performance was provided by the mixed blend @ λ = 1, SA −17 that gave the highest IMEP value.
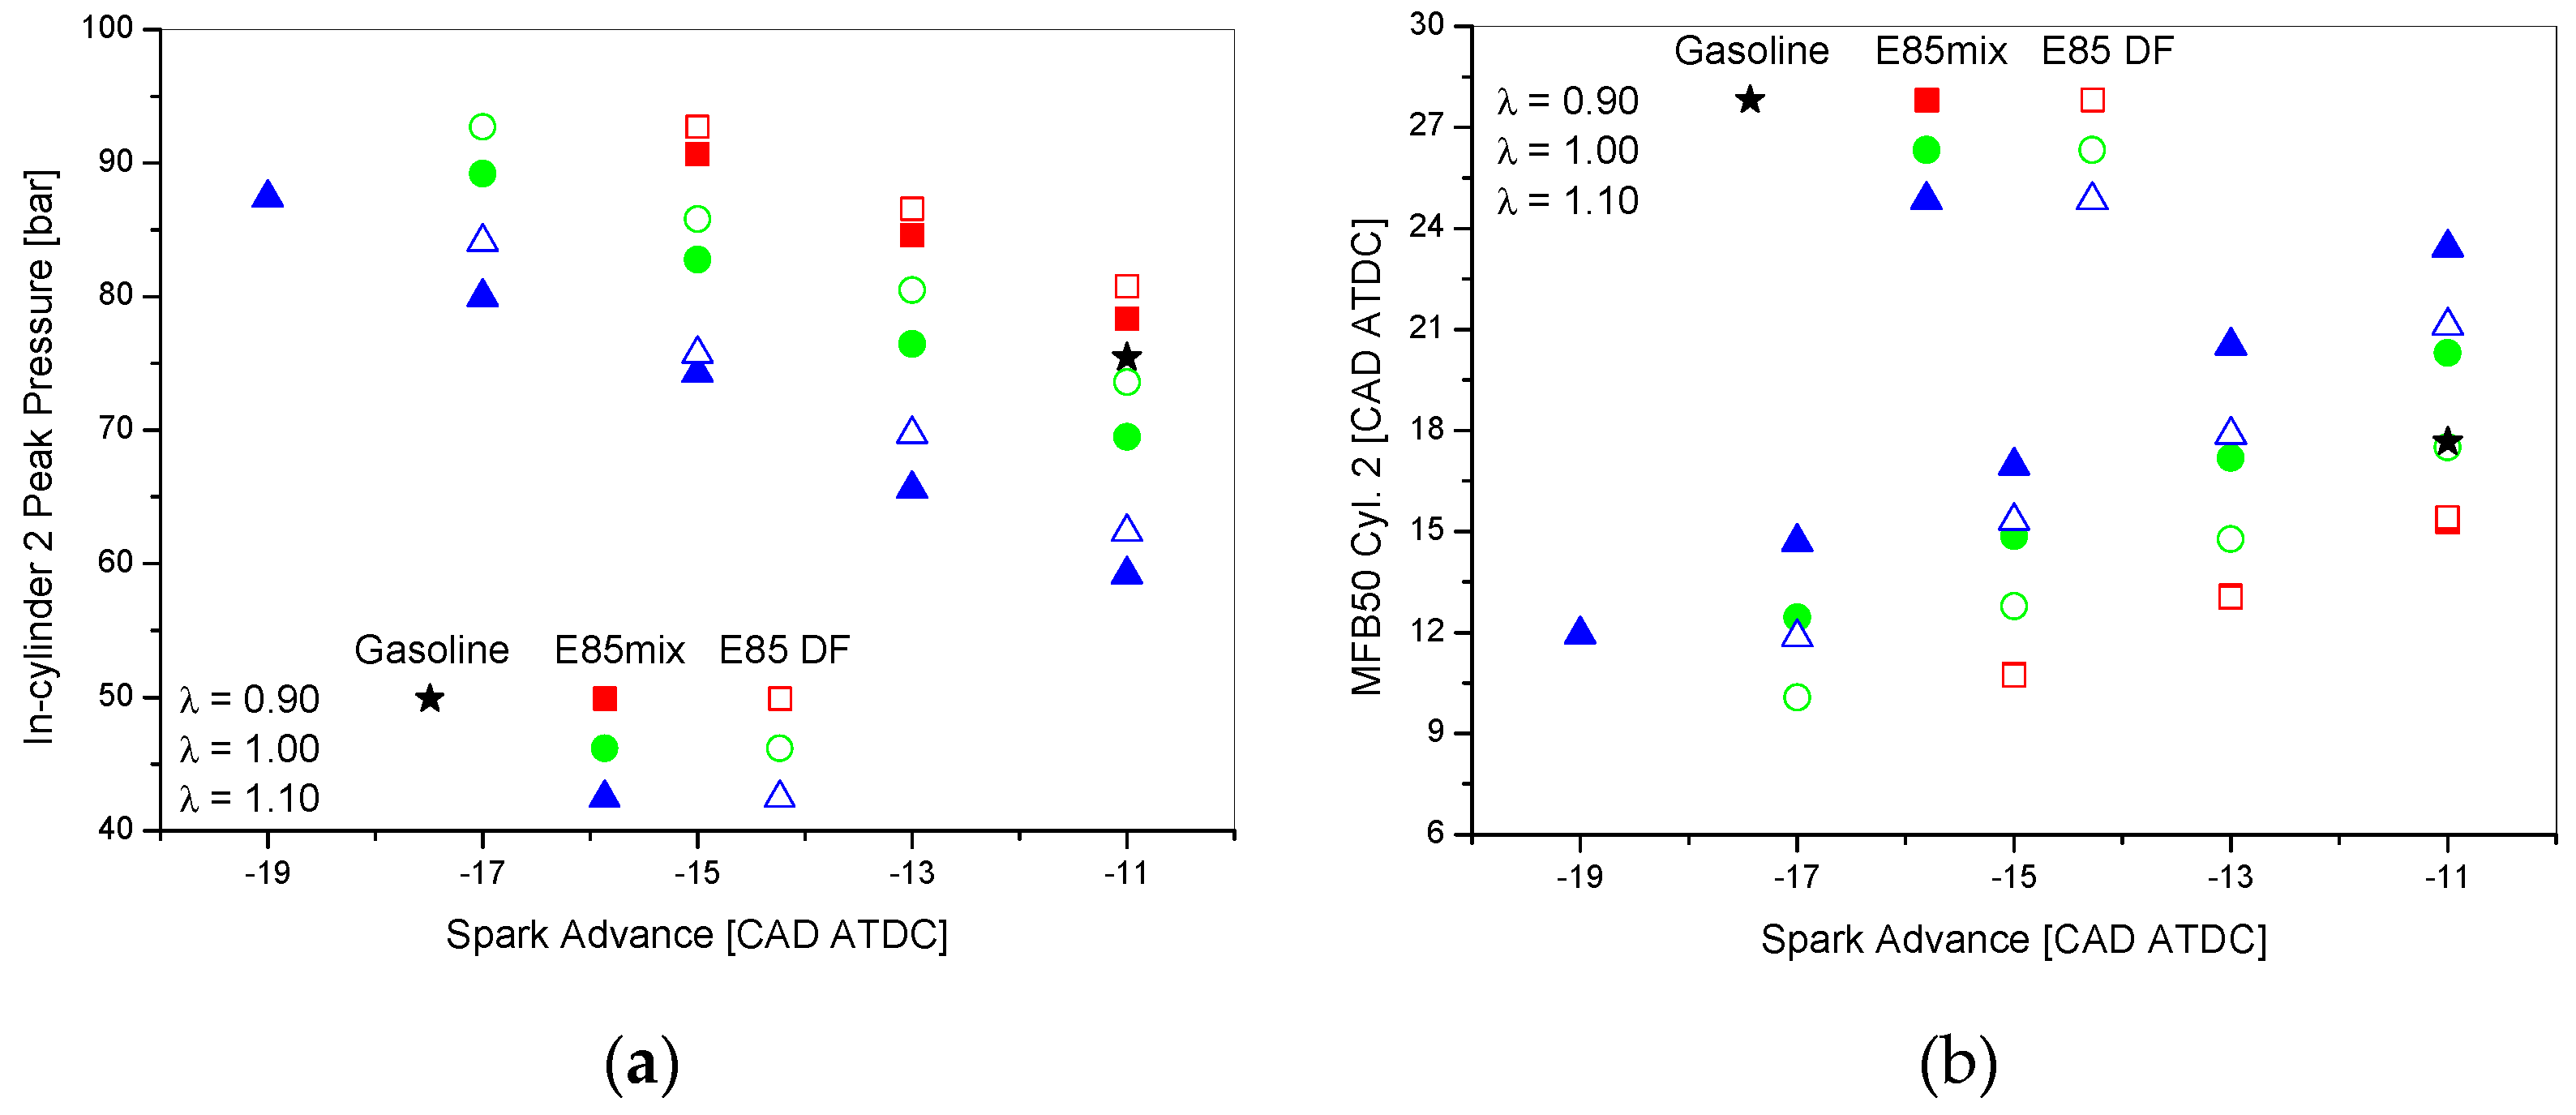
In-cylinder peak pressure profile (
Figure 4a), clearly shows that the E85 rich case results in significant higher peak values if compared to stoichiometric and lean case for all SA, as expected.
Dual fuel injection modes always provide higher Pmax than mix case, this behavior is in agreement with combustion phasing (MFB50) trends, shown in
Figure 4b. In fact, E85 DF shortens the combustion phasing at each SA and air to fuel ratio except for rich conditions where the two behaviors are almost overlapped. This makes the pressure peak in combustion closer to the TDC, resulting in higher values.
As regards the effect of air to fuel ratio, as expected a more advanced combustion phasing is given by rich case while the lean condition reduces the in-cylinder peak pressure and produces a slower combustion with higher MFB50 values.
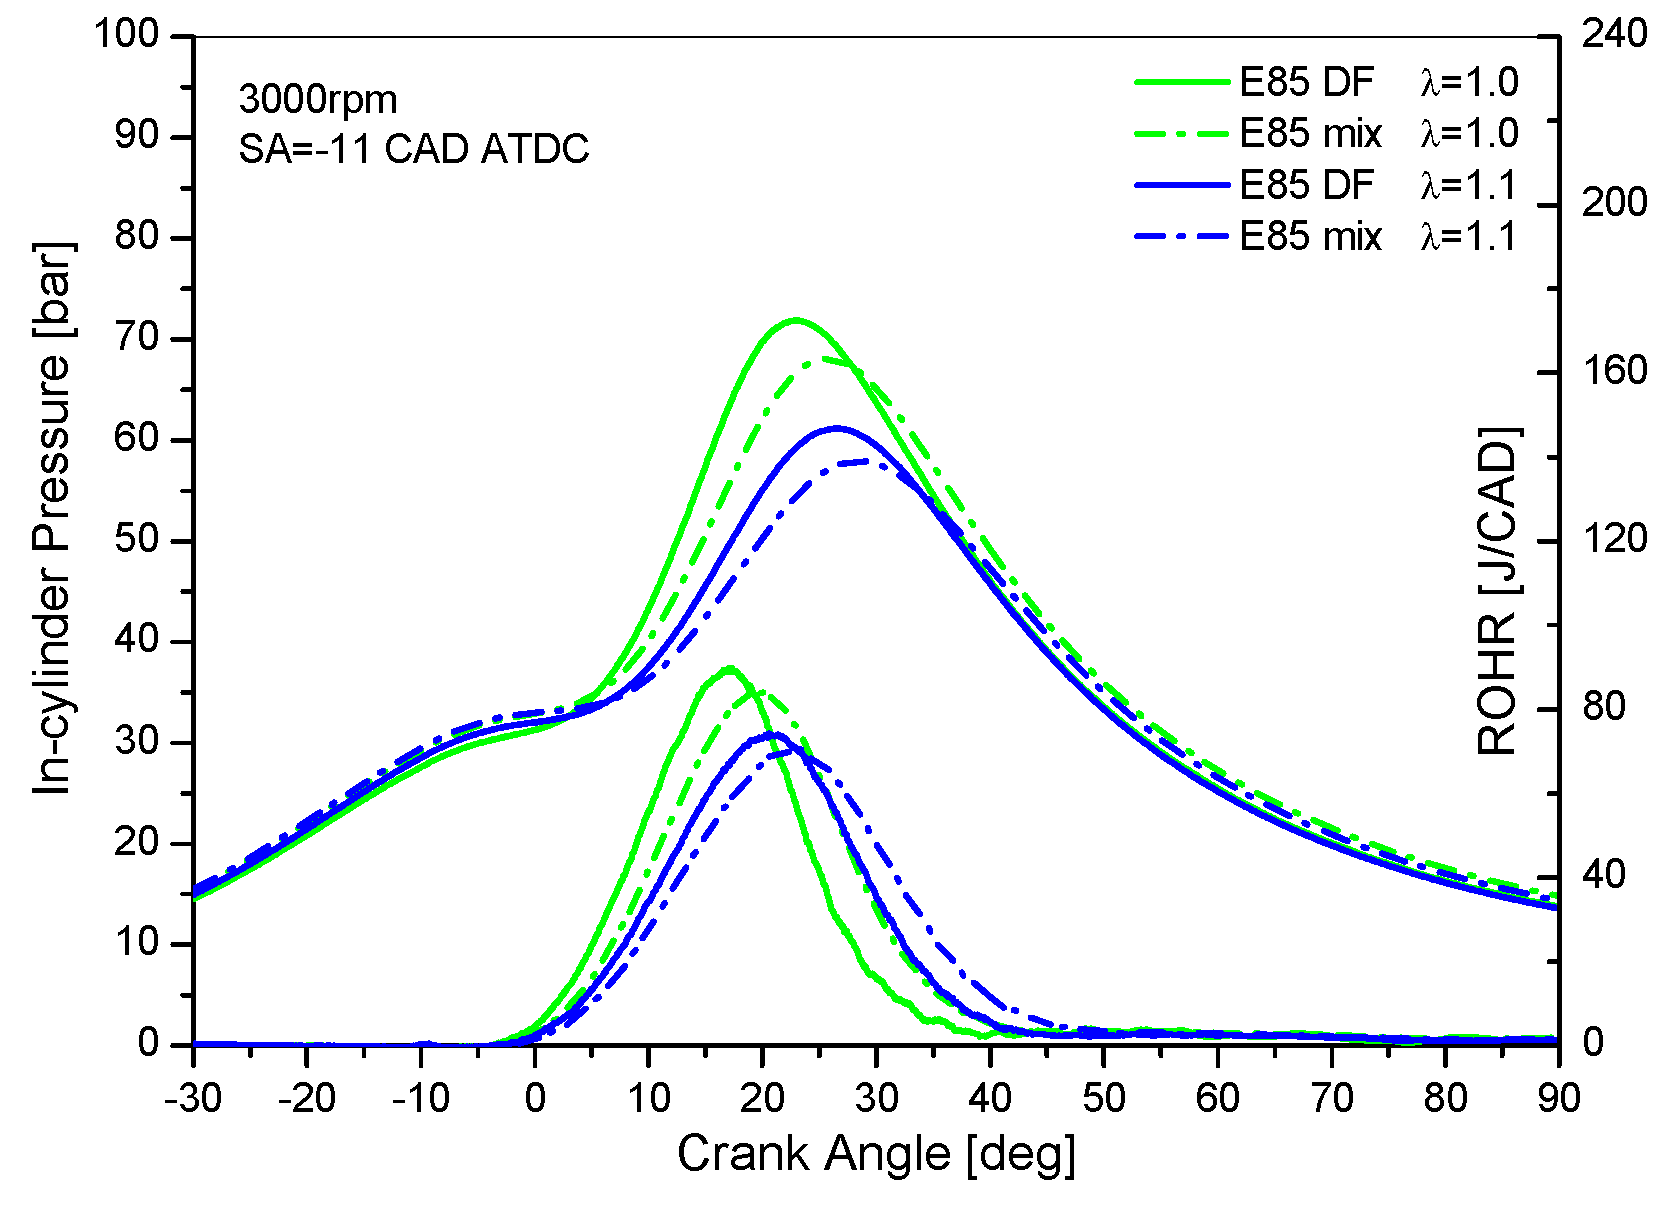
Figure 5 shows the in-cylinder pressure and rate of heat release profiles of E85 at λ = 1.0 and 1.1.
In the mixed fuel injection condition, for every λ value, the use of ethanol blend gives a lower peak pressure and a longer combustion interval. In spite of the lower pressure peak, the increase in combustion duration results in a constantly higher-pressure value during the expansion stroke that induces an increase in thermal efficiency, as confirmed by the results reported in
Figure 6.
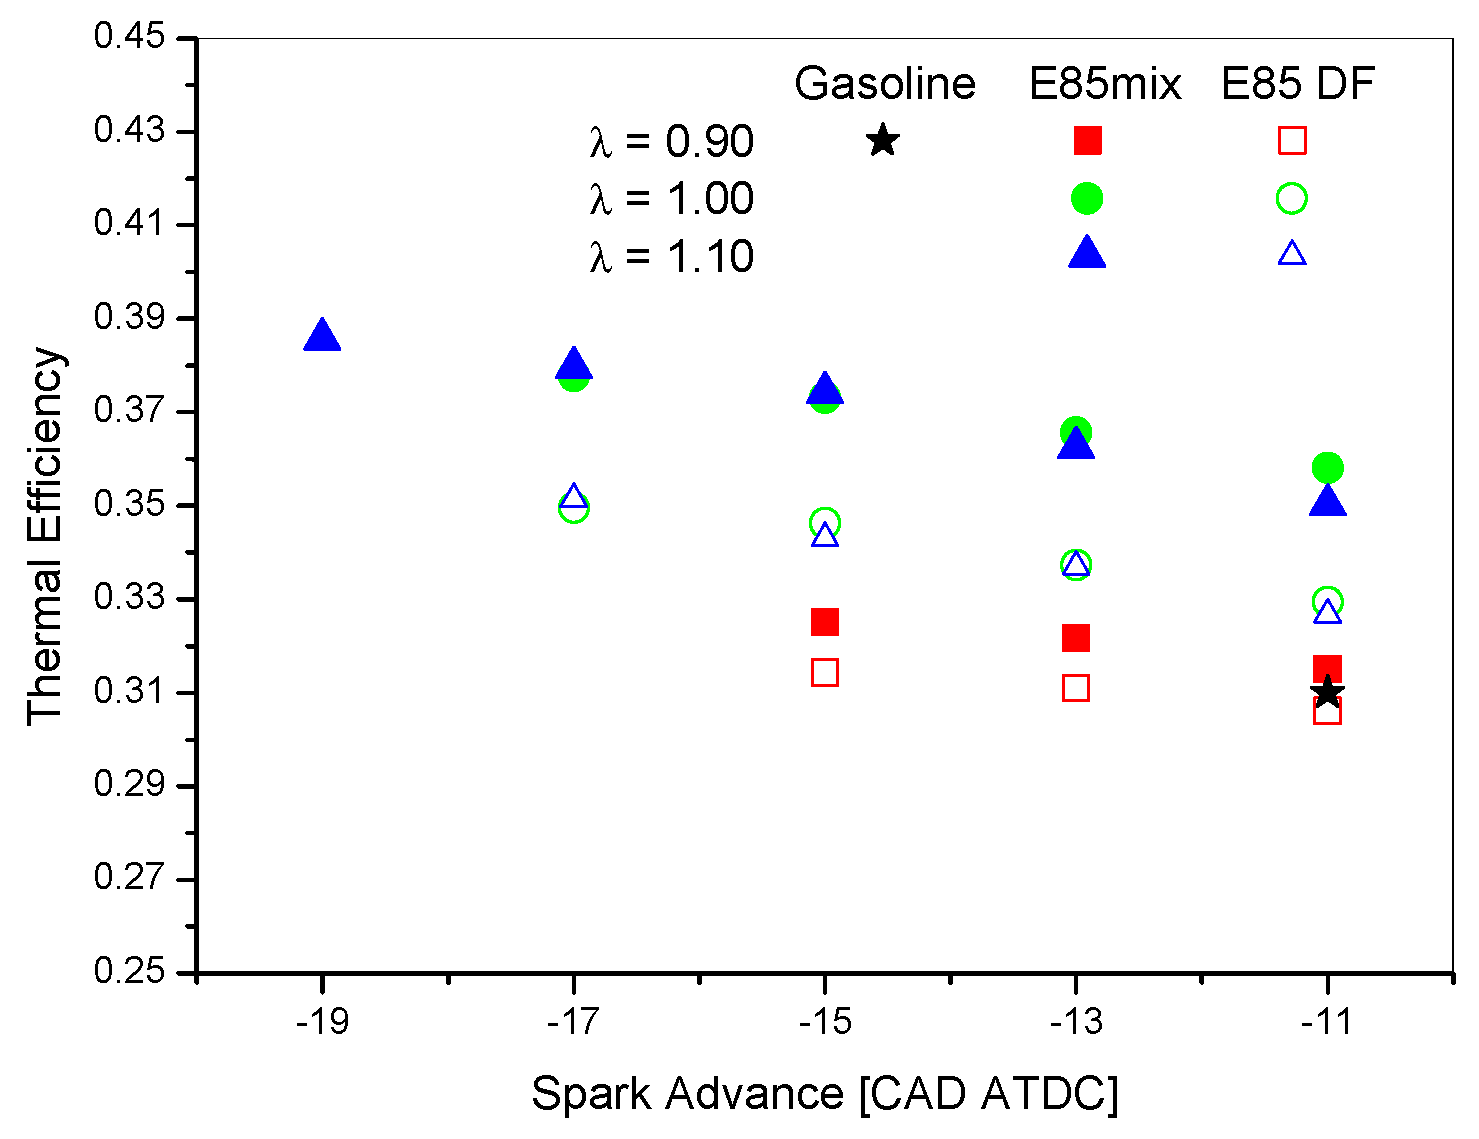
The indicated thermal efficiencies of E85, reported in
Figure 6 are always higher than the reference gasoline knock limited case except for E85-DF rich at SA −11. The highest efficiencies were reached by E85-mix, about 0.39 compared to 0.31 reached by the gasoline reference case. This result can be attributed to the advanced spark timings and leaner mixtures allowed by ethanol anti-knock effect inducing better combustion phasing and faster burning rate.
3.2. Effects of Ethanol–Gasoline Injection Mode on Exhaust Emissions
Figure 7,
Figure 8 and
Figure 9 show the variation of specific exhaust emissions versus the spark advance for different air-to-fuel ratios and injection modes.
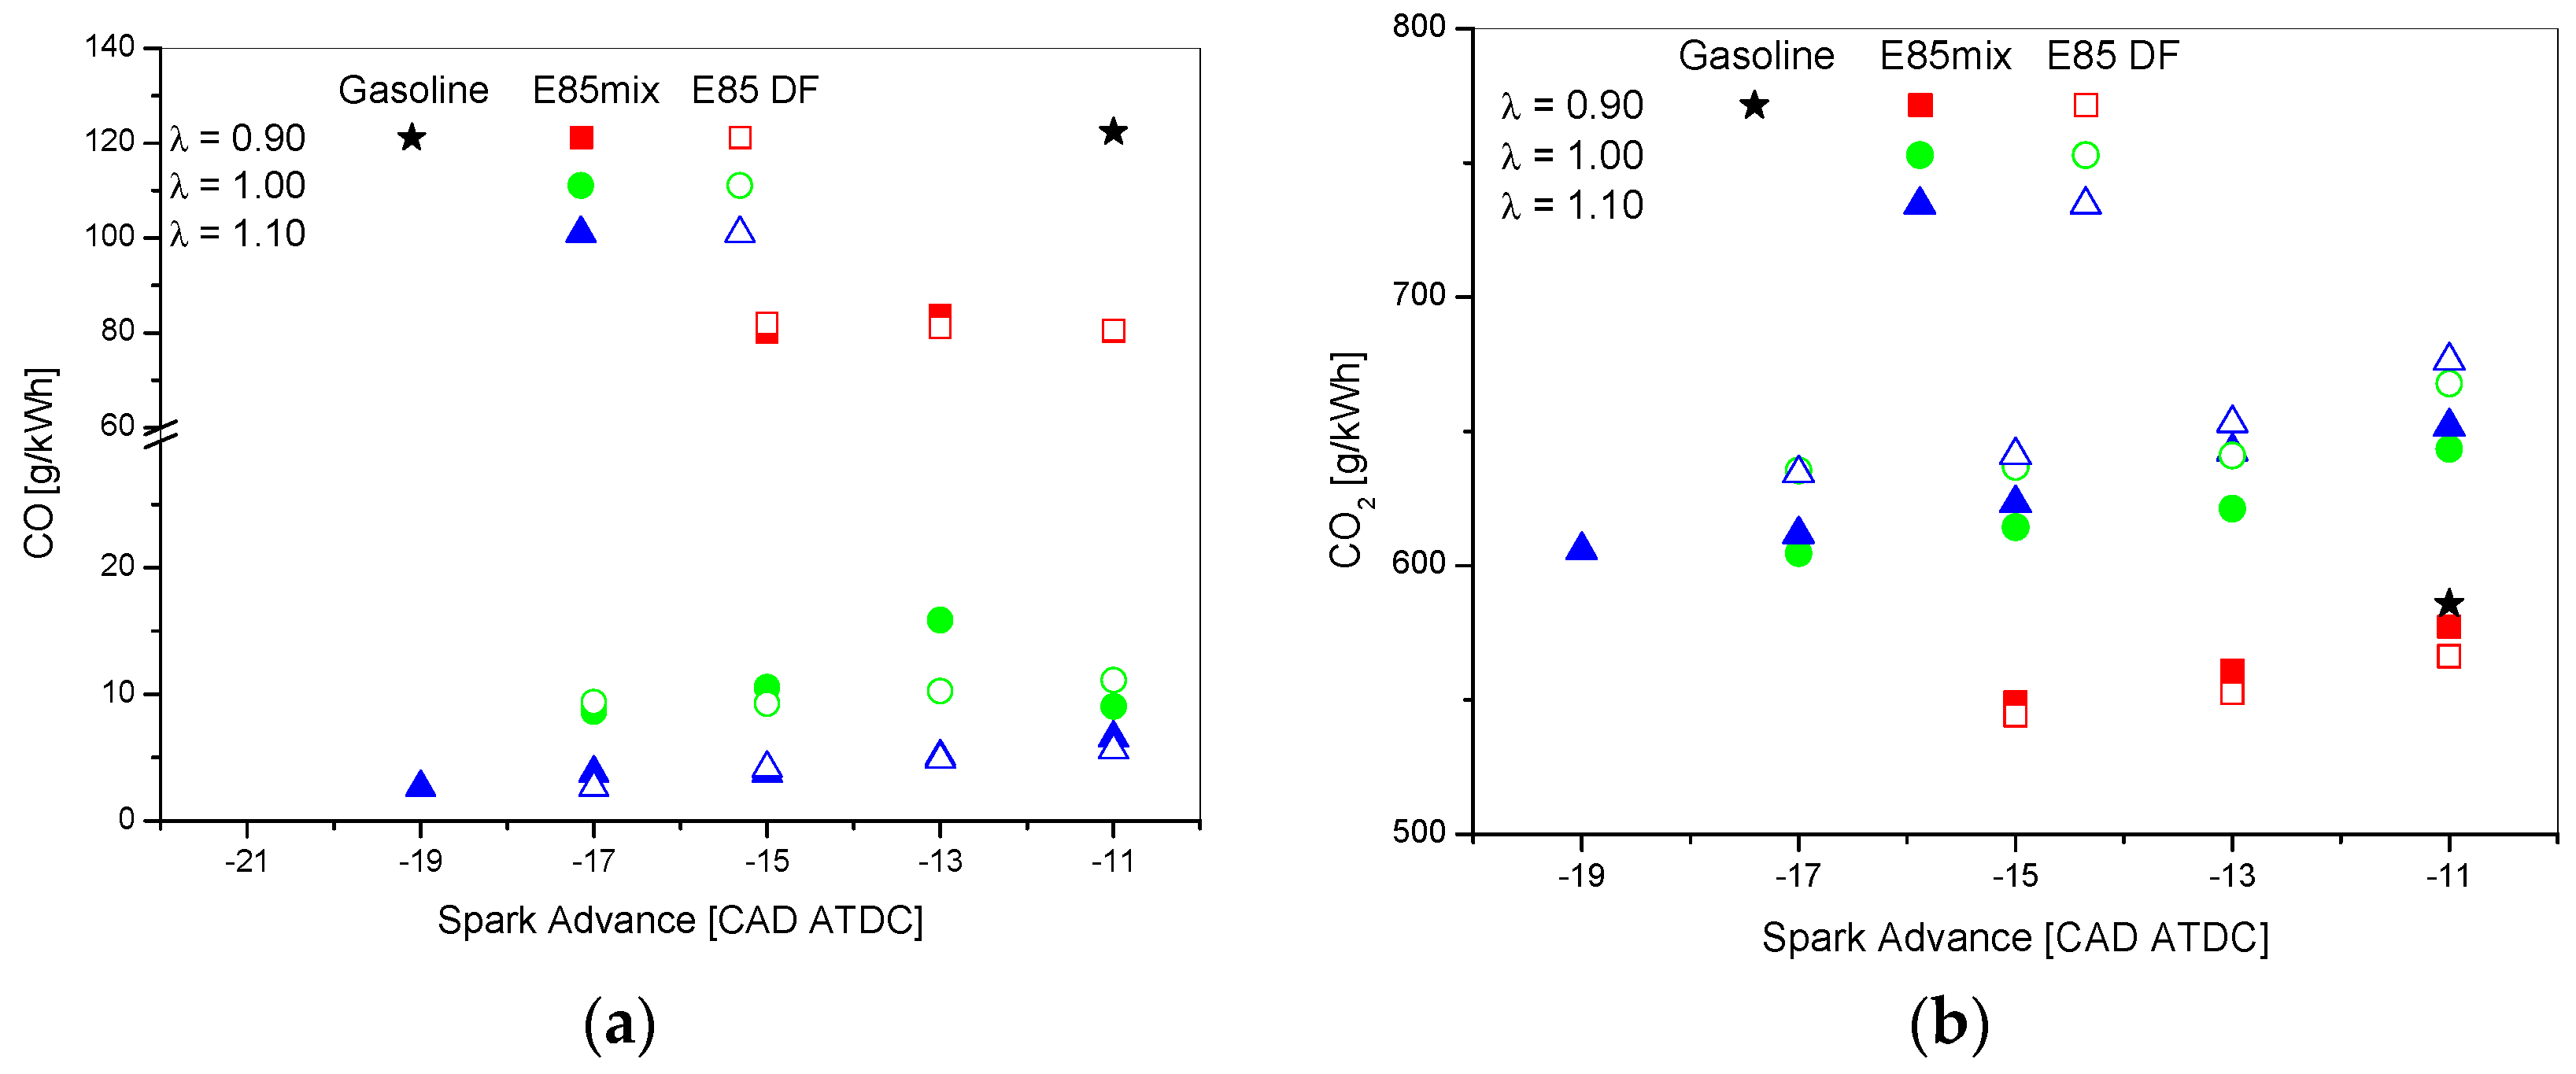
Figure 7a,b shows the effect of injection mode and air-fuel ratio on CO and CO
2.
Switching from gasoline to E85, a more complete combustion due to the ethanol oxygen content results in a reduction in CO.
For E85, the rich case shows high CO and lower CO2 compared to the other lambda values, indicating a low combustion efficiency. At stoichiometric and lean conditions, the higher oxygen content allows a very strong reduction in CO emissions up to values close to zero. For each injection mode, when switching from rich to stoichiometric and lean condition, an increase in CO2 is found in spite of the lower fuel amount injected. This is due to a better combustion for stoichiometric and lean mixture, confirmed by the simultaneous reduction in CO.
Negligible differences in specific CO emissions versus injection mode are obtained. Specific CO2 is higher in dual fuel injection condition for lean and stoichiometric mixture.
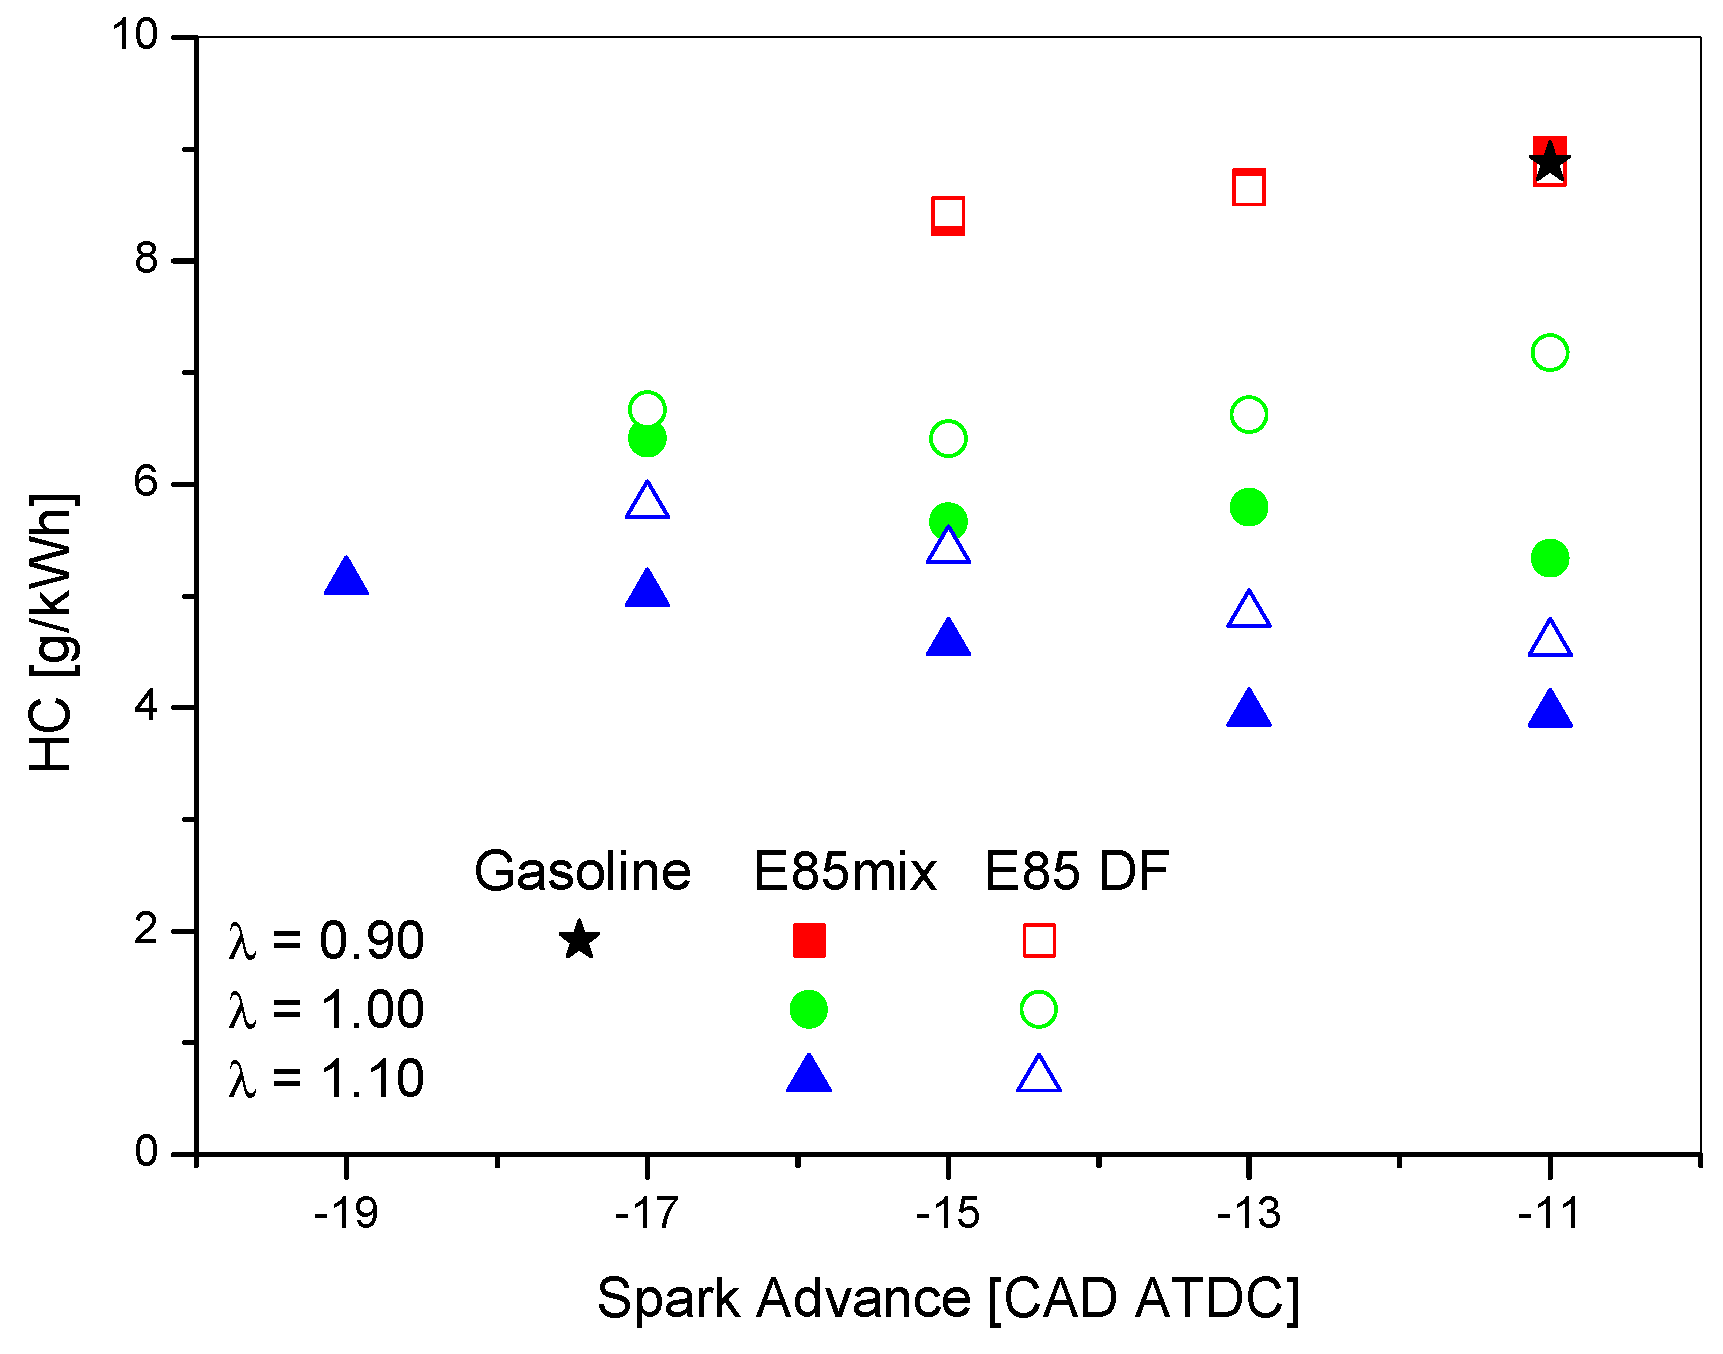
Figure 8 shows the specific HC emissions versus the spark advance for different air-to-fuel ratios and fuel injection modes. Since the FID used for THC measurements is a carbon ion counter and its response is directly proportional to the carbon count of the analyzed gas, in the case of HC coming from pure ethanol the sensitivity is reduced of 0.46 [
18]. As a result, the following HC emissions were adjusted, taking into account the ethanol mass fraction, according to the equation proposed by Kar et al. [
19].
The switch from gasoline to E85 in rich conditions does not result in lower HC. A reduction in HC could be expected since ethanol allows a faster and more complete combustion also thanks to the oxygen in the molecule. Anyway, for the selected operating conditions, when E85 is injected, the total mass of fuel is higher and more HC would be emitted. These two factors compensate each other and HC concentration remains unvaried. A decrease in HC is obtained by increasing the air-to-fuel ratio. The dual fuel injection mode produces higher HC levels than the mix case for every condition except for the rich case, where the worst combustion efficiency reduces the difference until overlapping the trends. The difference between the two injection modes can be explained with the fact that mix mode induces an increase in combustion duration resulting in a constantly higher pressure value during the expansion stroke. The higher pressure (and temperature) of E85 mix in the expansion stroke promotes the oxidation of unburned fuel trapped in the crevices during the compression stroke.
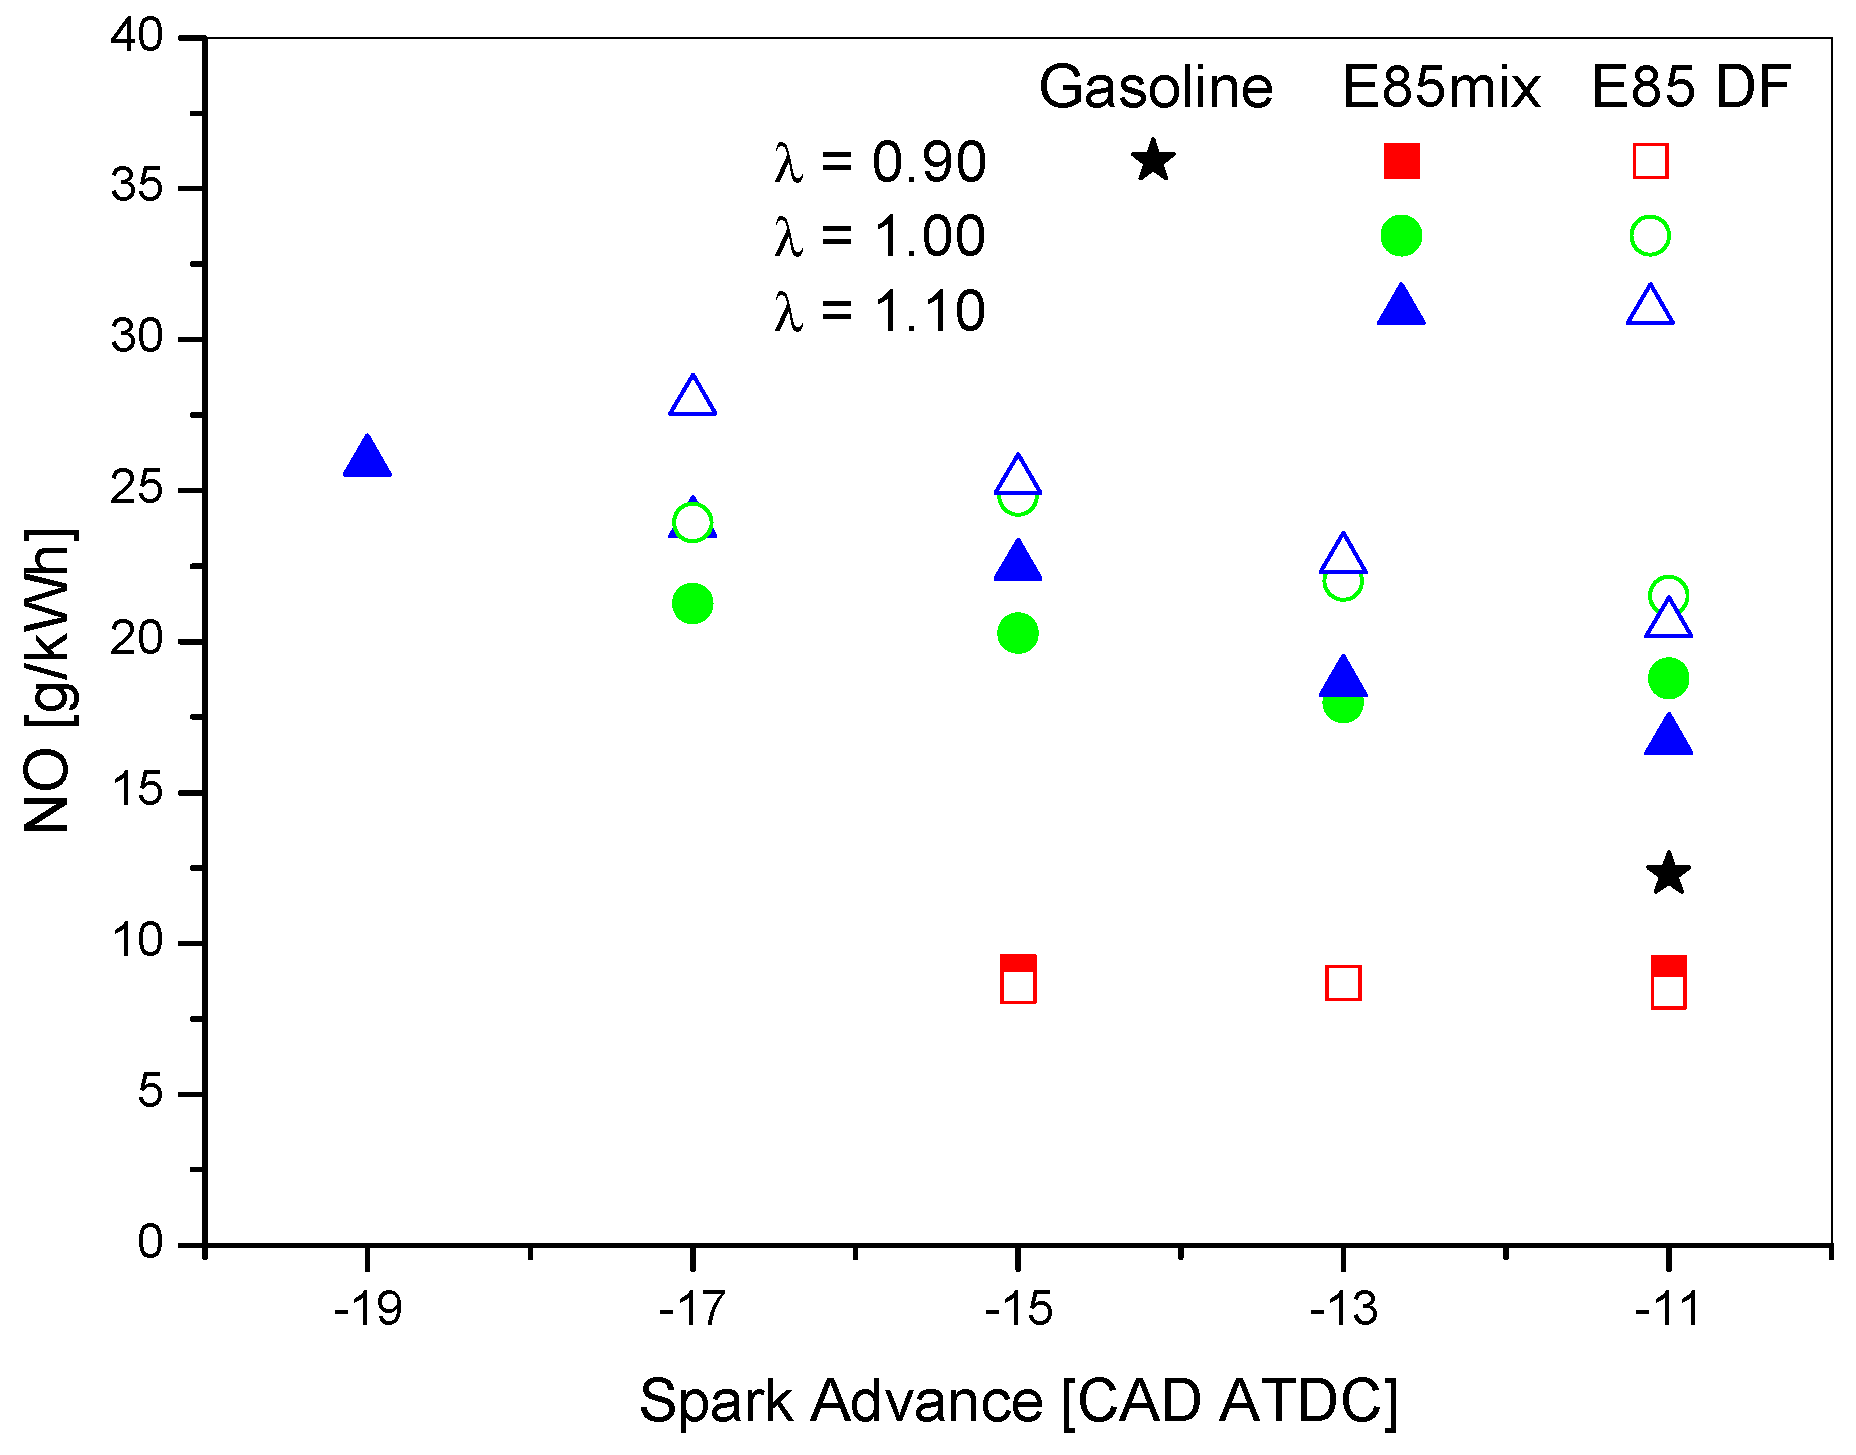
The effect of injection mode and λ on specific NO emissions is shown in
Figure 9. As suggested by many researchers [
16], thermal NOx formation is the dominant mechanism for NOx emission from SI engines for gasoline as well as ethanol fuel. According to this mechanism, NO formation is directly proportional to the temperature reached in the combustion chamber and to the oxygen concentration. In the rich condition, switching from gasoline to E85 there is a slight reduction in NOx. This can be due to the lower adiabatic flame temperature of ethanol which slows down the procedure of NOx formation for E85.
Leaning the mixture induces an increase in NOx emissions probably due to more oxygen available for N2 oxidation. At lean and stoichiometric conditions, the dual fuel injection mode produces higher NO levels than the mix case. This is in agreement with the higher peak reached by the pressure when dual fuel injection is used.
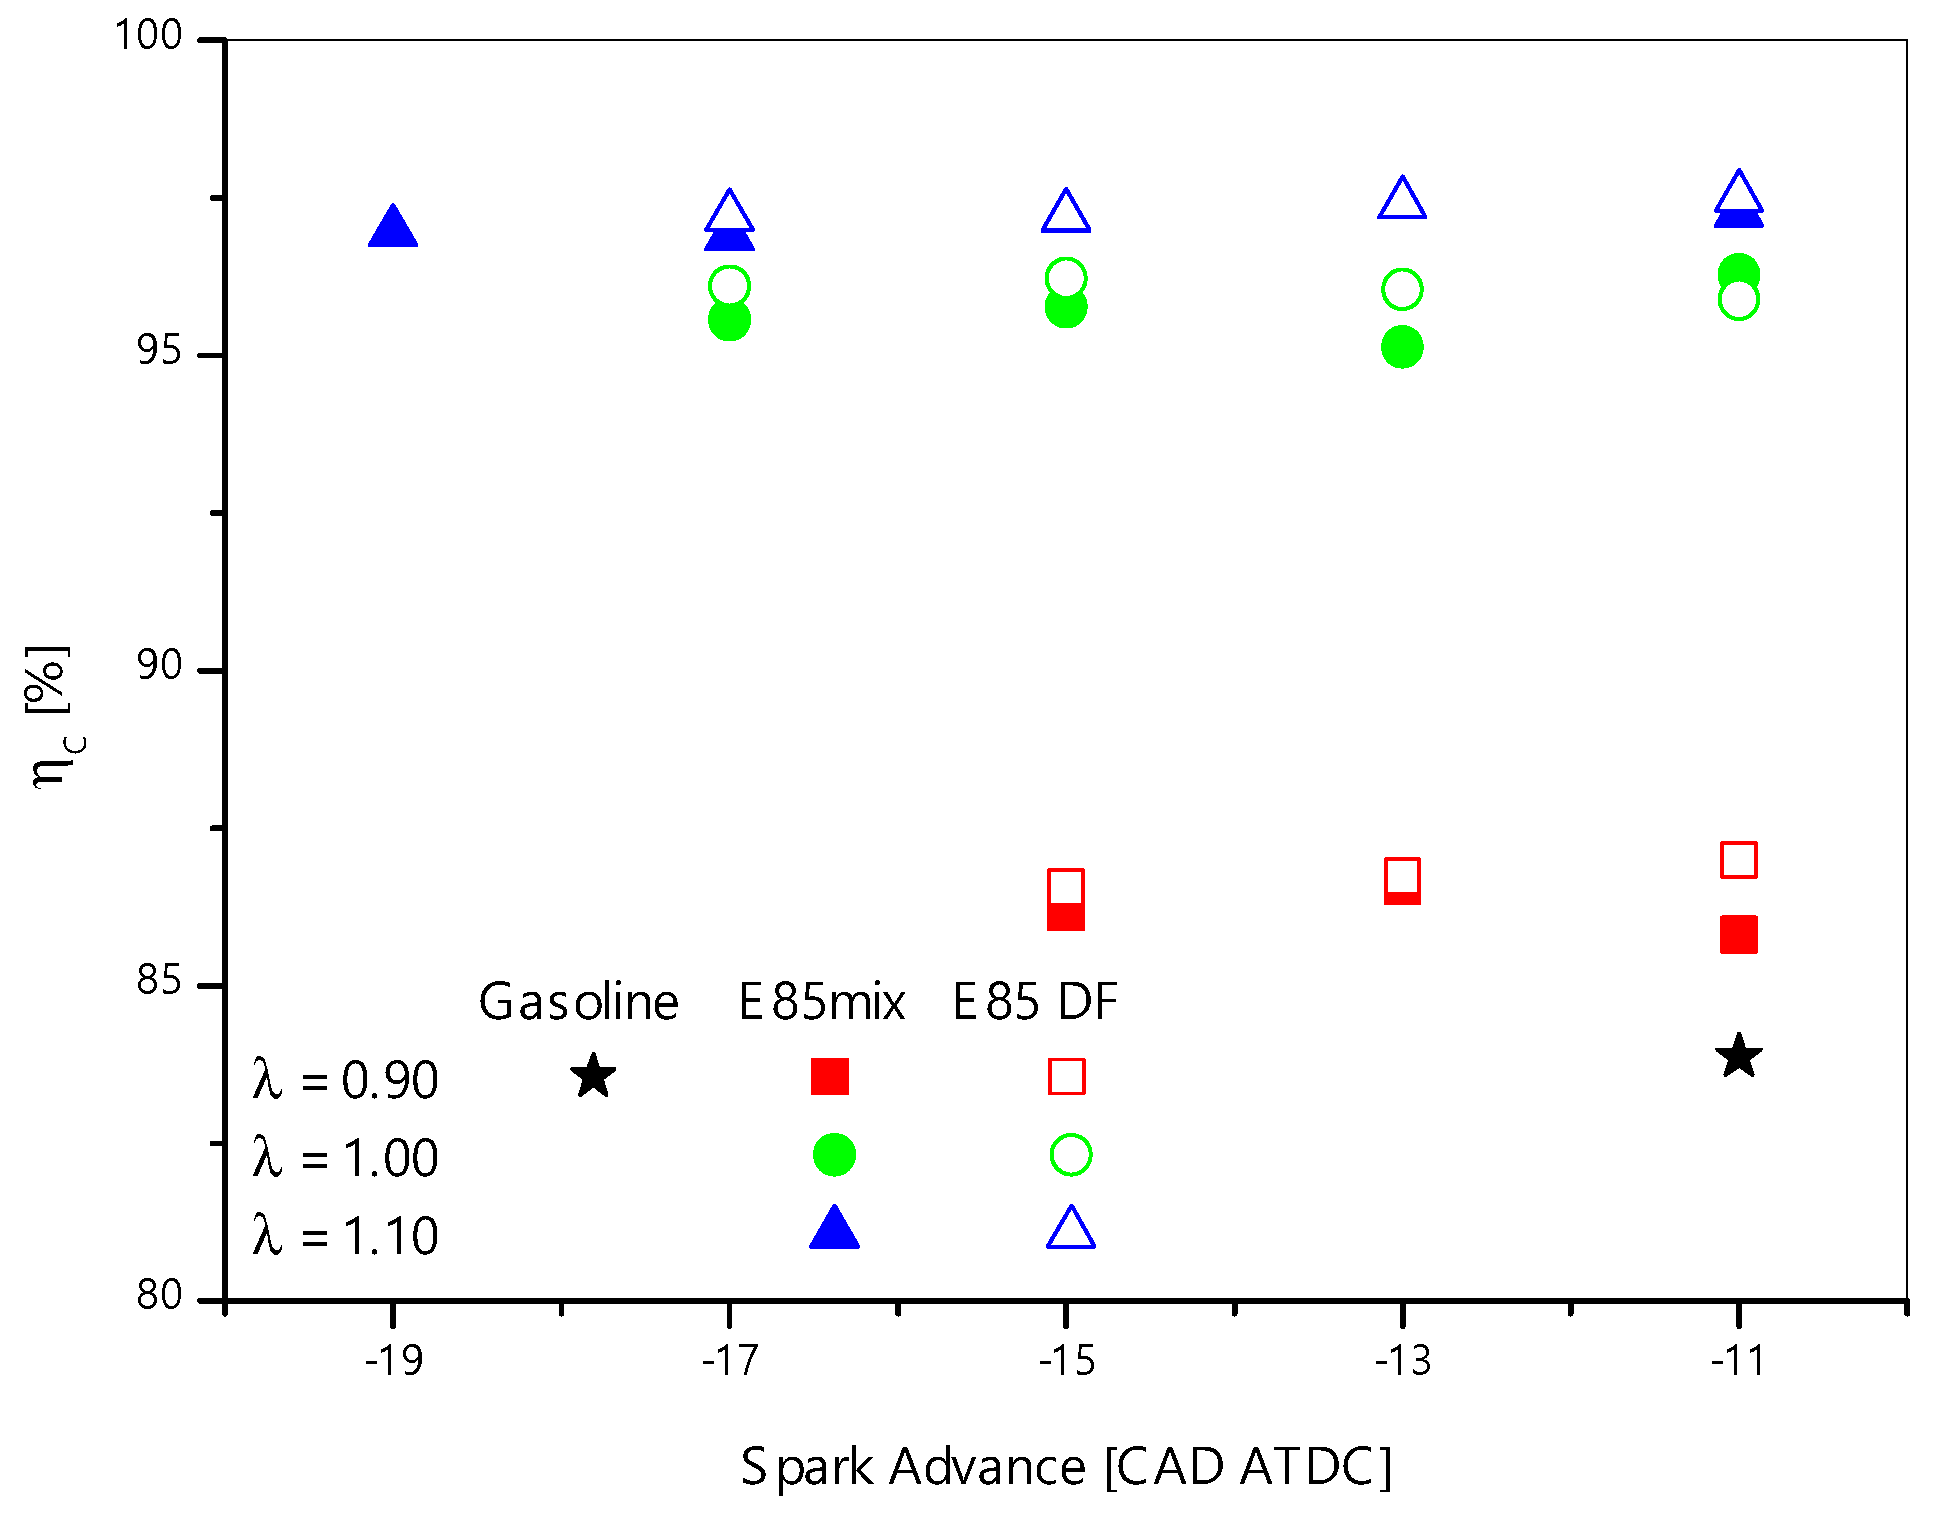
According to the equation by Su et al. [
20], the combustion efficiency (ηc) can be estimated as function of the measured values of emission concentration (HC, CO, CO
2). The results are reported in
Figure 10 against the spark advance for the different test cases. The combustion efficiency is almost independent on the spark advance. As a general trend, the main parameter influencing the combustion efficiency is λ, with a significant increase for the lean case, for both injection modes. The E85 efficiency is always higher than gasoline reference case for both injection modes. Dual fuel mode shows combustion efficiency values slightly higher than mix mode in agreement with a more complete evaporation of the fuel before entering in the combustion chamber. Nevertheless, DF injection induces a worse phasing with engine strokes reducing the thermal efficiency.
3.3. Effects of Ethanol–Gasoline Injection Mode on PN and PM1 Emissions
This section illustrates the influence of fuel injection mode on engine-out PN emissions.
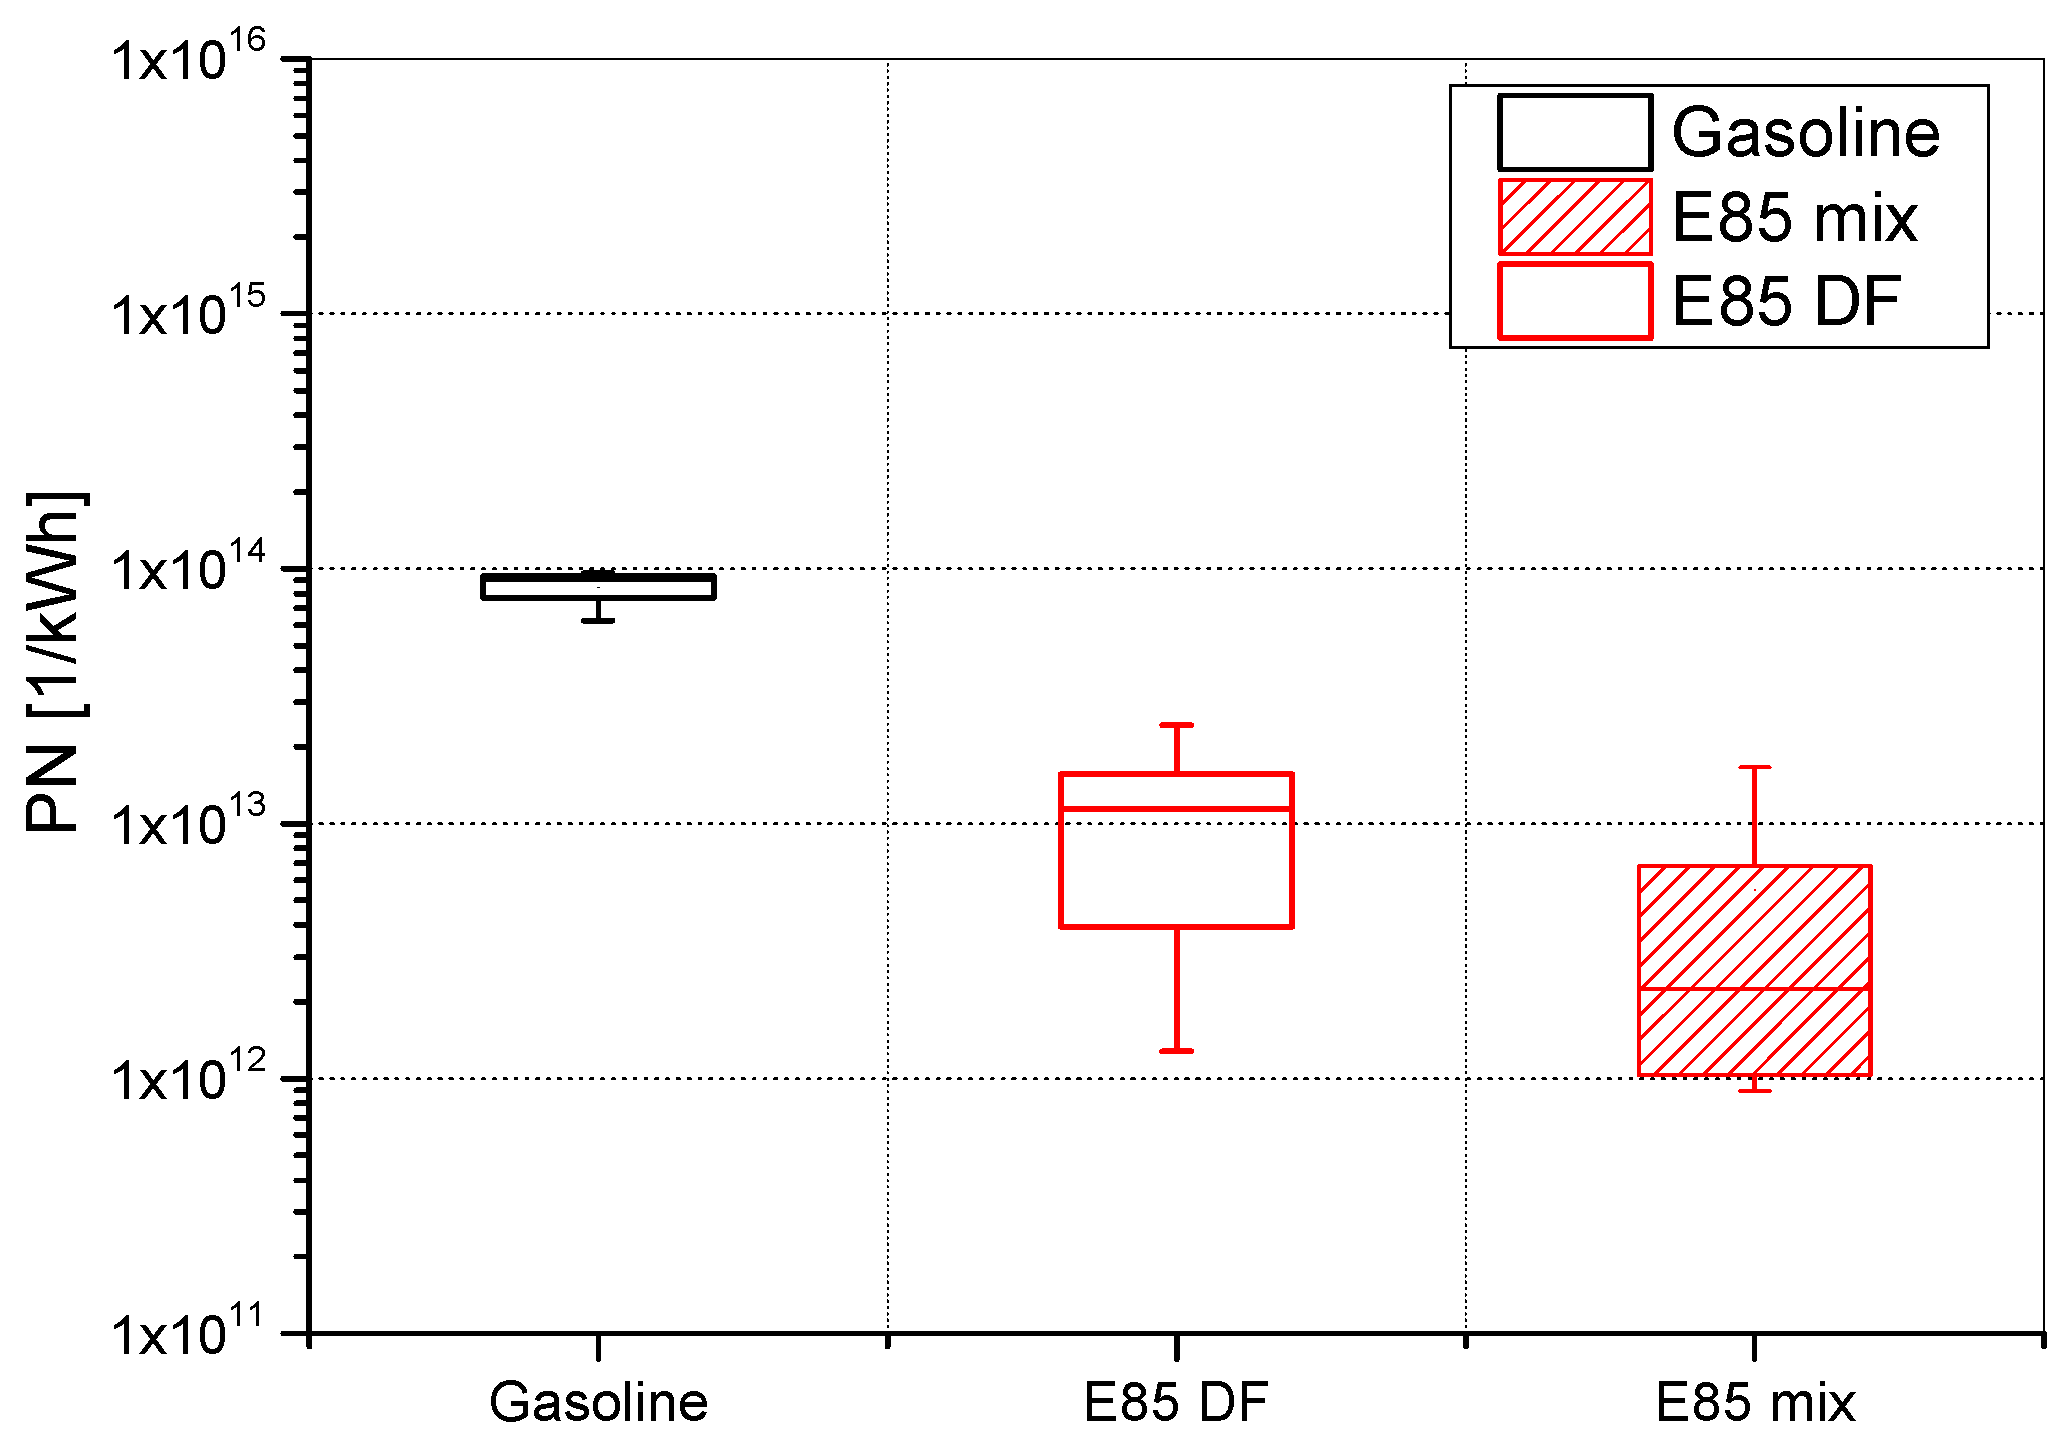
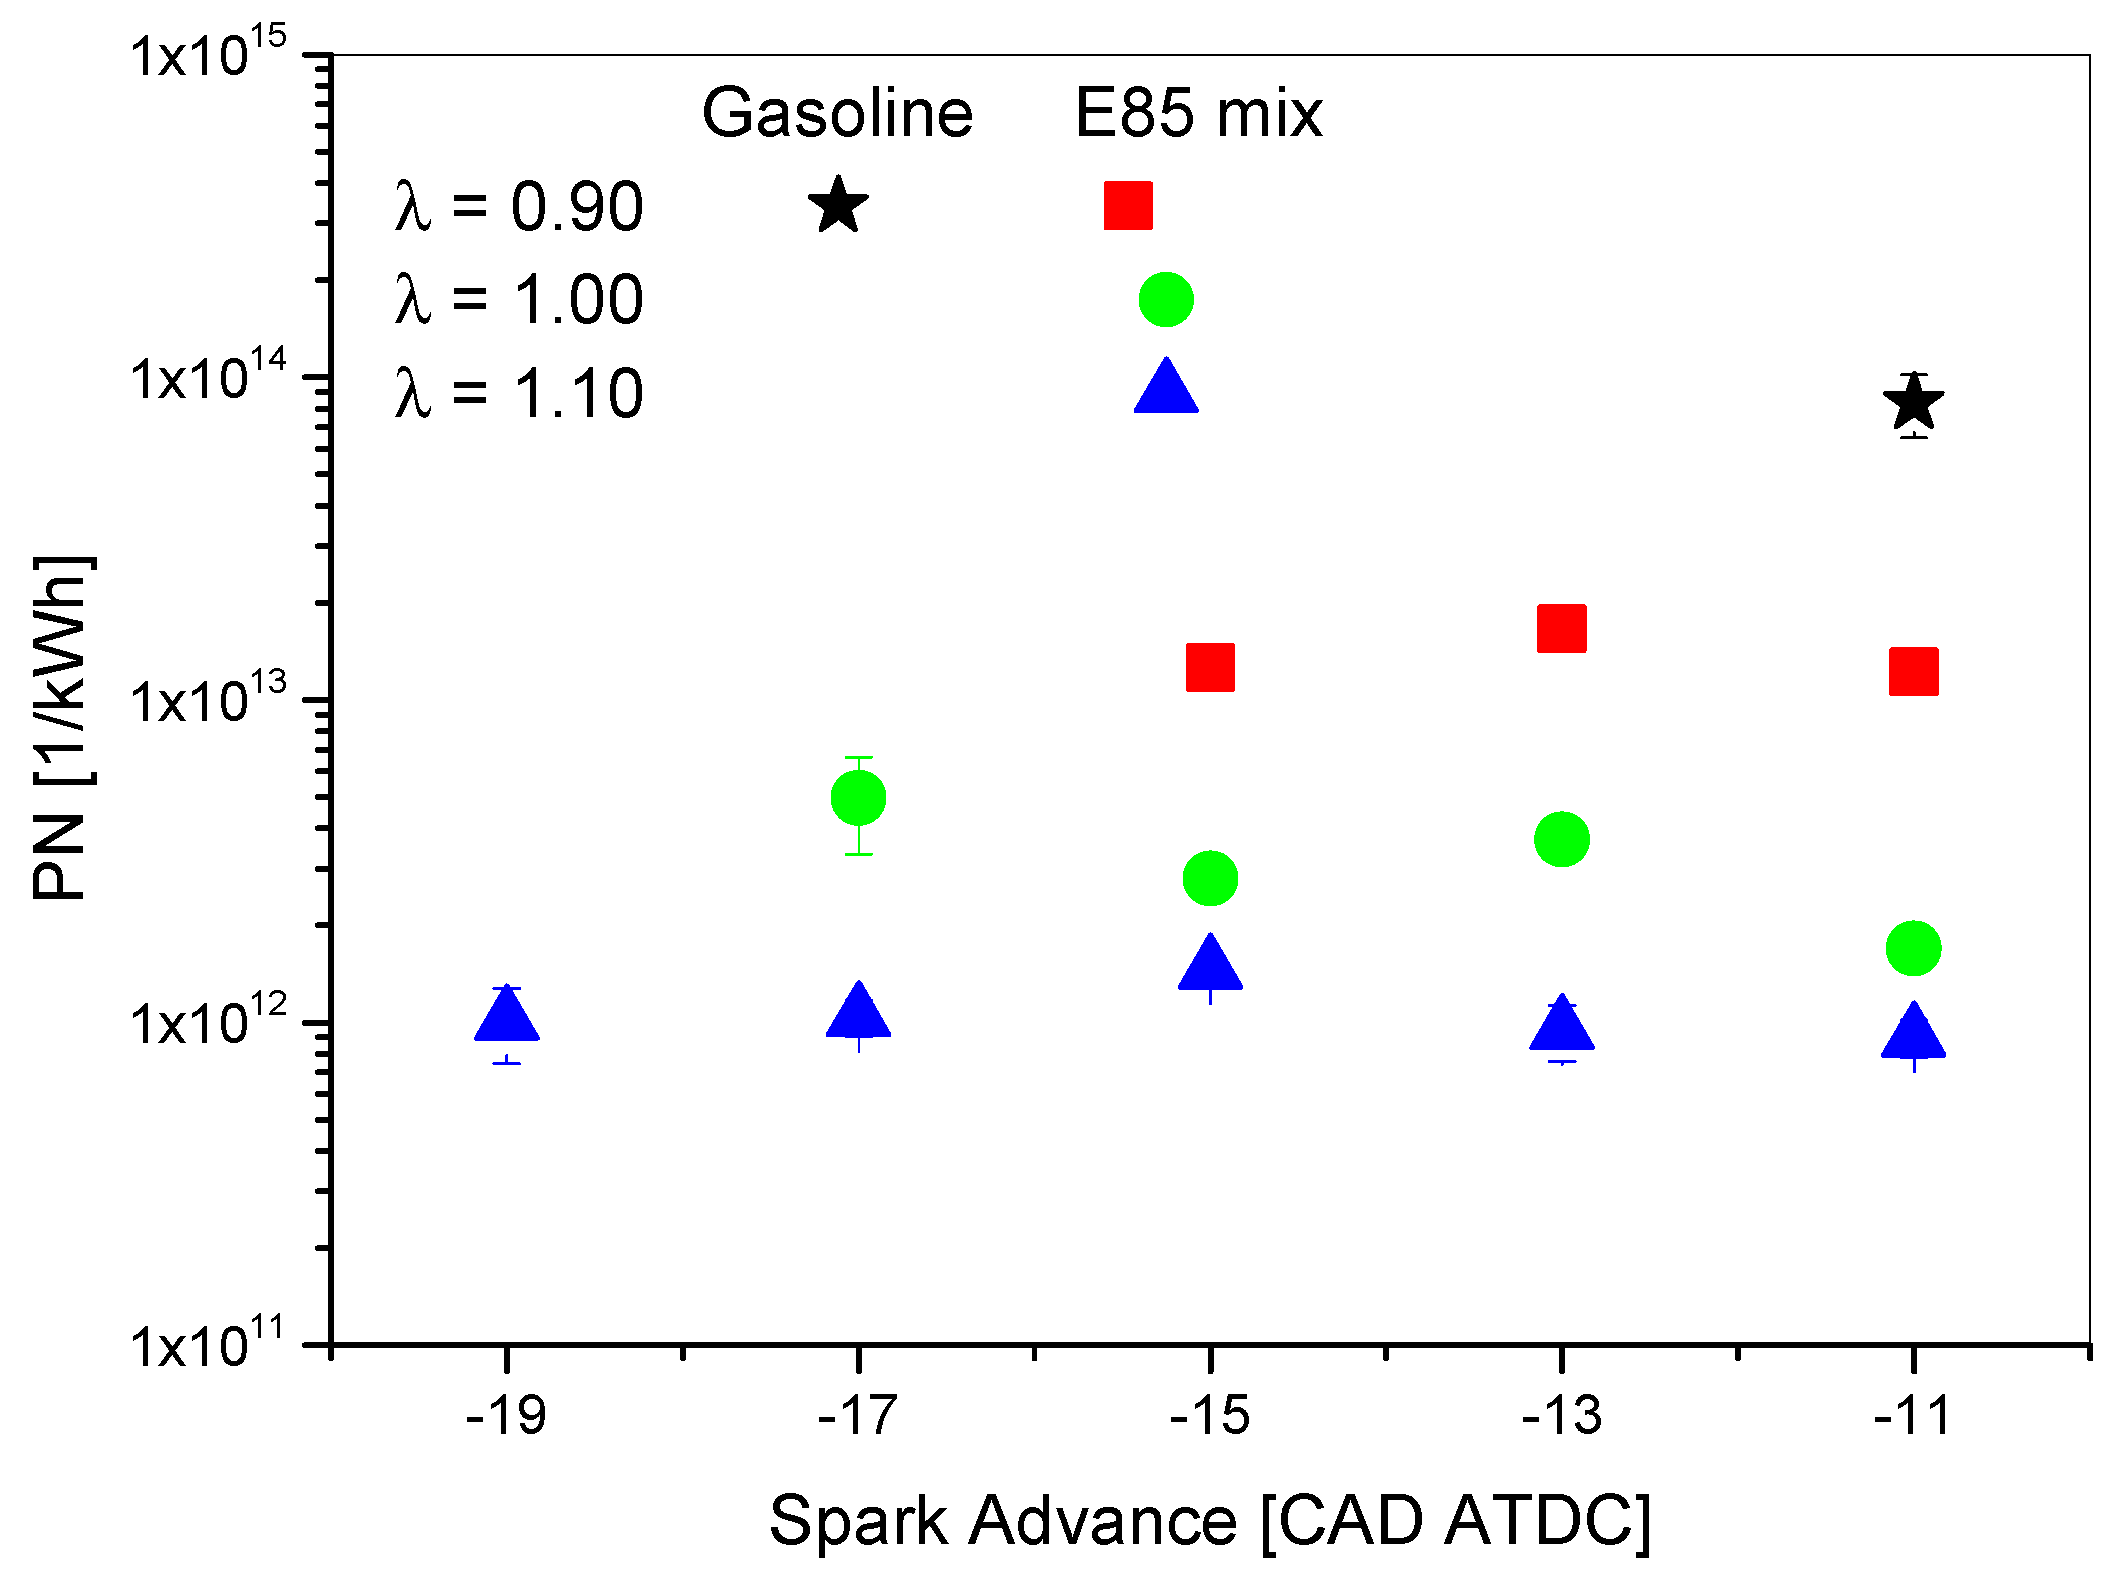
Figure 11 summarizes PN emissions (particles/kWh), measured for gasoline (reference λ = 0.9, SA = −11 CAD ATDC), E85 dual fuel and mix mode injection for each tested λ and SA. The box plot indicates the data distribution of each condition (minimum, first quartile, median, third quartile, and maximum). The addition of ethanol in gasoline causes a strong PN reduction compared to the reference gasoline case that exhibits a mean value of about 8 × 10
13 particles/kWh. Compared to gasoline, E85 DF and E85 mix achieve a PN average reduction of 87% and 94%, respectively, with a statistically significant result (F test: 95% confidence interval). The main reason for PN reduction with alcohol blend fuels is the increased fuel oxygen content within ethanol molecule, which leads to an increased yield in the combustion reaction [
21,
22].
The analysis of the ethanol/gasoline injection modes pointed out that, although most of the data overlap in the two tested configurations, the average PN emissions are slightly lower for the mixed fuel (E85 mix).
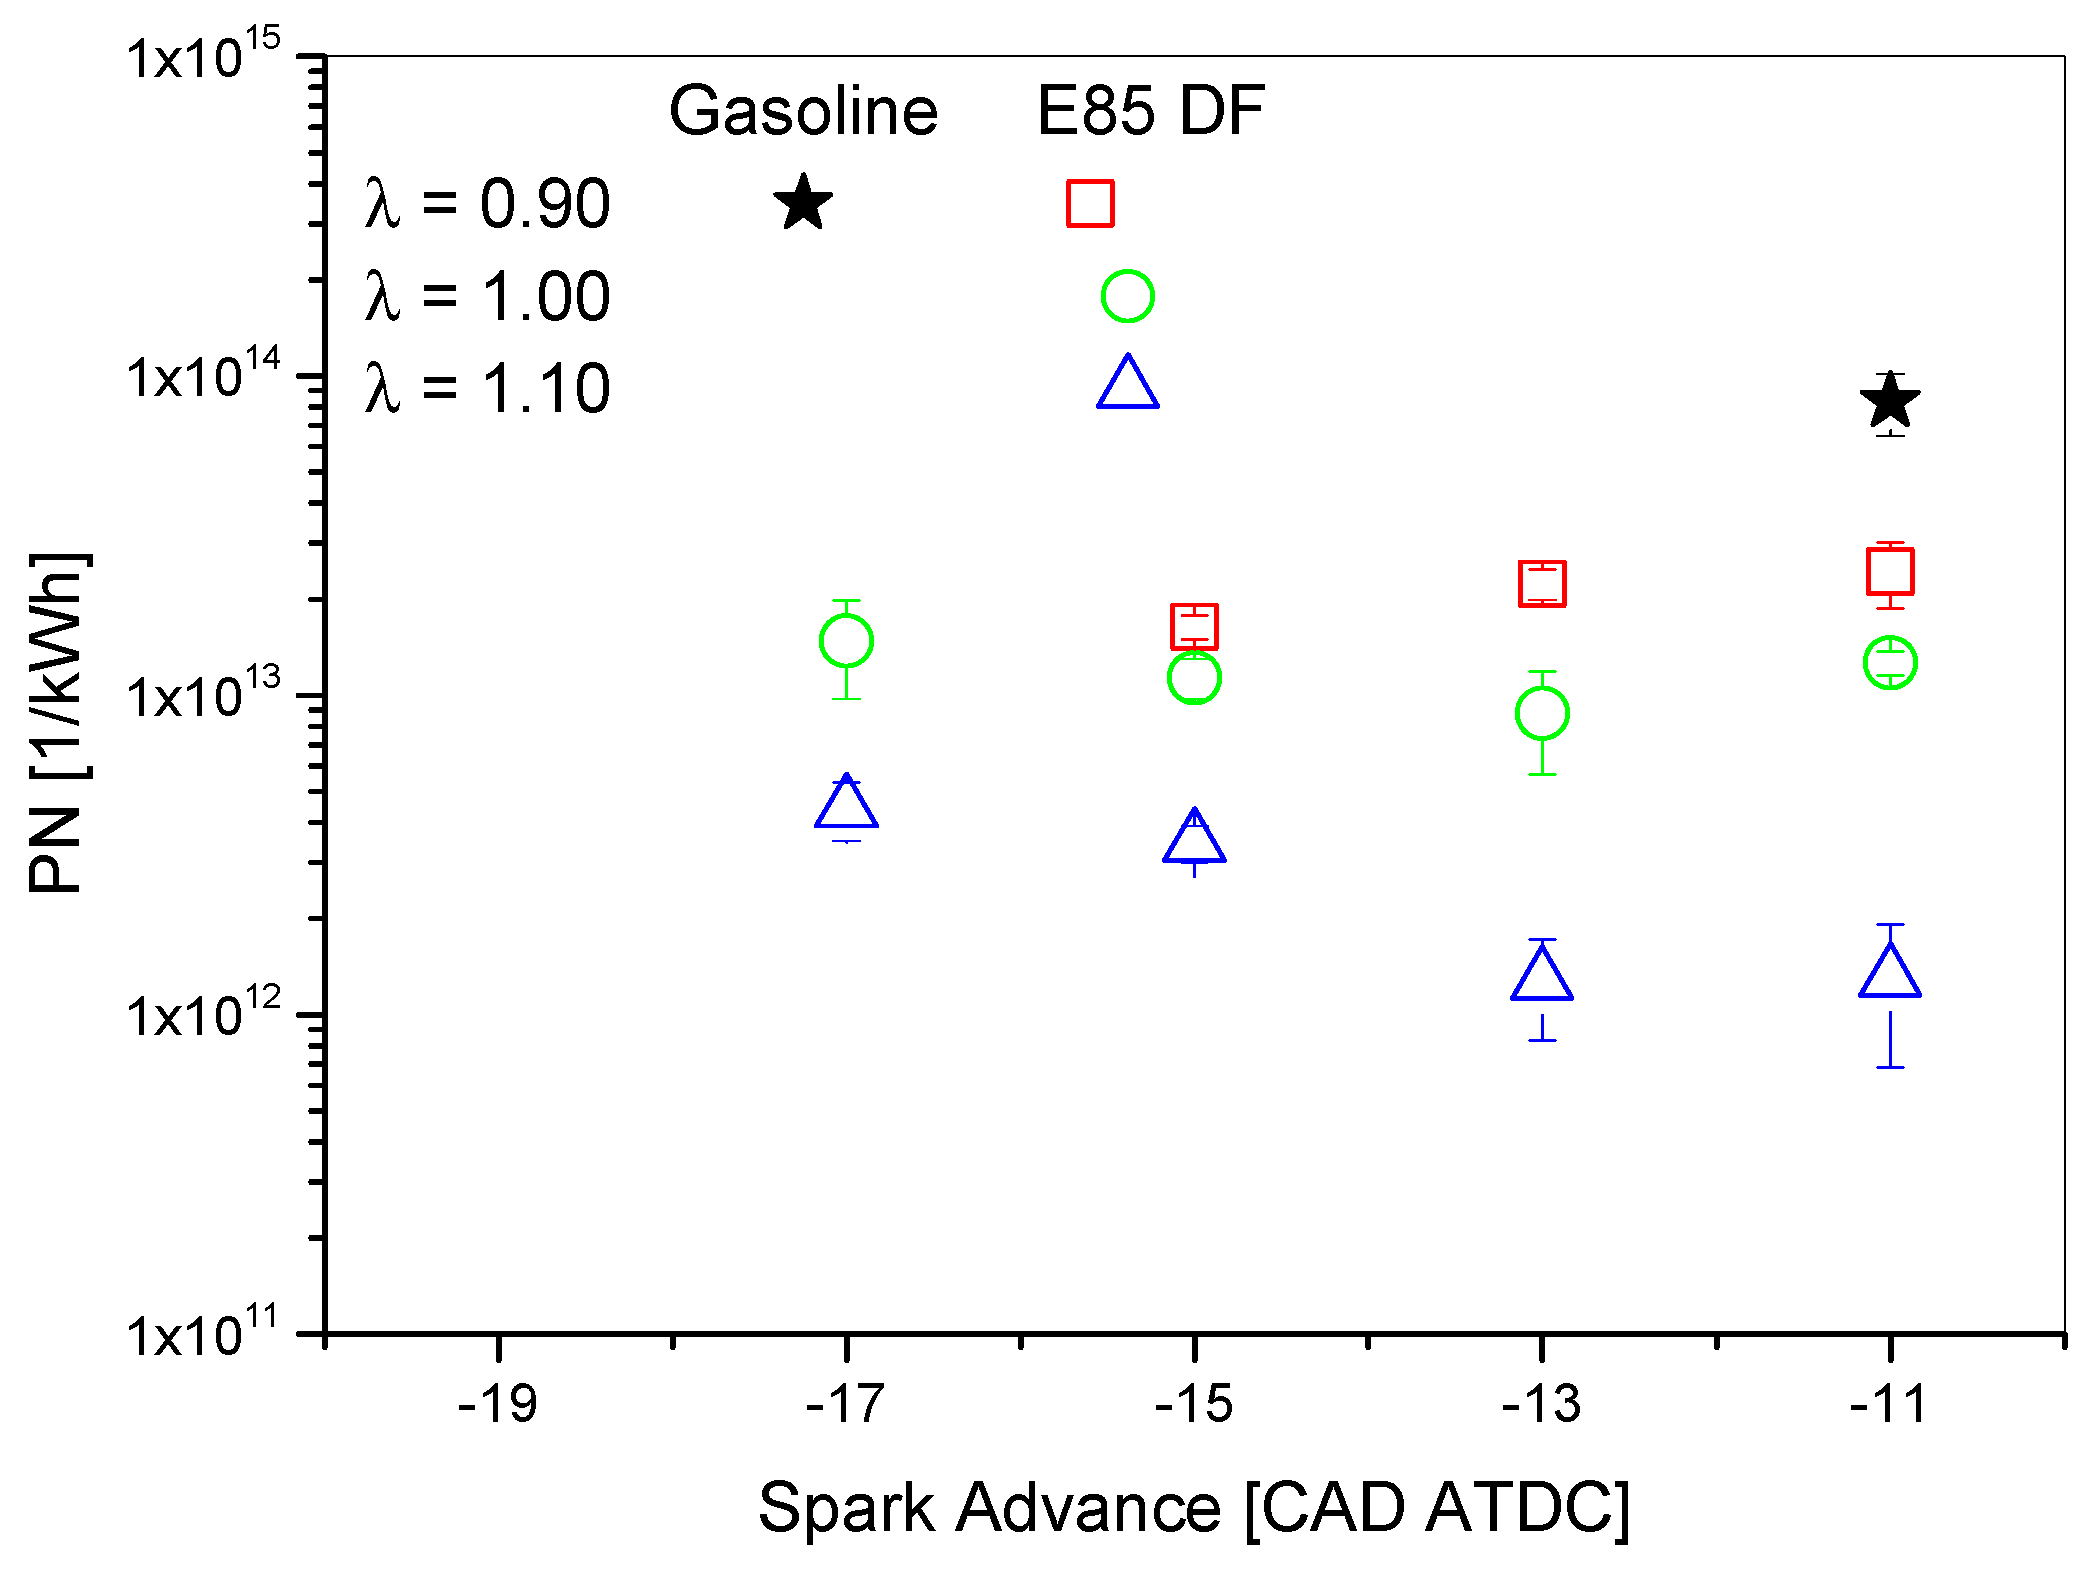
Figure 12 and
Figure 13 report PN emissions for E85 DF and E85 mix respectively, displayed in semi-log graphs, as a function of the spark advance at different air-to-fuel ratios. Each plot also reports the gasoline reference value (PN(E0) ≅ 8 × 10
13 particles/kWh) which gives the highest measured PN emission.
For E85 DF (
Figure 12), at rich condition, PN emissions follow a slight decreasing trend in the range between −11 and −15 CAD, with a minimum of 1.6 × 10
13 particles/kWh at the most advanced spark timing. A different trend against the spark advance is found at the stoichiometric and the lean conditions. In this case, a minimum is evident at SA = −13 CAD. The lowest PN emission values are attained for λ = 1.1: they range from 1 × 10
12 to 3 × 10
12 particles/kWh, for spark advance between −11 and −17 CAD ATDC.
These results confirm that E85 mix injection mode further reduces PN compared to E85 DF, with a maximum reduction at advanced spark timing at both stoichiometric and lean conditions (i.e., −15 and −17 CAD), where PN emissions, unlike E85 DF, are almost independent on the spark advance.
Figure 14,
Figure 15 and
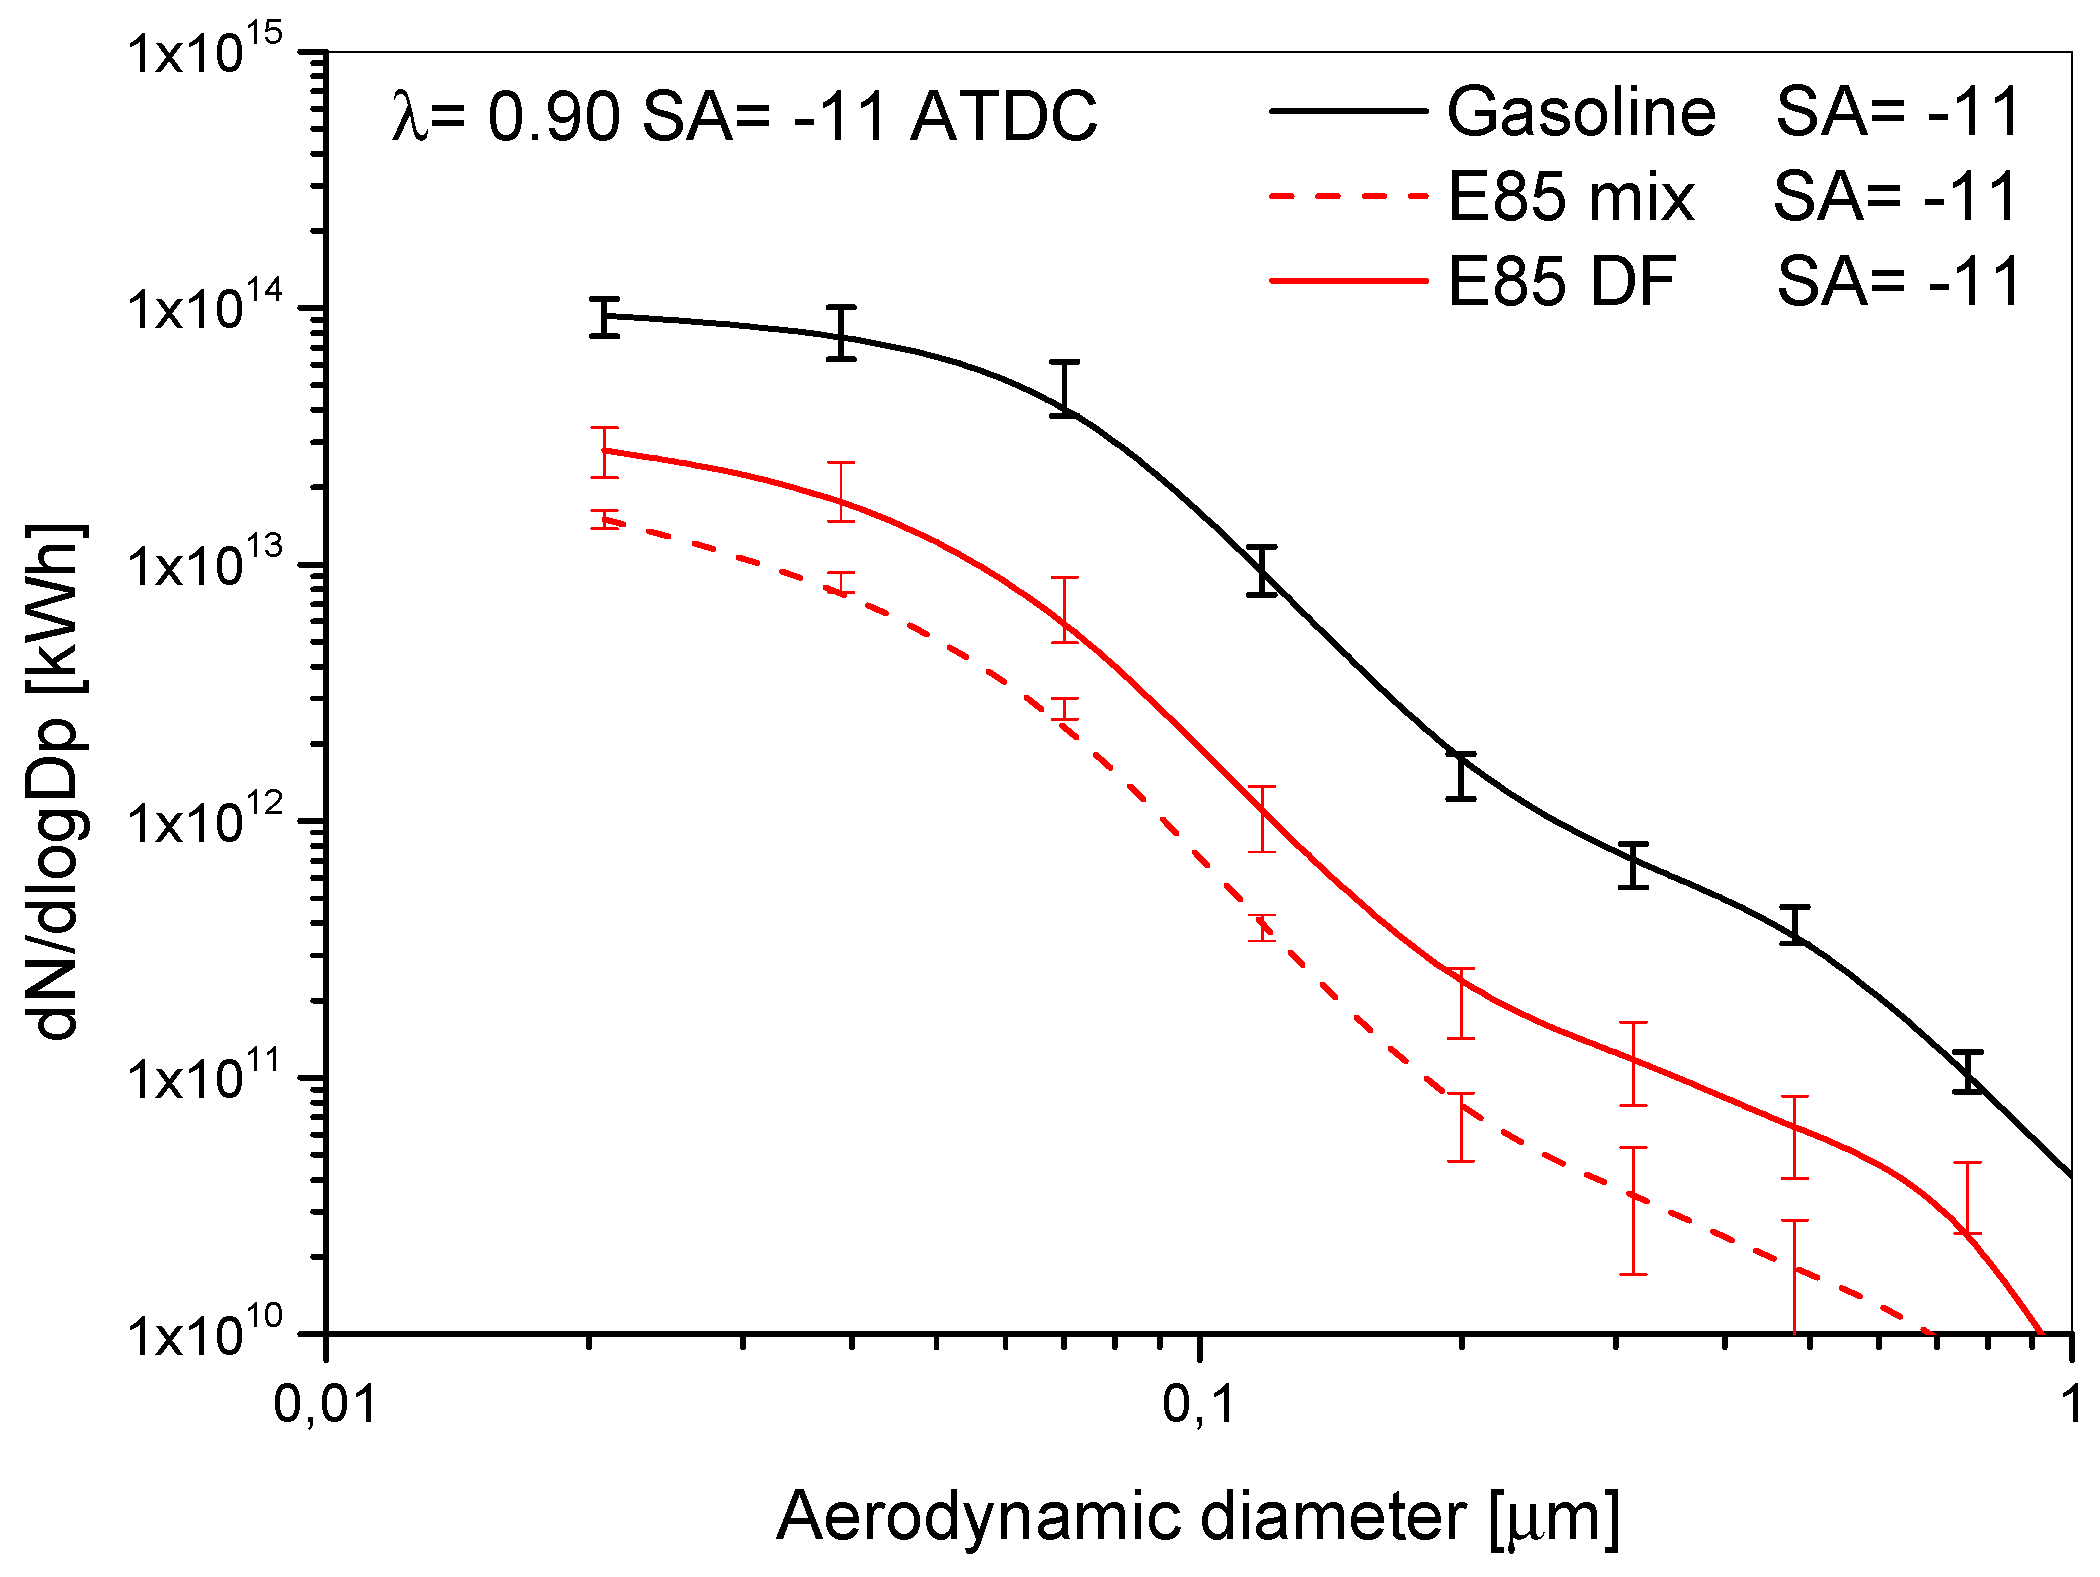
Figure 16 show the particle size distribution at λ = 0.9, λ = 1, and λ = 1.1, respectively. Each log diagram summarizes particle size distribution of fuels at different spark advances except the case at λ = 0.9 where only the trend at SA = −11 CAD ATDC is shown.
At rich condition (
Figure 14), gasoline provides the highest PN emissions, while E85 DF and E85 mix a significantly lower value over the entire dimensional range. The highest accumulation peak (particles with diameter higher than 100 nm) is reached by E85 DF, suggesting the presence of local rich regions which promote solid particle formation [
23]. For all the fuels, more than 95% of particles have the diameter lower than 70 nm, and more than 75% are smaller than 40 nm. The variation of spark advance carried out with E85 DF and E85 mix does not introduce any variation in particle size distribution compared with those reported in
Figure 14.
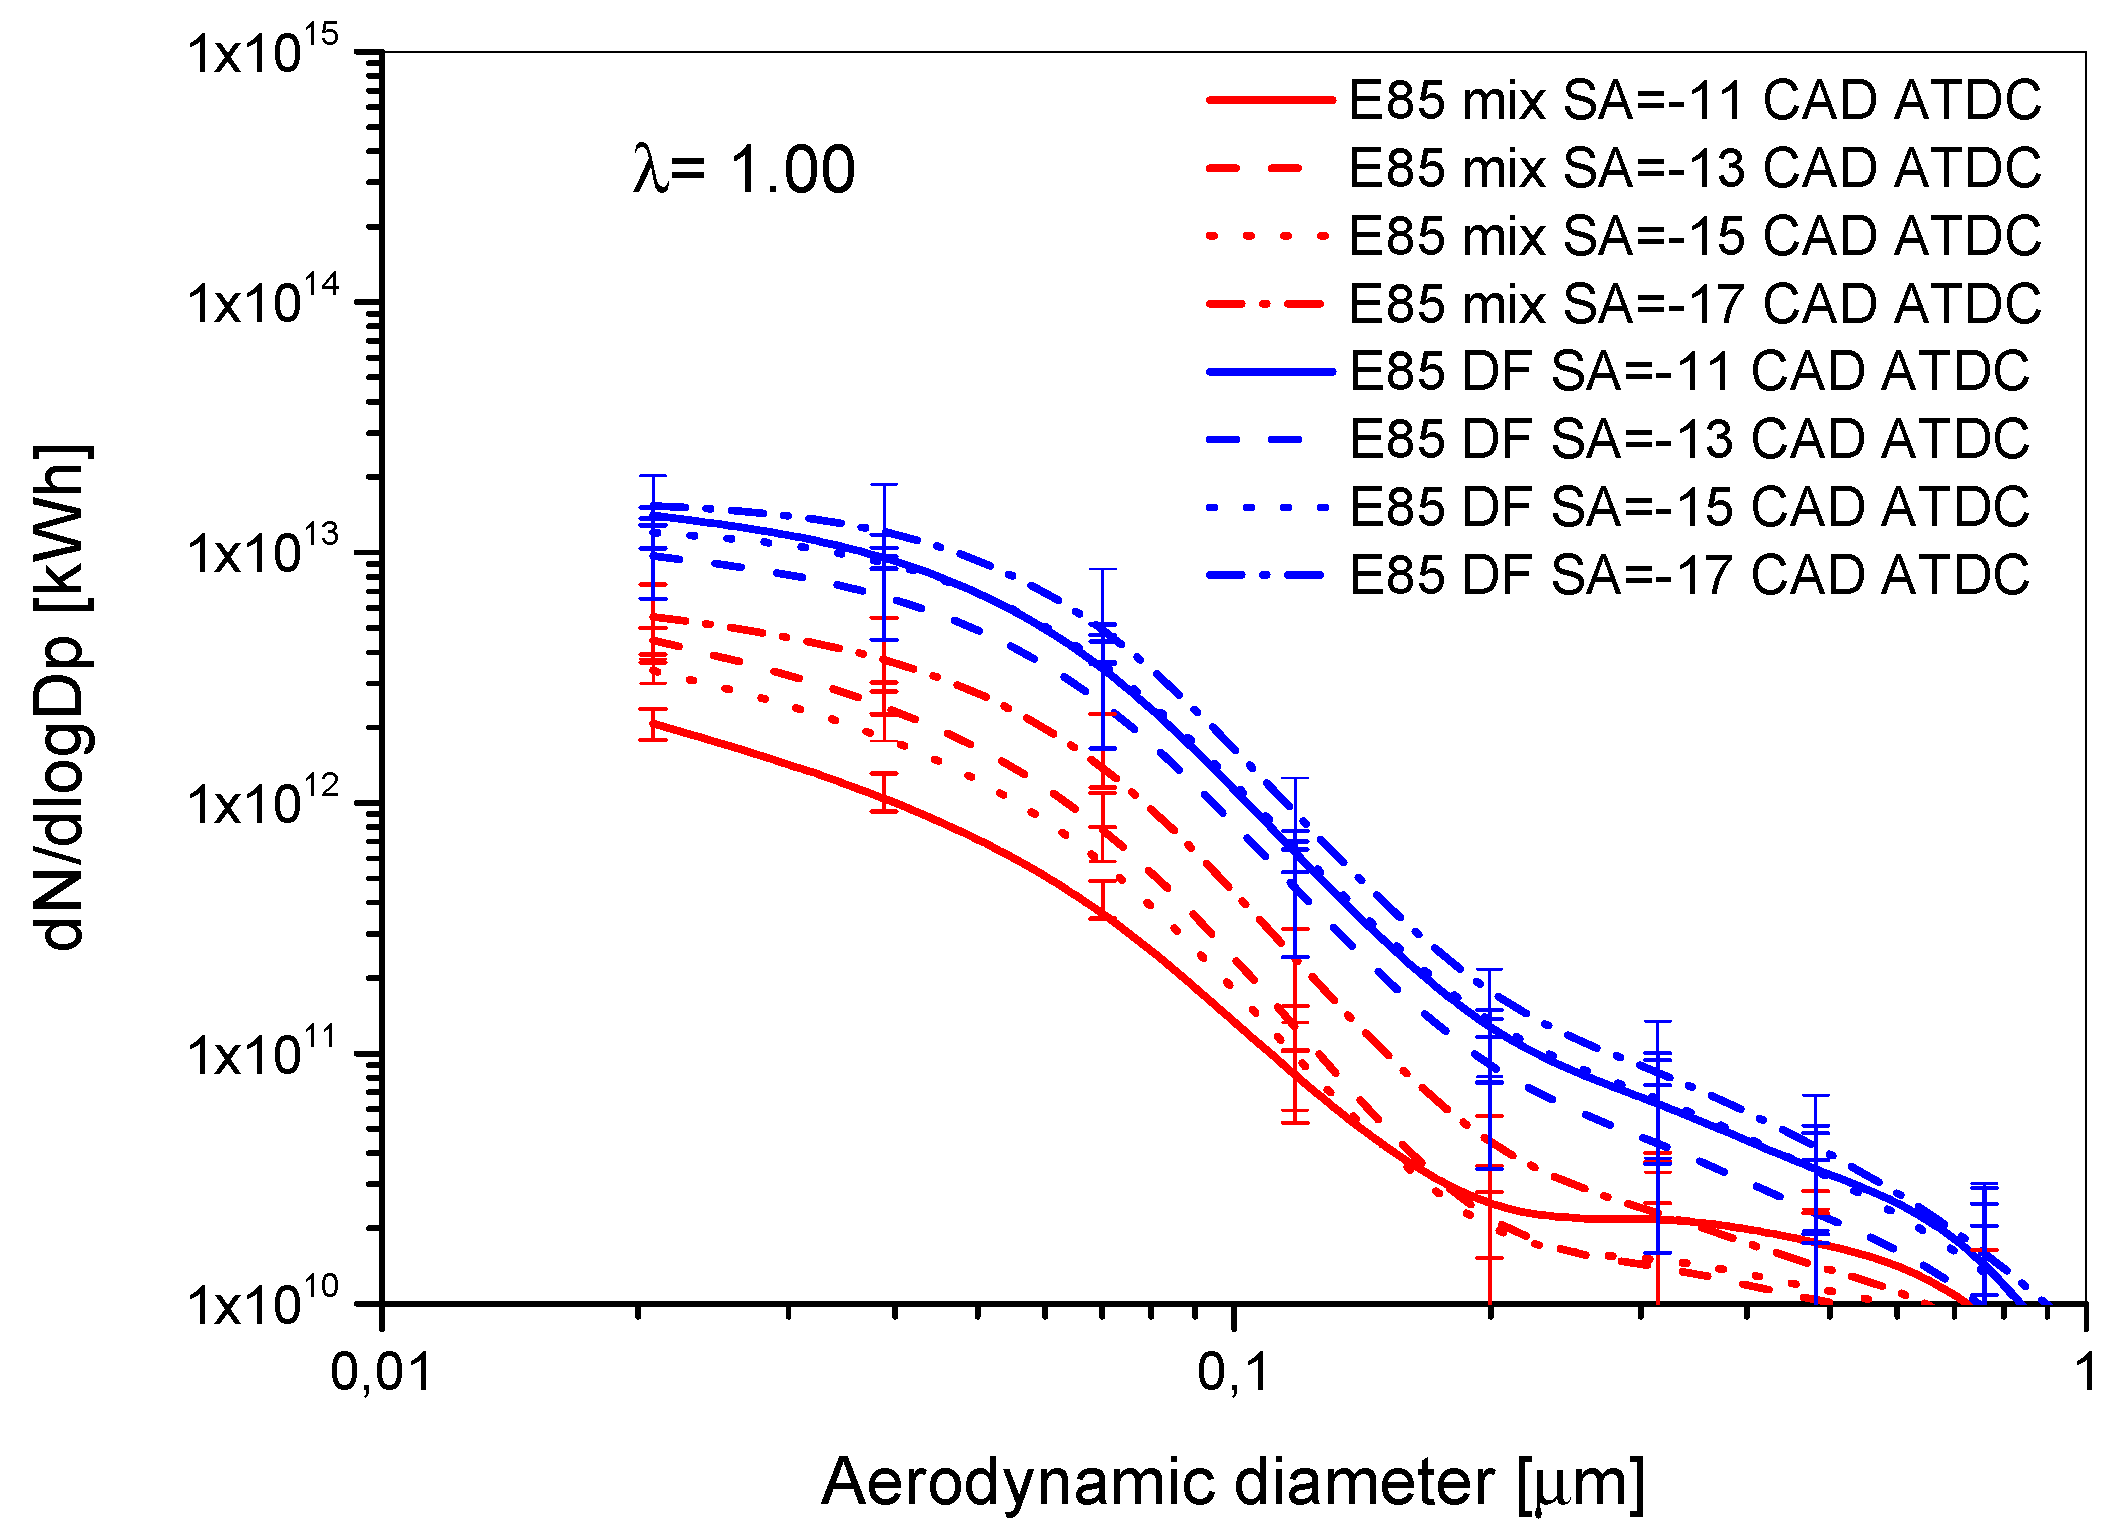
The higher PN emissions in the range between 7 nm up to 1 μm of E85 DF compared with E85 mix is confirmed at stoichiometric conditions (
Figure 15). Although the two injection modes provide similar particle distributions, ultrafine particles (diameter lower than 35 nm) cover a greater percentage with E85 mix than E85 DF (almost 55% vs. 45%) for all tested spark advances with the exception of SA = −17 CAD ATDC. In this case, contribution of ultrafine particles is close to that measured with E85 DF (almost 45% of total PN).
DF mode particle size distribution is just slightly influenced by the spark timing. An increase in particle emissions by increasing the spark advance is instead evident with E85 mix, especially in the diameter range between 28 and 150 nm. This behavior is strictly related to the THC increasing with SA, discussed above. Hydrocarbons contribute to particle emissions throughout nucleation process at the engine out.
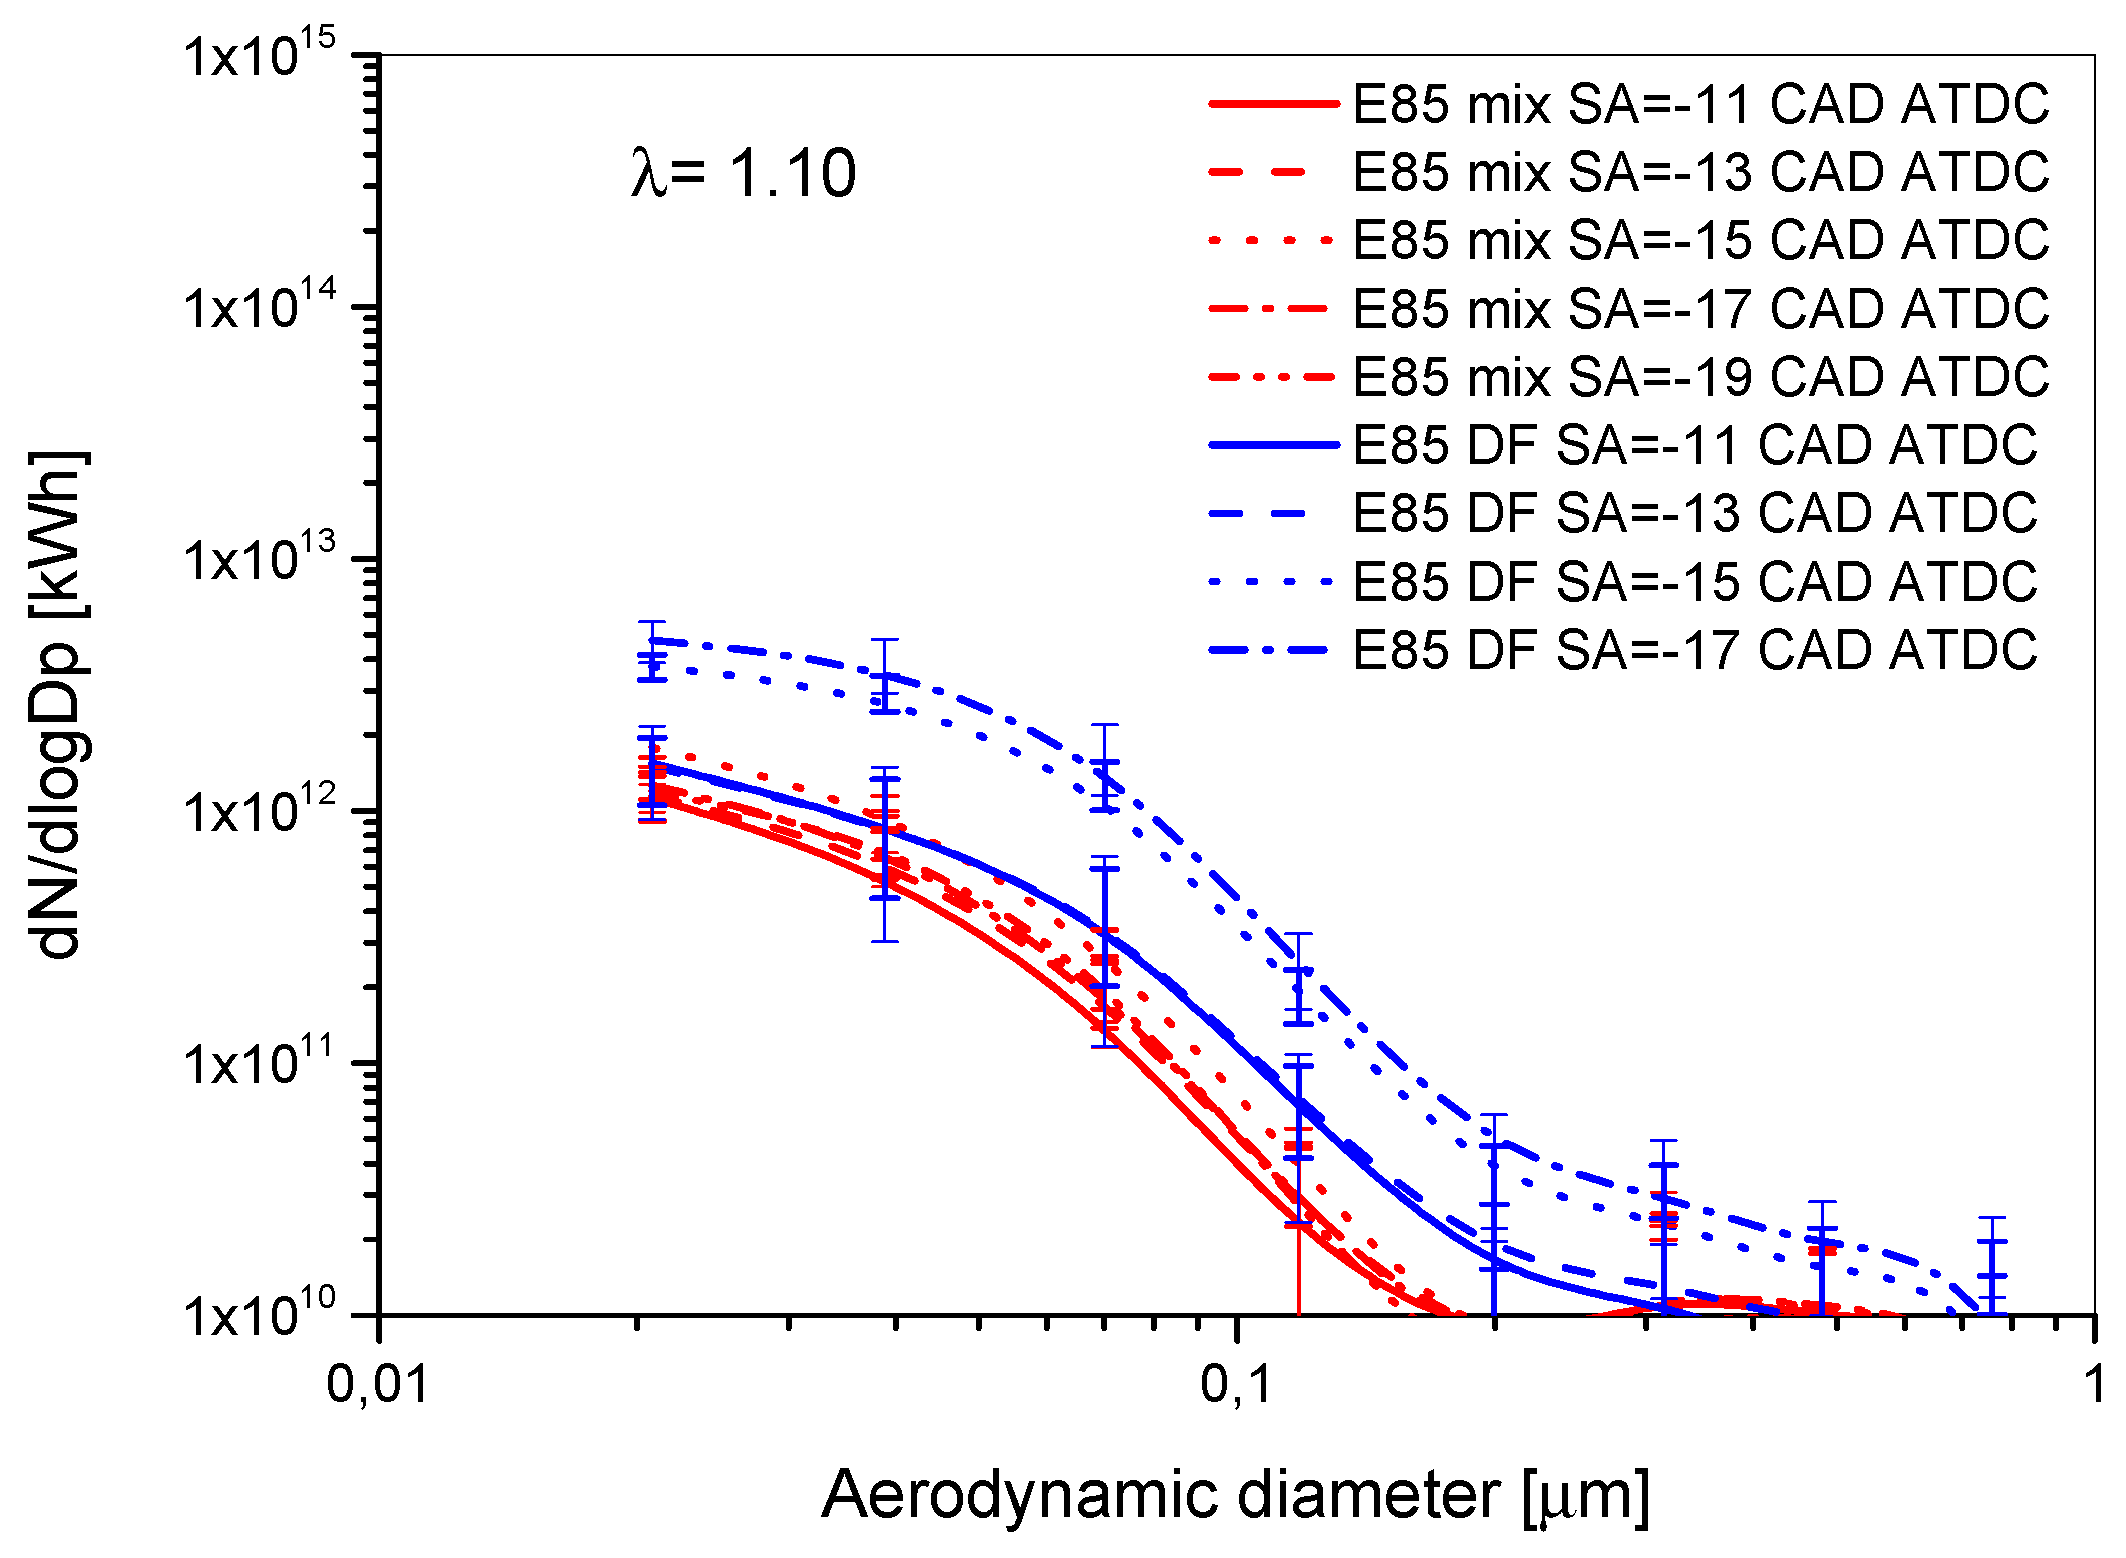
The same influence of SA on particle size distribution is found in lean conditions (
Figure 16). The increase in fine particles by advancing the spark timing is evident for both fuel injection modes. A reduction in PN larger than 200 nm is found compared to stoichiometric conditions. Their value is lower than 10
10 pt/kWh which is close to detection limit of measuring system.
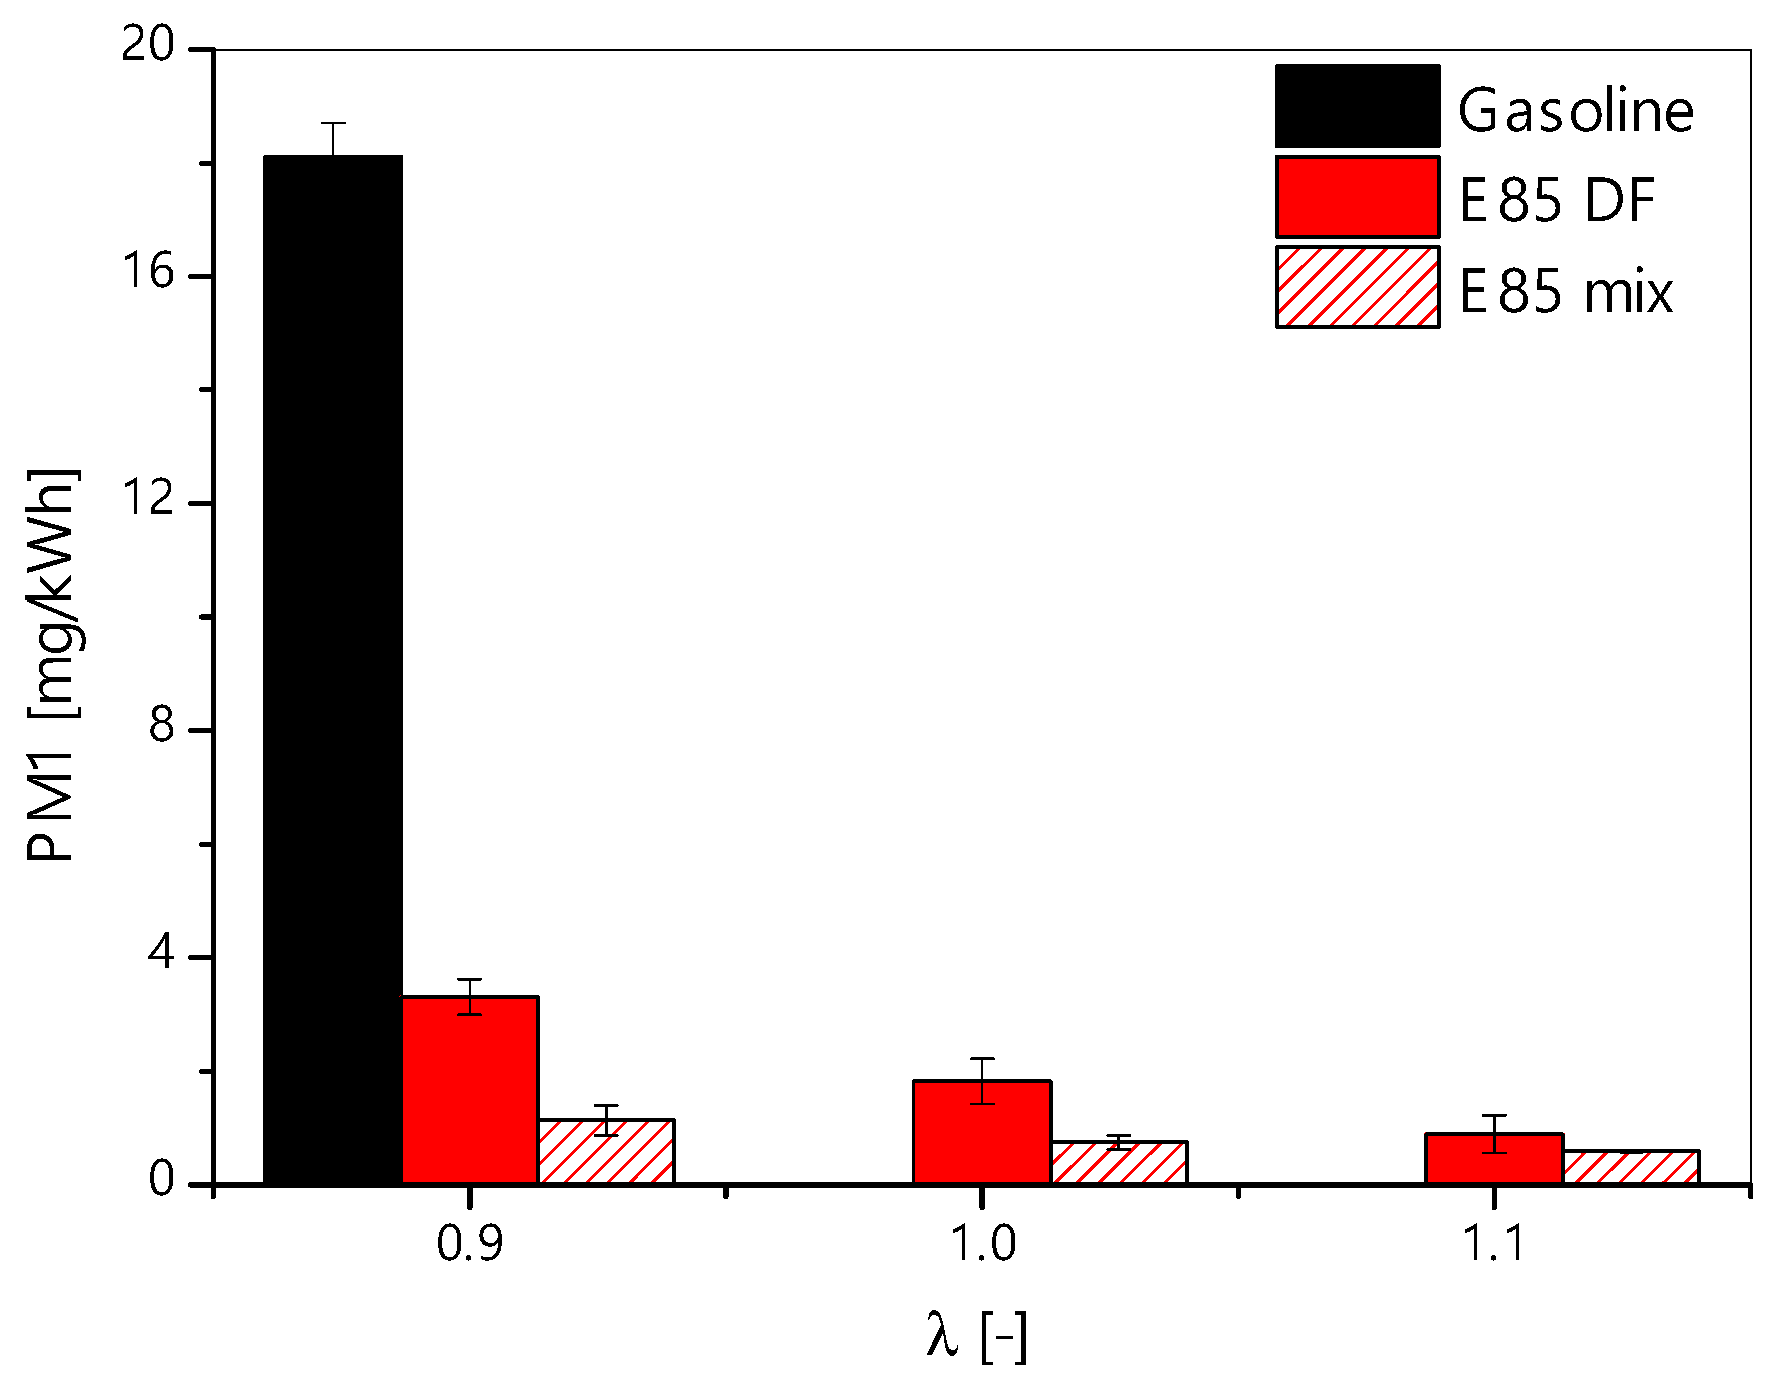
Figure 17 reports PM
1 emissions (particles less than 1.0 μm in aerodynamic diameter) estimated as integral of PN size distribution for gasoline, E85 DF, and E85 mix at the different λ. Adding ethanol strongly lowers the particulate mass. With rich conditions, PM1 goes from 18 mg/kWh with gasoline to less than 4 mg/kWh with E85.
Such as for PN, E85 DF provides higher PM emissions than E85 mix, with a difference of about 60% with rich and stoichiometric conditions and 30% with lean conditions. An evident reduction is obtained when leaning the mixture for both injection modes.
Generally, the E85 DF (15%v gasoline and 85%v ethanol) results in a great reduction of PN and PM1 engine-out emissions compared to gasoline, but further reduction is obtained with the mixed fuel gasoline/ethanol.
4. Conclusions
In this study, the effect of E85 injection mode on performance and gaseous and particle emissions was investigated on a turbocharged port fuel SI engine at 3000 rpm, high engine load, and different air-fuel ratios.
Two injection modes of E85 were compared: dual fuel—ethanol and gasoline separately injected within the intake manifold; and mixed—ethanol and gasoline mixed to form E85 and then injected.
The main advantage in using dual fuel injection is the flexibility of the system that can feed the engine with different percentages of ethanol in an easy way. Conversely, the injection system is more complex because it requires two separate circuits and tanks.
In the experiments, the relative air–fuel ratio (λ) was swept from rich (0.9) to stoichiometric (1) and lean condition (1.1). The initial spark timing was set according to the standard ECU map corresponding to the KLSA under full gasoline operation. Then, E85 was used and the spark timing was swept out up to the new knock limit.
E85 allowed advancing the spark timing and removing charge over-fueling: the increase in spark advance resulted in a slight increase of thermal efficiency without engine load penalties; leaning mixture provided a further increase in thermal efficiency with a maximum for E85-mix of about 0.39 compared to 0.31 reached by the gasoline reference case.
The combined effect of ethanol oxygen content and charge leaning resulted in a more complete oxidation process of burned gases with a lowering of CO and HC emissions. On the contrary, NO emissions increased due to the higher air-to-fuel ratio and the raise in the peak pressure and temperature, due to advanced spark timings.
The injection mode had significant effects on the combustion process: dual fuel injection promoted a faster evaporation of the gasoline than mix mode, shortening the combustion duration and reducing the thermal efficiency. The higher in-cylinder pressure and temperature peak provided a slight increase in NO and THC, compared to mix mode.
Regarding particulate emissions, the oxygen content of ethanol promoted the particle matter oxidation as demonstrated by the strong reduction in both particle size distribution number and particulate mass (PM1), obtained by E85 in the rich case. Furthermore, the E85 showed a reduced tendency to larger particle agglomeration at each air–fuel ratio, because the oxygen helps the post oxidation processes. Dual fuel injection mode produced a larger amount of particles at each investigated condition compared to E85 mix. This behavior was due to the increase in gasoline evaporation with a corresponding increase of the maximum pressure and combustion velocity, which partially reduces the soot post-oxidation during the expansion stroke.
This paper gives insights on the phenomena that take place in the combustion process when fuel is injected in DF mode. The analysis reported can be useful in optimizing this injection mode allowing to take advantage of its high flexibility.


