Comparison of Local Volt/var Control Strategies for PV Hosting Capacity Enhancement of Low Voltage Feeders


Institute of Energy Systems and Electrical Drives, TU Wien, 1040 Vienna, Austria
Energies 2019, 12(8), 1560; https://0-doi-org.brum.beds.ac.uk/10.3390/en12081560
Submission received: 18 March 2019
/
Revised: 15 April 2019
/
Accepted: 19 April 2019
/
Published: 24 April 2019
(This article belongs to the Special Issue Emerging Challenges in Hosting Capacity Enhancement due to High Penetration of Renewable Energy Resources)
Abstract
:The PV hosting capacity of low voltage feeders is restricted by voltage and current limits, and in many cases, voltage limit violations are the limiting factor for photovoltaic integration. To control the voltage, local Volt/var control strategies absorb or inject reactive power, provoking an additional current. This study analyzes the hosting capacity increase potential and the associated additional grid losses of local cosφ(P)- and Q(U)-control of photovoltaic inverters, and of local L(U)-control of inductive devices and its combination with Q-Autarkic prosumers. Therefore, four theoretical and one real low voltage test-feeders with distinct structures are considered: long overhead line, short overhead line, long cable, short cable and branched cable. While the theoretical test-feeders host homogeneously distributed PV-plants, the real one hosts heterogeneously distributed PV-plants. Each test-feeder is used to conduct load flow simulations in the presence of no-control and the different control strategies separately, while gradually increasing the PV-penetration. The minimum PV-penetration that provokes voltage or current limit violations is compared for the different control strategies and test-feeders. Simulation results of the theoretical test-feeders show that the hosting capacity increase potential of all local Volt/var control strategies is higher for the overhead line feeders than for the cable ones. Local L(U)-control, especially its combination with Q-Autarkic prosumers, increases the hosting capacity of all low voltage test-feeders significantly. The PV-inverter-based local Volt/var control strategies, i.e., Q(U)- and cosφ(P)-control, enable lower hosting capacity increases; in particular, cosφ(P)-control causes high additional currents, allowing the feeder to host only a relatively small PV-module rating per prosumer. Q(U)- and cosφ(P)-control are not sufficient to increase the hosting capacity of the long cable feeder significantly; they provoke high additional grid losses for the overhead line test-feeders. Meanwhile, L(U)-control, especially its combination with Q-Autarkic prosumers, increases the hosting capacity of the long cable feeder significantly, causing high additional grid losses during peak production of PV-plants. Regarding the real test-feeder with heterogeneously distributed PV-plants, on the one hand, the same trend concerning the HC increase prevails for the real branched cable test-feeder as for the theoretical short cable one. On the other hand, higher losses occur for the branched feeder in the case of L(U)-control and its combination with Q-Autarkic prosumers, due to the lower voltage set-points that have to be used for the inductive devices. All in all, the use of local L(U)-control, whether combined with Q-Autarkic prosumers or not, enables the effective and complete utilization of the existing radial low voltage feeders.
1. Introduction
The increasing amount of volatile and distributed generation challenges the traditional distribution grid operation in terms of power quality, protection, and stability [1,2,3]. In rural grids, the voltage rise effect is a key factor that limits the amount of distributed generation that can be connected [1]. The injection of distributed rooftop photovoltaic (PV) plants modifies the feeder section loading and power losses, and its intermittency causes voltage fluctuations [4]. Under these conditions, the PV integration is subject to technical limitations. The basic limitations are voltage and current limits. European distribution system operators have to keep their grid voltages within the EN 50,160 limits of ±10% around nominal voltage. Furthermore, the thermal current limits of electrical equipment such as overhead lines, cables or transformers should not be exceeded for a considerable time to avoid accelerated deterioration.
The hosting capacity (HC) of a distribution grid is defined as the maximum PV generation that can be connected to the grid without causing any adverse effect on the normal system operation [5]. It is determined by comparing performance indices with their limits [6]. To quantify the HC of a grid, clear performance indices, corresponding limits and calculation methods have to be defined [7]. The HC corresponds to the maximum PV generation that can be integrated without causing any performance index limit violation. The determination of the HC is subject to uncertainties like load consumption, PV production, distribution of PV-plants, and distribution transformer (DTR) primary voltage. A stochastic approach [8] is commonly used to address these uncertainties.
Low voltage (LV) feeders can be classified into voltage- and current-constrained feeders [9]. Long overhead line feeders in rural areas tend to be voltage-constrained, while short cable feeders in urban areas tend to be current-constrained. In general, the voltages in LV grids can be controlled by adjusting the DTR tap position, and by manipulating the active and reactive power flows through the line segments and the DTR. Numerous voltage control strategies for low voltage grids are discussed in literature such as upgrading DTRs with on-load tap changers [10]; upgrading PV-inverters with different local Volt/watt [11,12] or Volt/var control strategies [6,13,14,15,16,17,18]; installing inductive devices with local Volt/var control at the end of the violated feeders [19,20,21]; storage operation [14] and demand side management [14]. By controlling the voltage, the hosting capacity of the LV feeders can be increased. However, local Volt/var control strategies lead to a distributed or concentrated absorption or injection of reactive power, thus provoking additional currents and losses in the grid.
Local cosφ(P)- and Q(U)-control of PV-inverters [13,14,17,22,23] are often used for voltage control in LV grids. As an alternative, references [19,20,21] propose to install inductive devices equipped with local L(U)-control close to the end of the violated LV feeders. References [20,21] go further and propose a Volt/var control strategy ensemble, where the L(U)-control is combined with a Q-Autarky of prosumers. The latter uses the PV-inverter of each prosumer for a local power factor correction of the corresponding customer plant. These control strategies provoke different currents and voltages along the LV feeders, thus affecting the HC differently. An analysis that compares the HC increase potential of these control strategies for different LV feeder types is needed. For this comparison, it is sufficient and convenient to define a reference scenario for the abovementioned uncertainties instead of following the stochastic approach presented in [8].
This article analyzes and compares the HC increase potential of different local Volt/var control strategies and the associated grid losses in distinct LV feeder types. Firstly, the simulated model, including LV test-feeders, prosumers, and control strategies, is described. Secondly, the methodology, i.e., scenario definition, control parameterization and result evaluation, is explained. The simulation results are then presented. Finally, conclusions are drawn.
2. Model Description
This study aims to identify the PV HC increase potential of different local Volt/var control strategies in LV feeders. Therefore, various LV test-feeders with connected prosumers are simulated for different control strategies. For simplicity, in this study single-phase grid and prosumer models are used, although European LV grids are unbalanced in nature [24]. This is justified by the fact, that many grid codes require PV-plants above a certain inverter rating (3.68 kVA in Austria [25]) to be three-phase grid-connected. For very high PV-penetrations, which are investigated in this paper, the load-related unbalance becomes less crucial.
2.1. Low Voltage Test-Feeders
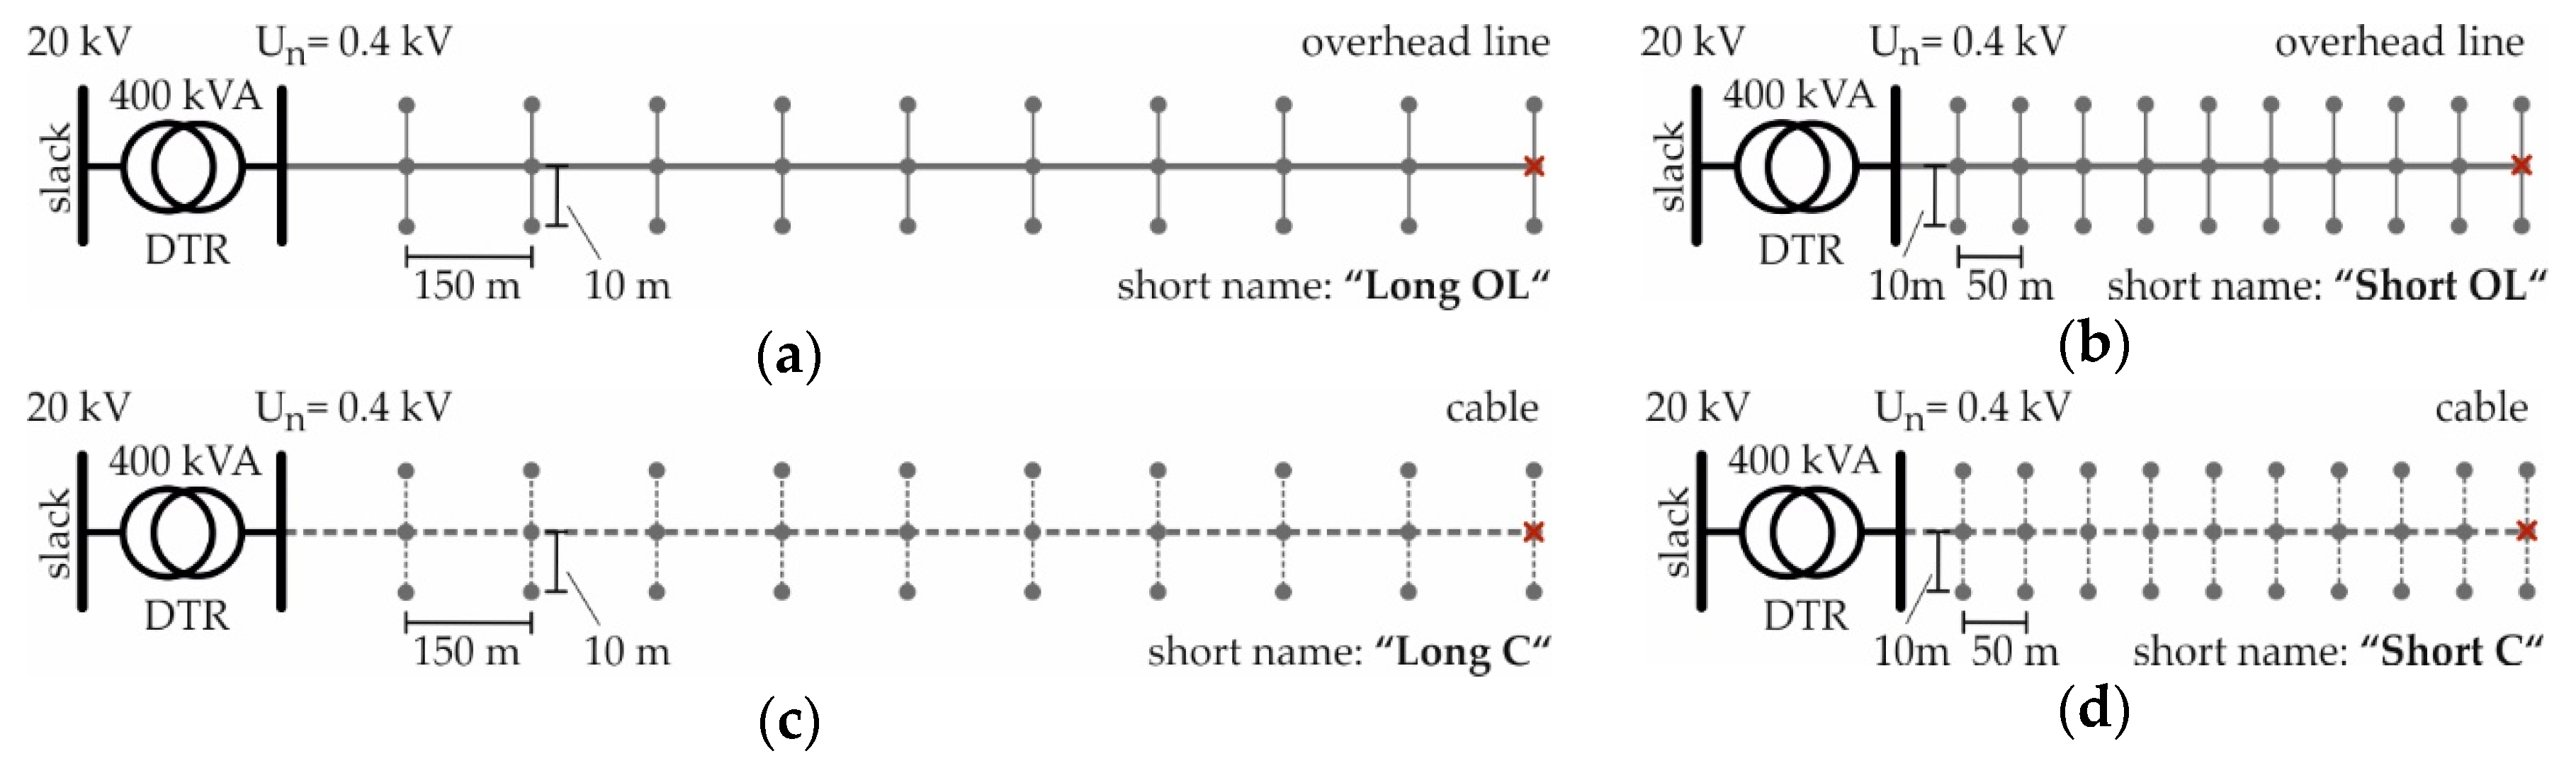
European low voltage grids are typically of radial structure with customer plants connected anywhere along the feeders [24]. To analyze the HC increase potential of the different control strategies, four theoretical feeders and one real feeder are simulated. For all test-feeders, the slack node is located at the DTR primary side and the connection points of the inductive devices in the case of L(U)-control are marked with a red cross in Figure 1 and Figure 2. All test-feeders are connected to the slack node through a 20 kV/0.4 kV, 400 kVA DTR. The detailed data of the used overhead lines and cables is given in Appendix A, Table A1.
2.1.1. Theoretical LV Test-Feeders
Figure 1 shows the theoretical LV test-feeders with homogeneously distributed PV-plants. Each of them supplies 20 prosumers. To consider rural as well as urban conditions, long feeders with low prosumer density, and short feeders with high prosumer density, are simulated. The feeder realization with overhead lines or cables enables an evaluation of the HC increase potential of each Volt/var control strategy in dependence of the cable share.
2.1.2. Real LV Test-Feeder
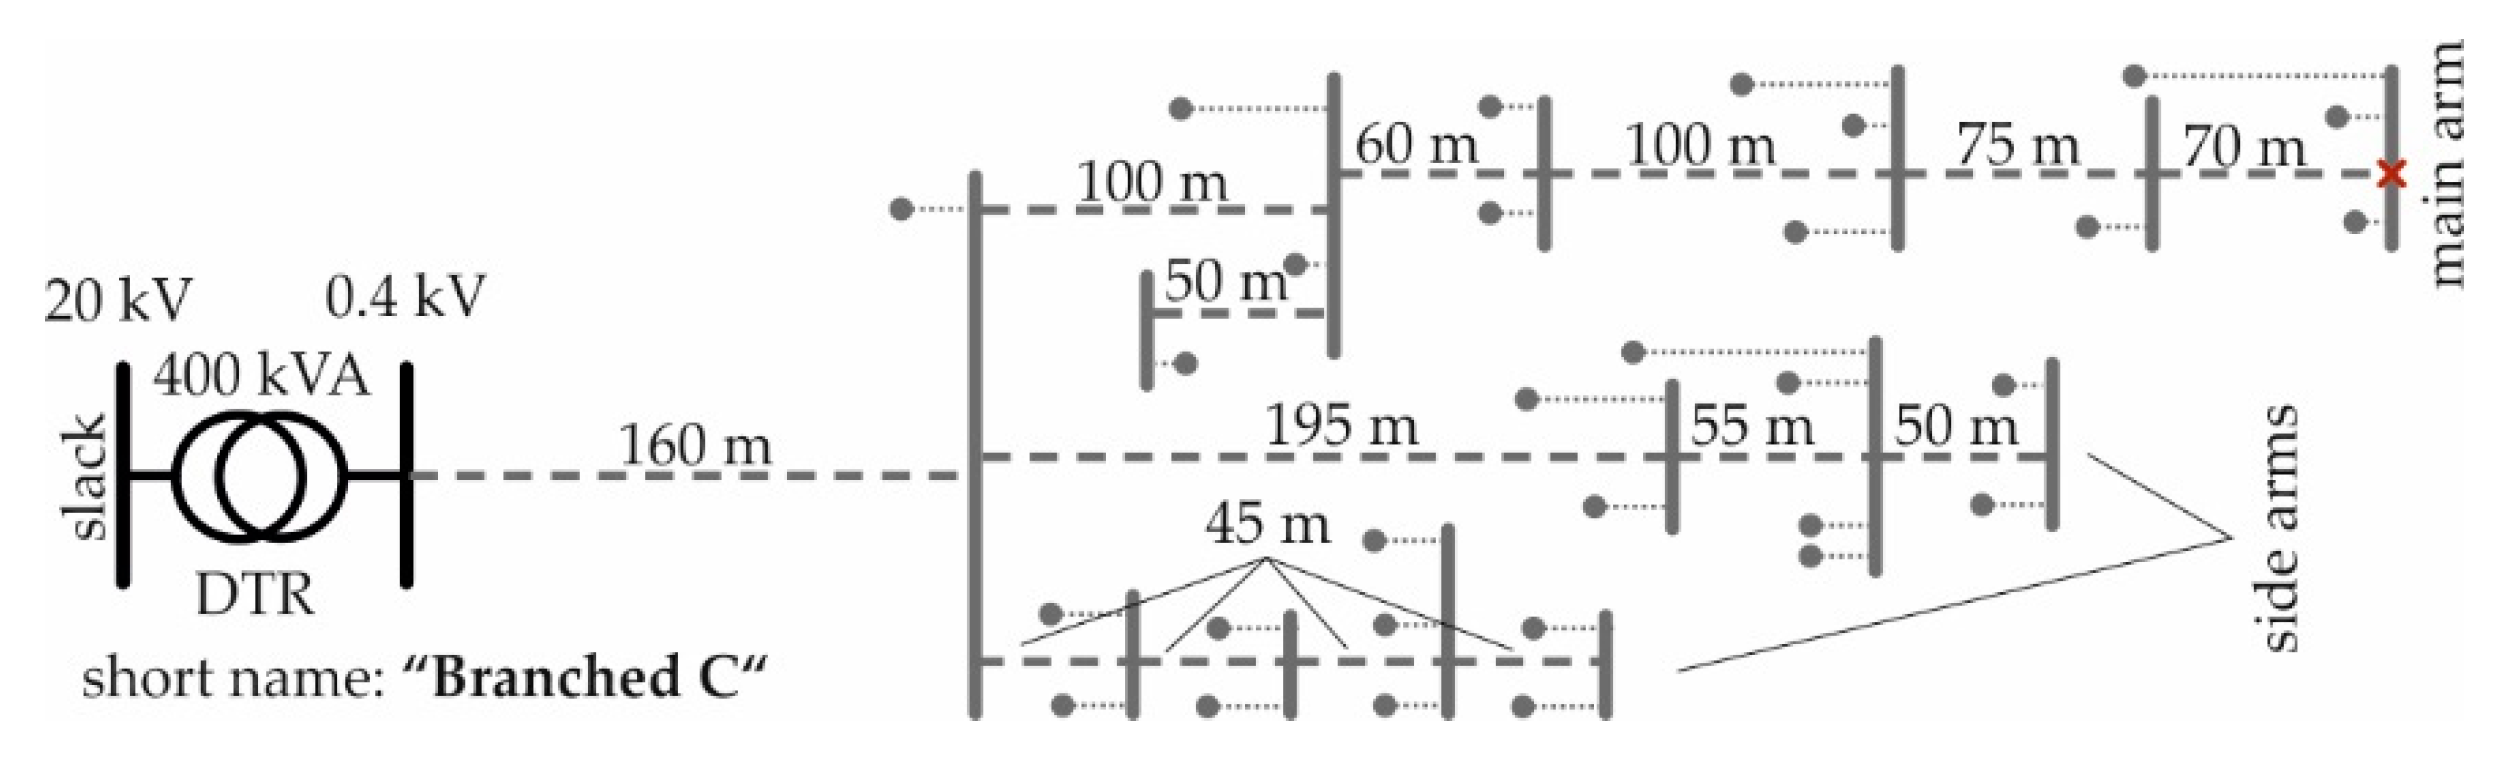
Figure 2 shows the branched cable test-feeder with heterogeneously distributed PV-systems. It is a typical urban feeder with 100% cable share and a maximal length of 0.64 km that supplies 31 prosumers. It consists of one main arm and two side arms. Apart from the branching, the structure of this real feeder is comparable to that of the theoretical short cable feeder.
2.2. Prosumer Model
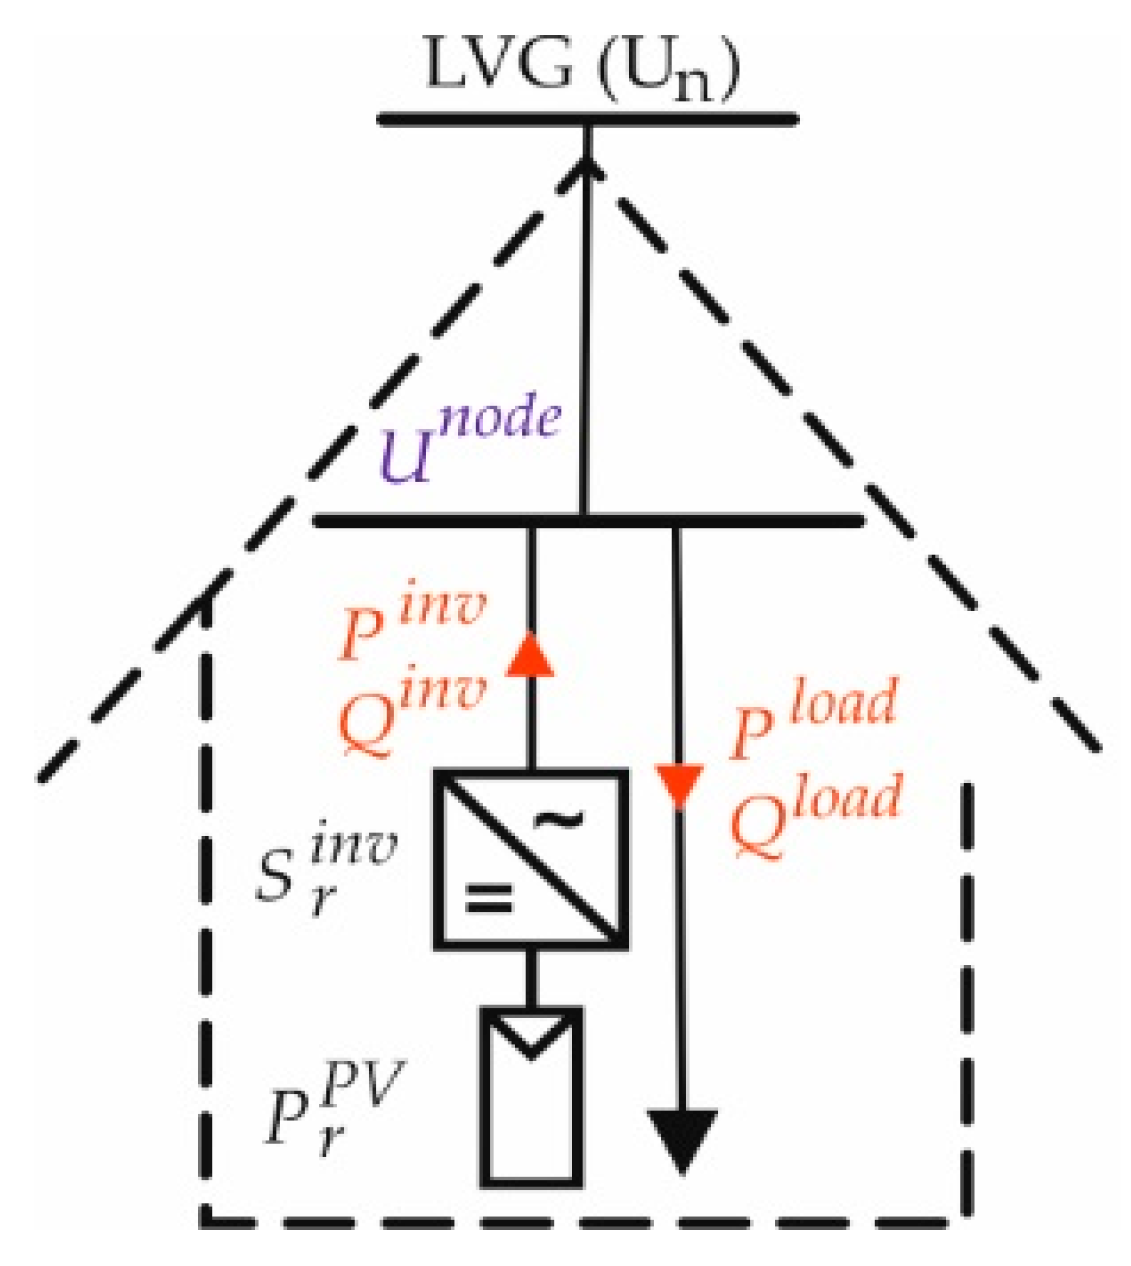
Figure 3 shows the used prosumer structure. It is characterized by the active and reactive power consumption and production of the internal load (, ) and PV-plant (, ). Each prosumer is connected to a grid node with a voltage of and owns a PV-plant with a module rating of and an inverter rating of . Voltage dependency of loads is modelled according to Equations (1) and (2) with ZIP-coefficients from [26]:
where and are the active and reactive power consumption of the initial load, respectively, and V is the normalized local grid node voltage.
An initial power factor of 0.95 inductive is set for all loads, thus:
The PV-inverters are over-dimensioned to allow injection with a power factor of 0.90, even during peak active power production, as in:
2.3. Control Strategies
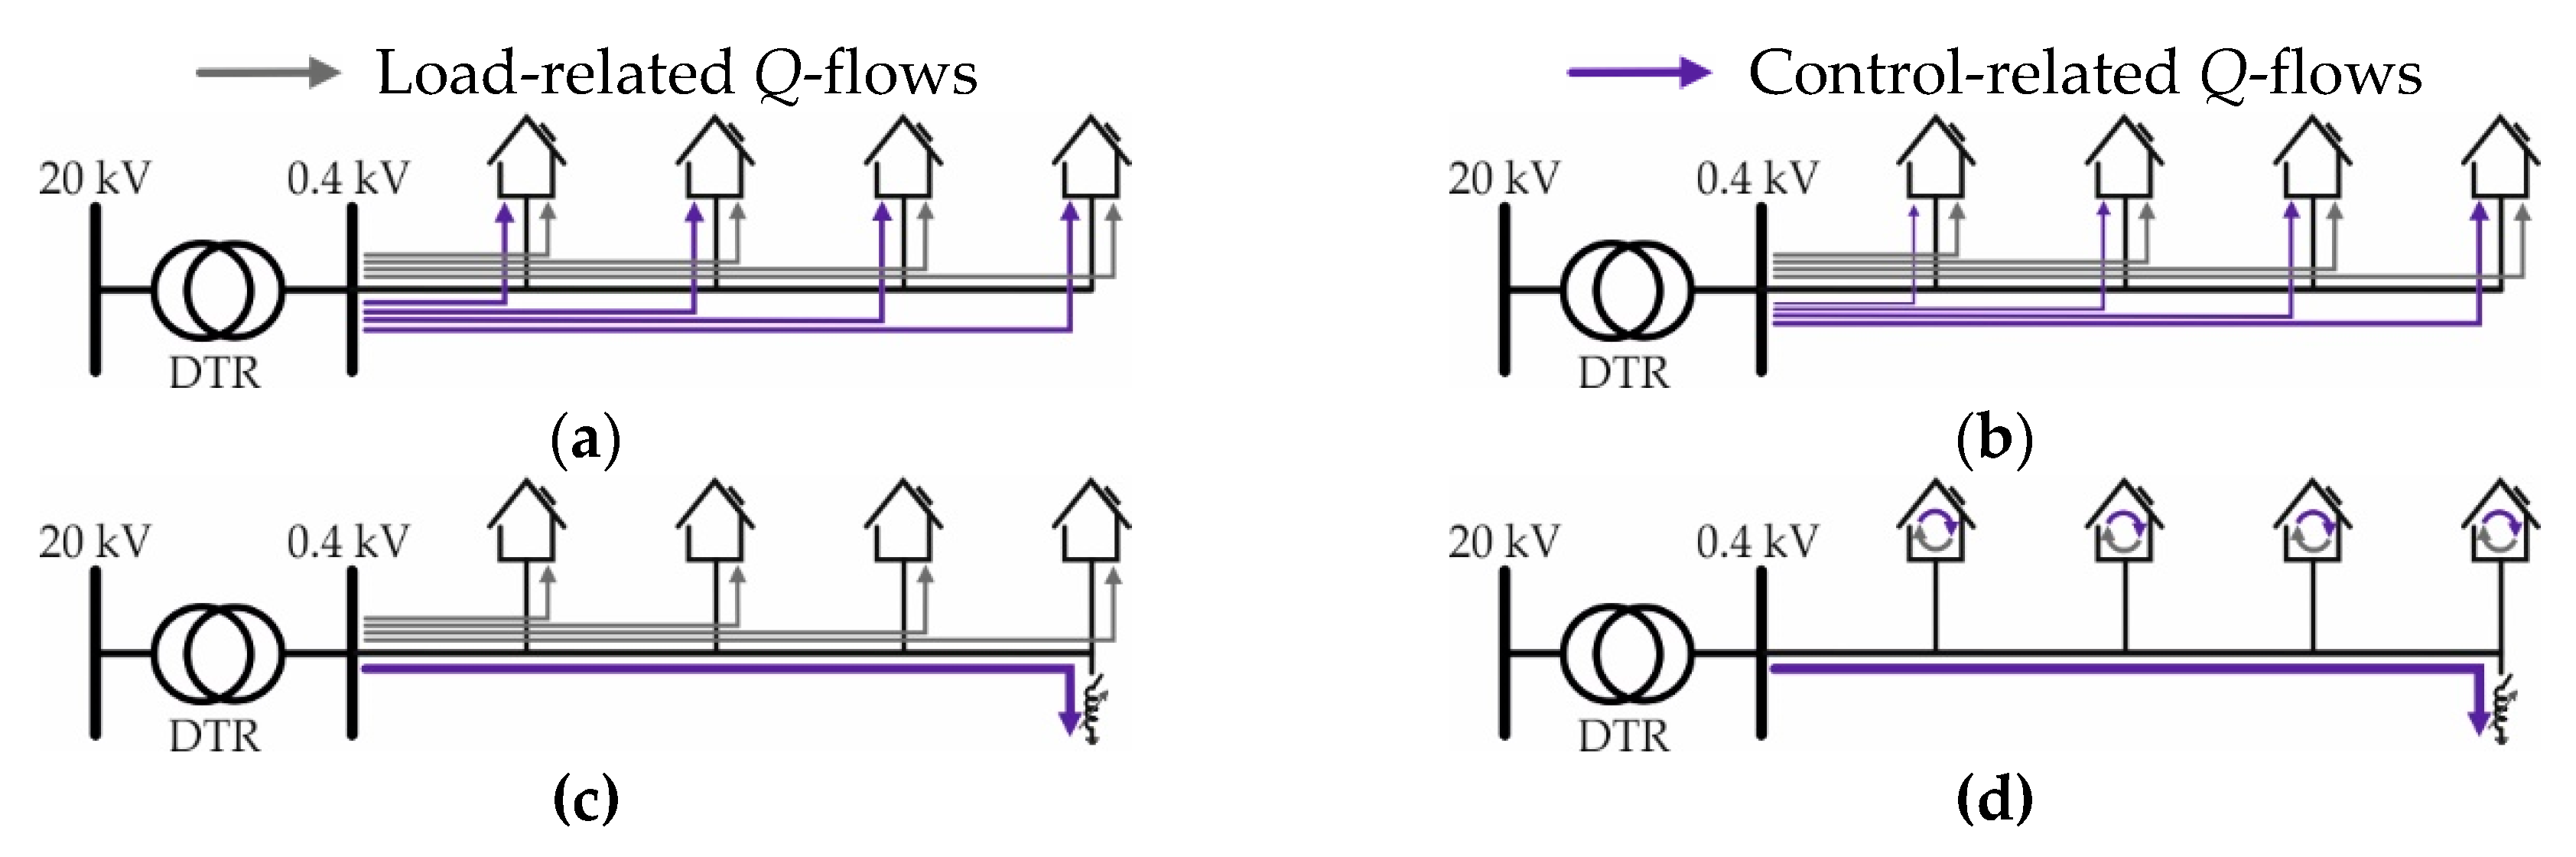
No-control and four different local control strategies are simulated, i.e., cosφ(P)-, Q(U)-, L(U)- and L(U)-control combined with Q-Autarkic prosumers. These control strategies provoke distinct reactive power flows within the LV feeders. Figure 4 shows the load- and control-related reactive power flows for the different control strategies. Figure 4a shows them in the case of local cosφ(P)-control. All inverters absorb the same amount of reactive power, if equal PV-production conditions (irradiance, temperature, tilt angle of PV-modules, etc.) along the LV feeder are assumed and all prosumers have the same PV-module and -inverter rating.
The distributed Q-consumption of cosφ(P)-controlled PV-plants provokes inhomogeneous control-related reactive power flows through the line segments, leading to an extensive loading of those close to the DTR. The reactive power needed to supply the internal loads is drawn from the grid. If Q(U)-control is used, the distributed inverters absorb different amounts of reactive power, depending on their local grid voltage, as shown in Figure 4b. As a result, inhomogeneous control-related reactive power flows occur in the individual line segments, leading to an extensive loading of those close to the DTR. Also in this case, the reactive power needed to supply the internal loads is drawn from the grid. Figure 4c shows the case with local L(U)-control. The inverters do not absorb or produce any reactive power, while the reactive power needed by the internal loads is obtained from the grid. The inductive device at the feeder end absorbs reactive power to control the feeder voltage, provoking a homogeneous control-related reactive power flow through the line segments. The inverters of Q-Autarkic prosumers produce the reactive power that is needed by the internal loads. Hence, if L(U)-control is combined with Q-Autarkic prosumers, the load-related reactive power flows are completely eliminated, further homogenizing the reactive power flow through the feeder, as shown in Figure 4d.
2.3.1. cosφ(P)-Control
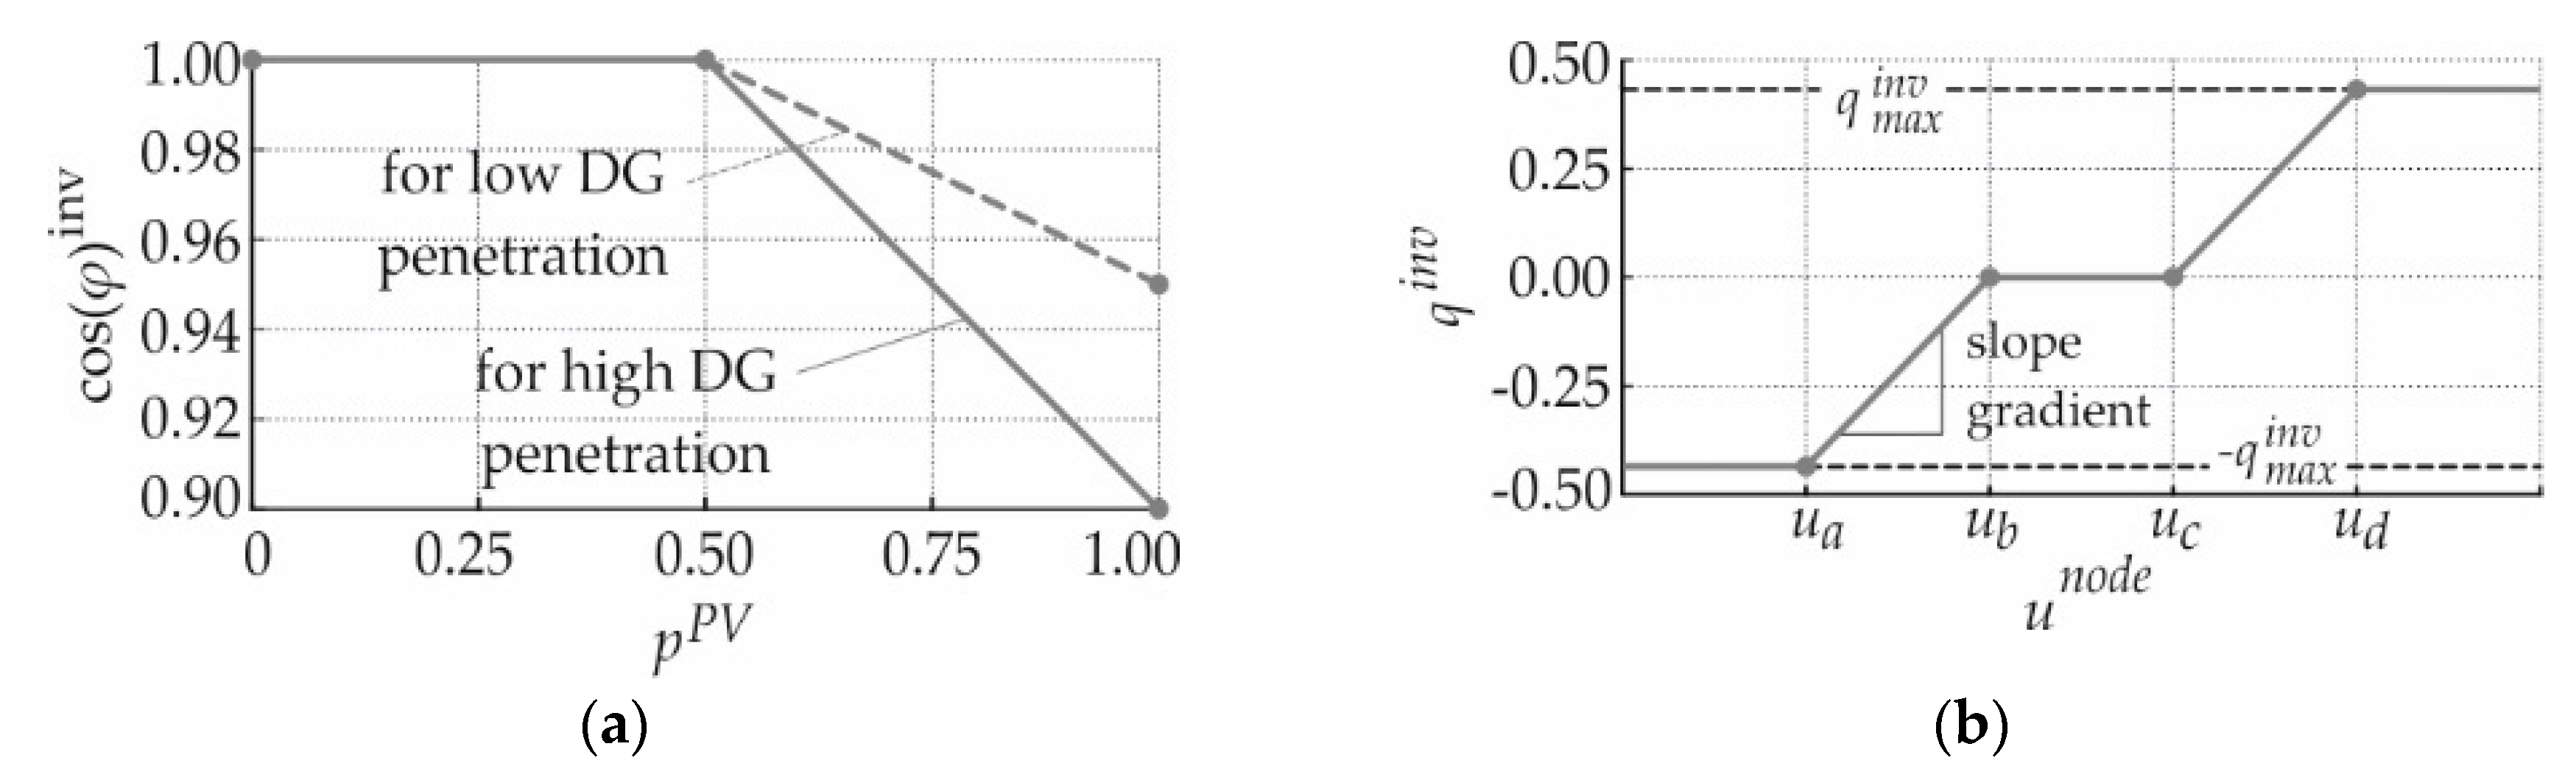
Figure 5a shows the fundamental cosφ(P)-control characteristics proposed by the Austrian grid code [25]. Two different ones are foreseen for low and high DG penetration, respectively. In both cases, the PV-inverter absorbs reactive power if its normalized active power injection, exceeds a value of 0.5:
2.3.2. Q(U)-Control
Figure 5b shows the fundamental Q(U)-control characteristics proposed by the Austrian grid code [25]. The inverter injects or absorbs reactive power depending on the local grid node voltage.
Plotted on the ordinate is the inverter’s normalized reactive power absorption, as in:
The maximal reactive power absorption of the PV-inverter is determined by:
The parameters , , and can be specified by the responsible DSO according to the prevalent grid conditions. To avoid oscillations, the maximum slope gradient needs to be respected [13].
2.3.3. L(U)-Control
In the case of L(U)-control, all PV-inverters inject with a power factor of one, and prosumers draw reactive power from the grid to supply their loads. Inductive devices with continuously variable inductances are set close to the end of the violated feeders and are equipped with local L(U)-control. They are activated only for local voltages . If activated, they absorb the reactive power needed to prevent a local exceedance of .
2.3.4. L(U)-Control Combined with Q-Autarkic Prosumers
This control ensemble uses the L(U)-control to mitigate the upper voltage limit violations in LV feeders, and simultaneously Q-Autarky of prosumers. As per the definition, Q-Autarkic prosumers fully compensate the reactive power needs at the customer plant level () at all times, acting self-sufficient concerning the reactive power [21]. Consequently, Q-Autarkic prosumers do not exchange any reactive power with the LV feeders.
3. Methodology
This section presents the methodology used for the simulations, including the scenario definition, the parameterization of control strategies, and the evaluation of the simulation results.
3.1. Scenario Definition
To analyze the HC of the LV test-feeders, the worst-case conditions are considered, i.e., minimal load and maximal production combined with the maximal or minimal DTR primary voltage. For a certain active and reactive power production/consumption of prosumers, the maximal DTR primary voltage reduces the margin to the upper voltage limit, and the minimal one reduces the margin to the current limit.
3.1.1. Load and Production
The initial load consumption is set to a value of kW/prosumer and is kept constant in all simulations. The installed PV-module rating at each customer plant, denoted as the PV-penetration in the following, is gradually increased from 0 kW up to 17.5 kW in steps of 10 W. Peak active power production is assumed for all simulations, as in:
3.1.2. DTR Primary Voltage
European distribution system operators have to keep their grid voltages within the EN 50160 limits of ±10% around nominal voltage. Usually, the DSOs allocate the available voltage band between the medium voltage (MV) and LV grids [6]. In this paper it is assumed that the MV grid is operated with voltages between 0.96 p.u. and 1.06 p.u., allowing within the LV grids a maximum voltage increase and decrease of 0.04 p.u. and 0.06 p.u., respectively. Therefore, two different values for the DTR primary voltage are considered: 0.96 p.u. and 1.06 p.u.
3.1.3. Control Strategy
No-control and all control strategies described in Section 2.3., i.e., cosφ(P)-, Q(U)-, L(U)-, and L(U)-control combined with Q-Autarkic prosumers, are simulated.
3.1.4. Test-Feeders
All LV test-feeders described in Section 2.1. are simulated.
3.1.5. Scenario Overview
Table 1 shows an overview of the defined scenarios. The initial load value of each prosumer remains unchanged in all simulations, while the PV-penetration is gradually increased. These load/production values are simulated for the minimal and maximal DTR primary voltages. The scenarios shown in Table 1 are simulated with each LV test-feeder and each control strategy, including no-control.
3.2. Control Parameterization
For each LV test-feeder, a distinct set of control parameters is defined. The parameters are set in order to maximize the HC of the corresponding test-feeder. The selected control parameters are given in Appendix B, Table A2. Other side effects of local Volt/var controls such as additional grid losses, DTR loading or Q-exchange are not considered within the parameterization process, since the focus of this study is the maximum HC increase that can be achieved by using the different control strategies. The different control strategies have different parameters to be set; they are explained in the following.
3.2.1. cosφ(P)-Control
Figure 6a illustrates the method used to specify the cosφ(P)-control parameters. To achieve the maximum HC in each test-grid, the minimum power factor (cosφmin) at peak active power production is varied between 0.9 under-excited and 1.
3.2.2. Q(U)-Control
Figure 6b illustrates the method used to specify the Q(U)-control parameters. The capacitive behavior of Q(U)-controlled PV-inverters for low voltages is not relevant for the HC. Therefore, it is not implemented in the model.
The slope gradient is not varied; instead, the parameter is calculated as in:
The parameter is varied to achieve the maximum HC of the corresponding test-grid.
3.2.3. L(U)-Control
References [19,20,21] suggest a voltage set-point of 1.09 p.u. to eliminate the violations of the upper voltage limit while keeping the L(U)-control related reactive power flow as low as possible. However, in this study the voltage set-point is varied between 1.0 p.u. and 1.1 p.u. to achieve the maximum HC of the corresponding test-feeder.
3.2.4. L(U)-Control Combined with Q-Autarkic Prosumers
In the presence of Q-Autarkic prosumers, the voltage set-point of the L(U)-control is also varied between 1.0 p.u. and 1.1 p.u. to achieve the maximum HC of the corresponding LV test-feeder.
3.3. Result Evaluation
The HC of the LV feeders is determined by comparing performance indices with their limits. As performance indices, maximal () and minimal node voltage (), maximal line segment loading (), and DTR loading () are used. They are calculated as in:
where is the RMS voltage of grid node j (including all LV grid nodes and the slack node), is the RMS current through line segment i, is the thermal current limit of line segment i, is the RMS current through the DTR, and is the thermal current limit of the DTR.
The DTR loading is obtained directly from the simulation results. The voltage- and current-related HC limits are defined as the minimal PV-penetration () that leads to the violation of the voltage and current limits, respectively, as in:
The hosting capacity of each test-feeder is reached when one of the limits is violated. Furthermore the HC increase and the additional grid losses provoked by each control strategy c, are presented according to Equations (18) and (19):
where is the HC of test-feeder for control strategy c, is the HC of test-feeder for no-control, is the grid losses for control strategy c, and is the grid losses for no-control. The grid losses include losses of the DTR and all line segments.
4. Hosting Capacity Enhancement by Local Reactive Power Control Strategies
In this section, the simulation results are presented for each LV test-feeder separately. The current- and voltage-related hosting capacity limits and the grid losses of each test-feeder are presented. Finally, an overview of the HC increase and the additional grid losses provoked by the different local Volt/var control strategies is given. The reactive power consumption of the inductive device in case of L(U)-control are shown for the different test-feeders and DTR primary voltages in Appendix C, Figure A1.
4.1. Theoretical LV Test-Feeders
This section presents the HC increase and the additional grid losses for the theoretical test-feeders provoked by the different control strategies, including no-control.
4.1.1. Long Overhead Line Test-Feeder
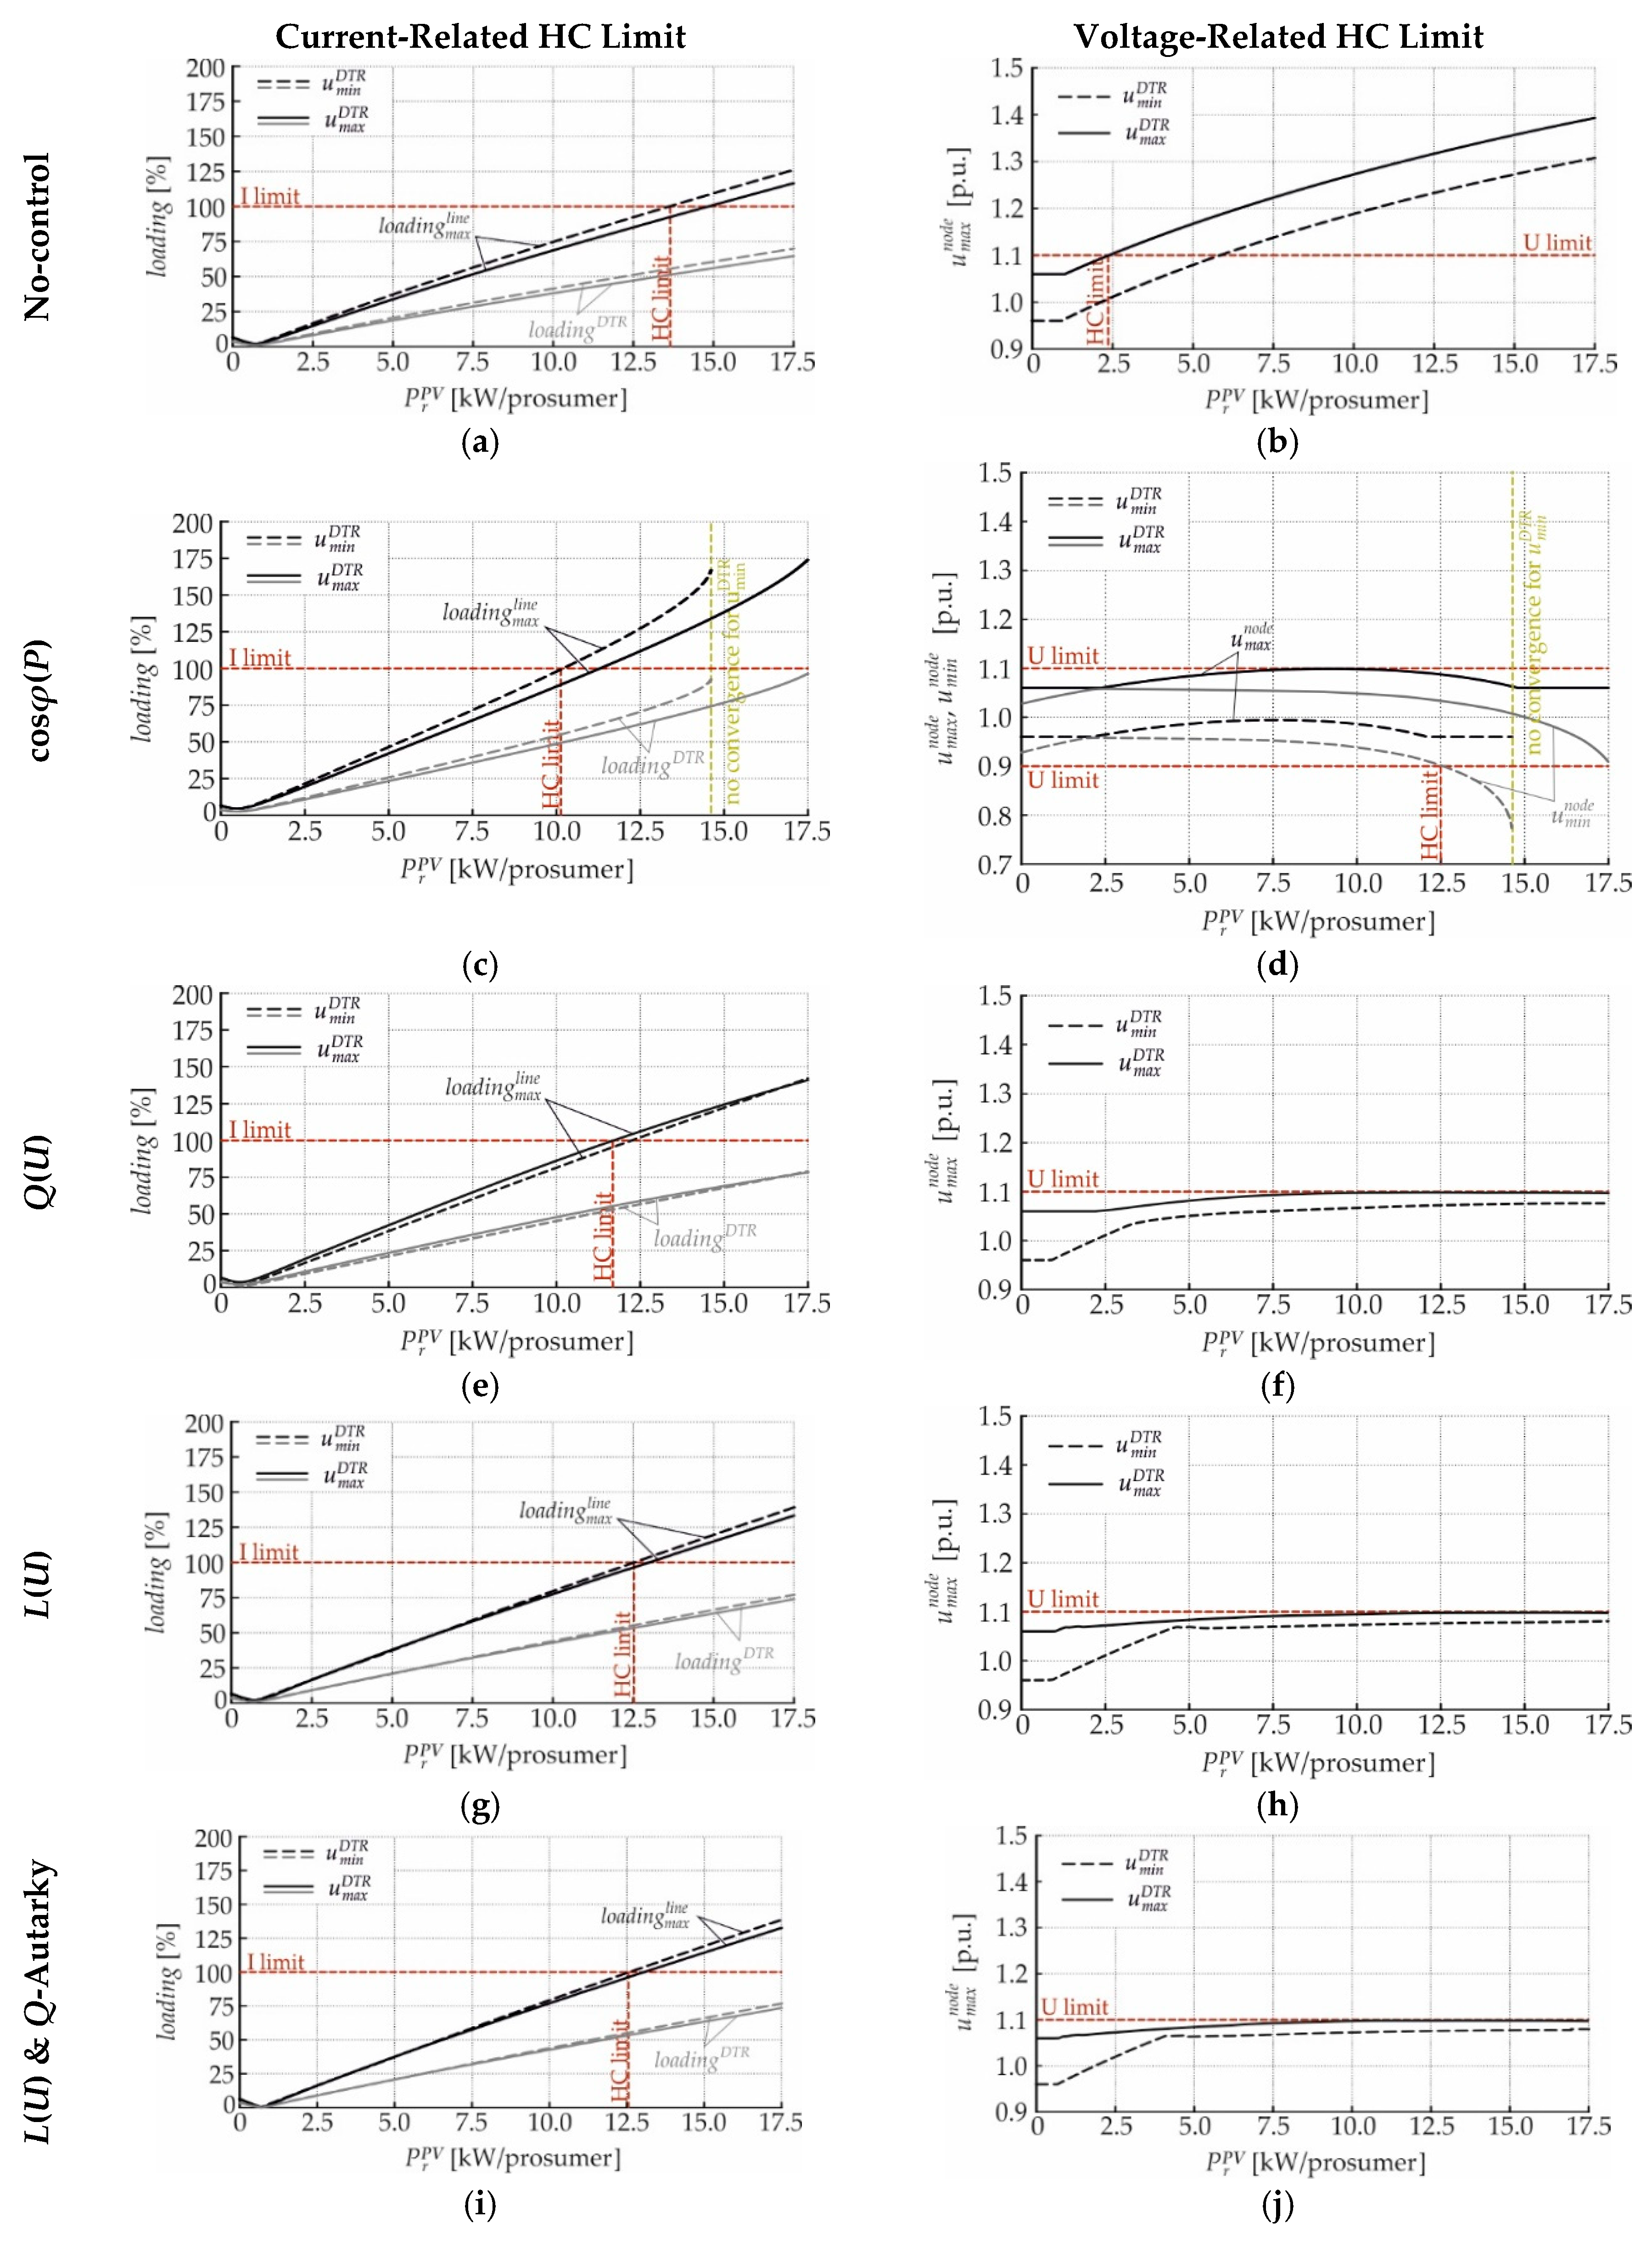
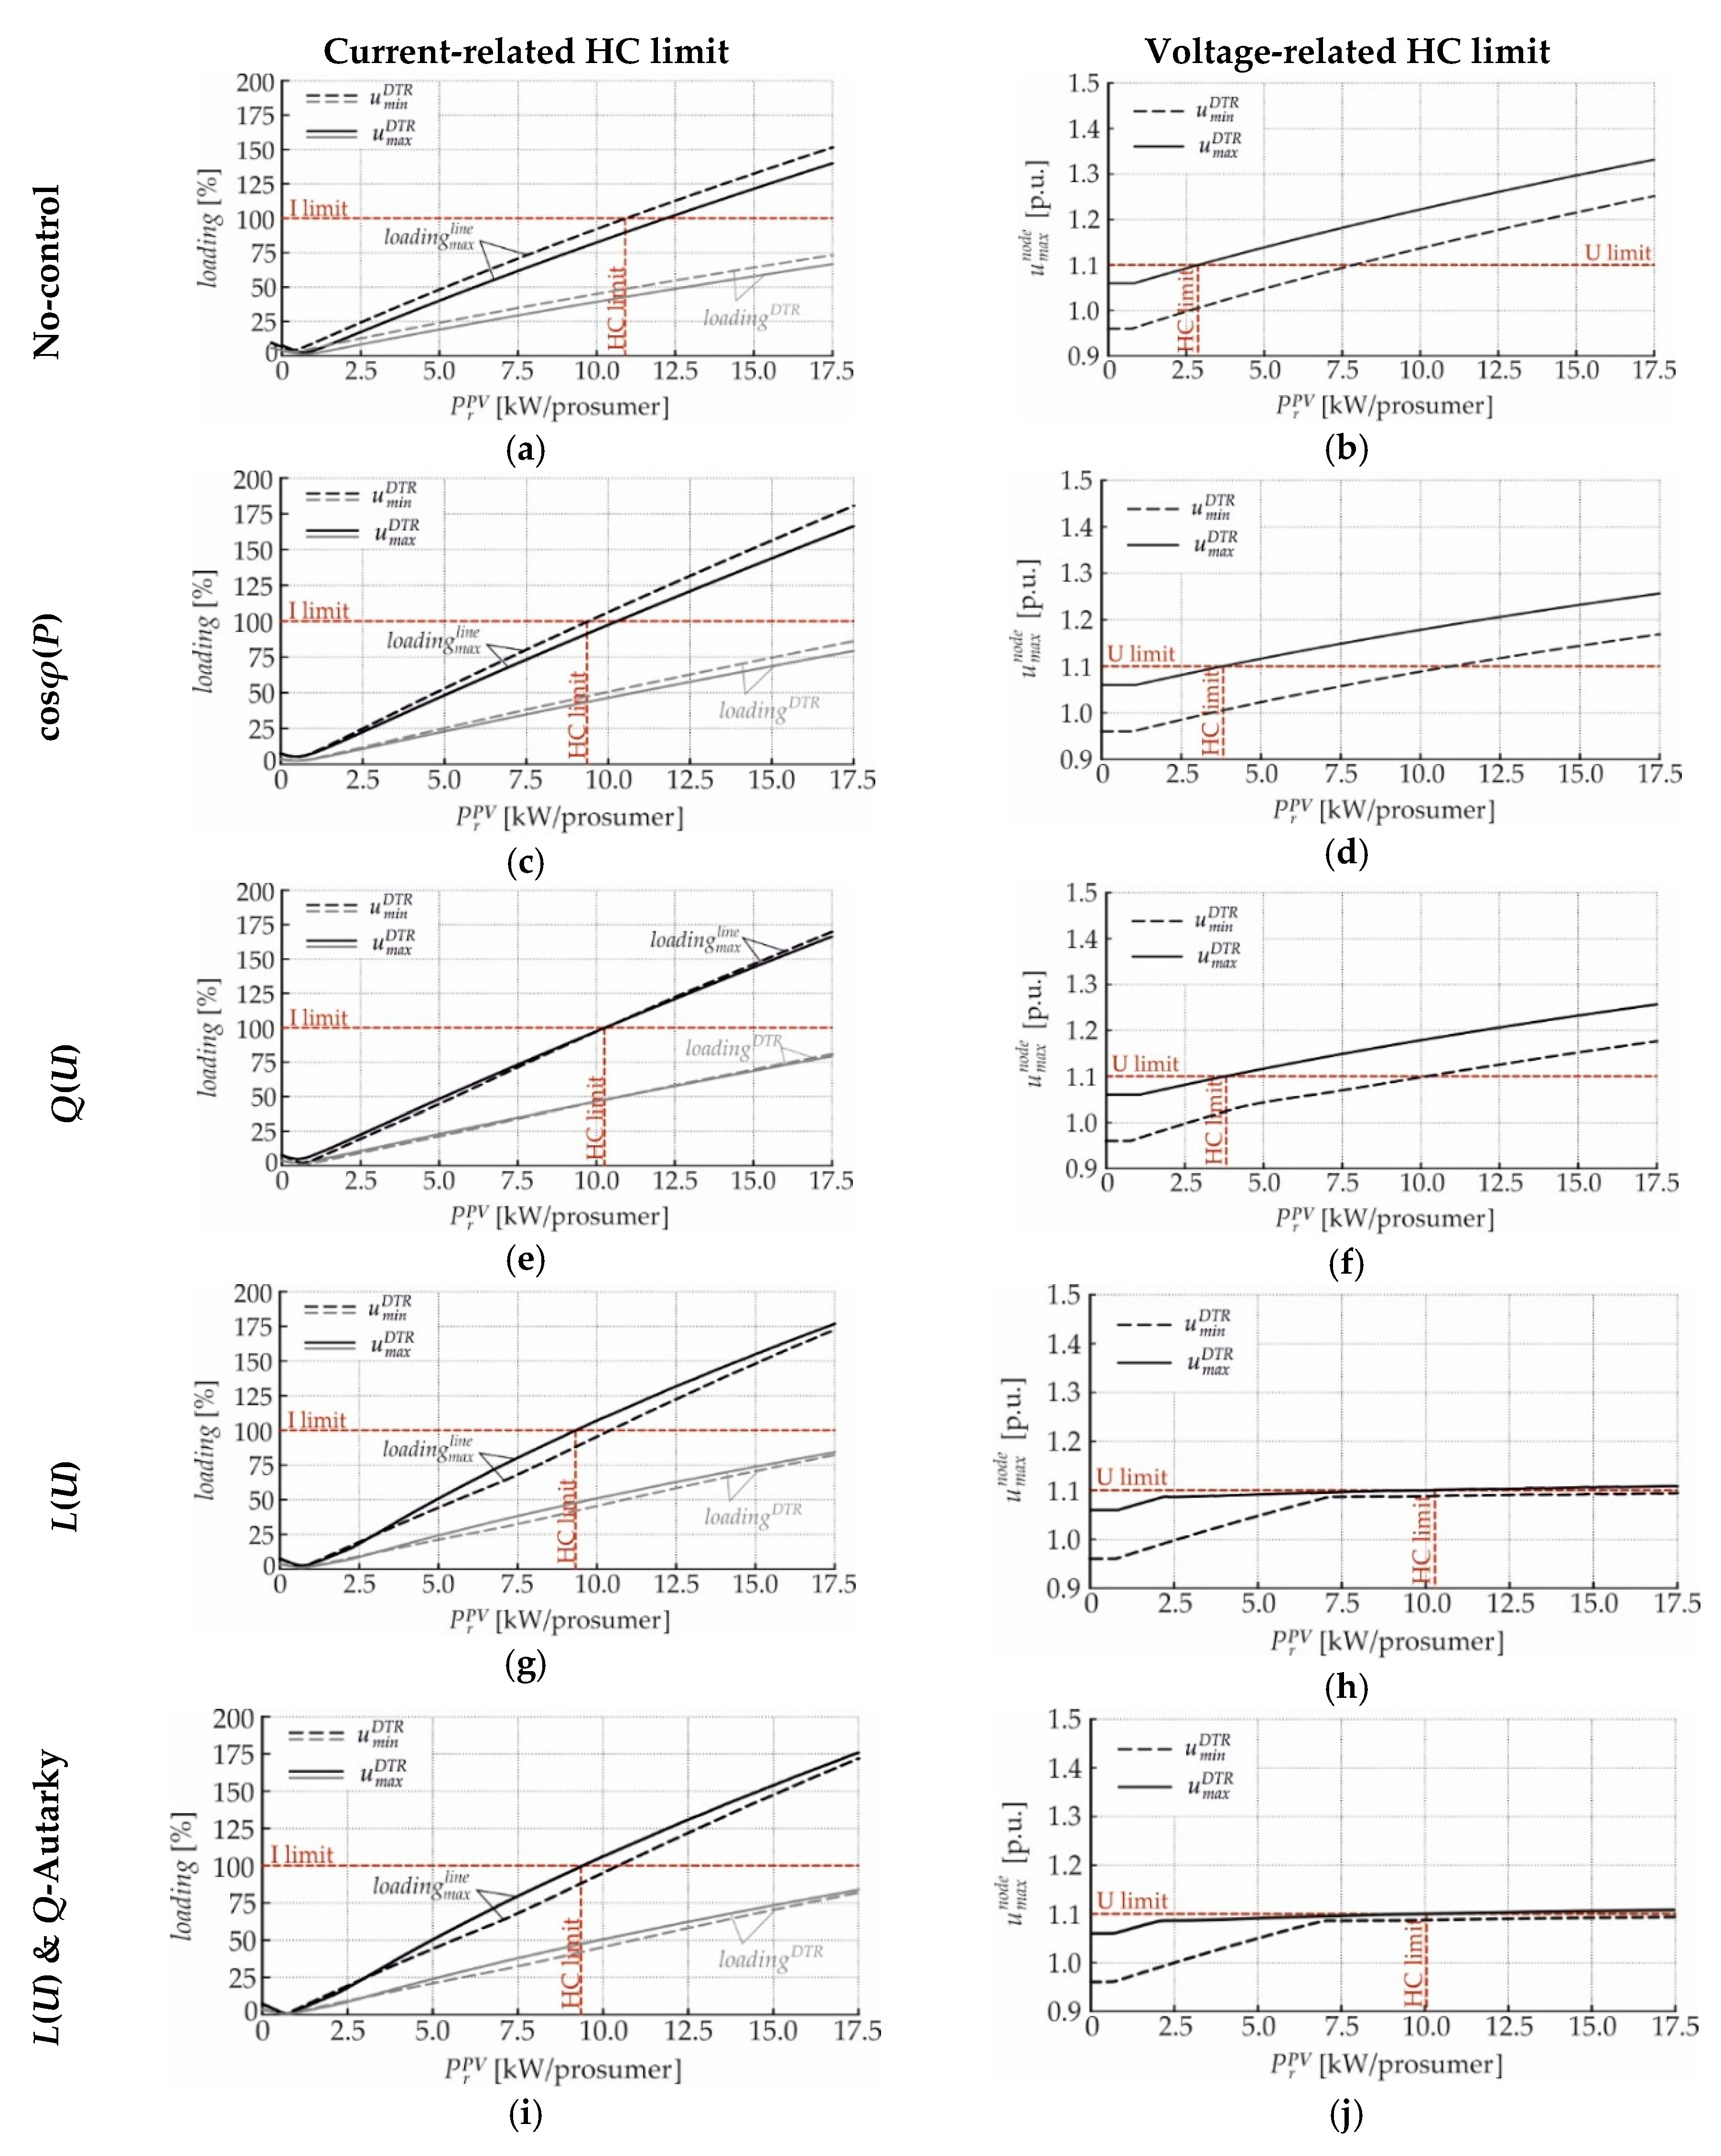
Figure 7 shows the current- and voltage-related hosting capacity limits of the long overhead line test-feeder for different control strategies. Figure 7a,b show the current- and voltage-related HC limits for no-control: they occur at PV-penetrations of 13.63 and 2.39 kW/prosumer, respectively, resulting in a HC of 2.39 kW/prosumer.
In the case of cosφ(P)-control, the uniform reactive power consumption of PV-plants shifts the current- and voltage-related HC limits to PV-penetrations of 10.20 and 12.50 kW/prosumer, respectively, resulting in a HC of 10.20 kW/prosumer, as shown in Figure 7c,d. For kW and the minimal DTR primary voltage, the load flow calculations do not converge, indicating instability. Compared to the case with no-control, the use of cosφ(P)-control increases the HC of the feeder by 7.81 kW/prosumer. If Q(U)-control is applied, the uneven reactive power consumption of PV-plants shifts the current-related HC limit to a PV-penetration of 11.71 kW/prosumer, and the voltage-related one to a value > 17.50 kW/prosumer, resulting in a HC of 11.71 kW/prosumer, as shown in Figure 7e,f. Compared to the case with no-control, the use of Q(U)-control increases the HC of the feeder by 9.32 kW/prosumer. The use of L(U)-control shifts the current-related HC limit to a PV-penetration of 12.53 kW/prosumer, and the voltage-related one to a value > 17.50 kW/prosumer, resulting in a HC of 12.53 kW/prosumer, as shown in Figure 7g,h. Compared to the case with no-control, the use of L(U)-control increases the HC of the feeder by 10.14 kW/prosumer. If L(U)-control is combined with Q-Autarkic prosumers, the reactive power consumption of the inductive device and Q-Autarky of prosumers shifts the current-related HC limit to a PV-penetration of 12.59 kW/prosumer, and the voltage-related one to a value > 17.50 kW/prosumer, resulting in a HC of 12.59 kW/prosumer, as shown in Figure 7i,j. Compared to the case with no-control, the combination of L(U)-control with Q-Autarkic prosumers increases the HC of the feeder by 10.20 kW/prosumer.
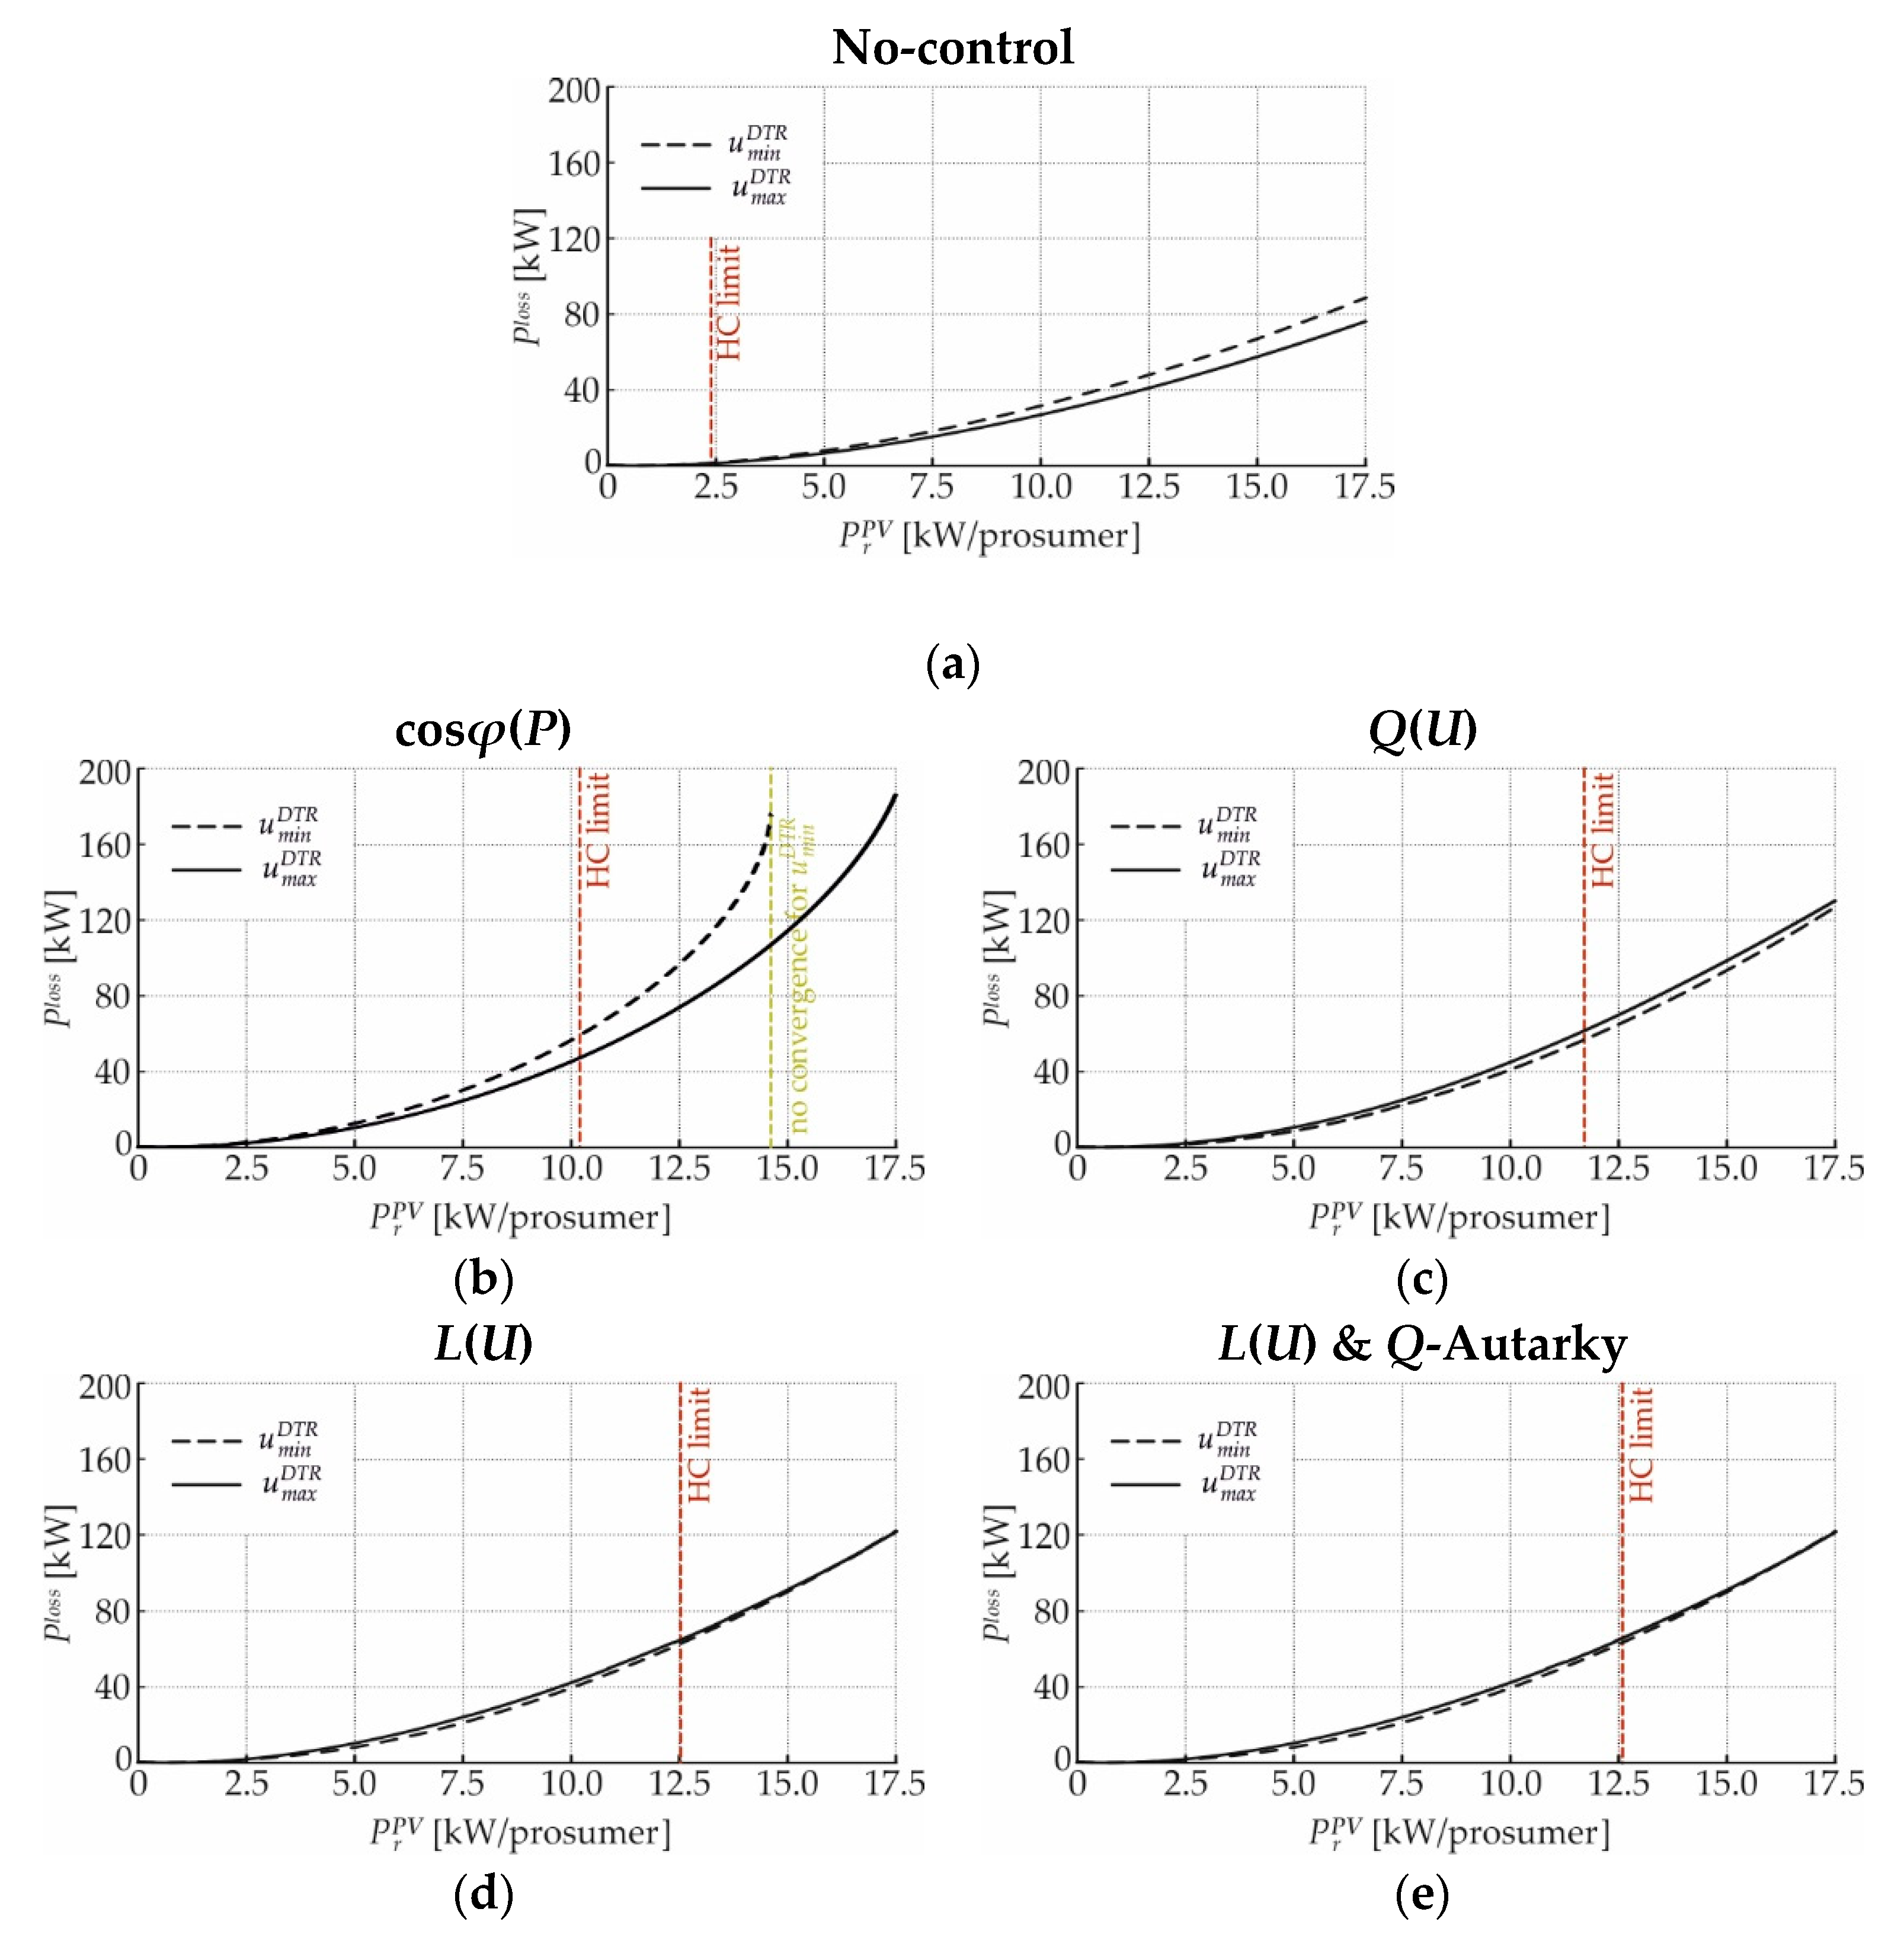
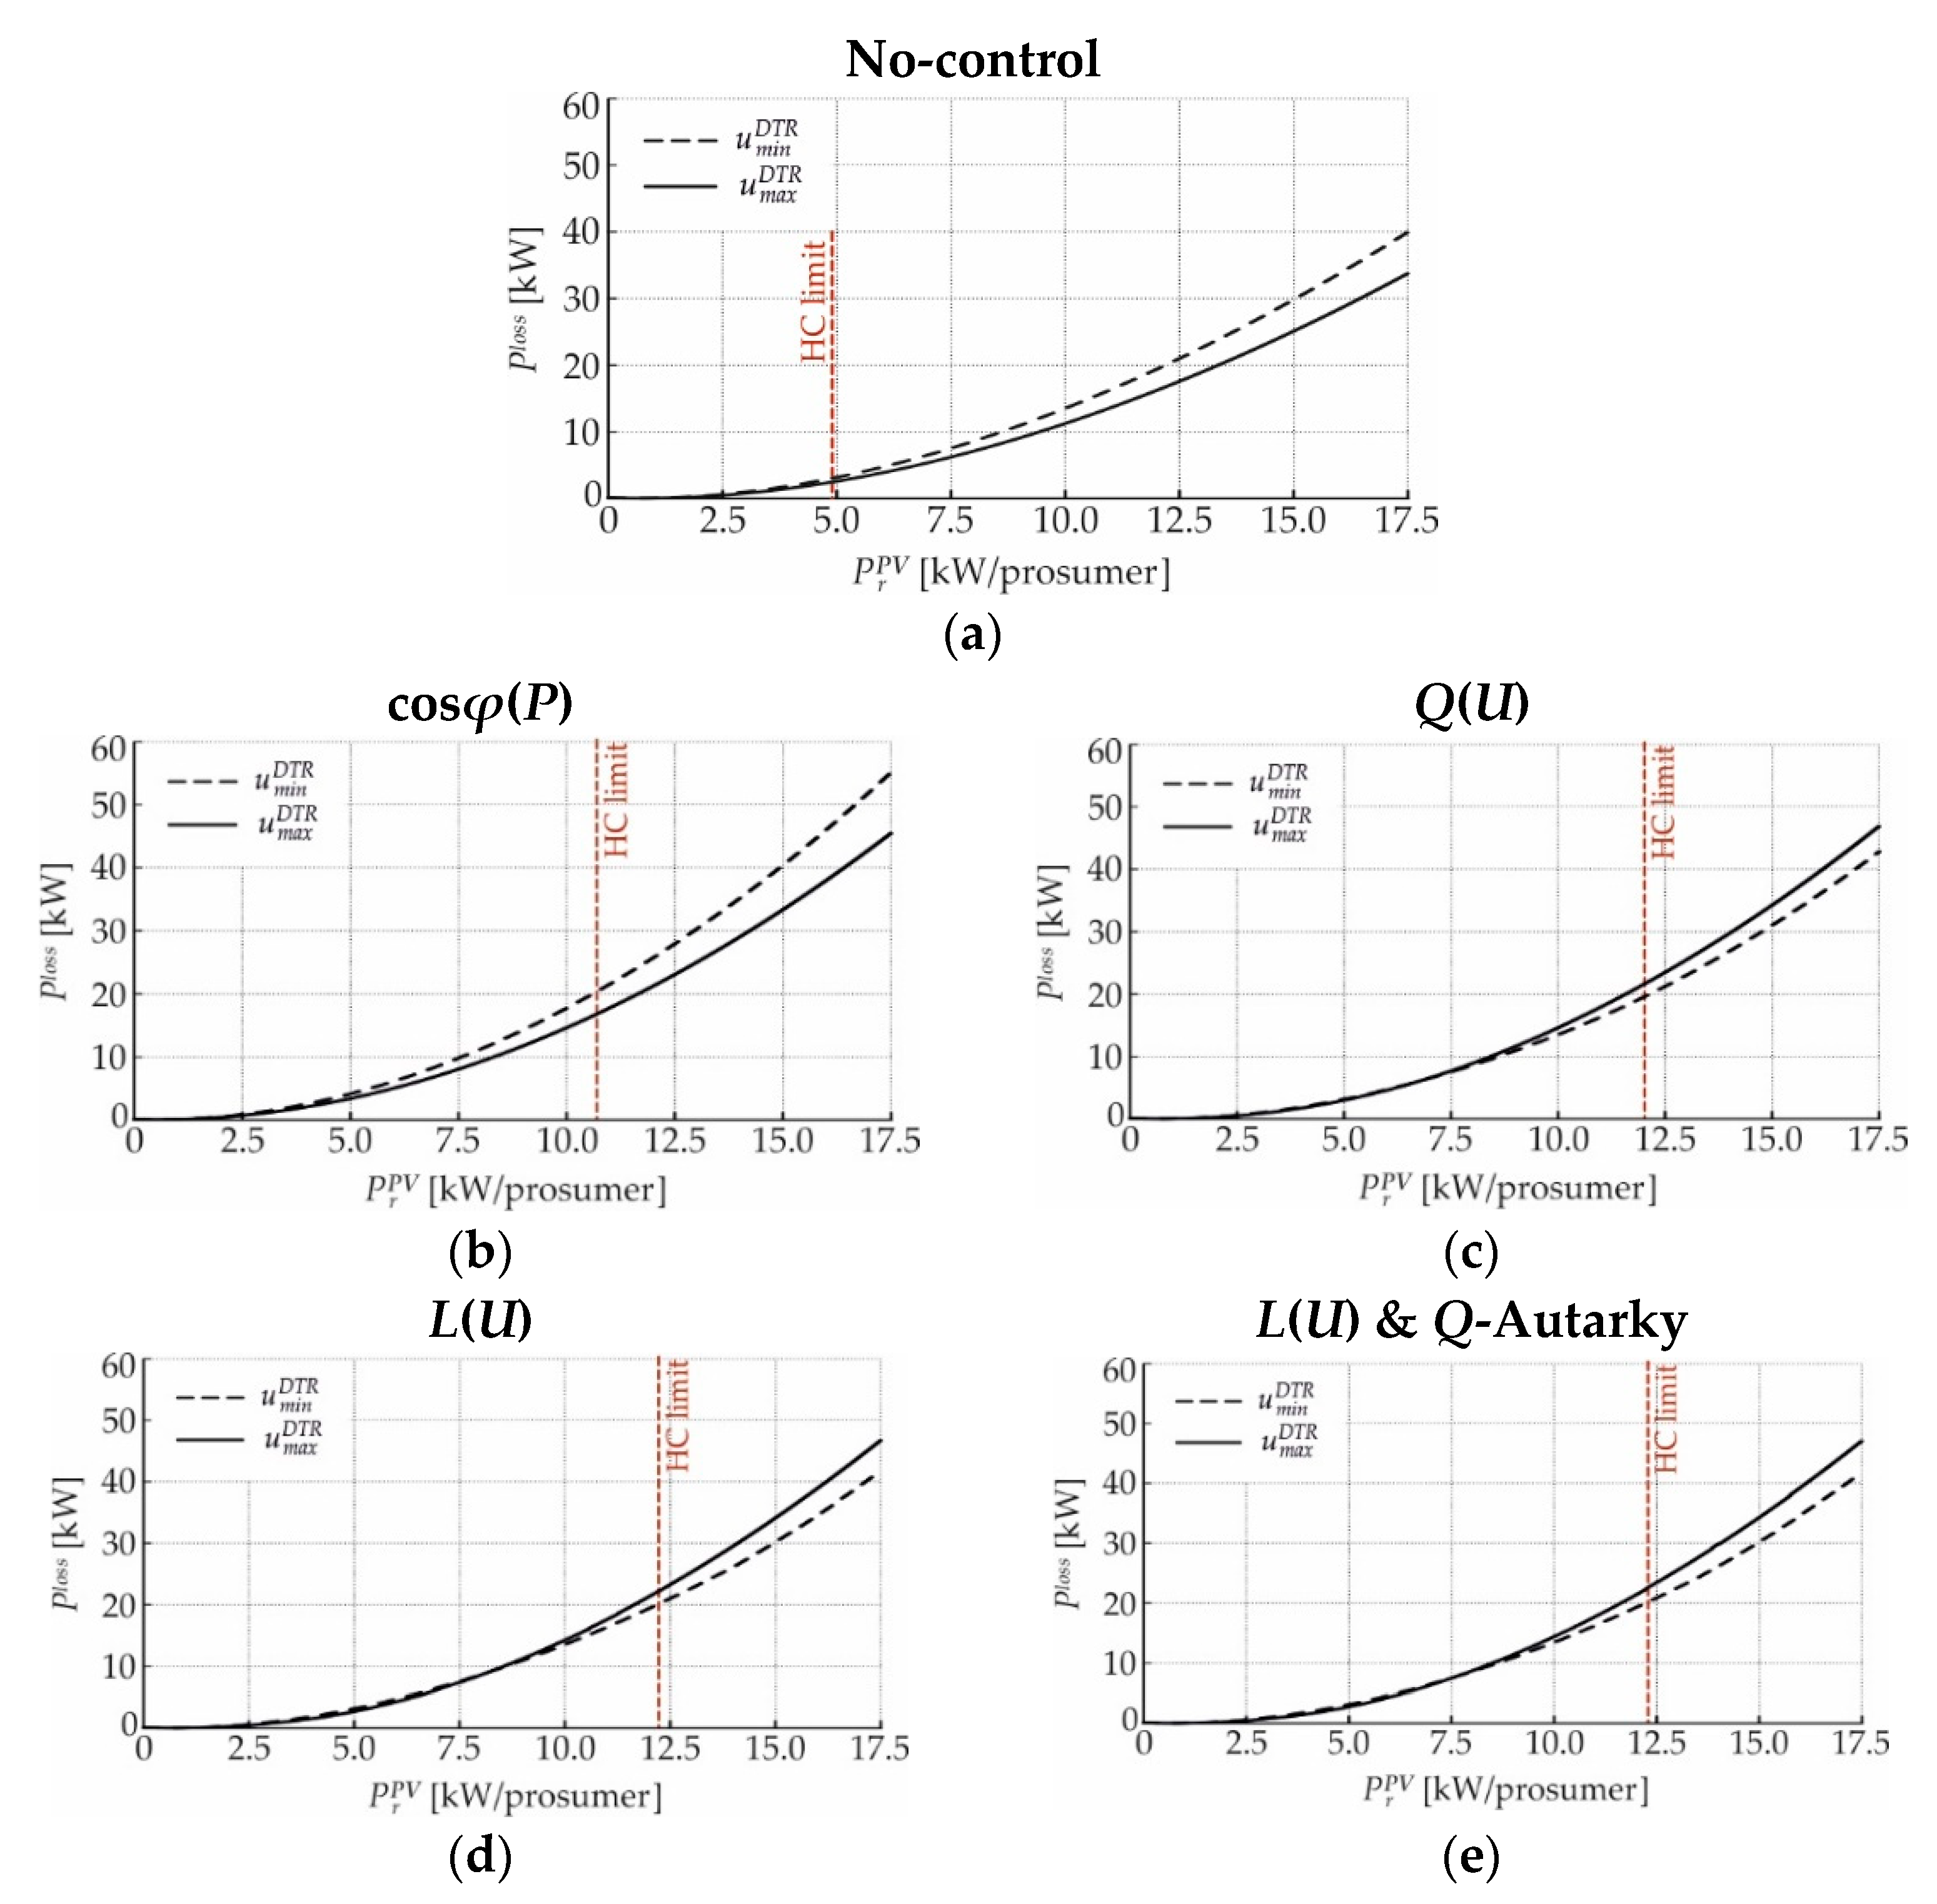
Figure 8 shows the grid losses of the long overhead line test-feeder for the minimal and maximal DTR primary voltages and different control strategies.
For no-control or cosφ(P)-control, the grid losses are greater for the minimal DTR primary voltage than for the maximal one, as shown in Figure 8a,b. If Q(U)-, L(U)- or L(U)-control combined with Q-Autarkic prosumers is applied, greater losses occur for the maximal DTR primary voltage, as shown in Figure 8c–e.
Figure 8a shows the grid losses for no-control: in the presence of the minimal DTR primary voltage, grid losses reach values of 7.89, 31.64 and 66.98 kW for PV-penetrations of 5, 10 and 15 kW/prosumer, respectively. Lower grid losses result from the maximal DTR primary voltage, i.e., 6.60, 26.89 and 57.47 kW, for the same PV-penetrations. The use of cosφ(P)-control drastically increases the grid losses, as shown in Figure 8b. For the minimal DTR primary voltage, the losses reach 12.72, 56.62 and 176.51 kW for PV-penetrations of 5, 10 and 14.7 kW/prosumer, respectively. The maximal DTR primary voltage leads to lower losses, i.e., 10.44, 45.33 and 114.29 kW. If Q(U)-control is applied, the minimal DTR primary voltage leads to losses of 8.67, 41.01 and 93.42 kW for PV-penetrations of 5, 10 and 15 kW/prosumer, respectively, as shown in Figure 8c. The maximal DTR primary voltage leads to greater losses, i.e., 10.61, 45.03 and 98.59 kW. The use of L(U)-control provokes grid losses of 8.16, 39.47 and 90.30 kW for PV-penetrations of 5, 10 and 15 kW/prosumer, respectively, and the minimal DTR primary voltage, as shown in Figure 8d. The maximal DTR primary voltage leads to greater losses, i.e., 10.31, 42.25 and 91.26 kW. If L(U)-control is combined with Q-Autarkic prosumers, the minimal DTR primary voltage leads to grid losses of 8.22, 39.46 and 90.18 kW for PV-penetrations of 5, 10 and 15 kW/prosumer, respectively, Figure 8e. For the maximal DTR primary voltage, they reach 10.38, 42.29 and 91.15 kW, respectively.
4.1.2. Short Overhead Line Test-Feeder
Figure 9 shows the current- and voltage-related hosting capacity limits of the short overhead line test-feeder for different control strategies. Figure 9a,b show the current- and voltage-related HC limits for no-control: they occur at PV-penetrations of 12.26 and 4.90 kW/prosumer, respectively, resulting in a HC of 4.90 kW/prosumer. In the case of cosφ(P)-control, the uniform reactive power consumption of PV-plants shifts the current- and voltage-related HC limits to PV-penetrations of 10.72 and 10.70 kW/prosumer, respectively, resulting in a HC of 10.70 kW/prosumer, as shown in Figure 9c,d. Compared to the case with no-control, the use of cosφ(P)-control increases the HC of the feeder by 5.80 kW/prosumer. If Q(U)-control is applied, the uneven reactive power consumption of PV-plants shifts the current- and voltage-related HC limits to PV-penetrations of 12.02 and 12.12 kW/prosumer, respectively, resulting in a HC of 12.02 kW/prosumer, as shown in Figure 9e,f. Compared to the case with no-control, the use of Q(U)-control increases the HC of the feeder by 7.12 kW/prosumer. The use of L(U)-control shifts the current- and voltage-related HC limits to PV-penetrations of 12.26 and 12.23 kW/prosumer, respectively, resulting in a HC of 12.23 kW/prosumer, as shown in Figure 9g,h. Compared to the case with no-control, the use of L(U)-control increases the HC of the feeder by 7.33 kW/prosumer. If L(U)-control is combined with Q-Autarkic prosumers, the reactive power consumption of the inductive device and Q-Autarky of prosumers shifts the current- and voltage-related HC limits to PV-penetrations of 12.29 and 12.77 kW/prosumer, respectively, resulting in a HC of 12.29 kW/prosumer, as shown in Figure 9i,j. Compared to the case with no-control, the use of L(U)-control combined with Q-Autarkic prosumers increases the HC of the feeder by 7.39 kW/prosumer.
Figure 10 shows the grid losses of the short overhead line test-feeder for the minimal and maximal DTR primary voltages and different control strategies. If no-control or cosφ(P)-control is used, grid losses are greater for the minimal DTR primary voltage than for the maximal one, as shown in Figure 10a,b. In the case of Q(U)-, L(U)- or L(U)-control combined with Q-Autarkic prosumers, greater losses occur for the minimal DTR primary voltage and low PV-penetrations, and for the maximal DTR primary voltage and high PV-penetrations, as shown in Figure 10c–e.
Figure 10a shows the grid losses for no-control: in the presence of the minimal DTR primary voltage, the grid losses reach values of 3.16, 13.51 and 29.83 kW for PV-penetrations of 5, 10 and 15 kW/prosumer, respectively. Lower grid losses result from the maximal DTR primary voltage, i.e., 2.56, 11.23 and 25.09 kW, for the same PV-penetrations. In the case of cosφ(P)-control, the minimal DTR primary voltage leads to grid losses of 4.14, 17.74 and 40.39 kW for PV-penetrations of 5, 10 and 15 kW/prosumer, respectively, as shown in Figure 10b.
The maximal DTR primary voltage leads to lower losses, i.e., 3.39, 14.62 and 33.35 kW. If Q(U)-control is applied, the losses reach values of 3.16, 13.51 and 31.02 kW for the minimal DTR primary voltage and PV-penetrations of 5, 10 and 15 kW/prosumer, respectively, as shown in Figure 10c. The maximal DTR primary voltage leads to grid losses of 2.98, 14.62 and 34.25 kW. The use of L(U)-control provokes grid losses of 3.16, 13.51 and 30.18 kW for the minimal DTR primary voltage and PV-module ratings of 5, 10 and 15 kW/prosumer, respectively, as shown in Figure 10d. The maximal DTR primary voltage changes the losses to 2.70, 14.21 and 34.10 kW. If L(U)-control is combined with Q-Autarkic prosumers, the minimal DTR primary voltage leads to grid losses of 3.13, 13.43 and 30.19 kW for PV-penetrations of 5, 10 and 15 kW/prosumer, respectively, as shown in Figure 10e. The maximal DTR primary voltage provokes losses of 2.74, 14.37 and 34.29 kW.
4.1.3. Long Cable Test-Feeder
Figure 11 shows the current- and voltage-related hosting capacity limits of the long cable test-feeder for different control strategies. Figure 11a,b show the current- and voltage-related HC limits for no-control: they occur at PV-penetrations of 11.19 and 2.89 kW/prosumer, respectively, resulting in a HC of 2.89 kW/prosumer. In the case of cosφ(P)-control, the uniform reactive power consumption of PV-plants shifts the current- and voltage-related HC limits to PV-penetrations of 9.40 and 3.81 kW/prosumer, respectively, resulting in a HC of 3.81 kW/prosumer, as shown in Figure 11c,d. Compared to the case with no-control, the use of cosφ(P)-control increases the HC of the feeder by 0.92 kW/prosumer.
If Q(U)-control is applied, the uneven reactive power consumption of PV-plants shifts the current- and voltage-related HC limits to PV-penetrations of 10.28 and 3.81 kW/prosumer, respectively, resulting in a HC of 3.81 kW/prosumer, as shown in Figure 11e,f. Compared to the case with no-control, the use of Q(U)-control increases the HC of the feeder by 0.92 kW/prosumer. The use of L(U)-control shifts the current- and voltage-related HC limits to PV-penetrations of 9.33 and 10.20 kW/prosumer, resulting in a HC of 9.33 kW/prosumer, as shown in Figure 11g,h. Compared to the case with no-control, the use of L(U)-control increases the HC of the feeder by 6.44 kW/prosumer. If L(U)-control is combined with Q-Autarkiv prosumers, the reactive power consumption of the inductive device and Q-Autarky of prosumers shifts the current- and voltage-related HC limits to PV-penetrations of 9.41 and 10.04 kW/prosumer, respectively, resulting in a HC of 9.41 kW/prosumer, as shown in Figure 11i,j. Compared to the case with no-control, the use of L(U)-control combined with Q-Autarkic prosumers increases the HC of the feeder by 6.52 kW/prosumer. Figure 12 shows the grid losses of the long cable test-feeder for the minimal and maximal DTR primary voltages and different control strategies.
If no-control or cosφ(P)-control is used, the grid losses are greater for the minimal DTR primary voltage than for the maximal one, as shown in Figure 12a,b. If Q(U)-control is used, greater losses occur for the maximal DTR primary voltage and low PV-penetrations, and for the minimal DTR primary voltage and high PV-penetrations, as shown in Figure 12c. If L(U)- or its combination with Q-Autarkic prosumers is applied, greater losses occur for the maximal DTR primary voltage, as shown in Figure 12d,e.
Figure 12a shows the grid losses for no-control: in the presence of the minimal DTR primary voltage, the grid losses reach values of 5.39, 21.81 and 46.05 kW for PV-penetrations of 5, 10 and 15 kW/prosumer, respectively. Lower grid losses result from the maximal DTR primary voltage, i.e., 4.42, 18.44 and 39.59 kW, for the same PV-penetrations. In the case of cosφ(P)-control, the minimal DTR primary voltage leads to grid losses of 7.74, 30.74 and 65.96 kW for PV-penetrations of 5, 10 and 15 kW/prosumer, respectively, as shown in Figure 12b. The maximal DTR primary voltage leads to lower losses, i.e., 6.44, 25.94 and 56.14 kW. If Q(U)-control is applied and minimal DTR primary voltage is present, grid losses are 5.53, 27.62 and 61.65 kW for a PV-penetration of 5, 10 and 15 kW/prosumer, respectively, as shown in Figure 12c. The maximal DTR primary voltage leads to losses of 6.44, 25.94 and 56.15 kW. The use of L(U)-control provokes grid losses of 5.39, 28.47 and 78.93 kW for the minimal DTR primary voltage and PV-penetrations of 5, 10 and 15 kW/prosumer, respectively, Figure 12d. The maximal DTR primary voltage changes the losses to 11.06, 52.93 and 110.72 kW. If L(U)-control is combined with Q-Autarkic prosumers, the minimal DTR primary voltage leads to losses of 5.35, 28.80 and 79.09 kW for PV-penetrations of 5, 10 and 15 kW/prosumer, respectively, as shown in Figure 12e. The maximal DTR primary voltage changes the losses to 11.28, 53.16 and 110.84 kW.
4.1.4. Short Cable Test-Feeder
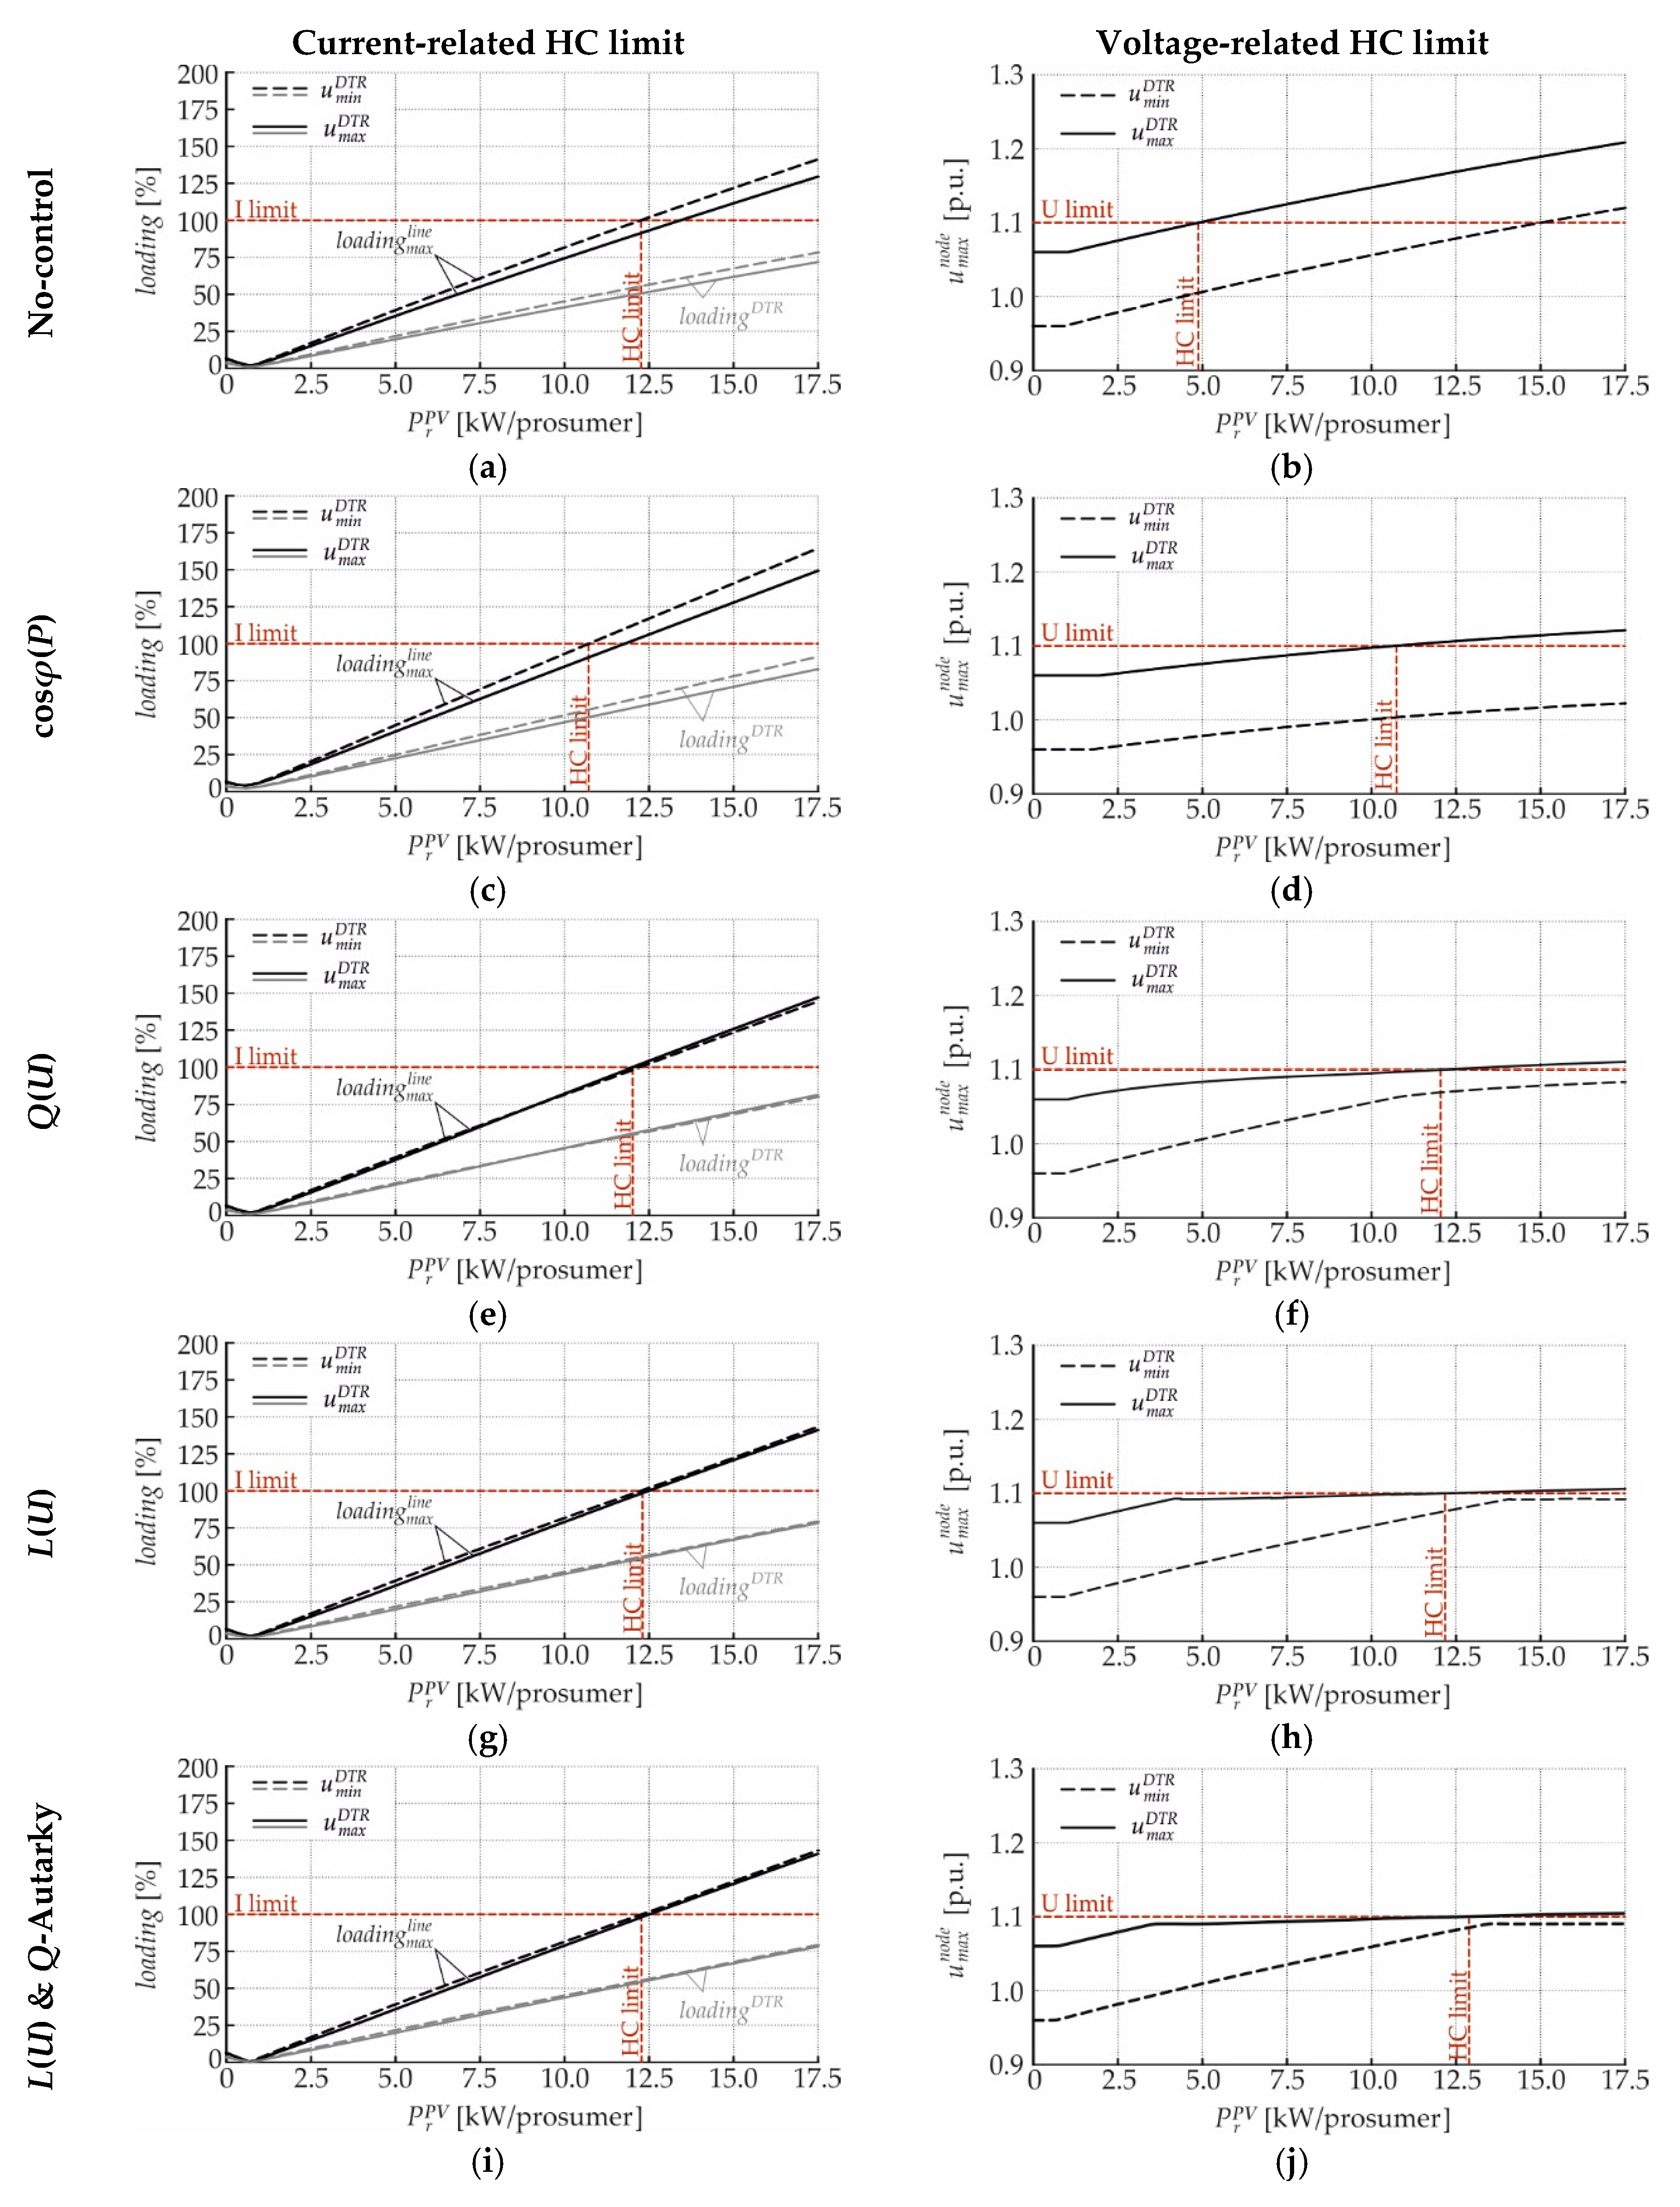
Figure 13 shows the current- and voltage-related hosting capacity limits of the short cable test-feeder for different control strategies. Figure 13a,b show the current- and voltage-related HC limits for no-control: they occur at PV-penetrations of 10.32 and 6.69 kW/prosumer, respectively, resulting in a HC of 6.69 kW/prosumer. In the case of cosφ(P)-control, the uniform reactive power consumption of PV-plants shifts the current- and voltage-related HC limits to PV-penetrations of 9.16 and 9.17 kW/prosumer, respectively, resulting in a HC of 9.16 kW/prosumer, as shown in Figure 13c,d. Compared to the case with no-control, the use of cosφ(P)-control increases the HC of the feeder by 2.47 kW/prosumer. If Q(U)-control is applied, the uneven reactive power consumption of PV-plants shifts the current- and voltage-related HC limits to PV-penetrations of 9.79 and 9.68 kW/prosumer, respectively, resulting in a HC of 9.68 kW/prosumer, as shown in Figure 13e,f. Compared to the case with no-control, the use of Q(U)-control increases the HC of the feeder by 2.99 kW/prosumer. The use of L(U)-control shifts the current- and voltage-related HC limits to PV-penetrations of 10.31 and 10.54 kW/prosumer, resulting in a HC of 10.31 kW/prosumer, as shown in Figure 13g,h. Compared to the case with no-control, the use of L(U)-control increases the HC of the feeder by 3.62 kW/prosumer. If L(U)-control is combined with Q-Autarkic prosumers, the reactive power consumption of the inductive device and Q-Autarky of prosumers shifts the current- and voltage-related HC limits to PV-penetrations of 10.33 and 10.43 kW/prosumer, respectively, resulting in a HC of 10.33 kW/prosumer, as shown in Figure 13i,j. Compared to the case with no-control, the use of L(U)-control combined with Q-Autarkic prosumers increases the HC of the feeder by 3.64 kW/prosumer.
Figure 14 shows the grid losses of the short cable test-feeder for the minimal and maximal DTR primary voltages and different control strategies. If no-control or cosφ(P)-control is used, the grid losses are greater for the minimal DTR primary voltage than for the maximal one, as shown in Figure 14a,b. If Q(U)-control is used, greater losses occur for the maximal DTR primary voltage, as shown in Figure 14c. In the case of L(U)-control or its combination with Q-Autarkic prosumers, greater losses occur for the minimal DTR primary voltage and low PV-penetrations, and for the maximal DTR primary voltage and high PV-penetrations, as shown in Figure 14d,e.
Figure 14a shows the grid losses for no-control: in the presence of the minimal DTR primary voltage, the grid losses reach values of 2.12, 9.26 and 20.71 kW for PV-penetrations of 5, 10 and 15 kW/prosumer, respectively. Lower grid losses result from the maximal DTR primary voltage, i.e., 1.72, 7.65 and 17.31 kW, for the same PV-penetrations. In the case of cosφ(P)-control, the minimal DTR primary voltage leads to grid losses of 2.79, 11.81 and 26.47 kW for PV-penetrations of 5, 10 and 15 kW/prosumer, respectively, as shown in Figure 14b. The maximal DTR primary voltage leads to lower losses, i.e., 2.29, 9.78 and 22.06 kW. If Q(U)-control is applied, the losses are 2.12, 9.26 and 21.57 kW for the minimal DTR primary voltage and PV-penetrations of 5, 10 and 15 kW/prosumer, respectively, as shown in Figure 14c. The maximal DTR primary voltage leads to losses of 2.43, 10.34 and 23.31 kW. The use of L(U)-control provokes grid losses of 2.12, 9.26 and 20.71 kW for the minimal DTR primary voltage and PV-penetrations of 5, 10 and 15 kW/prosumer, respectively, as shown in Figure 14d. The maximal DTR primary voltage changes the grid losses to 1.72, 10.76 and 32.45 kW. If L(U)-control is combined with Q-Autarkic prosumers, the minimal DTR primary voltage leads to grid losses of 2.11, 9.23 and 20.67 kW for PV-penetrations of 5, 10 and 15 kW/prosumer, respectively, as shown in Figure 14e. The maximal DTR primary voltage changes the grid losses to 1.70, 10.79 and 32.47 kW.
4.2. Real LV Test-Feeder
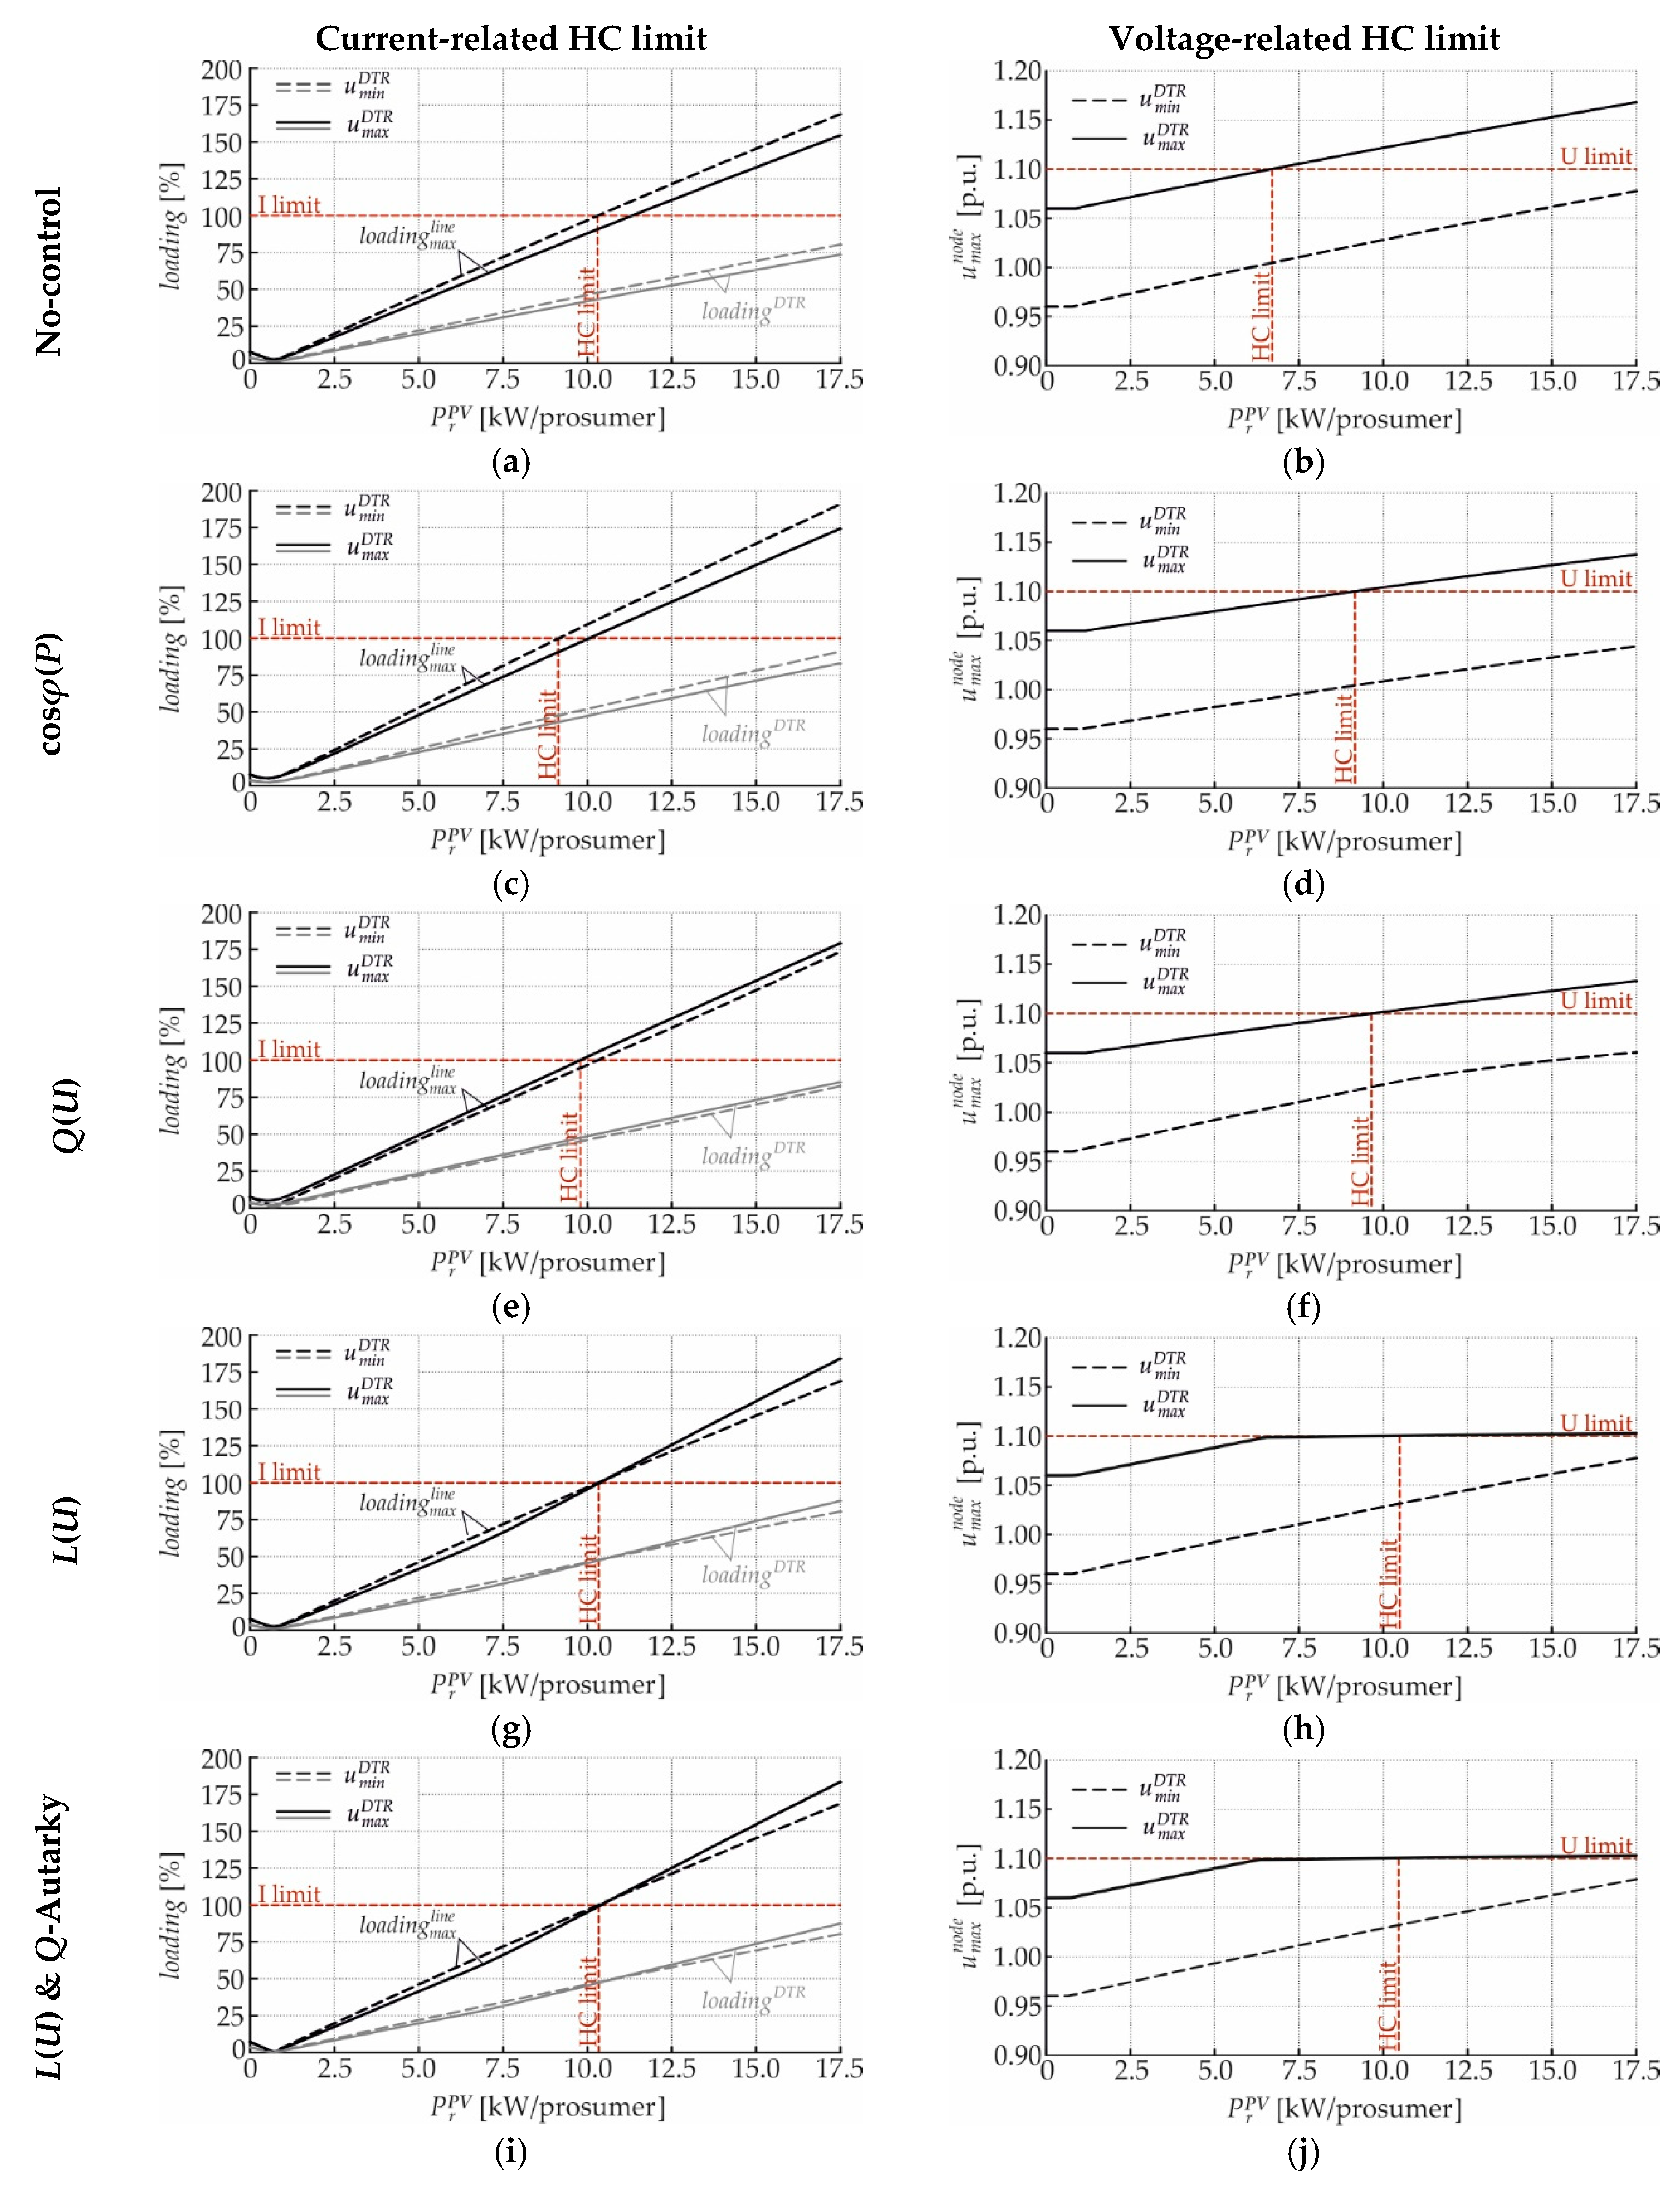
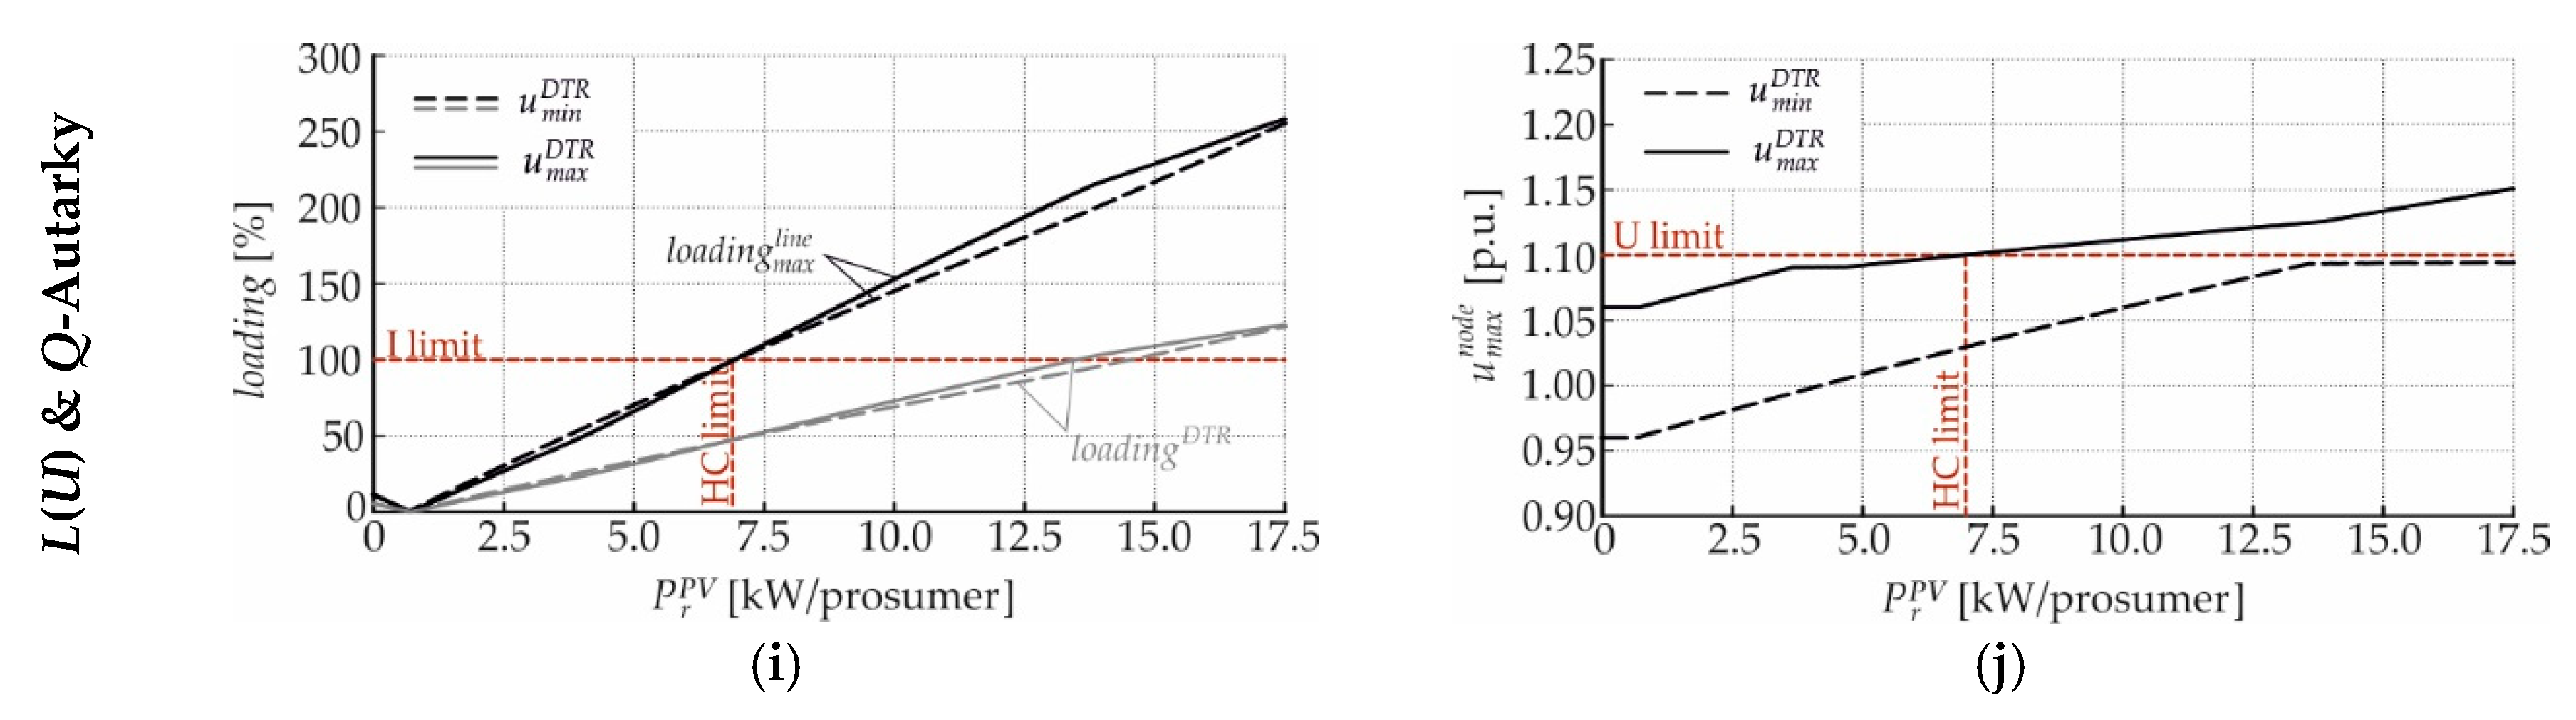
Figure 15 shows the current- and voltage-related hosting capacity limits of the branched cable test-feeder for different control strategies. Figure 15a,b show the current- and voltage-related HC limits for no-control: they occur at PV-penetrations of 6.93 and 4.79 kW/prosumer, respectively, resulting in a HC of 4.79 kW/prosumer. In the case of cosφ(P)-control, the uniform reactive power consumption of PV-plants shifts the current- and voltage-related HC limits to PV-penetrations of 6.26 and 6.25 kW/prosumer, respectively, resulting in a HC of 6.25 kW/prosumer, as shown in Figure 15c,d.
Compared to the case with no-control, the use of cosφ(P)-control increases the HC of the feeder by 1.46 kW/prosumer. If Q(U)-control is applied, the uneven reactive power consumption of PV-plants shifts the current- and voltage-related HC limits to PV-penetrations of 6.67 and 6.69 kW/prosumer, respectively, resulting in a HC of 6.67 kW/prosumer, as shown in Figure 15e,f. Compared to the case with no-control, the use of Q(U)-control increases the HC of the feeder by 1.88 kW/prosumer. The use of L(U)-control shifts the current- and voltage-related HC limits to PV-penetrations of 6.93 and 6.94 kW/prosumer, resulting in a HC of 6.93 kW/prosumer, as shown in Figure 15g,h. Compared to the case with no-control, the use of L(U)-control increases the HC of the feeder by 2.14 kW/prosumer. If L(U)-control is combined with Q-Autarkic prosumers, the reactive power consumption of the inductive device and Q-Autarky of prosumers shifts the current- and voltage-related HC limits to PV-penetrations of 6.94 and 6.93 kW/prosumer, respectively, resulting in a HC of 6.93 kW/prosumer, as shown in Figure 15i,j. Compared to the case with no-control, the use of L(U)-control combined with Q-Autarkic prosumers increases the HC of the feeder by 2.14 kW/prosumer.
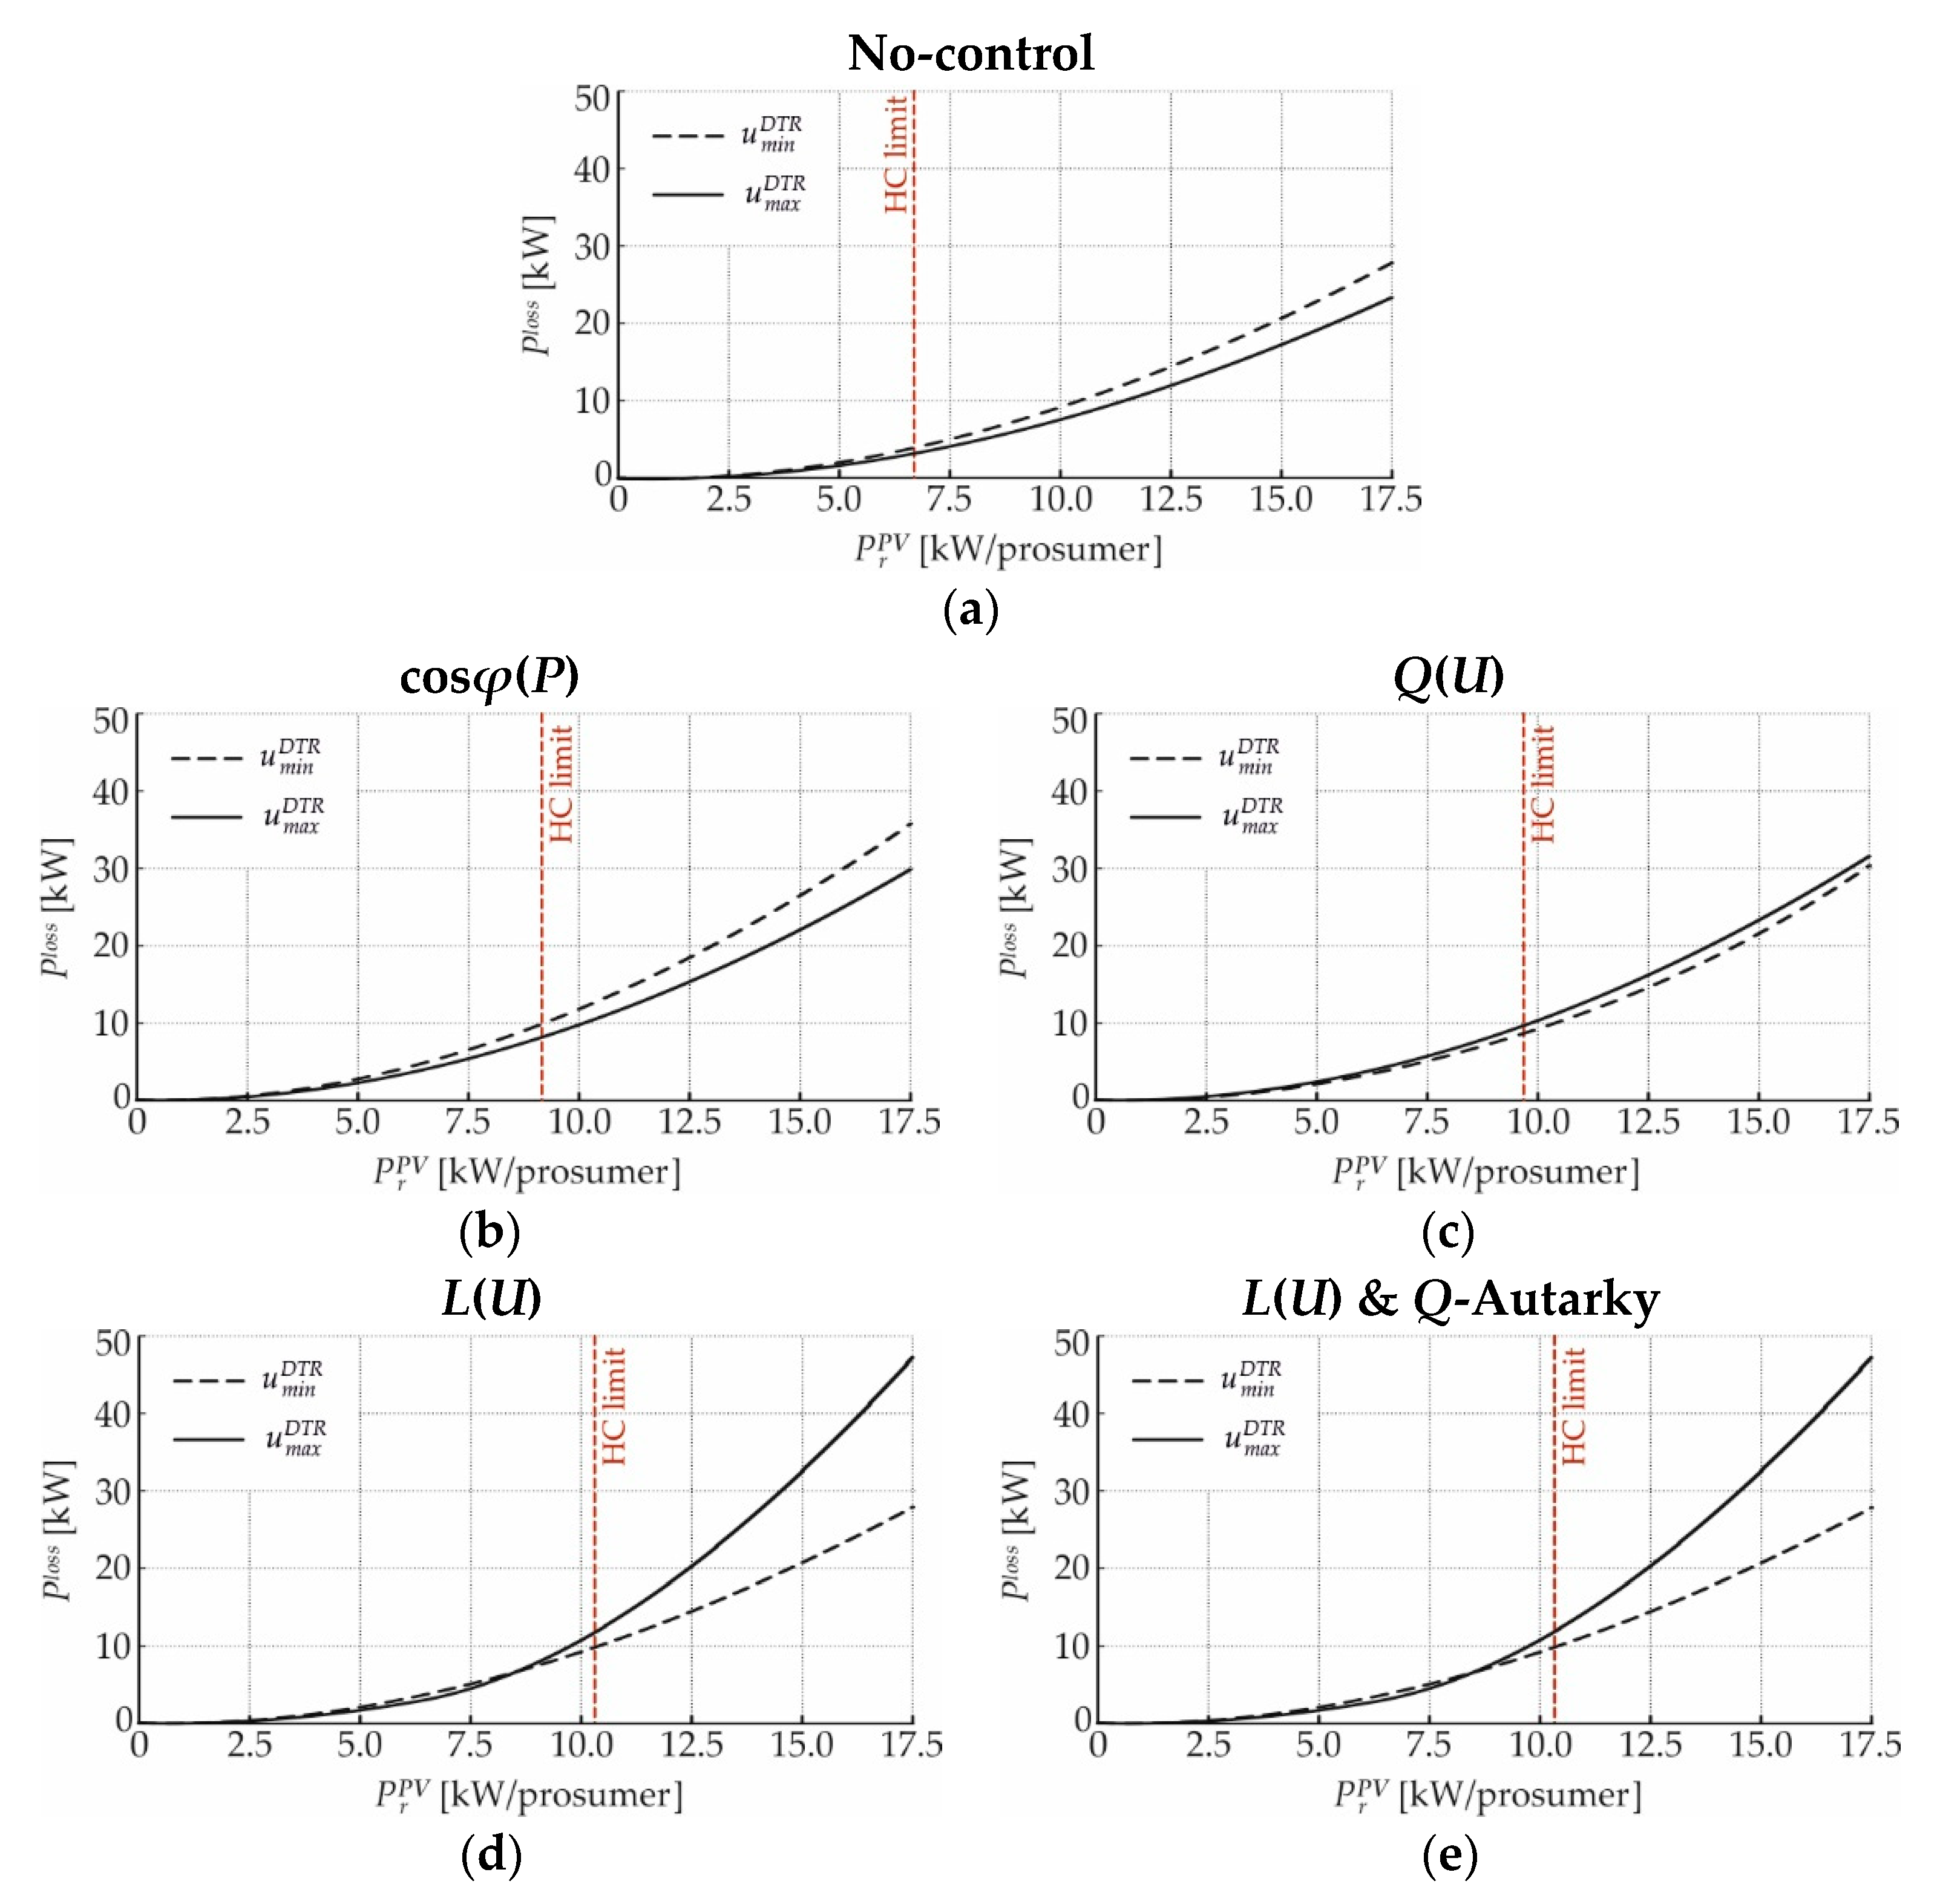
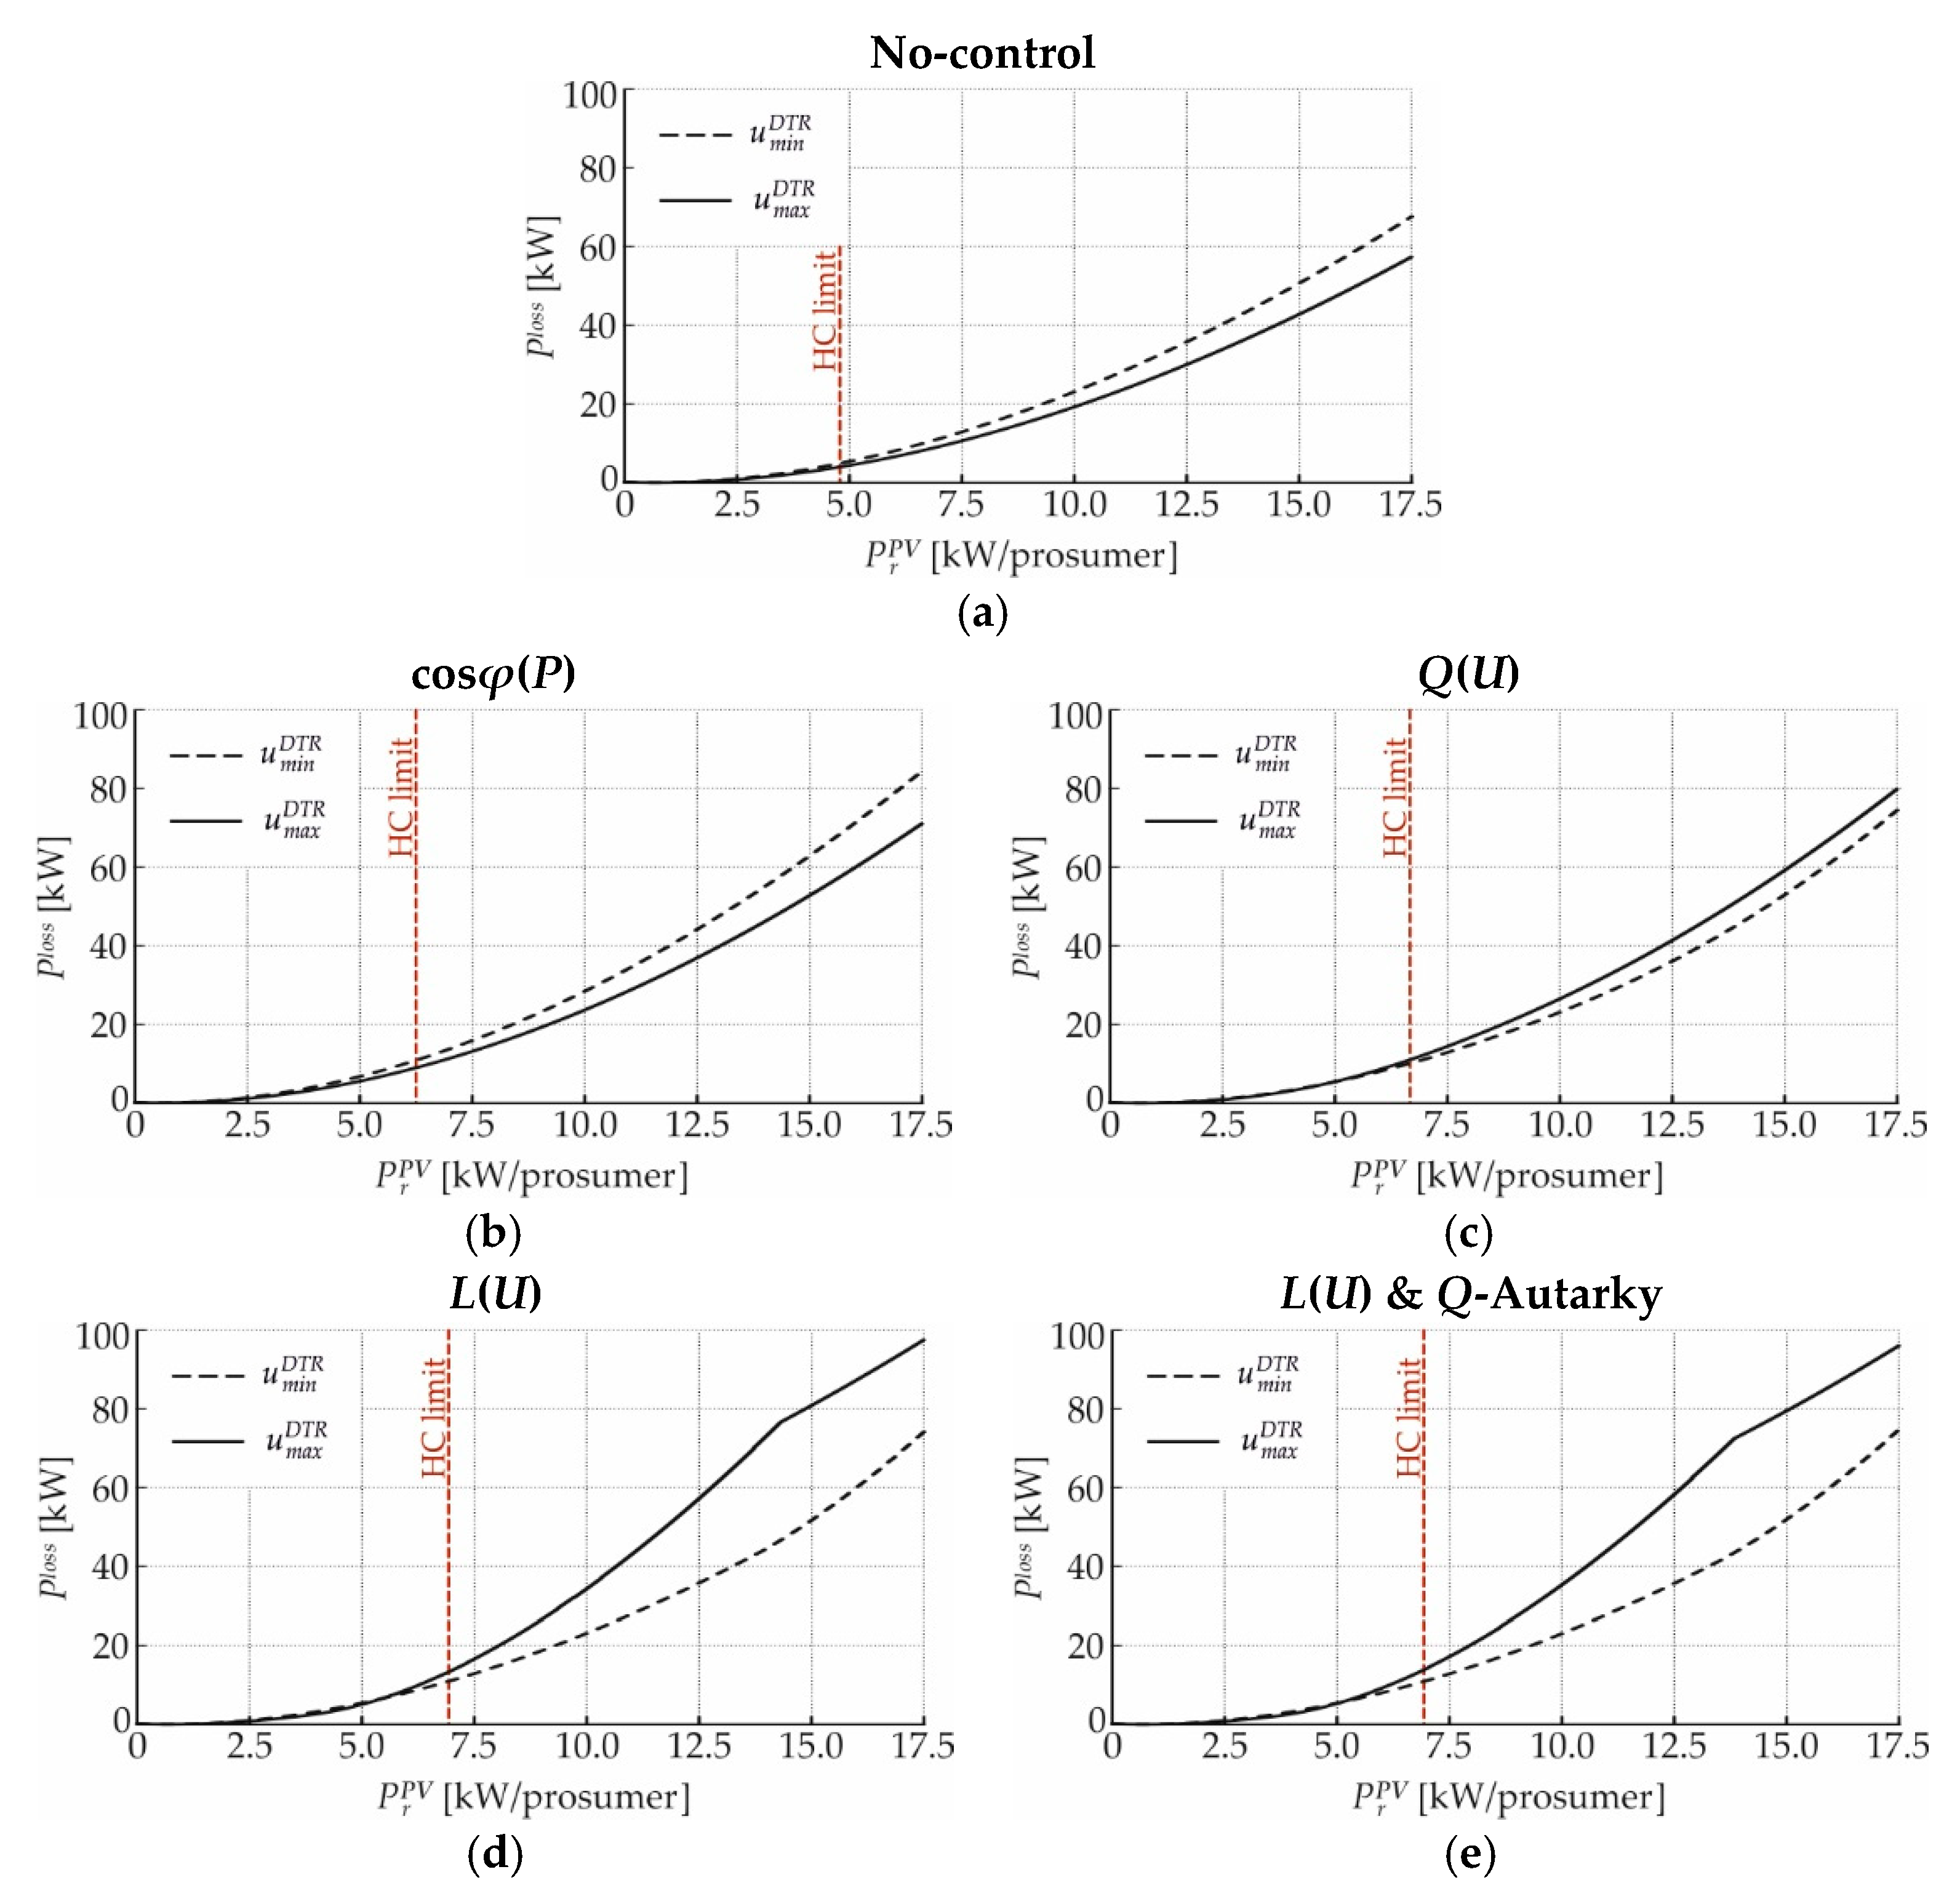
Figure 16 shows the grid losses of the branched cable test-feeder for the minimal and maximal DTR primary voltages and different control strategies.
If no-control or cosφ(P)-control is used, the grid losses are greater for the minimal DTR primary voltage than for the maximal one, as shown in Figure 16a,b. In case of Q(U)-, L(U)-control or its combination with Q-Autarkic prosumers, greater losses occur for the minimal DTR primary voltage and low PV-penetrations, and for the maximal DTR primary voltage and high PV-penetrations, as shown in Figure 16c–e.
Figure 16a shows the grid losses for no-control: in the presence of the minimal DTR primary voltage, the grid losses reach values of 5.43, 23.13 and 50.70 kW for PV-penetrations of 5, 10 and 15 kW/prosumer, respectively. Lower grid losses result from the maximal DTR primary voltage, i.e., 4.42, 19.27 and 42.81 kW, for the same PV-penetrations. In the case of cosφ(P)-control, the minimal DTR primary voltage leads to grid losses of 6.80, 28.46 and 62.89 kW for PV-penetrations of 5, 10 and 15 kW/prosumer, respectively, as shown in Figure 16b. The maximal DTR primary voltage leads to lower losses, i.e., 5.59, 23.70 and 52.81 kW. If Q(U)-control is applied, the losses are 5.43, 23.13 and 52.99 kW for the minimal DTR primary voltage and PV-penetrations of 5, 10 and 15 kW/prosumer, respectively, as shown in Figure 16c. The maximal DTR primary voltage leads to losses of 5.47, 26.53 and 59.24 kW. The use of L(U)-control provokes grid losses of 5.43, 23.13 and 51.70 kW for the minimal DTR primary voltage and PV-penetrations of 5, 10 and 15 kW/prosumer, respectively, as shown in Figure 16d. The maximal DTR primary voltage changes the grid losses to 5.08, 34.32 and 80.89 kW. If L(U)-control is combined with Q-Autarkic prosumers, the minimal DTR primary voltage leads to grid losses of 5.40, 23.04 and 51.97 kW for PV-penetrations of 5, 10 and 15 kW/prosumer, respectively, as shown in Figure 16e. The maximal DTR primary voltage changes the grid losses to 5.32, 35.31 and 79.54 kW.
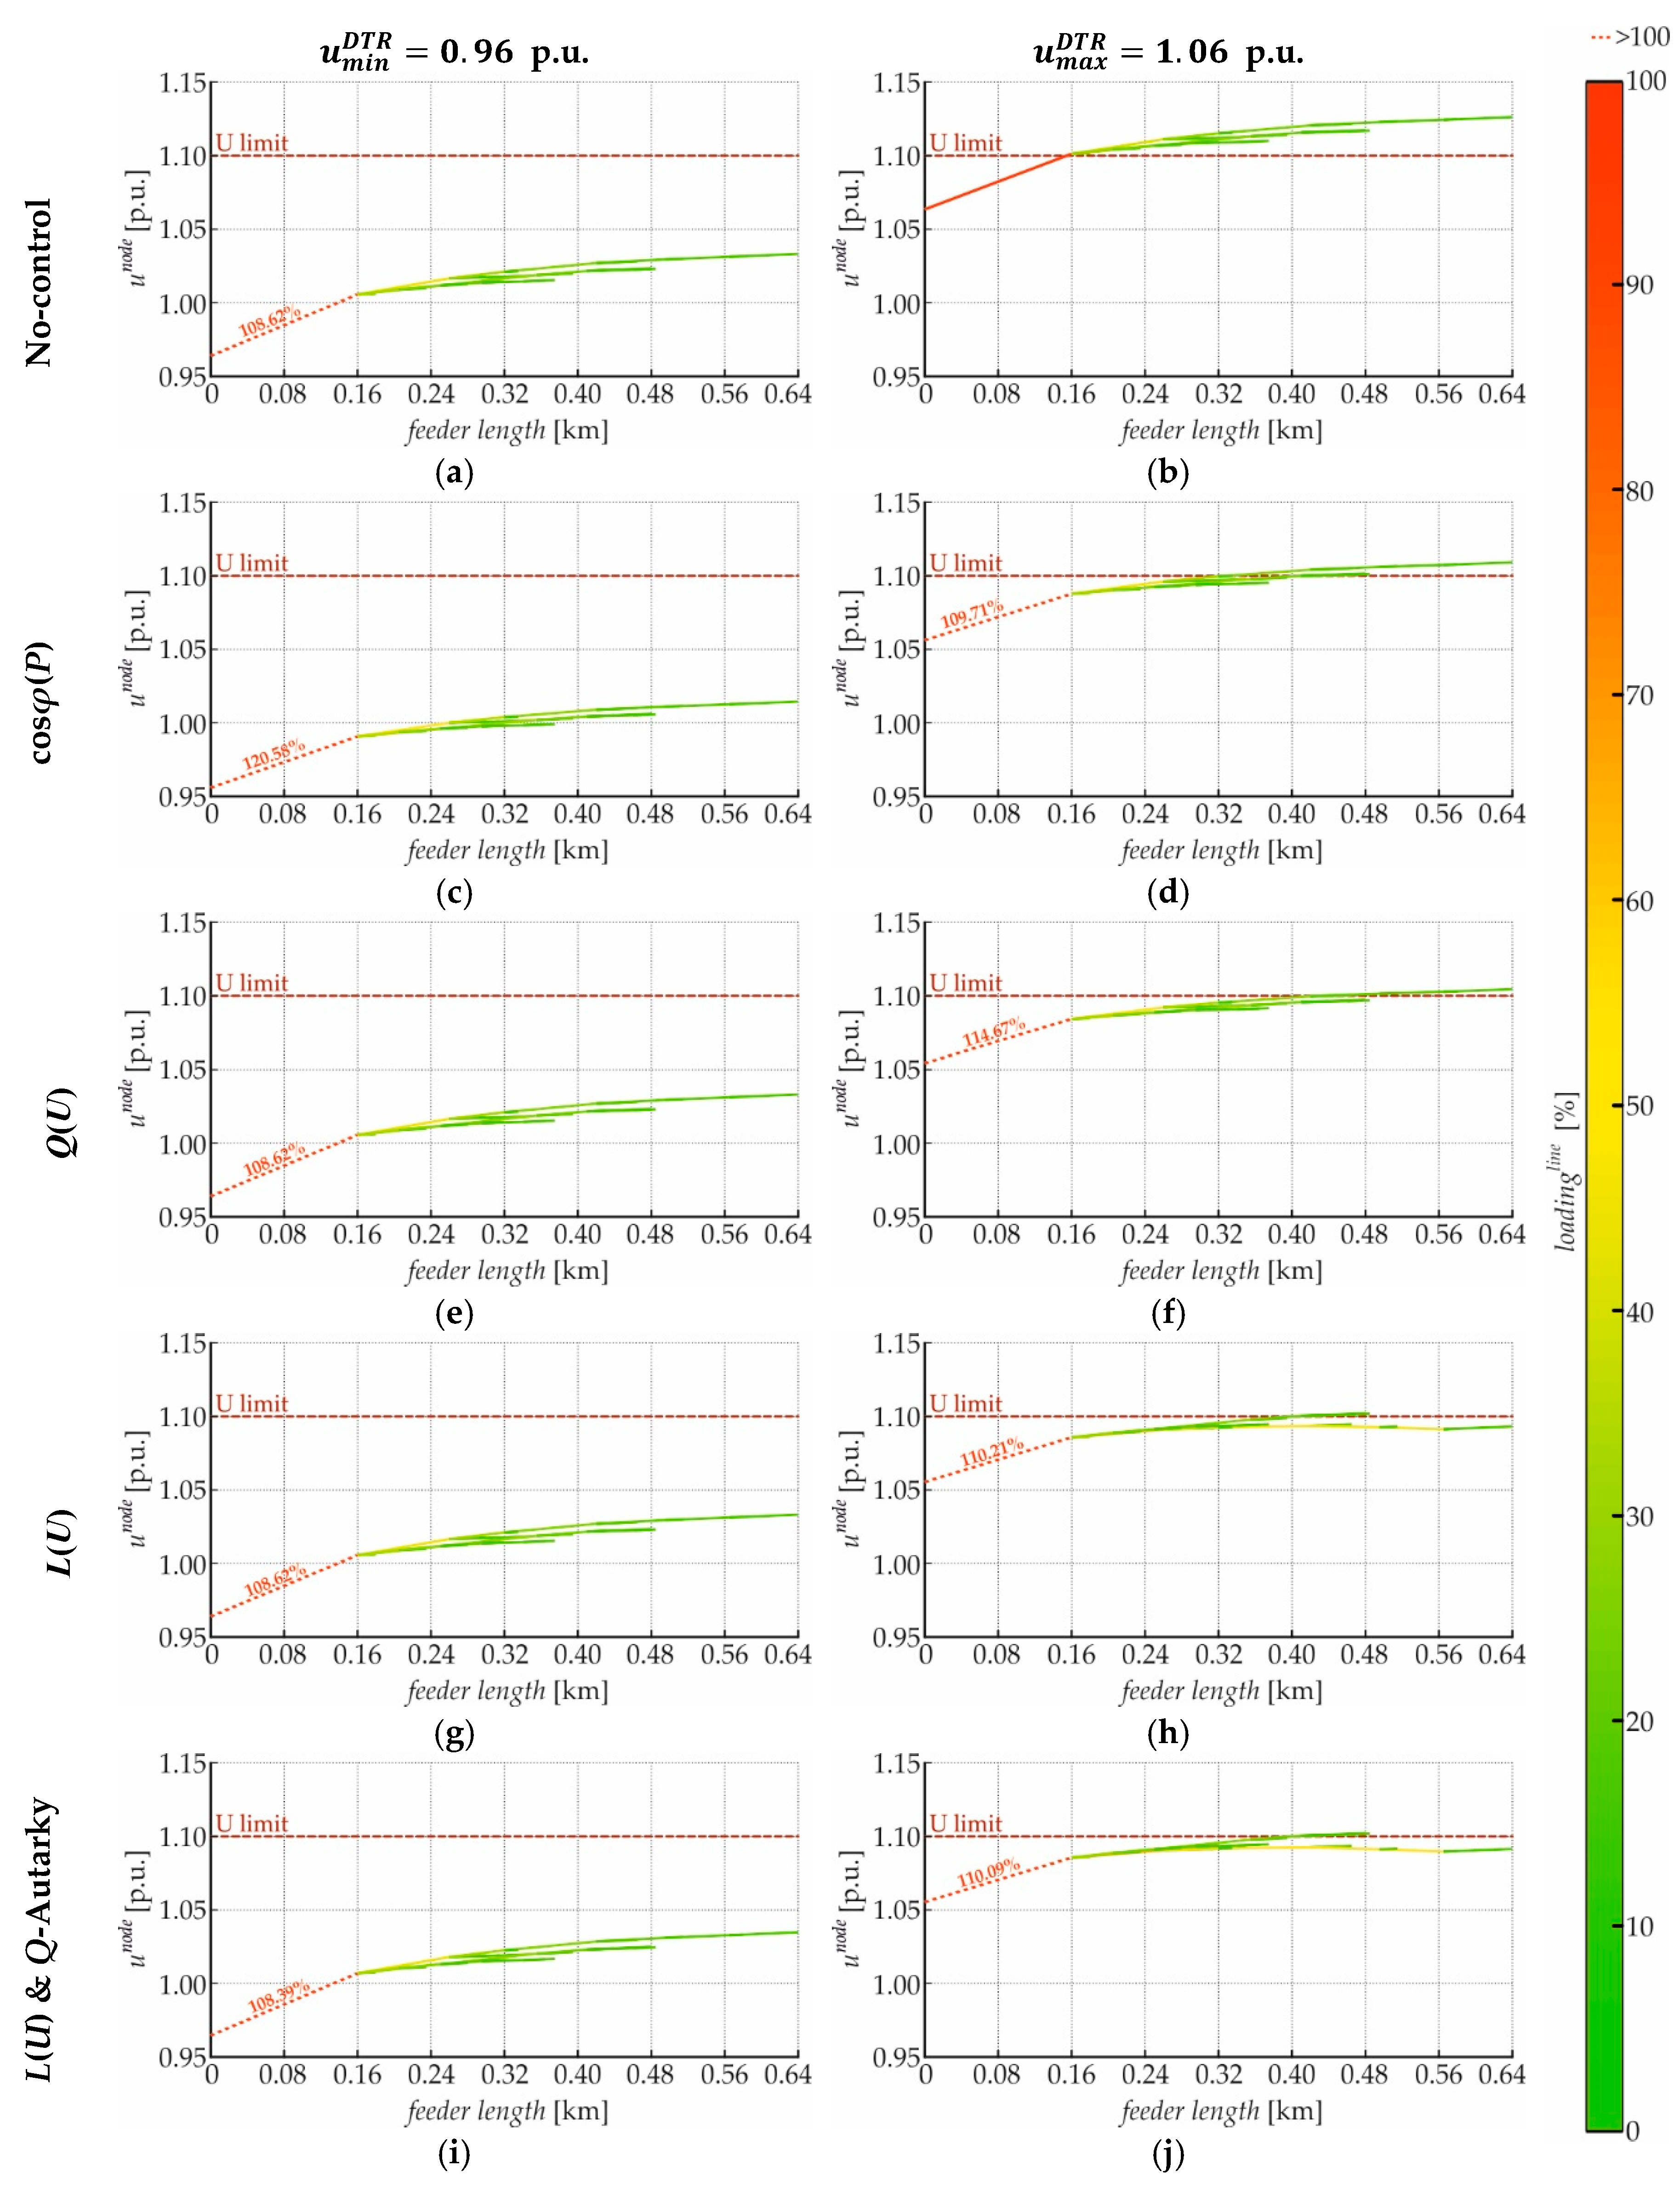
Figure 17 shows the voltage and current profiles of the branched cable test-feeder for a PV-penetration of 7.5 kW/prosumer, the minimal and maximal DTR primary voltages, and different control strategies. In all cases, the line segment loading decreases monotonically along the feeder. No voltage limits are violated for the minimal DTR primary voltage, but for the maximal one, the upper voltage limit is violated for all control strategies.
Figure 17a,b shows the voltage and current profiles for no-control. For the minimal DTR primary voltage, one line segment is overloaded by 108.62% and for the maximal one, no line segment is overloaded. For the minimal and maximal DTR primary voltages, cosφ(P)-control suppresses the voltages of the complete feeder significantly, overloading one line segment by 120.58 and 109.71%, respectively, as shown in Figure 17c,d. Figure 17e shows the case with Q(U)-control and the minimal DTR primary voltage. In this case, the feeder voltages are not suppressed, resulting in the same grid behavior as with no-control. For the maximal DTR primary voltage, the voltages of the complete feeder are significantly decreased, provoking an overloading of one line segment by 114.67%, as shown in Figure 17f. If L(U)-control is applied, the voltages are not suppressed for the minimal DTR primary voltage, resulting in the same grid behavior as with no-control, as shown in Figure 17g. For the maximal one, as shown in Figure 17h, L(U)-control decreases the voltages of the feeder’s main arm significantly, and those of the side arms moderately, leading to an overloading of one line segment by 110.21%. For the minimal DTR primary voltage, the combination of L(U)-control with Q-Autarkic prosumers increases the feeder voltages and unloads the first line segment slightly, resulting in an overloading of one line segment by 108.39%, as shown in Figure 17i. In the presence of the maximal DTR primary voltage, as shown in Figure 17j, the voltages of the feeder’s main arm are significantly decreased, and those of the side arms are moderately decreased, leading to an overloading of one line segment by 110.09%.
4.3. Overview
The potential of the different local Volt/var control strategies to increase the PV hosting capacity and the associated grid losses differ for the considered test-feeders. The overhead line segments have higher specific inductive reactances than the cable ones (cf. Table A1), and the lengths of the short and long test-feeders differ. Therefore, the control-related reactive power flows especially impact the voltages of both overhead line test-feeders, and the losses of both long test-feeders.
4.3.1. Current- and Voltage-Related Hosting Capacity Limits
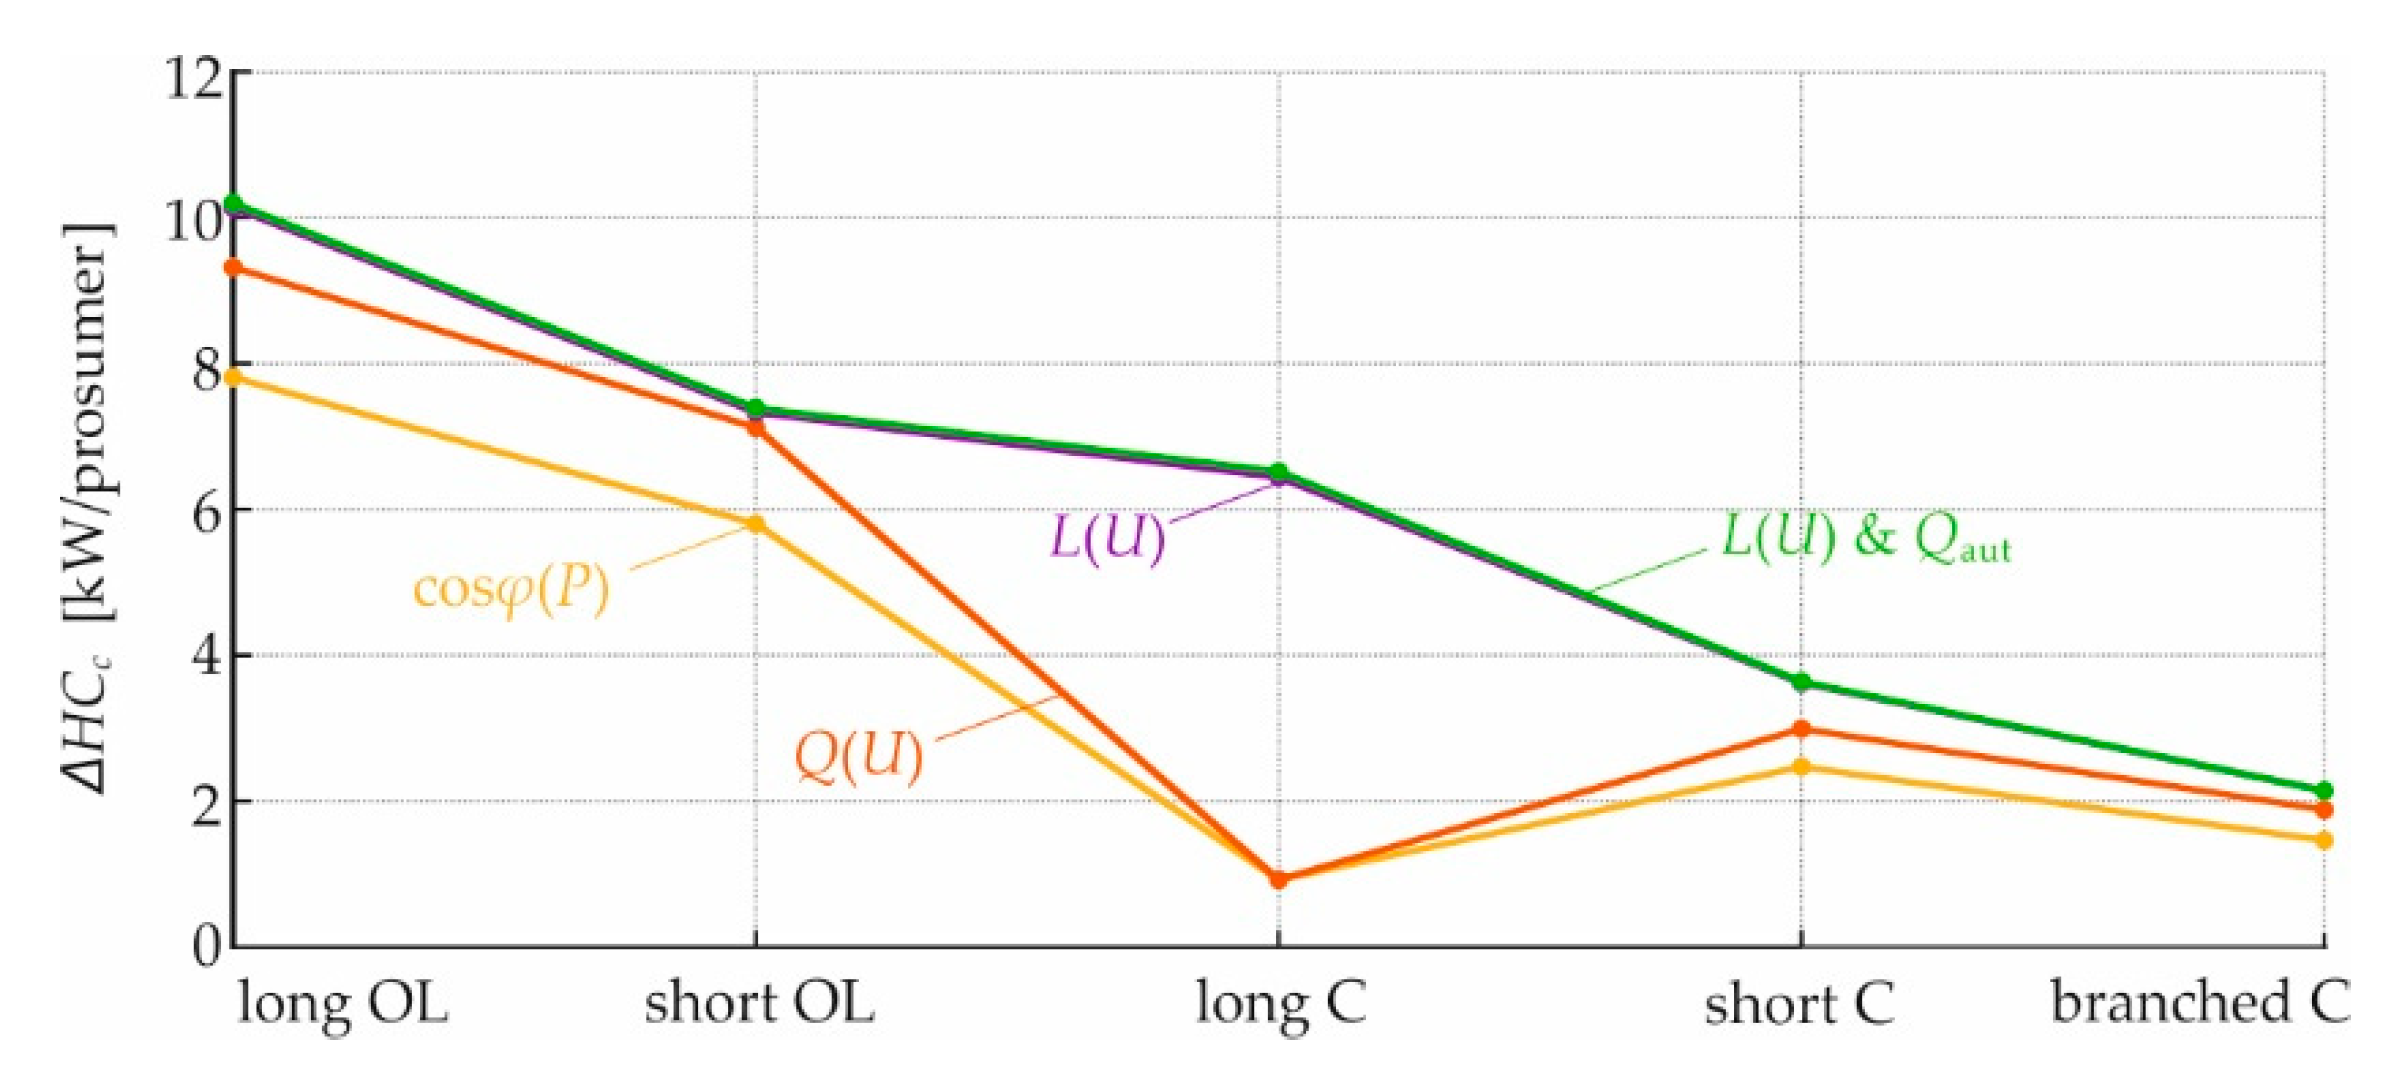
In general, the distributed Q-consumption of cosφ(P)- or Q(U)-controlled PV-plants extensively loads the line segments close to the DTR. Meanwhile, the concentrated Q-consumption of L(U)-controlled inductive devices provokes a moderate loading of all line segments. Its combination with Q-Autarkic prosumers further unloads the line segments close to the DTR. Figure 18 shows the HC increase of each Volt/var control strategy for each LV test-feeder.
In general, all of the Volt/var control strategies achieve relatively high HC increases of the overhead line feeders, and lower ones of the cable feeders. Local L(U)-control, especially its combination with Q-Autarkic prosumers, enables the highest HC increases of all LV test-feeders. The differences between L(U)-control and its combination with Q-Autarkic prosumers are very small due to the minimal load scenario that is used for the simulations. The PV-inverter-based local Volt/var control strategies, i.e., Q(U)- and cosφ(P)-control, enable lower HC increases; in particular, cosφ(P)-control causes very low HC increases of the different LV test-feeders due to the high additional currents. The difference between L(U)-control (with or without Q-Autarkic prosumers) and both PV-inverter-based control strategies is especially noticeable at the long cable test-feeder: while L(U)-control and its combination with Q-Autarkic prosumers increase the HC by 6.44 and 6.52 kW/prosumer, respectively, Q(U)- and cosφ(P)-control achieve a small HC increase of 0.92 kW/prosumer. Due to their comparable structure, the same trend concerning the HC increase prevails for the real branched cable test-feeder as for the theoretical short cable one.
4.3.2. Grid Losses
The grid losses are influenced by the different control strategies. On the one hand, for certain power flows, the losses decrease with an increasing grid voltage, resulting in high losses for low grid voltages. On the other hand, the reactive power consumption of Q(U)- and L(U)-controlled devices increases with an increasing grid voltage, resulting in high losses for high grid voltages. Both effects are present, as reflected in the results. However, losses are shown for the maximal PV production that is present only for a short time period per day.
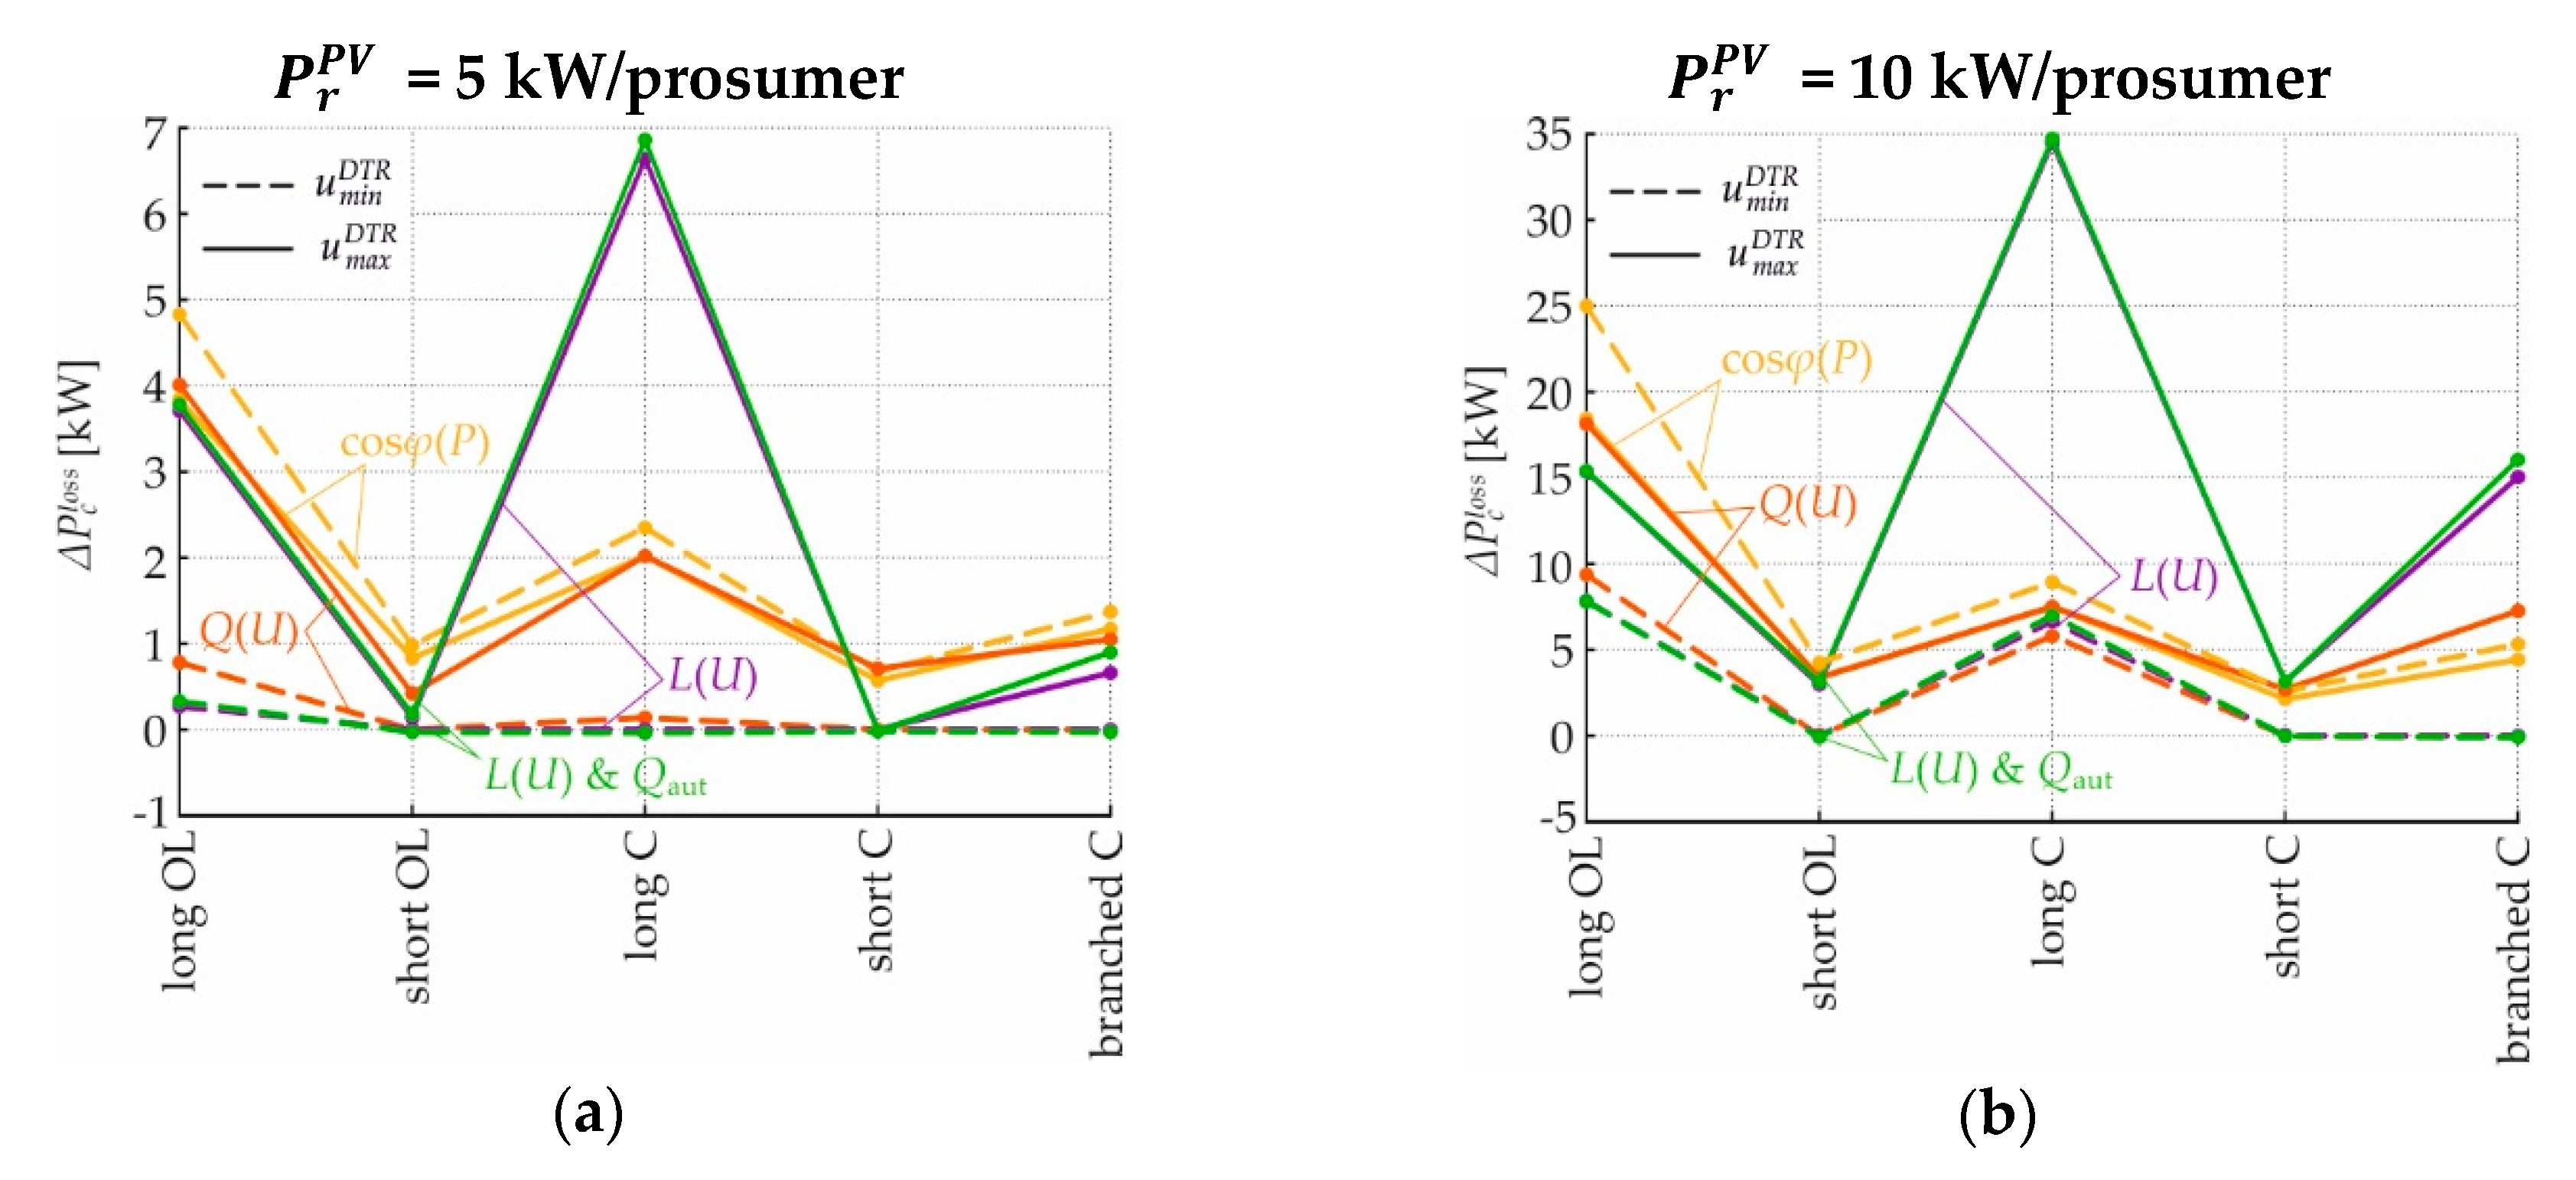
Figure 19 shows the additional grid losses provoked by different control strategies for the minimal and maximal DTR primary voltages, different LV test-feeders and different PV-penetrations. Due to their voltage-independent Q-consumption, cosφ(P)-controlled PV-plants cause greater additional grid losses for the minimal DTR primary voltage than for the maximal one. Q(U)-, L(U)- and L(U)-control combined with Q-Autarkic prosumers provoke higher additional losses for the maximal DTR primary voltage than for the minimal one, due to the associated voltage dependent reactive power absorptions. Figure 19a,b show the additional grid losses for a PV-penetration of 5 and 10 kW/prosumer, respectively. For both overhead line test-feeders, cosφ(P)- and Q(U)-control cause higher additional grid losses than L(U)-control and its combination with Q-Autarkic prosumers. This trend prevails for the long cable feeder with a PV-penetration of 5 kW/prosumer and the minimal DTR primary voltage. However, for the cable test-feeders, in many cases L(U)-control and its combination with Q-Autarkic prosumers cause higher additional losses than cosφ(P)- and Q(U)-control. Despite their comparable structure, the trend concerning grid losses differs for the real branched cable test-feeder and the theoretical short cable one: L(U)-control, especially its combination with Q-Autarkic prosumers, provokes higher additional losses for the branched cable feeder than indicated by the results of the short cable one. This is due to the fact, that lower voltage set-points (cf. Table A2) are used for L(U)-control to avoid voltage limit violations of the feeder’s side arms (cf. Figure 2). However, although it is not considered in this study, this problem can be avoided by placing a L(U)-controlled inductive device at the end of each side arm.
5. Conclusions
The investigated local Volt/var control strategies possess different potentials to increase the PV hosting capacity of radial low voltage feeders and differently impact the occurring grid losses. By absorbing reactive power, they release the voltage bottleneck but tighten the current one, provoking additional grid losses. Simulation results of the theoretical test-feeders with homogeneously distributed PV-plants show that the HC increase potential of all local Volt/var control strategies is higher for the overhead line feeders than for the cable ones. Local L(U)-control, especially its combination with Q-Autarkic prosumers, enables the highest HC increases of all LV test-feeders. The PV-inverter-based local Volt/var control strategies, i.e., Q(U)- and cosφ(P)-control, enable lower HC increases; in particular, cosφ(P)-control causes the lowest HC increases of the different LV test-feeders due to the high additional currents. Local Q(U)- and cosφ(P)-control of PV-inverters are not sufficient to increase the HC of the long cable test-feeder significantly. In contrast, L(U)-control and its combination with Q-Autarkic prosumers are sufficient; in return, they provoke high additional grid losses during peak PV production, which is present only for a short time period per day. Meanwhile, local Q(U)- and especially cosφ(P)-control cause high additional grid losses for the overhead line test-feeders. Regarding the real test-feeder with heterogeneously distributed PV-plants, on the one hand, the same trend concerning the HC increase prevails for the real branched cable test-feeder as for the theoretical short cable one. On the other hand, higher losses occur for the branched feeder in the case of L(U)-control and its combination with Q-Autarkic prosumers, due to the lower voltage set-points that have to be used for the inductive devices. All in all, the use of local L(U)-control, whether combined with Q-Autarkic prosumers or not, enables the effective and complete utilization of the existing radial low voltage feeders.
Funding
This research received no external funding.
Acknowledgments
The author acknowledges the TU Wien University Library for financial support through its Open Access Funding Programme.
Conflicts of Interest
The author declares no conflict of interest.
Appendix A
Table A1 shows the parameters used for the overhead lines and cables of the LV test-feeders. The “main branches” are drawn with a thick line in Figure 1 and Figure 2, while the “sub branches” are drawn with a thin one.

Table A1.
Line parameters of LV test-feeders.
| Line Type | Branch Type | Profile [mm2] | R′ [Ohm/km] | X′ [Ohm/km] | C′ [nF/km] | |
|---|---|---|---|---|---|---|
| Overhead line | Main branch | 95 | 0.3264 | 0.3557 | 0.0000 | 320 |
| Overhead line | Sub branch | 50 | 0.6152 | 0.3764 | 0.0000 | 210 |
| Cable | Main branch | 150 | 0.2060 | 0.0800 | 1040.0 | 275 |
| Cable | Sub branch | 50 | 0.6410 | 0.0850 | 720.00 | 145 |
is the specific resistance, is the specific inductive reactance, is the specific capacitance, and is the thermal current limit.
Appendix B
Table A2 shows the control parameters used for the different LV test-feeders and control strategies.
Table A2.
Control parameters for the different LV test-feeders and control strategies.
| Test-Feeder | cosφ(P) cosφmin | Q(U) uc [%] | L(U) uset-point [%] | L(U) & Qaut uset-point [%] | |
|---|---|---|---|---|---|
| theoretical | Long OL | 0.905 | 103.20 | 106.70 | 106.40 |
| Short OL | 0.932 | 106.30 | 109.18 | 108.97 | |
| Long C | 0.900 | 103.00 | 108.70 | 108.60 | |
| Short C | 0.920 | 103.30 | 109.88 | 109.88 | |
| real | Branched C | 0.939 | 106.40 | 109.15 | 108.97 |
Appendix C
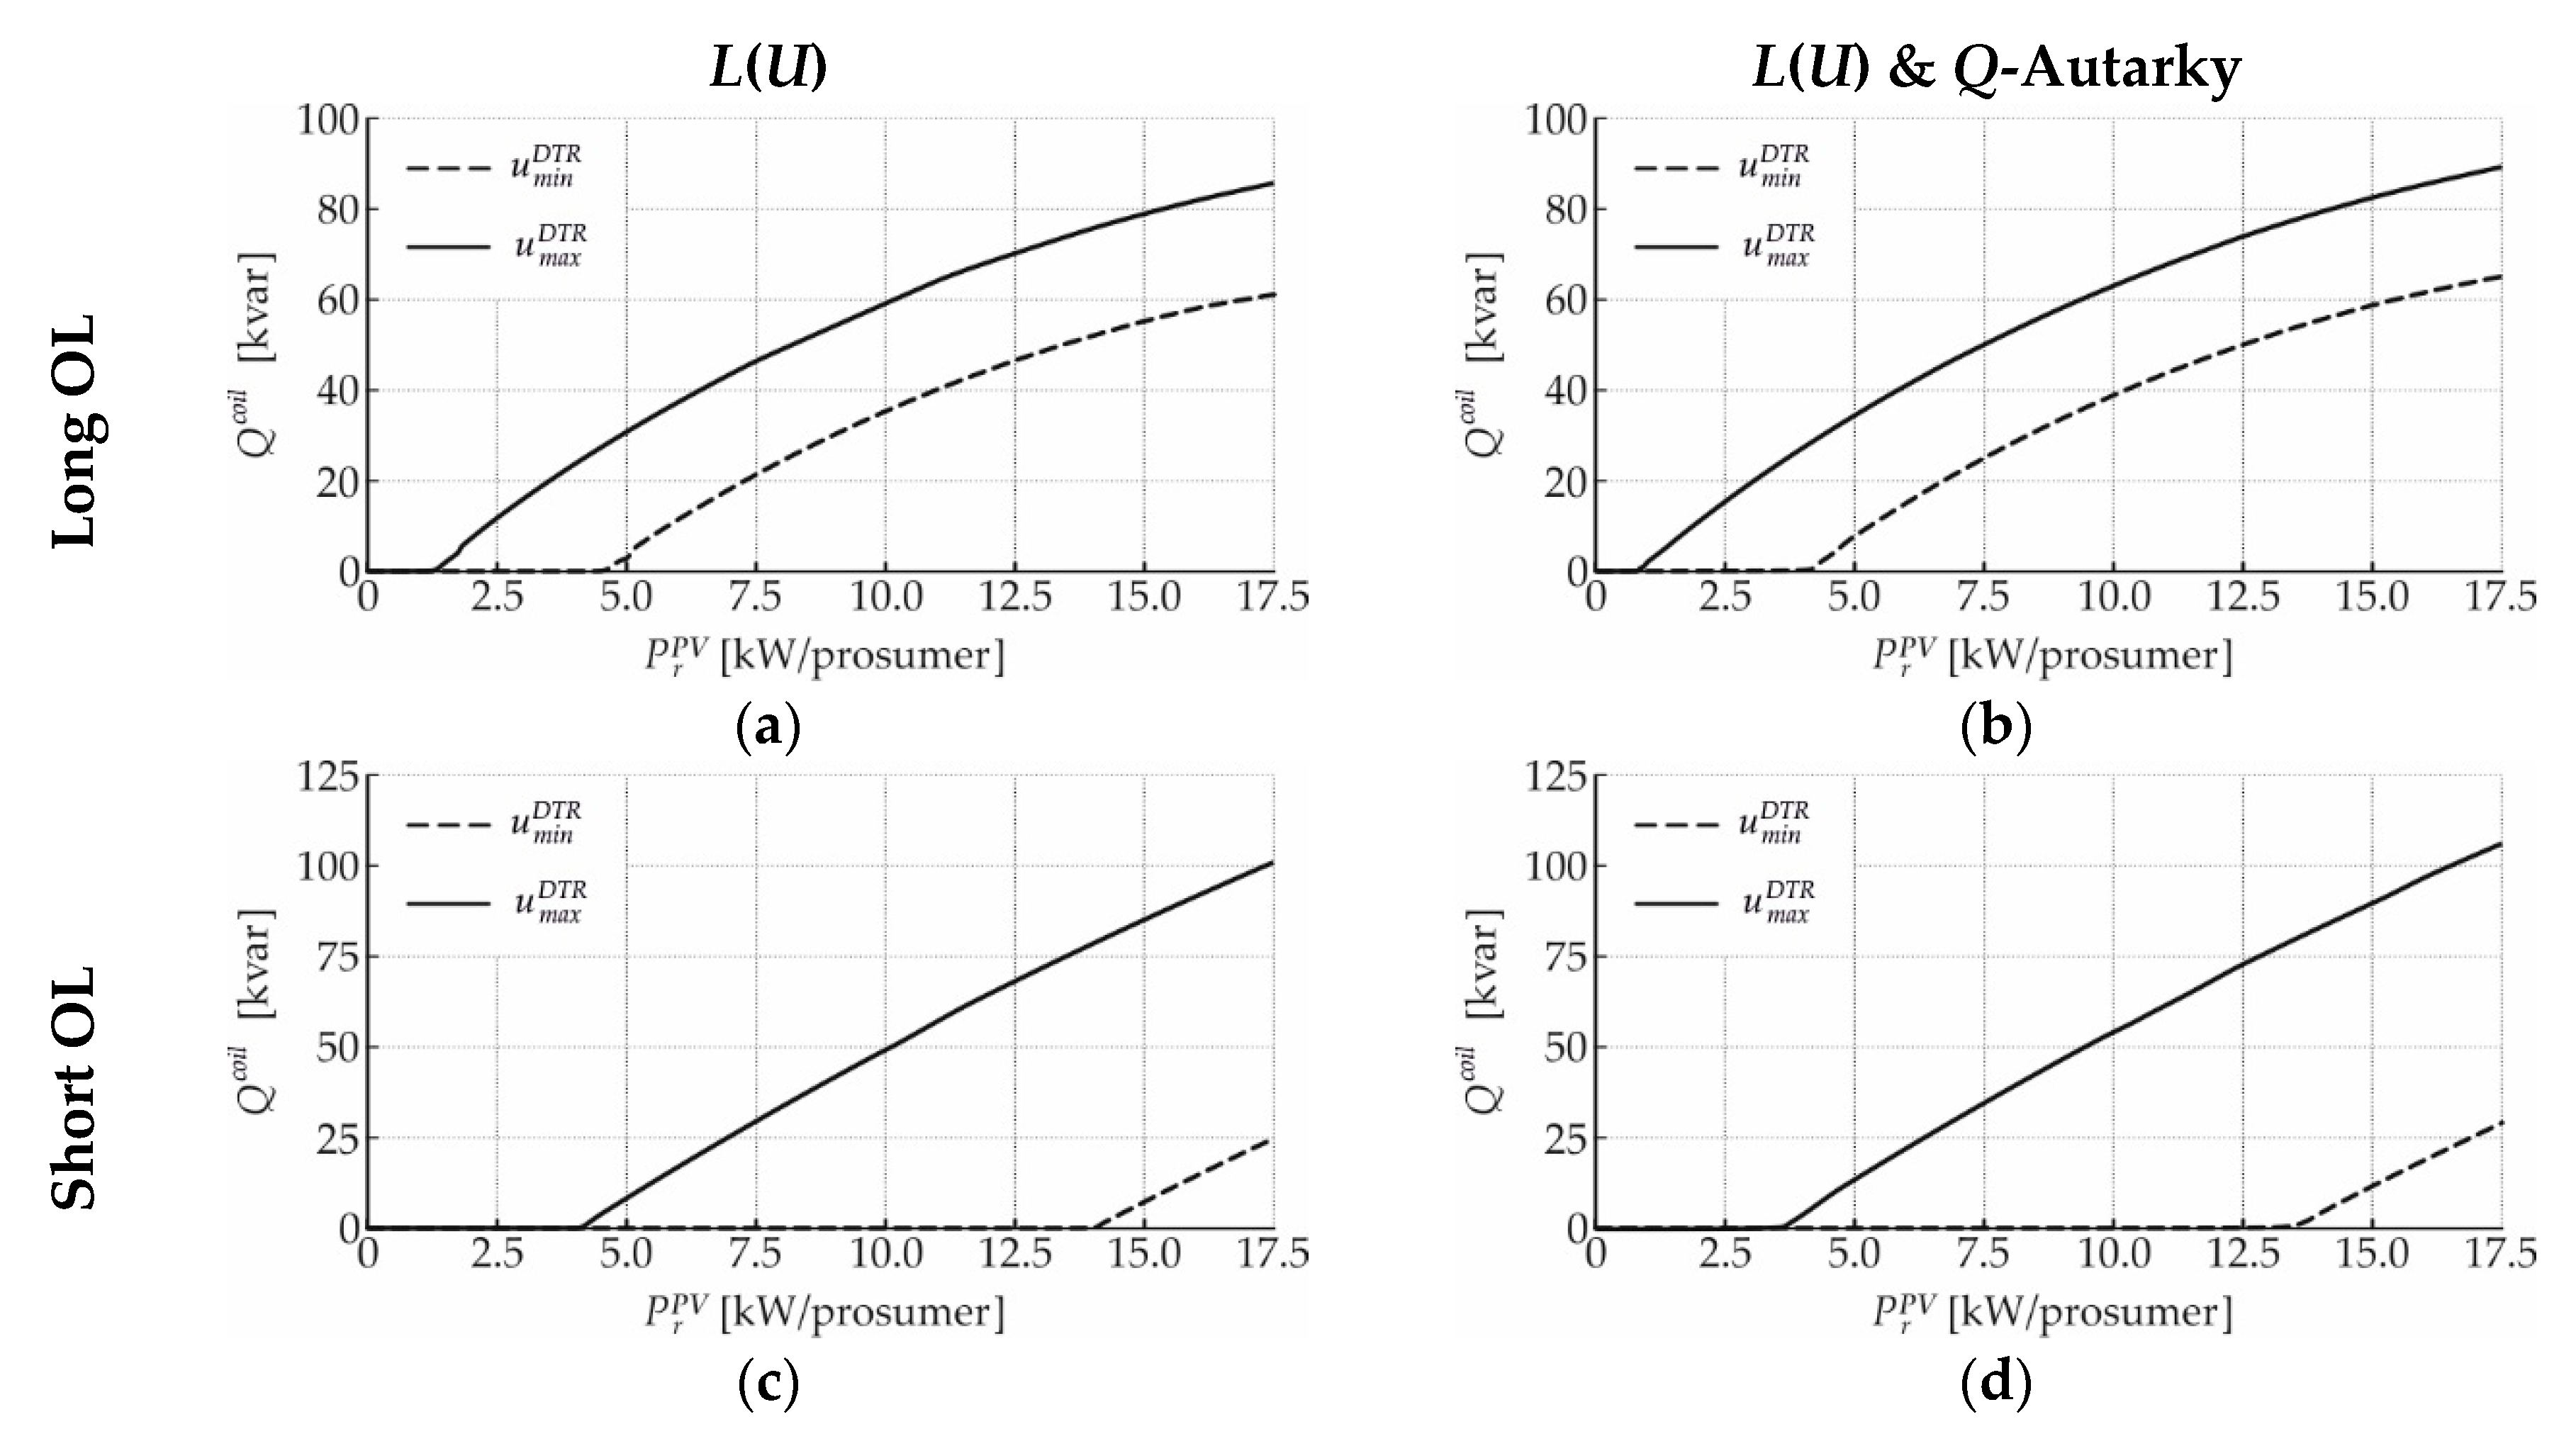
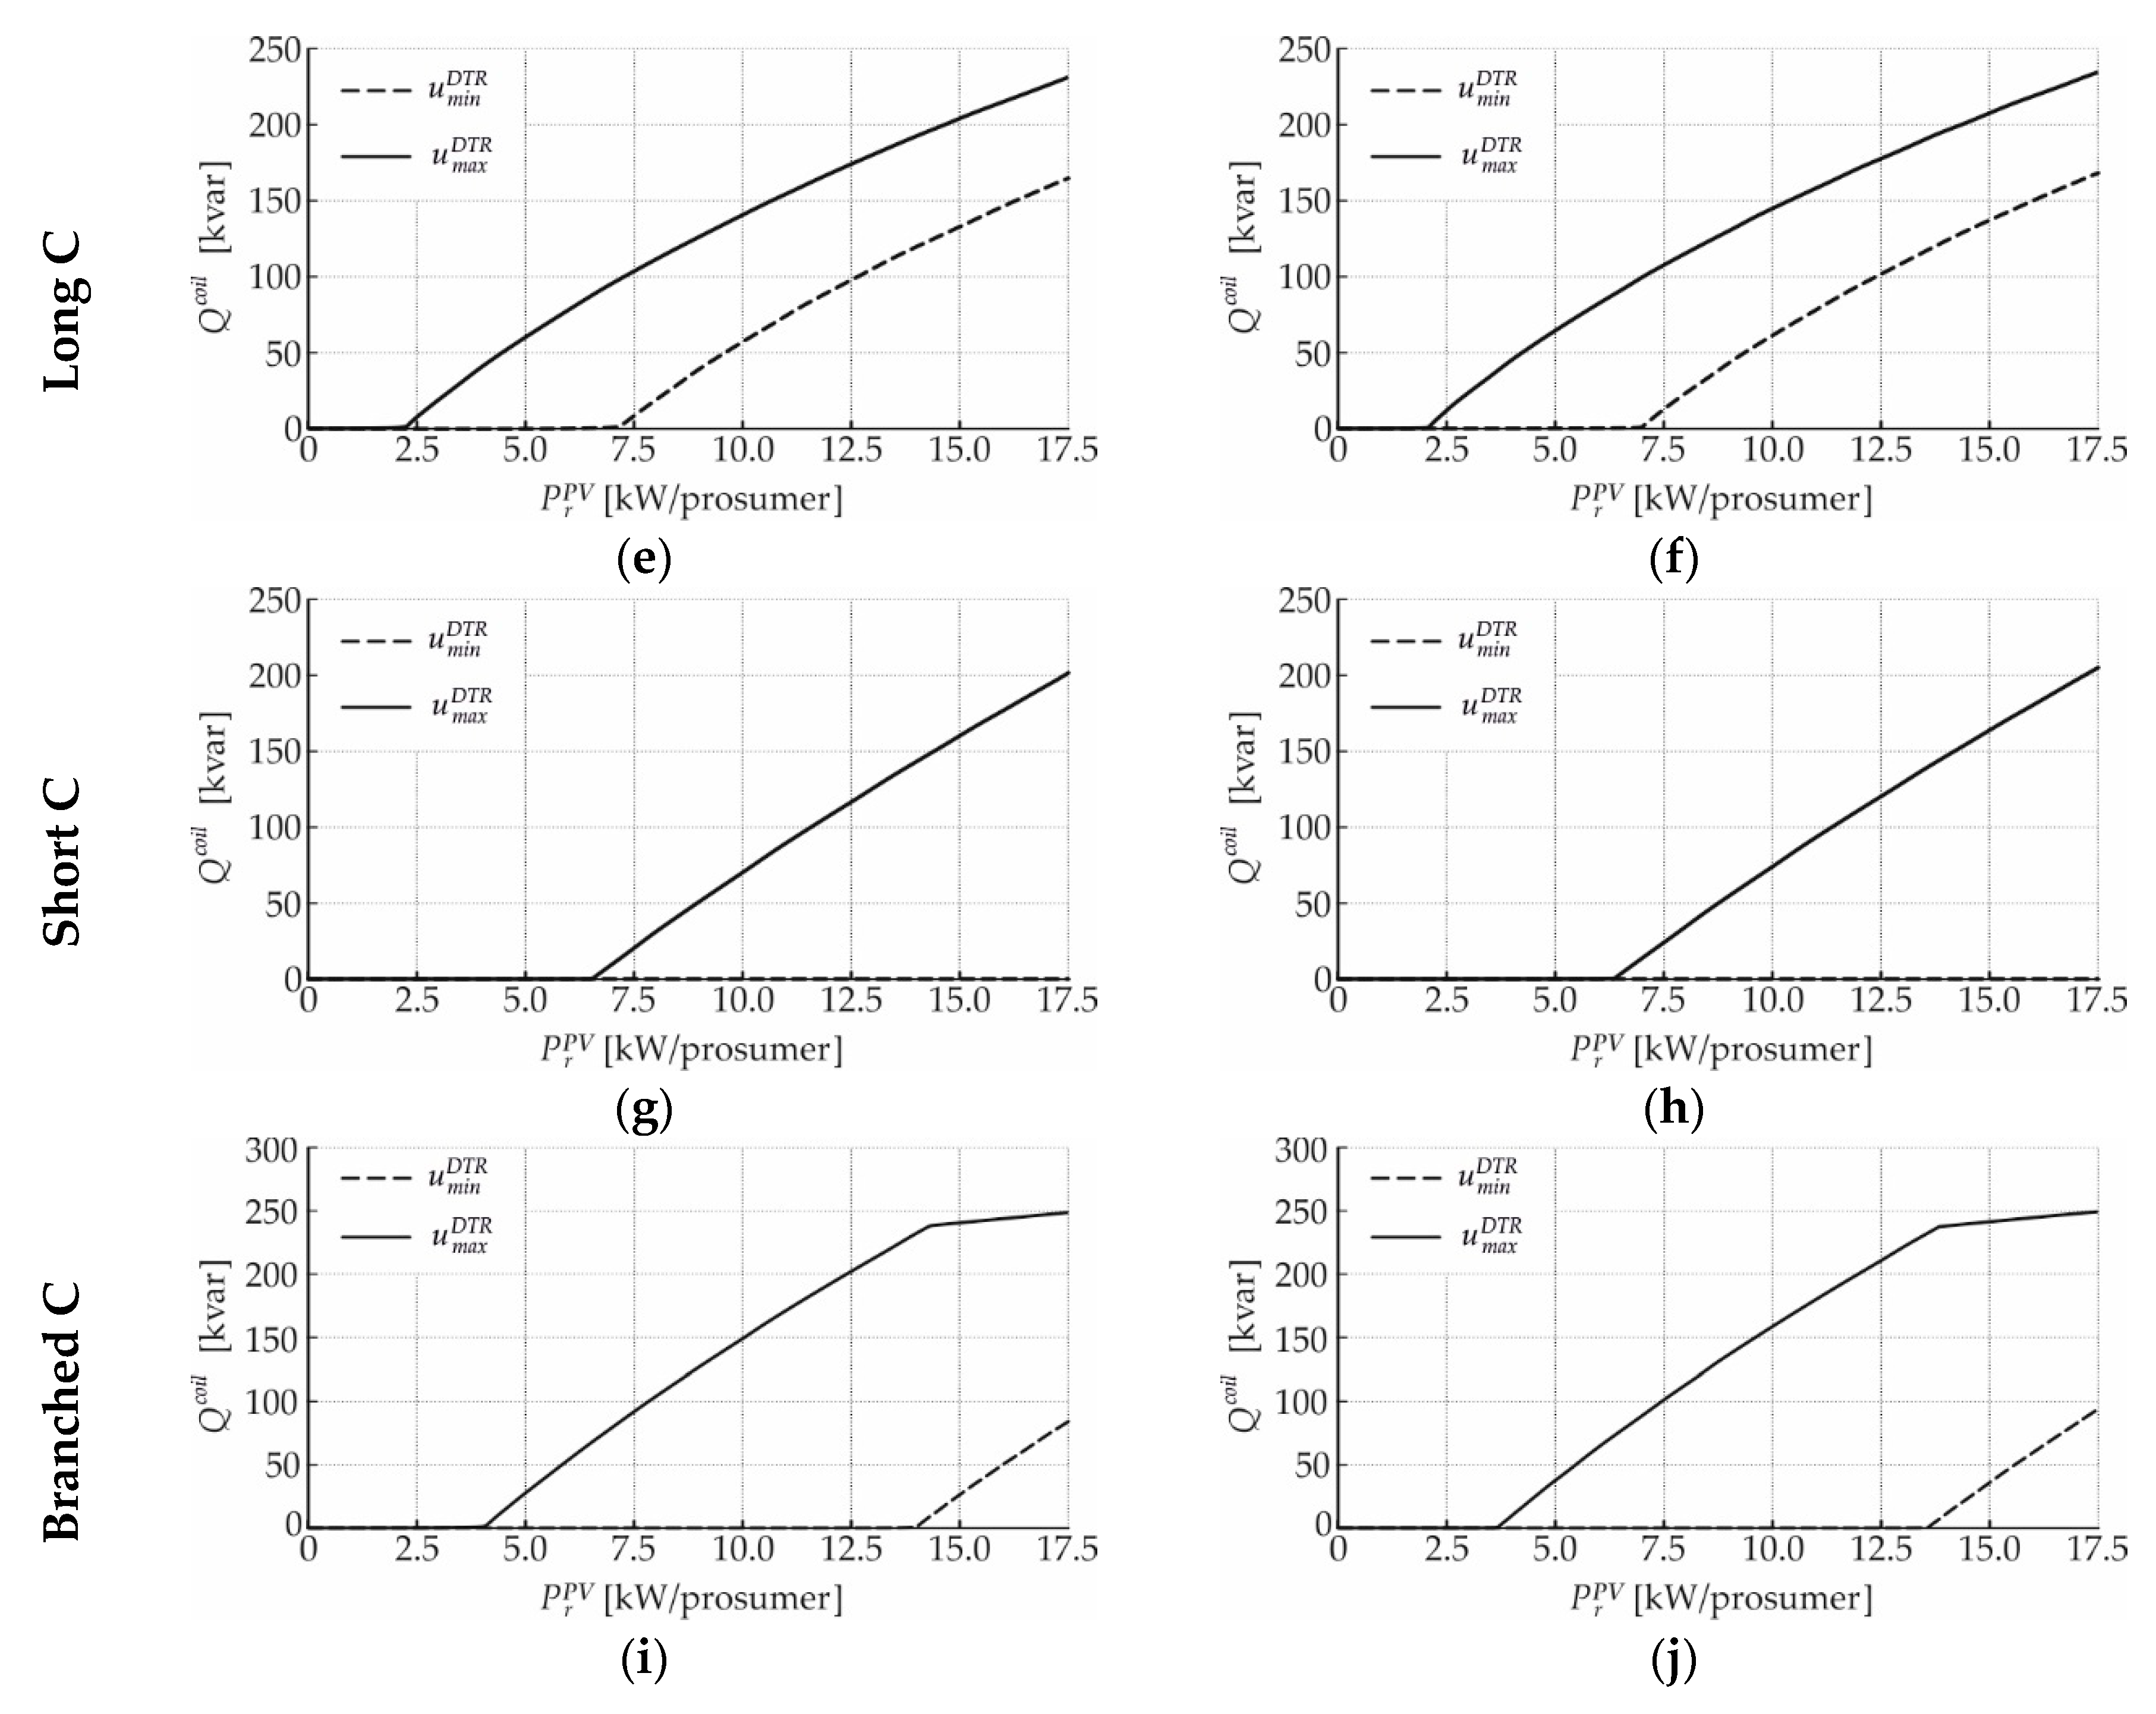
Figure A1 shows the reactive power consumption of the inductive device in case of L(U) and its combination with Q-Autarkic prosumers for the minimal and maximal DTR primary voltage and different test-feeders.
Figure A1.
Reactive power consumption of the inductive device in case of L(U) and its combination with Q-Autarkic prosumers for minimal and maximal DTR primary voltage and different test-feeders: (a,b) Long OL; (c,d) Short OL; (e,f) Long C; (g,h) Short C; (i,j) Branched C.
Figure A1.
Reactive power consumption of the inductive device in case of L(U) and its combination with Q-Autarkic prosumers for minimal and maximal DTR primary voltage and different test-feeders: (a,b) Long OL; (c,d) Short OL; (e,f) Long C; (g,h) Short C; (i,j) Branched C.


References
- Peças Lopes, J.A.; Hatziargyriou, N.; Mutale, J.; Djapic, P.; Jenkins, N. Integrating distributed generation into electric power systems: A review of drivers, challenges and opportunities. Electr. Power Syst. Res. 2007, 77, 1189–1203. [Google Scholar] [CrossRef]
- Manditereza, P.T.; Bansal, R. Renewable distributed generation: The hidden challenges—A review from the protection perspective. Renew. Sustain. Energy Rev. 2016, 58, 1457–1465. [Google Scholar] [CrossRef]
- Hatziargyriou, N.D.; Sakis Meliopoulos, A.P. Distributed energy sources: Technical challenges. In Proceedings of the IEEE Power Engineering Society Winter Meeting (Cat. No.02CH37309), New York, NY, USA, 27–31 January 2002; Volume 2, pp. 1017–1022. [Google Scholar] [CrossRef]
- Katiraei, F.; Aguero, J.R. Solar PV Integration Challenges. IEEE Power Energy Mag. 2011, 9, 62–71. [Google Scholar] [CrossRef]
- Navarro, B.B.; Navarro, M.M. A comprehensive solar PV hosting capacity in MV and LV radial distribution networks. In Proceedings of the ISGT-Europe, Torino, Italy, 26–29 September 2017; pp. 1–6. [Google Scholar]
- Bletterie, B.; Gorsek, A.; Uljanic, B.; Blazic, B.; Woyte, A.; Van, T.V.; Truyens, F.; Jahn, J. Enhancement of the network hosting capacity—Clearing space for/with PV. In Proceedings of the 5th World Conference on Photovoltaic Energy Conversion, Valencia, Spain, 6–10 September 2010. [Google Scholar]
- Bollen, M.H.J.; Rönnberg, S.K. Hosting capacity of the power grid for renewable electricity production and new large consumption equipment. Energies 2017, 10, 1325. [Google Scholar] [CrossRef]
- Smith, J. Stochastic Analysis to Determine Feeder Hosting Capacity for Distributed Solar PV; Technical Update; EPRI: Knoxville, TN, USA, 2012. [Google Scholar]
- Bletterie, B.; Kadam, S.; Renner, H. On the classification of low voltage feeders for network planning and hosting capacity studies. Energies 2018, 11, 651. [Google Scholar] [CrossRef]
- Reese, C.; Buchhagen, C.; Hofmann, L. Voltage range as control input for OLTC-equipped distribution transformers. In Proceedings of the PES T&D, Orlando, FL, USA, 7–10 May 2012; pp. 1–6. [Google Scholar] [CrossRef]
- Latif, A.; Gawlik, W.; Palensky, P. Quantification and mitigation of unfairness in active power curtailment of rooftop photovoltaic systems using sensitivity based coordinated control. Energies 2016, 9, 436. [Google Scholar] [CrossRef]
- Rossi, M.; Viganò, G.; Moneta, D.; Clerici, D.; Carlini, C. Analysis of active power curtailment strategies for renewable distributed generation. In Proceedings of the AEIT International Annual Conference, Capri, Italy, 5–7 October 2016; pp. 1–6. [Google Scholar] [CrossRef]
- Marggraf, O.; Laudahn, S.; Engel, B.; Lindner, M.; Aigner, C.; Witzmann, R.; Schoeneberger, M.; Patzack, S.; Vennegeerts, H.; Cremer, M.; Meyer, M. U-control—Analysis of distributed and automated voltage control in current and future distribution grids. In Proceedings of the International ETG Congress, Bonn, Germany, 28–29 November 2017; pp. 1–6. [Google Scholar]
- Hashemi, S.; Østergaard, J. Methods and strategies for overvoltage prevention in low voltage distribution systems with PV. IET Renew. Power Gen. 2017, 11, 205–214. [Google Scholar] [CrossRef] [Green Version]
- Caldon, R.; Coppo, M.; Turri, R. Distributed voltage control strategy for LV networks with inverter-interfaced generators. Electr. Power Syst. Res. 2014, 107, 85–92. [Google Scholar] [CrossRef]
- Smith, J.W.; Sunderman, W.; Dugan, R.; Seal, B. Smart inverter volt/var control functions for high penetration of PV on distribution systems. In Proceedings of the IEEE/PES Power Systems Conference and Exposition, Phoenix, AZ, USA, 20–23 March 2011; pp. 1–6. [Google Scholar] [CrossRef]
- Zhang, F.; Guo, X.; Chang, X.; Fan, G.; Chen, L.; Wang, Q.; Tang, Y.; Dai, J. The reactive power voltage control strategy of PV systems in low-voltage string lines. In Proceedings of the IEEE Manchester PowerTech, Manchester, UK, 18–22 June 2017; pp. 1–6. [Google Scholar] [CrossRef]
- Turitsyn, K.; Sulc, P.; Backhaus, S.; Chertkov, M. Options for control of reactive power by distributed photovoltaic generators. Proc. IEEE 2011, 99, 1063–1073. [Google Scholar] [CrossRef]
- Ilo, A.; Schultis, D.-L.; Schirmer, C. Effectiveness of distributed vs. concentrated volt/var local control strategies in low-voltage grids. Appl. Sci. 2018, 8, 1382. [Google Scholar] [CrossRef]
- Schultis, D.-L.; Ilo, A.; Schirmer, C. Overall performance evaluation of reactive power control strategies in low voltage grids with high prosumer share. Electr. Power Syst. Res. 2019, 168, 336–349. [Google Scholar] [CrossRef]
- Ilo, A.; Schultis, D.-L. Low-voltage grid behaviour in the presence of concentrated var-sinks and var-compensated customers. Electr. Power Syst. Res. 2019, 171, 54–65. [Google Scholar] [CrossRef]
- Demirok, E.; González, P.C.; Frederiksen, K.H.B.; Sera, D.; Rodriguez, P.; Teodorescu, R. Local reactive power control methods for overvoltage prevention of distributed solar inverters in low-voltage grids. IEEE J. Photovol. 2011, 1, 174–182. [Google Scholar] [CrossRef]
- Bletterie, B.; Kadam, S.; Bolgaryn, R.; Zegers, A. Voltage control with PV inverters in low voltage networks—In depth analysis of different concepts and parameterization criteria. IEEE Trans. Power Syst. 2017, 32, 177–185. [Google Scholar] [CrossRef]
- “Benchmark Systems for Network Integration of renewable and Distributed Energy Resources”; Task Force C6.04; CIGRE: Paris, France, 2014; ISBN 978-285-873-270-8.
- E-Control, Technische und Organisatorische Regeln für Betreiber und Benutzer von Netzen, Besondere technische Regeln/Parallelbetrieb von Erzeugungsanlagen mit Verteilernetzen, Teil D/Hauptabschnitt D4, Version 2.3. 2016. Available online: https://www.e-control.at/documents/20903/388512/TOR_D4_V2.3+ab+1.7.2016.pdf/1fbc3aff-36a6-4eee-8de5-6027eaa53a89 (accessed on 11 March 2019).
- Bokhari, A.; Alkan, A.; Dogan, R.; Diaz-Aguiló, M.; De Leon, F.; Czarkowski, D.; Zabar, Z.; Birenbaum, L.; Noel, A. Experimental determination of the ZIP coefficients for modern residential, commercial, and industrial loads. IEEE Trans. Power Deliv. 2014, 29, 1372–1381. [Google Scholar] [CrossRef]
Figure 1.
Theoretical LV test-feeders: (a) long overhead line feeder (“Long OL”); (b) short overhead line (“Short OL”); (c) long cable (“Long C”); (d) short cable (“Short C”).
Figure 1.
Theoretical LV test-feeders: (a) long overhead line feeder (“Long OL”); (b) short overhead line (“Short OL”); (c) long cable (“Long C”); (d) short cable (“Short C”).

Figure 2.
Real LV test-feeder: branched cable (“Branched C”).

Figure 3.
Structure of each prosumer.

Figure 4.
Load- and control-related reactive power flows provoked by the different control strategies: (a) cosφ(P); (b) Q(U); (c) L(U); (d) L(U) combined with Q-Autarkic prosumers.
Figure 4.
Load- and control-related reactive power flows provoked by the different control strategies: (a) cosφ(P); (b) Q(U); (c) L(U); (d) L(U) combined with Q-Autarkic prosumers.

Figure 5.
Fundamental characteristics of different local control strategies for PV-inverters proposed by the Austrian grid code: (a) cosφ(P); (b) Q(U).
Figure 5.
Fundamental characteristics of different local control strategies for PV-inverters proposed by the Austrian grid code: (a) cosφ(P); (b) Q(U).

Figure 6.
Methodology to parameterize different local control strategies for PV-inverters: (a) cosφ(P)-control; (b) Q(U)-control.
Figure 6.
Methodology to parameterize different local control strategies for PV-inverters: (a) cosφ(P)-control; (b) Q(U)-control.

Figure 7.
Current- and voltage-related hosting capacity limits of the long overhead line test-feeder for different control strategies: (a,b) no-control; (c,d) cosφ(P)-control; (e,f) Q(U)-control; (g,h) L(U)-control; (i,j) L(U)-control and Q-Autarkic prosumers.
Figure 7.
Current- and voltage-related hosting capacity limits of the long overhead line test-feeder for different control strategies: (a,b) no-control; (c,d) cosφ(P)-control; (e,f) Q(U)-control; (g,h) L(U)-control; (i,j) L(U)-control and Q-Autarkic prosumers.

Figure 8.
Grid losses of the long overhead line test-feeder for the minimal and maximal DTR primary voltages and different control strategies: (a) no-control; (b) cosφ(P)-control; (c) Q(U)-control; (d) L(U)-control; (e) L(U)-control and Q-Autarkic prosumers.
Figure 8.
Grid losses of the long overhead line test-feeder for the minimal and maximal DTR primary voltages and different control strategies: (a) no-control; (b) cosφ(P)-control; (c) Q(U)-control; (d) L(U)-control; (e) L(U)-control and Q-Autarkic prosumers.

Figure 9.
Current- and voltage-related hosting capacity limits of the short overhead line test-feeder for different control strategies: (a,b) no-control; (c,d) cosφ(P)-control; (e,f) Q(U)-control; (g,h) L(U)-control; (i,j) L(U)-control and Q-Autarkic prosumers.
Figure 9.
Current- and voltage-related hosting capacity limits of the short overhead line test-feeder for different control strategies: (a,b) no-control; (c,d) cosφ(P)-control; (e,f) Q(U)-control; (g,h) L(U)-control; (i,j) L(U)-control and Q-Autarkic prosumers.

Figure 10.
Grid losses of the short overhead line test-feeder for the minimal and maximal DTR primary voltages and different control strategies: (a) no-control; (b) cosφ(P)-control; (c) Q(U)-control; (d) L(U)-control; (e) L(U)-control and Q-Autarkic prosumers.
Figure 10.
Grid losses of the short overhead line test-feeder for the minimal and maximal DTR primary voltages and different control strategies: (a) no-control; (b) cosφ(P)-control; (c) Q(U)-control; (d) L(U)-control; (e) L(U)-control and Q-Autarkic prosumers.

Figure 11.
Current- and voltage-related hosting capacity limits of the long cable test-feeder for different control strategies: (a,b) no-control; (c,d) cosφ(P)-control; (e,f) Q(U)-control; (g,h) L(U)-control; (i,j) L(U)-control and Q-Autarkic prosumers.
Figure 11.
Current- and voltage-related hosting capacity limits of the long cable test-feeder for different control strategies: (a,b) no-control; (c,d) cosφ(P)-control; (e,f) Q(U)-control; (g,h) L(U)-control; (i,j) L(U)-control and Q-Autarkic prosumers.

Figure 12.
Grid losses of the long cable test-feeder for the minimal and maximal DTR primary voltages and different control strategies: (a) no-control; (b) cosφ(P)-control; (c) Q(U)-control; (d) L(U)-control; (e) L(U)-control and Q-Autarkic prosumers.
Figure 12.
Grid losses of the long cable test-feeder for the minimal and maximal DTR primary voltages and different control strategies: (a) no-control; (b) cosφ(P)-control; (c) Q(U)-control; (d) L(U)-control; (e) L(U)-control and Q-Autarkic prosumers.

Figure 13.
Current- and voltage-related hosting capacity limits of the short cable test-feeder for different control strategies: (a,b) no-control; (c,d) cosφ(P)-control; (e,f) Q(U)-control; (g,h) L(U)-control; (i,j) L(U)-control and Q-Autarkic prosumers.
Figure 13.
Current- and voltage-related hosting capacity limits of the short cable test-feeder for different control strategies: (a,b) no-control; (c,d) cosφ(P)-control; (e,f) Q(U)-control; (g,h) L(U)-control; (i,j) L(U)-control and Q-Autarkic prosumers.

Figure 14.
Grid losses of the short cable test-feeder for the minimal and maximal DTR primary voltages and different control strategies: (a) no-control; (b) cosφ(P)-control; (c) Q(U)-control; (d) L(U)-control; (e) L(U)-control and Q-Autarkic prosumers.
Figure 14.
Grid losses of the short cable test-feeder for the minimal and maximal DTR primary voltages and different control strategies: (a) no-control; (b) cosφ(P)-control; (c) Q(U)-control; (d) L(U)-control; (e) L(U)-control and Q-Autarkic prosumers.

Figure 15.
Current- and voltage-related hosting capacity limits of the branched cable test-feeder for different control strategies: (a,b) no-control; (c,d) cosφ(P)-control; (e,f) Q(U)-control; (g,h) L(U)-control; (i,j) L(U)-control and Q-Autarkic prosumers.
Figure 15.
Current- and voltage-related hosting capacity limits of the branched cable test-feeder for different control strategies: (a,b) no-control; (c,d) cosφ(P)-control; (e,f) Q(U)-control; (g,h) L(U)-control; (i,j) L(U)-control and Q-Autarkic prosumers.


Figure 16.
Grid losses of the branched cable test-feeder for the minimal and maximal DTR primary voltages and different control strategies: (a) no-control; (b) cosφ(P)-control; (c) Q(U)-control; (d) L(U)-control; (e) L(U)-control and Q-Autarkic prosumers.
Figure 16.
Grid losses of the branched cable test-feeder for the minimal and maximal DTR primary voltages and different control strategies: (a) no-control; (b) cosφ(P)-control; (c) Q(U)-control; (d) L(U)-control; (e) L(U)-control and Q-Autarkic prosumers.

Figure 17.
Voltage and current profiles of the branched cable test-feeder for a PV-penetration of 7.5 kW/prosumer, the minimal and maximal DTR primary voltages, and different control strategies: (a,b) no-control; (c,d) cosφ(P)-control; (e,f) Q(U)-control; (g,h) L(U)-control; (i,j) L(U)-control and Q-Autarkic prosumers.

Figure 18.
HC increase of each Volt/var control strategy for each LV test-feeder.

Figure 19.
Additional grid losses provoked by different control strategies for minimal and maximal DTR primary voltages, different LV test-feeders and different PV-penetrations: (a) 5 kW/prosumer; (b) 10 kW/prosumer.
Figure 19.
Additional grid losses provoked by different control strategies for minimal and maximal DTR primary voltages, different LV test-feeders and different PV-penetrations: (a) 5 kW/prosumer; (b) 10 kW/prosumer.

Table 1.
Scenarios simulated with each LV test-feeder and control strategy (including no-control).
| DTR Primary Voltage | |
|---|---|
| 0.96 p.u | 1.06 p.u. |
| = 0.00 kW | = 0.00 kW |
| = 0.01 kW | = 0.01 kW |
| … | … |
| = 17.49 kW | = 17.49 kW |
| = 17.50 kW | = 17.50 kW |
© 2019 by the author. Licensee MDPI, Basel, Switzerland. This article is an open access article distributed under the terms and conditions of the Creative Commons Attribution (CC BY) license (http://creativecommons.org/licenses/by/4.0/).
Share and Cite
MDPI and ACS Style
Schultis, D.-L. Comparison of Local Volt/var Control Strategies for PV Hosting Capacity Enhancement of Low Voltage Feeders. Energies 2019, 12, 1560. https://0-doi-org.brum.beds.ac.uk/10.3390/en12081560
AMA Style
Schultis D-L. Comparison of Local Volt/var Control Strategies for PV Hosting Capacity Enhancement of Low Voltage Feeders. Energies. 2019; 12(8):1560. https://0-doi-org.brum.beds.ac.uk/10.3390/en12081560
Chicago/Turabian StyleSchultis, Daniel-Leon. 2019. "Comparison of Local Volt/var Control Strategies for PV Hosting Capacity Enhancement of Low Voltage Feeders" Energies 12, no. 8: 1560. https://0-doi-org.brum.beds.ac.uk/10.3390/en12081560
Note that from the first issue of 2016, this journal uses article numbers instead of page numbers. See further details here.