Economic and Technological Analysis of Commercial LNG Production in the EU


1
Department of Chemistry, Faculty of Agrobiology, Food and Natural Resources, Czech University of Life Sciences Prague, Kamýcká 129, 165 00 Prague 6, Czech Republic
2
Department of Strategy, Faculty of Business Administration, University of Economics, Prague, W. Churchill Sq. 1938/4, 130 67 Prague 3, Czech Republic
3
Department of Economics, Faculty of Economics and Management, Czech University of Life Sciences Prague, Kamýcká 129, 165 00 Prague 6, Czech Republic
4
Department of Trade and Finance, Faculty of Economics and Management, Czech University of Life Sciences Prague, Kamýcká 129, 165 00 Prague 6, Czech Republic
5
Department of Chemistry and Chemical Technology, Faculty of Wood Sciences and Technology, Technical University in Zvolen, 960 53 Zvolen, Slovakia
*
Author to whom correspondence should be addressed.
Energies 2019, 12(8), 1565; https://0-doi-org.brum.beds.ac.uk/10.3390/en12081565
Submission received: 25 March 2019
/
Revised: 14 April 2019
/
Accepted: 19 April 2019
/
Published: 25 April 2019
(This article belongs to the Section A: Sustainable Energy)
Abstract
:There is a global need to increase the production of alternative sources of energy due to many issues related to conventional sources, such as environmental degradation or energy security. In this paper, decentralized liquefied natural gas production is analyzed. Liquefied natural gas, according to the analysis, can be considered a viable alternative even for decentralized applications Design and economic analysis of a small-scale biogas LNG plan together with the necessary technology and economic evaluation are presented in the paper. The results show that a project of the proposed size (EUR 3 million) offers a relatively good profitability level. Specifically, the net present value of the project is mostly positive (around EUR 0.1 million up to EUR 0.8 million). Therefore, based on the research, small LNG plants operating across the continent can be recommended for the processing of local sources of biogas.
1. Introduction
The European Union’s Green Paper specifies the need to substitute 20% of conventional fuel consumption with alternative fuels by the year 2020. Today, alternative energy sources are most often allocated to electricity production and transportation [1,2,3]. Solar panels, biomass, wind power plants, or solar power plants are commonly used to produce electricity [4,5]. For transportation, it is possible to use the following alternative energy resources: Liquefied petroleum gas (LPG), compressed natural gas (CNG), liquefied natural gas (LNG), biodiesel, fuels based on methyl ester of rapeseed oil, fuels using alcohol (methanol, ethanol, butanol), hydrogen, and electricity [6].
Out of the above mentioned alternative sources of energy (not considering electricity), natural gas is a source that is, relatively, one of the most environmentally friendly, as it has an inherently clean combustion process [7]. According to the future scenarios presented by the International Energy Agency (IEA), the demand for natural gas should witness one of the fastest growth rates [8]. This is due to the following advantages [9]:
- Wide availability;
- Conventional spark-ignition and internal combustion engines compatibility; and
- Low operational cost.
The total confirmed global reserves of natural gas are 193.5 trillion cubic meters, under current economic conditions using current geological and engineering information. The reserves-to-production (R/P) ratio for natural gas in 2018 was about 53 [10].
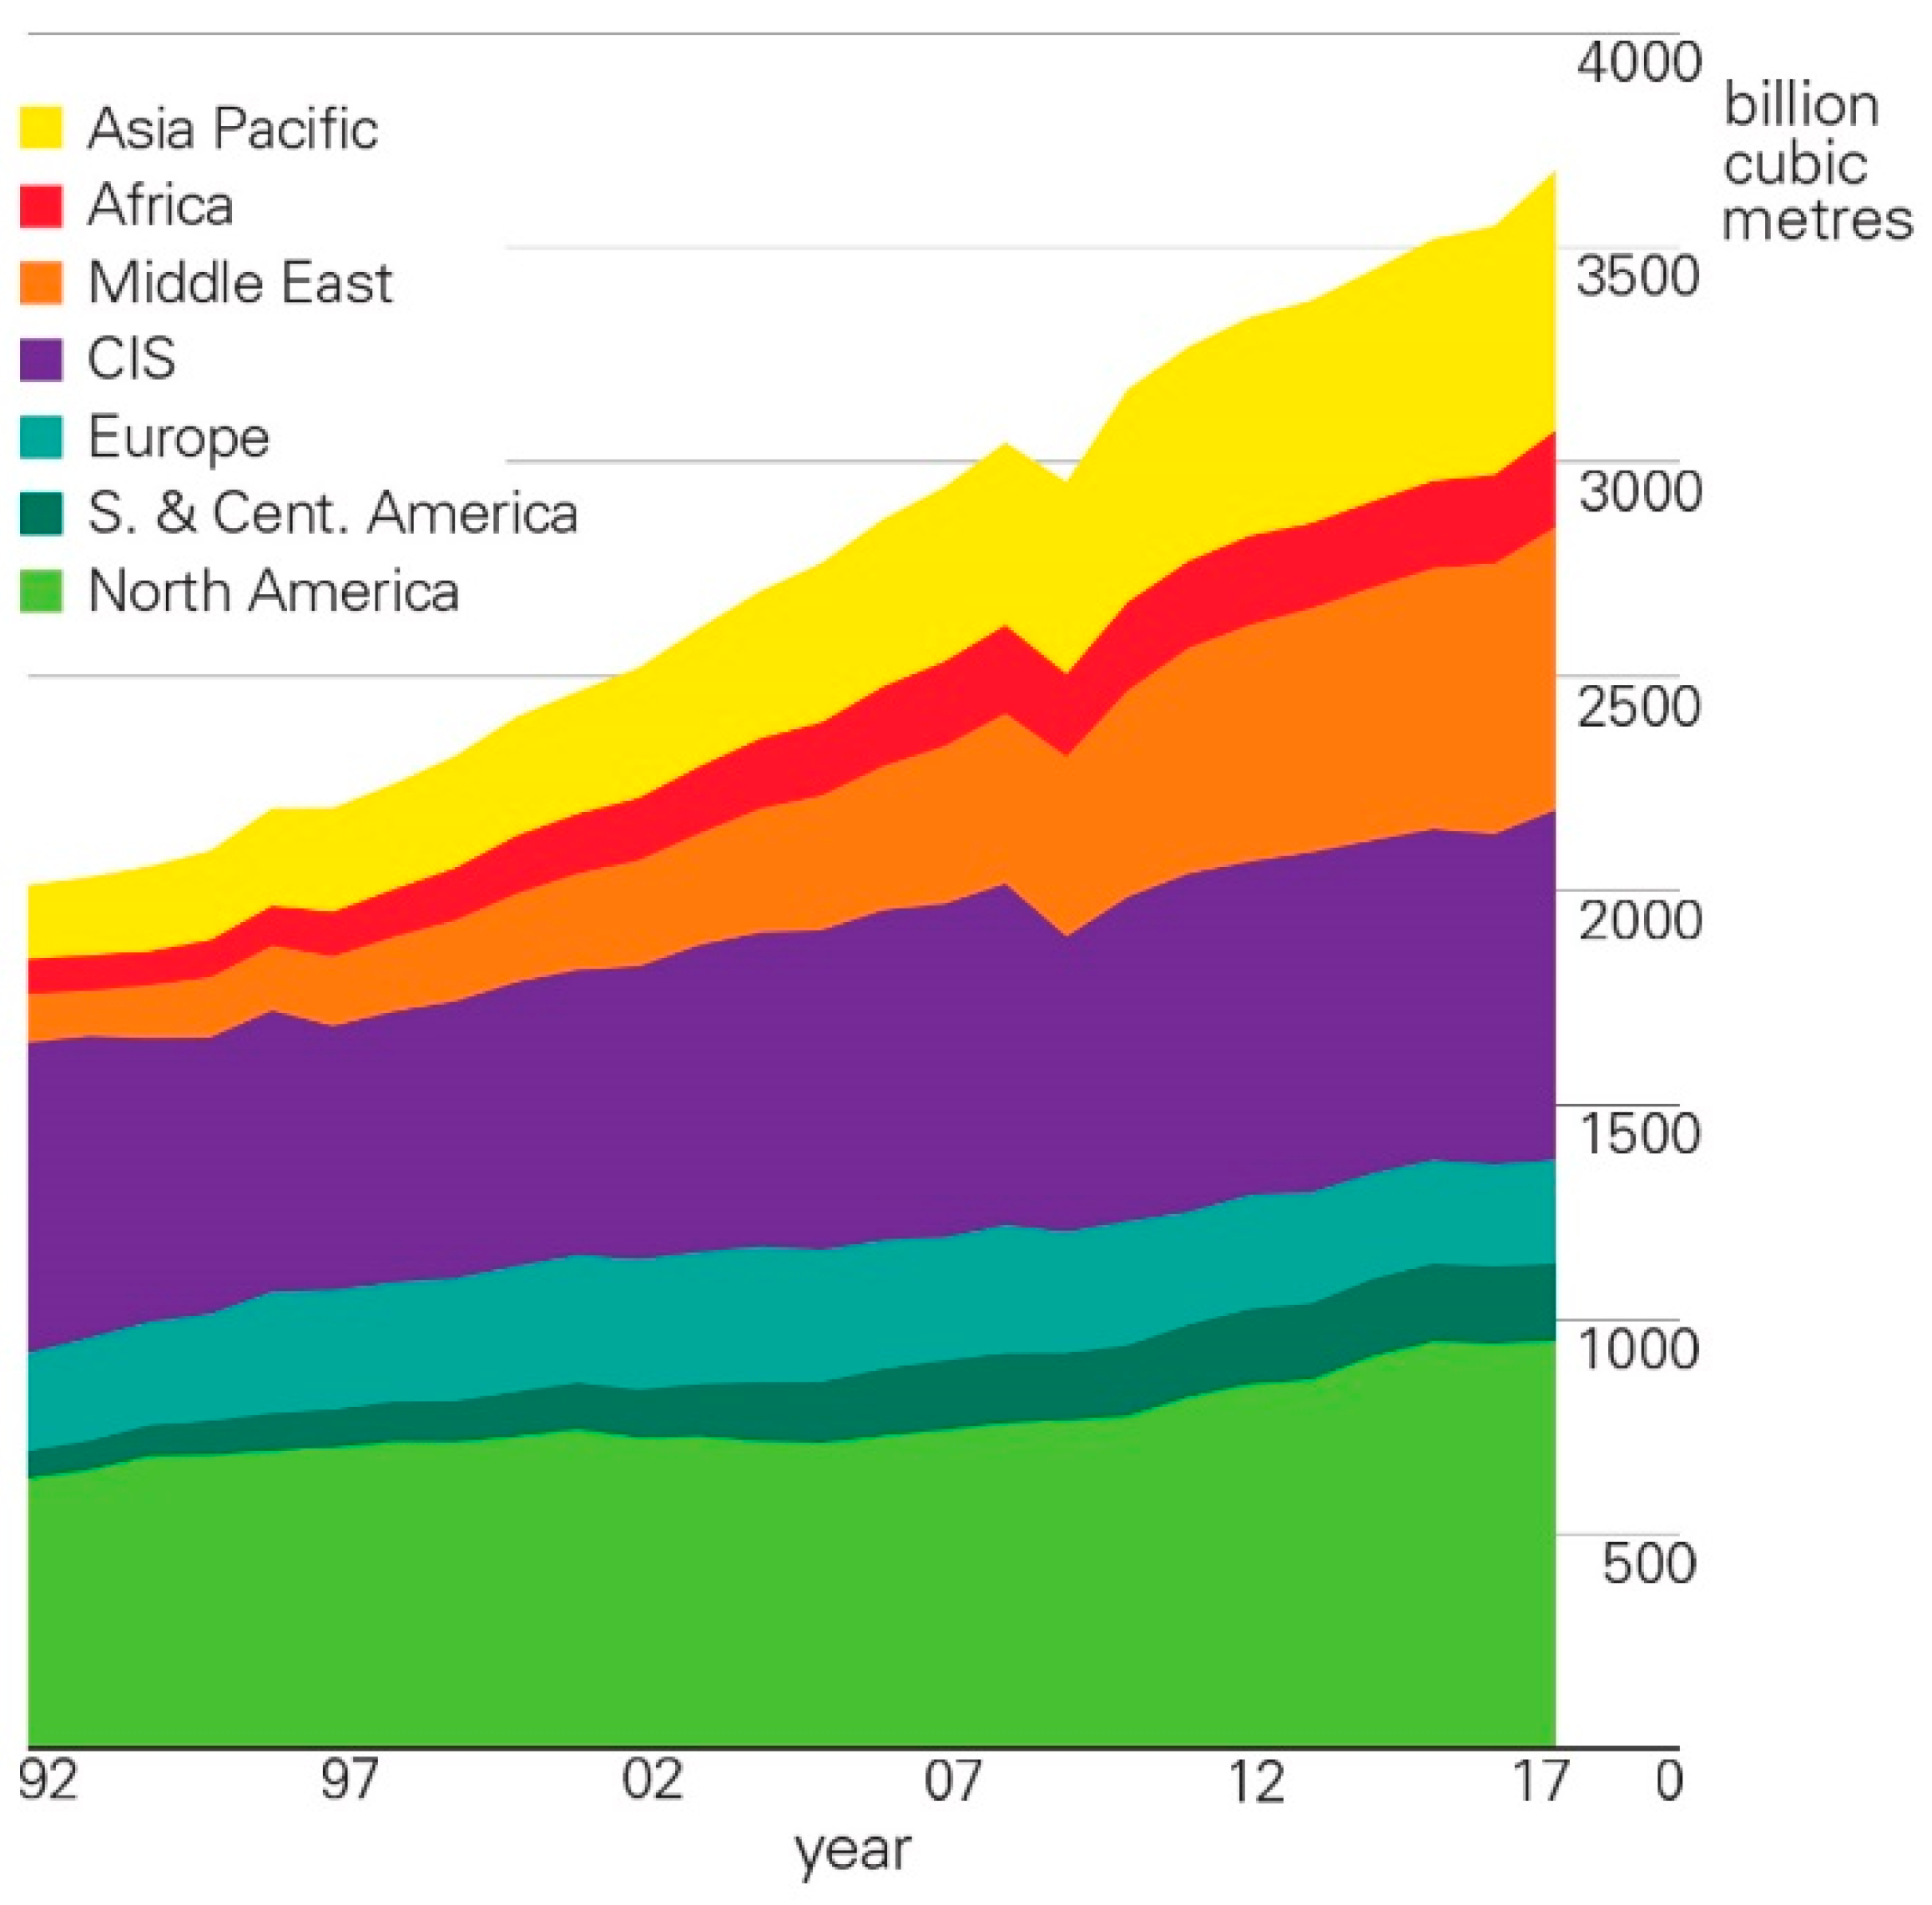
Consumption of natural gas rises steadily—see Figure 1 (CIS means Commonwealth of Independent States, which is a regional organization of 10 post-Soviet republics).
Natural gas can be used in its natural form, in a compressed state (CNG), or in a liquid state (LNG). LNG is more suitable for heavy-duty vehicles as its energy is denser than CNG [7]. In recent years, out of the available forms, LNG has become a popular choice for many small to medium-scale supply chains [11]. This is important for many sectors, such as agriculture [12,13,14,15]. Some examples can be found in Norway or Japan, where small-scale supply chains satisfy the needs of local consumers, such as power companies and the chemical industry. Furthermore, the emission restrictions on maritime transportation imposed by the International Maritime Organization (IMO) favor the use of LNG as a cleaner propulsion fuel for vessels [11].
Based on the above mentioned peculiarities, it is clear that LNG is expected to play a big role in the future energy policies of various countries in the European Union. Currently, analysis from Spain claims that LNG use in heavy-duty trucks for freight transport is possible due to the mature technology and energy resource availability [16]. In order to achieve higher energy security in the EU, it is necessary to build several LNG plants across the continent. By the end of 2014, Europe had only 43 LNG stations, and 90% of these were concentrated on the shores of Spain, The Netherlands, the United Kingdom, and Sweden [17]. LNG plants could also process locally produced biogas. In 2015, there were up to 17,240 biogas plants in Europe [18]. Natural gas obtained this way is cheaper and produces a sustainable and competitive alternative to conventional fuels, alongside with an improvement of the environment and contribution to fulfilling the EU demands of lowering CO2 emissions [19]. Small-scale LNG could be a better alternative to large-scale factories [20,21]. This kind of decentralization of LNG plants and use of biogas produced locally brings many benefits to the region itself, as well as to the entire European Union [20]. Local LNG plants were also discussed in other scientific papers [21,22,23,24]. Authors agree that the usage of local sources is an integral part of LNG plant sustainability. Large-scale LNG plants were discussed only marginally because scaling up brings higher levels of uncertainty, investment, and goes against decentralization.
The goal of this article is the technical and economical evaluation of the construction and operation of a small-scale LNG plant. A simulation in Aspen HYSYS will be designed to obtain all necessary material and energy flows. It will be based on content analysis of real-world operations, legislative standards, and relevant patented manufacturing processes in the European Union to satisfy the emission and environmental regulations. The chemical-engineering simulation will handle the cleaning and liquefaction of natural gas. The results will serve as inputs into the material and energy flow-based cost analysis [25]. Based on the material and energy flows of the simulated LNG plant, the economic analysis will be conducted. The economic aspects of the analyzed plant will be discussed based on the results of the dynamic net present value. In order to predict future economic conditions, researchers predict the development of both prices and demand. Based on the results of economic variable predictions, cost-revenue analysis with a statistical confidence interval will be done. Using both chemical-engineering and economic models, a reliable and complex analysis of an LNG plant provides comprehensive insight into the construction and operation of such a plant. At the same time, it also reveals the inherent dependencies of LNG plant construction and operation. Based on the literature review, this study is unique on its own, because it merges both the technical part of LNG plant design with mathematical simulation, and economic part with net present value evaluation supported by econometric analysis of time series according to the ARIMA model. Results outline the direction to lower energy security risk and at the same time it helps to achieve the fulfillment of sustainability criteria in the EU of lowering greenhouse gas emissions.
In the first part of this manuscript, the technical model is discussed, in which all technological units with a comprehensive explanation of the methodology used is described. This part contains physical models, chemical-engineering simulation, and the design of the LNG plant. In the second part of the manuscript, the economic analysis is thoroughly evaluated. In this part, the LNG plant is set into the real economic situation in the EU by an estimation of the costs, cash flow, and econometric analysis of the time series. The results incorporate both the technical part and economic part into one complex outcome with a fully modelled LNG plant with material and energy flows and a dynamic net present value, based on ARIMA predictions. At the end of the manuscript, the results are compared with other articles within this field of study.
2. Literature Review
According to Pongas et al. [16], the introduction of LNG in road transport in the EU can reduce environmental pollution and noise. Furthermore, the use of LNG reduces the emissions of particulate matter and oxides of sulfur and nitrogen. Greenhouse gas emissions of LNG trucks are reduced by about 20%. The importance of LNG also lies in energy security. The EU’s energy import dependence has been increasing steadily since the 1980s [16]. Even though the United Kingdom (UK) and the Netherlands are among the largest EU natural gas producers, these large producers still import more than 60% of their consumption [26]. Lack of domestic gas production is, therefore, a big issue for EU energy security.
As a counter-measure, Lithuania built an import terminal for liquefied natural gas (LNG) in Klaipeda in 2014 with financial support from the EU to allow LNG suppliers access to the EU market, thus breaking the Russian monopoly. This long-term contract with the Norwegian supplier, Statoil, also ensures continuous utilization of this newly built terminal [27].
Another important EU co-financed investment into natural gas infrastructure is an ongoing project, EastMed, which is the Eastern Mediterranean pipeline project related to an offshore/onshore natural gas pipeline directly connecting East Mediterranean resources to Greece via Cyprus and Crete that could enhance Europe’s gas supply security via diversification of counterparts, routes, and sources; develop EU indigenous resources, such as the offshore gas reserves around Cyprus and Greece; and promote the development of a South Mediterranean gas hub [28,29].
Based on the information above, we can say that the import of natural gas into the European Union can be ensured in two ways: By liquefied natural gas (LNG) or via pipeline natural gas (PNG). However, the most common way of transporting natural gas is still by pipeline. The most important producers that supply the European Union with gas are from the Russian Federation, Norway, Algeria, countries around the Caucasus, and countries from the Persian Gulf. In the last decade, increasing attention about the development of the European gas market has occurred, both by national states and academia [30,31,32].
This increased interest is due to a more general trend towards a return to energy security among the prominent political and academic issues, raised by a number of unexpected and turbulent events. This is also true for the gas sector, which is receiving considerable space in the current security discourse. The EU is now facing some crucial decisions [33]:
- What role will natural gas have in the energy mix?
- How will the internal gas market work?
- How will the security of the gas supply be ensured?
Naturally, these challenges affect all countries in the region, as the subprime mortgage crisis between 2007 and 2010 has clearly shown. In order to evaluate the current position and perspective of the EU countries within the ever-changing European market, there is also the necessity to consider the broader context, including the situation in producer areas, the main trends of the emerging “world” market (the growing importance of LNG and the emergence of unconventional US sources), and consequences for the security of the supply. The development of a gas supply in the form of LNG changes the European gas market, because these new forms influence the possibilities of transport and the importance of individual countries. For a qualified estimate of gas transit potential, it is necessary to estimate gas consumption in individual EU countries. A clear trend is the continuing decline in domestic production. The IEA estimates that production in the Netherlands will decline by more than 25 bcm/year and in the UK even more, around 50 bcm/year between 2015 and 2030, which is currently about 70% of the EU production [8].
It is estimated that in 2020, EU gas production will only be around 57% of the volume extracted in 2004. This would be partially covered by the increased production of Norway and the supply of liquefied natural gas, which would be more than double the current values (value of about 120 to 140 bcm/year) between 2015 and 2020. Nevertheless, the dependence on PNG transport from non-EU production areas will still grow. The IEA estimates that PNG supplies will be between 400 and 420 bcm in 2020. As imports from Norway are likely to be 120 bcm at this time, imports of gas from North Africa, Russia, and other areas will need to be about 280 to 300 bcm [8].
According to the IEA’s predictions [8], imports of natural gas should therefore increase to 425 bcm in 2020 and 516 bcm in 2030, which corresponds to an import dependency of 75% in 2020 and 83% in 2030. The main suppliers of natural gas currently include Russia (24% of EU consumption), Norway (15%), and Algeria (11%). Their import shares are 42%, 22%, and 18%. LNG shares about 9.4% of the total EU gas consumption. Its import share is about 15.6%. It can be expected that these three largest exporters will continue to hold their dominant position. In 2020, the predicted share is around 31% (Russia), 18% (Norway), and 17% (Algeria). A wider Caspian region (8% share in imports in 2020) could be a new source area, with supplies by the Nabucco pipeline and/or South Stream. There will also be a significant increase in the share of LNG supplies from West Africa (especially Nigeria) and the Persian Gulf (especially Qatar), which could cover up to 30% of EU imports in 2020. Ukraine has also committed to diversification of their supplies. This could be achieved by the LNG terminal project in Odessa with a capacity of 5 bcm in the first phase and 10 bcm in the second, through which Ukraine would import natural gas from Azerbaijan. The expected price of the terminal is between $1 billion and $1.2 billion, but Ukraine should receive financial support from the EU. It is estimated that the price of LNG could be around $190/tcm, compared to $250/tcm for Russian gas.
Based on this information, it is crucial to ensure some level of energy security. To achieve this, the following main principles were proposed [34]:
- Diversification.
- Accepting the (global) market and its principles.
- Strategic reserves in case of supply failure.
- Enough quality information (IEA).
- The interdependence of producers and consumers.
- Dialogue with new consumers (China, India).
- Greater efficiency, savings, research, and development.
Yergin [34] came up with his general principles of energy security from the example of the global oil trade. At the same time, he adds that these principles can be also applied to the gas trade. This is certainly possible at a theoretical level, especially if, like Yergin, we consider the gradually developing liquefied natural gas trade. However, most authors [35,36,37,38] stress the differences in the functioning of the gas market and the oil market. For example, as Orbánová [35] points out, the main differences arise from the different raw material transport requirements. Oil can be transported relatively easily, either by oil pipelines or by tankers, which allows a truly global market to operate, since oil loaded on a tanker can be brought anywhere and sold to anyone in the world. On the other hand, transport, and therefore also trade, of natural gas is inseparably linked to the existing pipeline network between producers and customers, which significantly determines and restrains business opportunities. The natural gas trade is thus much more regional in nature, against a truly global oil trade, where we can basically talk about three main markets—European, North American, and East Asian. Dependence on transport infrastructure in the form of gas pipelines linking producers to customers also has other impacts, including the existence of long-term gas supply contracts at pre-agreed prices, which are summarized in Table 1.
However, the regional gas market model has been recently partially disrupted by the increase of the LNG supply. The transport of liquefied natural gas by tankers partly brings elements known from the global oil trade to the gas trade. However, there are several problems that (for the time being) prevent the use of the same business rules for oil and for gas. Although the political goal of supply diversification could be achieved by this approach, an economic assessment of the terminal crucially depends on global LNG market development.
The construction and optimization of LNG plants is the subject to several studies [39,40,41,42,43,44]. For example, Alabdulkarem et al. [39] look at the optimization of LNG plants using genetic algorithms. Lim et al. [40] concluded that they expect steady growth in the LNG industry and called for improvements of efficiency. The Oxford Institute for Energy Studies [44] (2014) looked at the increasing costs within the LNG industry. An update of this study from 2018 informs about the decreasing costs of LNG plants during 2014 and 2018 [45]. At the same time, some researchers have studied the peculiarities of the entire LNG industry outside of the EU. For example, Lam [46] discussed the evolution of the LNG industry in Japan and compared this evolution with China and Hong Kong. Lin et al. [47] stressed the importance of LNG infrastructure for China.
3. Materials and Methods
3.1. Technical Model
For the LNG plant modeling, chemical-engineering models in the Aspen HYSYS V8.6 were used. For the calculations, a physical package “acid gas”, which is suitable for a description of acid gas treatment, was used. It contains predefined reactions alongside with all the necessary kinetics data. For the rest of the calculations, the physical package “Peng-Robinson” was used (see (1)–(5) [48,49] and Table 2).
where p is pressure [Pa], R is the universal gas constant [J⋅mol−1⋅K−1], T is the thermodynamic temperature [K], Vm is the molar volume [m3·mol−1], Tc is the critical temperature [K], pc is the critical pressure [Pa], and ω is the acentric factor [-].
LNG production generally consists of two phases—the processing of natural gas and liquefaction. Liquefaction is done by natural gas cooling. The resulting product temperature ranges between −159 and −162 °C [25].
3.1.1. Gas Sweetening
The main objective is the removal of hydrogen sulfide, the concentration of which has to be 4 ppmv at the most. Sulfur compounds are a catalytic poison and have corrosive properties. LNG production also requires a maximum concentration of CO2 to be 50 to 100 ppmv. The volume of carbon dioxide has to be reduced due to solid phase formation during liquefaction [50].
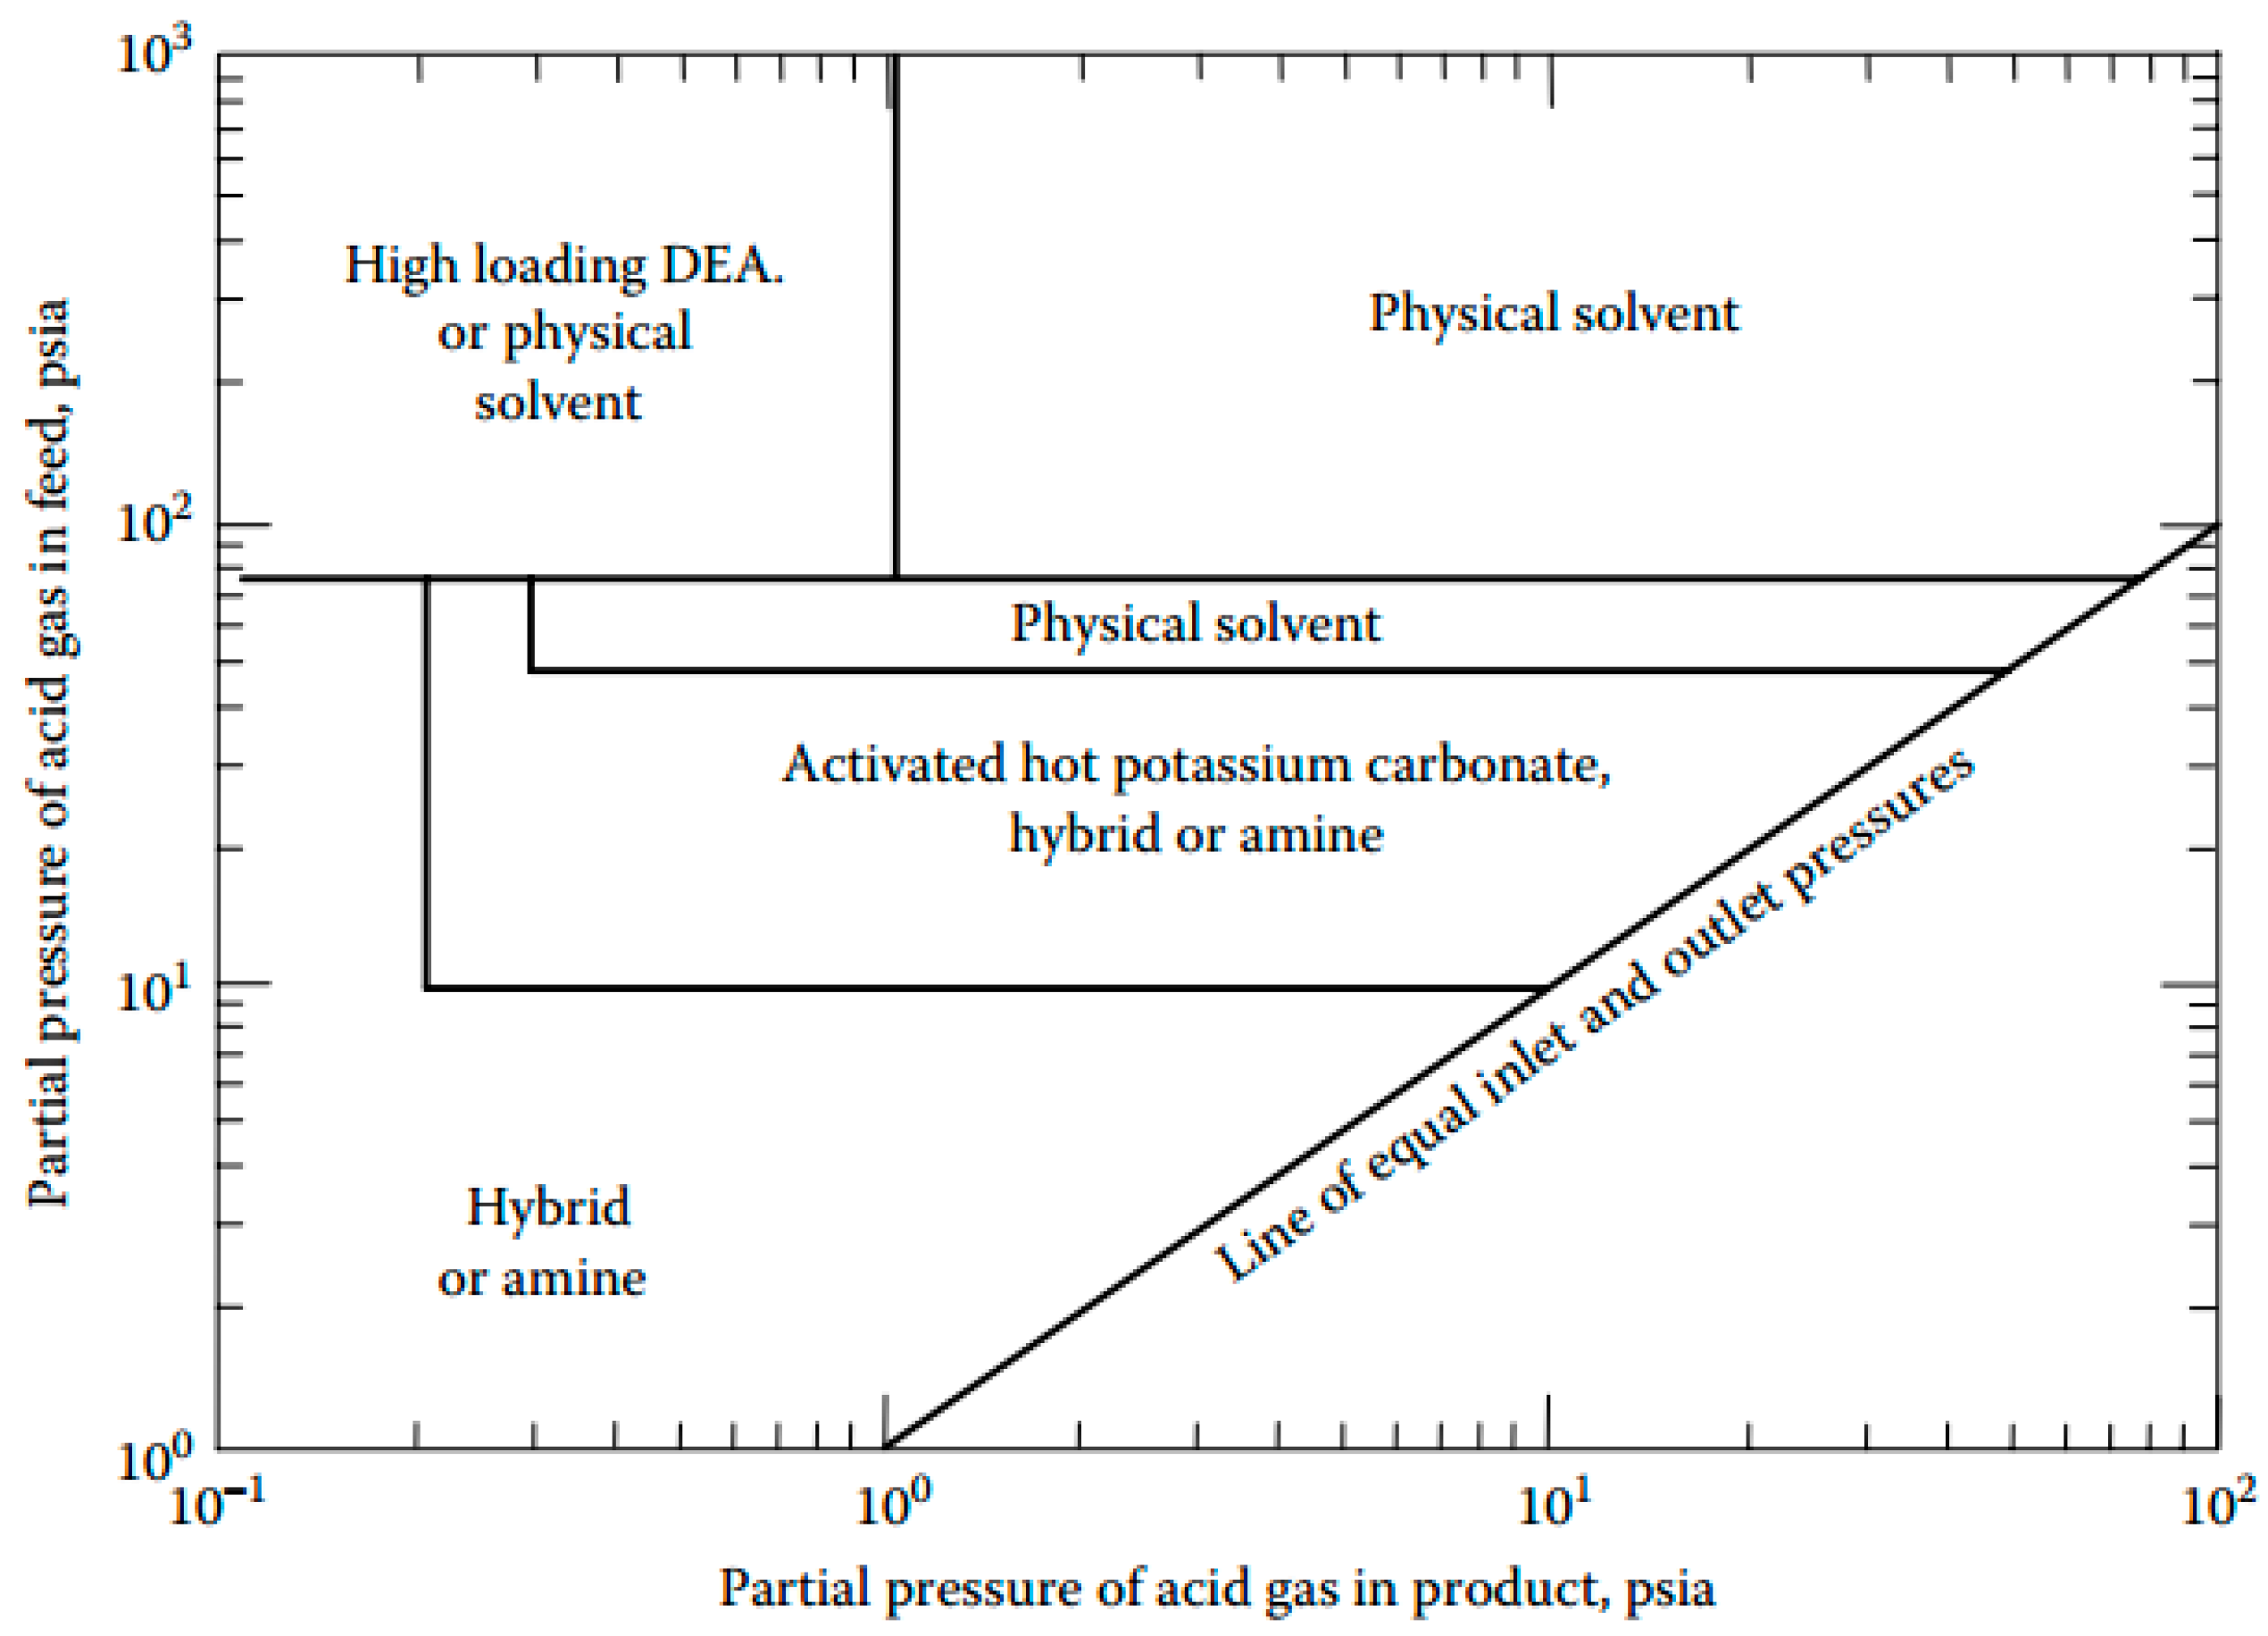
The choice of a specific gas sweetening process depends mostly on the material itself, the required selectivity, costs, environmental requirements, and the final product (quantity, composition). The diagram in Figure 2 can be used to choose the process [48].
The diagram above shows that the absorption to an amine should be used for this project. The amine absorption mechanism can be divided into the gas dissolution and the subsequent reaction of the weak amine base and weak CO2 or H2S. The dissolution of the gases is controlled mainly by the partial gas pressure and the reaction in the liquid phase is controlled mainly by the reactivity of the compounds. H2S reacts rapidly with primary, secondary, and tertiary amines according to the reaction (6) [51]:
The reaction of CO2 and amines is more complex. The CO2 in solution is in equilibrium with carbonic acid, which partially slowly dissociates into the bicarbonate ion. The resulting oxonium ions can only react with the amine. The summary reaction is:
3.1.2. Dehydration
The second necessary step in natural gas treatment, which follows acid gas removal, is the removal of water vapor. Gas saturated with water causes the formation of methane hydrates, which have a solid crystalline structure and can damage the valves and pipes. The water vapor itself increases the volume of gas, reduces its heating capacity, etc. Condensed water affects the flow of gas, causes corrosion, and ultimately, during the liquefaction itself, the ice particles clog the heat exchangers.
Natural gas specifications for normal use require a maximum water concentration of 20 ppmv. Such treated gas will not significantly contribute to corrosion of the pipeline. However, in the case of the production of liquefied natural gas, it is necessary to reduce the water content to about 1 ppmv in order to avoid the formation of hydrates during the cryogenic separation of heavier hydrocarbons. Since there is this limiting condition, the usage of zeolite adsorption is the most suitable method [51,52]. This part was not directly modeled in the Aspen HYSYS. The methodology of the calculation was taken from [51]. The first step is to determine the bed diameter, which depends on the superficial velocity. The pressure drop is determined by a modified Ergun equation, which relates the pressure drop to the superficial velocity as follows:
which gives the superficial velocity as:
Then, the corresponding minimum column diameter is calculated and selected to be close to the standard diameter:
where q is obtained from the gas sweetening simulation. A separate gas stream is considered to regenerate the columns. The energy required for regeneration, Q, is calculated from the four equations describing the heating of water, zeolites, and column shells. In addition, 10% heat loss from the system to the surroundings and 40% of the heat is transferred to the bed and walls and the rest is lost in the exiting gas. Imperial units are taken from the original source:
where m is the mass of (w = water, si = sieve, st = steel), and T is the temperature (rg = the regeneration temperature of the gas that enters the bed, i = inlet gas temperature).
3.1.3. Liquefaction
The last step for the production of LNG is the liquefaction of the gas itself. Liquefaction technologies are based on cooling cycles, where the heat is drawn off from the inlet gas. Ongoing cooling results of repeated cooling cycles lead to the condensation and liquefaction of gas. The refrigerant circulates in the process through a condenser or heat exchanger. To achieve the extremely low temperatures necessary to produce LNG, the process is divided into several steps, where the gas is gradually cooled down.
The most common liquefaction technology for natural gas is the propane precooled mixed refrigerant (C3-MR) process. This process uses a mixture of methane, ethane, propane, and nitrogen. At first, CNG is cooled to −35 °C by a smaller propane cooler and then is liquefied in a primary heat exchanger. The condensation of the liquefaction mixture occurs at the same time. Both the mixture and natural gas are liquefied by expansion-based liquefaction processes, for example, by Joule-Thomson valves [50].
3.2. Economic Model
3.2.1. Costs and Financing
One of the key economic variables is the interest rate paid for the initial investment. In the model, researchers consider an interest rate of 3.5% to 20 years, as it is the prevailing current interest rate in the EU market [53].
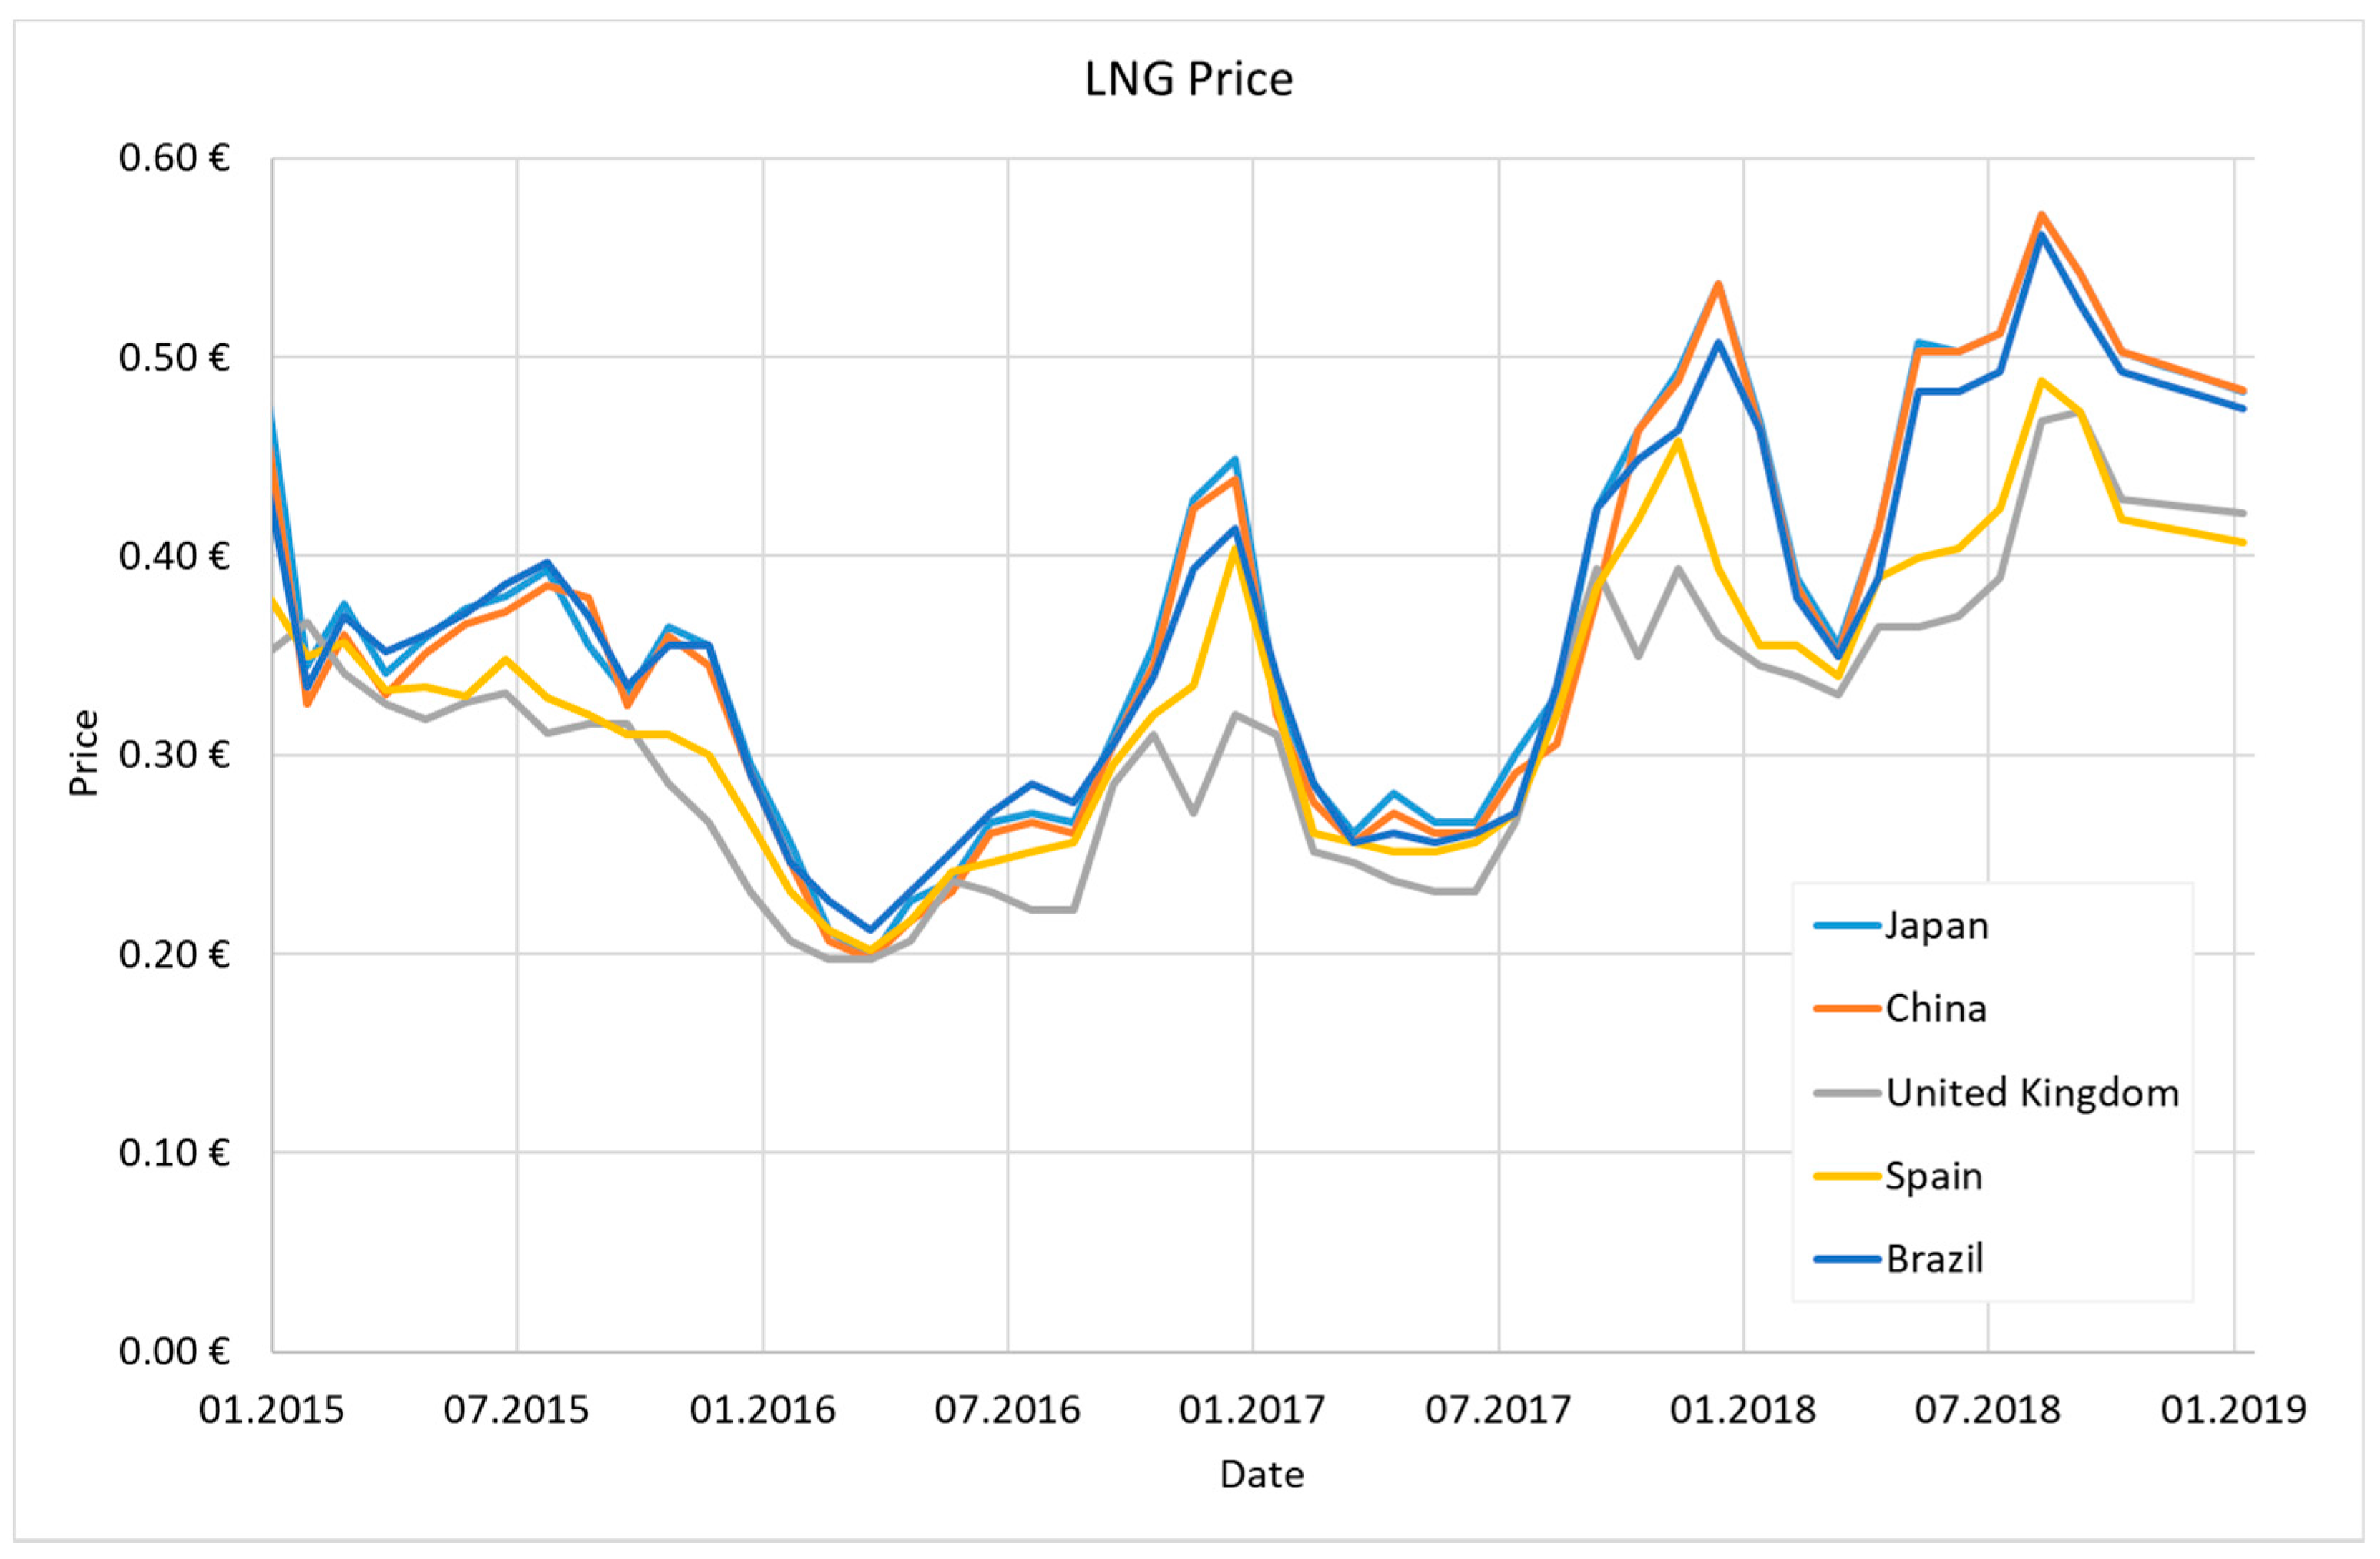
It is necessary to estimate the investment costs for the construction of the factory, in order to evaluate its profitability. The investment costs will be estimated as the average investment costs of similar projects in the world. In the literature, it is possible to find tones per annum (TPA), which corresponds to the amount of investment per ton of LNG produced. The values in the literature are around EUR 1000 per TPA. A factory of such a size is built within 4 years and costs approximately three million euros [44,45] Additionally, all factories producing CO2 are obliged to pay emission allowances [54]. An LNG plant generates roughly around 0.3 tons of CO2 per 1 ton of LNG [55]. One emission allowance corresponds to 1 ton of CO2 released. For labor costs, the growth of wages was estimated to 2.7% per year according to the current conditions prevailing in the market [56]. Depreciation is set to 20 years [22,57,58]. Price for electricity was obtained from the Eurostat [59] and the price of natural gas was taken from a meta-analysis of a biogas plant [18], which estimated the mean price as 1.91 EuroCt per kWh. Excise duty was taken from the Energy Tax Directive 2003/96/EC as 2.6 EUR per gigajoule [60]. The price of LNG is shown in Figure 3, which shows the world prices of LNG in € per kg. For the model, an average of the price development for the United Kingdom and Spain was considered.
3.2.2. Economic Indicators
To economically evaluate the investment, the net present value indicator was used. The net present value is the sum of the current (discounted) values of all cash flows (investments). It is the financial quantity that expresses the total current (i.e., discounted) value of all cash flows associated with the investment project. It is used as a criterion for evaluating the profitability of investment projects. It is calculated by Equation (12):
where CFk is the cash flow at year k obtained from revenues minus costs; k is the length of the project in years; r is the capital cost.
When comparing more investment alternatives, higher NPVs are preferred [62,63]. The discount rate is defined as a risk-free rate. Given the risks of the project and using similar investments, researchers approximated the discount rate to be 10% based on a previous study [57]. Finally, according to the NPV calculated is whether the investment pays off.
The internal rate of return, usually referred to as the IRR, is the indicator of the relative revenues (profitability) the project provides during its life cycle (13):
where CFk is the cash flow at year k; k is the length of the project in years [64,65].
Numerically, it is equal to the discount rate at which the NPV is equal to zero. For investments with a life span of over 2 years, it is calculated using iterative methods. Investment according to this criterion is acceptable if the IRR is greater than the discount rate or WACC (weighted average cost of capital).
The statistical model, ARIMA, was used to forecast the price of LNG, price of electricity, price of gas, price of emission allowances, and LNG demand. It has three parameters, p, d, and q. It consists of the autoregression process of the order, p (denotes AR(p)), the integrated process of the order, d (denotes I(d)—the parameter, d, represents the order of the used difference to stabilize the time series), and the process of moving averages of the order, q (denotes MA(q)). The model can be written in the form of:
where Φp(B) denotes the (operator) part of the autoregression process of the order, p, (1–B)d represents part of the integrated process of the order, d, and Θq(B) denotes a part of the moving average of the q order in the ARIMA model (all using the time shift q). If d = 0, ARIMA is reduced to ARMA (p, q) and similarly with IMA (d, q) and ARI (p, d).
For the parameters p, d, and q, the AIC (Akaike information criterion), AICc (corrected Akaike information criterion), and BIC (Bayesian information criterion) need to be evaluated. These criteria are thoroughly explained in [66].
The Akaike information criterion (AIC) is a relative measure of the fitting quality. This criterion determines the smallest order for the model:
where denotes the maximum likelihood estimate value of the parameter, , which is the vector of the parameters estimated from the maximum likelihood, and K is the number of estimated parameters [67].
The AIC may provide poor performance if there are many parameters for the sample size. For small sample sizes (N/K < ~40), the corrected AIC (AICc) should be used [68,69]:
where N is the sample size.
The Bayesian information criterion (BIC), also called the Schwarz criterion, is a criterion for grading models based on the posteriori probability of the models being compared [70]. This criterion is based on the Bayes theorem and the approximation of the Laplace integrals to derive the bias of the support function, defining the information criterion given as:
where is the chosen model.
The statistical program, R, was used for ARIMA modeling. The selection of the proper ARIMA model (p, d, q order) was done by the auto.arima function on the 80% confidence level. This function returns the best ARIMA (p, d, q) model according to either the AIC, AICc, or BIC value. The function conducts a search over a range of possible models within the order constraints provided [71]. This lower confidence level was chosen, as the prediction was done for a relatively long time interval.
4. Results
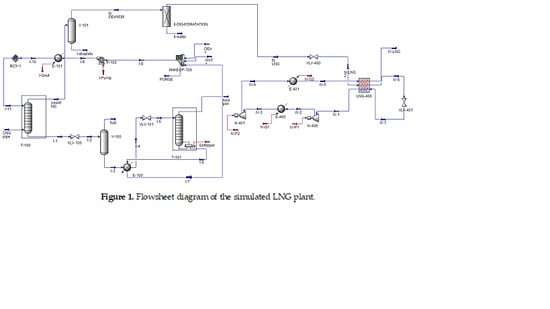
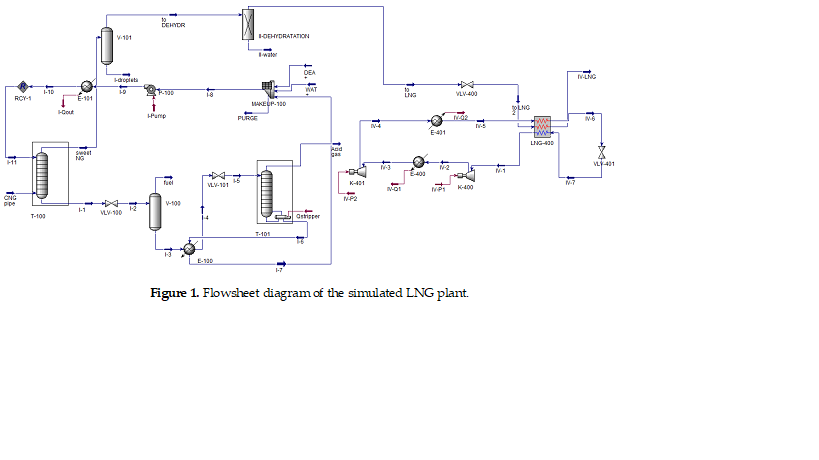
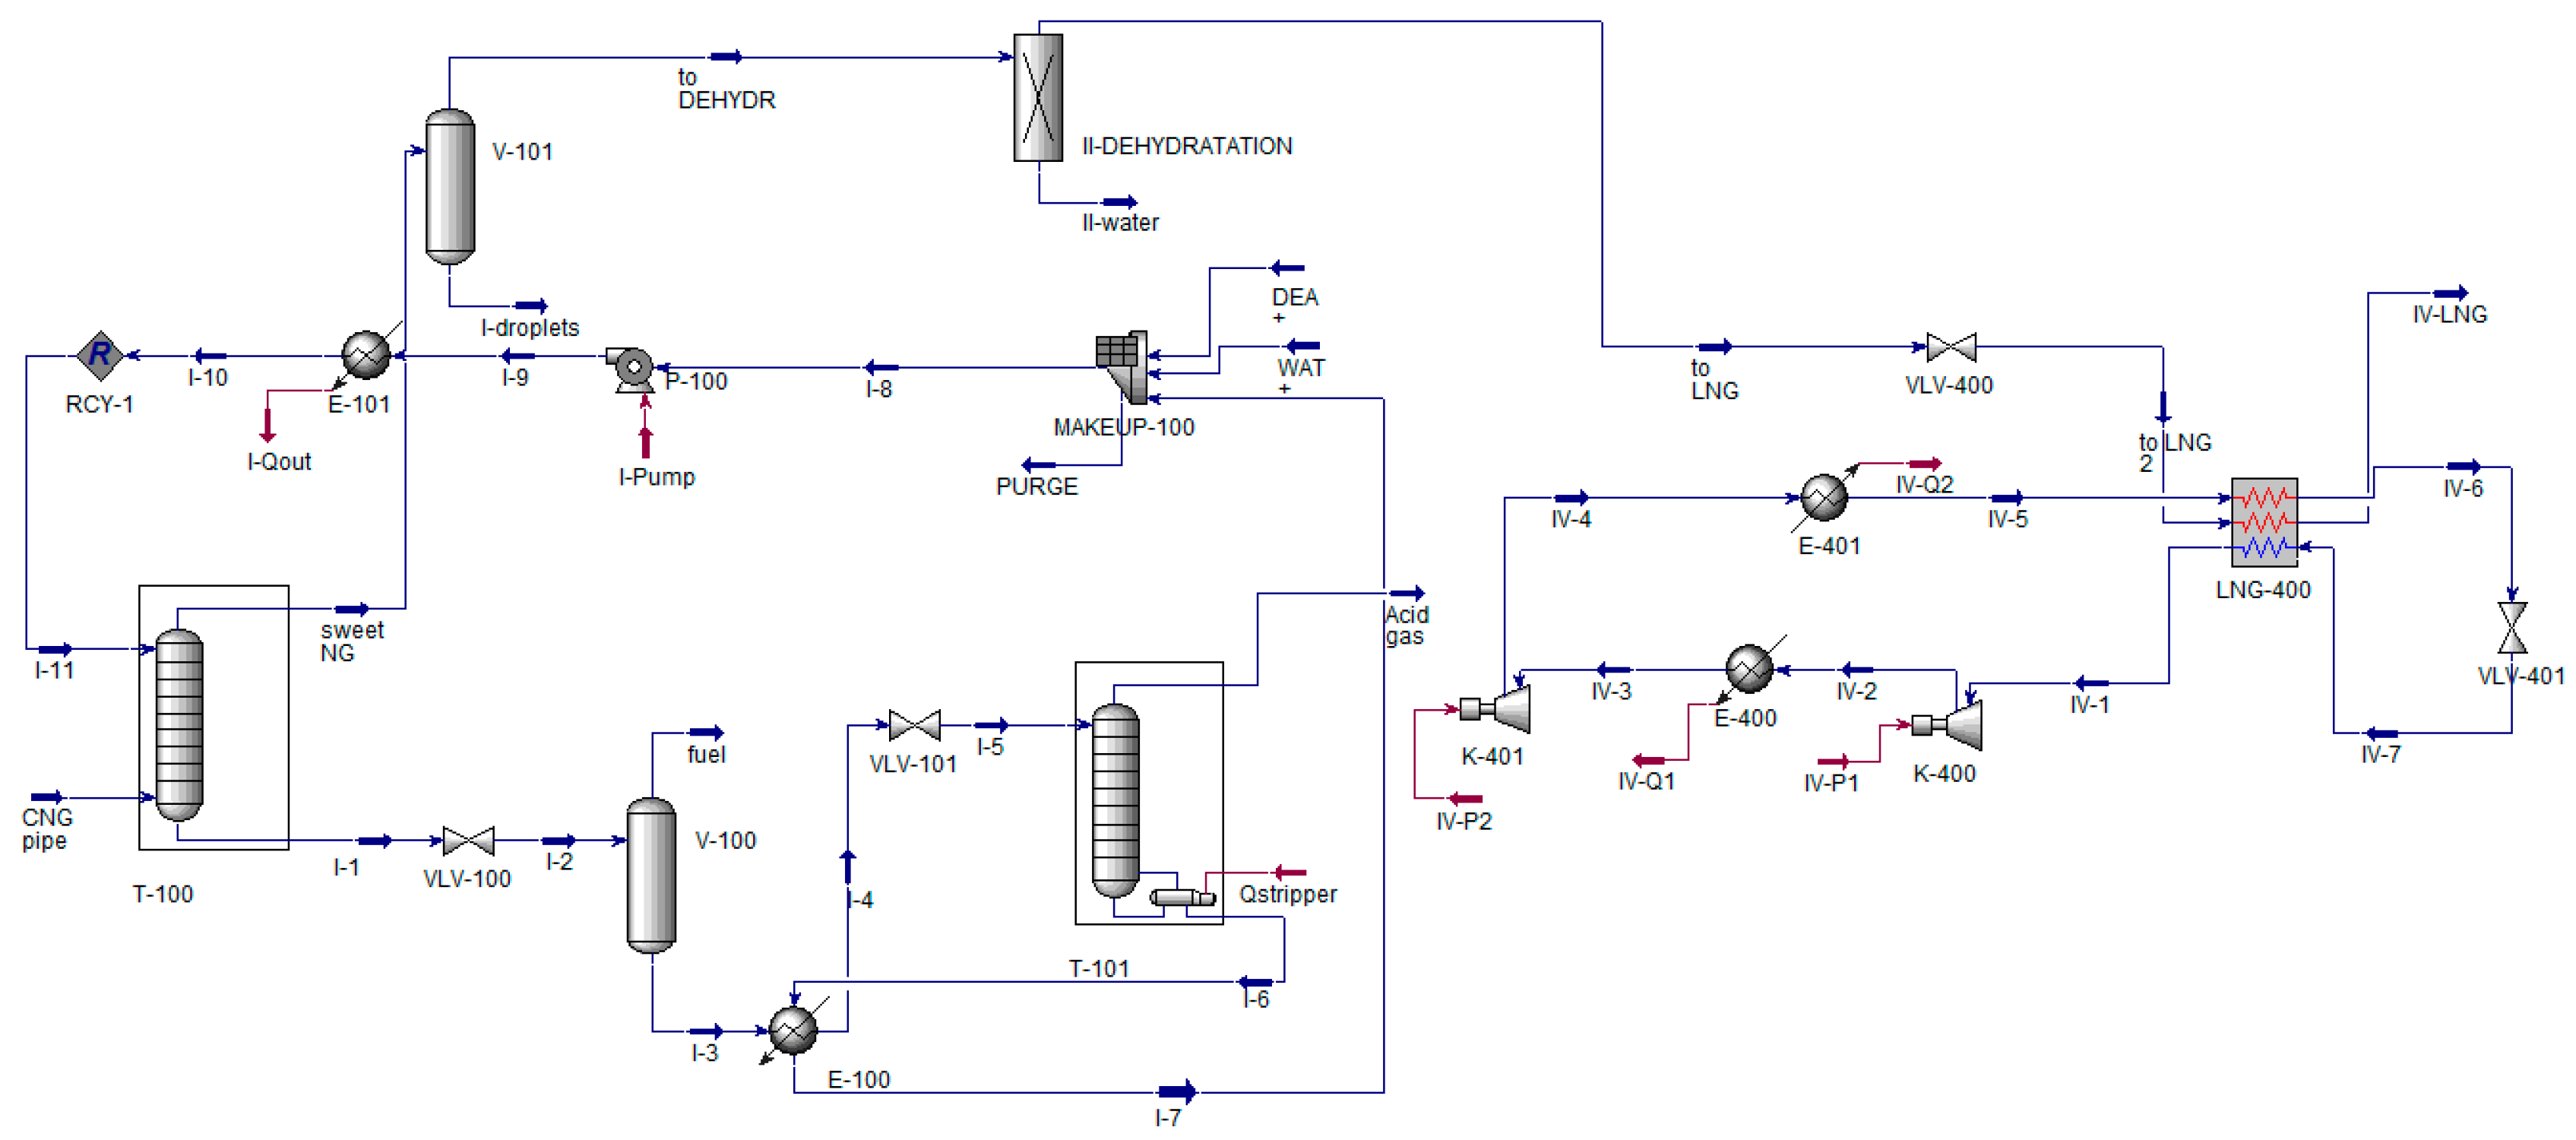
Technology simulation was conducted in Aspen HYSYS software with the physical packages “Acid gas” for a description of the acid gas treatment and the “Peng-Robinson” package for the other simulations. In Figure 4, the simulated process flowsheet is presented.
In the first part, the acid gas treatment was done by a 15 stages absorption column with a standard pressure drop of 20 kPa per stage. The purified gas saturated by water is taken off the head of this column and from the bottom, and leaves a liquid containing diethanolamine (DEA) and acid gases. The gas goes into the separator, where part of the redundant water is stripped. Liquid is processed by flash separation under the lower pressure to remove dissolved hydrocarbons. These could be used as a fuel. The liquid with water and DEA with acid gas continues into the heat exchanger and to the head of the stripper, where acid gas is separated. The stripper has 10 stages with a 3 kPa pressure drop. Cleaned liquid is regenerated to the previous concentration of DEA and water, pressured, and heated up to the temperature of the inlet at the head of the absorber. Saturated purified gas goes into the dehydration part. The dehydration was calculated manually according to the methods described in Section 3.1.2. and the results were set up into the component splitter. Dry gas was then liquefied. The liquefaction was set up according to the standard process conditions [50] with the cooling medium described in Section 3.1.3. The natural gas enters the process by a CNG pipe and liquefied natural gas exits through the IV-LNG output.
Simulation of the LNG plant was performed for a given initial investment of 3 million EUR. The resulting information obtained from the simulation is the energy consumption and a necessary amount of natural gas going to the process—see Table 3.
From Table 3, an interesting finding is an excessive use of energy in the gas cleaning process. This process uses 10.7% of the whole energy consumption. A similar process of cleaning is being done right after the natural gas extraction. Raw gas contains hydrocarbons, noncombustible gases, inert gases, contaminants, water, and even NORM (naturally occurring radioactive material) [72]. Most of these substances are stripped out on some defined level before it is sent to pipeline. If the cleaning standard is stricter, gas cleaning will not be necessary. It can be expected that a lowering of the concentration on a cleaning side would definitely be cheaper than building a whole new cleaning unit right next to the liquefaction unit. In the case of biogas usage, the whole process of CO2 removal should be included in one cleaning step to avoid duplication of the processes.
It can be clearly seen that most of the energy consumption originates from liquefaction—89.3%. These results are used as inputs into the economic model for the calculation of the costs and revenues, based on the ARIMA forecasting. Cost consists of the price of electricity, emission allowances, wages, excise duty, and investment to the factory itself with a loan interest. The revenue was calculated from the price of LNG in the EU. The identification of the ARIMA models for each time series is shown in Table 4.
According to the results from forecasting, the cost-revenue analysis was conducted. The contribution to cost is shown in Table 5.
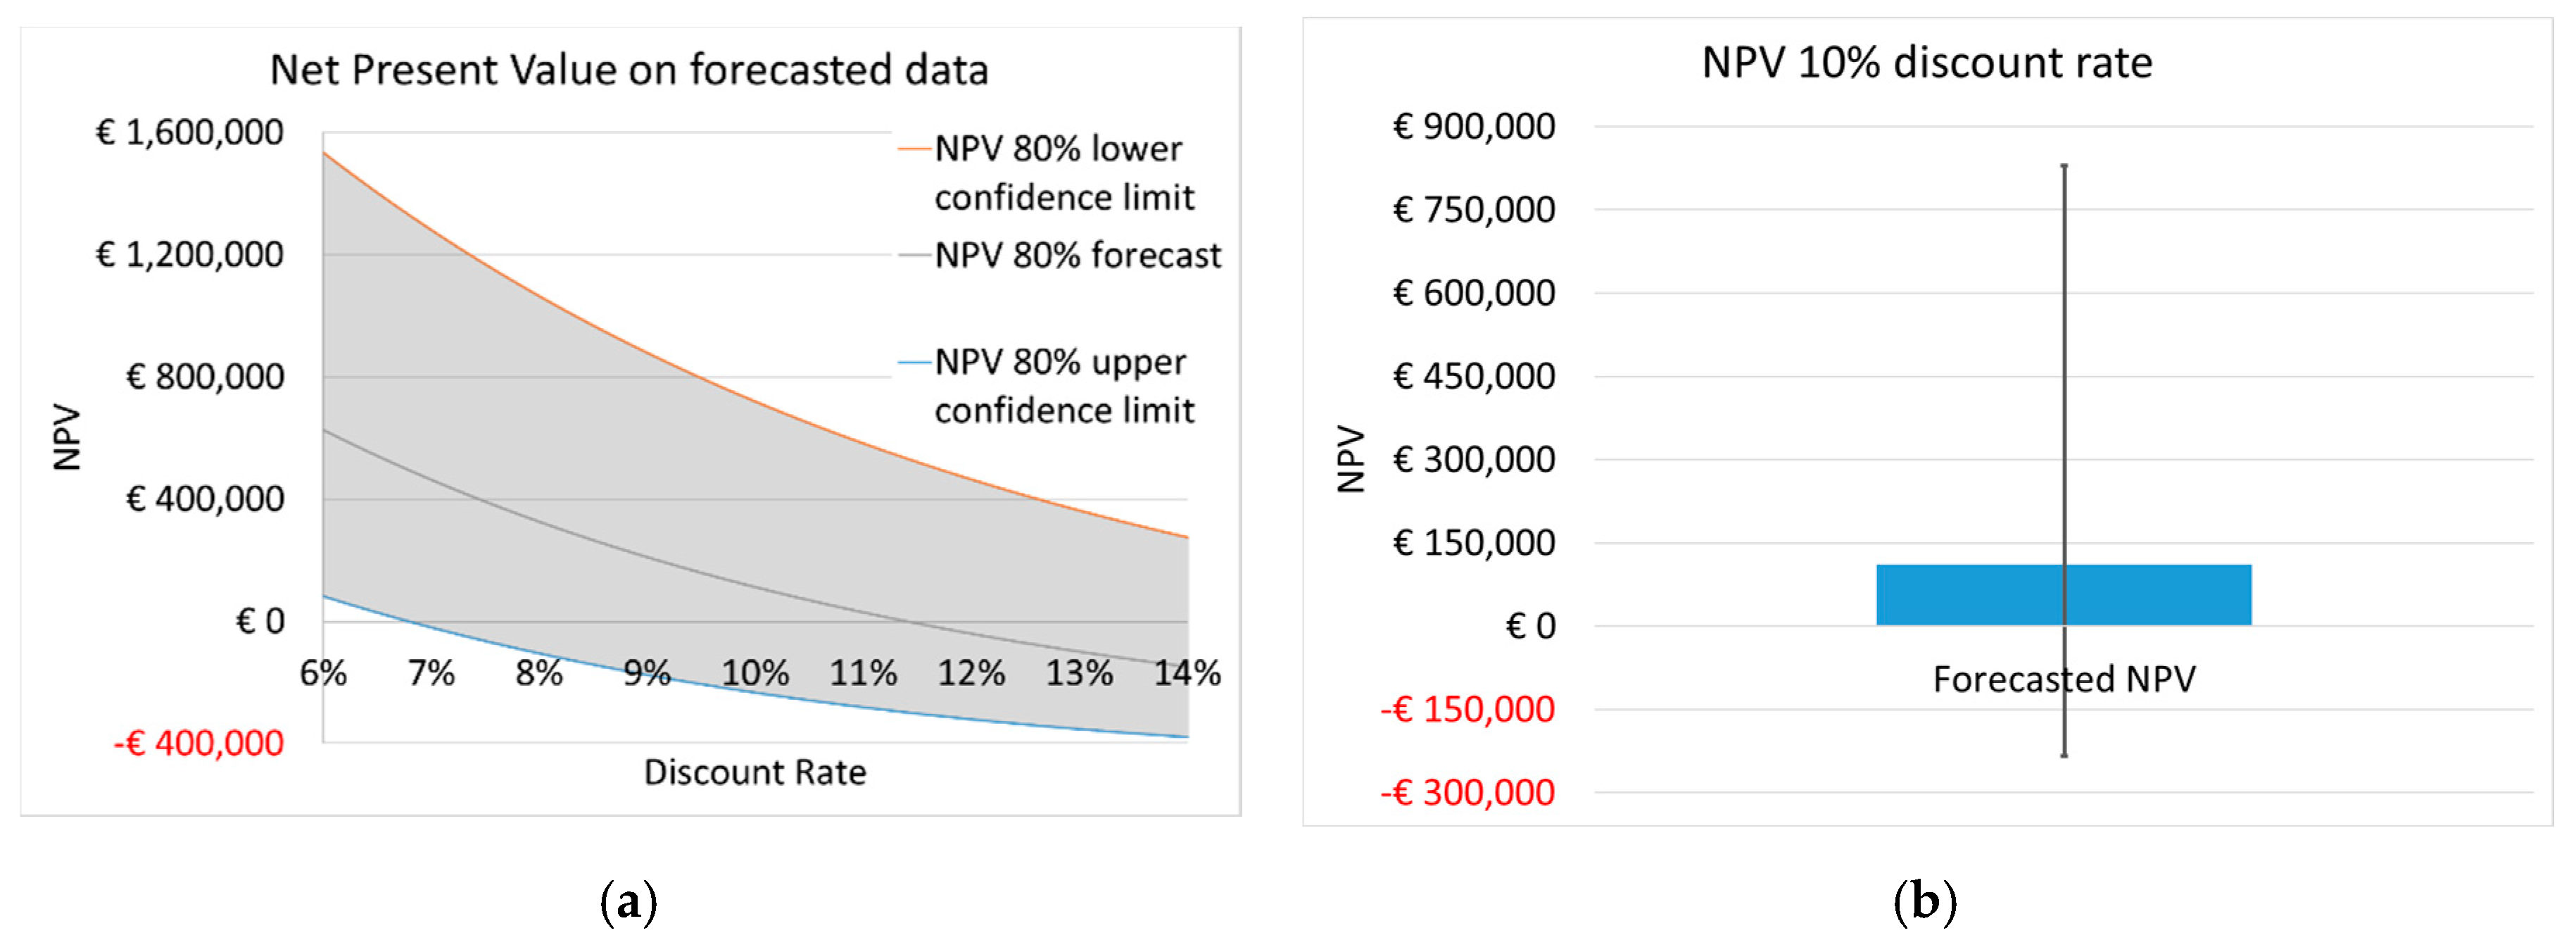
Because a significant part of the analysis is based on ARIMA forecasting, results have to contain a confidence interval. The resulting NPV with an 80% confidence interval is presented in Figure 5. The semi-transparent gray area contains an 80% confidence level, which is bounded by upper (orange) and lower (blue) confidence limits with forecasted NPV (grey).
In Figure 5a, it can be observed that the NPVs have the form of a quadratic function of the discount rate. As mentioned above, the industry’s discount rate is around 10%. Let us assume this value is fixed and conduct the NPV forecasting. The results of this are displayed in Figure 5b. The results of this model show that the net present value forecast is mostly positive.
5. Discussion
In the article, a chemical-engineering model of an LNG plant was used. In the center of this model is a C3-MR process, which is commonly used. For the presented small scale LNG plant, the MSMR (modified single mixed refrigerant) or PNEC (parallel nitrogen expansion) liquefaction process may fit better, since the mixed refrigerant liquefaction process is not that thermally efficient [22]. The authors used the same physical model as Peng-Robinson. In the paper [21], a small bio-LNG plant was designed. The removal of CO2 was also discussed there. Also, different physical models, “Refprop” alongside with Peng-Robinson, were used. The liquefaction process presented in [21] consisted only of two-pressure levels. They used a Joule-Brayton reverse cycle with nitrogen as the working fluid for liquefaction.
Khan et al. [73] analyzed the efficiency of nitrogen single and dual expander processes, showing that for optimized configurations, the specific energy requirement for a single expander is 0.745 kWh/kg LNG produced, while 0.501 kWh/kg LNG is obtained for dual expander [21]. According to He et al. [22], the proposed MSMR process takes 0.411 kWh/kg LNG, whereas the PNEC process consumes more energy with 0.618 kWh/kg LNG. This research obtained similar results with the proposed design, which is a consumption of energy of 0.653 kWh per 1 kg of LNG. This can be expected, because a similar technology with expanders was used.
The outlook for price electricity can be found in [74], where a more or less similar price is predicted (considering the forecast for the year of 2040). The trend in [74] is slightly different. The price predicted in this current paper exhibits a linear and almost non-changing trend. Results between 2020 and 2050 are €87 ± €6.5. On the other hand, the authors in [75] showed a constant price increase of electricity per annum. During the years of 2020, 2025, 2030, 2040, and 2050, the price is forecasted to be €59.3, €68.9, €77.8, €94.5, and €100.4, respectively.
The forecast of emission allowances in this paper exhibits a linear trend. Between 2020 and 2030, there is a slow increase in the price accounting for approximately €2 per year. From the year of 2030, it shows an annual increase of approximately €5 per annum. Namely, in the years, 2020, 2030, 2040, and 2050, the prices are predicted to be €10, €33, €81, and €130, respectively. This forecast is slightly different from the forecast presented in [75], where the authors predicted a faster growth of the price. Specifically, for the same years, they predicted €10, €40, €65, and €76, respectively [75]. Similarly, different results can be found also in [76], where the price in 2020 is on the level of approximately €20. For the year of 2030, the authors predicted €42.5 and for the year of 2040 they predicted €65 per allowance, which is similar to this current study [76]. The same behavior for 2020 was predicted in [77]. In 2030, the predicted price is between €20.1 and €40.6 per allowance [77]. The ARIMA model used in this study was commonly used in many other studies [78,79,80].
Prospects for liquefied natural gas are promising [81,82]. That corresponds with the results in this paper. According to analysis of the Organization for Economic Co-operation and Development (OECD) countries, LNG grows steadily [83]. The key aspect of profitability is the scalability of the project. Research conducted in this paper shows that a relatively small LNG plant can be a relatively good investment. Similar results can be found in many articles concerning small-scale LNG plants with similar technology [21,22,23,84].
6. Conclusions
In this paper, a detailed content analysis of liquefied natural gas production was conducted. It was done using suitable technology for the liquefaction of natural gas obtained in the form of biogas. According to the presented results, it is possible to design a sustainable and competitive alternative to conventional fuels in the absence of infrastructure. Decentralization of LNG production around the EU may help to spread the use of LNG as a fuel for vehicles. To analyze both the technical and economic part of the situation, the researchers conducted a chemical-engineering model in Aspen HYSYS and the results from the model were used for the economical evaluation of the net present value. The NPV analysis considered the forecasted prices of electricity, gas, emission allowances, wages, excise duty, and investment to the factory itself, with loan interest on the one hand and the revenues from the LNG on other hand. To enhance the prediction power of the provided economic model, a time series analysis ARIMA was performed to predict the realistic development of future prices. Using the results of this research, it can be concluded that the project seems to be profitable. This is true without any government subsidy. It can be expected that these kinds of projects would be supported by the EU, as they are in accordance with the long-term goal of sustainable and clean energy. Providing these subsidies would improve the profitability of these projects and would lead to desirable decentralization of energy production across Europe. This would necessarily lead to higher energy security in the European Union.
Author Contributions
V.H., P.P., M.O. and L.S. designed methodology; V.H., P.P., M.O., L.S. and V.K. performed the calculation and analyzed the data; V.H., P.P., M.O.; L.S. and V.K. wrote the paper.
Funding
This research was funded by the Internal Grant Agency of the Faculty of Economics and Management Czech University of Life Sciences, Prague. Grant number (20181018).
Acknowledgments
This paper is supported by a grant project of the Internal Grant Agency of the Faculty of Economics and Management Czech University of Life Sciences, Prague. The project title is “Economic specifics of the post-Soviet countries (20181018)”.
Conflicts of Interest
The authors declare no conflict of interest.
References
- Arteconi, A.; Polonara, F. LNG as vehicle fuel and the problem of supply: The Italian case study. Energy Policy 2013, 62, 503–512. [Google Scholar] [CrossRef]
- European Commission. Green Paper: Towards a European Strategy for the Security of Energy Supply; European Commission: Luxembourg, 2001. [Google Scholar]
- Pfoser, S.; Schauer, O.; Costa, Y. Acceptance of LNG as an alternative fuel: Determinants and policy implications. Energy Policy 2018, 120, 259–267. [Google Scholar] [CrossRef]
- Enteria, N.; Yoshino, H.; Takaki, R.; Mochida, A.; Satake, A.; Baba, S.; Ishihara, H.; Yoshie, R. Case analysis of utilizing alternative energy sources and technologies for the single family detached house. Sol. Energy 2014, 105, 243–263. [Google Scholar] [CrossRef]
- Kruyt, B.; Lehning, M.; Kahl, A. Potential contributions of wind power to a stable and highly renewable Swiss power supply. Appl. Energy 2017, 192, 1–11. [Google Scholar] [CrossRef]
- Vlk, F. Alternativní pohony motorových vozidel. Soud. Inž. 2004, 4, 212–224. [Google Scholar]
- Arteconi, A.; Brandoni, C.; Evangelista, D.; Polonara, F. Life-cycle greenhouse gas analysis of LNG as a heavy vehicle fuel in Europe. Appl. Energy 2010, 87, 2005–2013. [Google Scholar] [CrossRef]
- International Energy Agency. Market Report Series: Gas 2018. Available online: https://webstore.iea.org/download/summary/1235?fileName=English-Gas-2018-ES.pdf. (accessed on 9 April 2019).
- Khan, M.I.; Yasmin, T.; Shakoor, A. Technical overview of compressed natural gas (CNG) as a transportation fuel. Renew. Sustain. Energy Rev. 2015, 51, 785–797. [Google Scholar] [CrossRef]
- British Petroleum BP Statistical Review of World Energy 2018. Available online: https://www.bp.com/content/dam/bp/en/corporate/pdf/energy-economics/statistical-review/bp-stats-review-2018-full-report.pdf. (accessed on 11 November 2018).
- Bittante, A.; Pettersson, F.; Saxén, H. Optimization of a small-scale LNG supply chain. Energy 2018, 148, 79–89. [Google Scholar] [CrossRef]
- Severová, L.; Svoboda, R.; Kopecká, L. Increase in prices of farmland in the Czech Republic. Prop. Manag. 2017, 35, 326–338. [Google Scholar] [CrossRef]
- Svoboda, R.; Severová, L. Regional Cooperation of Farmers and Producers of Organic Food in the Czech Republic and EU (Federal Republic of Germany). In Proceedings of the International Scientific Conference on Opportunities and Threats to Current Business Management in Cross-Border Comparison, Pilsen, Czech Republic, 2015; pp. 93–99. [Google Scholar]
- Sredl, K.; Mikhalkina, E. Regional Characteristics of the Development of Agricultural Enterprises in the Czech Republic. In Proceedings of the International Scientific Conference on Opportunities and Threats to Current Business Management in Cross-Border Comparison, Pilsen, Czech Republic, 2015; pp. 107–115. [Google Scholar]
- Sredl, K.; Rodonaia, E. Comparison of Conventional and Organic Farming of Agricultural Companies in the Czech Republic and Germany. In Proceedings of the International Scientific Conference on Opportunities and Threats to Current Business Management in Cross-Border Comparison, Pilsen, Czech Republic, 2017; pp. 157–162. [Google Scholar]
- Pongas, E.; Todorova, A.; Gambini, G. Statistical Analysis of EU Trade in Energy Products, with Focus on Trade with the Russian Federation. Available online: https://ec.europa.eu/eurostat/statistics-explained/index.php/Archive:Trade_in_energy_products (accessed on 12 January 2019).
- Osorio-Tejada, J.; Llera, E.; Scarpellini, S. LNG: An alternative fuel for road freight transport in Europe. WIT Press 2015, 168, 235–246. [Google Scholar] [CrossRef]
- Herbes, C.; Halbherr, V.; Braun, L. Factors influencing prices for heat from biogas plants. Appl. Energy 2018, 221, 308–318. [Google Scholar] [CrossRef]
- Simmer, L.; Aschauer, G.; Schauer, O.; Pfoser, S. LNG as an alternative fuel: The steps towards European implementation. WIT Press 2014, 186, 887–898. [Google Scholar] [CrossRef]
- European Commission BIOLNG4EU. Available online: https://ec.europa.eu/inea/en/connecting-europe-facility/cef-transport/2016-nl-tm-0339-s (accessed on 22 March 2019).
- Baccioli, A.; Antonelli, M.; Frigo, S.; Desideri, U.; Pasini, G. Small scale bio-LNG plant: Comparison of different biogas upgrading techniques. Appl. Energy 2018, 217, 328–335. [Google Scholar] [CrossRef]
- He, T.; Liu, Z.; Ju, Y.; Parvez, A.M. A comprehensive optimization and comparison of modified single mixed refrigerant and parallel nitrogen expansion liquefaction process for small-scale mobile LNG plant. Energy 2019, 167, 1–12. [Google Scholar] [CrossRef]
- Kanbur, B.B.; Xiang, L.; Dubey, S.; Choo, F.H.; Duan, F. Finite sum based thermoeconomic and sustainable analyses of the small scale LNG cold utilized power generation systems. Appl. Energy 2018, 220, 944–961. [Google Scholar] [CrossRef]
- Ancona, M.A.; Bianchi, M.; Branchini, L.; De Pascale, A.; Melino, F.; Mormile, M.; Palella, M.; Scarponi, L.B. Investigation on small-scale low pressure LNG production process. Appl. Energy 2018, 227, 672–685. [Google Scholar] [CrossRef]
- Möller, A. Material and Energy Flow-Based Cost Accounting. Chem. Eng. Technol. 2010. [Google Scholar] [CrossRef]
- European Parliament Energy Policy: General Principles. Available online: http://www.europarl.europa.eu/factsheets/en/sheet/68/energy-policy-general-principles (accessed on 7 December 2018).
- Schulte, S.; Weiser, F. LNG import quotas in Lithuania—Economic effects of breaking Gazprom’s natural gas monopoly. Energy Econ. 2019, 78, 174–181. [Google Scholar] [CrossRef]
- European Commission. Orient—East Med. Available online: https://ec.europa.eu/transport/themes/infrastructure/orient-east-med_de (accessed on 8 April 2019).
- Edison.it. EastMed Pipeline. Available online: https://www.edison.it/en/eastmed-pipeline (accessed on 8 April 2019).
- Prpich, G.; Coulon, F. Assessing unconventional natural gas development: Understanding risks in the context of the EU. Curr. Opin. Environ. Sci. Health 2018, 3, 47–51. [Google Scholar] [CrossRef]
- Madžarević, A.; Ivezić, D.; Živković, M.; Tanasijević, M.; Ivić, M. Assessment of vulnerability of natural gas supply in Serbia: State and perspective. Energy Policy 2018, 121, 415–425. [Google Scholar] [CrossRef]
- Ruble, I. European Union energy supply security: The benefits of natural gas imports from the Eastern Mediterranean. Energy Policy 2017, 105, 341–353. [Google Scholar] [CrossRef]
- Chalvatzis, K.J.; Ioannidis, A. Energy supply security in the EU: Benchmarking diversity and dependence of primary energy. Appl. Energy 2017, 207, 465–476. [Google Scholar] [CrossRef]
- Yergin, D. Ensuring Energy Security. Foreign Aff. 2006, 85, 69. [Google Scholar] [CrossRef]
- Orbánová, A. Moc, Energie a Nový Ruský Imperialismus; Argo: Praha, Czech Republic, 2010; ISBN 978-80-257-0251-2. [Google Scholar]
- Egenhofer, C.; Grigoriev, L.; Socor, V.; Riley, A. European Energy Security: What Should It Mean? What to Do? Centre for European Policy Studies: Brussels, Belgium, 2006; ISBN 978-92-9079-667-1. [Google Scholar]
- Dančák, B. Energetická Bezpečnost a Zájmy Česke Republiky; Masarykova University, Mezinárodní Politologický Ústav: Brno, Czech Republic, 2007; ISBN 978-80-210-4440-1. [Google Scholar]
- Jesień, L. The Future of European Energy Security: Interdisciplinary Conference; Tischner European University: Kraków, Poland, 2006; ISBN 978-83-60125-80-9. [Google Scholar]
- Alabdulkarem, A.; Mortazavi, A.; Hwang, Y.; Radermacher, R.; Rogers, P. Optimization of propane pre-cooled mixed refrigerant LNG plant. Appl. Therm. Eng. 2011, 31, 1091–1098. [Google Scholar] [CrossRef]
- Lim, W.; Choi, K.; Moon, I. Current Status and Perspectives of Liquefied Natural Gas (LNG) Plant Design. Ind. Eng. Chem. Res. 2013, 52, 3065–3088. [Google Scholar] [CrossRef]
- Mortazavi, A.; Somers, C.; Hwang, Y.; Radermacher, R.; Rodgers, P.; Al-Hashimi, S. Performance enhancement of propane pre-cooled mixed refrigerant LNG plant. Appl. Energy 2012, 93, 125–131. [Google Scholar] [CrossRef]
- Jensen, J.B.; Skogestad, S. Optimal operation of a mixed fluid cascade LNG plant. In Computer Aided Chemical Engineering; Elsevier: Amsterdam, Netherlands, 2006; Volume 21, pp. 1569–1574. ISBN 978-0-444-52969-5. [Google Scholar]
- Hasan, M.M.F.; Karimi, I.A.; Alfadala, H.E. Optimizing Compressor Operations in an LNG Plant. In Proceedings of the 1st Annual Gas Processing Symposium; Elsevier: Amsterdam, The Netherlands, 2009; pp. 179–184. ISBN 978-0-444-53292-3. [Google Scholar]
- The Oxford Institute for Energy Studies. LNG Plant Cost Escalation; The Oxford Institute for Energy Studies: Oxford, UK, 2014. [Google Scholar]
- The Oxford Institute for Energy Studies. LNG Plant Cost Reduction; The Oxford Institute for Energy Studies: Oxford, UK, 2018. [Google Scholar]
- Lam, P.-L. The growth of Japan’s LNG industry: Lessons for China and Hong Kong. Energy Policy 2000, 28, 327–333. [Google Scholar] [CrossRef]
- Lin, W.; Zhang, N.; Gu, A. LNG (liquefied natural gas): A necessary part in China’s future energy infrastructure. Energy 2010, 35, 4383–4391. [Google Scholar] [CrossRef]
- Tennyson, R.N.; Schaaf, R.P. Guidelines Can Help Choose Proper Process for Gas Treating Plants. Available online: https://www.researchgate.net/publication/279674565_Guidelines_Can_Help_Choose_Proper_Process_for_Gas_Treating_Plants (accessed on 11 November 2018).
- Peng, D.-Y.; Robinson, D.B. A New Two-Constant Equation of State. Ind. Eng. Chem. Fundam. 1976, 15, 59–64. [Google Scholar] [CrossRef]
- Mokhatab, S.; Mak, J.Y.; Valappil, J.V.; Wood, D.A. Handbook of Liquefied Natural Gas; Gulf Professional Publishing: Oxford, UK, 2013; ISBN 978-0-12-404645-0. [Google Scholar]
- Kidnay, A.J.; Parrish, W.R. Fundamentals of Natural Gas Processing, 1st ed.; CRC Press: Boca Raton, FL, USA, 2006; ISBN 978-0-8493-3406-1. [Google Scholar]
- Netusil, M.; Ditl, P. Natural Gas Dehydration. In Natural Gas—Extraction to End Use; IntechOpen: London, UK, 2012; ISBN 978-953-51-0820-7. [Google Scholar]
- Reuters. U.S. Export Bank Offers to Co-Finance Czech Nuclear Plant. Available online: https://www.reuters.com/article/cez-temelin/u-s-export-bank-offers-to-co-finance-czech-nuclear-plant-idUSL6N0FZ1WH20130729 (accessed on 17 January 2019).
- Ferdinand, M.; Dimantchev, E.; Fjellheim, H. Animal Spirits versus the Big Picture: Why the Outlook for the Carbon Price Is Still Bullish; Thomson Reuters: Eagan, MN, USA, 2016. [Google Scholar]
- Antweiler, W. Liquefied Natural Gas: Technology Choices and Emissions. Available online: https://wernerantweiler.ca/blog.php?item=2014-11-11 (accessed on 11 November 2018).
- Trading Economics European Union Wage Growth|2019|Data|Chart|Calendar|Forecast. Available online: https://tradingeconomics.com/european-union/wage-growth (accessed on 22 March 2019).
- Arcuri, N.; Bruno, R.; Bevilacqua, P. LNG as cold heat source in OTEC systems. Ocean Eng. 2015, 104, 349–358. [Google Scholar] [CrossRef]
- Hatcher, P.; Khalilpour, R.; Abbas, A. Optimisation of LNG mixed-refrigerant processes considering operation and design objectives. Comput. Chem. Eng. 2012, 41, 123–133. [Google Scholar] [CrossRef]
- Eurostat Electricity Prices for Non-Household Consumers. Available online: http://appsso.eurostat.ec.europa.eu/nui/show.do?dataset=nrg_pc_205&lang=en (accessed on 22 March 2019).
- European Commission Excise Duty on Energy. Available online: https://ec.europa.eu/taxation_customs/business/excise-duties-alcohol-tobacco-energy/excise-duties-energy_en (accessed on 22 March 2019).
- Global LNG Prices. Available online: https://bluegoldresearch.com/global-lng-prices (accessed on 17 November 2018).
- McLaney, E.; Atrill, D.P. Accounting: An Introduction, 6th ed.; Pearson: Harlow, UK, 2012; ISBN 978-0-273-77183-8. [Google Scholar]
- Pesaran, B.; Pesaran, M.H. Time Series Econometrics Using Microfit 5.0; Oxford University Press: Oxford, UK, 2009; ISBN 978-0-19-956353-1. [Google Scholar]
- Cucchiella, F.; D’Adamo, I.; Rosa, P. Industrial Photovoltaic Systems: An Economic Analysis in Non-Subsidized Electricity Markets. Energies 2015, 8, 12865–12880. [Google Scholar] [CrossRef] [Green Version]
- Romano, S.; Cozzi, M.; Di Napoli, F.; Viccaro, M. Building Agro-Energy Supply Chains in the Basilicata Region: Technical and Economic Evaluation of Interchangeability between Fossil and Renewable Energy Sources. Energies 2013, 6, 5259–5282. [Google Scholar] [CrossRef] [Green Version]
- Emiliano, P.C.; Vivanco, M.J.F.; de Menezes, F.S. Information criteria: How do they behave in different models? Comput. Stat. Data Anal. 2014, 69, 141–153. [Google Scholar] [CrossRef]
- Chang, L.; Zhou, Z.; Chen, Y.; Xu, X.; Sun, J.; Liao, T.; Tan, X. Akaike Information Criterion-based conjunctive belief rule base learning for complex system modeling. Knowl.-Based Syst. 2018, 161, 47–64. [Google Scholar] [CrossRef]
- Kletting, P.; Glatting, G. Model selection for time-activity curves: The corrected Akaike information criterion and the F-test. Z. Med. Phys. 2009, 19, 200–206. [Google Scholar] [CrossRef]
- Hurvich, C.M.; Tsai, C.-L. Regression and time series model selection in small samples. Biometrika 1989, 76, 297–307. [Google Scholar] [CrossRef]
- Schwarz, G. Estimating the Dimension of a Model. Ann. Stat. 1978, 6, 461–464. [Google Scholar] [CrossRef]
- Hyndman, R. auto.arima Function. Available online: https://www.rdocumentation.org/packages/forecast/versions/8.4/topics/auto.arima (accessed on 11 November 2018).
- Faramawy, S.; Zaki, T.; Sakr, A.A.-E. Natural gas origin, composition, and processing: A review. J. Nat. Gas Sci. Eng. 2016, 34, 34–54. [Google Scholar] [CrossRef]
- Khan, M.S.; Lee, S.; Getu, M.; Lee, M. Knowledge inspired investigation of selected parameters on energy consumption in nitrogen single and dual expander processes of natural gas liquefaction. J. Nat. Gas Sci. Eng. 2015, 23, 324–337. [Google Scholar] [CrossRef]
- Statista Electricity Price France 2020–2040|Forecast. Available online: https://0-www-statista-com.brum.beds.ac.uk/statistics/753239/electricity-price-forecast-france/ (accessed on 22 March 2019).
- Knaut, A.; Tode, C.; Lindenberger, D.; Malischek, R.; Paulus, S.; Wagner, J. The reference forecast of the German energy transition—An outlook on electricity markets. Energy Policy 2016, 92, 477–491. [Google Scholar] [CrossRef]
- Wilson, R.; Luckow, P.; Biewald, B.; Ackerman, F.; Hausman, E. 2012 Carbon Dioxide Price Forecast; Synapse: Cambridge, Massachusetts, 2012. [Google Scholar]
- CE Delft Power to Ammonia: Energy and Electricity Prices Scenarios 2020-2023-2030. Available online: https://www.cedelft.eu/en/publications/1911/power-to-ammonia-energy-and-electricity-prices-scenarios-2020-2023-2030 (accessed on 23 January 2019).
- Wang, Y.; Wang, J.; Zhao, G.; Dong, Y. Application of residual modification approach in seasonal ARIMA for electricity demand forecasting: A case study of China. Energy Policy 2012, 48, 284–294. [Google Scholar] [CrossRef]
- Kriechbaumer, T.; Angus, A.; Parsons, D.; Rivas Casado, M. An improved wavelet–ARIMA approach for forecasting metal prices. Resour. Policy 2014, 39, 32–41. [Google Scholar] [CrossRef] [Green Version]
- Zhu, B.; Wei, Y. Carbon price forecasting with a novel hybrid ARIMA and least squares support vector machines methodology. Omega 2013, 41, 517–524. [Google Scholar] [CrossRef]
- Naderi, M.; Khamehchi, E.; Karimi, B. Novel statistical forecasting models for crude oil price, gas price, and interest rate based on meta-heuristic bat algorithm. J. Pet. Sci. Eng. 2019, 172, 13–22. [Google Scholar] [CrossRef]
- Van Goor, H.; Scholtens, B. Modeling natural gas price volatility: The case of the UK gas market. Energy 2014, 72, 126–134. [Google Scholar] [CrossRef]
- Varahrami, V.; Haghighat, M.S. The assessment of liquefied natural gas (LNG) demand reversibility in selected OECD countries. Energy Rep. 2018, 4, 370–375. [Google Scholar] [CrossRef]
- Ancona, M.A.; Bianchi, M.; Branchini, L.; De Pascale, A.; Melino, F.; Mormile, M.; Palella, M. On-site LNG production at filling stations. Appl. Therm. Eng. 2018, 137, 142–153. [Google Scholar] [CrossRef]
Figure 1.
Consumption of natural gas by region in billion cubic meters 1992–2017 [10].
Figure 1.
Consumption of natural gas by region in billion cubic meters 1992–2017 [10].

Figure 2.
Process selection chart for simultaneous CO2 and H2S removal [48].
Figure 2.
Process selection chart for simultaneous CO2 and H2S removal [48].

Figure 3.
LNG prices in previous years [61].
Figure 3.
LNG prices in previous years [61].

Figure 4.
Flowsheet diagram of the simulated LNG plant.

Figure 5.
(a) Net present value LNG plant with an 80% confidence interval, (b) net present value for a discount rate of 10% with the same confidence interval.
Figure 5.
(a) Net present value LNG plant with an 80% confidence interval, (b) net present value for a discount rate of 10% with the same confidence interval.


Table 1.
Differences in the oil and natural gas market [35].
Table 1.
Differences in the oil and natural gas market [35].
| Parameter | Oil | Natural Gas |
|---|---|---|
| Market form | Global | Regional |
| Contracts form | Short-term | Long-term |
| Dependence on specific supplier and infrastructure | Low | High |
| Main threat | Price growth | Physical supply disruption |
Table 2.
Parameters of the Peng-Robinson state equations.
| Parameter | Value |
|---|---|
| Critical temperature | 241.14 K |
| Critical pressure | 12.97×10⁶ Pa |
| Molar volume | 1.22×10⁻⁴ m3 mol−1 |
| Acentric factor | 0.055 |
Table 3.
Material and energy flow.
| Process | Input Consumption per Year |
|---|---|
| Natural gas for liquefaction | 2.49×10⁵ m3 |
| Acid gas treatment | 18 kWh |
| Dehydration | 5 kWh |
| Liquefaction | 199 kWh |
Table 4.
Used ARIMA models for time series.
| Time Series | Model | AIC | AICc | BIC |
|---|---|---|---|---|
| Price of LNG | ARIMA (0,1,0) | −119.27 | −119.21 | −117.04 |
| Price of electricity | ARIMA (0,2,1) | −126.84 | −126.56 | −119.38 |
| Price of emission allowances | ARIMA (0,1,0) with drift | −43.7 | −43.32 | −40.65 |
| LNG demand | ARIMA (0,2,1) | 378.52 | 380.02 | 379.32 |
Table 5.
Cost structure and contributions.
| Electricity | Gas | Depreciation | Wages | Emission Allowances | Excise Duty | Loans |
|---|---|---|---|---|---|---|
| 4.23% | 6.64% | 18.02% | 16.51% | 3.56% | 43.71% | 7.34% |
© 2019 by the authors. Licensee MDPI, Basel, Switzerland. This article is an open access article distributed under the terms and conditions of the Creative Commons Attribution (CC BY) license (http://creativecommons.org/licenses/by/4.0/).
Share and Cite
MDPI and ACS Style
Hönig, V.; Prochazka, P.; Obergruber, M.; Smutka, L.; Kučerová, V. Economic and Technological Analysis of Commercial LNG Production in the EU. Energies 2019, 12, 1565. https://0-doi-org.brum.beds.ac.uk/10.3390/en12081565
AMA Style
Hönig V, Prochazka P, Obergruber M, Smutka L, Kučerová V. Economic and Technological Analysis of Commercial LNG Production in the EU. Energies. 2019; 12(8):1565. https://0-doi-org.brum.beds.ac.uk/10.3390/en12081565
Chicago/Turabian StyleHönig, Vladimír, Petr Prochazka, Michal Obergruber, Luboš Smutka, and Viera Kučerová. 2019. "Economic and Technological Analysis of Commercial LNG Production in the EU" Energies 12, no. 8: 1565. https://0-doi-org.brum.beds.ac.uk/10.3390/en12081565
Note that from the first issue of 2016, this journal uses article numbers instead of page numbers. See further details here.