Comparative Study on the Effects of Ethanol Proportion on the Particle Numbers Emissions in a Combined Injection Engine

1
State Key Laboratory of Automotive Simulation and Control, Jilin University, Changchun 130022, China
2
Mechanical and Mechatronics Engineering, University of Waterloo, Waterloo, ON N2L 3G1, Canada
*
Authors to whom correspondence should be addressed.
Energies 2019, 12(9), 1788; https://0-doi-org.brum.beds.ac.uk/10.3390/en12091788
Submission received: 12 April 2019
/
Revised: 3 May 2019
/
Accepted: 6 May 2019
/
Published: 10 May 2019
Abstract
:Ethanol has significant potential for the reduction of fuel consumption and the emissions of engines. In this paper, a dual-fuel combined engine test rig with ethanol injected in the intake port and gasoline injected directly into the cylinder are developed and the effects of ethanol/gasoline ratio (Re) on the combustion and emission of particle numbers are investigated experimentally. The results indicate that the peak in-cylinder temperature (Tmax) decreases continuously with the increase of the ethanol/gasoline ratio (Re). For particle emissions, ethanol can significantly reduce the accumulation mode particle number (APN) at low engine speed; and the lowest number of particulates are at G25 (the gasoline ratio is 25% of the fuel) at low load. And at high engine load, the total particle number (TPN) is insensitive to speed with large ethanol fraction and TPN is relatively small. With the decrease of Re (Re < 50%), TPN rises sharply. When the direct injection timing advances, TPN reduces continuously and the effects caused by speed can be neglected. On the contrary, the speed has significant effects on particle emissions at various ignition times. At low speed, increasing ignition advance can cause the increase of the TPN; which is contrary to the effects of particle emissions at medium engine speed. And the effect of ignition timing at high speed on particle number is not obvious. The ignition timing for which the lowest TPN is reached will increase with the direct injection timing advances.
1. Introduction
In the context of the energy crisis and environmental pollution, it is particularly important to find ways to alleviate the energy crisis and to reduce environmental pollutions. It is imperative to find new clean and renewable alternative fuels and develop new internal combustion engine technologies [1]. Ethanol has significant advantages compared to gasoline. The octane number of ethanol is higher than that of gasoline, which can suppress the knock of gasoline engine [2]. The laminar flame propagation speed of ethanol s higher than that of gasoline, which enable the fuel to burn out quickly and shorten the whole combustion period to make the combustion much closer to ideal constant-volume combustion. The latent heat of vaporization of ethanol is large, which can enhance the charge cooling effects. When the ethanol is used in combination with gasoline, the oxygen in the ethanol can promote the complete combustion of the fuel and can effectively reduce the emissions of CO, HC and particulate matters [3,4].
New technologies for engines have emerged in recent years, such as variable valve timing and lift technology [5,6], optical engine [7] and Variable compression ratio [8], miniaturization and light weight. The combined injection technology has a complicated structure and a high cost. However, the combined injection combines the advantages of the traditional port fuel injection (PFI) and DI direct injection (DI). According to operations, the two injection systems can be operated simultaneously or only one injection system can be used. The mixed fuel ratio can be adjusted in real time to flexibly respond to different operating conditions of the engine, so this technology has certain research significance [9].
Nora et al. [10] studied the effects of ethanol and gasoline on combustion characteristics on a pressurized two-stroke DI engine. The results show that ethanol improves the overall indicator fuel efficiency by about 10% compared to gasoline and the combustion process is improved under small loads due to the higher tolerance to dilute combustion. Khosousi et al. [11] studied the formation of soot in a laminar diffusion flame at atmospheric pressure after adding ethanol to gasoline. The study showed that increasing the ethanol mass fraction can reduce the soot formations obviously. The decrease of soot concentration can be attributed to the dilution effect of adding ethanol into gasoline. Ahmed et al. [12] studied the effects of oxygen content and natural polycyclic aromatics on particles emissions from ethanol/gasoline fuel vehicles. The results showed that under cold engine start-up conditions (−7 degrees Celsius), the increase of polycyclic aromatic hydrocarbons can lead to the increase of the emission of particulates and the oxygen content in the mixed fuel can effectively reduce the number of particles. Wang et al. [13,14,15,16,17] conducted a comparative study of n-butanol and gasoline combustion and particulate emissions in a spark ignition engine equipped with a combined injection system. The experimental results showed that with the increase of n-butanol mixed volume ratio, the average effective pressure increased firstly and then decreased and the total particulate matter decreased continuously but the total number of particles (TPN) and the number of nucleation mode particles (NPN) first dropped and then rose, cumulative pattern number of particles (APN) increased with the increase of ethanol mass fraction. Kim et al. [18] studied the fuel efficiency and emission performance of dual fuels on a spark ignited engine. During the experiment, Gasoline is injected directly in the cylinder and ethanol is injected by the inlet. Compared to gasoline direct injection engines, the dual-fuel engine’s compression ratio increased from 9.5 to 13.3 and achieved higher thermal efficiency. Zhuang et al. [19] investigated the fuel efficiency and gaseous emission of ethanol and gasoline dual fuel engine and observed that volume efficiency was improved, however, CO and HC emissions increased when ethanol fraction was higher than 36.3% of the total fuel energy used. Cammarota et al. [20]. explored the factors affecting the explosion of ethanol/air mixture in a 5 dm3 closed container. Experiments have shown that it is positive to characterize the safety of ethanol-air mixtures at different temperatures by maximum pressure, maximum rate of pressure rise and burning velocity. Grabarczyket al. [21] studied the effect of initial temperature on the explosion pressure of various liquid fuels and their mixtures. The experiment explored the trend of the explosion pressure (Pex) of liquid fuels in the range of 333–413 K when the fuel-air equivalence ratio (F) is in different ranges. The results show that when F < 3, Pex decreases with the increase of initial temperature and when F > 3, Pex increases with the increase of initial temperature. Zhuang et al. [22] studied the flame zone characteristics of gasoline, ethanol and butanol in the early stage of combustion in a single-cylinder spark-ignition direct injection engine. The experimental results show that there is a reasonable relationship between heat release and flame zone in the early combustion stage. The flame area correlations with heat release of gasoline, ethanol and butanol can also be distinguished by the properties of each type of fuel. Chen et al. [23] studied ethanol Spray from different DI Injectors by using Two-Dimensional laser induced exciplex fluorescence. The test determines the effect of temperature and pressure on the spray. A co-evaporative mixture of benzene and triethylamine (TEA) was used as a fluorescent seeding material to study the evaporation processes of ethanol fuel. A mixture of fluorobenzene (FB) and diethylmethylamine (DEMA) in n-hexane was allowed for the investigation of the evaporation processes of gasoline fuel mixture. The test results displayed that the collapsing of both liquid and vapor phases of n-hexane is stronger than that of ethanol spray for both swirl and multi-hole injectors. Huang et al. [24,25,26,27] studied the effects of injection timing on the formation and combustion of the mixture on a combined injection engine using the mode of ethanol direct injection and gasoline port injection. It is found that when the direct injection time is delayed, the mixture around the spark plug became leaner and the equivalence ratio distribution became more uneven. In addition, delaying the direct injection time causes the fuel to hit the cylinder wall and causes local subcooling effects and excessive mixture. Therefore, the combustion speed and temperature are lowered by delaying the direct injection timing, resulting in the decrease of NOx emissions and the increase of HC and CO emissions. Also, numerical simulations were conducted to study the performance of adding a small amount of ethanol to reduce incomplete combustion and fuel hits the cylinder wall caused by late fuel injection timing. Wang et al. [28] studied the gaseous and particulates emission characteristics under two different injection modes: mixed direct injection of ethanol-gasoline and gasoline port injection and ethanol direct injection. The average particle size of the combined injection was lower than that of the direct injection and the thermal efficiency of the port injection of premixed fuel is improved compared to the separate injection methodology. Zhuang et al. [29] studied the lean combustion performance of a spark-ignition ethanol/gasoline dual-fuel engine. The results showed that EDI helps to increase the lean burn limit due to the combined effect of dual injection and widely lean burn limit of ethanol.
Even although a lot of researches had been done on ethanol and ethanol gasoline blends, most of the work is focused on the effects of ethanol gasoline mixture on power performance, fuel economy, gas emissions and even lean combustion in PFI or DI engine. The systematic analysis of particulates emission in ethanol-gasoline combined injection engines is still rarely reported. This paper combined with limited control variables (such as rotation speed, direct injection timing, ignition timing, ethanol gasoline blending ratio and so forth, mainly discussed the effect of ethanol/gasoline on the number of nuclear particles and accumulated particles in an injection mode of EPI (ethanol port injection) + GDI (gasoline direct injection) under stoichiometric air-fuel ratio. The optimal ethanol gasoline blending ratio and the optimal combination of control parameters under different operating conditions were explored to obtain the optimal output of engine emissions. Indeed, the control of particulates after ethanol was mixed with gasoline as an oxygen-containing fuel is obvious.
2. Materials and Methods
2.1. Engine and Test Equipment
This experiment was carried out on a four-stroke spark-ignition dual fuel engine. The main technical parameters of the engine are shown in Table 1.
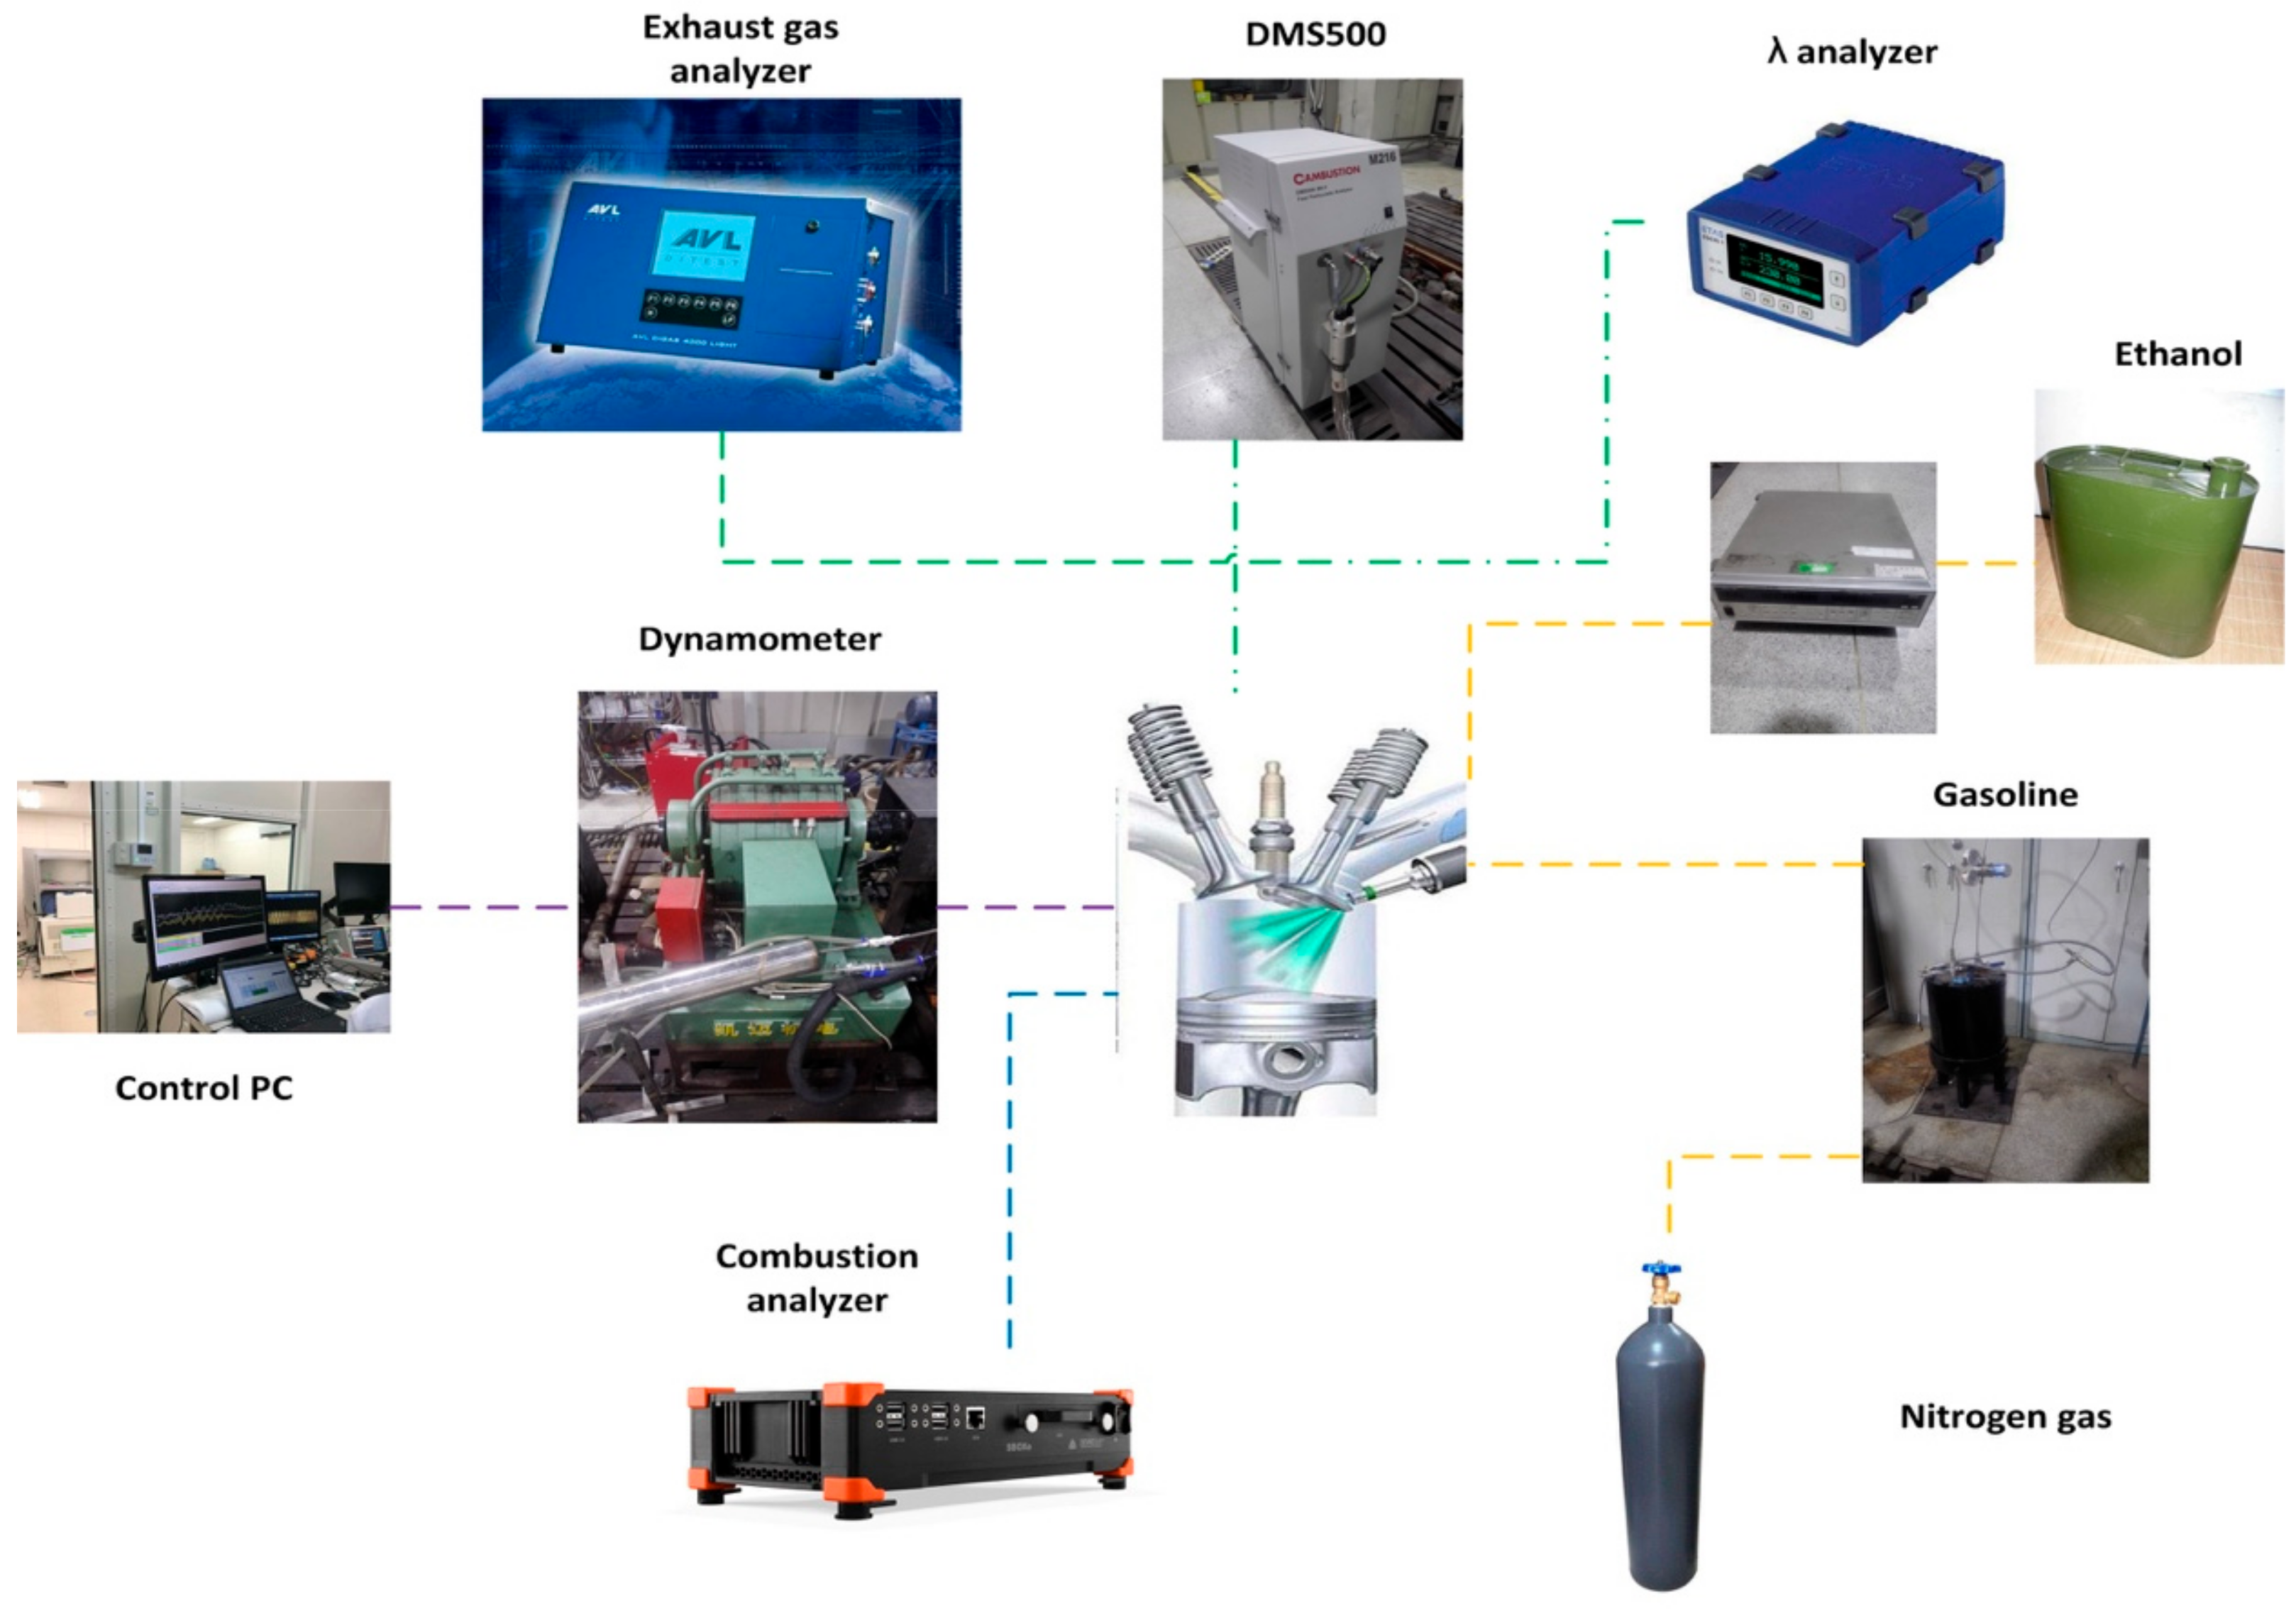
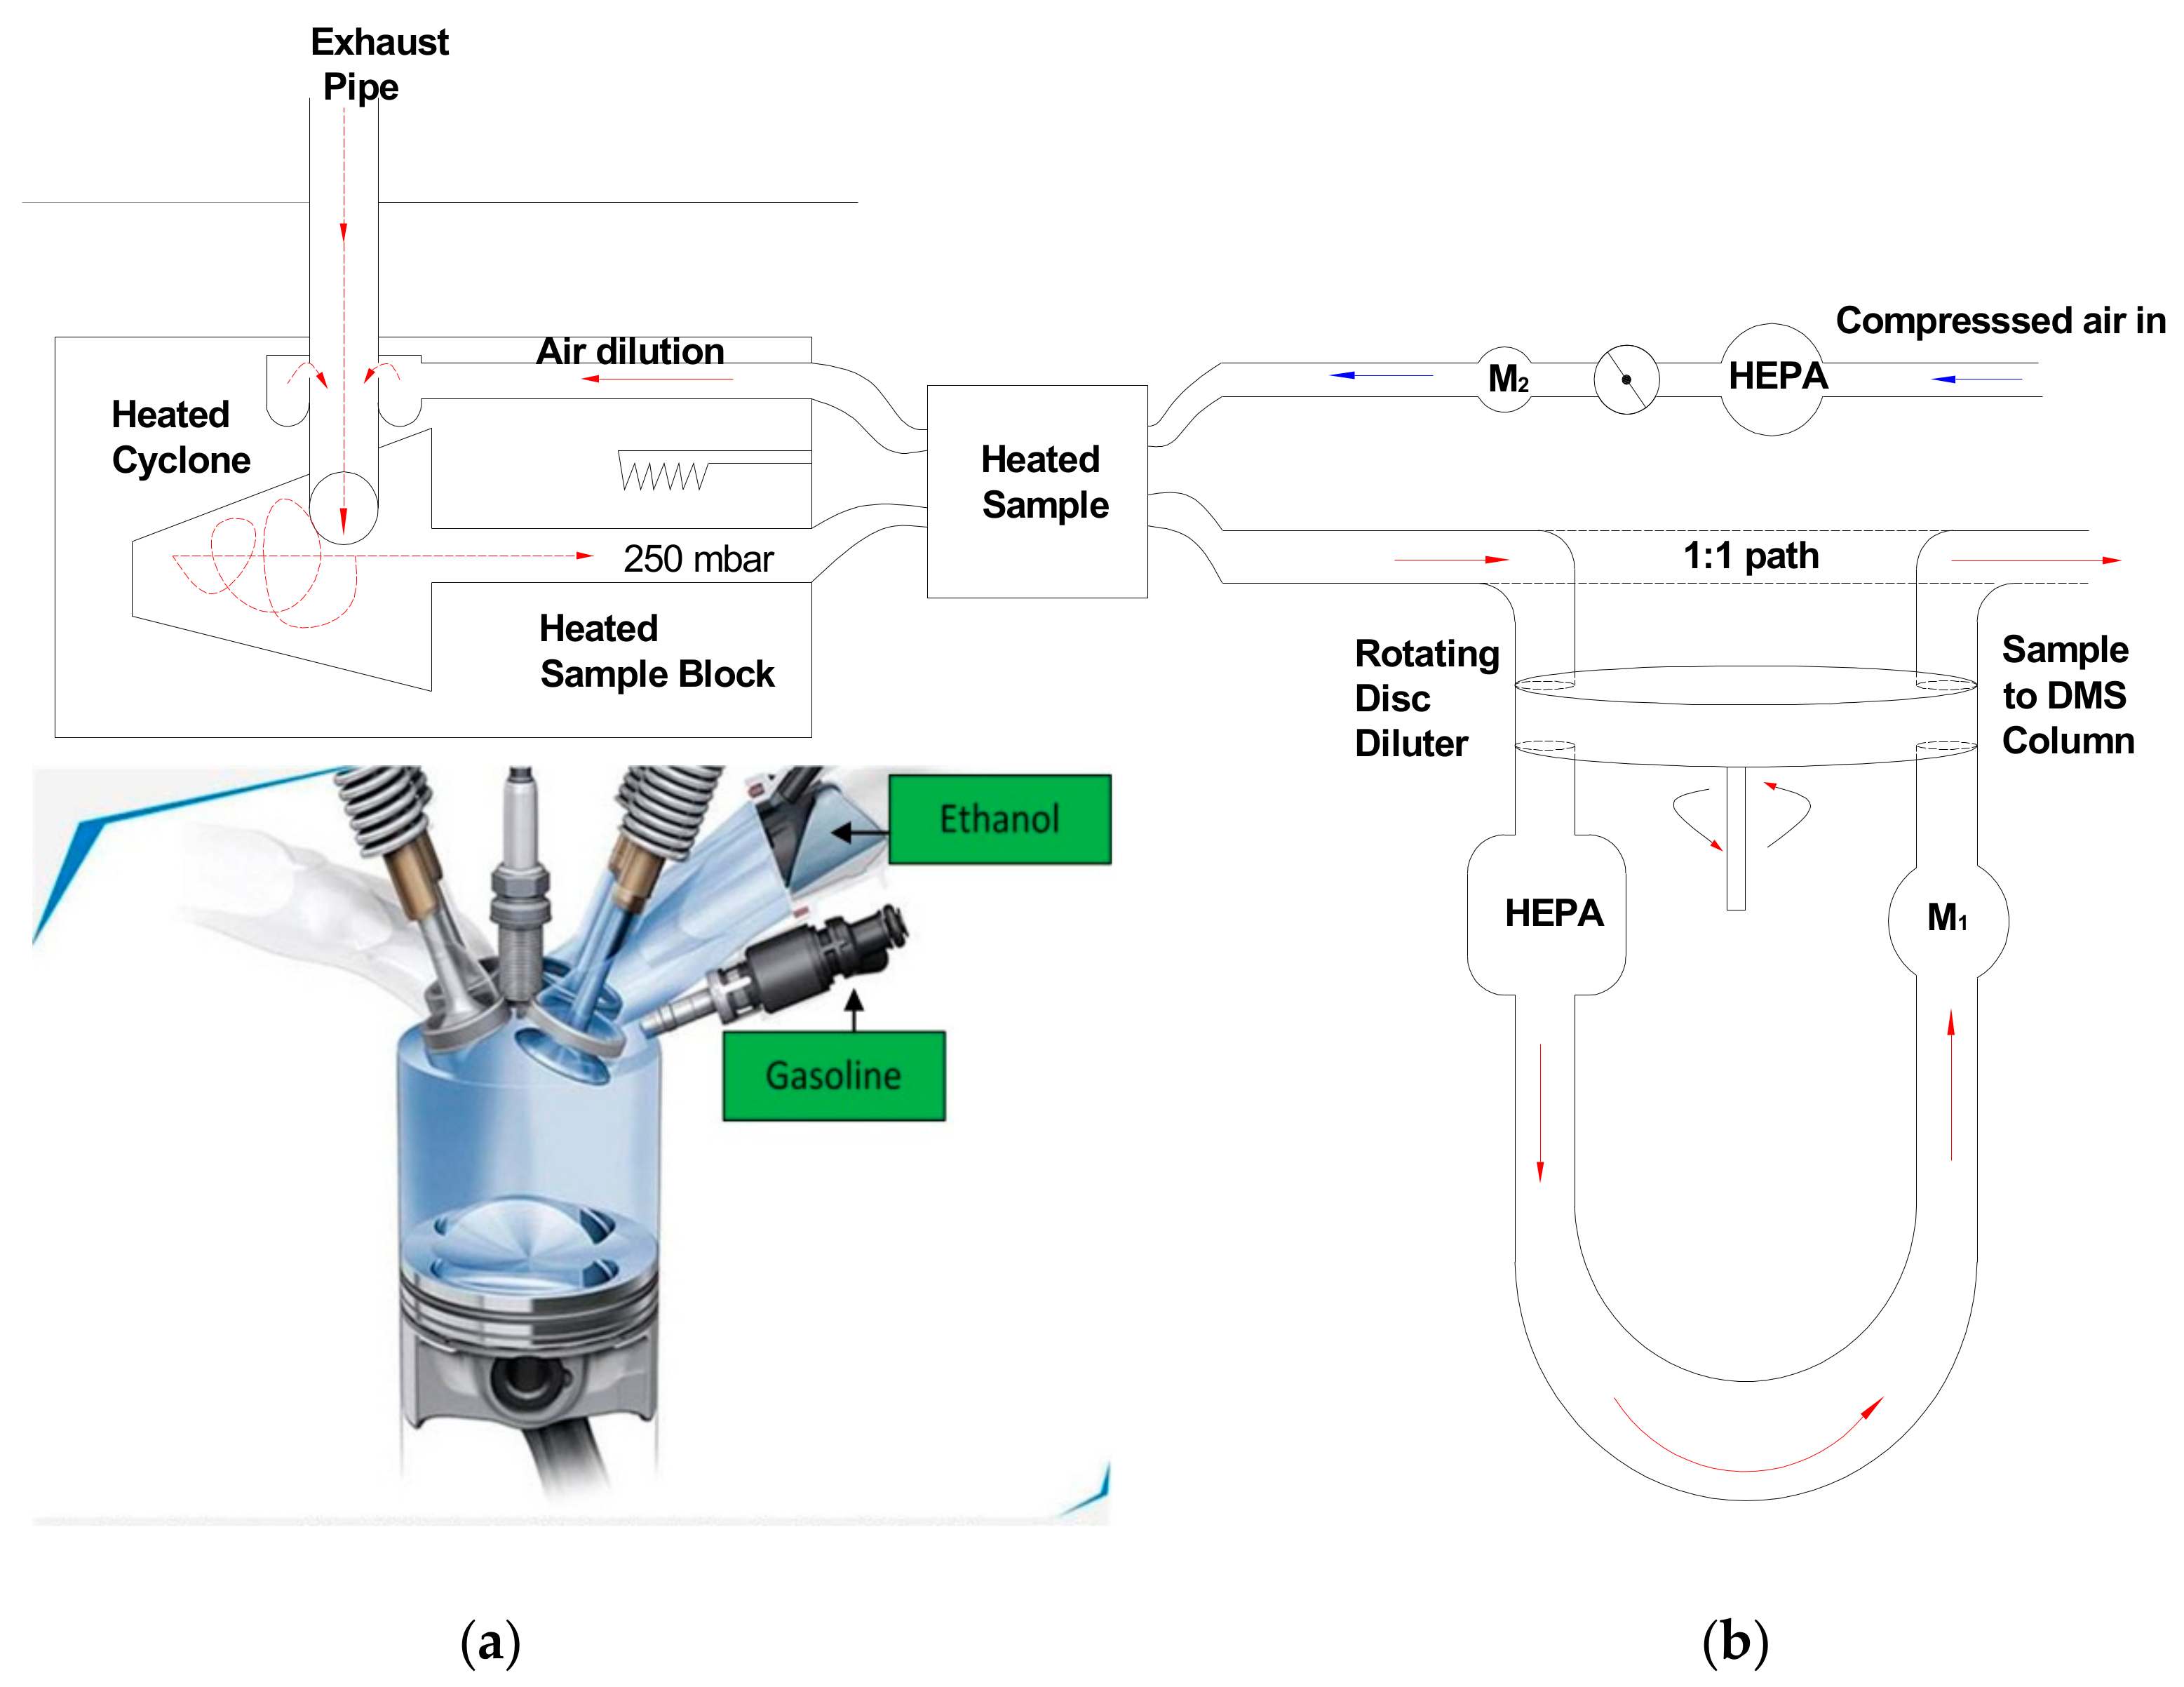
The measuring instruments and their main technical parameters are shown in Table 2. CW160eddy current dynamometer (Luoyang Nanfeng Electromechanic Equipment Manufacturing Co., Ltd., Luoyang, China) is used to measure the speed and output torque of the engine. the measurement range of which are 0–6000 r/min and 0–600 Nm, respectively. The in-cylinder pressure is measured by a AVL IndiSetIndiComV2.0 type cylinder pressure sensor (AVL List GmbH, Shanghai, China) and goniometer (Kistler Instrument China Ltd., Shanghai, China) and the information of combustion temperature in cylinder is analyzed using a Dewesoft combustion analyzer (Dewesoft China limited, Beijing, China). Exhaust emissions were measured by AVL-DiGas4000Light five-component tail gas analyzer (AVL List GmbH, Shanghai, China), the operating temperature is 5–45 °C, suitable for oil temperature of 1–120 °C. Fuel consumption was measured by DF-2420 volumetric fuel consumption meter (Shanghai ONO SOKKI Co., Ltd., Shanghai, China), the measurement accuracy is 0.01 g/s. A broadband oxygen sensor mounted into the exhaust pipe, ModelETAS Lambda Meter 4 (ETAS (Shanghai) Co., Ltd., Shanghai, China), was used to measure and record excess air ratios, whose measuring range is 0.700–32.767. The control system of the engine is the dSPACE system (dSPACE (Shanghai) Co., Ltd., Shanghai, China). dSPACE adopts rapid control prototype, which can transform the Simulink model into C language algorithm through user’s personalized configuration. Moreover, the control algorithm optimization is easy to perform, which brings great convenience to the precise control of engine. The number concentration and size distribution of particles were collected by DMS500 (Shanghai Cambustion Ltd., Shanghai, China). The DMS500 has a built-in 2-stage diluter that allows direct measurement of the original exhaust without any additional peripherals. The schematic diagram of the test devices is shown in Figure 1. Figure 2 is a combined injection structure.
2.2. Test Fuel Information
The gasoline used in this experiment is commercial 95# gasoline, which meets the technical requirements of GB 17930–2016 Gasoline for motor vehicles (VIA) and the purity of ethanol is 99.5%, which meets the technical requirements of GB/T 678-2002 Chemical reagent-Ethanol (anhydrous ethanol). The physical and chemical properties of ethanol and gasoline are shown in Table 3. The naming rules for mixed fuels are shown in Table 4.
2.3. Experimental Procedure
The injection mode used in this study is ethanol port injection (EPI) and gasoline direct injection (GDI). From the comparison of physical and chemical properties between gasoline and ethanol in Table 3, it can be seen that ethanol is more difficult to volatilize than gasoline, so the use of ethanol port injection can avoid the insufficient evaporation of ethanol. The effects of ethanol/gasoline mixing ratio, speed, load, ignition time and injection time of gasoline on the combustion and emission characteristics were investigated in this study and the experimental conditions are shown in Table 5.
DMS500 mainly includes sampling dilution system and grader, in which the sampling dilution system includes the first dilution device and the second dilution device and the dilution ratio varies from 1:80 to 1:2500. Also includes cyclone separators, heating devices, filters and other devices. The particle sampling dilution system diagram is shown in Figure 2b.
In this work the formula for calculating the excess air coefficient is [33]:
In Equation (1), denotes actual air mass (kg), is gasoline mass supplied per cycle (kg), is gasoline stoichiometric air-fuel ratio, is the ethanol mass supplied per cycle (kg), is ethanol stoichiometric air-fuel ratio.
Since the stoichiometric air-fuel ratio of ethanol is less than that of gasoline, the stoichiometric air-fuel ratio of the mixture decreases with the increase of ethanol at a certain engine speed. Table 6 shows the fuel consumption of 20s during the experiment. It can be seen that from G0 to G100, both the total mass of the blended fuel and total amount of released heat decreases gradually. It is worthy to note that the total heat decreases only by 1.2%, which means that even if the stoichiometric air-fuel ratio of the mixture is fixed and the total mass of the blended fuel increases as Re increases but the change in the total heat value of the blended fuel is negligible.
3. Results and Discussion
The results of experiments are presented with two parts: the first part is the combustion and the second part is particle emission characteristics. In this paper, error bars are obtained by calculating the standard deviation of multiple sets of experimental data to give the proper justification for the real outcome of the work.
3.1. Combustion Characteristics
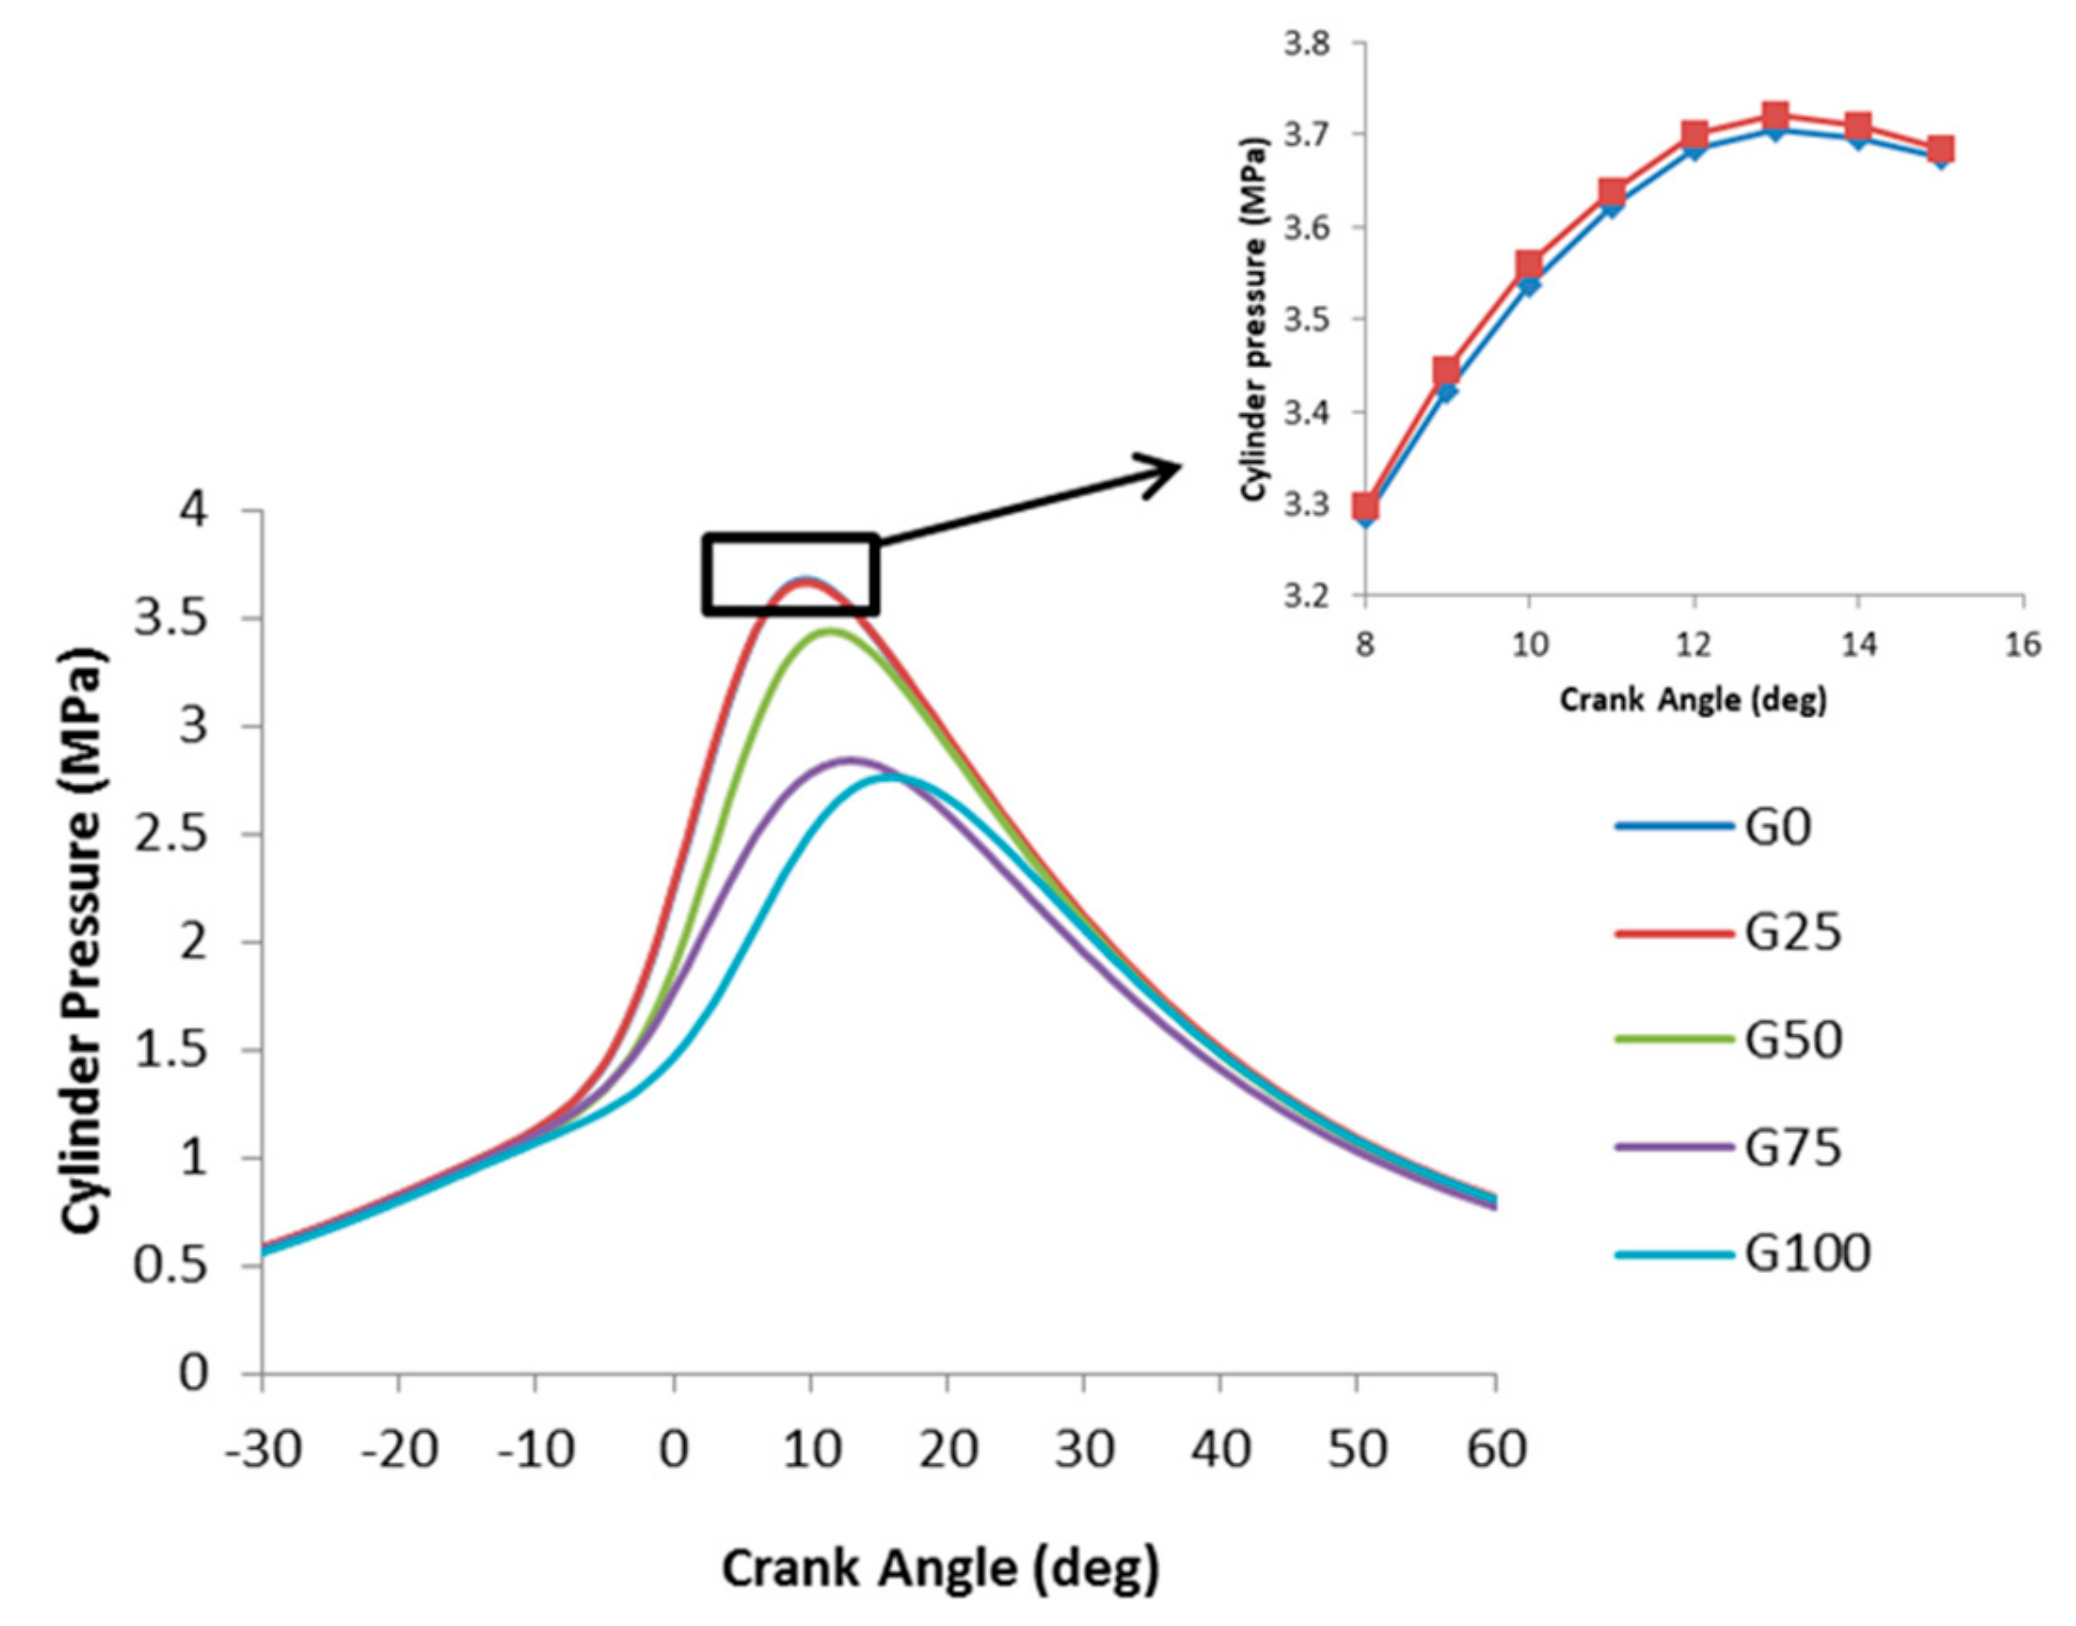
Figure 3 shows the effect of ethanol/gasoline ratio on cylinder pressure. The peak cylinder pressure under the G25 ratio is up to 3.72 MPa and the minimum cylinder pressure at the ratio of G100 is 2.73 MPa. The peak pressure of the G25 is 36% higher than that of the G100. The cylinder pressure in pure ethanol is slightly lower than that of G25 but the difference between the two is small. When the blending ratio is changed from G0 to G100, the crank angles at which the cylinder pressure peak occurs are 9, 9, 11, 12, 15 °CA BTDC, respectively. Ethanol has higher laminar burning velocity shortens the whole combustion period, which makes the combustion closer to ideal constant-volume combustion to improve thermal efficiency of the engine.
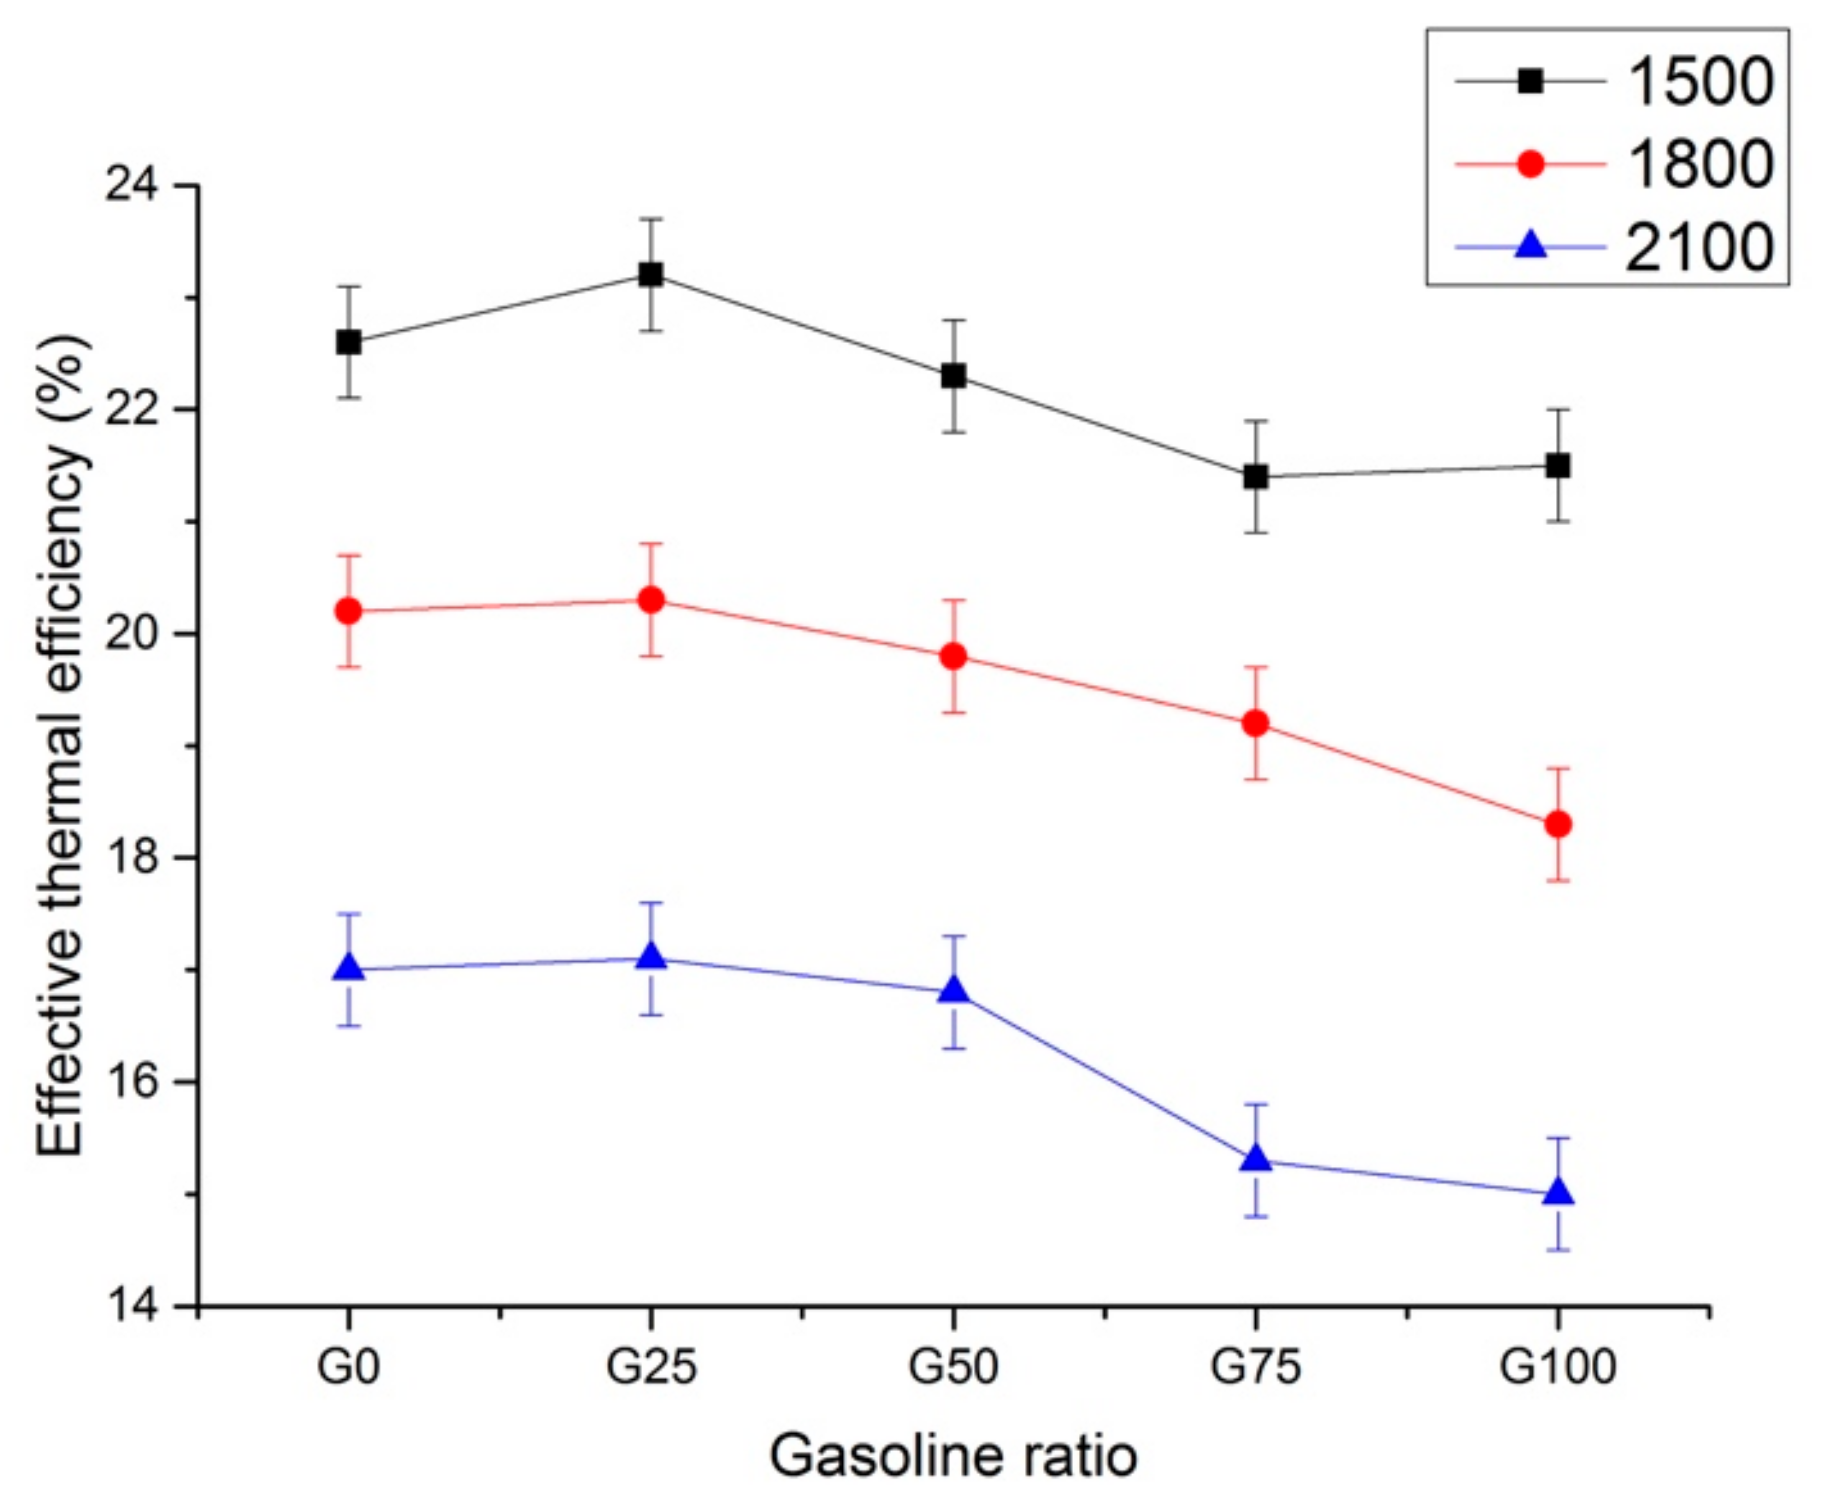
Figure 4 shows the changes in engine effective thermal efficiency at different fuel blending ratios and speeds. Comparing the three speeds, with the addition of direct injection gasoline, the effective thermal efficiency of the engine first increases and then decreases. When the inlet is sprayed with 75% ethanol and 25% gasoline is injected directly into the cylinder, the effective thermal efficiency is highest. Compared to the full gasoline mode (G100), the effective thermal efficiency at G25 is 8%, 11% and 12.3% from 1500 r/min to 2100 r/min. This indicated that at high speeds, the addition of in-port ethanol in the combined injection mode is more conducive to thermal efficiency. However, when the speed is increased, the combustion duration is increased, the combustion constant capacity is deteriorated and the paint loss is increased, which leads to a decrease in thermal efficiency, thereby explaining the highest thermal efficiency at 1500 r/min in the experimental data.
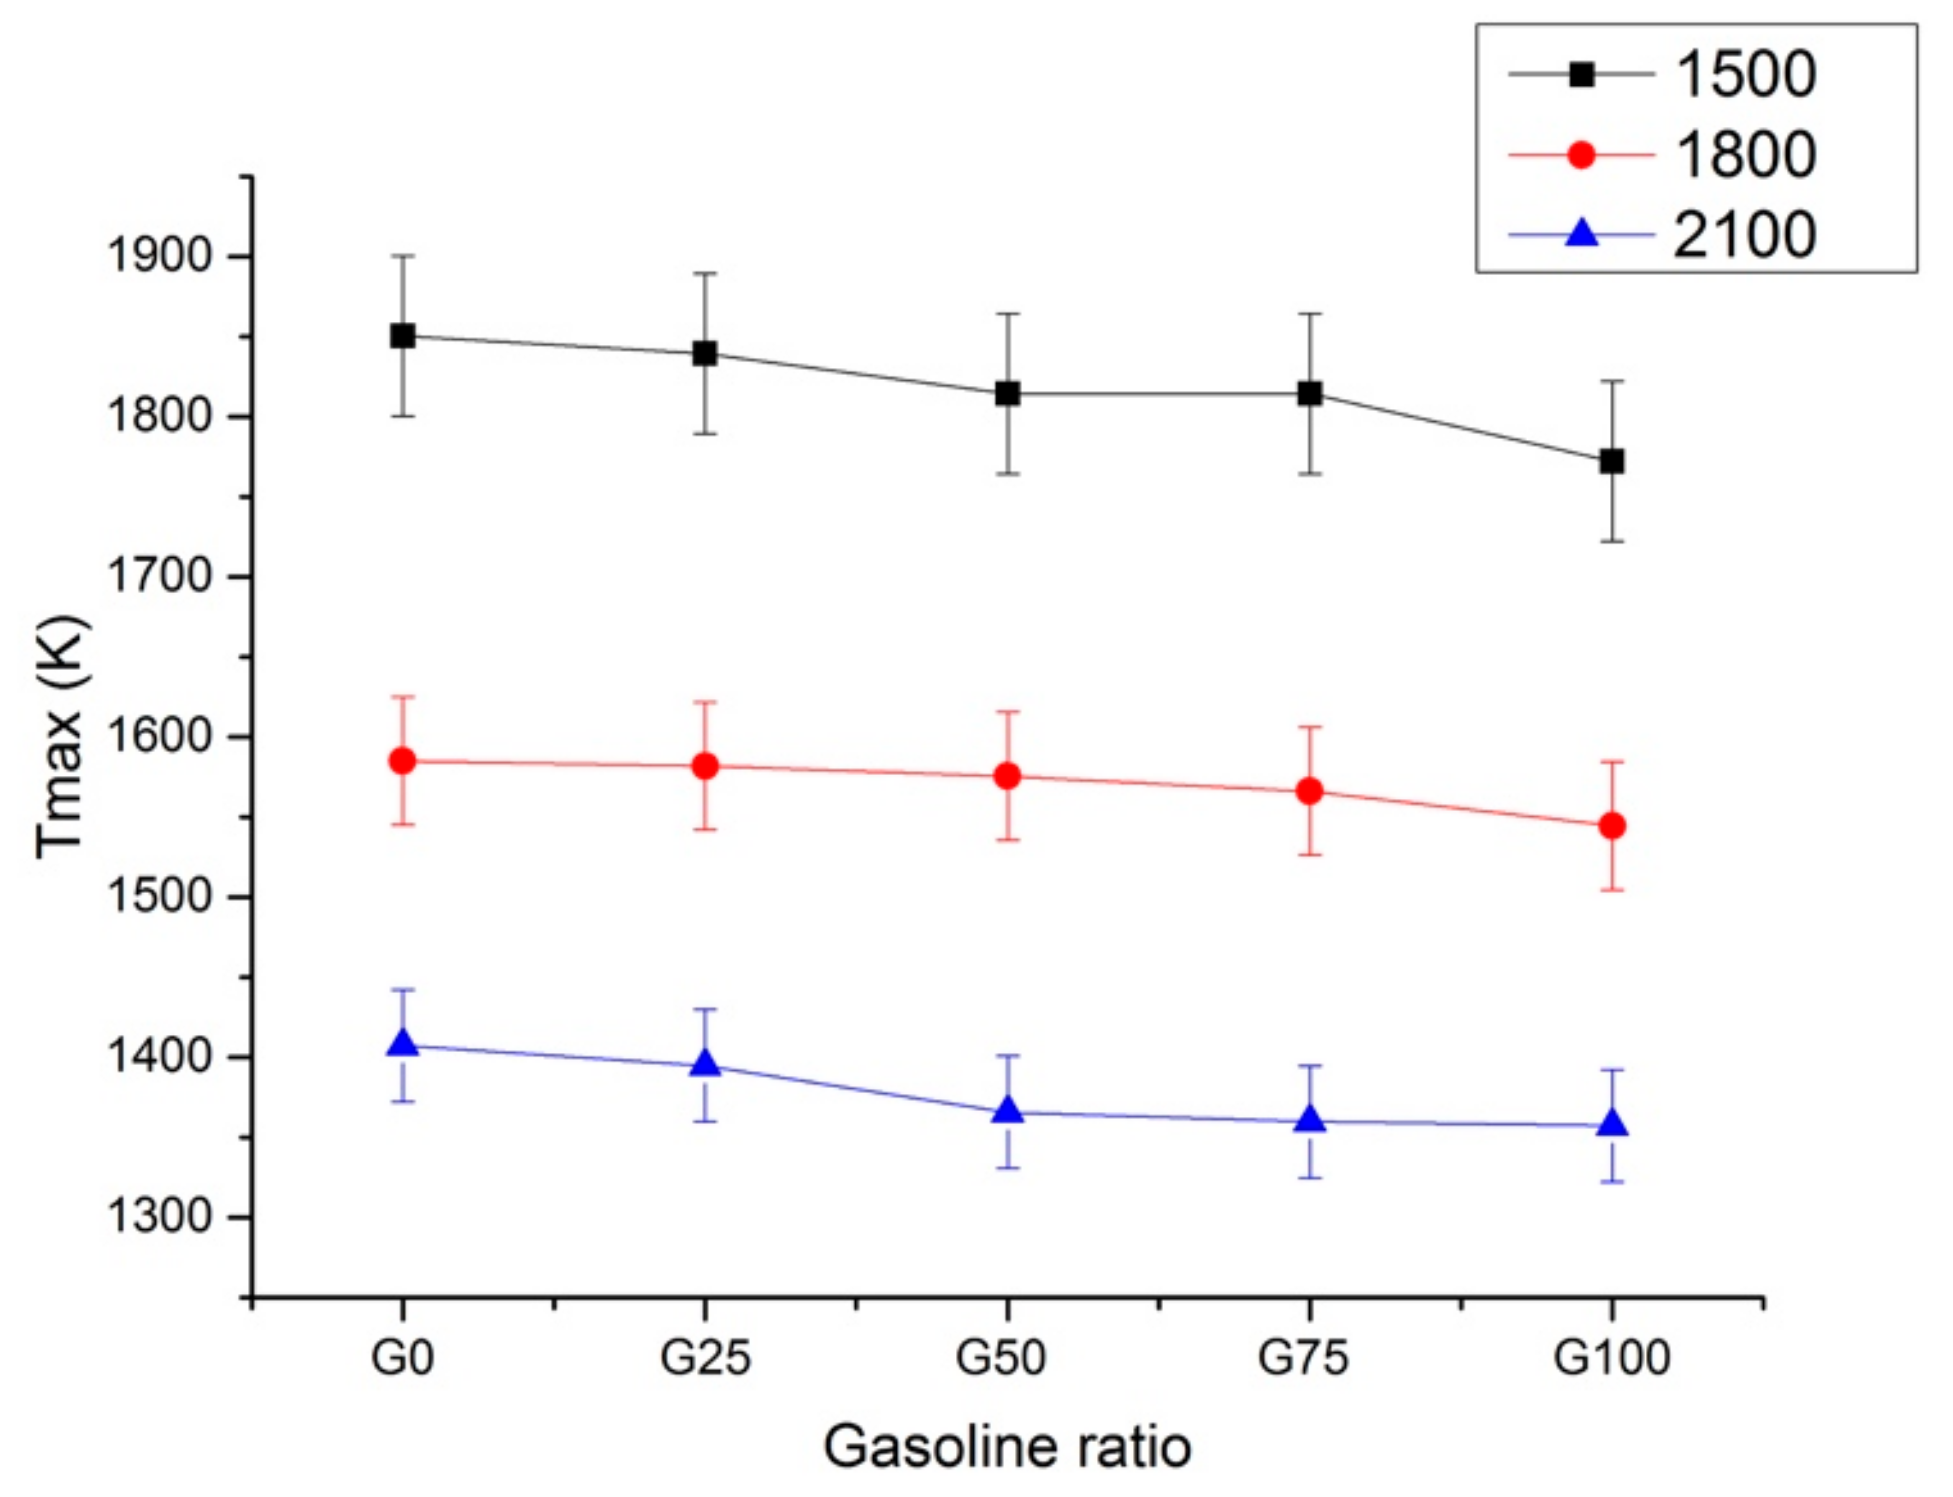
Figure 5 shows the variation of the in-cylinder maximum temperature (Tmax) with the blending ratio of ethanol gasoline. It can be seen that when the proportion of direct injection gasoline increases gradually, the maximum combustion temperature in cylinder decreases; but the decrease trend is unobvious. When the speed changes at 1500, 1800 and 2100 r/min, Tmax decreases 4.2%, 2.5%, 3.5% from G0 to G100. After the ethanol PFI is switched to the gasoline DI, the evaporation and atomization time of the gasoline is shorter, therefore, the distribution of fuel in the mixture is non-uniform and the incomplete combustion of the fuel leads to the decrease of the Tmax. With the speed increasing, the air-fuel mixing time becomes shorter, so the combustion is insufficient and Tmax decreases. Therefore, the variation of the blending ratio for Tmax is not affected by the rotational speed, whether it is the urban operating speed (2100) or the initial engine speed (1500), the amount of ethanol should be increased to obtain good combustion.
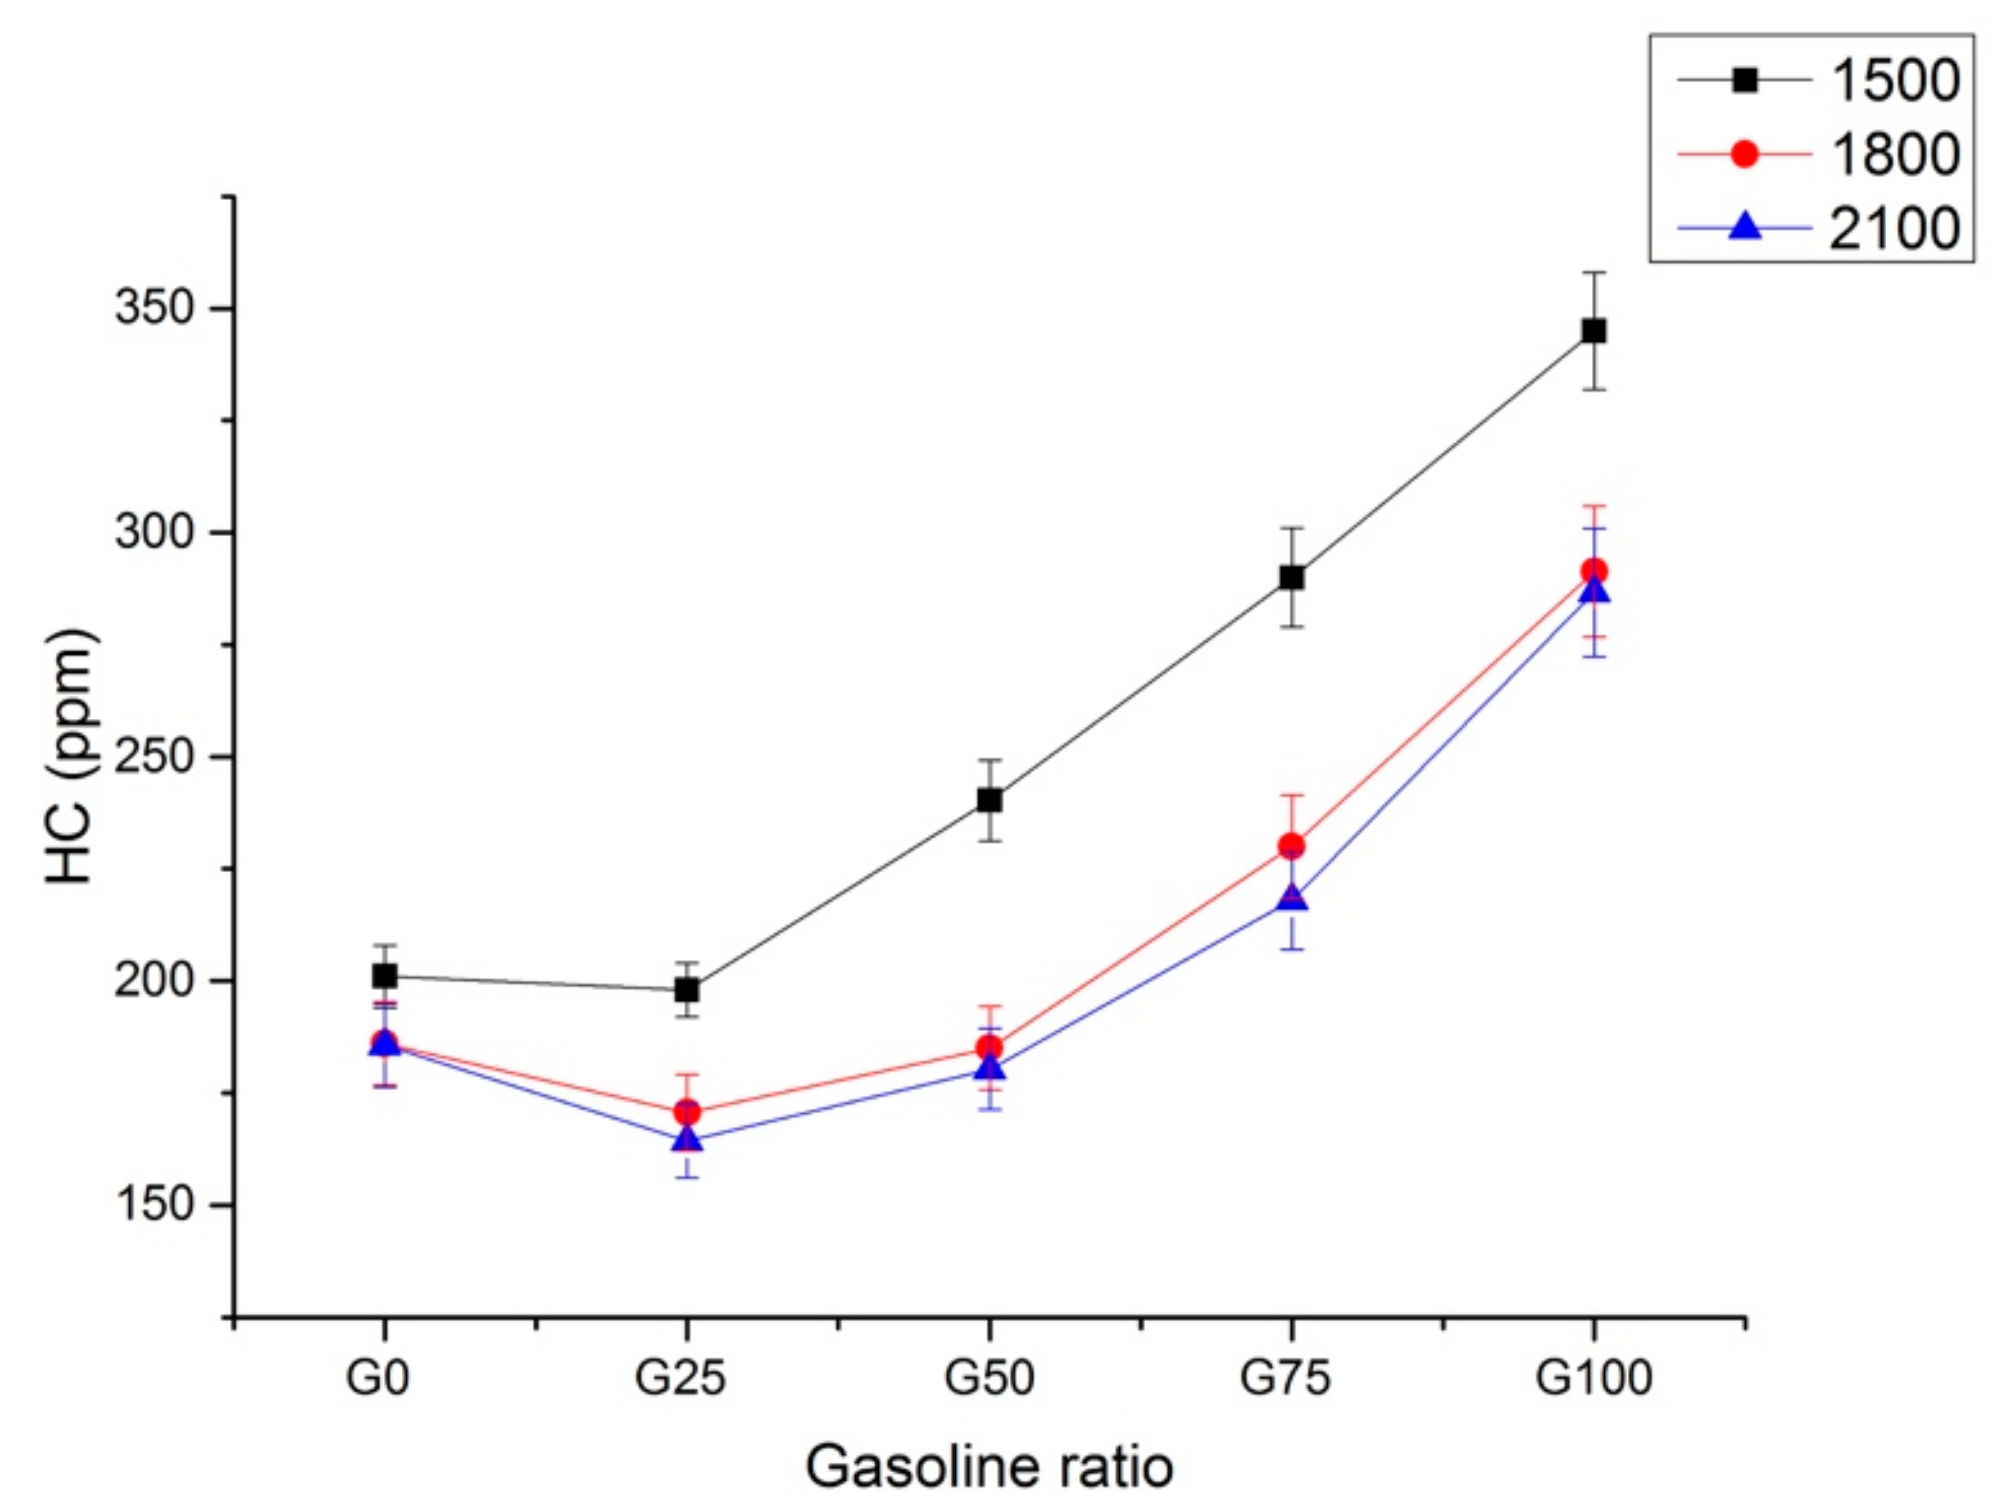
Figure 6 shows the relationship between HC emissions and the blending ratio of ethanol/gasoline at three different engine speeds at 1500, 1800 and 2100 respectively as shown in the legend of the figure. It can be seen that the HC emissions show a same trend at each speed. With the increase of the proportion of direct injection gasoline, HC emissions first decrease and then increase, which is lowest at G25. As the speed increases, the HC drops significantly. This is because the increase in the rotational speed increases the vortex diffusion and turbulent mixing of the cylinder and also increases the turbulence and mixing in the exhaust. The former increases the combustion in the cylinder and the latter increases the oxidation effect. When only ethanol injected into the intake port, the amount of fuel film attached to the intake port increases due to the increase of the amount of ethanol (Table 6) and the increase of fuel film formation on the intake port resulting in the increase of HC emissions. Ethanol can increase the oxygen content in the mixed fuel to a certain extent, however, the increase of the amount of gasoline can lead to the formation of local fuel-rich zone, so fuel and air cannot be fully mixed and burned. It can be found that the HC emissions of adding ethanol are always lower than that of only gasoline and to be more specific, HC emissions decreases by 43%, 41.6% and 42.6% for three engine speed.
3.2. Particle Emission Characteristics
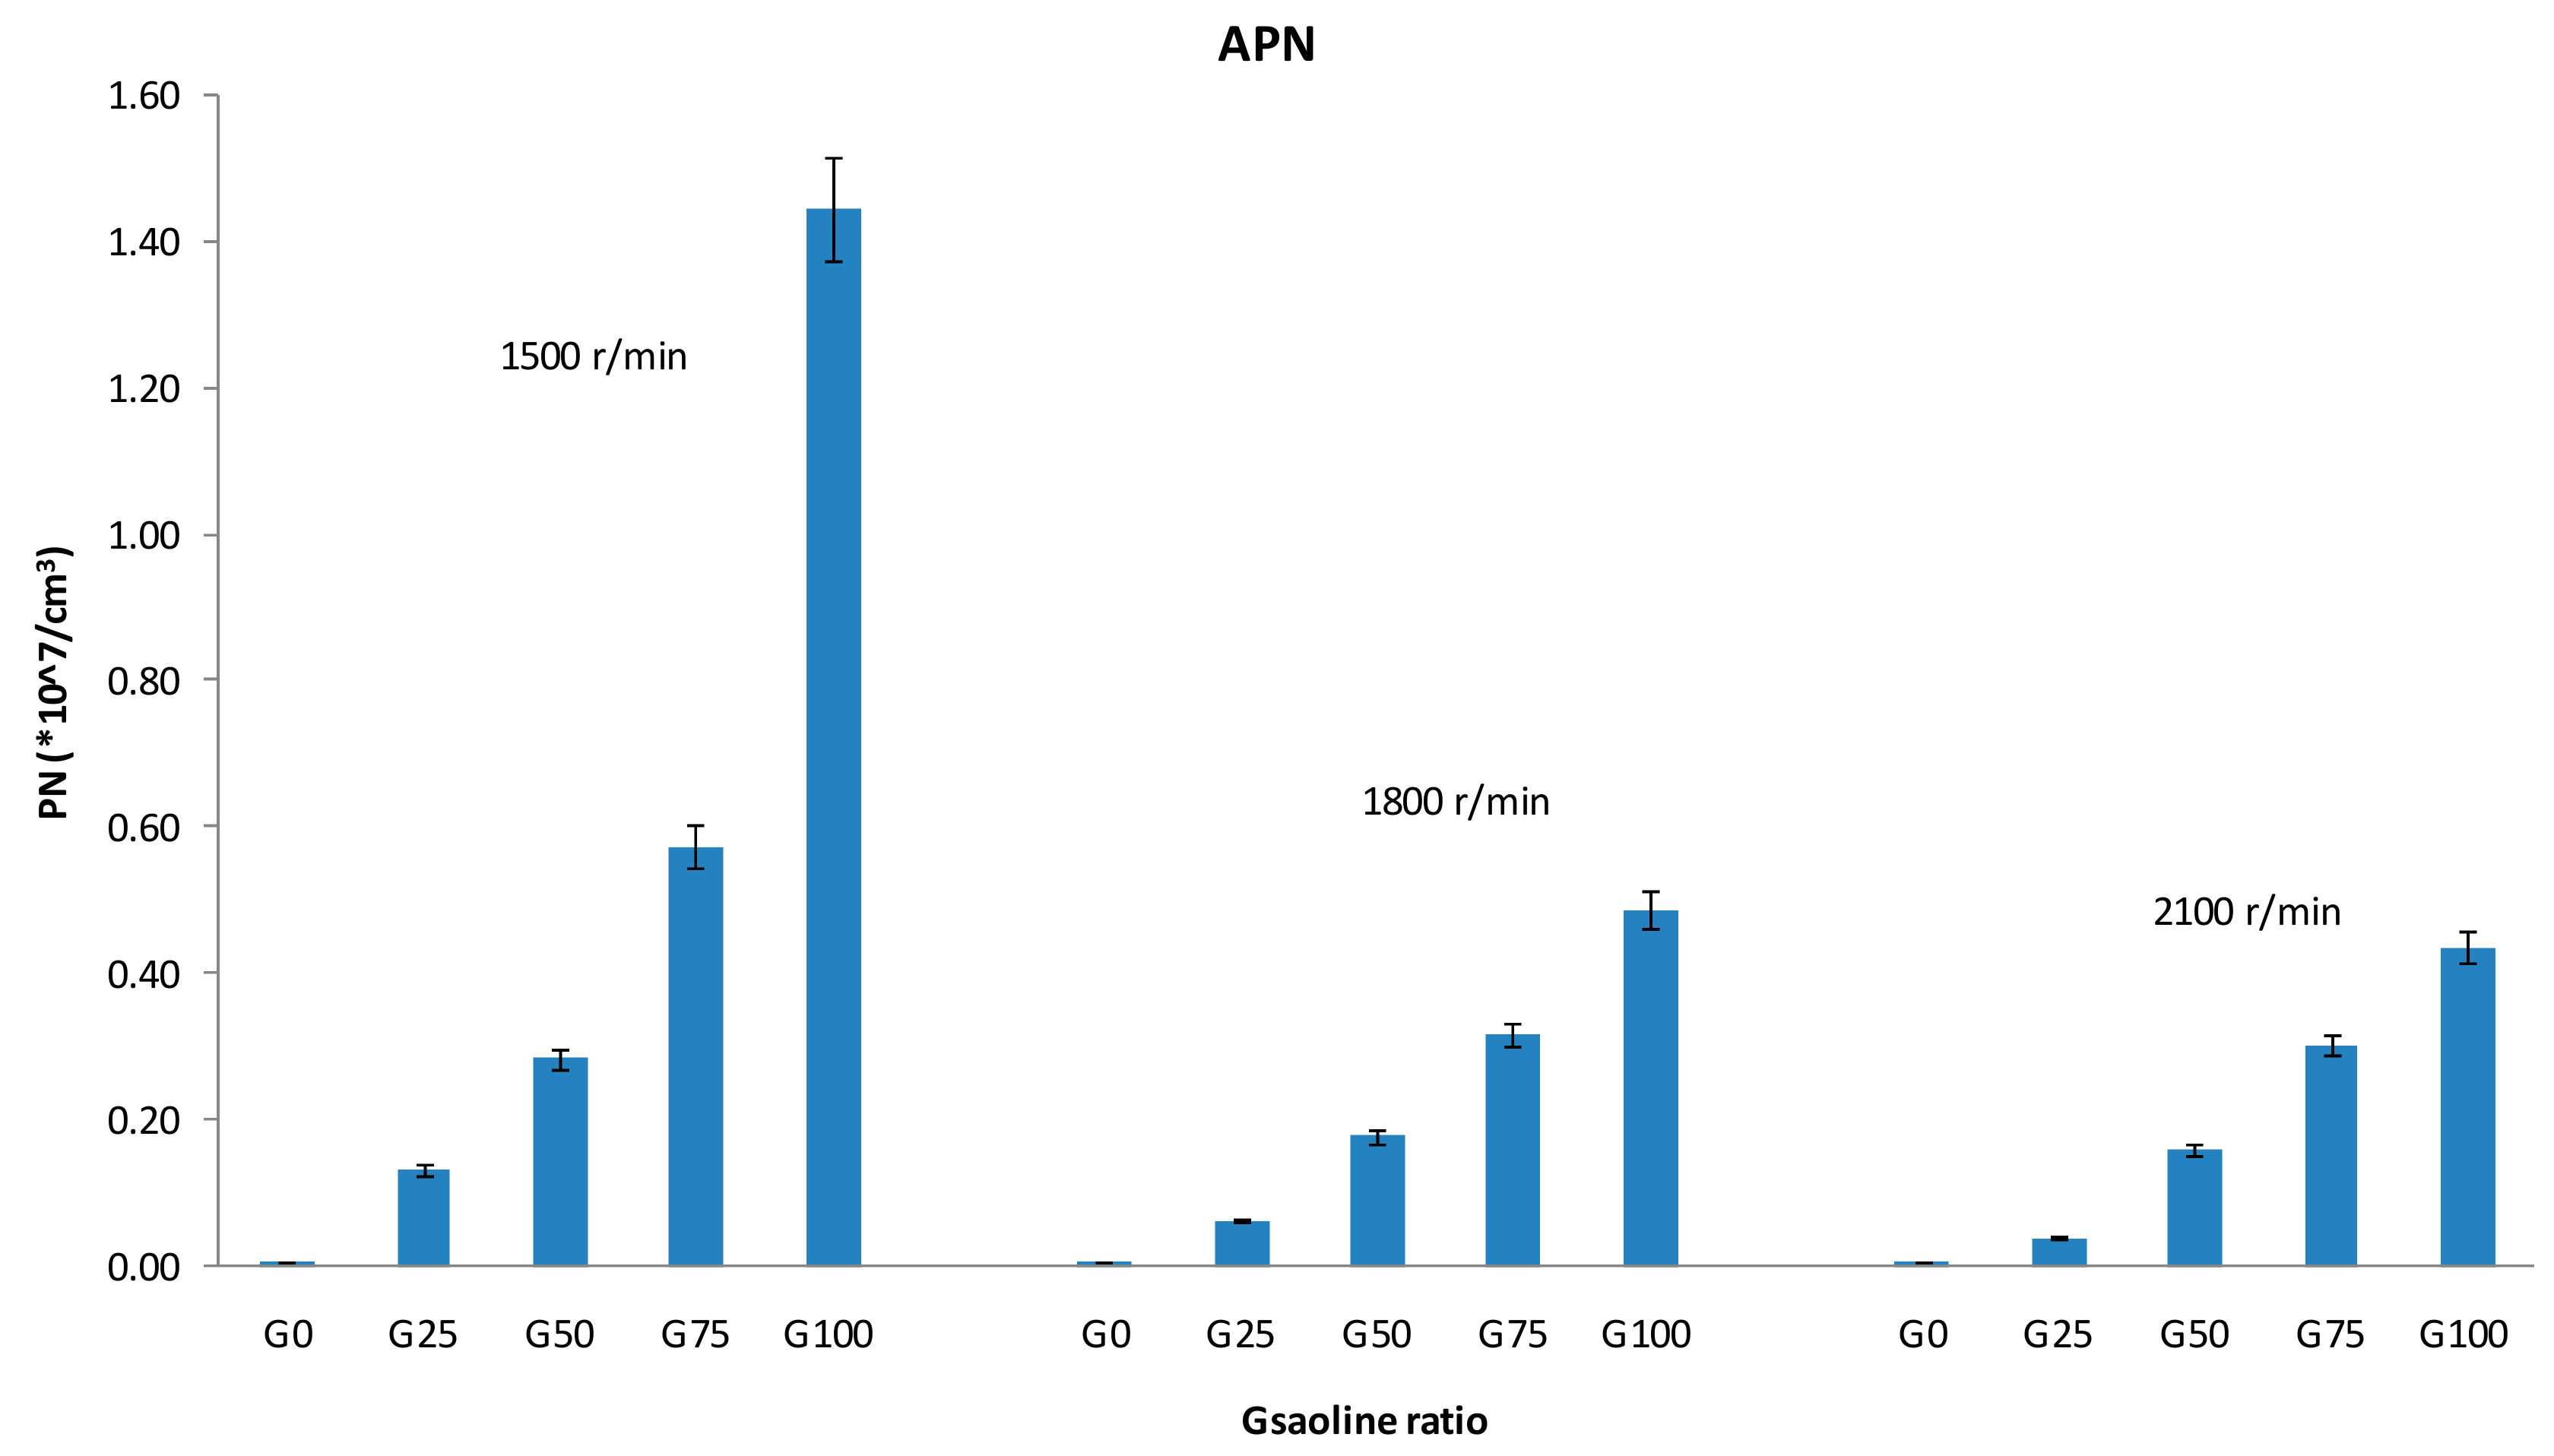
Figure 7 shows the variation of APN as a function of Re at three different speeds. It can be seen that there is very small amount of APN in pure ethanol and the engine speeds do not affect the particulate emissions. The reason is that the oxygen in ethanol plays an important role in the later oxidation of the accumulated particles and the uniform mixture formation in the intake port. At other blending ratios, as the speed increases, the APN decreases accordingly. Especially at the G100 ratio, APN decreases by 67.8% when the speed changes from 1500, 1800 r/min and decreases by 72% when the engine speed changes from 1800, 2100 r/min. This is because the strong airflow in cylinder caused by the increase of speed improves the fuel mixing, which makes the combustion more complete, Also, the strong airflow movement in the high engine speed makes the particles less likely to accumulate. It can also be found that the relationship between the APN and the blending ratio is similar for these three different engine speeds. When the intake port injected ethanol is gradually switched to direct injected gasoline, the APN of particles gradually rises. The formation of aggregated particles is strongly related to polycyclic aromatic hydrocarbons in gasoline; and the injection of large amount of gasoline into the cylinder can result in a locally fuel rich zone near the spark plug [34], so the atomization mixing effect is poor and the incomplete combustion can produce large amount of particles. Meanwhile, the reduction of ethanol will reduce the oxygen content in the fuel, which can also contribute to the increase of the particle emissions. In addition, when the engine speed changes from medium to high speeds, the APN is insensitive to the speed changes.
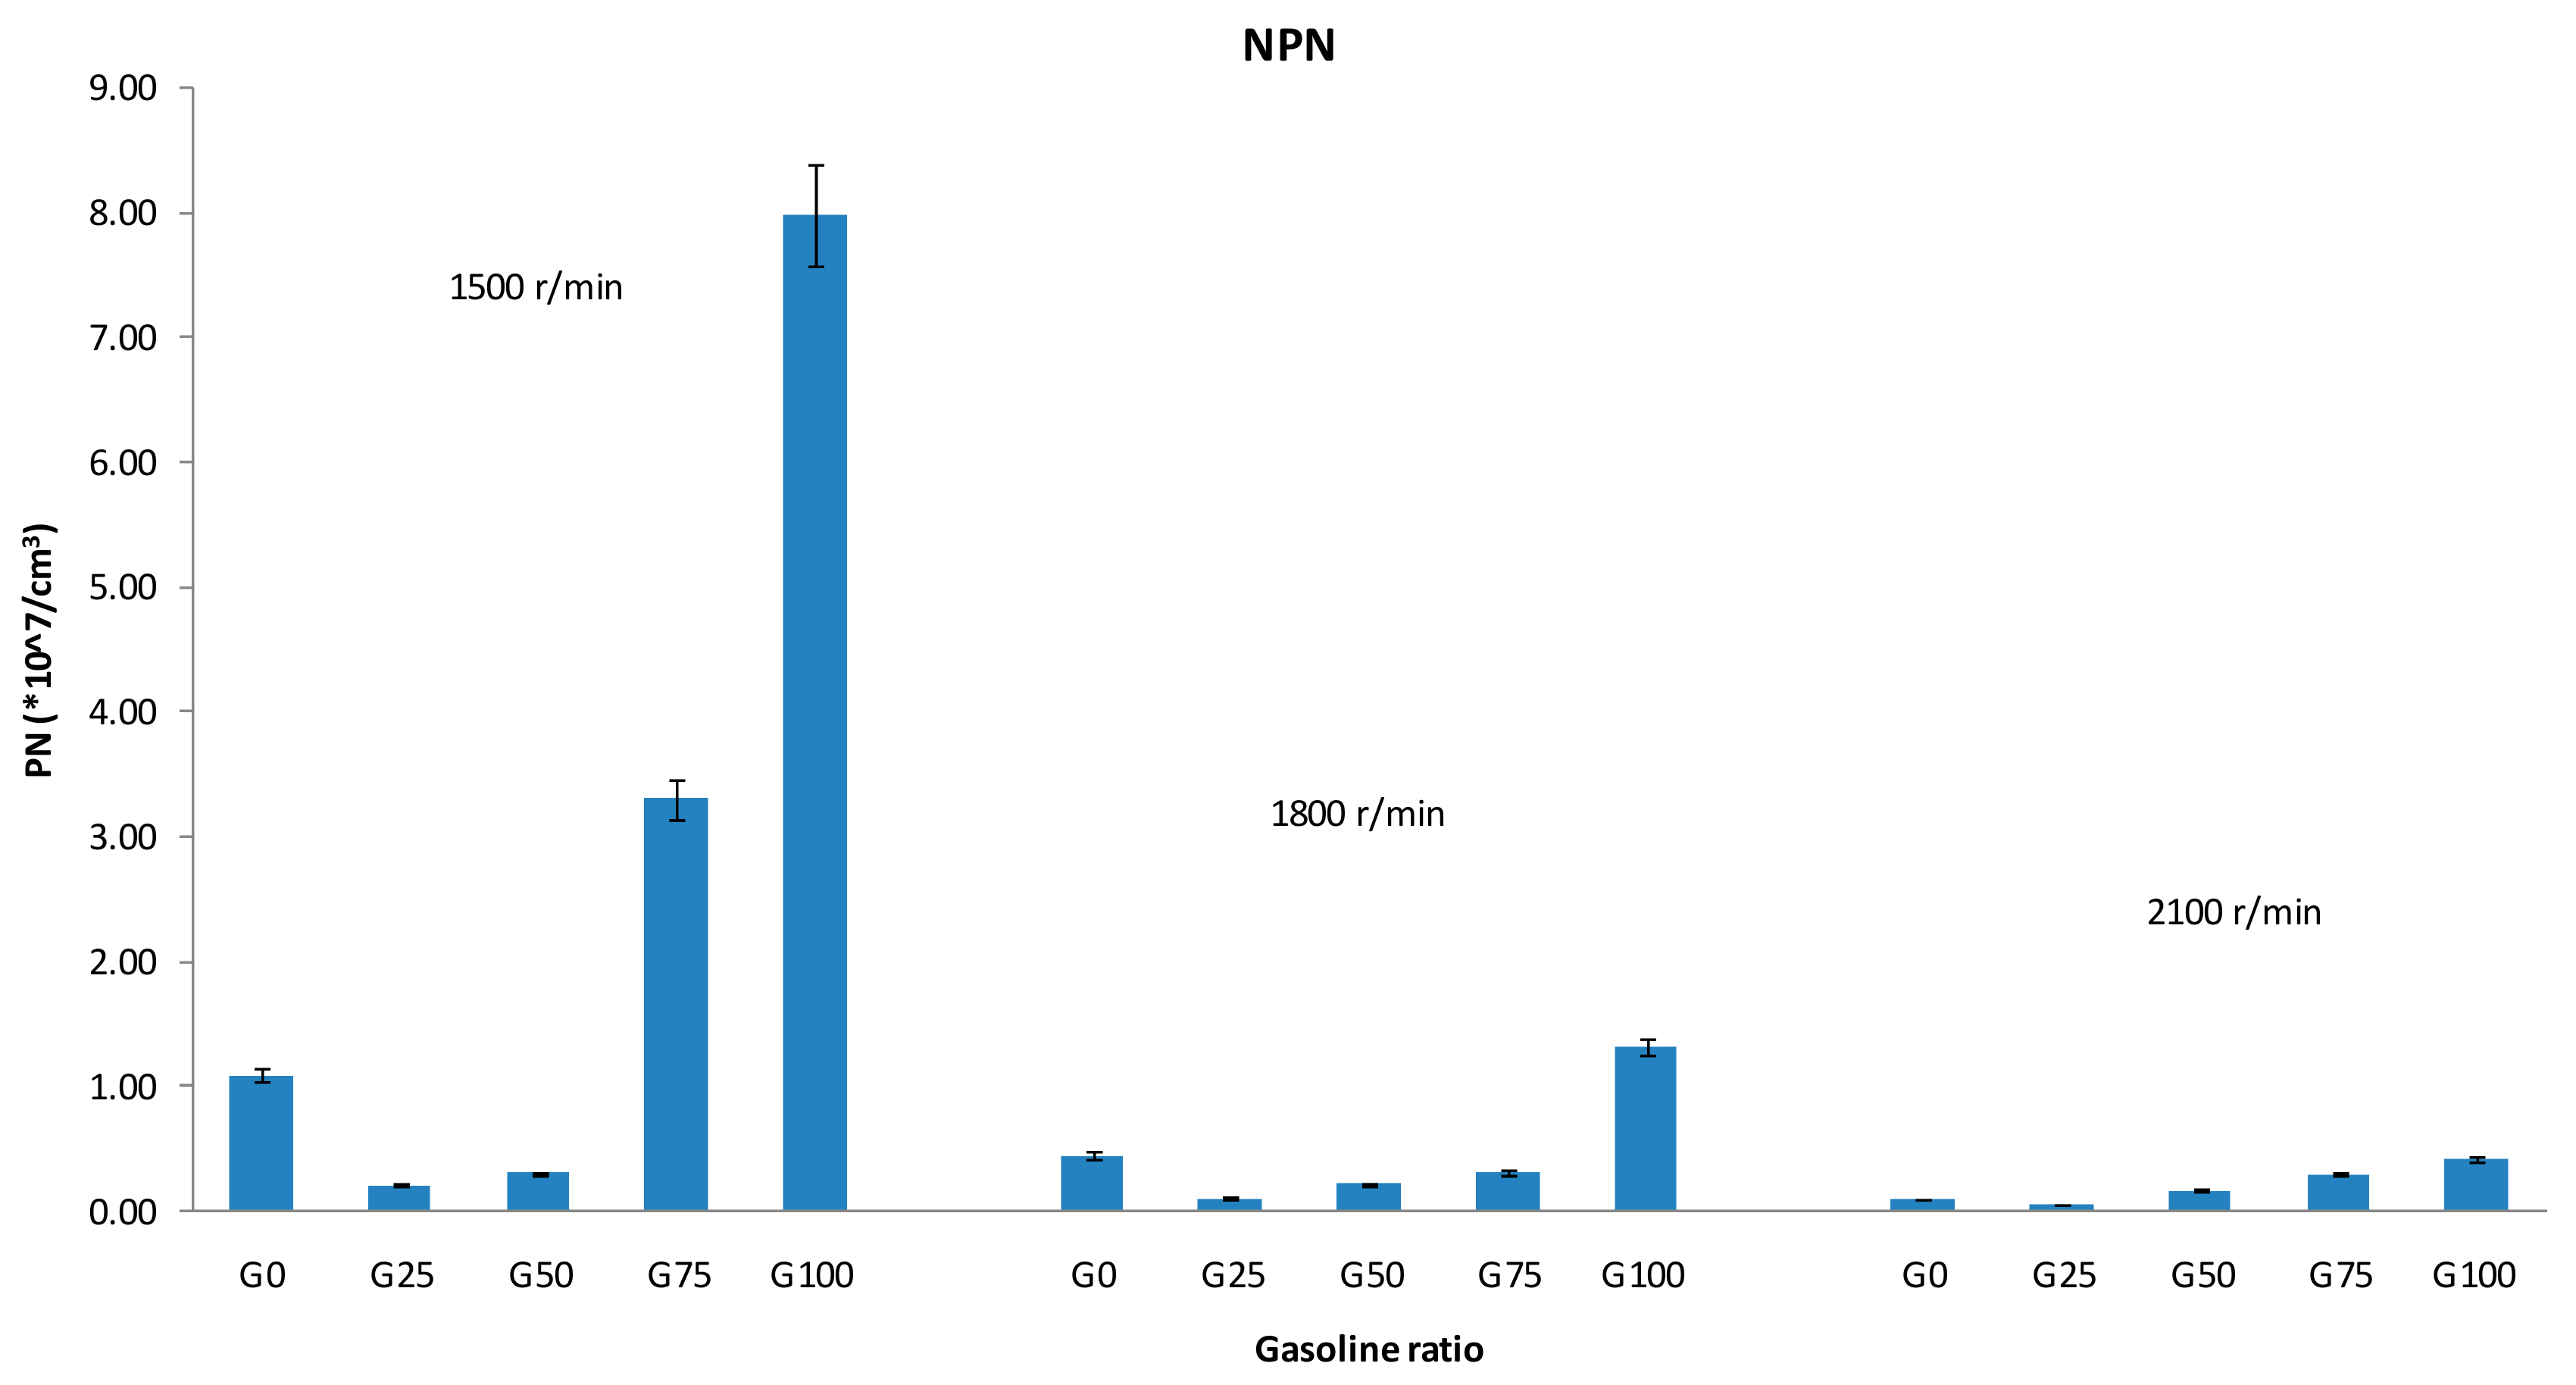
Figure 8 shows the variation of NPN versus Re at three different engine speeds. It indicates that with the direct injection ratio increasing, the NPN decreases first and then increases for all the three engine speeds and the minimum NPN is at G25. Firstly, more fuel is needed at pure ethanol working mode for a certain engine output power, compared to the ethanol/gasoline dual fuel working mode. Secondly, ethanol has a good combustion effect when injected from intake port and its oxygen-containing properties act on the oxidation of the particles. These lead to a large number of fine particles with smaller diameters and NPN for G0 fuel is higher than that from G25.When the blending ratio exceeds G25, the proportion of gasoline increases. Although the total amount of fuel is reduced, the direct injection of gasoline will bring about the incomplete atomization, which will increase the unburned HC and the NPN. It is worth mentioning that the nucleation particles are closely related to HC emissions. Similarly, The increase in speed is beneficial to the reduction of NPN.
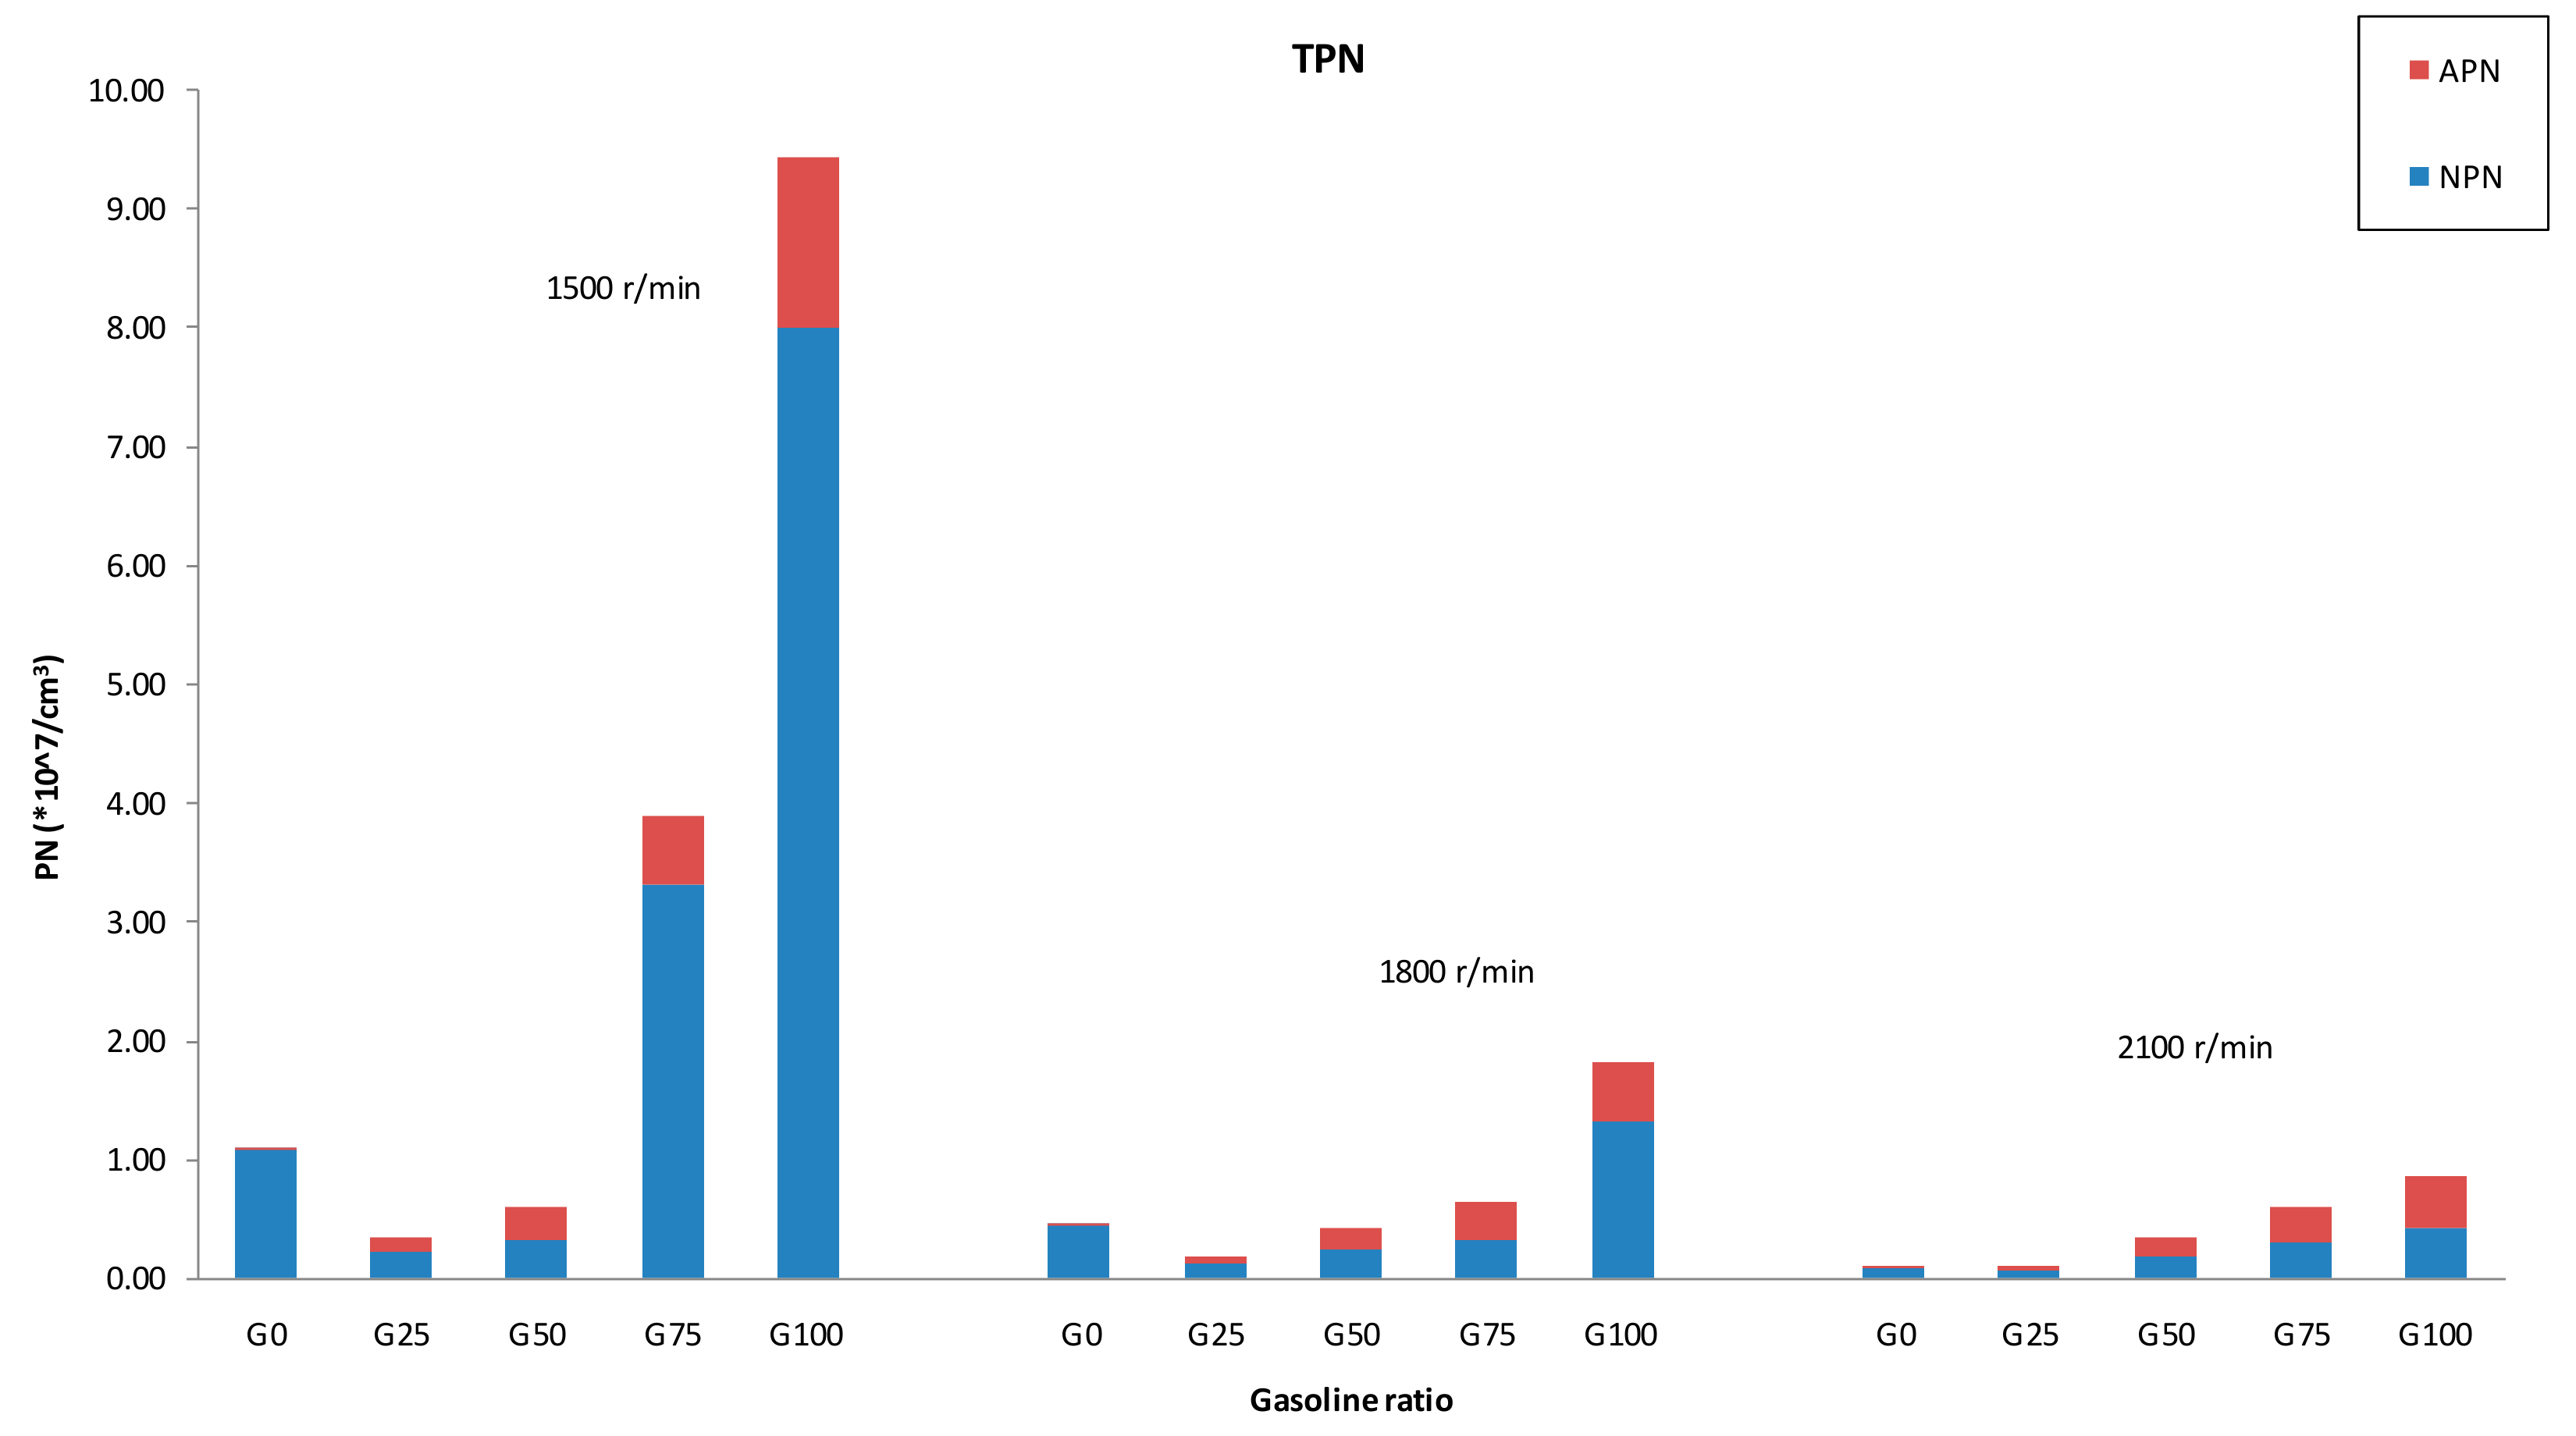
Figure 9 shows the variation of TPN with blending ratio with three different engine speeds at low engine load. It can be seen that the trend of TPN is consistent with that of NPN for all three different engine speeds in this study. At a fixed blend ratio, the NPN is higher than the APN, especially at small and medium speeds. The change of TPN depends on the NPN. TPN remains least with 75% ethanol and 25% gasoline (G25). When the speed changes at 1500, 1800 and 2100 r/min, The TPN of G25 is respectively 96.3%, 90.2%, 87.6% more than G100. For low engine speed, when the proportion of gasoline is higher than 50%, the TPN increases sharply. When the proportion of gasoline is greater than 50%, gasoline plays a major role in combustion, which causes APN to increase. As the direct injection gasoline increases, the diffusion of the oil film on the wall increases the HC emissions. Also, the in- cylinder temperature decreases with the increase of the proportion of direct injection gasoline which increases the possibility of wall quenching and the increase of HC emissions. In addition, the airflow at a low engine speed is weak, which is not conducive to the formation of a uniform mixture during the combustion process. Since the amount of HC in the gas mixture can significantly affect the formation of NPN, the increase of APN and NPN make TPN rise sharply when gasoline exceeds 50%.
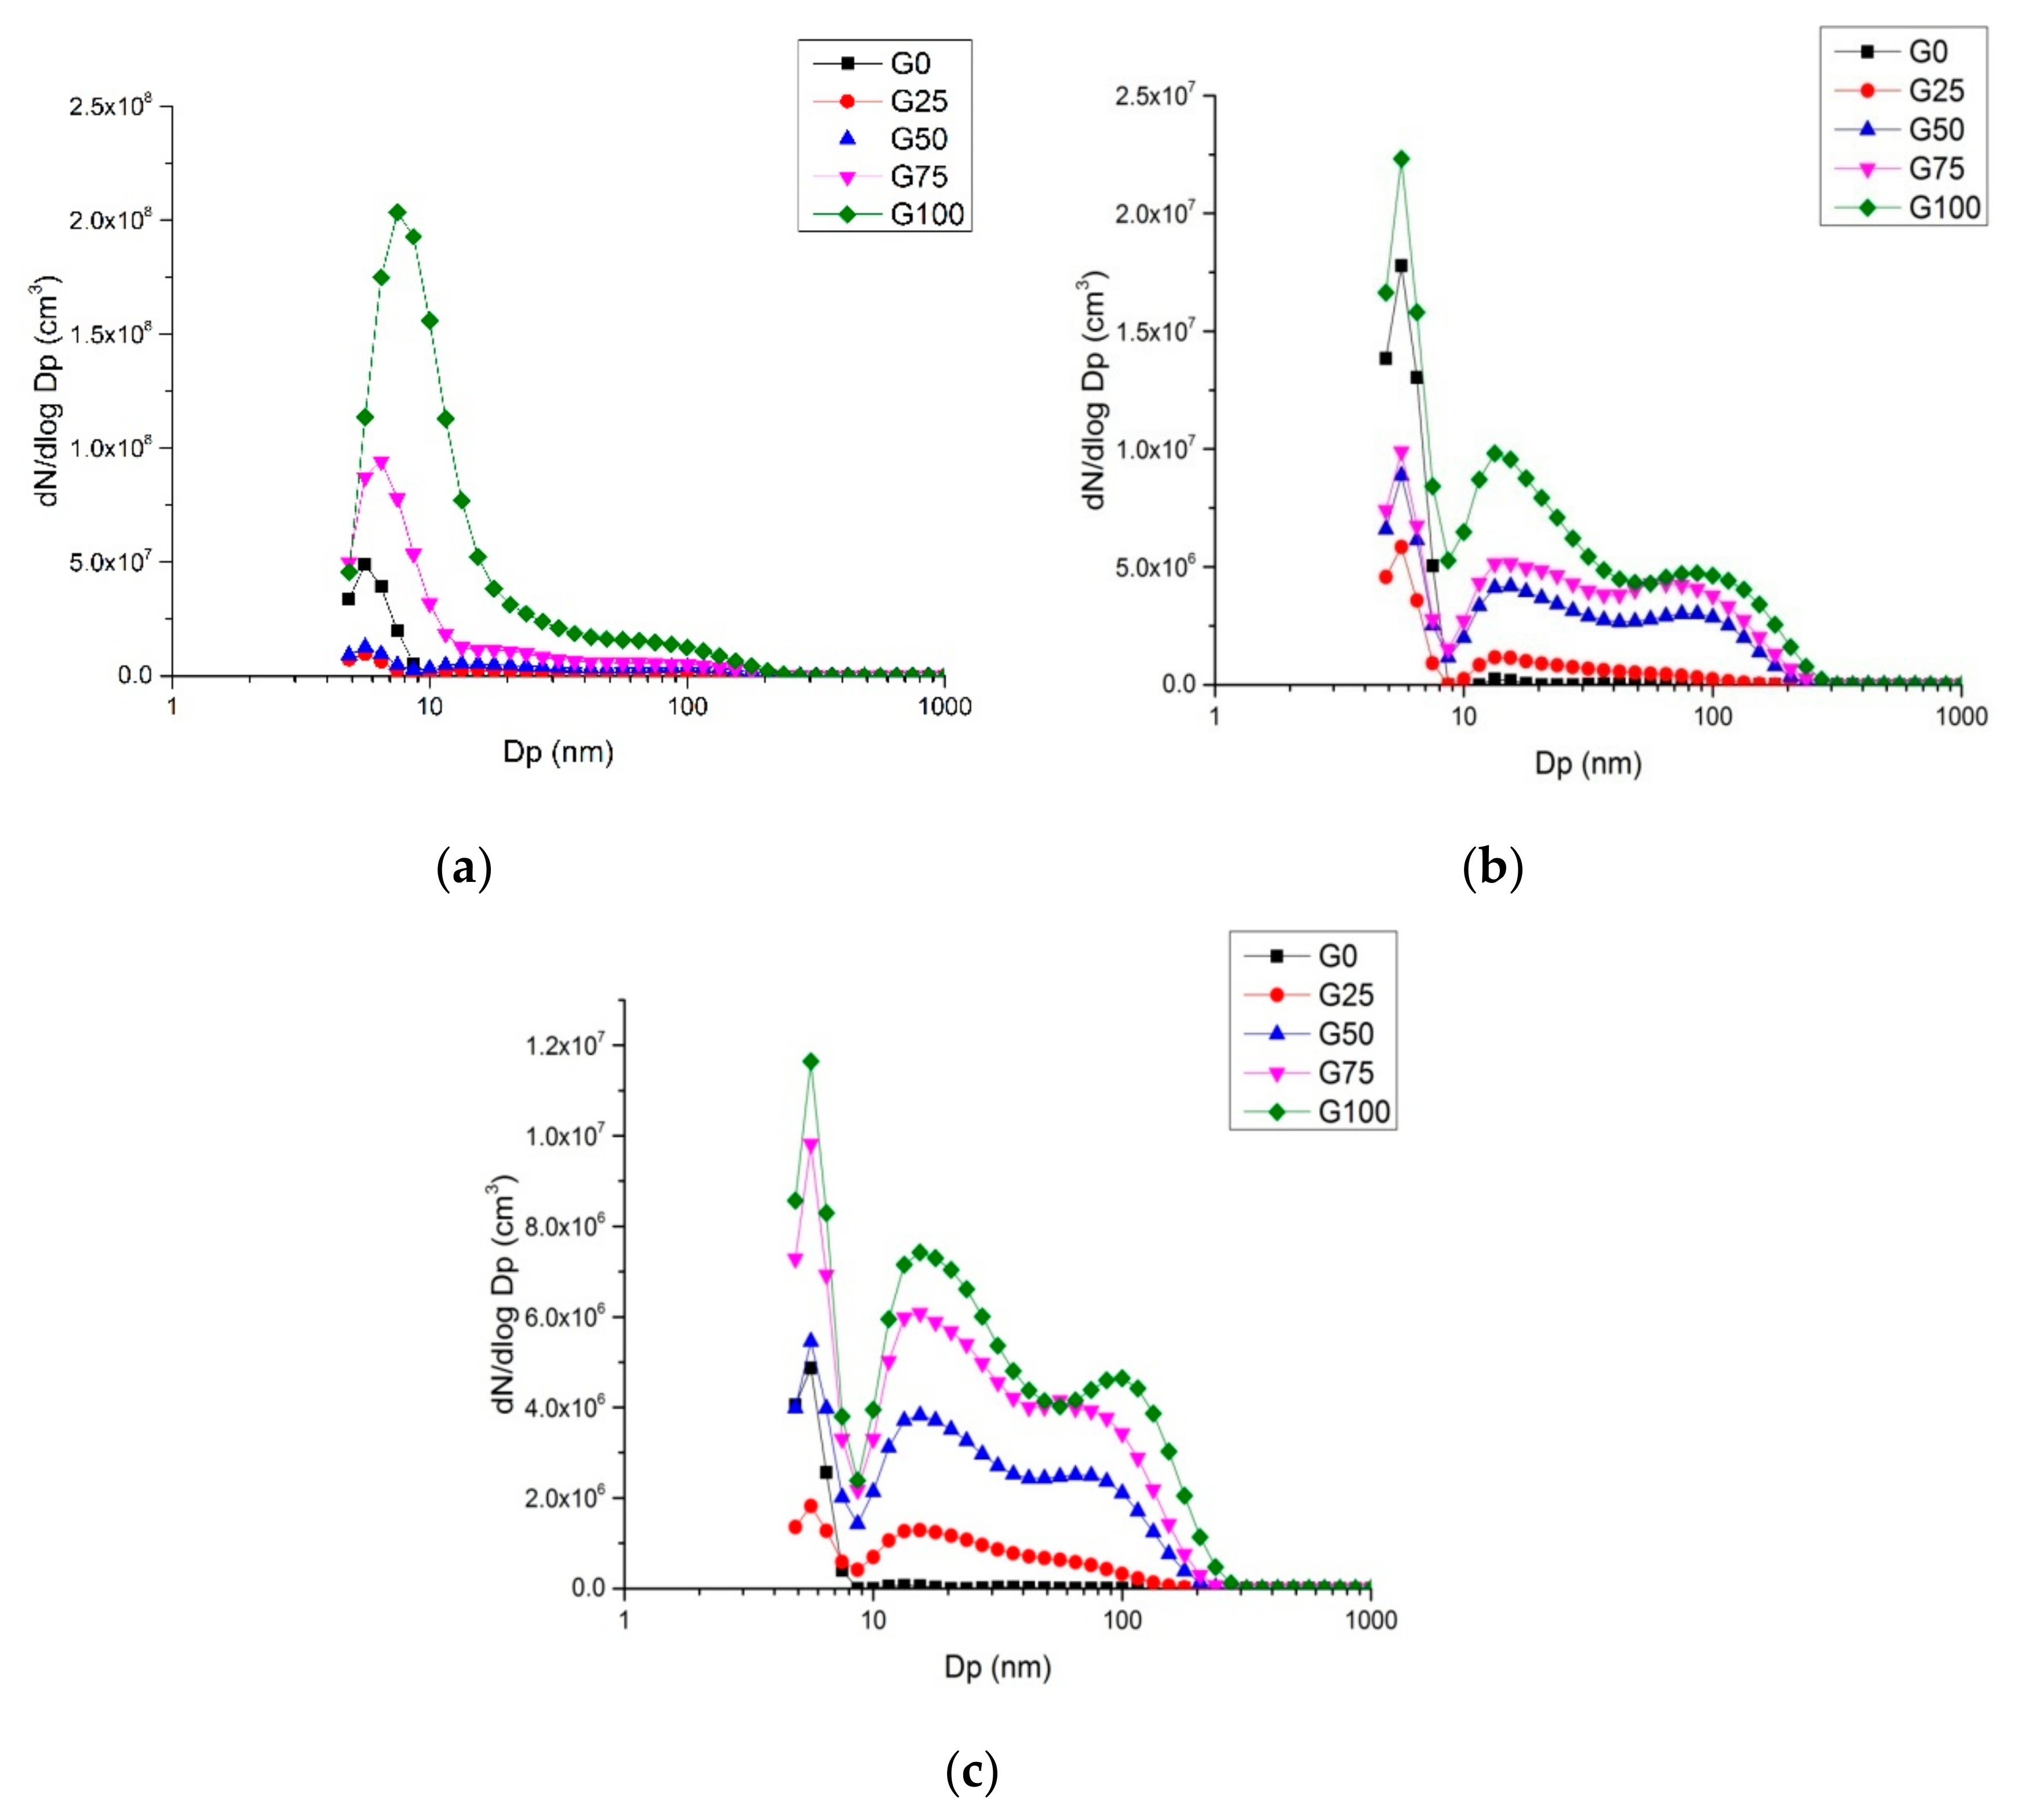
Figure 10 shows the distribution of particle size with different Re at three engine speeds. At low speeds, the particles have a single peak concentration distribution and the particle size distribution is almost the same at the ratio of G0 and G25. The peak value and peak particle size gradually increase from G25 to G100 and The maximum number of particles corresponds to the particle size is between 5–10 nm. At medium and high speeds, the peak size of the particles appears between 5–10 nm too, the particle size distribution is multiple peaks and the number of nucleation particles are still more than that of accumulation particles. From the particle size distribution, it can be found that as the proportion of ethanol decreases, the proportion of accumulated particles becomes larger and larger.
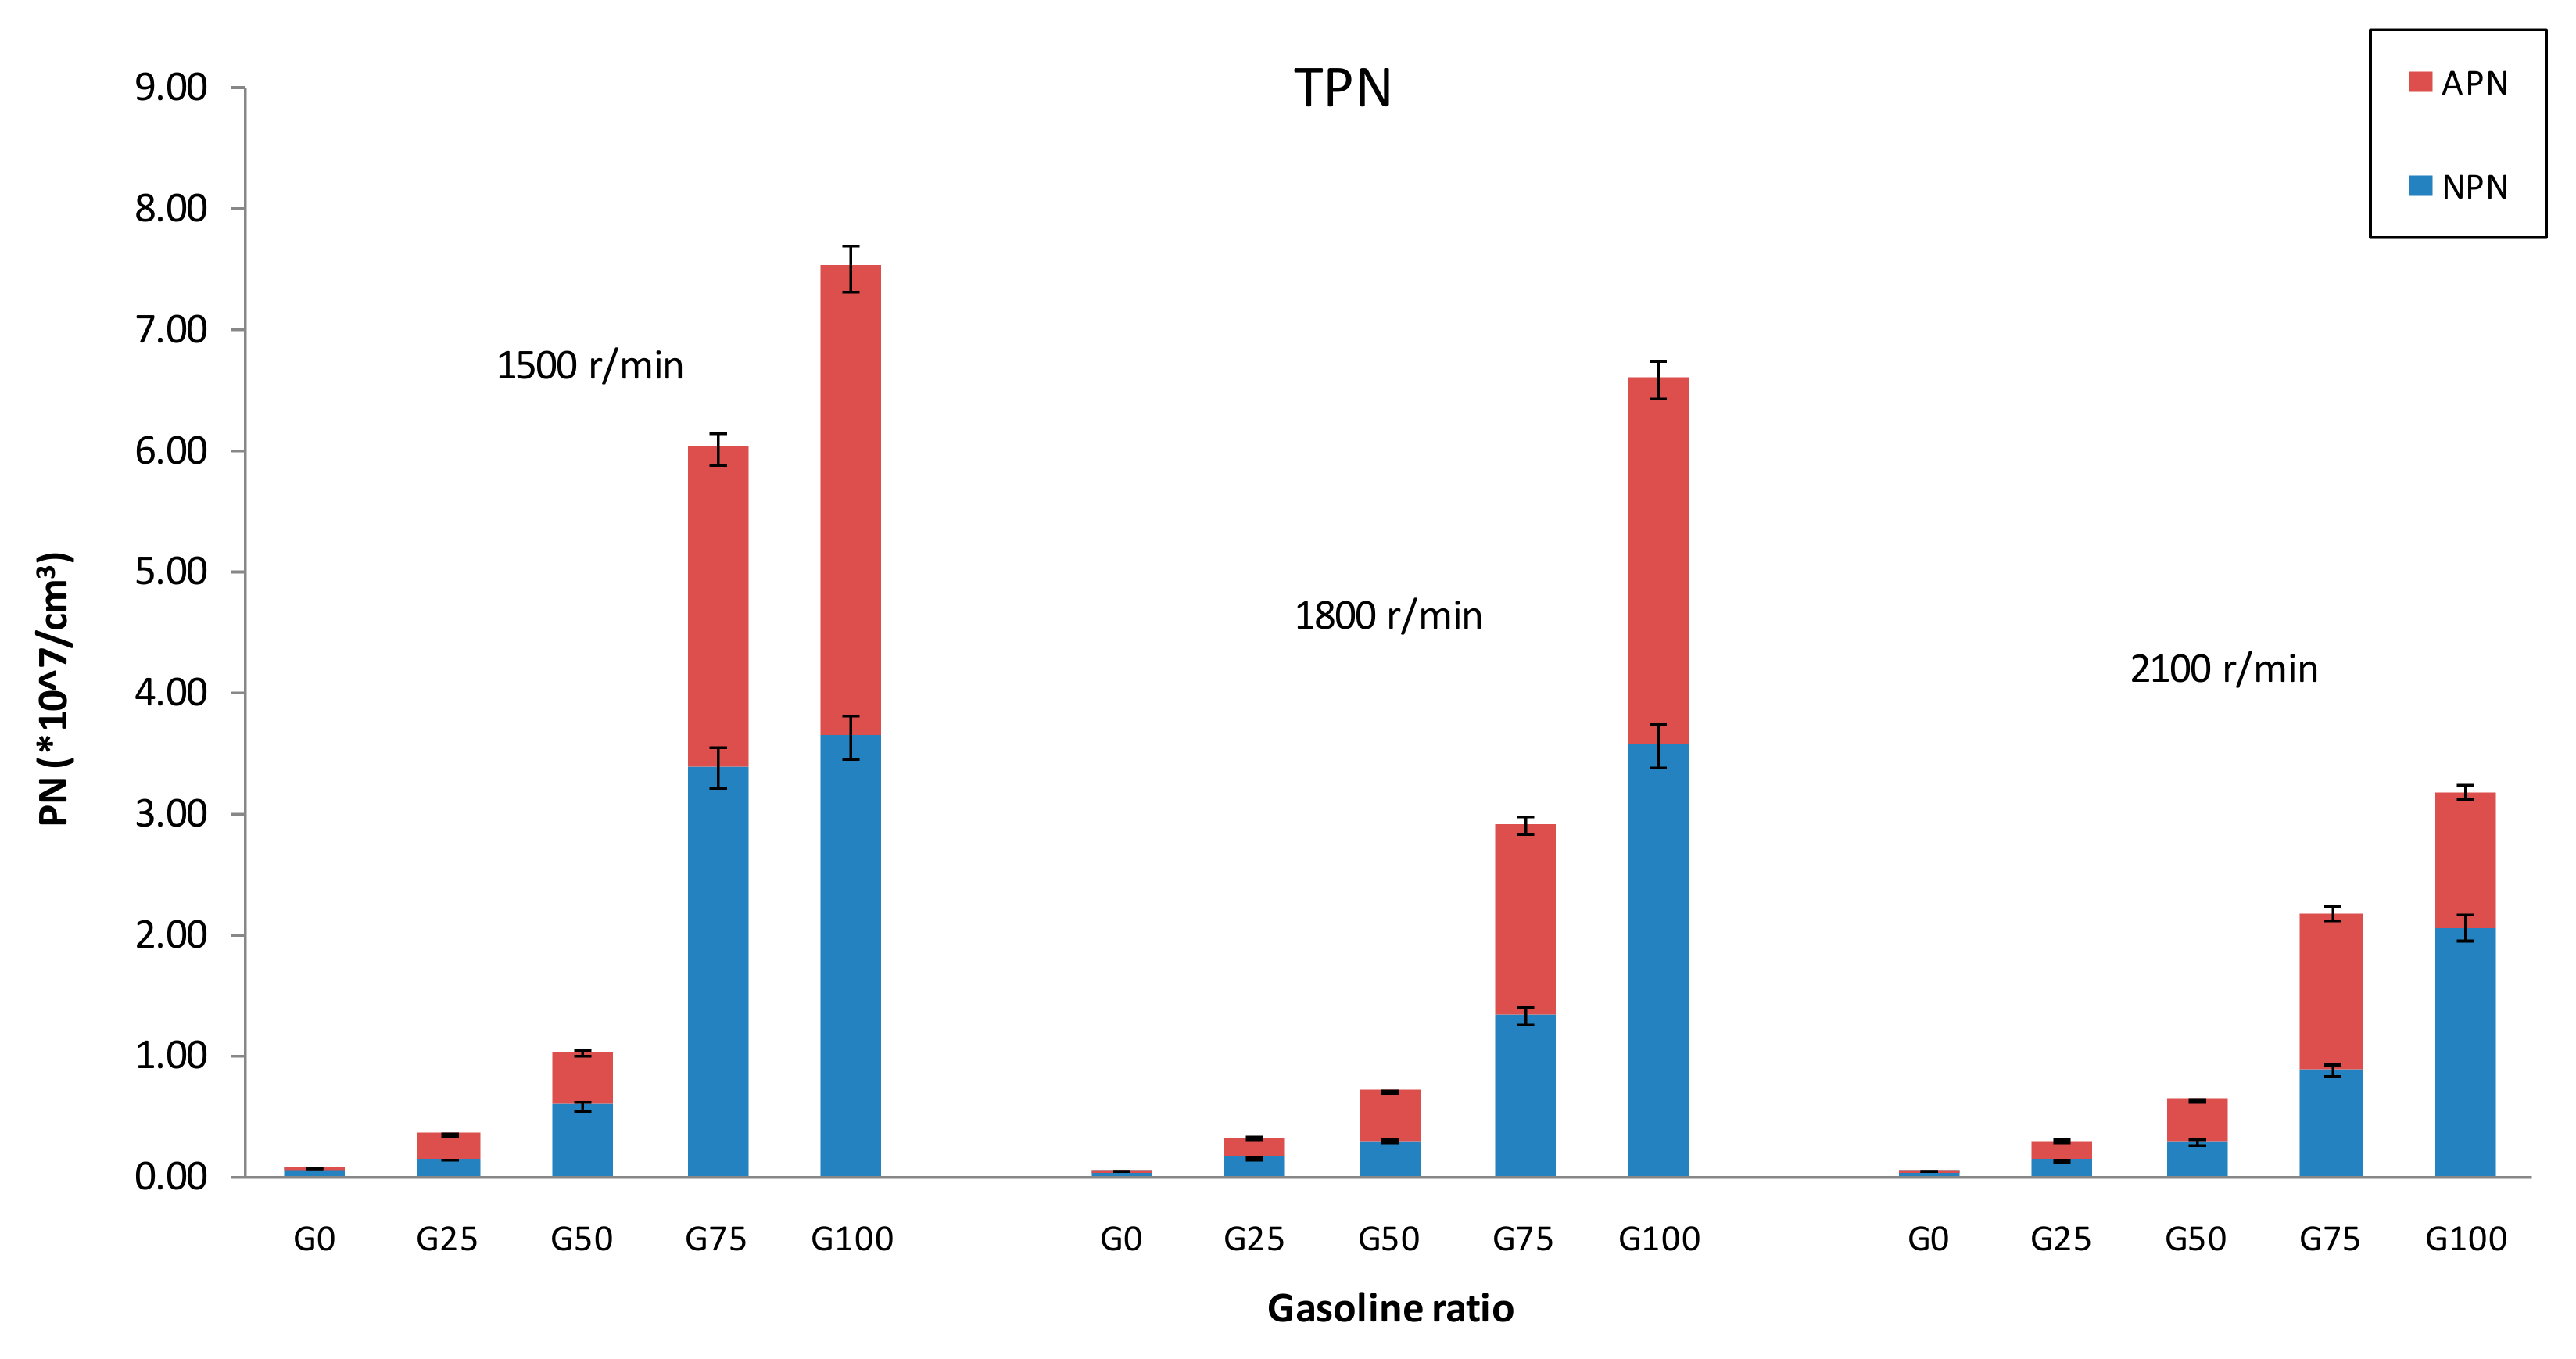
Figure 11 shows the relationship between TPN and Re at high load with three different engine speeds. At any of the speeds, when the mixture is below the G50, the amount of TPN is very small, while above the G50, the TPN increases sharply and from GO to G100, TPN is reduced by up to 95.4%, 95.1%, 90.7% for three speeds, respectively. The reason is that when Re is higher than 50%, ethanol plays a dominant role in the combustion process. Also, the oxygen-containing characteristics of the ethanol and the injection of the ethanol at intake port make the mixed fuel burn more totally, which can significantly help the oxidation of the particles at the late phase of combustion. When Re is less than 50%, gasoline is dominant in the mixed fuel, the local rich zone caused by direct injection and the decrease of oxygen content in the fuel mixture can lead to a substantial increase in TPN. It is worthy to note that for the ethanol/gasoline ratio smaller than G50, the change of TPN is insensitive to the engine speed but at the ratio of G75 and G100, the TPN decreases as the speed increases. The strong air motion will make up the shortcomings of the locally fuel rich zone and increase the uniformity of the fuel/air mixture, thus reducing the production of TPN. the TPN is the smallest under only ethanol injection/combustion model for each engine speed in this study. Therefore, Re is greater than 50% for the best effect on particulate emissions at high speed and large load.
Both HC emissions and the total number of particulates are at the minimum level at G25. Therefore, it is necessary to analyze the influence of other engine operating parameters on the particle emissions with G25 ethanol/gasoline ratio.
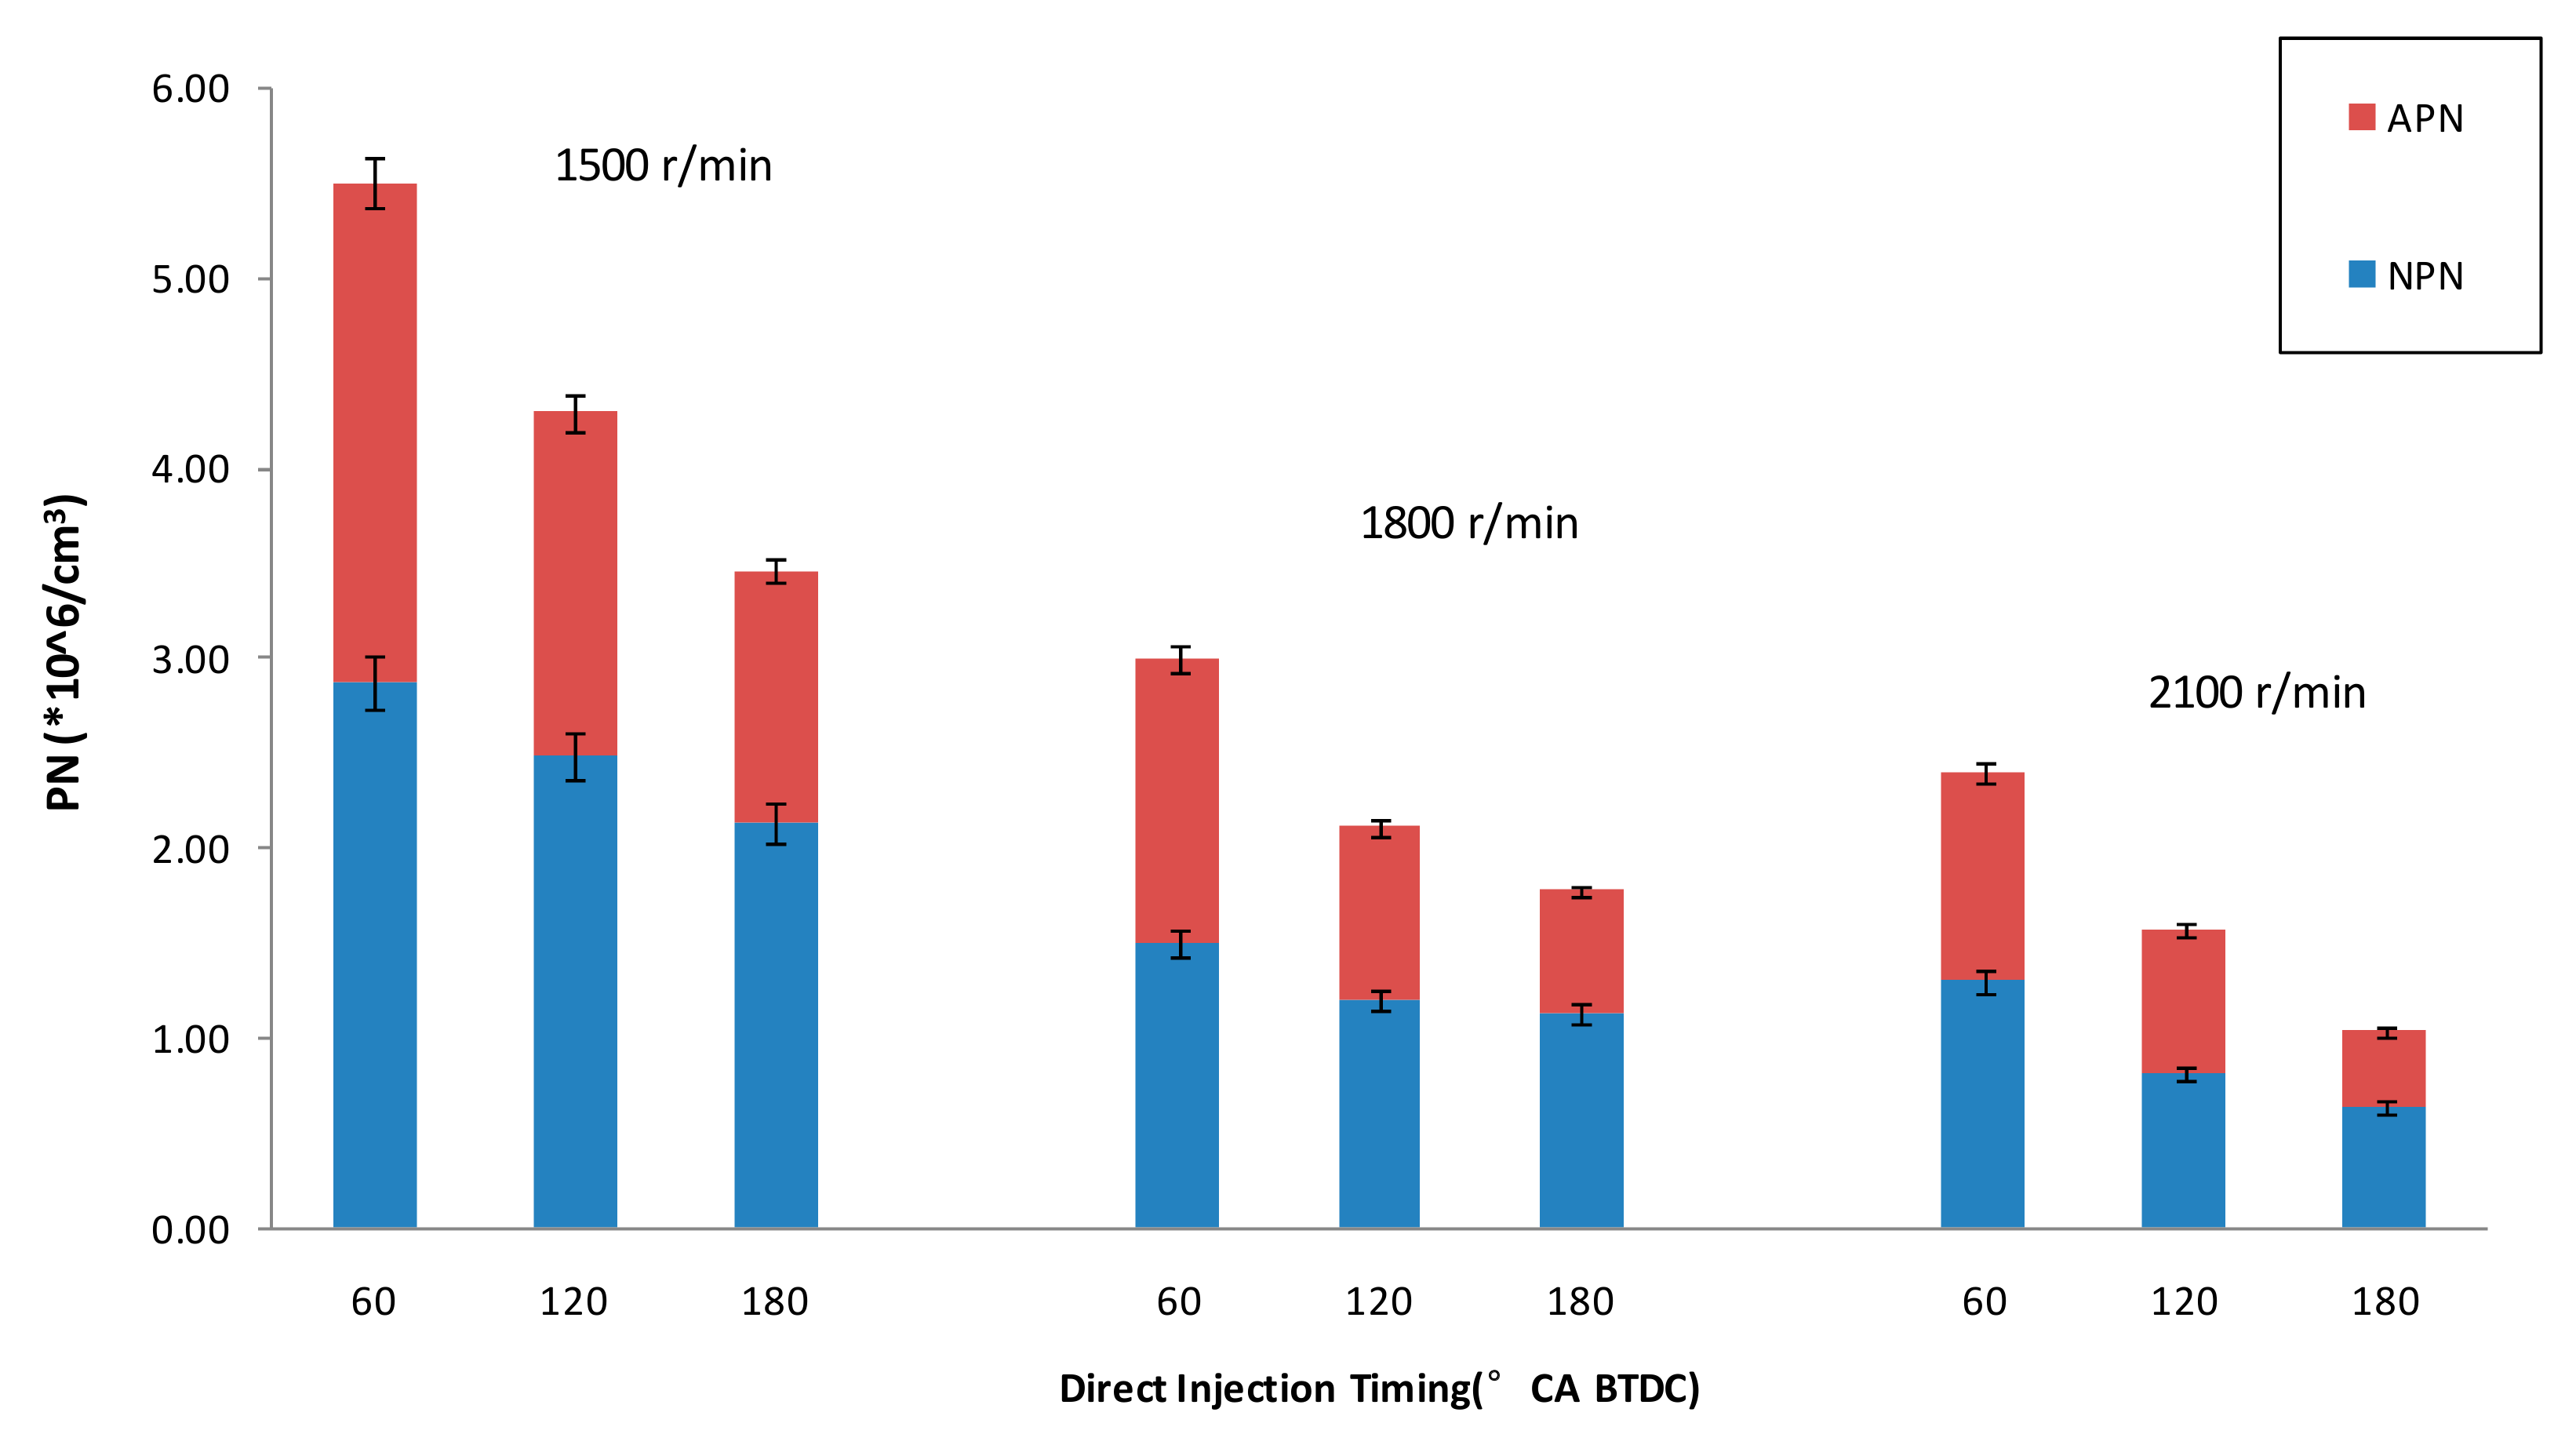
Figure 12 shows that the effects of the direct injection timing on the TPN is significant and the trend for different engine speeds is consistent. for a certain engine speed, APN and NPN gradually decrease with the advance of the direct injection timing. This is because larger direct injection timing allows the gasoline to have more time for atomization and mixing, which is beneficial to reducing the carbon particles, HC and polycyclic aromatic hydrocarbons produced by incomplete combustion. When the direct injection timing is constant, the increase of the engine speed can reduce the TPN, this can be attributed to the increasing of engine speed makes the in-cylinder airflow motion stronger, which is beneficial to further atomizing and mixing of the mixed fuel. When the speed is at 1500, 1800 and 2100 r/min, injecting gasoline in advance from 60 to 180 °CA BTDC reduces TPN by about 37%, 41% and 57%, respectively.
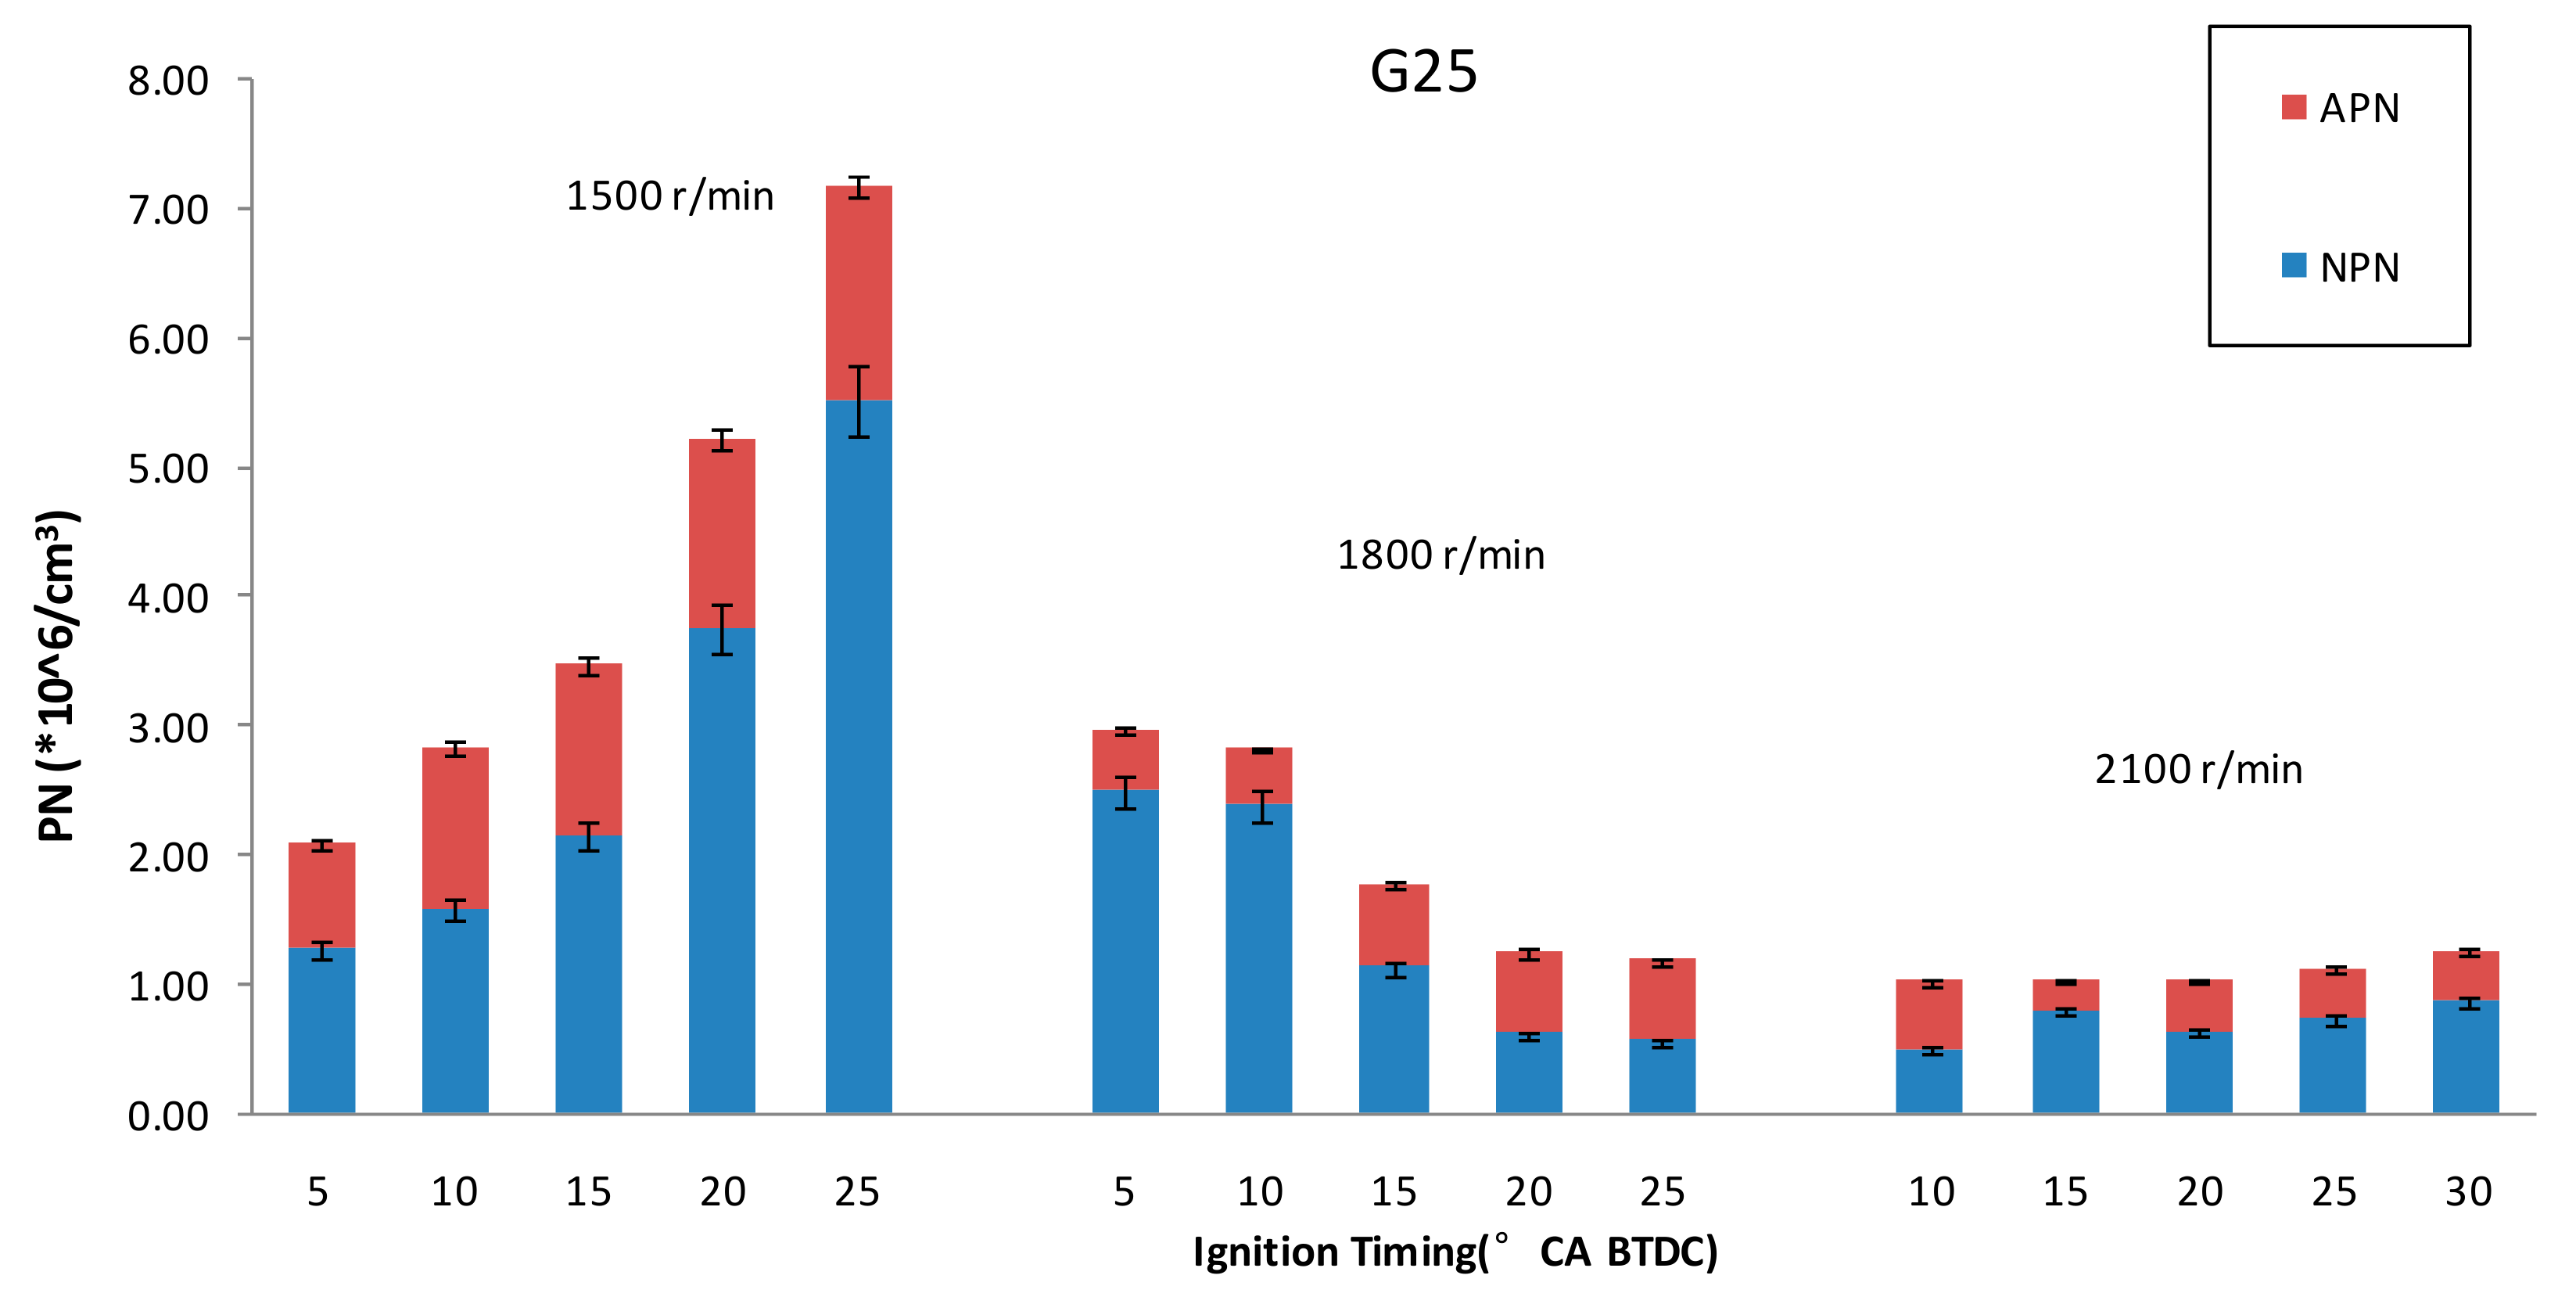
Figure 13 shows the relationship between the number of particles and the ignition timing at three speeds under ethanol/gasoline ratio equals to G25. At small engine speed, APN and NPN increases as the ignition timing advance from 5 °CA BTDC to 25 °CA BTDC. The reason is that with the advance of ignition timing, most of the fuel completes the combustion and releases heat close to the top dead center. The increase of the in-cylinder temperature can cause the fuel to crack and form a large number of fine particles, which can lead to the increase of NPN. At specific direct injection timing, the earlier ignition timings affect the evaporation and atomization of gasoline and the increase of the local rich zone, which can increase the APN. However, the trend of TPN with different ignition times is opposite for engine speed at 1800 r/min and 1500 r/min. With the ignition timing delay, the APN reduces while the NPN increases gradually. The reason is that when the ignition is retard to 5 °CA BTDC, the post-combustion plays a dominant role in the oxidation of the accumulated particles. A large amount of nucleation particles are formed in the post combustion region and the number of accumulated particles is reduced [35]. The excessive afterburning can result in the insufficient of the late oxidation of the particles because of the low pressure and temperature, which may be the main reason for the increase in TPN [36]. At high speeds, it can be seen that the TPN is insensitive to the variation of ignition timings. At 2100 r/min, the particulate emissions corresponding to each ignition moment are less than 1800, 1500 r/min. Therefore, the ignition strategy corresponding to the three speeds is different. As the speed increases, we should pre-ignite appropriately to obtain the best particle emissions.
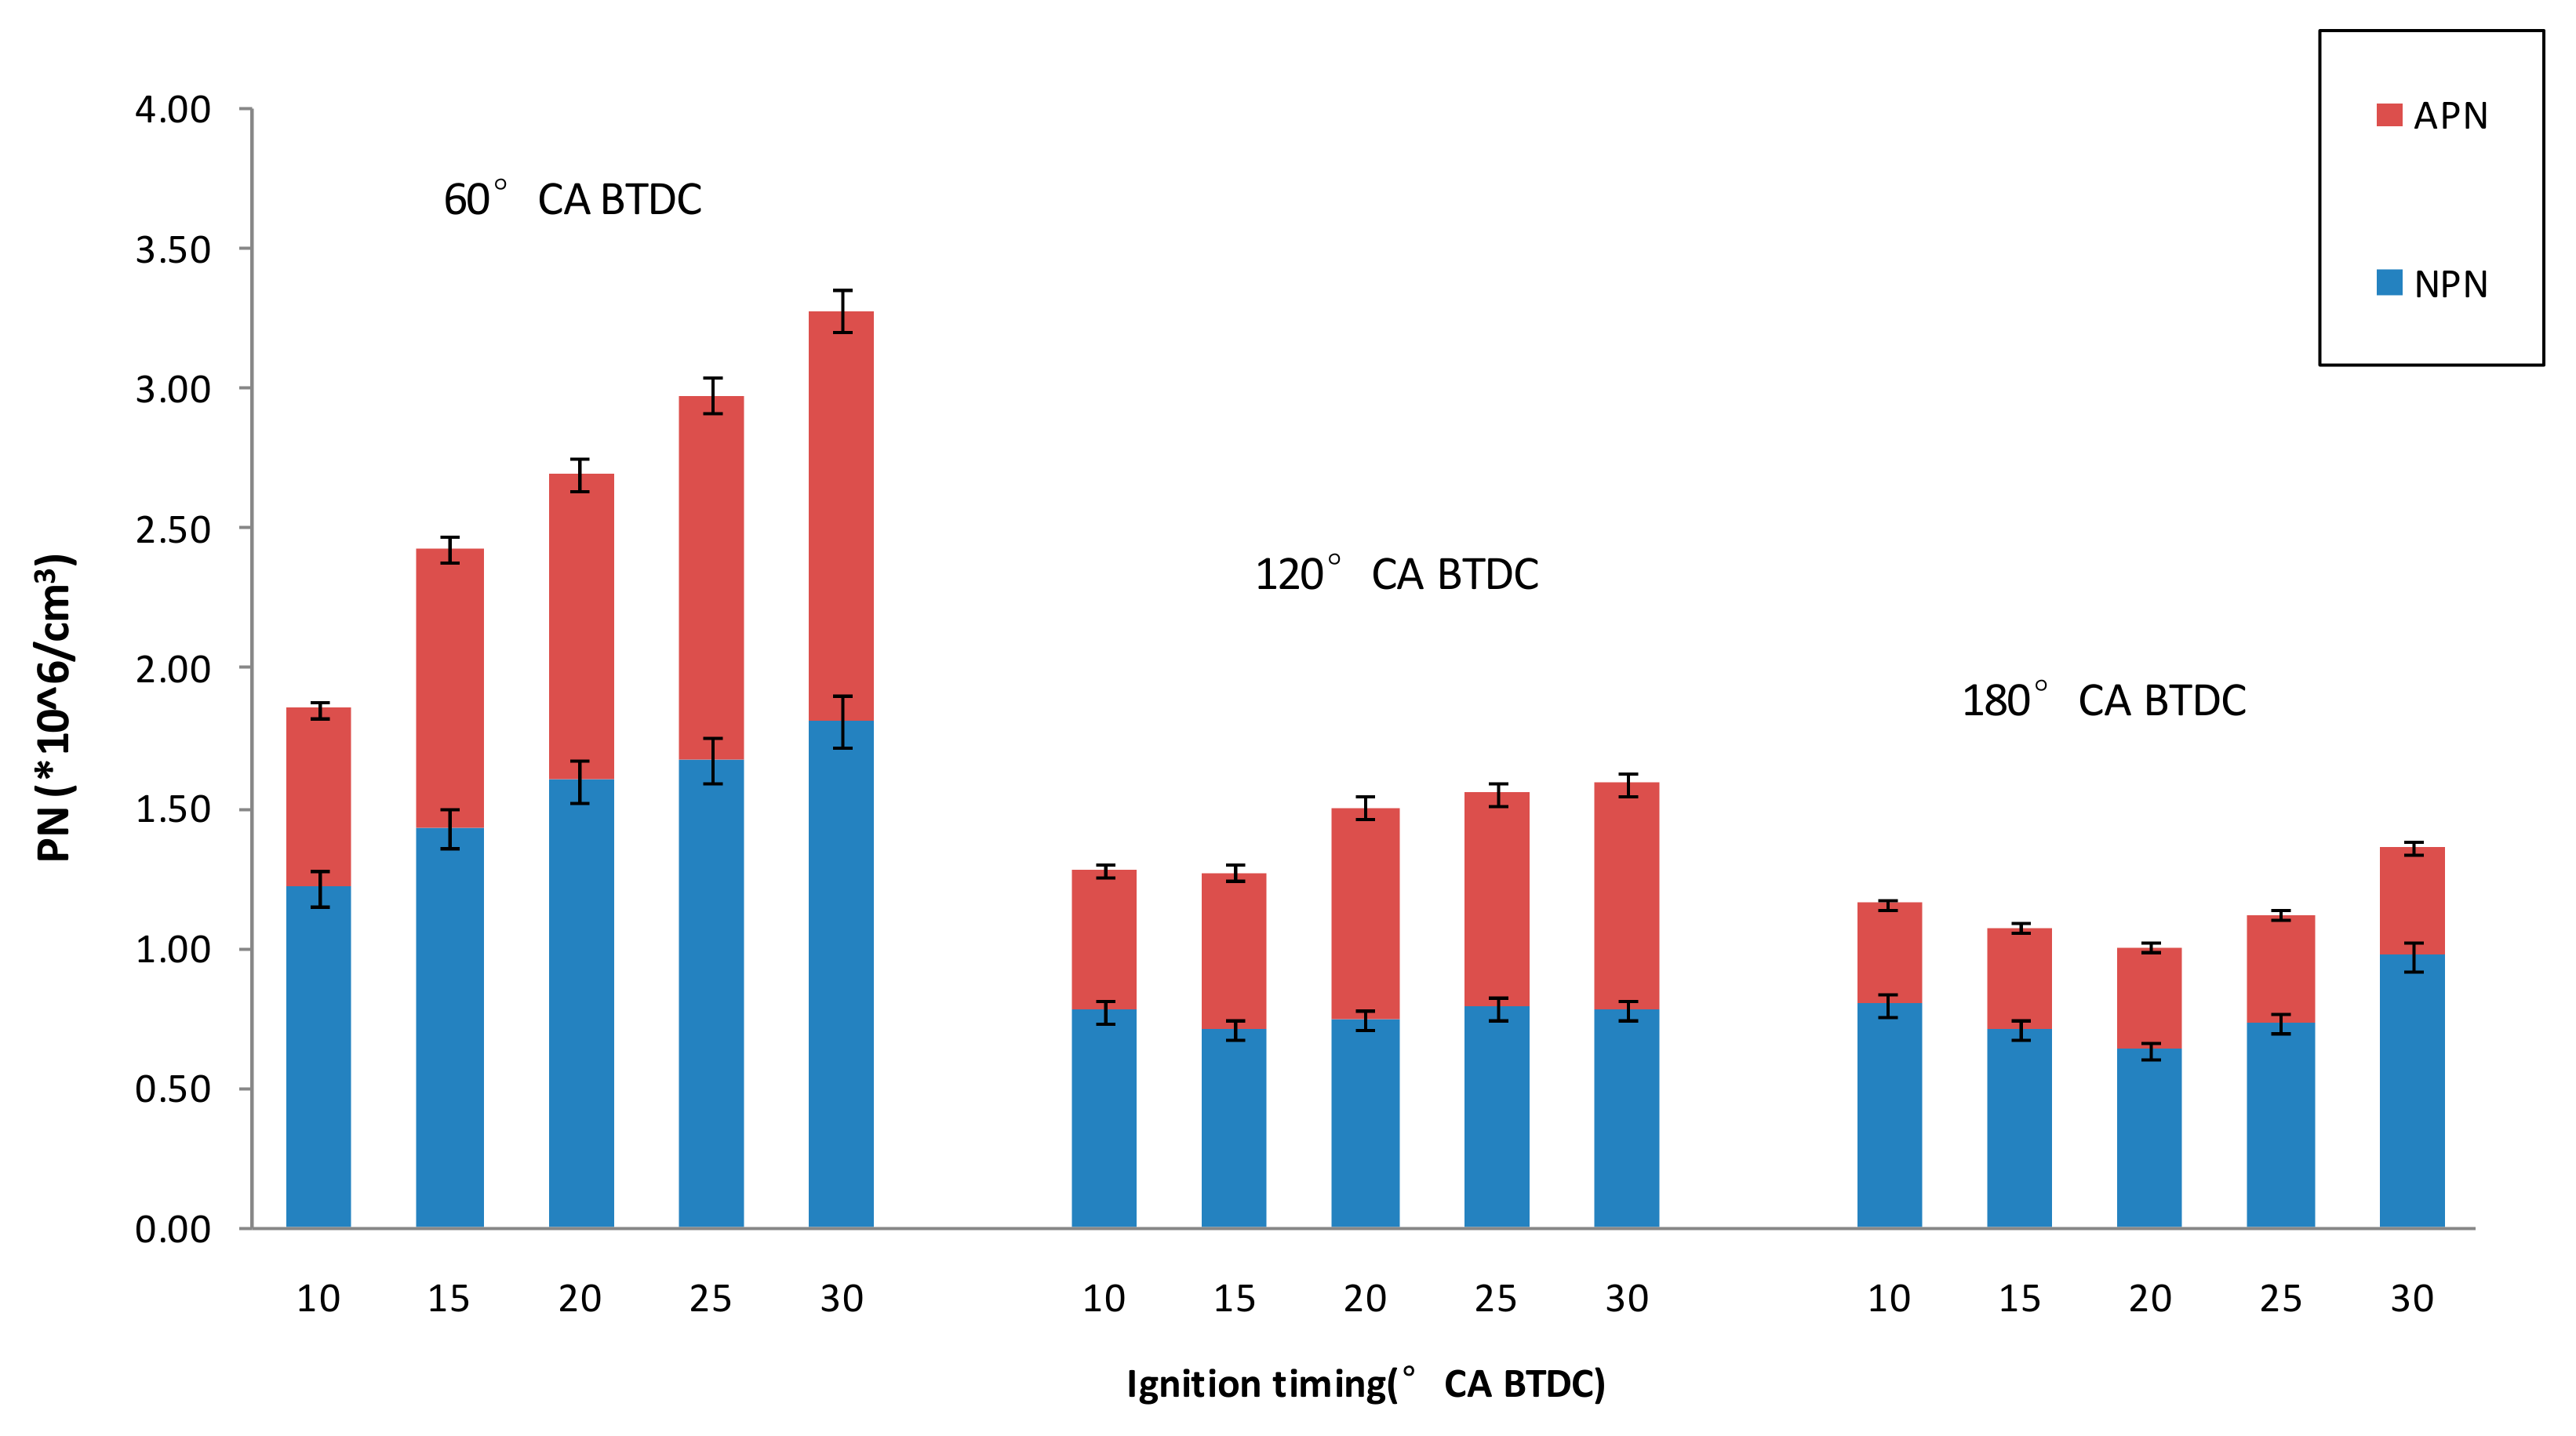
Figure 14 shows that effects of direct injection timing and ignition timing on TPN at ethanol/gasoline ratio equals to G25. It can be seen that the variation of TPN with ignition timing is not the same with different direct injection timings. When the direct injection timing is 60 °CA BTDC, the advance of ignition advance angle causes the NPN and APN to increase and the TPN increases accordingly. However, at injection timings equal to 120 and 180 °CA BTDC as the ignition timing advances, the TPN decreases first and then increases. For the direct injection timing of 60, 120, 180 °CA BTDC, the lowest TPN is obtained at 10, 15, 20 °CA BTDC, respectively. This is because the overlap period between the direct injection timing and the ignition timing is related to the mixed atomization of the fuel in the cylinder. It is necessary to delay the ignition timing at small direct injection timing and it can be relatively pre-ignited at large direct injection timing.
4. Conclusions
The ethanol have a huge impact on the particle because of its physical and chemical properties, such as its oxygen-containing properties have obvious effects on the oxidation of particulates. In this study, the effects of gasoline/ethanol on the engine-out particle emissions are explored using the injection mode of EPI+GDI. The main conclusions of the experimental results are:
- When the intake port ethanol is switched to direct injection gasoline, the maximum temperature Tmax decreases. The peak in-cylinder combustion temperature is the lowest when the only gasoline DI but the decrease extend is small. The peak cylinder pressure at G25 reaches a maximum of 3.72 MPa, which is 36% higher than the 2.73 MPa achieved with only gasoline. From G0 to G100, the crank angles at the peak cylinder pressure are 9, 9, 11, 12, 15 °CA BTDC, which means that the combustion process is shortened with the increase of ethanol and make the combustion much closer to ideal constant- volume combustion.
- The increase of Re (Ethanol ratio) can suppress the formation and emission of APN. At the G100 ratio, the increase of engine speed can reduce the APN by up to 72%. With the increase of speed, APN is not affected by speed at different fuel ratio. Particle number is the lowest at the ratio of G25 at low load. While at the high load the TPN level is lower and the influence of the speed on it is smaller when the proportion of gasoline is lower than 50%. When the energy proportion of gasoline is higher than 50%, the TPN increases sharply and when the engine speeds increase, TPN decrease significantly.
- The advance of the direct injection timing can effectively reduce the total particle number and the effects of early direct injection timing on the decrease of particles is more obvious at high engine speed, which reduced TPN by 57%.
- At low speed, retarding the ignition timing causes the particles to decrease and the trend for the particle emission at medium speed is reversed. The number of particles at high speeds is insensitive to the ignition timings. As the direct injection timing advances, the ignition timings are also need to advance in order to get minimum particle emissions.
- The combined injection engine is fully qualified for ethanol and gasoline to be injected into the cylinder to form a mixture. In addition, it also can control the ratio of the two fuels in real time to obtain a good engine performance to meet the requirements of energy saving and emission reduction. For the production of such an engine, a set of fuel injection devices is added to the intake port on the basis of the DI engine to achieve combined injection. The results of this work will provide a reference for energy saving and emission reduction.
This work is only a preliminary study of combined injection fuel and there are still many aspects that need to be explored. In future work, it is possible to focus on the effects of direct injection pressure on engine emissions and combustion performance in different combined injection modes. At the same time, the effects of mixing between alternative fuels and gasoline and alternative fuels on engine performance can also be explored.
Author Contributions
P.S. and W.D. helped conduct the experiments and analyzed the data, Z.L. analyzed the data and results and wrote this paper. S.Y. checked the paper and language, analyzed the rationality of the paper and gave important suggestions.
Funding
This work was financially supported by the National Natural Science Foundation of China (Grant No. 51276079); National Engineering Laboratory for Mobile Source Emission Control Technology (Grant No. NELMS2018A19); Foundation of State Key Laboratory of Automotive Simulation and Control of Jilin University (Grant No. 20120109).
Conflicts of Interest
The authors declare no conflict of interest.
Abbreviations
| Re | the ratio of ethanol |
| Tmax | peak temperature in-cylinder |
| HC | hydrocarbon |
| CO | carbon monoxide |
| NOx | nitrogen oxide |
| PN | particle number |
| TPN | total particle number |
| NPN | nucleation mode particle number |
| APN | accumulation particle number |
| rpm | revolutions per minute |
| λ | excess air ratio |
| BTDC | before top dead center |
| CA | crank angle |
| MBT | minimum advance for best torque |
| PFI | port fuel injection |
| GDI | gasoline direct injection |
| EPI | ethanol port injection |
| DI | Direct injection |
References
- Wurms, R.; Jung, M.; Adam, S.; Dengler, S.; Heiduk, T.; Eiser, A. Innovative technologies in current and future TFSI engines from Audi. In Proceedings of the 20th Aachen Colloquium Automobile and Engine Technology, Aachen, Germany, 12 October 2011. [Google Scholar]
- Badra, J.; AlRamadan, A.S.; Sarathy, S.M. Optimization of the octane response of gasoline/ethanol blends. Appl. Energy 2017, 203, 778–793. [Google Scholar] [CrossRef]
- Iodice, P.; Langella, G.; Amoresano, A. Ethanol in gasoline fuel blends: Effect on fuel consumption and engine out emissions of SI engines in cold operating conditions. Appl. Therm. Eng. 2018, 130, 1081–1089. [Google Scholar] [CrossRef]
- Lapuerta, M.; Armas, O.; Herreros, J.M. Emissions from a diesel-bioethanol blend in an automotive diesel engine. Fuel 2008, 87, 25–31. [Google Scholar] [CrossRef]
- Li, Q.; Liu, J.; Fu, J.; Zhou, X.; Liao, C. Comparative study on the pumping losses between continuous variable valve lift (CVVL) engine and variable valve timing (VVT) engine. Appl. Therm. Eng. 2018, 137, 710–720. [Google Scholar] [CrossRef]
- Ohsugi, A.; Toyoda, M.; Shen, T.; Xie, H. Optimal Calibration of VVT by Extremal Seeking in Combustion Engines. In 2015 54th Annual Conference of the Society of Instrument and Control Engineers of Japan; IEEE: Piscatvi, NJ, USA, 2015; pp. 1337–1340. [Google Scholar]
- Breda, S.; D’Orrico, F.; Berni, F.; d’Adamo, A.; Fontanesi, S.; Irimescu, A.; Merola, S.S. Experimental and numerical study on the adoption of split injection strategies to improve air-butanol mixture formation in a DISI optical engine. Fuel 2019, 243, 104–124. [Google Scholar] [CrossRef]
- Saraswat, M.; Chauhan, N.R. Performance Evaluation of Algae Oil-Gasoline Blends in Variable Compression Ratio Spark Ignition Engine. J. Sci. Ind. Res. 2018, 77, 723–727. [Google Scholar]
- Yu, X.; Zuo, X.; Wu, H.; Du, Y.; Sun, Y.; Wang, Y. Study on Combustion and Emission Characteristics of a Combined Injection Engine with Hydrogen Direct Injection. Energy Fuels 2017, 31, 5554–5560. [Google Scholar] [CrossRef]
- Nora, M.D.; Metzka Lanzanova, T.D.; Zhao, H. Investigation of performance and combustion characteristics of a four-valve supercharged two-stroke DI engine fuelled with gasoline and ethanol. Fuel 2018, 227, 401–411. [Google Scholar] [CrossRef]
- Khosousi, A.; Liu, F.; Dworkin, S.B.; Eaves, N.A.; Thomson, M.J.; He, X.; Dai, Y.; Gao, Y.; Liu, F.; Shuai, S.; et al. Experimental and numerical study of soot formation in laminar coflow diffusion flames of gasoline/ethanol blends. Combust. Flame 2015, 162, 3925–3933. [Google Scholar]
- Ahmed, T.M.; Bergvall, C.; Westerholm, R. Emissions of particulate associated oxygenated and native polycyclic aromatic hydrocarbons from vehicles powered by ethanol/gasoline fuel blends. Fuel 2018, 214, 381–385. [Google Scholar] [CrossRef]
- Wang, Y.; Yu, X.; Ding, Y.; Du, Y.; Chen, Z.; Zuo, X. Experimental comparative study on combustion and particle emission of n-butanol and gasoline adopting different injection approaches in a spark engine equipped with dual-injection system. Fuel 2018, 211, 837–849. [Google Scholar] [CrossRef]
- Du, Y.; Yu, X.; Wang, J.; Wu, H.; Dong, W.; Gu, J. Research on combustion and emission characteristics of a lean burn gasoline engine with hydrogen direct-injection. Hydrog. Energy 2016, 41, 3240–3248. [Google Scholar] [CrossRef]
- He, F.; Li, S.; Yu, X.; Du, Y.; Zuo, X.; Dong, W.; He, L. Comparison study and synthetic evaluation of combined injection in a spark ignition engine with hydrogen-blended at lean burn condition. Energy 2018, 157, 1053–1062. [Google Scholar] [CrossRef]
- Yu, X.; Du, Y.; Sun, P.; Liu, L.; Wu, H.; Zuo, X. Effects of hydrogen direct injection strategy on characteristics of lean-burn hydrogen–gasoline engines. Fuel 2017, 208, 602–611. [Google Scholar] [CrossRef]
- Shi, W.; Yu, X.; Zhang, H.; Li, H. Effect of spark timing on combustion and emissions of a hydrogen direct injection stratified gasoline engine. Hydrog. Energy 2017, 42, 5619–5626. [Google Scholar] [CrossRef]
- Kim, N.; Cho, S.; Choi, H.; Song, H.H.; Min, K. The Efficiency and Emission Characteristics of Dual Fuel Combustion Using Gasoline Direct Injection and Ethanol Port Injection in an SI Engine. Sae Tech. Pap. 2014, 1, 1208. [Google Scholar]
- Zhuang, Y.; Hong, G. Investigation to leveraging effect of ethanol direct injection (EDI) in a gasoline port injection (GPI) engine. Sae Tech. Pap. 2013, 2, 437–449. [Google Scholar]
- Cammarota, F.; Di Benedetto, A.; Di Sarli, V.; Salzano, E. The Effect of Hydrogen addition on the Explosion of Ethanol/Air Mixtures. Chem. Eng. Trans. 2012, 26, 405–410. [Google Scholar]
- Grabarczyk, M.; Teodorczyk, A.; Di Sarli, V.; Di Benedetto, A. Effect of initial temperature on the explosion pressure of various liquid fuels and their blends. J. Loss Prev. Process Ind. 2016, 44, 775–779. [Google Scholar] [CrossRef]
- Zhuang, H.; Hung, D.; Xu, M.; Chen, H.; Li, T.; Zhang, Y.; Men, Y. Flame Area Correlations with Heat Release at Early Flame Development of Combustion Process in a Spark-Ignition Direct-Injection Engine Using Gasoline, Ethanol and Butanol. SAE Int. 2013, 1, 2637. [Google Scholar]
- Chen, H.; Xu, M.; Zhang, G.; Zhang, M.; Zhang, Y. Investigation of Ethanol Spray from Different DI Injectors by Using Two-Dimensional Laser Induced Exciplex Fluorescence at Potential Cold-Start Condition. In Proceedings of the Asme Internal Combustion Engine Division Fall Technical Conference, Greenville, SC, USA, 9–12 October 2010; pp. 391–403. [Google Scholar]
- Huang, Y.; Hong, G. Investigation of the effect of heated ethanol fuel on combustion and emissions of an ethanol direct injection plus gasoline port injection (EDI plus GPI) engine. Energy Convers. Manag. 2016, 123, 338–347. [Google Scholar] [CrossRef]
- Huang, Y.; Hong, G.; Huang, R. Investigation to charge cooling effect and combustion characteristics of ethanol direct injection in a gasoline port injection engine. Appl. Energy 2015, 160, 244–254. [Google Scholar] [CrossRef]
- Huang, Y.; Hong, G.; Huang, R. Numerical investigation to the dual-fuel spray combustion process in an ethanol direct injection plus gasoline port injection (EDI plus GPI) engine. Energy Convers. Manag. 2015, 92, 275–286. [Google Scholar] [CrossRef]
- Huang, Y.; Hong, G.; Huang, R. Effect of injection timing on mixture formation and combustion in an ethanol direct injection plus gasoline port injection (EDI plus GPI) engine. Energy 2016, 111, 92–103. [Google Scholar] [CrossRef]
- Wang, C.; Xu, H.; Daniel, R.; Ghafourian, A.; Martin Herreros, J.; Shuai, S.; Ma, X. Combustion characteristics and emissions of 2-methylfuran compared to 2,5-dimethylfuran, gasoline and ethanol in a DISI engine. Fuel 2013, 103, 200–211. [Google Scholar] [CrossRef]
- Zhuang, Y.; Qian, Y.; Hong, G. Lean Burn Performance of a Spark Ignition Engine with an Ethanol-Gasoline Dual Injection System. Energy Fuels 2018, 32, 2855–2868. [Google Scholar] [CrossRef]
- Kim, N.; Cho, S.; Min, K. A study on the combustion and emission characteristics of an SI engine under full load conditions with ethanol port injection and gasoline direct injection. Fuel 2015, 158, 725–732. [Google Scholar] [CrossRef]
- Aleiferis Pavlos, G.; Behringer Markus, K. Flame front analysis of ethanol, butanol, iso-octane and gasoline in a spark-ignition engine using laser tomography and integral length scale measurements. Combust. Flame 2015, 162, 4533–4552. [Google Scholar] [CrossRef]
- Catapano, F.; Di Iorio, S.; Luise, L.; Sementa, P.; Vaglieco, B.M. Influence of ethanol blended and dual fueled with gasoline on soot formation and particulate matter emissions in a small displacement spark ignition engine. Fuel 2019, 245, 253–262. [Google Scholar] [CrossRef]
- Heywood, J.B. Internal Combustion Engine Fundamentals; McGraw Hill Education: New York, NY, USA, 1988. [Google Scholar]
- Hergueta, C.; Bogarra, M.; Tsolakis, A.; Essa, K.; Herreros, J.M. Butanol-gasoline blend and exhaust gas recirculation, impact on GDI engine emissions. Fuel 2017, 208, 662–672. [Google Scholar] [CrossRef]
- Yu, X.; Guo, Z.; He, L.; Dong, W.; Sun, P.; Shi, W.; Du, Y.; He, F. Effect of gasoline/n-butanol blends on gaseous and particle emissions from an SI direct injection engine. Fuel 2018, 229, 1–10. [Google Scholar] [CrossRef]
- Sun, Y.; Yu, X.; Jiang, L. Effects of direct hydrogen injection on particle number emissions from a lean burn gasoline engine. Int. J. Hydrog. Energy 2016, 41, 18631–18640. [Google Scholar] [CrossRef]
Figure 1.
Engine and instrument system.

Figure 2.
(a) Combined injection structure; (b) Particle sampling dilution system.

Figure 3.
Cylinder pressure curve at different Re. (The direct injection timing is 180 °CA BTDC (before top dead center). The ignition timing is MBT (minimum advance for best torque). The intake manifold absolute pressure is 42 kPa. The speed is 2100 r/min).
Figure 3.
Cylinder pressure curve at different Re. (The direct injection timing is 180 °CA BTDC (before top dead center). The ignition timing is MBT (minimum advance for best torque). The intake manifold absolute pressure is 42 kPa. The speed is 2100 r/min).

Figure 4.
Effective thermal efficiency with Re for different speed (The direct injection timing is 180 °CA BTDC. The ignition timing is MBT. The intake manifold absolute pressure is 42 kPa).
Figure 4.
Effective thermal efficiency with Re for different speed (The direct injection timing is 180 °CA BTDC. The ignition timing is MBT. The intake manifold absolute pressure is 42 kPa).

Figure 5.
Peak in-cylinder temperature with Re for different speed (The direct injection timing is 180 °CA BTDC. The ignition timing is MBT. The intake manifold absolute pressure is 42 kPa).
Figure 5.
Peak in-cylinder temperature with Re for different speed (The direct injection timing is 180 °CA BTDC. The ignition timing is MBT. The intake manifold absolute pressure is 42 kPa).

Figure 6.
Hydrocarbon emissions with Re for different speed (The direct injection timing is 180 °CA BTDC. The ignition timing is MBT. The intake manifold absolute pressure is 42 kPa.
Figure 6.
Hydrocarbon emissions with Re for different speed (The direct injection timing is 180 °CA BTDC. The ignition timing is MBT. The intake manifold absolute pressure is 42 kPa.

Figure 7.
Accumulation mode particle number with Re for different speed (The direct injection timing is 180 °CA BTDC. The ignition timing is MBT. The intake manifold absolute pressure is 42 kPa).
Figure 7.
Accumulation mode particle number with Re for different speed (The direct injection timing is 180 °CA BTDC. The ignition timing is MBT. The intake manifold absolute pressure is 42 kPa).

Figure 8.
Nucleation mode particle number with Re for different speed. (The direct injection timing is 180 °CA BTDC. The ignition timing is MBT. The intake manifold absolute pressure is 42 kPa).
Figure 8.
Nucleation mode particle number with Re for different speed. (The direct injection timing is 180 °CA BTDC. The ignition timing is MBT. The intake manifold absolute pressure is 42 kPa).

Figure 9.
Total particle number with Re for different speed (The direct injection timing is 180 °CA BTDC. The ignition timing is MBT. The intake manifold absolute pressure is 42 kPa).
Figure 9.
Total particle number with Re for different speed (The direct injection timing is 180 °CA BTDC. The ignition timing is MBT. The intake manifold absolute pressure is 42 kPa).

Figure 10.
Particle size distribution with Re for different speed (The direct injection timing is 180 °CA BTDC. The ignition timing is MBT. The intake manifold absolute pressure is 42 kPa): (a) 1500 r/min particle size distribution; (b) 1800 r/min particle size distribution; (c) 2100 r/min particle size distribution.

Figure 11.
Particle number with Re for different speed (The direct injection timing is 180 °CA BTDC. The ignition timing is MBT. The intake manifold absolute pressure is 56 kPa).
Figure 11.
Particle number with Re for different speed (The direct injection timing is 180 °CA BTDC. The ignition timing is MBT. The intake manifold absolute pressure is 56 kPa).

Figure 12.
Particle number with direct injection timing for different speed (The ignition timing is MBT at G25 and the intake manifold absolute pressure is 42 kPa).
Figure 12.
Particle number with direct injection timing for different speed (The ignition timing is MBT at G25 and the intake manifold absolute pressure is 42 kPa).

Figure 13.
Particle number with ignition timing for different speeds (The direct injection timing is 180 °CA BTDC at G25 and the intake manifold absolute pressure is 42 kPa).
Figure 13.
Particle number with ignition timing for different speeds (The direct injection timing is 180 °CA BTDC at G25 and the intake manifold absolute pressure is 42 kPa).

Figure 14.
Particle number with ignition timing for different direct injection timing (At G25 and 2100 r/min and the intake manifold absolute pressure is 42 kPa).
Figure 14.
Particle number with ignition timing for different direct injection timing (At G25 and 2100 r/min and the intake manifold absolute pressure is 42 kPa).


Table 1.
Main technical parameters of the engine.
| Type | Four Cylinder, Water Cooled, Combined Injection |
|---|---|
| Displacement | 1984 (mL) |
| Stroke | 92.8 (mm) |
| Bore | 82.5 (mm) |
| Compression ratio | 9.6:1 |
| valve number/cylinder | 4 |
| Ignition sequence | 1-3-4-2 |
| Maximum power | 132 (kW) (4000–6000 r/min) |
| Maximum torque | 320 (N·m) (1500–3800 r/min) |
Table 2.
Technical parameter of the experimental instrument.
| Parameters | Precision | Manufacturer | Type Name |
|---|---|---|---|
| Speed | ≤±1 r/min | Luoyang Nanfeng Electromechanic Equipment Manufacturing Co., Ltd. | CW160 |
| Torque | ≤±0.4 N·m | Luoyang Nanfeng Electromechanic Equipment Manufacturing Co., Ltd. | CW160 |
| Excess air coefficient | ≤±1.5% | ETAS Engineering TOOLS | Lambda LA4 |
| Particle number | ≤±1.4 × 10⁴ dN/dlogDp/cm3 | Cambustion Ltd. | DMS500 |
| HC | ≤±1 ppm | AVL | DICOM 4000 |
| fuel mass flow rate | ≤±0.01 g/s | ONO SOKKI (Onokazu detector) | DF-2420 |
| Cylinder pressure | ≤±0.5% | AVL | IndiSetIndiComV2.0 |
| Crank angle position | ≤±0.01°CA | KISTLER | KISTLER2614CK |
Table 3.
Fuel properties.
| Properties | Gasoline | Ethanol |
|---|---|---|
| Low heat value (MJ/kg) [30] | 43.5 | 26.9 |
| Latent heat of vaporization (kJ/kg)(@25 °C) [31] | 380–500 | 874 |
| Reid vapor pressure (kPa)(@37.8 °C) [31] | 72.4 | 16.1 |
| RON [26] | 95.7 | 106 |
| Theoretical air-fuel ratio [26] | 14.8:1 | 9:1 |
| Oxygen atom content (mass%) [32] | ≤2.7 | 34.78 |
| Laminar flame velocity (m/s) @(stoichiometric equivalence ratio, 100kPa, 100 °C) [24] | 0.49 | 0.62 |
| Density (g/cm3) [18,32] | 743.5 | 0.789 (@20 °C) |
Table 4.
Fuel naming rules.
| Fuel Name | G0 | G25 | G50 | G75 | G100 |
|---|---|---|---|---|---|
| Gasoline energy ratio in mixed fuel | 0% | 25% | 50% | 75% | 100% |
| Air ratio required for ethanol (Re) | 100% | 75% | 50% | 25% | 0% |
Table 5.
Experimental conditions.
| Parameters | Value |
|---|---|
| λ | 1 |
| Speed (r/min) | 1500, 1800, 2100 |
| Intake manifold absolute pressure (kPa) | 42, 56 |
| Ethanol/Gasoline ratio | G0, G25, G50, G75, G100 |
| Direct injection timing (°CA BTDC) | 60, 120, 180 |
| Ignition timing (°CA BTDC) | 5, 10, 15, 20, 25 (@ 1500 and 1800 r/min) |
| Ignition timing (°CA BTDC) | 10, 15, 20, 25, 30 (@ 2100 r/min) |
| Intake injection timing (°CA BTDC) | 300 |
| Direct injection pressure (MPa) | 5 |
Table 6.
Total fuel heat value at λ = 1.
| Fuel Definitions | G0 | G25 | G50 | G75 | G100 |
|---|---|---|---|---|---|
| Total low heat value (kJ) | 918.2 | 912.2 | 910.1 | 908.8 | 907.3 |
| Change ratio (%) | 0 | −0.65 | −0.87 | −0.92 | −1.2 |
| Ethanol mass (g) | 34.3 | 25.72 | 17.25 | 8.57 | 0 |
| Gasoline mass (g) | 0 | 5.2 | 10.4 | 15.64 | 20.86 |
| Total mass (g) | 34.3 | 30.9 | 27.6 | 24.2 | 20.86 |
© 2019 by the authors. Licensee MDPI, Basel, Switzerland. This article is an open access article distributed under the terms and conditions of the Creative Commons Attribution (CC BY) license (http://creativecommons.org/licenses/by/4.0/).
Share and Cite
MDPI and ACS Style
Sun, P.; Liu, Z.; Dong, W.; Yang, S. Comparative Study on the Effects of Ethanol Proportion on the Particle Numbers Emissions in a Combined Injection Engine. Energies 2019, 12, 1788. https://0-doi-org.brum.beds.ac.uk/10.3390/en12091788
AMA Style
Sun P, Liu Z, Dong W, Yang S. Comparative Study on the Effects of Ethanol Proportion on the Particle Numbers Emissions in a Combined Injection Engine. Energies. 2019; 12(9):1788. https://0-doi-org.brum.beds.ac.uk/10.3390/en12091788
Chicago/Turabian StyleSun, Ping, Ze Liu, Wei Dong, and Song Yang. 2019. "Comparative Study on the Effects of Ethanol Proportion on the Particle Numbers Emissions in a Combined Injection Engine" Energies 12, no. 9: 1788. https://0-doi-org.brum.beds.ac.uk/10.3390/en12091788
Note that from the first issue of 2016, this journal uses article numbers instead of page numbers. See further details here.