Wind Turbine Control Using Nonlinear Economic Model Predictive Control over All Operating Regions


1
The State Key Laboratory of Alternate Electrical Power System with Renewable Energy Sources, North China Electric Power University, Beijing 102206, China
2
Electrical Power and Machines Engineering Department, Faculty of Engineering, Cairo University, Giza 12613, Egypt
*
Author to whom correspondence should be addressed.
Energies 2020, 13(1), 184; https://0-doi-org.brum.beds.ac.uk/10.3390/en13010184
Submission received: 13 November 2019
/
Revised: 27 December 2019
/
Accepted: 27 December 2019
/
Published: 1 January 2020
(This article belongs to the Special Issue Wind Turbine Power Optimization Technology)
Abstract
:With the gradual increase in the installed capacity of wind turbines, more and more attention has been paid to the economy of wind power. Economic model-predictive control (EMPC) has been developed as an effective advanced control strategy, which can improve the dynamic economy performance of the system. However, the variable-speed wind turbine (VSWT) system widely used is generally nonlinear and highly coupled nonaffine systems, containing multiple economic terms. Therefore, a nonlinear EMPC strategy considering power maximization and mechanical load minimization is proposed based on the comprehensive VSWT model, including the dynamics of the tower and the gearbox in this paper. Three groups of simulations verify the effectiveness and reliability/practicability of the proposed nonlinear EMPC strategy.
1. Introduction
As a consequence of energy shortages around the world, environmental protection requirements, and the higher cost of traditional power, renewable energy sources are receiving a great deal of attention worldwide nowadays. Wind energy becomes the dominant renewable energy source due to its plentifulness, cleanness, and economic advantages. By the ending of 2018, the cumulative installed capacity of wind is estimated to be more than 221 GW in China, with an increase of 19 GW and 25.9 GW in 2017 and 2018 respectively, accounting for 31.9% and 32.8% of global overall wind power capacity [1]. Therefore, enhancing the efficiency and economy of wind energy conversion systems has become an important issue to handle the growing need for energy.
Numerous control schemes have been applied in variable-speed wind turbine (VSWT) controller designs to enhance efficiency. Generally, PID controllers are widely used in the pitch control of wind turbine systems, which only focuses on decreasing the blades’ mechanical loads within region three, as shown in Figure 1 [2]. A feedback gain-scheduled PI controller was designed to maximize the captured power and mitigate the mechanical loads, where the fixed-phase and gain-margins are obtained through a frequency response analysis [3]. In [4], a gain-scheduled L1 adaptive optimal controller is proposed for the VSWT control system, where the nonconvex optimization problem is solved by using a genetic algorithm based on a single linearized model of the wind-turbine (WT) system at different operating points. To obtain the rated generator power and reduce the mechanical load, a nonlinear-PI controller with an extended state-observer was developed in order to control the blade pitch angle [5]. Although these PI controllers have led to the effective steady-state performance of VSWTs, the distortion of the transient performance according to variations in the wind speed is still a drawback. Additionally, PI/PID controllers offer good performance, but they still are not optimal [6].
However, owing to multiple constraints, multiple variables, the highly coupled nonaffine basis of the VSWT systems, and the stochastic shape of wind speed input, high-performance wind turbine control (WTC) has become a challenging problem [7]. Various nonlinear control schemes have been applied to the WTC problem. In [8], an artificial neural network technique is proposed for the pitch control in region three, where the VSWT dynamics are modeled using a back-propagation learning algorithm. In [9], a fuzzy logic pitch controller is proposed for WTC, considering the generator power and speed as control inputs. In [10], a multiple feedback pitch controller is proposed for the nacelle fore-aft speed and generator power regulation. This controller is designed by employing a trade-off between pitch angle fluctuations and output power fluctuations. In [11], an adaptive neural pitch controller is proposed for the WTC problem. An online, two-layer neural network model is proposed for estimating the unknown wind turbine aerodynamics. Recently in [12], a T-S fuzzy modeling method with nonlinear consequents is proposed for the VSWT control problem. However, the wind turbine actuator constraints are not considered in the controller designs presented in these approaches, which may cause a wind-up phenomenon and significant performance deterioration if the actuator inputs reach saturation limits.
Among all the control strategies, model predictive control (MPC) is emerging as a powerful candidate for WTC thanks to its capacity to handle all the system constraints directly, such as physical limitations and operational constraints [13]. Classical MPC schemes have been used for WTC to ensure that the maximum power is captured in region two, and the rated power is tracked in region three. In [14,15], a linear MPC strategy is proposed based on a single linear state-space model to deal with the actuator constraints. Although these approaches have good performance concerning certain operating points and system constraints handling, no special attention has been paid to either the strong nonlinearity of the system or the mechanical load mitigation to enhance the economy of the VSWT system.
Some MPC techniques have been utilized by taking the wind turbine nonlinearity into account. In [16,17,18], a multivariable MPC is proposed for VSWT pitch control in region three, using Takagi-Sugeno (T-S) fuzzy models. In [19], a nonlinear MPC (NMPC) strategy is investigated for VSWT control for both regions two and three by tuning the penalty parameters. In [20,21], multiple model predictive controllers are proposed based on multiple linearized time-invariant state-space models, guaranteeing the actuator limits in all operation regions. However, it is obvious that the controller switching results in more difficulties. The authors take the load of WT into account as one of completing penalties based on a simplified nonlinear WT model. The shortcoming of these control schemes is the difficulty of adequately tuning the tracking weights; furthermore, economic factors are not considered in the design of the controller.
To enhance the dynamic economy, the economic MPC (EMPC) was developed for the VSWT system. Generally, the EMPC uses a measure of the system performance directly as an economic cost function [22]. However, the economic cost function may not be a positive definite with regard to any tracking trajectory in order to guarantee the stability of the operating points. In [23], the closed-loop stability of the system is guaranteed via terminal constraints depending on the strong duality assumption. In addition, in [24], a Lyapunov-based EMPC is constituted using two separate operation modes to make the closed-loop system ultimately bounded within a small region. In the context of the WTC problem, the EMPC objective function directly considers VSWT energy generation maximization against the actuator fatigue minimization, as opposed to tracking some reference states and inputs. The proposed NEMPC in this paper has a unique weight in the objective function, while the weights must be chosen carefully for every input and state in the classical NMPC strategy [19]. In addition, in [25,26], an EMPC strategy has been designed for wind turbine control systems for all regions. In [26], the wind speed is produced based on the Van der Hoven spectrum [27], in which the wind speed is considered as a slowly-changing average wind speed superposed by a rapidly-changing turbulence wind speed. However, these EMPC approaches pay no special attention to the mitigation of mechanical loads on the tower in the economic objective function. Additionally, different treatment of the random wind speed can be considered, consisting of summing the mean wind speed, which follows a two-parameter Weibull distribution, and the turbulent wind speed, which follows a zero-mean Gaussian, white noise distribution [28].
In this study, a nonlinear EMPC (NEMPC) strategy is proposed for all the operating regions of the VSWT system. A nonlinear VSWT model, which considers the tower and gearbox dynamics, is established. The NEMPC optimization problem considers all the actuator constraints (pitch angle, and torque constraints with their rate of change constraints) and the hard constraints (rotor speed, generator speed, and electrical power). The economic cost function seeks the maximum VSWT generated power against the competing penalties regardless of wind input, in order to achieve the best economic operation, as well as the fatigue load mitigation of key mechanical structures, including both drive-shaft torsion and tower fore-aft motion. This control strategy can provide potential improvements in the closed-loop performance, and satisfy the economy in contrast with classical WTC strategies. Finally, in the simulations, random wind speed is considered by summing the mean wind speed and the turbulent wind speed, which follow a two-parameter Weibull distribution and a zero-mean Gaussian white noise distribution, respectively.
The paper is organized as follows. The nonlinear modeling of the VSWT system is established in Section 2. The proposed NEMPC strategy is derived in Section 3. In Section 4, the simulation results for a 5-MW VSWT system are demonstrated, with comparisons between the classical NMPC strategy and the proposed NEMPC strategy. Also, in this section, a typical wind turbine benchmark simulator FAST is used to test the validity and practicability of the proposed NEMPC strategy. Lastly, Section 5 provides conclusions.
2. Wind Turbine Modeling
Wind-energy conversion systems consist of a windmill, a gearbox, and a generator, as demonstrated in Figure 2. In this section, nonlinear VSWT modeling is investigated. To establish this nonlinear model, the aerodynamics, tower, drive train, and the generator should be considered. In the following subsections, these subsystems are discussed separately. Finally, a nonlinear state-space model is established.
2.1. Rotor Aerodynamics
The airflow on VSWT blades causes aerodynamic torque, which represents one of the causes of VSWT nonlinearities. The aerodynamic torque can be stated as below [29]:
The aerodynamic power that the VSWT extracts is expressed by [29]:
where is the air density, represents the effective wind speed on the turbine rotor [30], is the rotor radius of VSWT, is the VSWT rotor angular speed, is the aerodynamic power coefficient, and is the blade pitch angle. The tip speed ratio is defined as [30]:
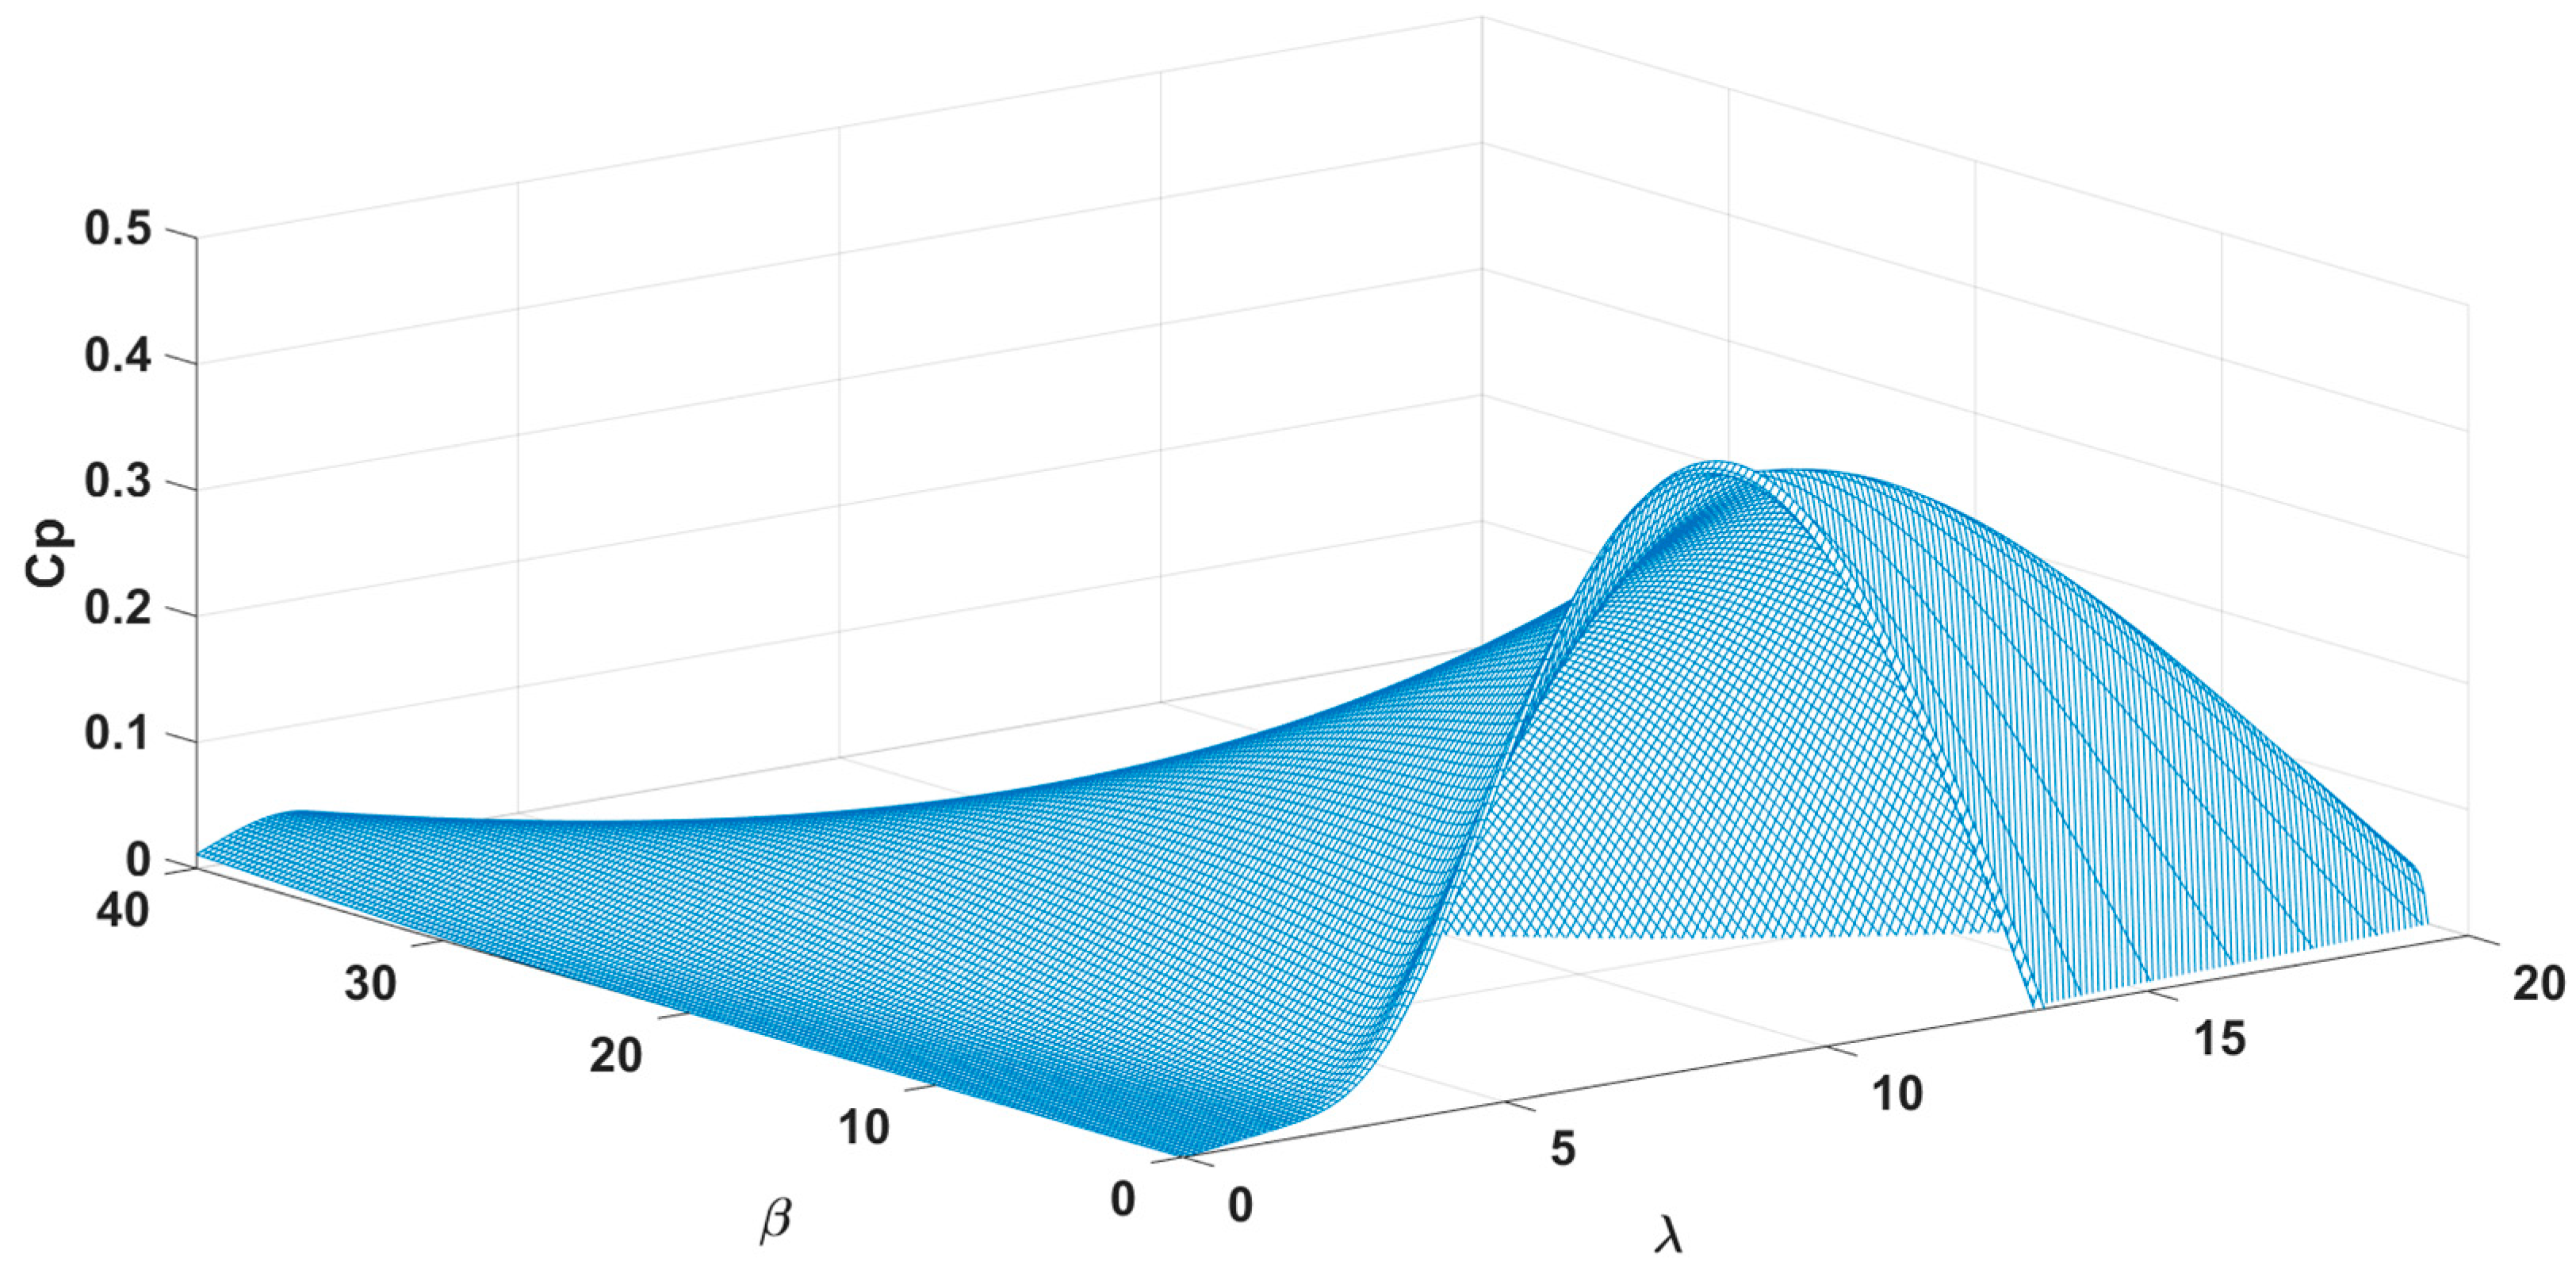
The following approximate expression of the aerodynamic power coefficient derived from [18] is widely used:
where , and the coefficients depend on the blade shape and its aerodynamic performance [18,29]. In this paper, NREL 5-MW VSWT system is discussed; the six chosen coefficient values are [18]: = 0.5176, = 116, = 0.4, = 5, = 21, = 0.0068. This nonlinear function is indicated in Figure 3.
2.2. Tower Dynamics
The blade vibration results in the tower deflection. Thus, the thrust force on a tower top over the nacelle, which causes undesired nodding for the tower and fatigue loads on the VSWT, must be considered [31]:
where is the thrust coefficient, which is the nonlinear function in terms of blade pitch angle and tip speed ratio . By adopting a polynomial fitting algorithm based on the data-driven from a typical wind turbine benchmark simulator, the thrust coefficient can be derived as:
where represents a nonlinear function, as indicated in Figure 4.
Thrust force towards the tower top over the nacelle causes tower fore-aft motion. The dynamics of tower fore-aft motion can be stated as a simplified second-order differential equation:
where represents the mass model, and are the structural damping and structural stiffness coefficients of the tower model respectively, represents the tower top displacement, and is the tower deflection rate.
Tower fore-aft motion causes a nonnegligible effect on effective wind speed. The tower deflection rate is defined as . Thus, the effective (relative) wind speed on the turbine rotor can be expressed with the normal wind speed and the tower deflection as follows [30]:
The above formula shows that the actual wind speed acting on the blade is a relative wind speed, which is the difference between the natural wind speed and the displacement speed of the tower . It can be imagined that when the tower moves forward and backward in the horizontal direction with the wind speed, the wind speed acting on the blade is not exactly equal to the wind speed directly given by the natural environment. This formula makes the wind speed acting on the blade more accurate.
In Figure 2, represents the nature wind speed towards the blade, which cannot be replaced by the relative (effective) wind speed because the relative (effective) wind speed is just a virtual physical variable which is defined for the aerodynamic torque and power, not a real physical variable. Therefore, the relative (effective) wind speed cannot appear before the blade, replacing wind speed in Figure 2.
2.3. Drive Train
The wind mechanical energy is transformed through a drive train to the electrical generator. The drive train is rigidly coupled in the rotor side with a flexible connection in the generator side, as demonstrated in Figure 2. The shaft torsion represents the torque of the drive train flexible shaft, which is a vital factor affecting economic performance. Oscillations in the shaft torsion cause damage to the turbine components. The shaft torsion is replaced by the absolute angular position of the generator and rotor; its derivative is [17]:
where is the shaft torsional angle, is the generator angular speed, and is the gearbox ratio.
Assuming that the low-speed shaft is one spring and one damper, the two-mass model is used to describe the drive train from a low- to a high-speed shaft through a gearbox as follows [17,26]:
where is the inertia of the VSWT rotor and the low-speed shaft, is the inertia of the generator, and represent the stiffness and damping of the drive train, is the generator torque.
2.4. Generator
2.5. The Nonlinear State-Space Model of VSWT
Based on Equations (1)–(12), the nonlinear dynamics of the VSWT system can be transformed into the following nonlinear state-space form:
where , .
Define the state variables, input variables, and output variables as: . Then, the discrete wind turbine system model (13) can be obtained by forth stage Runge–Kutta (RK4) method with the sampling time ,
where , , , , .
3. NEMPC Strategy for VSWT Control
EMPC for WTC seeks the optimal operation between the maximization of the generated power and the minimization of the cost related to care and maintenance. In a real wind farm, the oscillatory transient of tower deflection and shaft torsion can create microcracks in the materials, which can lead to component failure and increase maintenance costs. Therefore, not only generated power, pitch-angle and generator-torque, but also shaft torsion angle and tower displacement are considered in the economic cost function for the reduction of fatigue loads in this paper.
3.1. Economic Cost Function
In this paper, economic indexes are defined as follows. Firstly, the generator power must be considered in the economic index to capture the maximum power [19]:
Secondly, the shaft torsional angle and tower displacement must be considered in the economic index to reduce the fatigue of the tower structure caused by the tower deflection [19] and the gearbox load caused by the drive-shaft torsion [26]:
Finally, the pitch-angle and generator-torque must be considered in the economic indexes and , respectively, to smoothen the control performance and reduce the fluctuations of the output electric power [19]:
where , , , , , and are weighted coefficients.
In designing the NEMPC for the VSWT system, the economic cost function can be obtained as:
which aims to decrease the load and fatigue on the wind power system and smooth the generator torque input and the output power while capturing the maximal power.
3.2. The Operational and Physical Constraints
Due to the electrical limitations of the actuator electronics and the safety requirements of the control process, a set of physical constraints must be fulfilled during operation in VSWT. Thus, the following set of constraints must be taken into consideration along the predictive/control horizon:
where the maximum rotor speed , generator speed , and torque are set slightly higher than their rated values , , and . The definition and values of related parameters are listed in Table A2 in Appendix A [19,32].
3.3. The Optimization Problem for the Proposed NEMPC Strategy
Based on the above nonlinear model and cost function in Section 3.1 and Section 3.2, the optimization problem for the proposed NEMPC strategy can be summed up as follows:
Define , , , , where is the predictive/control horizon.
Define as the new optimal variables set. Then, the optimization problem (24) can be rewritten as:
where , , .
The optimization problem (25) can be solved by using the interior point method, which is realized by using IPOT solver in MATLAB [33]. Then, the optimal solution of the control inputs (pitch angle and the generator torque) at the current time can be extracted and implemented.
4. Simulations Results
Three simulations are performed based on a typical 5-MW NREL VSWT system to validate the proposed NEMPC strategy. The corresponding parameters of the 5-MW NREL VSWT system are listed in Table A1 in the Appendix A [32]. The corresponding constraints are shown in Table A2 [19,32]. In the simulations, the weights in the cost function (15)–(18) contain: . The maximum generator speed, rotor speed, and generator torque are all arbitrarily set at 5% above their rated values, i.e.,, , . For the purpose of simplicity, the maximum electric power is chosen as .
For comparison purposes, the classical NMPC strategy based on [19] is also constituted, which has the same model (13) and constraints (20)–(23) as the proposed NEMPC strategy in this paper. However, the tracking objective function (not economic cost function) is used in the classical NMPC, which can be described as:
where , for the wind speed region II, , for wind speed region III, is the pitch angle reference and is the rotor speed reference, which can be derived as:
and in Equation (27) are the optimal pitch angle and tip ratio in wind speed region II as demonstrated in Figure 1, can be derived via maximizing the power coefficient :
Then, the optimal rotor speed can be obtained:
in Equation (27) can be solved from: .
The predictive/control horizon is set as for both classical NMPC and the proposed NEMPC in the following three groups of simulations.
4.1. Gradient Normal Wind
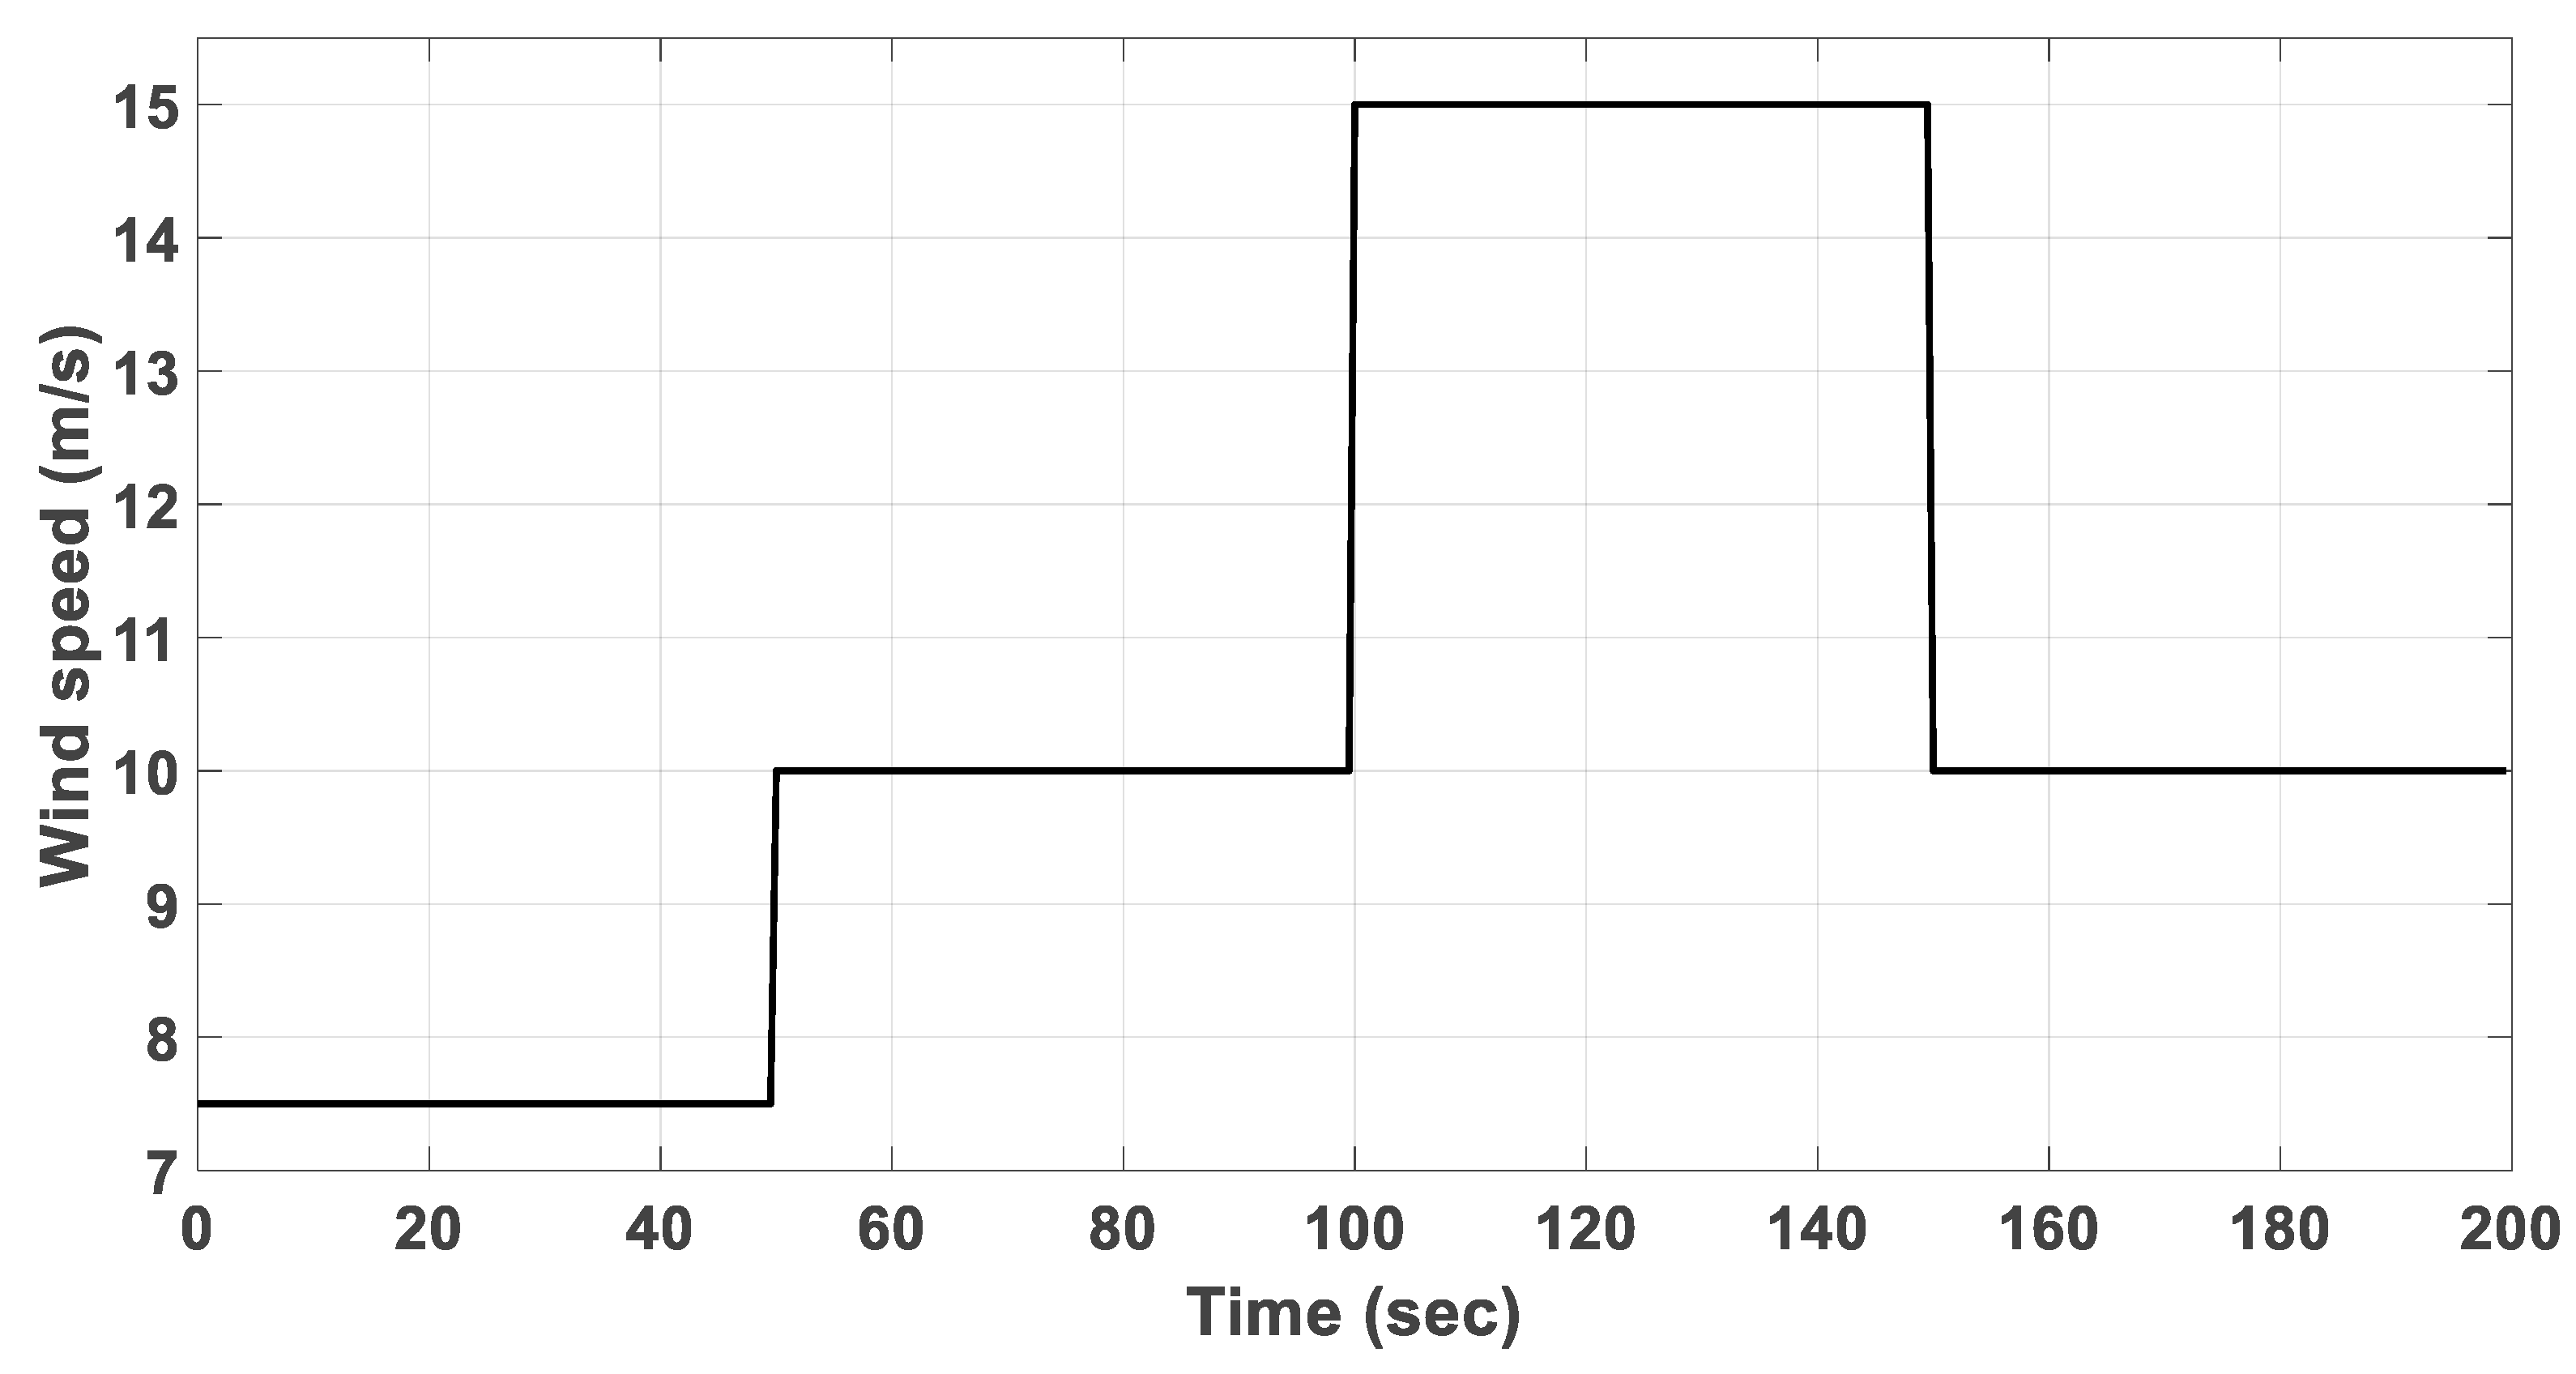
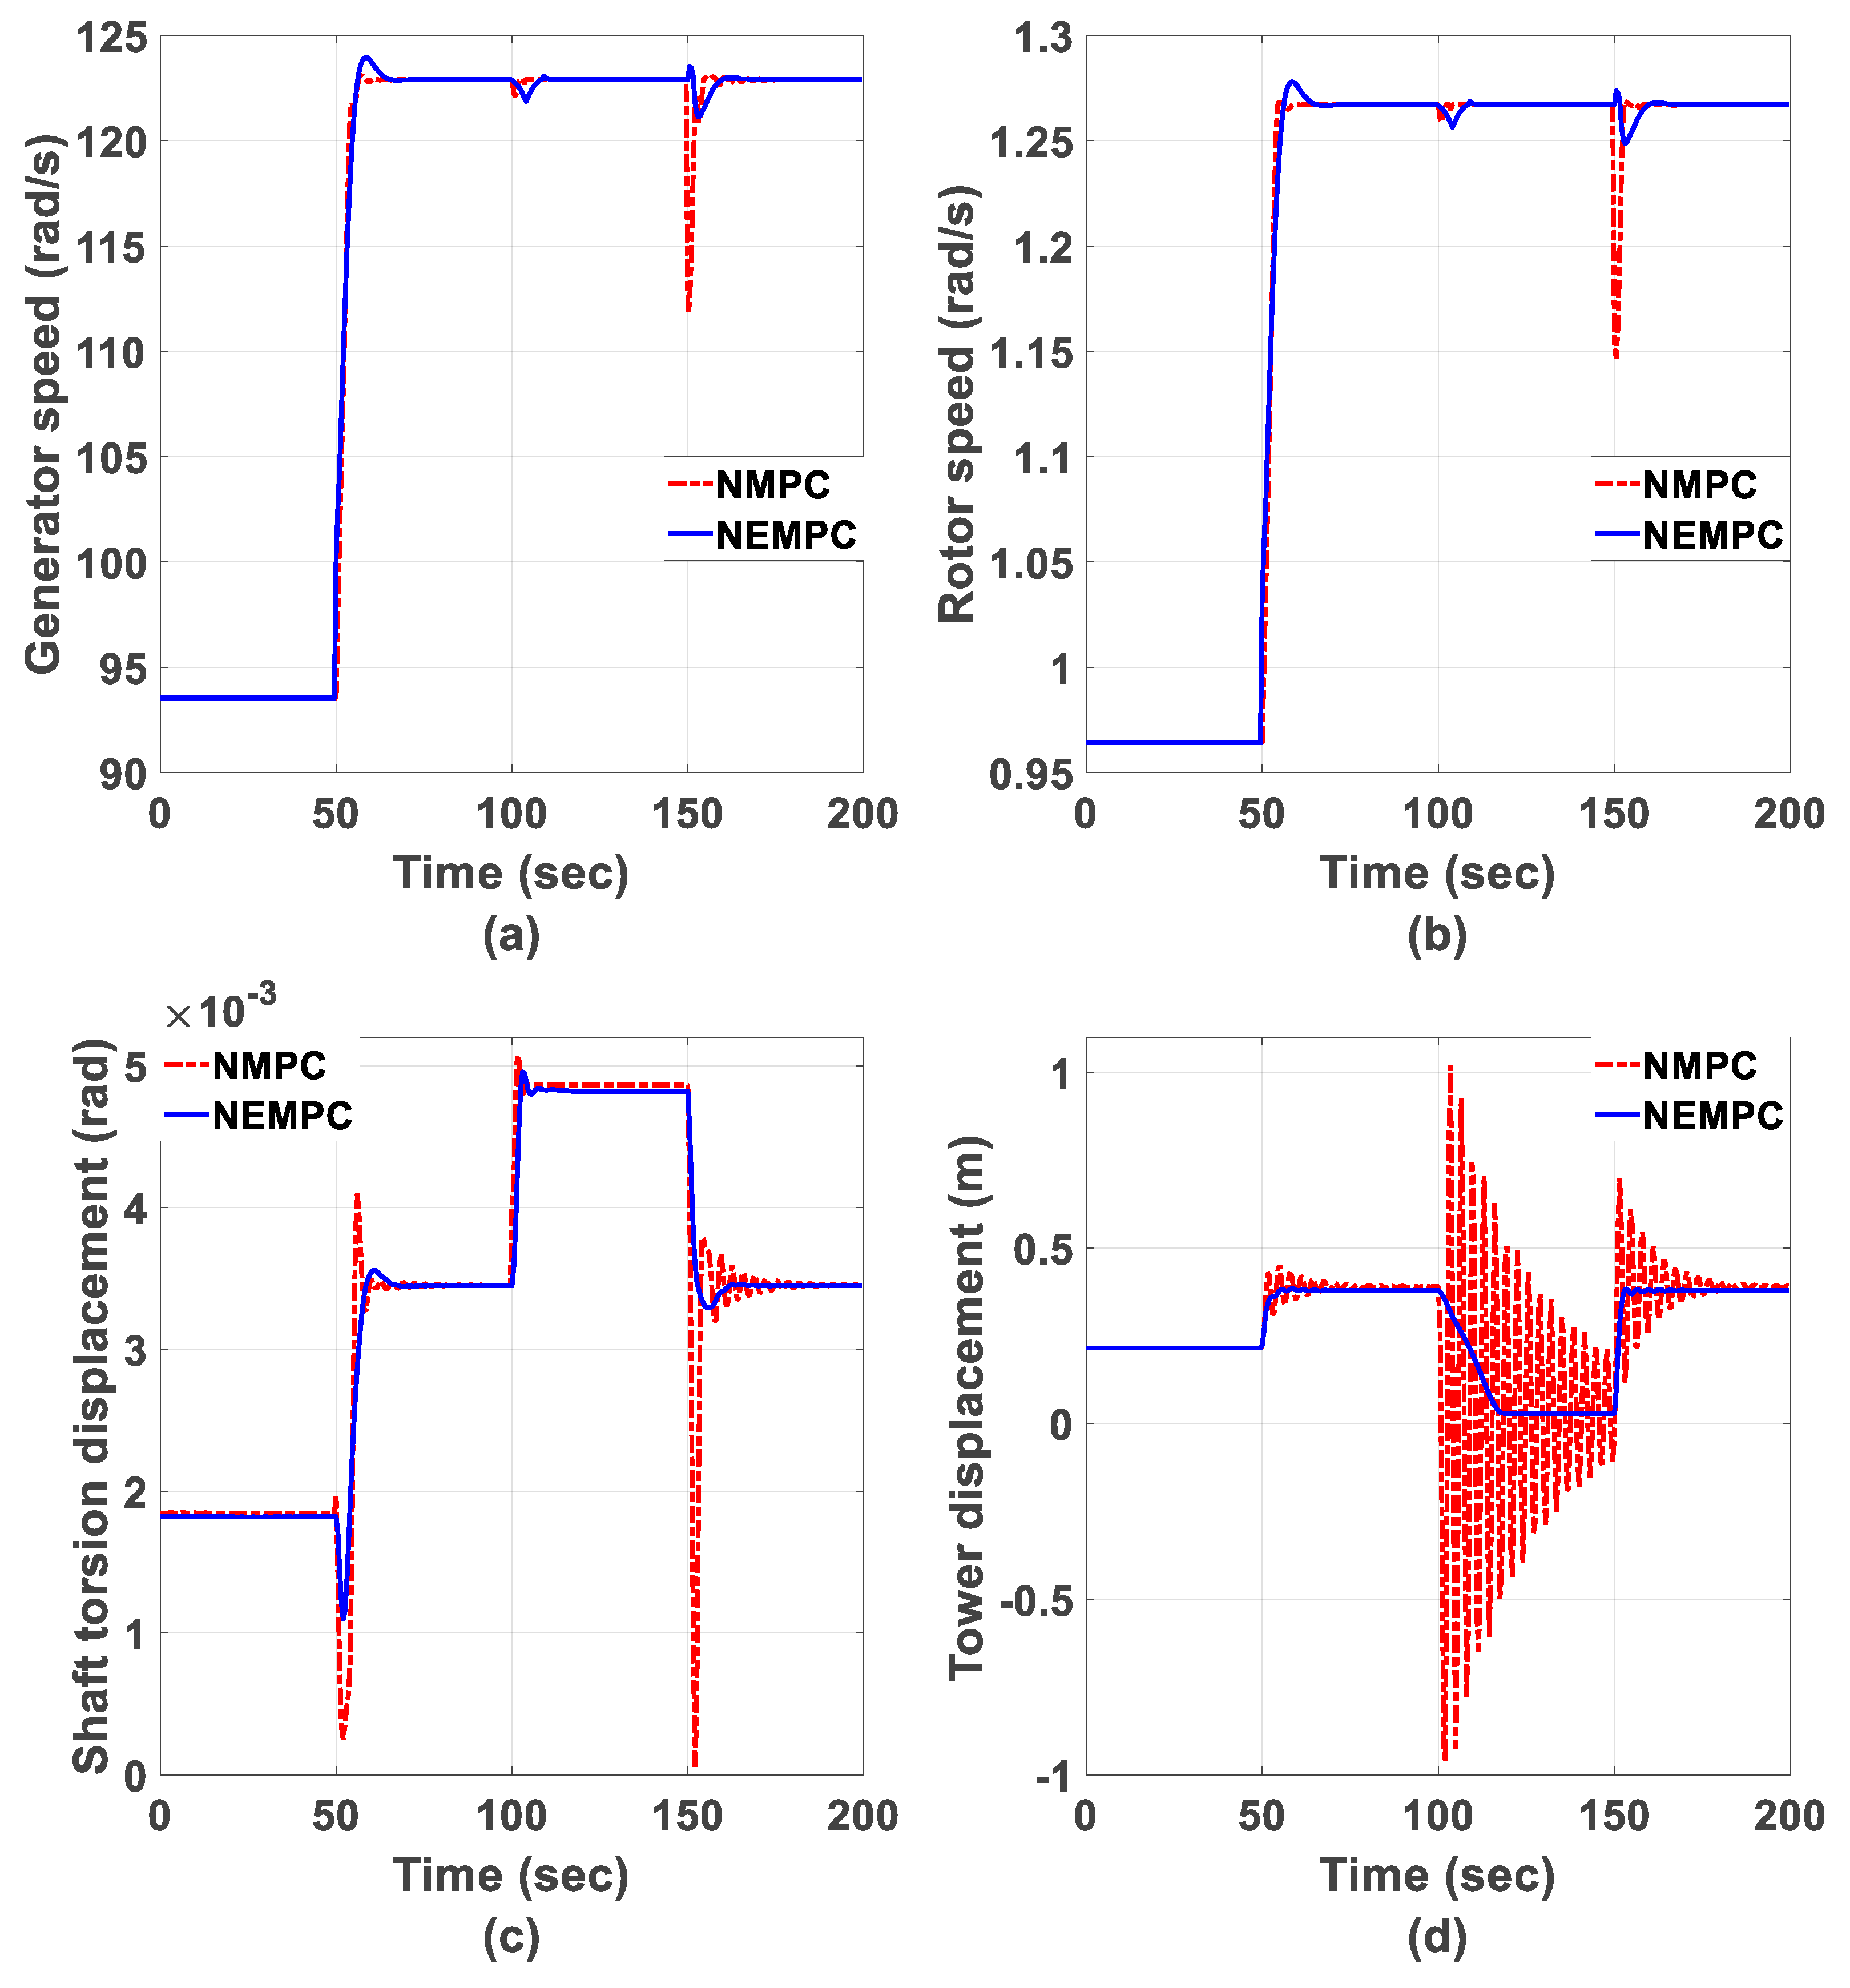
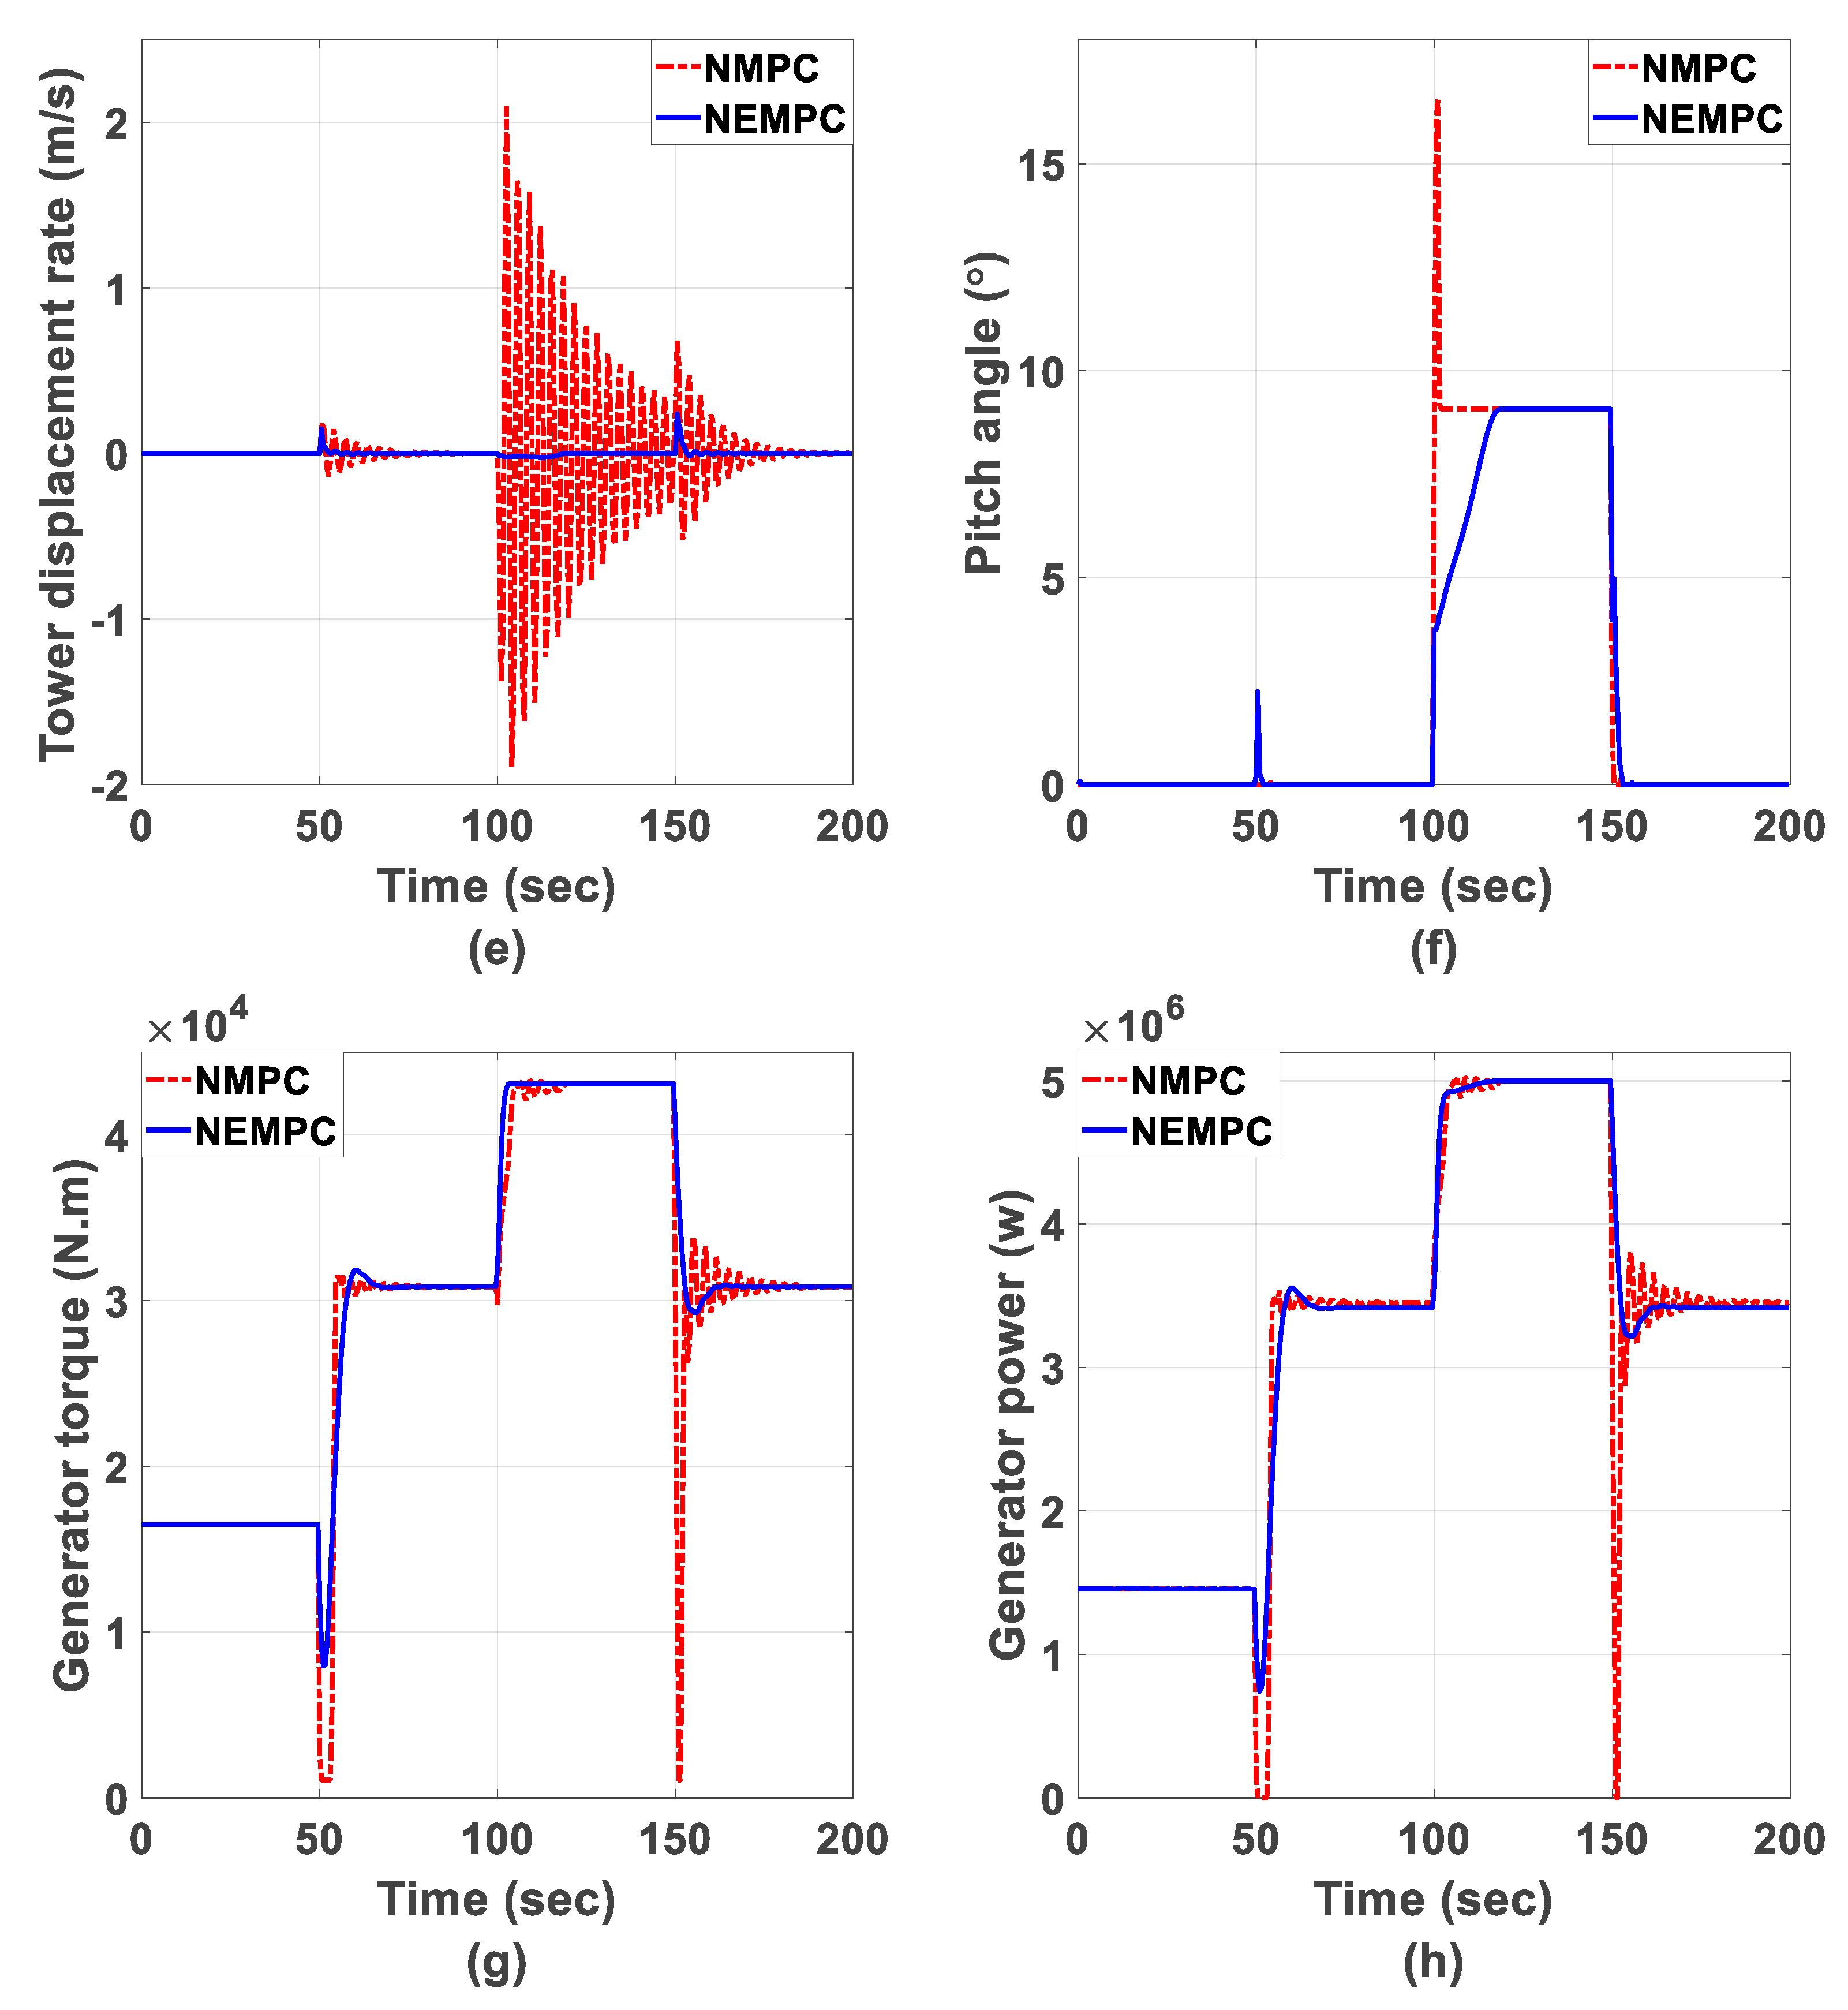
As indicated in Figure 5, a gradient normal wind varying between 7.5 m/s and 15 m/s is used in the simulation. The initial condition is set as . All the input variables, state variables, and output variables adopting both the proposed NEMPC and the classical NMPC strategies are shown as Figure 6a–h. During the time period from 0 s to 50 s, all the dynamic trajectories are almost the same when using the proposed NEMPC and the classical NMPC strategies, because the chosen initial state is just the optimal solution for both controllers under the initial 7.5 m/s normal wind speed.
At time instant 50 s, the normal wind speed steps from 7.5 m/s to 10 m/s, which is below the rated wind speed. Obviously, the VSWT system remains working in region II by using the classical NMPC strategy, which aims to follow the maximum power point and keeps the pitch angle zero. The proposed NEMPC strategy aims to attain a trade-off between the power maximization and turbine fatigue minimization by minimizing the economic cost function (19). Therefore, the pitch-angle is not always kept at zero, while the vibrations of the shaft torsion angle, the tower displacement, and the generation torque are much slighter when using the proposed NEMPC strategy, as shown in Figure 6c–f. No constraints are violated due to the constraints in Equations (20)–(23), which are imposed in both the classical NMPC strategy and the proposed NEMPC strategy, as seen in Figure 6.
At time instant 100 s, the normal wind speed steps from 10 m/s to 15 m/s, which is above the rated wind speed. Therefore, the working region of the VSWT system changes from region II to region III. The aim of the classical NMPC changes from the maximization power capturing to rated power capturing. The generator speed, rotor speed, generator torque, and generator power are changed to the rated values. Simultaneously, the pitch angle is enabled. As shown in Figure 6c–f, the vibration of the shaft torsional angle, the pitch angle, and especially the tower displacement, is much smaller when using the proposed NEMPC strategy than when using the classical NMPC strategy, due to , and being considered in the economic cost function (19).
At time instant 150 s, the normal wind speed decreases from 15 m/s to 10 m/s. Thus, the wind turbine works back to region II. The pitch angle is disabled, the generator speed, rotor speed, and generator torque are performed to follow the maximum power point by using the classical NMPC strategy. From 6b–h, it is obvious that the vibration of each state variable is much more severe when using the classical NMPC strategy compared with the proposed NEMPC strategy. This is because the shaft load and the tower fatigue are not considered in the tracking objective function (26) for the classical NMPC strategy, while they are emphasized in the economic cost function (19) for the proposed NEMPC strategy. Vibrations in the shaft torsional angle, the tower displacement, and the tower displacement rate are harmful to wind turbine systems. Thus, the proposed NEMPC strategy is much better than the classical NMPC strategy in this respect.
From a more intuitive point of view, numerical comparisons have been made to illustrate the difference between these two controllers. Define the root mean square (RMS) values of mechanical loads as follows:
where is the length of the simulation, is the RMS value of gearbox load on the shaft, is the RMS value of fatigue on the tower.
As shown in Table 1, the average values of generator power , the RMS values of the gearbox load on shaft , and the RMS values of fatigue on tower by adopting both the proposed NEMPC strategy and the classical NMPC strategy at different normal wind speed are listed for comparison purposes.
From Table 1, it is obvious that the proposed NEMPC strategy enhances the average generator power over the classical NMPC strategy by 0.03%, 0.5%, 0.3%, and 2.98%, when the normal wind speeds are 7.5 m/s, 10 m/s, 15 m/s, and 10 m/s, respectively. During different normal wind speed periods, the proposed NEMPC strategy reduces the gearbox load on the shaft over the classical NMPC strategy by 1.41%, 0.36%, 1.38%, and 1.73%, respectively. Furthermore, it is obvious that the proposed NEMPC strategy reduces the tower fatigue a lot compared to the classical NMPC strategy from the RMS values of the fatigue on the tower, which proves that the fatigue on the tower can’t be ignored with regards to economic factors.
4.2. Stepwise Normal Wind
In general, 11.4 m/s represents the rated wind-speed, which is used to divide the wind speed into region II and III. Due to the different control objectives in regions II and III, a switching controller is widely used in the actual control of VSWT, which is a great challenge in controller design. To achieve the various operational requirements, the objective function of the classical NMPC strategy switches frequently according to wind speed operating regions. Thus, the rated wind speed 11.4 m/s is actually a very important speed in practical controller designs for VSWT systems.
The proposed NEMPC strategy in this paper adopts a unique economic cost function (19) which does not change according to the normal wind speed between the cut-in and cut-off wind speeds. Suppose the stepwise wind speed is initially set to 10.6 m/s, then steps to 12 m/s with an increment of 0.2 m within 25 s (from region II to region III), as shown in Figure 7a. As indicated in Figure 7b, it’s obvious that the pitch angle has a quick and small overshoot, before quickly returning to zero before t = 125 s. After 125 s, the fluctuations of the pitch angle accumulate around a certain optimal value when the proposed NEMPC strategy is used. At 125 s, the wind speed changes from 11.4 m/s to 11.6 m/s. This means that the special wind speed is around 11.4 m/s due to the economic objective function (19), above which the stable pitch angle no longer remains at zero. Thus, these simulation results prove that a wind speed of around 11.4 m/s was set to divide the region II and III, which is reasonable for considering the economic operation of the VSWT system.
4.3. Randomly Varying Wind Speed Based on the FAST Simulator
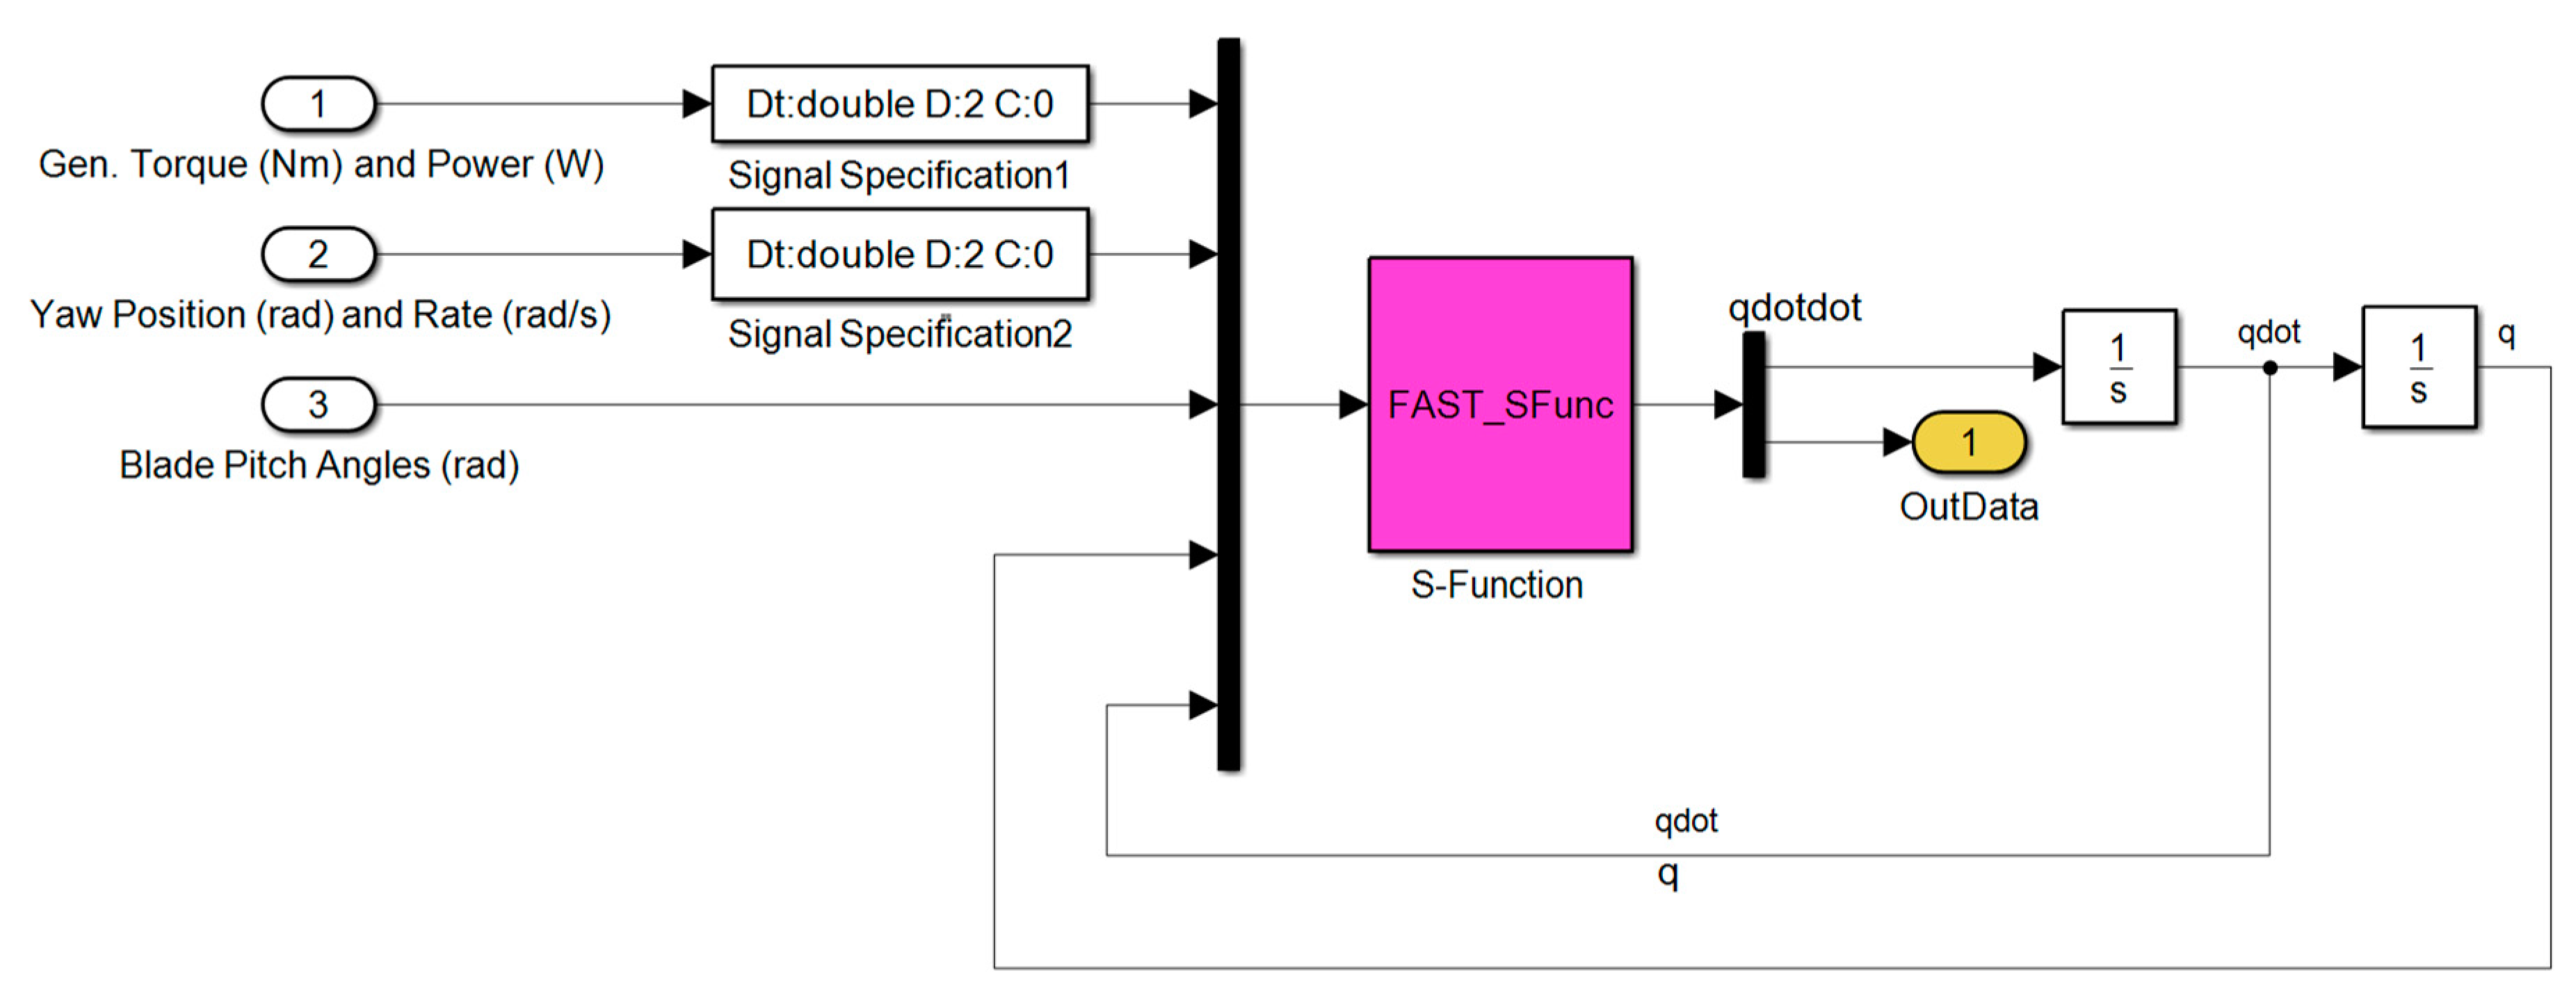
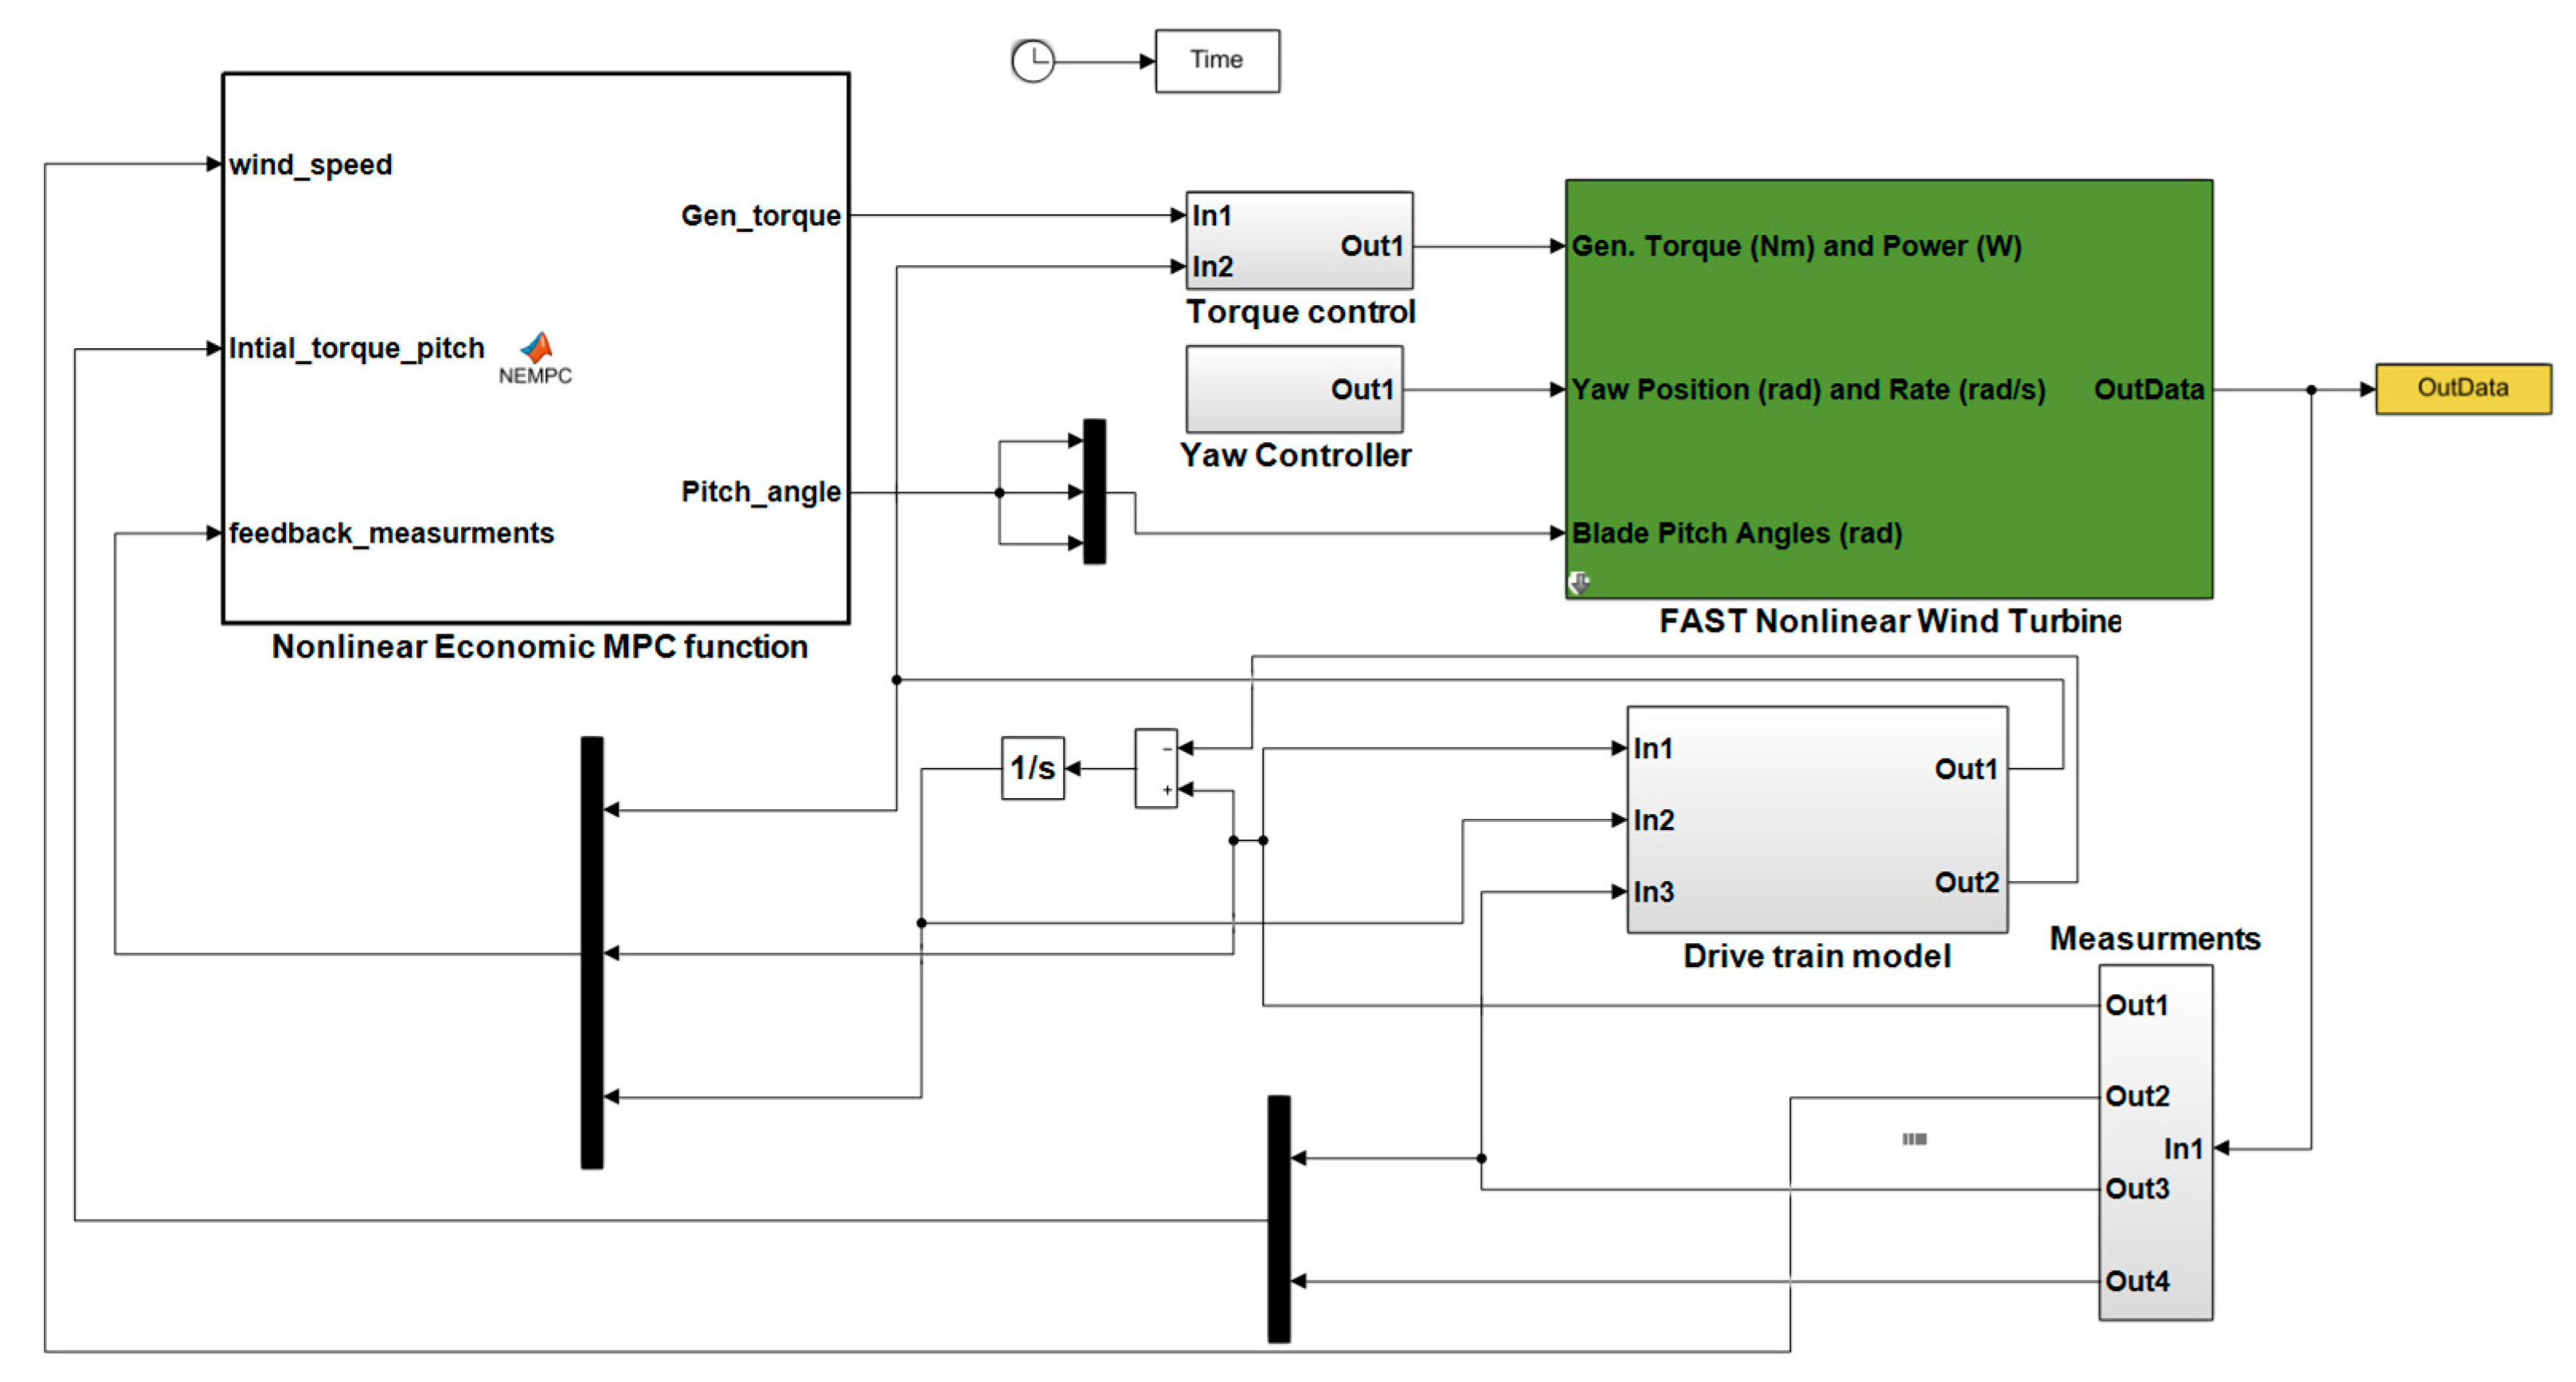
The NREL FAST is an inclusive aeroelastic simulator of two- and three-bladed horizontal-axis WTs [34]. To validate the practicality and validity of the proposed NEMPC strategy, the simulation is then tested on NREL FAST. In this group of simulations, a FAST subroutine was written into the MATLAB S-function, as indicated in Figure 8 and Figure 9.
The normal wind speed is always modeled as the combination of a slowly-changing mean wind-speed and a rapidly-changing turbulent wind-speed :
where we suppose that follows the two-parameter Weibull distribution through a scale parameter and shape parameter , and follows zero-mean Gaussian white noise distribution with standard variation [28].
Then, a group of 600 s random normal wind speed data generated by the FAST simulator as indicated in Figure 10 is adopted in Case 3. The initial condition is set as . Figure 11a–h indicate the performances of the generator speed, rotor speed, shaft torsion angle, tower displacement, tower displacement rate, pitch angle, generator torque, and generator power via the proposed NEMPC strategy.
From a more intuitive viewpoint, it can be observed that the performances of the proposed NEMPC strategy outperform the classical NMPC strategy. More specifically, the classical NMPC strategy shows more noticeable fluctuations in the performance of generator power, shaft torsion displacement, tower displacement, generator torque, and pitch angle when the wind speed has a sudden increase around its rated wind speed, i.e., 11.4 m/s, compared with the proposed NEMPC scheme.
Meanwhile, the classical NMPC strategy shows more successive fluctuations in the performance of generator power, shaft torsion displacement, tower displacement, generator torque, and pitch angle when the normal wind speed has a sudden drop around the rated wind speed, compared with the proposed NEMPC strategy.
As shown in Figure 11d–e, the tower displacement and the tower displacement by using the classical NMPC strategy fluctuates more severely according to the wind speed variation compared with the proposed NEMPC strategy, due to the economic index related with the tower displacement considered in the economic cost function (19) for the proposed NEMPC. It is similar in the performances of the generator power, shaft torsion displacement, generator torque, and pitch angle, as shown in Figure 10. It can be concluded that the proposed NEMPC strategy decreases the operating costs while maintaining energy utilization, compared with the classical NMPC strategy. This is especially obvious when the wind speed varies around the rated wind speed. From Table 2, it is obvious that the proposed NEMPC strategy enhances the average generator power over the classical NMPC strategy by 0.67%, 1.05%, 0.28%, and 1.75%, when the average wind speeds are 9.7 m/s, 9.4 m/s, 10.8 m/s, and 9 m/s, respectively.
During different average wind speed periods, the proposed NEMPC strategy reduces the gearbox load on the shaft over the classical NMPC strategy by 4.05%, 3.96%, 0.68%, and 6.96%, respectively. Furthermore, it is obvious that the proposed NEMPC strategy reduces the tower fatigue a lot compared to the classical NMPC strategy from the RMS values of the fatigue on the tower. Therefore, this group of simulation-based FAST verifies the economy of the proposed NEMPC strategy.
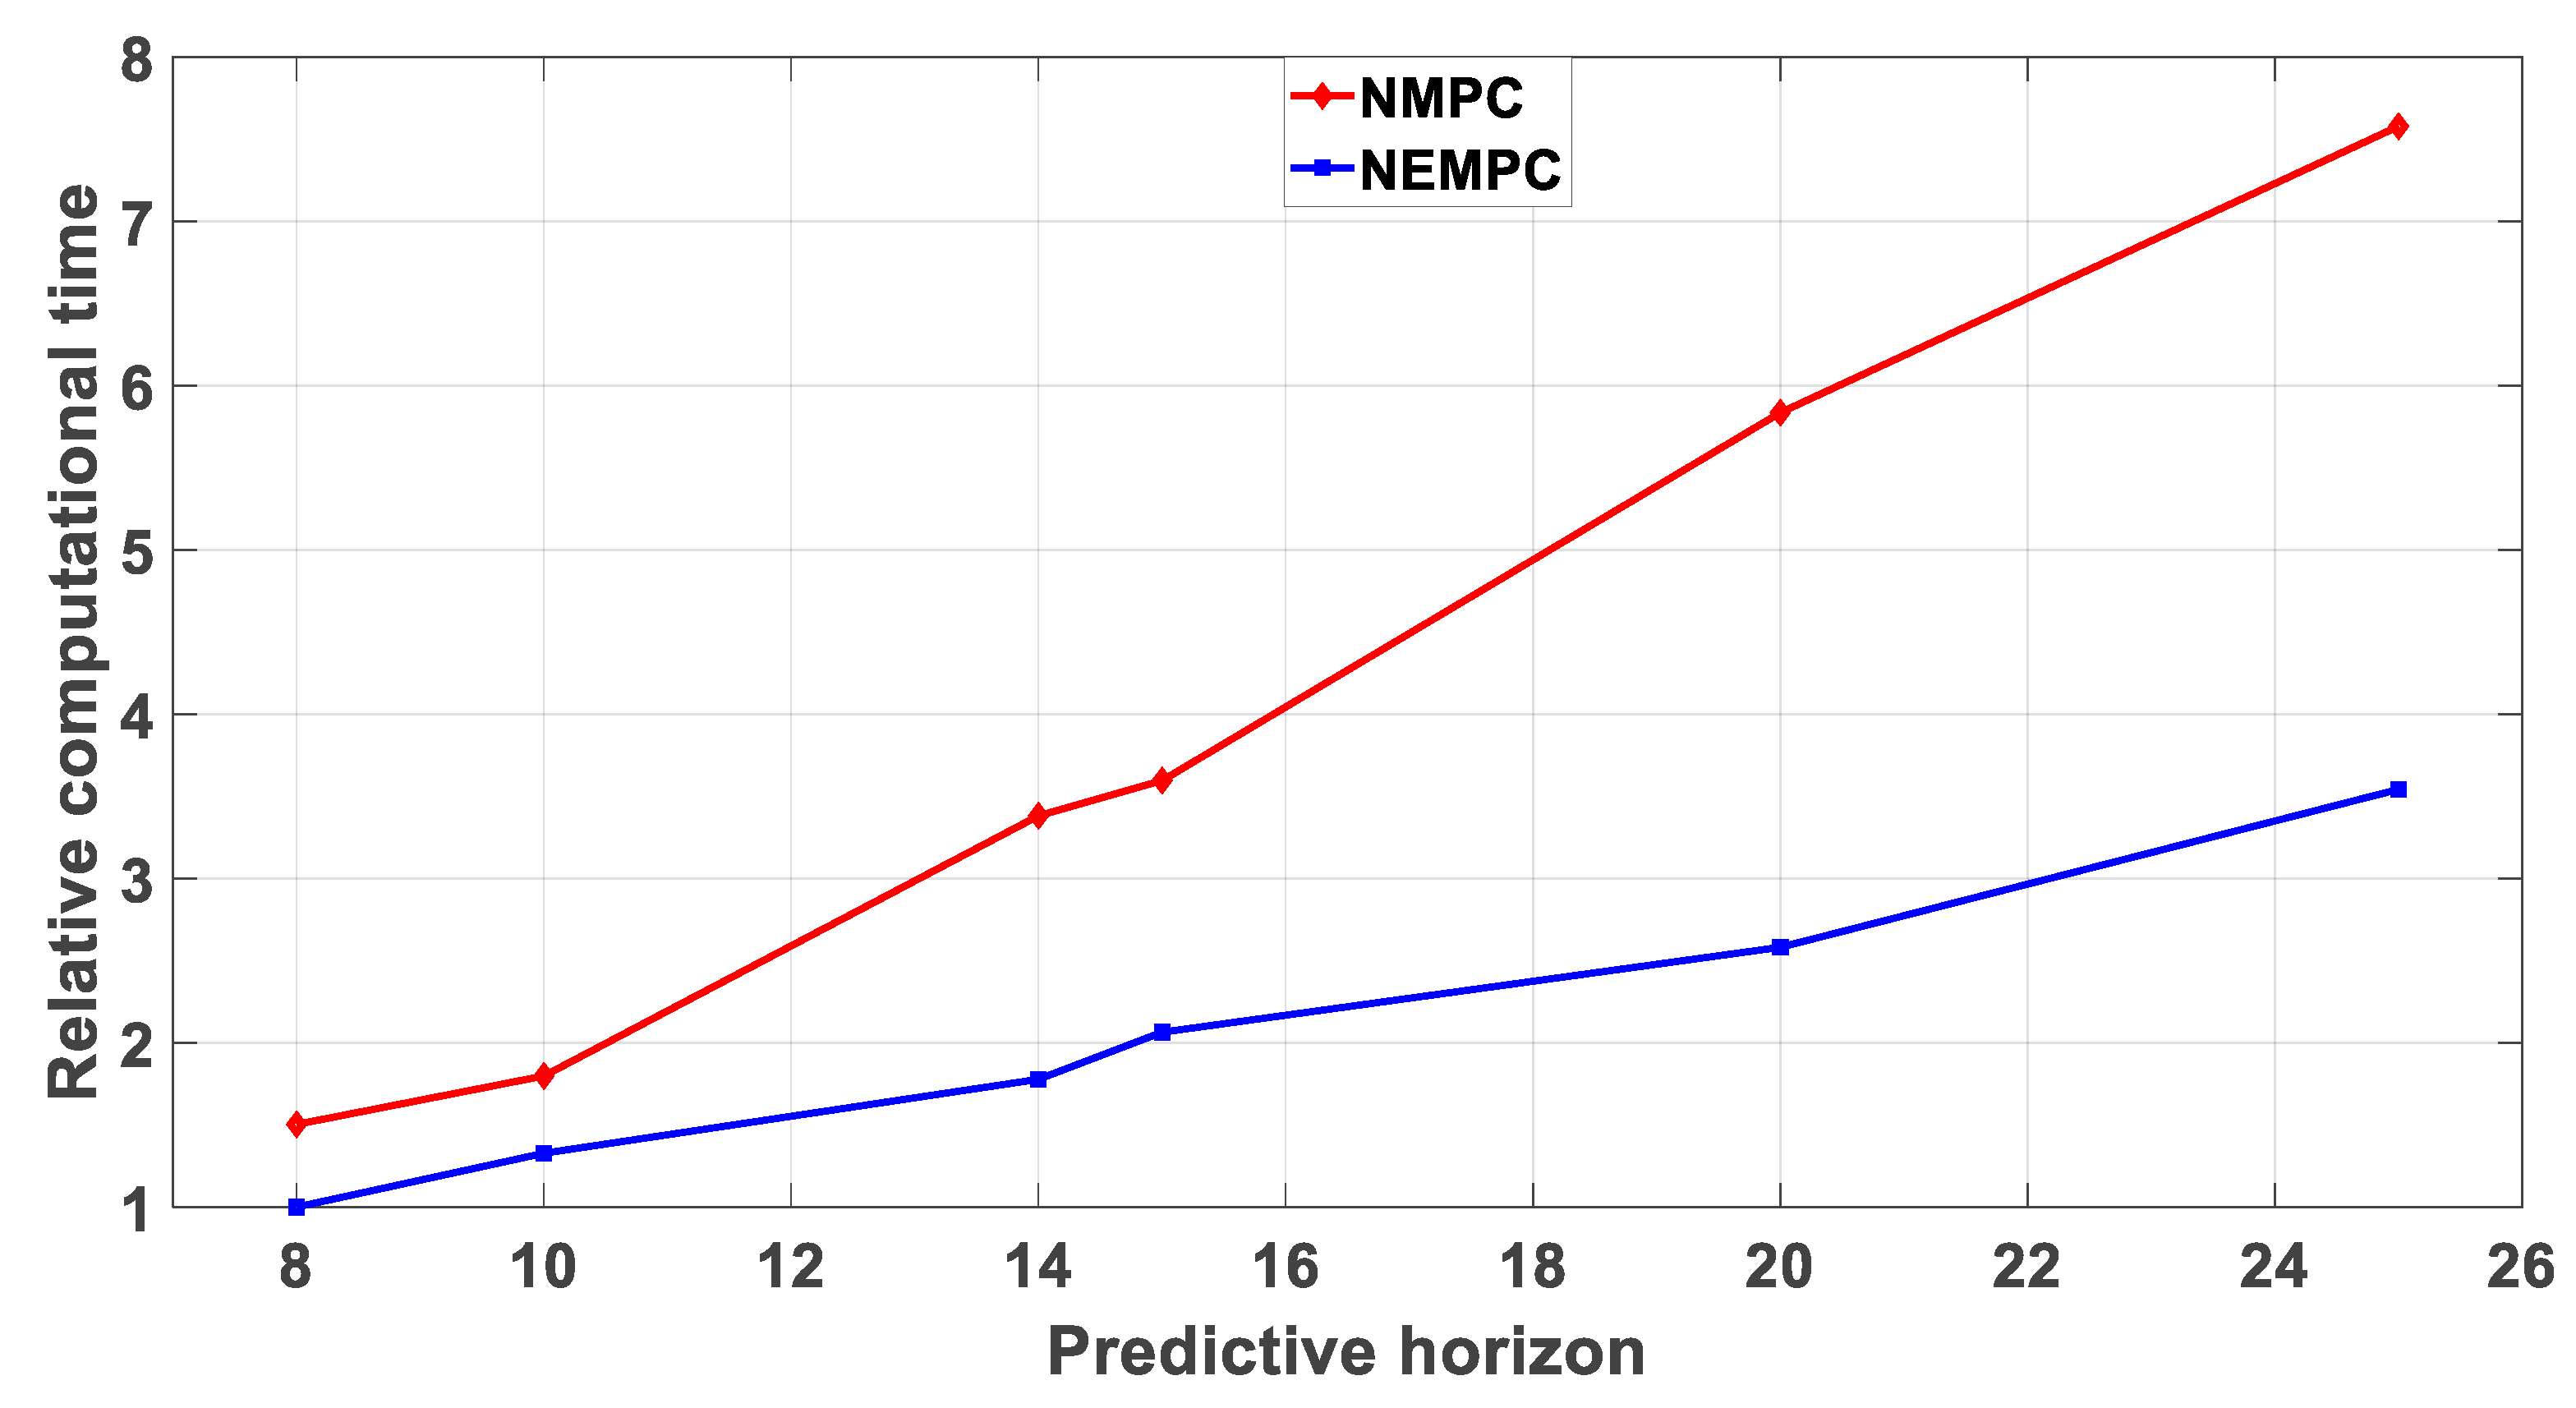
It is well known that the computational burden of nonlinear MPC strategies increases exponentially according to the incensement of the predictive horizon. Various predictive horizons have been considered to investigate the computational burden by using classical NMPC and the proposed NEMPC strategies. The relative computational times of these two controllers are indicated in Figure 12. From Figure 12, it is obvious that the computational time of the proposed NEMPC is much smaller than the classical NMPC with the same predictive horizon. Simultaneously, the computational time of the classical NMPC increases more rapidly according to the incensement of the predictive horizon, compared with the proposed NEMPC strategy.
5. Conclusions
In this paper, the tower displacement and shaft torsional angle are taken into consideration in the development of a nonlinear model for a 5-MW VSWT system. Based on this comprehensive model, a NEMPC strategy for the VSWT system is proposed to increase the dynamic economy, i.e., through power generation maximization and fatigue load minimization during operation. Three groups of simulations for comparisons with the classical NMPC strategy demonstrate the effectiveness of the proposed NEMPC strategy. The simulation under random wind speeds based on the FAST simulator verified the reliability practicability of the proposed NEMPC strategy.
The contributions of this study compared with other current studies can be outlined as follows: Firstly, the tower dynamics are focused on in the modeling process for the VSWT with flexible connections on the shaft, and the tower displacement is considered as a part of the economic objective function, which can reduce tower fatigue. Secondly, all the related operational constraints and physical constraints in the VSWT system with flexible connections on the shaft are considered in the proposed NEMPC strategy in detail. Finally, simulations based on the FAST simulator, which is a realistic WT simulator for testing the system’s validity and practicability, were performed to show the practical implementation of the proposed controller using a turbulence wind speed profile. A future research topic is the design of a robust EMPC strategy taking into account the uncertainty of wind speed.
Author Contributions
Conceptualization, X.K. and M.A.A.; methodology, X.K.; software, M.A.A. and Q.W.; validation, X.K., M.A.A., and Q.W.; formal analysis, X.K.; investigation M.A.A. and Q.W.; resources, L.M. and X.L.; data curation, X.K.; writing—original draft preparation, M.A.A. and Q.W.; writing—review and editing, X.K., L.M. and X.L.; visualization, X.K.; supervision, L.M. and X.L.; project administration, L.M. and X.L.; funding acquisition, X.K. All authors have read and agreed to the published version of the manuscript.
Funding
This work was supported in part by the National Nature Science Foundation of China under Grant 61603134, 61673171, U1709211, 61533013, and 61833011, and in part by Fundamental Research Funds for the Central Universities under Grant 2019QN041, 2017MS033, and 2017ZZD004.
Conflicts of Interest
The authors declare no conflict of interest.
Appendix A

Table A1.
The parameters in the 5-MW VSWT system.
| Parameter | Symbol | Value |
|---|---|---|
| Number of blades | - | 3 |
| Rotor radius | - | 63 m |
| Hub height | - | 84.3 m |
| Hub inertia on the low-speed shaft | 115,926 kg·m2 | |
| Blade inertia on the low-speed shaft | 11,776,047 kg·m2 | |
| Generator inertia on high-speed shaft | 534.116 kg·m2 | |
| Equivalent drive shaft torsion spring | 867,637,000 N·m/rad | |
| Equivalent drive shaft torsion damping | 6,215,000 N·m/(rad/s) | |
| Gearbox ratio | 97 | |
| tower fore-aft inertia | 430,000 kg | |
| tower damping | 17,600 N·s/m | |
| tower stiffness | 1,770,000 N/m | |
| Air density | 1.2231 kg/m3 | |
| Rotor radius | 63 m | |
| Generator efficiency | 94.4% |
Table A2.
The values of the bounds in the 5-MW VSWT system.
| Parameter | Symbol | Value |
|---|---|---|
| Rated generator speed, Min. generator speed | 122.9096, 70.1622 | |
| Rated rotor speed, Min. rotor speed | 1.2671, 0.7226 | |
| Min. shaft torsion angle | 0 | |
| Rated torque, Min. torque | 43,093.55, 0 | |
| Max. torque rate, Min. pitch, Max. pitch | 15,000, 0, 90 | |
| Max. pitch rate, Rated electrical power | 8, 5,000,000 |
References
- Data, E.S.T. What is the proportion of China’s global renewable energy power generation installed data in 2018? Polaris Power Network: Polaris Power Network News. 12 April 2019. Available online: http://news.bjx.com.cn/html/20190412/974382.shtml (accessed on 2 May 2019).
- Bossanyi, E.A. Wind Turbine Control for Load Reduction. Wind Energy 2003, 6, 229–244. [Google Scholar] [CrossRef]
- Nam, Y. Control System Design. In Wind Turbines; IntechOpen: Rijeka, Croatia, 2011. [Google Scholar]
- Jafarnejadsani, H.; Pieper, J. Gain-Scheduled ℓ1-Optimal Control of Variable-Speed-Variable-Pitch Wind Turbines. IEEE Trans. Control Syst. Technol. 2015, 23, 372–379. [Google Scholar] [CrossRef]
- Ren, Y.; Li, L.; Brindley, J.; Jiang, L. Nonlinear PI control for variable pitch wind turbine. Control Eng. Pract. 2016, 50 (Suppl. C), 84–94. [Google Scholar] [CrossRef] [Green Version]
- El-Shafei, M.A.K.; El-Hawwary, M.I.; Emara, H.M. Implementation of fractional-order PID controller in an industrial distributed control system. In Proceedings of the 2017 14th International Multi-Conference on Systems, Signals & Devices (SSD), Marrakech, Morocco, 28–31 March 2017; pp. 713–718. [Google Scholar]
- Kusiak, A.; Zhang, Z.; Verma, A. Prediction, operations, and condition monitoring in wind energy. Energy 2013, 60, 1–12. [Google Scholar] [CrossRef]
- Yilmaz, A.S.; Özer, Z. Pitch angle control in wind turbines above the rated wind speed by multi-layer perceptron and radial basis function neural networks. Expert Syst. Appl. 2009, 36, 9767–9775. [Google Scholar] [CrossRef]
- Van, T.L.; Nguyen, T.H.; Lee, D.C. Advanced Pitch Angle Control Based on Fuzzy Logic for Variable-Speed Wind Turbine Systems. IEEE Trans. Energy Convers. 2015, 30, 578–587. [Google Scholar] [CrossRef]
- Wakui, T.; Yoshimura, M.; Yokoyama, R. Multiple-feedback control of power output and platform pitching motion for a floating offshore wind turbine-generator system. Energy 2017, 141, 563–578. [Google Scholar] [CrossRef]
- Jiao, X.; Meng, W.; Yang, Q.; Fu, L.; Chen, Q. Adaptive Continuous Neural Pitch Angle Control for Variable-Speed Wind Turbines. Asian J. Control 2019, 21. [Google Scholar] [CrossRef]
- Moodi, H.; Bustan, D. Wind turbine control using T-S systems with nonlinear consequent parts. Energy 2019, 172, 922–931. [Google Scholar] [CrossRef]
- Lio, W.H.; Rossiter, J.; Jones, B.L. A review on applications of model predictive control to wind turbines. In Proceedings of the 2014 UKACC International Conference on Control (CONTROL), Loughborough, UK, 9–11 July 2014; pp. 673–678. [Google Scholar]
- Henriksen, L.C. Model Predictive Control of Wind Turbines; DTU Informatics: Lyngby, Denmark, 2010. [Google Scholar]
- Henriksen, L.C.; Hansen, M.H.; Poulsen, N.K. Wind turbine control with constraint handling: A model predictive control approach. IET Control Theory Appl. 2012, 6, 1722–1734. [Google Scholar] [CrossRef] [Green Version]
- Bououden, S.; Chadli, M.; Filali, S.; El Hajjaji, A. Fuzzy model based multivariable predictive control of a variable speed wind turbine: LMI approach. Renew. Energy 2012, 37, 434–439. [Google Scholar] [CrossRef]
- Abdelbaky, M.A.; Liu, X.; Jiang, D. Design and implementation of partial offline fuzzy model-predictive pitch controller for large-scale wind-turbines. Renew. Energy 2020, 145, 981–996. [Google Scholar] [CrossRef]
- Abdelbaky, M.A.; Liu, X.; Kong, X. Wind Turbines Pitch Controller using Constrained Fuzzy-Receding Horizon Control. In Proceedings of the 2019 Chinese Control And Decision Conference (CCDC), Nanchang, China, 3–5 June 2019; pp. 236–241. [Google Scholar]
- Gros, S.; Vukov, M.; Diehl, M. A real-time MHE and NMPC scheme for wind turbine control. In Proceedings of the 52nd IEEE Conference on Decision and Control, Florence, Italy, 10–13 December 2013; pp. 1007–1012. [Google Scholar]
- Soliman, M.; Malik, O.P.; Westwick, D.T. Multiple model multiple-input multiple-output predictive control for variable speed variable pitch wind energy conversion systems. IET Renew. Power Gener. 2011, 5, 124–136. [Google Scholar] [CrossRef]
- Song, D.; Yang, J.; Dong, M.; Joo, Y.H. Model predictive control with finite control set for variable-speed wind turbines. Energy 2017, 126, 564–572. [Google Scholar] [CrossRef]
- Rawlings, J.B.; Mayne, D.Q. Model Predictive Control: Theory and Design; Nob Hill Publishing: Madison, WI, USA, 2009. [Google Scholar]
- Diehl, M.; Amrit, R.; Rawlings, J.B. A Lyapunov Function for Economic Optimizing Model Predictive Control. IEEE Trans. Autom. Control 2011, 56, 703–707. [Google Scholar] [CrossRef]
- Heidarinejad, M.; Liu, J.; Christofides, P.D. Economic model predictive control of nonlinear process systems using Lyapunov techniques. AIChE J. 2012, 58, 855–870. [Google Scholar] [CrossRef]
- Gros, S.; Schild, A. Real-time economic nonlinear model predictive control for wind turbine control. Int. J. Control 2017, 90, 2799–2812. [Google Scholar] [CrossRef]
- Cui, J.; Liu, S.; Liu, J.; Liu, X. A Comparative Study of MPC and Economic MPC of Wind Energy Conversion Systems. Energies 2018, 11, 3127. [Google Scholar] [CrossRef] [Green Version]
- Munteanu, I.; Bratcu, A.I.; Cutululis, N.-A.; Ceanga, E. Optimal Control of Wind Energy Systems: Towards a Global Approach; Springer Science & Business Media: New York, NY, USA, 2008. [Google Scholar]
- Usta, I.; Arik, I.; Yenilmez, I.; Kantar, Y.M. A new estimation approach based on moments for estimating Weibull parameters in wind power applications. Energy Convers. Manag. 2018, 164, 570–578. [Google Scholar] [CrossRef]
- Bianchi, F.; De Battista, H.; Mantz, R.J. Wind Turbine Control Systems: Principles, Modelling and Gain Scheduling Design; Springer: London, UK, 2007; p. 208. [Google Scholar]
- Imran, R.; Hussain, D.; Chowdhry, B. Parameterized Disturbance Observer Based Controller to Reduce Cyclic Loads of Wind Turbine. Energies 2018, 11, 1296. [Google Scholar] [CrossRef] [Green Version]
- Hur, S.-H. Modelling and control of a wind turbine and farm. Energy 2018, 156, 360–370. [Google Scholar] [CrossRef]
- Jonkman, J.; Butterfield, S.; Musial, W.; Scott, G. Definition of a 5-MW Reference Wind Turbine for Offshore System Development; National Renewable Energy Laboratory (NREL): Golden, CO, USA, 2009.
- Wächter, A.; Biegler, L.T. On the implementation of an interior-point filter line-search algorithm for large-scale nonlinear programming. Math. Program. 2006, 106, 25–57. [Google Scholar] [CrossRef]
- Jonkman, J.M.; Buhl, M.L., Jr. FAST User’s Guide-Updated August 2005; National Renewable Energy Laboratory (NREL): Golden, CO, USA, 2005.
Figure 1.
VSWT operation regions.

Figure 2.
The mechanical structure of the VSWT generation system.

Figure 3.
The aerodynamic power coefficient for 5-MW VSWT.

Figure 4.
The thrust coefficient for 5-MW VSWT.

Figure 5.
Gradient wind speed.

Figure 6.
(a) Generator speed; (b) Rotor speed; (c) Shaft torsional angle; (d) Tower displacement; (e) Tower displacement rate; (f) Pitch angle; (g) Generator torque; (h) Generator power.
Figure 6.
(a) Generator speed; (b) Rotor speed; (c) Shaft torsional angle; (d) Tower displacement; (e) Tower displacement rate; (f) Pitch angle; (g) Generator torque; (h) Generator power.


Figure 7.
(a) Stepwise wind speed; (b) Pitch angle.

Figure 8.
The FAST S-Function Block.

Figure 9.
Simulation structure.

Figure 10.
Wind speed.

Figure 11.
(a) Generator speed; (b) Rotor speed; (c) Shaft torsional angle; (d) Tower displacement; (e) Tower displacement rate; (f) Pitch angle; (g) Generator torque; (h) Generator power.
Figure 11.
(a) Generator speed; (b) Rotor speed; (c) Shaft torsional angle; (d) Tower displacement; (e) Tower displacement rate; (f) Pitch angle; (g) Generator torque; (h) Generator power.


Figure 12.
Relative computational times for various predictive horizons.

Table 1.
Data analysis based on the results in Figure 6.
Table 1.
Data analysis based on the results in Figure 6.
| 7.5 m/s | 10 m/s | 15 m/s | 10 m/s | |
|---|---|---|---|---|
| (MW) | 1.4575 | 3.1873 | 4.9493 | 3.4317 |
| (MW) | 1.4570 | 3.1714 | 4.9343 | 3.3323 |
| ( rad) | 1.820 | 3.288 | 4.784 | 3.416 |
| ( rad) | 1.846 | 3.300 | 4.851 | 3.476 |
| ( m/s) | 0 | 1.643 | 1.10 | 3.31 |
| ( m/s) | 0 | 4.483 | 76.58 | 16.44 |
Table 2.
Data analysis based on the results in Figure 11.
Table 2.
Data analysis based on the results in Figure 11.
| 9.7 m/s | 9.4 m/s | 10.8 m/s | 9 m/s | |
|---|---|---|---|---|
| (MW) | 3.1162 | 2.9598 | 4.1231 | 2.5662 |
| (MW) | 3.095 | 2.9291 | 4.1116 | 2.5221 |
| ( rad) | 3.234 | 3.092 | 3.913 | 2.581 |
| ( rad) | 3.365 | 3.215 | 3.939 | 2.761 |
| ( m/s) | 36.38 | 35.80 | 42.59 | 33.40 |
| ( m/s) | 39.44 | 35.83 | 43.22 | 32.86 |
© 2020 by the authors. Licensee MDPI, Basel, Switzerland. This article is an open access article distributed under the terms and conditions of the Creative Commons Attribution (CC BY) license (http://creativecommons.org/licenses/by/4.0/).
Share and Cite
MDPI and ACS Style
Kong, X.; Ma, L.; Liu, X.; Abdelbaky, M.A.; Wu, Q. Wind Turbine Control Using Nonlinear Economic Model Predictive Control over All Operating Regions. Energies 2020, 13, 184. https://0-doi-org.brum.beds.ac.uk/10.3390/en13010184
AMA Style
Kong X, Ma L, Liu X, Abdelbaky MA, Wu Q. Wind Turbine Control Using Nonlinear Economic Model Predictive Control over All Operating Regions. Energies. 2020; 13(1):184. https://0-doi-org.brum.beds.ac.uk/10.3390/en13010184
Chicago/Turabian StyleKong, Xiaobing, Lele Ma, Xiangjie Liu, Mohamed Abdelkarim Abdelbaky, and Qian Wu. 2020. "Wind Turbine Control Using Nonlinear Economic Model Predictive Control over All Operating Regions" Energies 13, no. 1: 184. https://0-doi-org.brum.beds.ac.uk/10.3390/en13010184
Note that from the first issue of 2016, this journal uses article numbers instead of page numbers. See further details here.