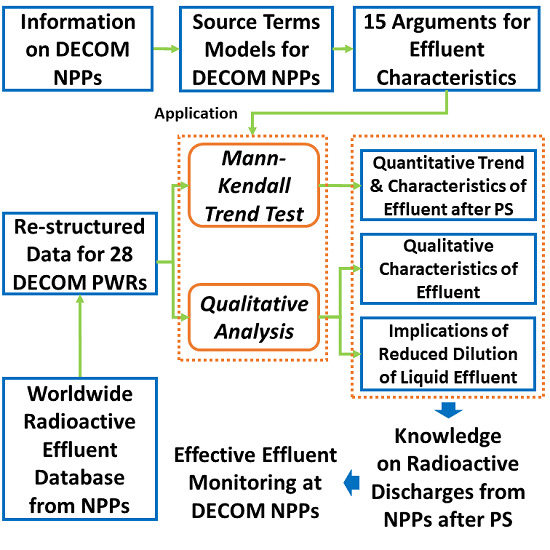
Characteristics of Radioactive Effluent Releases from Pressurized Water Reactors after Permanent Shutdown


Department of Nuclear Engineering, Kyung Hee University, 1732 Deokyoung-daero, Giheung-gu, Yongin-si, Gyeonggi-do 17104, Korea
*
Author to whom correspondence should be addressed.
Energies 2020, 13(10), 2436; https://0-doi-org.brum.beds.ac.uk/10.3390/en13102436
Submission received: 31 March 2020
/
Revised: 30 April 2020
/
Accepted: 5 May 2020
/
Published: 12 May 2020
(This article belongs to the Special Issue Nulcear Energy and Technology)
Abstract
:In order to expand our understanding of the characteristics of radioactive effluent from nuclear power plants under decommissioning, which have not been systematically investigated, a series of source term models of radioactive effluent after permanent shutdown has been established based upon theoretical reasoning on the design and operation features of plants and derived in terms of fifteen arguments. Comprehensive radioactive effluent data have been collected and profiled from twenty-eight decommissioning pressurized water reactors, and annual trends of effluent from each plant have been quantitatively analyzed using Mann-Kendall statistical test. In addition, the characteristics of collected effluent data have been qualitatively interpreted based upon arguments newly proposed in this study. Furthermore, potential decreasing of dilution factor for liquid effluent and its safety implications are identified. The source term models and verified characteristics of radioactive effluent after permanent shutdown developed in this study can be used for establishing more efficient discharge monitoring program for decommissioning authorization.
1. Introduction
It is reported that 53 pressurized water reactor (PWR) units have been permanently shut down among the 172 nuclear power plant (NPP) units that ceased operations as of 31 December 2018, and additional NPPs have ceased operation every year since and the cumulative number of permanently shut down NPPs is expected to continually increase in the future [1,2].
Radioactive materials in airborne and liquid effluent are released to the environment from NPPs, and the radioactivity in discharged materials is reported to the corresponding regulatory authority for each radionuclide (RN) or RNs groups [3,4,5]. The discharged radioactive materials may have a radiological impact on the public and the environment (i.e., flora and fauna) in the vicinity of NPPs. Accordingly, the radioactive effluent discharges should be justified and managed in accordance with the plant’s authorization, and authorized discharge operations should be conducted under the discharge limits (usually within the range of 0.1 to <1 mSv in a year) set in accordance with an internationally endorsed as low as reasonably achievable (ALARA) principle [6].
It is noted that the radioactive effluent is released to the environment from NPPs not only during operation, but after permanent shutdown (PS) as well and even during decommissioning until license termination (LT) [7]. With regard to the radioactive effluent from decommissioning NPPs, the International Atomic Energy Agency (IAEA) has stated that the discharge of radioactive effluents during decommissioning requires authorization in compliance with appropriate national regulations [7]. Besides, the United States Nuclear Regulatory Commission (USNRC) has stated, in its general environmental impact statement (GEIS) on decommissioning of nuclear facilities, that the quantities of gaseous effluents released in the decommissioning process are to be controlled by the administrative limits defined in the plant-specific Offsite Dose Calculation Manual (ODCM) or a similar document [8].
A set of specific regulatory guides or industrial standards on monitoring, control and reporting of radioactive discharges from NPPs have been applied in many countries, however, most of them elaborate mainly on NPPs in operation. That is, existing standards on radioactive discharges have defined their scope to operating NPPs and specific provisions for the effluent control at the NPPs after PS are not directly addressed [9,10,11,12,13]. Furthermore, no specific considerations have been taken on the characteristics of radioactive discharge during decommissioning compared to those in operation period. Most of the existing studies on the radioactive discharge from NPPs have focused on the operating plants such as analyses of trends in airborne and liquid effluent from NPPs in operation [14,15].
However, a few open literature publications have addressed some characteristics of radioactive effluent from NPPs after cessation of their operations. Among them, the IAEA has pointed out the possible change of the characteristics of radioactive discharges during decommissioning compared to the operation period and proposed the need of a new or revised discharge permit for decommissioning period [7]. The IAEA has also emphasized the potential elevation of radioactive discharges due to decommissioning actions, variation of effluent discharges through different phases of decommissioning, and change of forms and compositions of effluent compared to normal operation. But neither further details on the sources of respective information nor references are given.
The USNRC has provided comparative statistics of RNs (or their groups) in gaseous and liquid radioactive discharges from a set of multiple units of operating and permanently shutdown NPPs and concluded that decommissioning releases are lower [16]. Moreover, some interpretations of changes in release rates of RNs in effluent were given as: no emissions of most of radioiodine isotopes after defueling due to their short half-lives; continued release of longer-lived fission gases and particulate materials in gaseous effluent after the end of operation attributed to maintained plant ventilation systems during decommissioning process; and so forth. The characteristics of radioactive effluent from each decommissioning NPP have not been analyzed or reported plant by plant, however, and the technical basis for interpretations of changes in radioactive discharge after PS has not been given.
Besides, Bonavigo et al., have introduced foreseen annual discharges (i.e., gross radioactivity) of gaseous and liquid from the Trino NPP due to a sequence/series of dismantling activities by referring to its decommissioning plan [17]. However, analysis on the change of radioactive discharges using actual release data has not been conducted, and the predicted emissions could not be verified due to the limited information on the time and duration of major dismantling activities actually done in the paper.
Based upon the above review, this study aims at more comprehensive understanding of the radioactive discharge characteristics after PS, which could be a robust technical basis for effective radioactive effluent monitoring program at decommissioning NPPs. In order to attain the goal, a generalized model of radioactive source terms of discharges from permanently shut down PWRs is established, and plant-specific characteristics of effluent discharges are investigated based on actual data of radioactive effluent from decommissioning plants in the world. In addition, a series of specific considerations to be taken in airborne and liquid effluent control at decommissioning NPPs are to be proposed.
2. Methodology
2.1. Data Collection of Radioactive Effleunt from Decommissioning NPPs
RNs in airborne and liquid effluent released from NPPs to the environment are commonly categorized into a few groups and have been recorded and periodically reported to the national authority and/or international organizations [18,19,20,21,22,23,24,25,26]. Publicly available database or reports on radioactive effluent from NPPs surveyed and/or collected in this study are shown in Table 1 together with the groups of RNs categorized in each information source.
In order to keep the consistency of analysis on effluent data, the variable categories of RNs groups in effluent databases or reports as specified in Table 1 are re-categorized in accordance with a regulatory guidance of the USNRC as below [9]:
- Airborne effluent: , , , , and ; and
- Liquid effluent: , , , and .
PWRs permanently shut down, in decommissioning process or decommissioned are chosen for investigation in this study, since they are the majority among multiple types of NPPs ceased their operations [1]. Effluent data sources D9 and D10 are not further reviewed, since D9 contains data only for pressurized heavy water reactors (PHWRs) and D10 data only for operating reactors and reactors just recently shutdown within 3 years. Furthermore, PWRs which ceased operations after 2016 and PWRs for which either no or rare effluent data after PS are available in the information sources (see Table 1) are excluded from further analysis. As such, a full set or part of annual radioactive effluent data for 28 out of 53 units of PWRs have been profiled and utilized in this study (see Table 2).
As shown in Table 2, the trend of effluent discharge has been analyzed quantitatively using Mann-Kendall test for 25 PWR units for which effluent data after the PS are available (i.e., Type analysis, see Section 3.1). Comprehensive qualitative analysis on characteristics of effluent discharges affected by specific factors including decommissioning strategies, phases, and activities has been conducted for seven PWR units for which effluent data both in operational and post shutdown phases are available (i.e., Type analysis, see Section 3.2 and Section 3.4). Furthermore, the effect of changing discharge conditions on the effluent discharge has been investigated for five PWR units (i.e., Type analysis, see Section 3.3).
2.2. Mann-Kendall Trend Test
In order to identify the quantitative characteristics of radioactive effluent after PS of NPPs, an analysis of yearly trends in radioactivity discharged to the environment is adopted in this study. There have been developed various trends analysis methodologies including but not limited to: regression-based method for estimating and testing for trends, general trend estimation methods, and hypothesis tests for detecting trends [27]. Among them, Mann-Kendall trend test based on nonparametric statistics categorized into a general trend estimation method have been widely used for analysis of trends of pollutant emissions, sea level, climate change, etc. in annual, monthly or seasonal time series [28,29,30]. More specifically, Jason and David analyzed the trends of annual radioactive effluent released from commercial NPPs in the United States using the Mann-Kendall trend test [14]. The Mann-Kendall test is adopted, therefore, for radioactive effluent trends analysis from PS NPPs in this study as well.
The null hypothesis for the Mann-Kendall trend test is that there is no trend in the time series to be analyzed. For a time series , where is a data value at time and is the number of data points (i.e., sample size), the statistic is calculated as:
where, and are data values at times and , respectively, and the sign function is defined as given in Equation (2):
When the sample size is higher than 10 (i.e., ), the statistic is assumed to be a normal distribution and the standard normal test Z value is calculated using Equation (3):
where, the variance of statistic , is given by:
A positive value in Equation (3) indicates an increasing trend, while a negative implying a decreasing trend. If the calculated value meets the condition of , the null hypothesis is rejected and either increasing or decreasing trend exists. Otherwise, the null hypothesis is accepted, which means there is no trend in the time series. is obtained from the standard normal distribution table with significance level of α.
The probability value or p-value for each trend test can be obtained using Equations (5) and (6):
where, denotes the cumulative distribution function (CDF) of a standard normal variate, which is defined as:
If the calculated p-value is equal to or less than the assumed significance level α, it can be concluded that the existing trend is statistically significant [28].
On the other hand, the p-value is calculated in a different way if the sample size is equal to or less than 10 (i.e., ). In this case of small sample size, the probability value or p-value can be obtained by reading a specific statistical table with given sample size () and the statistic () calculated from Equation (2). For testing the null hypothesis (H0) of no trend against the alternative hypothesis H1 (upward trend), H0 is rejected if > 0 and p < α at the same time, while H0 against H2 (downward trend) being rejected if < 0 and if < α [27].
2.3. Source Term Modeling of Radioactive Effluent after Permanent Shutdown
During operation of NPPs, fission products and actinides are produced in nuclear fuel through nuclear fission and neutron capture reactions, and primary coolant, various structures, systems, and components (SSCs) and air adjacent to reactor core become radioactive by neutron activation reactions [31]. After PS of NPPs, however, no additional generation of RNs is expected since fission and neutron activation reactions are to be practically ceased after defueling. Accordingly, both airborne and liquid radioactive effluent discharges are expected to show generally decreasing trend from PS to LT (see Argument 1 in Section 2.3.4).
2.3.1. Modeling of Potential Compartments and Release Paths of RNs
RNs which are present in major SSCs of permanently shut down NPPs and releasable to the environment in either airborne or liquid effluent forms have been conceptualized together with potential discharge paths in this study (see Figure 1). Releases of fixed amounts of RNs being produced during operation, through specified compartments and paths, may enhance the homogeneity of airborne or liquid effluent stream (i.e., constant fraction of each RNs group present in), but for ventilation filtration system (see compartment ⑦) and liquid waste processing system (see compartment ⑧) which may remove parts of contaminants (i.e., , , , and ) selectively (see Argument 2 in Section 2.3.4).
Iodine radioisotopes in effluent are to be negligible even just one year after cessation of operation due to very short half-lives of major radioiodines from NPPs (e.g., half-lives of 131I and 133I are 8.02 days and 20.8 h, respectively). Only one radioiodine 129I having a very long half-life (i.e., 15.7 million years) may be continued to be released all through the decommissioning period, however, it is usually not accounted for under radioactive effluent control program at NPPs [12,32]. Generally major fission gases or noble gases have short half-lives as well except 85Kr (i.e., half-lives of 131mXe, 133Xe, 133mXe, and 85Kr are 11.9 days, 5.2 days, 2.2 days, 10.8 years, respectively), thereby only 85Kr being practically available for discharge during decommissioning period (see Arguments 3A and 3B in Section 2.3.4).
Main sources of RNs at the time of PS are to be spent fuel (SF) (i.e., compartment ②) and radioactive water (i.e., compartments ① and ③), from which radioactive effluent discharges would be continued until they are shipped out of spent fuel pool (SFP) or drained out. That is, handling of SF within the plant, either defueling (i.e., removal of SF from reactor core) or shipping out SF from SFP may cause release of RNs in airborne effluent (see Arguments 4 and 5 in Section 2.3.4). It is certain that drainage of radioactive water in the primary coolant or SFP may induce release of RNs in liquid effluent (see Argument 6 in Section 2.3.4).
Gross alpha ( or ), particulates or fission/activation products ( or ) existing in contaminated or activated SSCs (i.e., compartment ④ in Figure 1) can be suspended into the building atmosphere or rinsed out with wet decontamination agent in dismantling or decontamination of such SSCs, and subsequently discharged to the environment in either forms of airborne (i.e., in Figure 1) or liquid (i.e., in Figure 1) effluent (see Arguments 7A and 7B in Section 2.3.4).
As reflected in transfer rates and (see Figure 1), special attention should be paid to volatile RN tritium, since it can be partitioned into and present in airborne and aqueous phases through vaporization/condensation of tritiated water () and/or isotope exchange reactions exemplified as below [33]:
Accordingly, it can be postulated that both airborne and liquid tritium may be discharged at the same time with a correlation between their relative fractions discharged (see Argument 8 in Section 2.3.4).
2.3.2. Effect of Decommissioning Strategies and Activities on Radioactive Discharges
The IAEA has reported that a large reduction in radiological hazard is to be expected by carrying out transitional operations such as removal of fuel, drainage of circuits, cleaning, and decontamination [35]. In addition, it has been shown that the radiological hazard decreases rapidly for the immediate dismantling (or DECON) strategy where dismantling is conducted just after initial dismantling, while the hazard decreasing slowly during the safe enclosure period and then decreasing quickly through final dismantling for deferred dismantling (SAFSTOR) strategy [35].
It is noted that the above decommissioning activities reducing radiological hazard may increase the radioactive discharges if removed, drained, cleaned or decontaminated radioactivity is not contained/confined properly and released to the environment. Accordingly, a generalized radioactive effluent profile from PS to completion of dismantling has been proposed based upon the inference that decommissioning activities may lead discharges of radioactive effluent as shown in Figure 2. Moreover, the profile has been differentiated for immediate dismantling strategy from deferred dismantling options where most activated/contaminated SSCs are to be decayed during the safe enclosure period.
With respect to the characteristics of radioactive effluent from NPPs after PS, the whole decommissioning period including transitional phase can be divided as below (see Figure 2):
- Phase T: Transition phase in which SF is removed, primary circuits are drained, operational waste is conditioned, and cleaning and decontamination are conducted for both immediate and deferred dismantling. For deferred dismantling strategy, however, initial dismantling of some parts of the facility and early processing of some radioactive material and its removal from the facility, as preparatory steps for the safe storage of the remaining parts of the facility [35]. Hence, the radioactive discharges in Phase T are to be varied due to intermittent preparative measures such as drainage of circuits and defueling conducted (see Argument 9A in Section 2.3.4).
- Phase DI: Immediate dismantling phase in which SSCs are actively dismantled and decontaminated in a relatively short time, which may guarantee fluctuations of radioactive discharges in this phase (see Argument 9B in Section 2.3.4).
- Phase S: Safe enclosure phase for deferred dismantling strategy in which all or part of facility is placed or preserved in such a condition that it can be put in safe storage and the facility maintained until it is subsequently decontaminated and/or dismantled [36]. Stabilized and gradual decreasing trend of radioactive effluent due to radioactive decay under safe storage is expected for Phase S (see Argument 9C in Section 2.3.4).
- Phase DD: Final dismantling phase for deferred dismantling strategy in which SSCs are actively dismantled and decontaminated after safe enclosure phase. The same argument for fluctuations of radioactive discharges in Phase DI is applicable to Phase DD as well (see Argument 9D in Section 2.3.4).
2.3.3. Potential Change of Effluent Discharge Conditions during Decommissioning
With regard to liquid radioactive effluent, the concentration of a RN at a certain point in a receiving water body (e.g., exclusion area boundary of NPPs in Korea) are to be quantified and controlled in a few ways [37]. The general formulas for radioactivity concentration, offsite dose, and alarm set point of effluent monitor with regard to RN in liquid effluent can be obtained as follows. First, the concentration at Exclusion Area Boundary (EAB) or in drinking water ( in Bq/m3) can be calculated by:
where, is the concentration of RN in release tank (Bq/m3), is the release rate of RN in liquid effluent (Bq/y), is the liquid waste flow rate (m3/y), is the dilution water flow rate (m3/y), is the dilution factor . The offsite effective dose for age group through ingestion of RN ( in mSv/y) is defined:
where, is the ingestion rate of contaminated drinking water (m3/y), is the effective dose coefficient for ingestion of RN (Sv/Bq). In addition, the alarm set point of liquid effluent monitor for single RN ( in Bq/m3) can be calculated by:
where, is the Effluent Control Limit (ECL) for RN in liquid effluent (Bq/m3).
It is noted that non-radiological parameters such as flow rates of liquid waste and dilution water may affect the compliance with the respective discharge limits and the alarm setpoint of liquid effluent monitor. The flow rate of dilution water () supplied by pumps for cooling water (e.g., condenser cooling water, circulating water, etc.) is anticipated to become much lower during decommissioning than in operational phase since required heat removal capability of the plant will be drastically reduced after PS of the reactor, while the liquid waste flow rate () may be much more varied in decommissioning phase compared to the operation period [38] (see Argument 10 in Section 2.3.4).
Accordingly, actual cases where liquid effluent discharge conditions have been changed during decommissioning can be found by reviewing the effluent data from decommissioning NPPs collected (see Section 2.1) in order to bring up potential safety insights induced by generally decreasing and variable .
On the other hand, similar considerations have not been proposed for airborne radioactive effluent in this study, since the concentrations of airborne RNs in the atmosphere around NPPs are controlled by natural phenomena such as atmospheric dispersion coefficient which is not to be affected by cessation of operation of NPPs [39].
2.3.4. Major Arguments from Source Term Modeling
Based upon the source term models developed in this study as above, major arguments for the anticipated characteristics of radioactive effluent discharges after permanent cessation of NPPs operation can be summarized as given in Table 4.
3. Results and Discussion
3.1. Results of Mann-Kendall Trend Test for Radioactive Efflunet after Permanent Shutdown
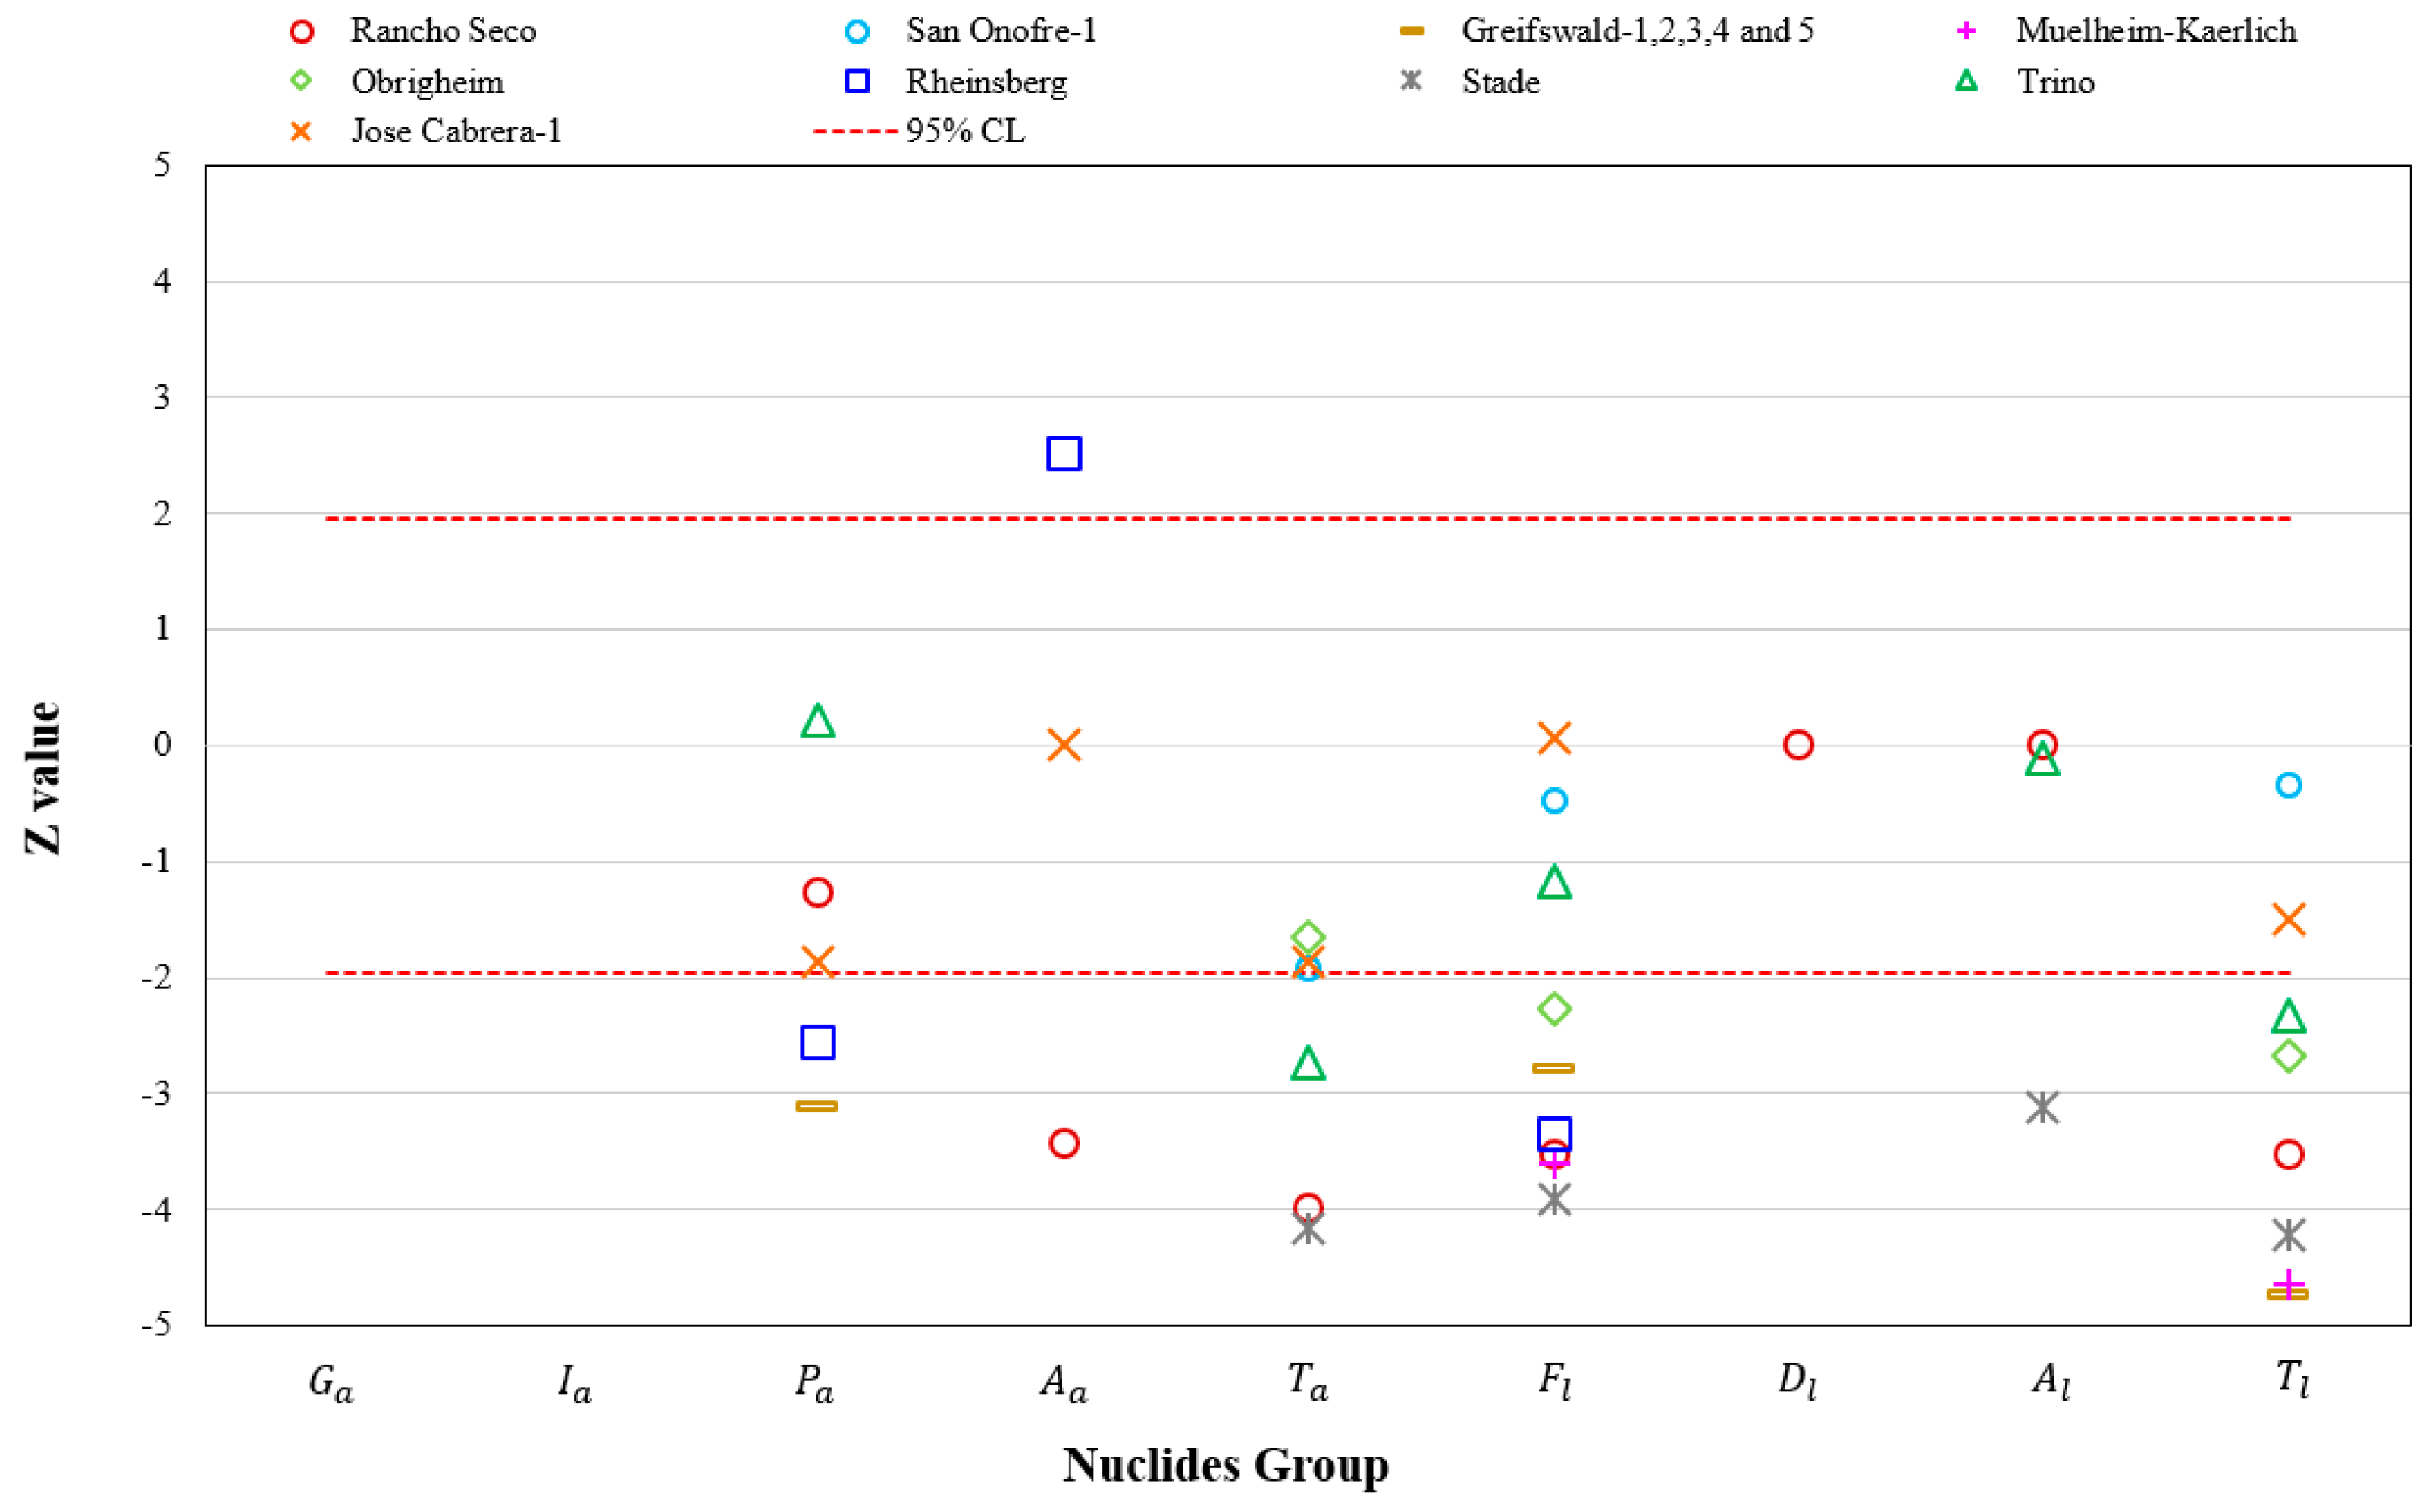
The trend of effluent discharge has been analyzed quantitatively using Mann-Kendall test (i.e., Type analysis in Table 2). The Mann-Kendall test introduced in Section 2.2 has been applied for a totally of 25 NPP units listed in Table 2 depending on the sample size of available effluent data collected. Figure 3 shows values of discharged RNs or their groups from 13 NPPs for which annual effluent data are available for longer than 10 years (i.e., sample size ), which are calculated using Equation (3) with 95% confidence levels. It is noted that the plots are actually depicted for nine units since effluent data for five units at the Greifswald site have been reported together in the Radiation Protection Report published by the European Commission [20,21,22].
A positive value could imply an increasing trend to a certain extent, however, its increasing tendency can be confirmed with 95% of confidence level only if it exceeds the upper red dotted line (i.e., value of +1.96) in Figure 3. Likewise, negative values lower than −1.96 can be determined to have a statistically decreasing trend with 95% confidence level. As a whole, just 1 plot is higher than of +1.96 and 19 plots are lower than of −1.96, while values of 15 plots being distributed between them. It can be concluded with 95% confidence level that the majority of effluent data (i.e., 54.29% of total data plots) represent downward tendencies, 42.86% of total 35 data plots show no specific trends and the remaining plot shows an increasing trend even after PS of NPPs.
The variance of value of each group of RNs calculated for nine plants ranges from 0.26 (Stade) to 1.72 (Trino), while those for Rancho Seco and Reinsberg are relatively high at 3.14 and 10.11, respectively. Major dismantling work (i.e., removal of steam generator and pressurizer, segmentation of reactor pressure vessel and its internal, shipment of dismantled components, etc.) has been conducted at the Rancho Seco NPP from 1999 (i.e., after 10 years from its PS) to 2009 when its license was terminated [40]. For the given period, annual radioactive effluent discharges of , , and have been varied within the ranges of about 8, 27, and 57 times of its minimum, respectively. Furthermore, the ranges of annual liquid effluent discharges of and are much wider such as 106 and 105 times of its minimum, respectively. The unique apparently increasing trend of airborne gross alpha activity for Rheinsberg may be attributed to some decommissioning activities as well, however, further reasoning is not possible due to unavailability of relevant specific information.
On other hand, plots of values for airborne tritium versus liquid tritium discharged from six NPPs where both airborne and liquid tritium effluent data are available are shown in Figure 4. The plots are approximated quite well by a linear regression equation with a coefficient of determination (i.e., R2 = 0.63), which conforms to the statement on partitioning of tritium between airborne and aqueous phases through vaporization/condensation and isotope exchange reactions as addressed in Section 2.3.1 (see Argument 8 in Table 4).
For the other 12 NPP units whose sample size of effluent data is equal to or lower than 10, the Mann-Kendall trend test has been conducted by reading p-values in a statistical table with a given sample size () and the statistic () calculated from Equation (2) [27]. Though calculated p-values of discharged RNs groups from 12 plants are not depicted in this paper, the variance of p-values resides between 0.002 and 0.051. About 91% of respective effluent data show no trend under 95% of confidence level, and about 6% and 3% of data have decreasing and increasing trends, respectively. No further analysis has been conducted for the case of small sample size (i.e., ≤ 10).
3.2. Qualitative Analysis of Radioactive Effluent after Permanent Shutdown
A series of qualitative analysis has been conducted for the annual effluent releases from NPPs with actual information mainly on each plant’s strategy, stage and actions of decommissioning mainly based upon 15 Arguments derived from source term modeling proposed in this study (see Table 4). It is noted that the qualitative analysis is applicable to 23 NPP units for which sufficient effluent data and specific decommissioning information are available, and the results for seven NPPs representing the characteristics of radioactive effluent discharges from decommissioning plants have been thoroughly discussed in this section.
3.2.1. Characteristics of Airborne Radioactive Effluent Discharge
In order to verify the general trend of airborne radioactive effluent during decommissioning period, the radioactive effluent discharges from completely decommissioned NPPs (i.e., Haddam Neck, Maine Yankee, Rancho Seco, and Yankee NPS) have been analyzed from PS to LT. As a result, the ratio of annual radioactive effluent released in the year of license termination to that released in the last operation year prior to PS ranges from 8.6 × 10⁻⁴ to 3.7 × 10⁻³, 2.1 × 10⁻⁴ to 7.8 × 10⁻⁴, 9.7 × 10⁻⁶ to 3.3 × 10⁻², and 3.7 × 10⁻⁶ to 4.8 × 10⁻² for Haddam Neck, Maine Yankee, Rancho Seco, and Yankee NPS, respectively [3,25]. Even if the specific effluent data are not depicted in this paper, the generally decreasing trends of radioactive effluents all through the decommissioning period of the decommissioned NPPs support Argument 1 in Table 4.
Discharges of after PS are not reported for 19 out of the total 28 NPP units of concern, while having been identified in airborne effluent from eight plants after 1 to 7 years from PS. Only relatively long-lived fission gas 85Kr has been reported to be discharged after PS from six out of eight plants (except Stade and Rancho Seco where nuclide-specific effluent data are not available for the period). From San Onofre-1, (i.e., 85Kr, 131mXe, and 133Xe) was discharged until just next one year after PS, and no releases of fission gases have been reported thereafter. All of which conform to Argument 3B in Table 4 addressing no release of short-lived fission gases (except 85Kr) in a very short period after PS. Contrary to Argument 3B, however, it has been reported that (only 85Kr) was discharged 2001 to 2018 during dismantling activities even after 5 years from PS, which could be ascribed to the potential failure of SF cladding if any.
With regard to , only 131I has been reported to be discharged from San Onofre-1 until just one year after PS, while no releases of have been profiled in the radioactive effluent data for remaining 27 units of NPPs of concern. No release of short-lived radioiodines (except 129I) in a very short period after PS observed as above fully supports Argument 3A in Table 4.
On the other hand, Figure 5 shows the annual radioactive effluent discharges of RNs groups from four NPPs such as Crystal River-3, Kewaunee, Rancho Seco, and Trino, where specific dismantling activities have been well documented. For instance, shipping out all SF from SFP to separate storage installations outside of the plants have been reported to be conducted at Crystal River-3 (in 2018), Kewanee (in 2017), Rancho Seco (in 2002), and Trino (2011 to 2015) [3,40,41,42].
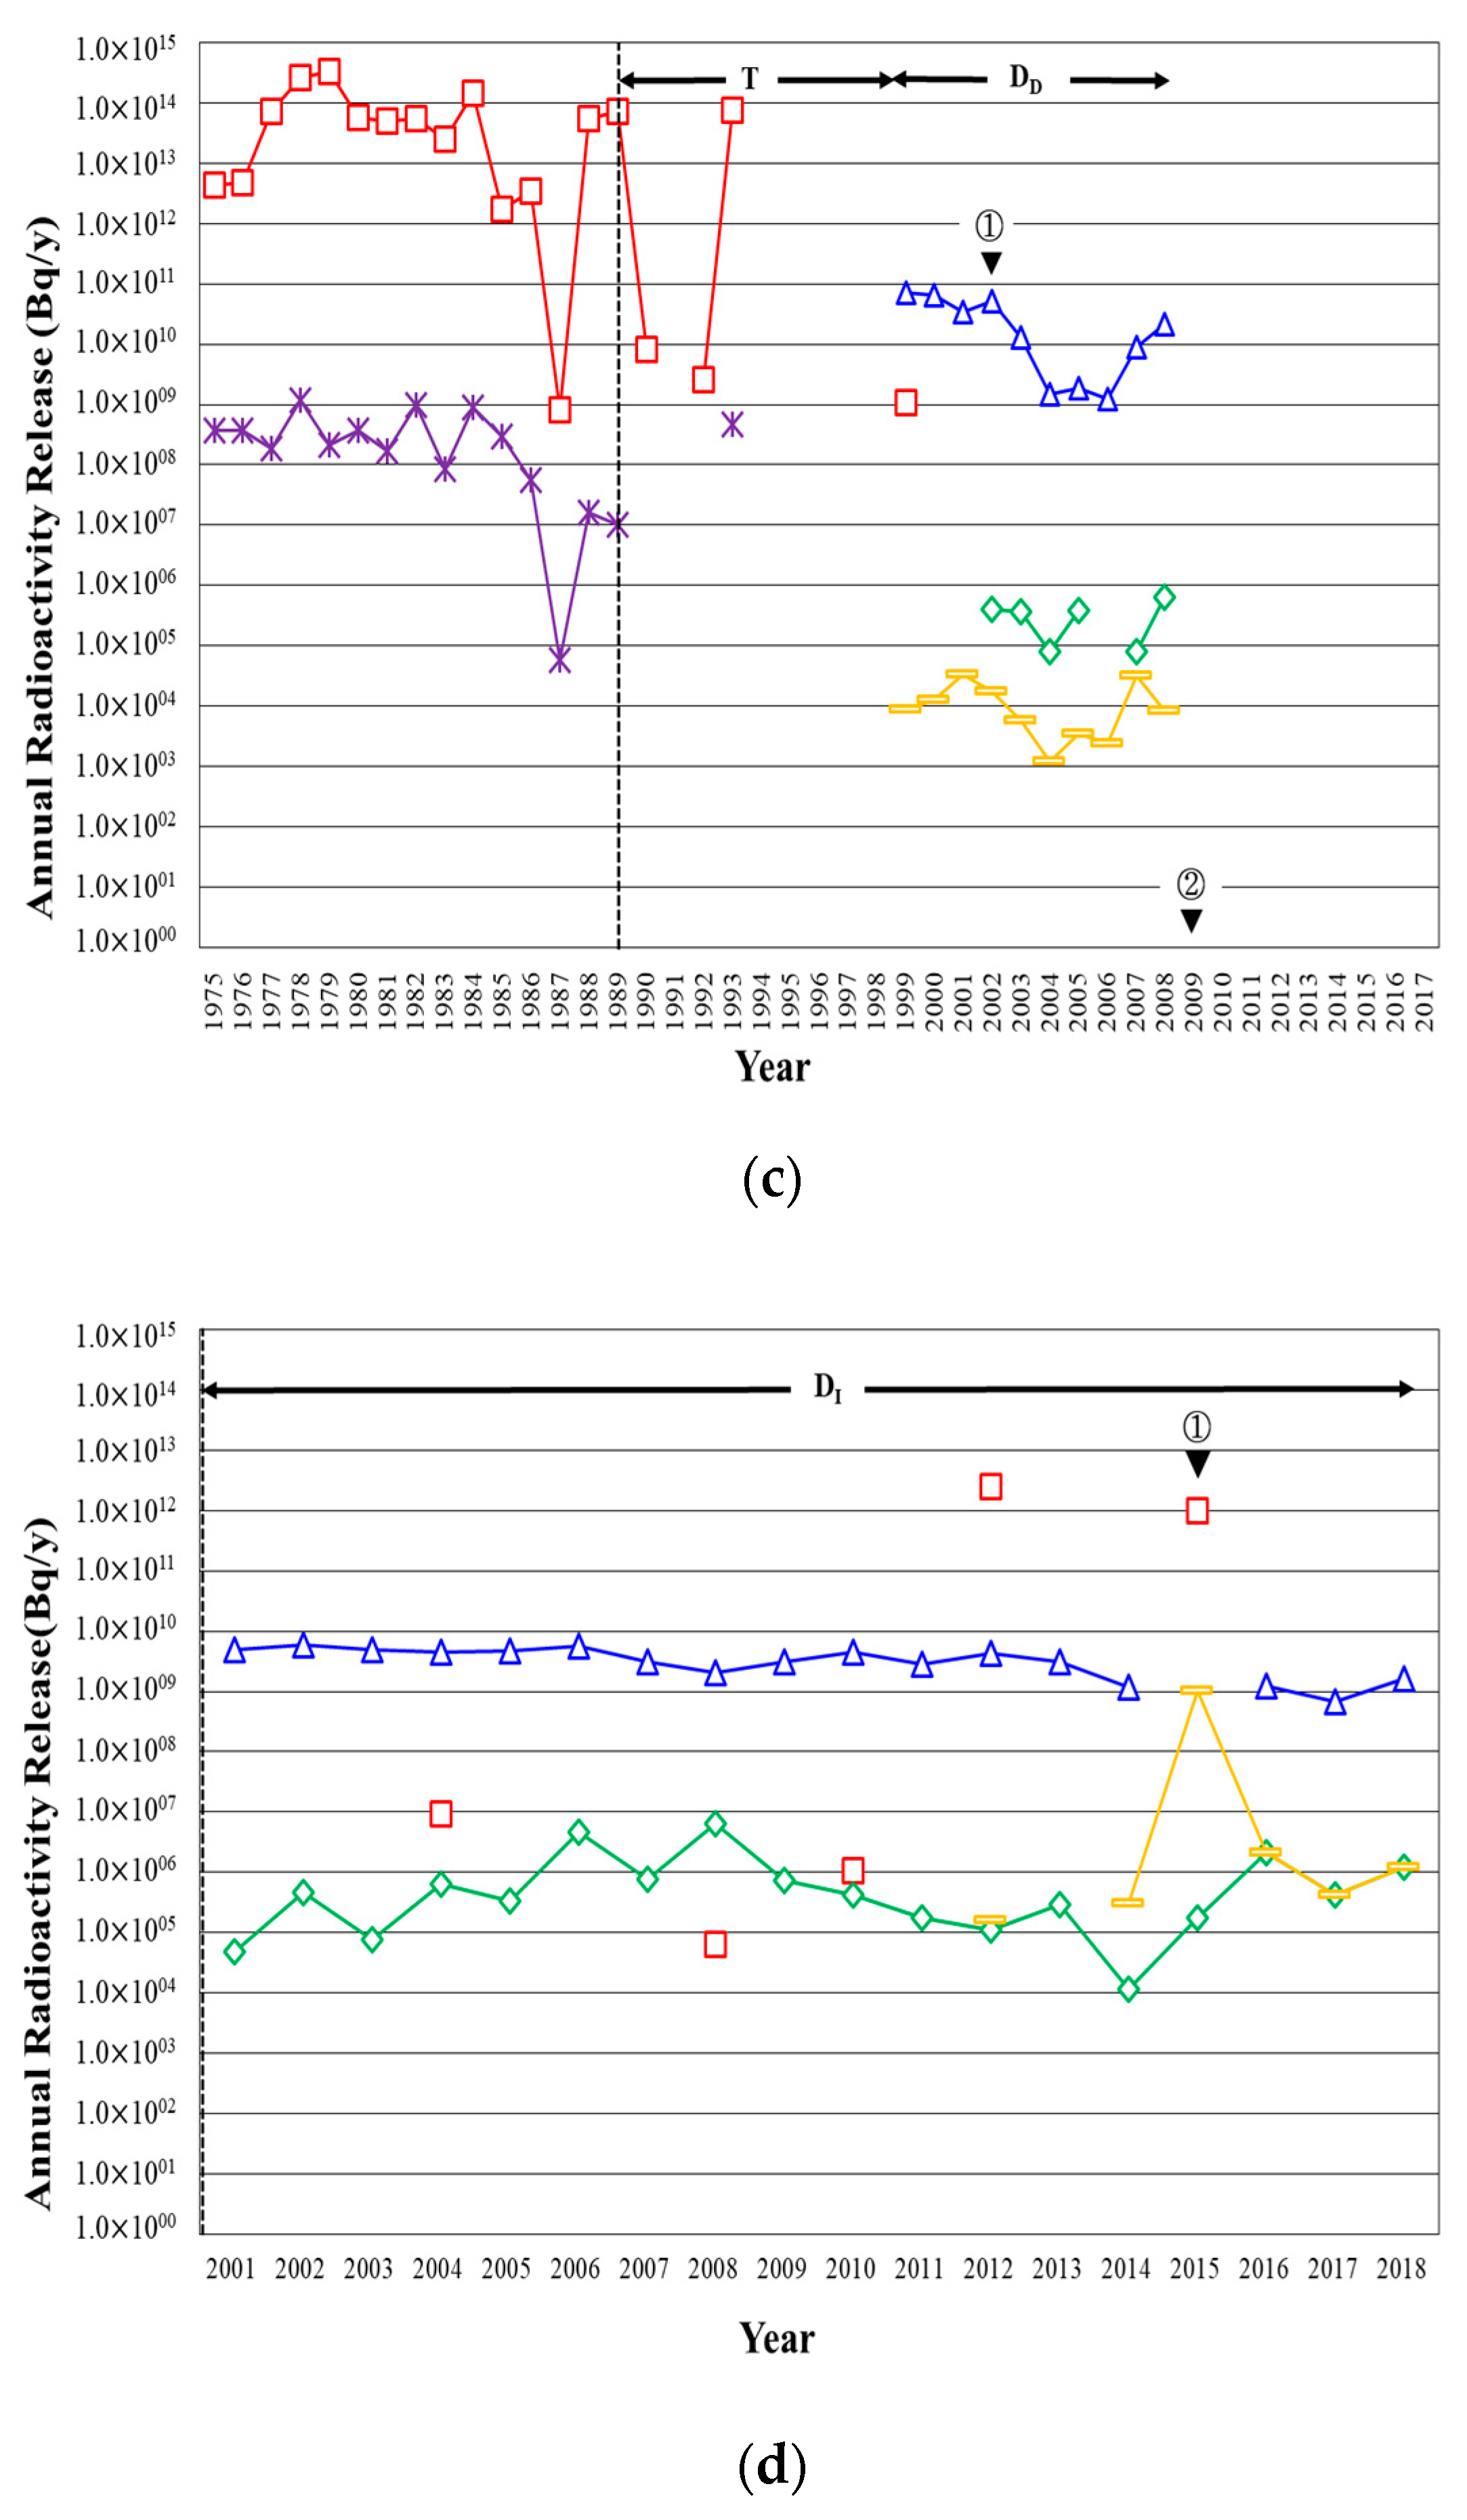
During the above period of handling of SF, has been commonly increased from all four plants, while airborne discharges of and have been additionally increased from Trino NPP, which supports Argument 5 in Table 4. The variations of types of non-tritium RNs increased due to shipping out SF could be affected by the integrity of SF handled. The period of transferring operations of SF can be categorized into the transitional phase (Phases T or DD) as specified in Figure 2, and the increase of radioactive discharges during the period supports Arguments 9A and 9D in Table 4.
In addition, increased discharges of , , and from Rancho Seco in 1999 to 2008 can be explained by reported dismantling work such as removal of steam generators and pressurizer, which can be considered to be conducted in the final dismantling stage (i.e., Phase DD) and supports Argument 9D in Table 4 [40]. On the other hand, the discharge of , , and are even decreased in 2004 and 2006 for which segmentation and segmentation of pressure vessel internal have been reported. The effluent data not compatible with Argument 7A could be partly attributed to high decontamination factor ( in Table 3) of the ventilation exhaust filter (see Figure 1), though further detailed analysis is not possible due to the limited information.
The effluent data for Trino NPP, which was permanently shut down in 1990 and then SF was removed in 1992, are available only for the final dismantling phase (Phase DI) from 2001 to 2018 in which various dismantling activities such as removal of fuel loading crane, anti-missile shield, and other components has been reported [42]. Argument 9B in Table 4 can be supported by the variations of effluent data for the period, especially airborne gross alpha activity intermittently released within a wide range (i.e., over order of 107) of annual radioactivity discharges.
3.2.2. Characteristics of Liquid Radioactive Effluent Discharge
Annual discharges of liquid radioactive effluent from four NPPs completely decommissioned (i.e., Haddam Neck, Maine Yankee, Rancho Seco, and Yankee NPS) have been analyzed from PS to LT in order to identify the general trend. The ratio of liquid radioactive effluent discharged in the year of license termination to that discharged in the last operation year prior to PS lies in zero to 3.7 × 10⁻³, 7.8 × 10⁻⁴ to 2.1 × 10⁻⁴, 9.7 × 10⁻⁶ to 3.3 × 10⁻², and 3.7 × 10⁻⁶ to 4.8 × 10⁻² for Haddam Neck, Maine Yankee, Rancho Seco, and Yankee NPS, respectively. The general downward trends of liquid radioactive effluents from PS to LT of the decommissioned NPPs support Argument 1 in Table 4 as well.
Correlations between and for 21 plants where relevant effluent data are available were calculated, which shows that the correlation for some plants such as San Onofre-1 and Kewaunee is very high (i.e., R2 = 0.99), while average and minimum R2 among 21 plants being around 0.34 and 0.002 (for Biblis-A), respectively. The very high correlation of and can be interpreted by the argument on enhanced homogeneity of composition of RNs in effluent streams after PS (i.e., Argument 2 in Table 4). In addition, the lowered correlation of and in other plants could be attributed to the performance of liquid waste processing system (i.e., Compartment ⑧ in Figure 1) which is generally higher to fission/activation products than to liquid tritium.
On the other hand, only one unit of San Onofre-1 out of total 28 PWR units discharged dissolved fission gases (85Kr and 131mXe) even after PS, while was not detected in liquid effluent after PS of the other 27 plants, which supports Argument 3B in Table 4 again.
Figure 6 depicts the annual radioactivity release in liquid effluent before and after PS of 4 NPPs including Crystal River-3, Haddam Neck, Stade, and Jose Cabrera, which show representative characteristics of liquid radioactive effluent during decommissioning. Increments of , and are observed at Haddam Neck (2004, 2006), Stade (2005~2006), and Jose Cabrera (2014), for which various dismantling activities such as building demolition and removal of reactor pressure vessels/pressurizers have been reported [43,44]. Moreover, the reported periods of increasing liquid discharges from three of the plants can be categorized into Phase DI (see Figure 2). The above observations are supported by Arguments 7B and 9B in Table 4.
The drainage of SFP at Crystal River-3 conducted in 2018 is interpreted to induce an increase of and around the same period as supported by Argument 6 in Table 4 [3]. Contrary to Argument 6, however, discharges of and from Jose Cabrera NPP decreased around 2015 and 2016 in which surface decontamination in the containment and auxiliary buildings have been undertaken [44]. Reduction of fission/activation products including gross alpha activity in liquid effluent under active dismantling work could be attributed to the potentially high performance of liquid waste processing system (i.e., Compartment ⑧ in Figure 1).
Though the IAEA pointed out the possibility of additional radionuclides (e.g., alpha emitters) being discharged from decommissioning NPPs that were not present in routine discharges during normal operation, the statement could not be verified in this study due to the limited availability of and uncertainty in interpretation of blank fields of old effluent database [7].
3.3. Implications of Varying Discharge Conditions of Liquid Effluent
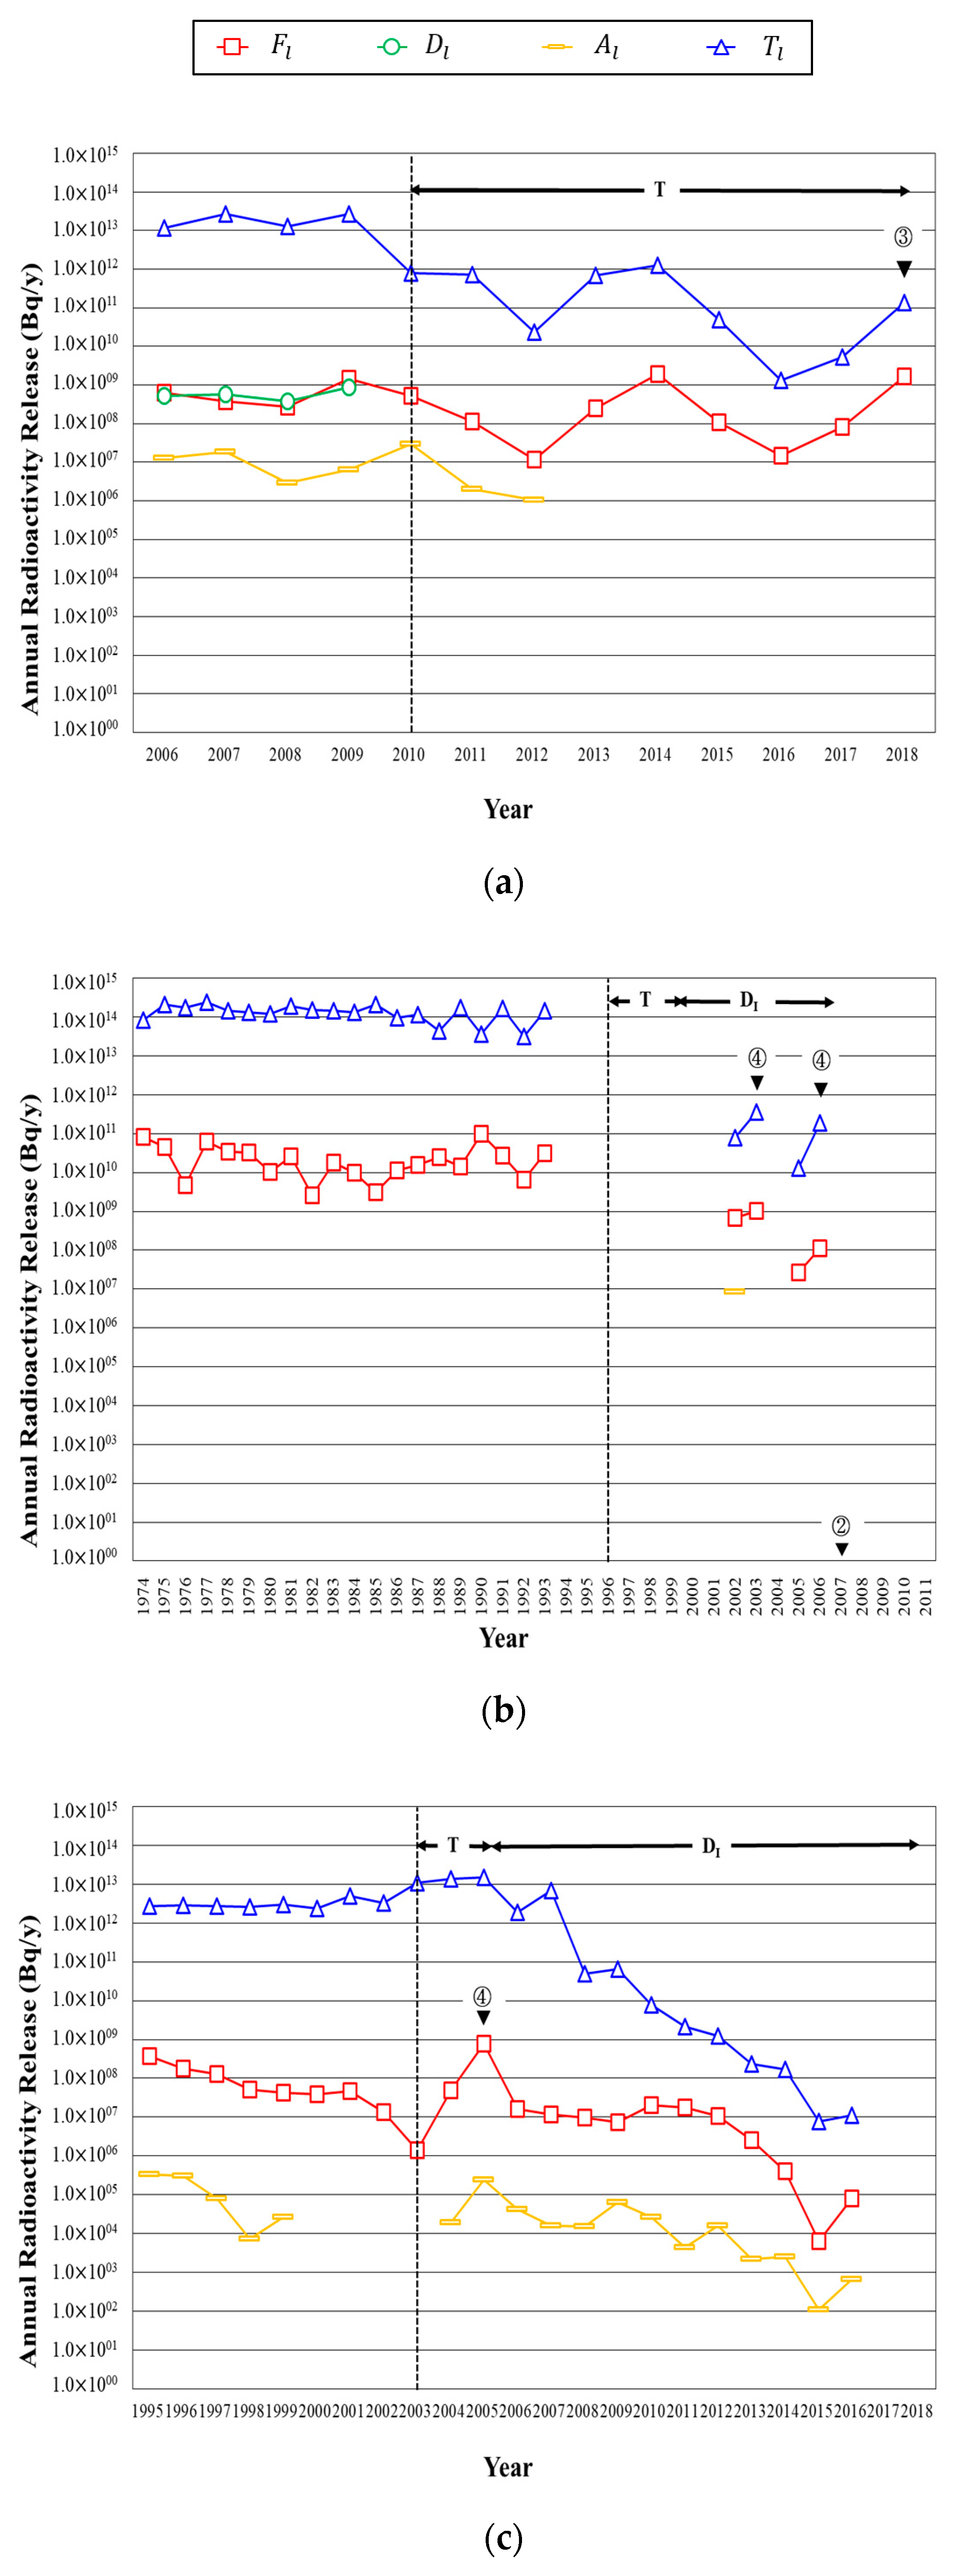
The effect of changing discharge conditions on the effluent discharge has been investigated for five PWR units (Type analysis in Table 2). In order to verify the inference on the potential effect of varying liquid effluent discharge conditions on the radiological effect to the public, the flow rates of liquid waste and dilution water reported in the ARERRs of decommissioning PWRs in the United States (US) have been collected and the dilution factor () are calculated using Equation (8). Figure 7 shows presentative variations of flow rates of liquid waste () and dilution water () together with dilution factors for five units of four NPPs in the US as: Kewaunee, San Onofre-2 and 3, Fort Calhoun, and Crystal River-3.
The dilution flow rate tends to decrease after permanent shutdown in three NPPs except Crystal River-3, where the dilution flow is almost kept the same even after cessation of its operation. The liquid waste flow rate generally decreases at all four NPPs, however, its temporal increase is observed in Crystal River-3, and San Onofre-2 and 3.
As a whole, the ratio of minimum dilution factor after permanent shutdown to average dilution factor in operation period shown in Figure 7 for each NPP ranges from 0.002 (Fort Calhoun) to 0.04 (San Onofre-2 and 3). The reduced dilution water flow rate at decommissioning NPPs, which is supplied by cooling water pumps, can be attributed to the fact that required heat removal capability of the plant will be drastically reduced after permanent shutdown of the nuclear reactor. Furthermore, it can be generally anticipated that the liquid waste flow rate is to be reduced during decommissioning compared to operation period when various liquid radioactive waste streams are continuously produced [38]. As such, the generally decreasing dilution factor after permanent shutdown can be rationalized. The potential reduction of dilution factor at decommissioning NPPs may cause higher concentrations of RNs in receiving water body and thus higher radiation dose to the public in the vicinity of NPPs even for the same radioactivity released to the environment, while the alarm set point of liquid effluent radiation monitor should be lowered as implied in Equations (8) to (10).
Even after permanent shutdown, however, a certain amount of liquid waste can be temporally produced from drainage of radioactive system fluids such as reactor coolant and spent fuel pool water or decontamination activities adopting wet process [45]. The increased liquid waste flow rate at Crystal River-3 from 2017 to 2018 can be ascribed to the decommissioning operations such as release of SFP water after shipment of SF to onsite dry storage as reported by the operator in the ARERR for 2018 [3].
3.4. Interpretation of Effluent Data after Permanent Shutdown to Termination of Monitoring Program
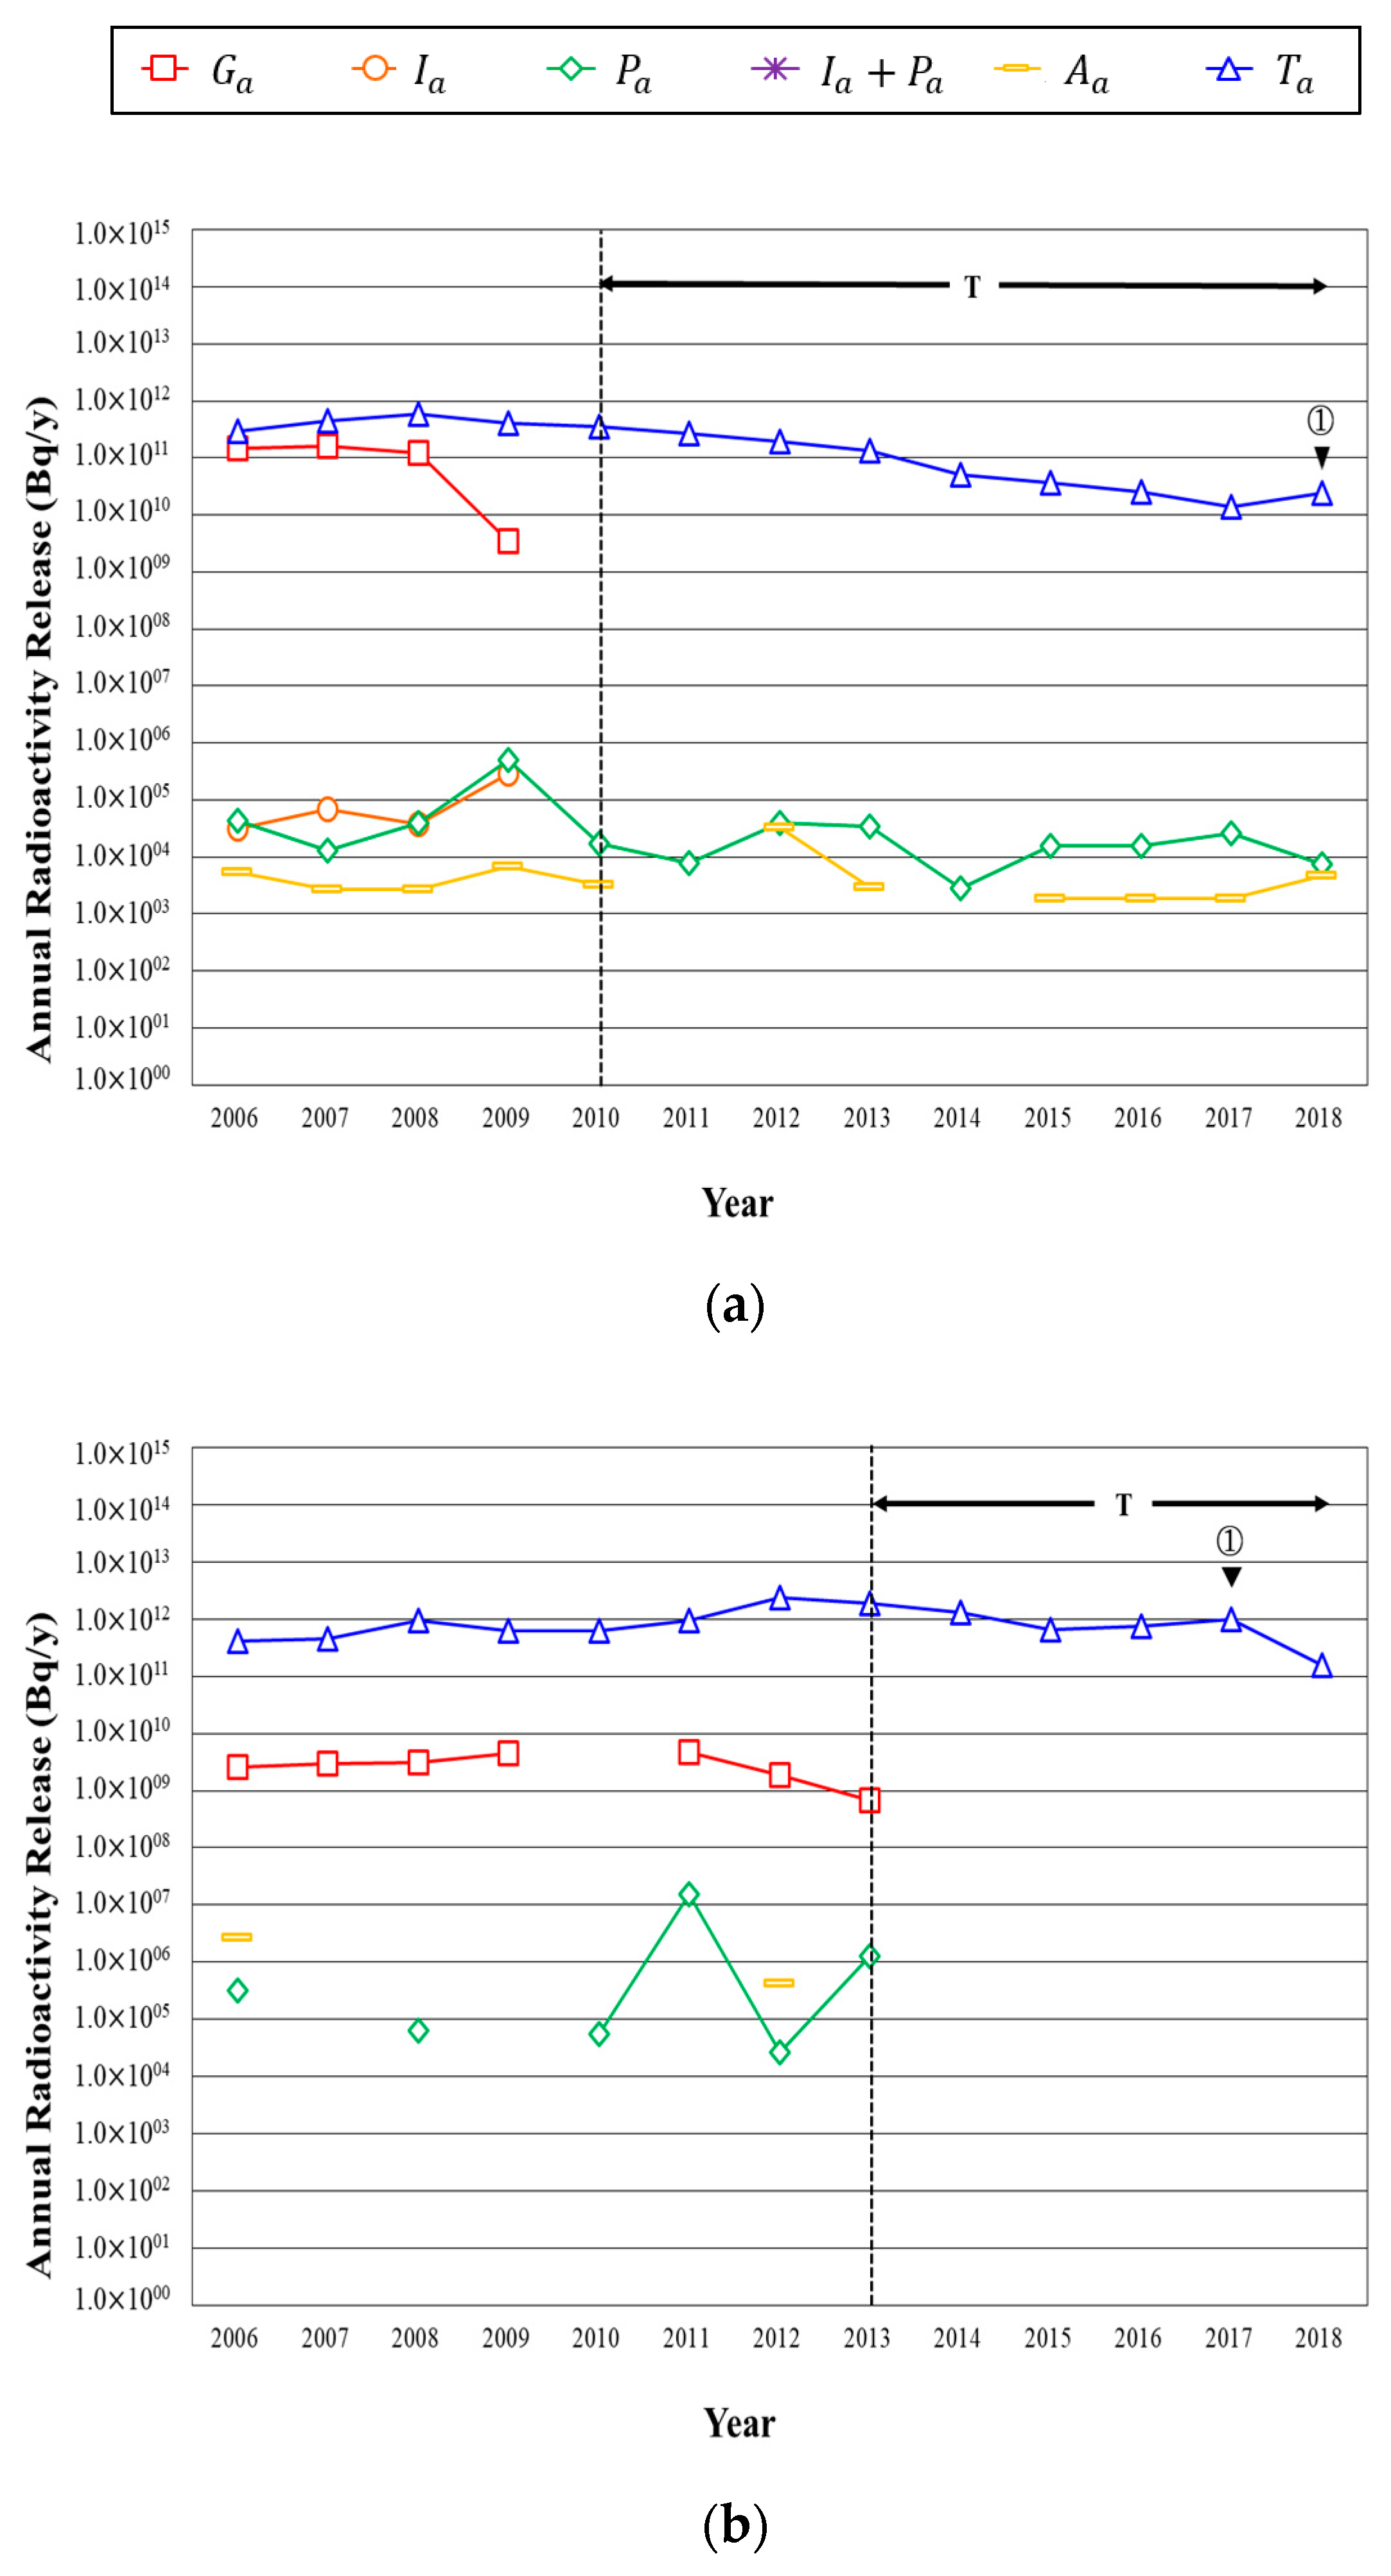
In this section, the radioactive effluent from San Onofre-1 has been interpreted by the source term models established in this study, all through its permanent shutdown, transition, and decommissioning phases until its effluent monitoring programs are terminated. The decommission-related history of San Onofre-1 which began its commercial operation on 1 January 1968 and permanently shut down on 30 November 1992 after approximately 24 years of operation is summarized in Table 5 [46].
The annual effluent data of airborne and liquid radioactive discharges from San Onofre-1 in 1974 to 2006 are collected and plotted as shown in Figure 8. After the permanent shutdown, the airborne tritium () discharge has been reduced by about 0.02 times when major airborne release is terminated, while the liquid tritium () and fission/activation products () having been reduced about 10−4 times all through the decommissioning process.
After permanent shutdown, the trend of tritium turns out to be almost linearly correlated to that of gross alpha in annual airborne discharges (i.e., R2 of the linear regression equation = 0.916), while fission/activation products and tritium in liquid effluent showing a linear correlation (i.e., R2 = 0.995) as well. Even if gross alpha activity also shows an annual trend analogous to fission/activation products or tritium in liquid effluent, it has been less frequently reported after permanent shutdown. Correlation of trends in other RN groups are not able to be determined since they have not been frequently identified in effluents during decommissioning. Furthermore, the higher correlations of those RN groups in airborne or liquid effluent streams after permanent shutdown can be ascribed to the source term model proposed in Section 2.3 (Argument 2).
During the transitional period (i.e., typically 1 to 5 years after permanent shutdown; approximately 1993 to 1997/1978) in preparation of SAFSTOR (or deferred dismantling) strategy, it has been reported that defueling of SF from the reactor core to SFP was completed in March 1993, and reactor coolant and other primary systems were drained by 1998 (see Phase T in Figure 2) [46]. With regard to airborne effluent, discharge of fission gases and short-lived radioiodine (i.e., 131I) was reported just once in 1993, which can be attributed to completion of the defueling operation. Dissolved noble gases in liquid may come from the process handling SF for defueling. Besides, the intermittent increase of tritium and fission/activation products in liquid effluent can be attributed to the drainage of primary systems. It is noted that the batch release of liquid waste was not committed in 1994, however, 23 and five instances of batch release were reported in 1993 and 1995, respectively, as communicated by the operator in the ARERR for 1994 [3].
The safe storage after transition period for SAFSTOR (i.e., Phase in Figure 2) is not so definite in Figure 8, however, since the decommissioning strategy of San Onofre-1 has been shifted from SAFSTOR to DECON (or immediate dismantling) as specified in the first Post Shutdown Decommissioning Activities Report (PSDAR) in 1998 [47]. Accordingly, the transition period (Phase T in Figure 2) can be interpreted to be just followed by the active dismantling period (Phase in Figure 2) in the source term model proposed in this study. As introduced in Table 5, a series of dismantling and decontamination activities including removal and segmentation of large components have been conducted since 1999 to 2002 [47]. The slight increase of airborne tritium and gross alpha, and relatively rapid moving up of liquid tritium and fission/activation products around 1999 to 2002 in Figure 8 can be attributed to such decommissioning activities. Airborne particulates which have not been released since 1994 started to be detected from 2001 and liquid gross alpha have been newly detected from 2001, which can be interpreted in a similar way.
The characteristics of radioactive discharges from permanent shutdown San Onofre-1 for all the above radionuclides groups can be analyzed by source term modeling, Mann-Kendall trend test, and qualitative analysis conducted in this study. As proposed in Argument 6 of the source term model, considerably increasing discharge of liquid tritium, gross alpha, and fission/activation products in 2004 and 2005 is ascribed to the drainage of SFP water after transferring of SF to onsite Independent Spent Fuel Storage Installation (ISFSI) [47]. The declined airborne tritium release in 2004 (never reported afterwards) conforms to the reduction of potential airborne radioactive inventory by removing SF out of fuel storage building to the onsite ISFSI and subsequent drainage of SFP water (see Argument 4 and 5 of the source term model). Temporal detection of fission gases in 2004, which has not been discharged since 1994, is to be originated from stored SF with failed cladding if any, while it being handled for shipment. The slight rising of airborne tritium and particulates in 2006 may come from dismantling of fuel storage building.
4. Conclusions
A series of source term models of radioactive effluent after PS has been established based upon eight compartments and potential release paths (e.g., primary coolant, spent fuel, SFP, building atmosphere, ventilation filter, etc.) representing an NPP after PS. Taking into additional consideration of strategies and stages of decommissioning of the NPP, the source term models are expressed in terms of 15 arguments as: generally decreasing trend of effluent from PS to LT (Argument 1); Enhanced homogeneity of effluent (2); No release of short-lived radioiodides (3A) and fission gases (3B); Enhanced release of airborne RNs with defueling (4) and SF shipment (5), and liquid RNs drainage of primary coolant or SFP water (6); Release of airborne RNs with dry processes (7A) and liquid RNs with wet processes (7B); High correlation between airborne and liquid tritium releases (8); High variations of releases in Phase T (9A) and in Phase DI (9B), gradual decreasing in Phase S (9C), and high variations in Phase DD (9D); Much variable waste water flow and generally decreasing dilution water after PS (10).
The variability of radioactive effluent from decommissioning PWRs worldwide has been quantitatively demonstrated using Mann-Kendall trend test where annual radioactive discharges show a decreasing trend only in 54% and 6% (at 95% CL) of collected plant data whose sample size () is >10 and ≤10, respectively. No statistically distinct or even increasing trend of annual discharges after PS in 46% and 94% of collected data, and high variance of value plant by plant ranging from 0.26 to 10.11 conform to the proposed source term models identifying temporal increase of effluent along with specific decommissioning activities being conducted at the plant. Furthermore, significant correlations between respective effluent data have been identified through quantitative analysis as anticipated in Arguments 2 and 8 of the source term models: airborne vs. liquid tritium discharges; fission and activation products vs. tritium in liquid effluent; and tritium and gross alpha in airborne effluent.
Through a series of qualitative analysis of radioactive effluent data from PWRs after PS, the feasibility and applicability of the source term models have been verified. All through the decommissioning period the radioactive effluent decreases in general (Argument 1), while short-lived fission gases or radioiodides except 85Kr and 129I not being reported to be discharged from just one year after PS (Arguments 3A and 3B). As anticipated in Arguments 4, 5, 6, 7A, 7B, 9A, 9B, and 9D, enhanced releases of respective radionuclides in connection with specific activities have been observed in the actual radioactive effluent data collected and profiled in this study. The radioactive effluent from San Onofre-1 has been successfully interpreted by the source term models all through its lifetime from operation, permanent shutdown, transitional phase, and decommissioning until its effluent monitoring program is terminated.
As inferred from Argument 10, moreover, it turns out that the actual dilution factor for liquid effluent from NPPs tends to decrease (i.e., the minimum dilution factor after PS lies between 0.2 and 4% of that for operational average) due to less required heat removal capability after PS. Accordingly, a safety implication is proposed that the alarm set point of liquid effluent radiation monitor at decommissioning NPPs may be lowered after PS since higher concentrations of RNs in receiving water body and thus higher radiation dose to the public even for the same radioactivity discharged.
The source term models and characteristics of radioactive effluent after PS of NPPs developed and identified in this study can be used to establish more efficient discharge monitoring program for decommissioning authorization, and to minimize the radioactivity to be released after PS in accordance with ALARA principle, which may ultimately contribute to improve the public acceptance of the safety of decommissioning of NPPs.
Author Contributions
J.H.C. provided the main idea of the study; J.S.K. performed the model validation and analyzed the data; J.S.K wrote the original draft; J.H.C. reviewed and edited the draft. All authors have read and agreed to the published version of the manuscript.
Funding
This work was supported by the Nuclear Safety Research Program through the Korea Foundation Of Nuclear Safety (KOFONS), granted financial resource from the Nuclear Safety and Security Commission (NSSC), Republic of Korea (Grant number: 1605008). This work was supported by “Human Resources Program in Energy Technology” of the Korea Institute of Energy Technology Evaluation and Planning (KETEP), granted financial resource from the Ministry of Trade, Industry & Energy, Republic of Korea (Grant number: 20184030202170).
Conflicts of Interest
The authors declare no conflict of interest.
References
- International Atomic Energy Agency. Nuclear Power Reactors in the World; Reference Data Series No.2; IAEA: Vienna, Austria, 2019. [Google Scholar]
- Volk, R.; Hübner, F.; Hünlich, T.; Schultmann, F. The future of nuclear decommissioning–a worldwide market potential study. Energy Policy 2019, 124, 226–261. [Google Scholar] [CrossRef]
- Duke Energy. Crystal River Unit 3-2018 Annual Radioactive Effluent Release Report; USNRC: Washington, DC, USA, 2019. [Google Scholar]
- Canadian Nuclear Safety Commission. Radioactive Release Data from Canadian Nuclear Power Plants 2001-10; CNSC: Ottawa, ON, Canada, 2012.
- Nuclear Regulation Authority. Radiation Management Report on Nuclear Facilities in 2017; NRA: Tokyo, Japan, 2018.
- International Atomic Energy Agency. Radiation Protection and Safety of Radiation Sources: International Basic Safety Standards; General Safety Requirements No. GSR Part 3; IAEA: Vienna, Austria, 2014. [Google Scholar]
- International Atomic Energy Agency. Regulatory Control of Radioactive Discharges to the Environment; General Safety Guide No. GSG-9; IAEA: Vienna, Austria, 2018. [Google Scholar]
- United States Nuclear Regulatory Commission. Generic Environmental Impact Statement on Decommissioning of Nuclear Facilities: Regarding the Decommissioning of Nuclear Power Reactors; NUREG-0586; USNRC: Washington, DC, USA, 2002; Volume 1, Supplement 1.
- United States Nuclear Regulatory Commission. Measuring, Evaluating, and Reporting Radioactive Material in Liquid and Gaseous Effluents and Solid Waste; Regulatory Guide 1.21, Revision 2; USNRC: Washington, DC, USA, 2009.
- Environment Agency. Monitoring of Radioactive Releases to Atmosphere from Nuclear Facilities; Technical Guidance Note M11; EA: London, UK, 1999. [Google Scholar]
- Environment Agency. Monitoring of Radioactive Releases to Water from Nuclear Facilities; Technical Guidance Note M12; EA: London, UK, 1999. [Google Scholar]
- Nuclear Safety Standards Commission. Monitoring the Discharge of Radioactive Gases and Airborne Radioactive Particulates, Part 1: Monitoring the Discharge of Radioactive Matter with the Stack Exhaust Air During Specified Normal Operation; KTA 1503.1; KTA: Salzgitter, Germany, 2016. [Google Scholar]
- Nuclear Safety Standards Commission. Monitoring and Assessing the Discharge of Radioactive Substances with Water; KTA 1504: Salzgitter, Germany, 2017. [Google Scholar]
- Jason, T.; David, W. Radiological effluents released by U.S. commercial NPP from 1995–2005. Health Phys. 2008, 95, 734–743. [Google Scholar]
- Kong, T.Y.; Kim, S.Y.; Lee, Y.J.; Son, J.K.; Maeng, S.J. Radioactive effluents released from Korean nuclear power plants and the resulting radiation doses to members of the public. Nucl. Eng. Technol. 2017, 49, 1772–1777. [Google Scholar] [CrossRef]
- HOLTEC. Notification of Revised Post-Shutdown Decommissioning Activities Report and Revised Site-Specific Decommissioning Cost Estimate for Oyster Creek Nuclear Generating Station; USNRC: Washington, DC, USA, 2018. [Google Scholar]
- Bonavigo, L.; Salve, M.D.; Zucchetti, M.; Annunziata, D. The decommissioning of trino nuclear power Plant environmental radiological impact of liquid and gaseous effluents. Environ. Appl. Sci. 2010, 5, 379–390. [Google Scholar]
- The United Nations Scientific Committee on the Effects of Atomic Radiation (UNSCEAR). Sources and Effects of Ionizing Radiation, UNSCEAR 2000 Report to the General Assembly, with Scientific Annexes; UNSCEAR: Vienna, Austria, 2000. [Google Scholar]
- International Atomic Energy Agency. Database on Discharges of Radionuclides to the Atmosphere and the Aquatic Environment. Available online: https://dirata.iaea.org/ (accessed on 21 March 2020).
- European Commission. Radioactive Effluents from Nuclear Power Stations and Nuclear Fuel Reprocessing Sites in the European Union, 2004–2008; RP-164; EC: Luxembourg, 2006. [Google Scholar]
- European Commission. Radioactive Effluents from Nuclear Power Stations and Nuclear Fuel Reprocessing Sites in the European Union, 1999–2003; RP-143; EC: Luxembourg, 2005. [Google Scholar]
- European Commission. Radioactive Effluents from Nuclear Power Stations and Nuclear Fuel Reprocessing Sites in the European Union, 1995–1999; RP-127; EC: Luxembourg, 2001. [Google Scholar]
- International Atomic Energy Agency. RAdioactive Discharges Databases (RADD). Available online: https://europa.eu/radd/ (accessed on 21 March 2020).
- OSPAR Commission. Liquid Discharges from Nuclear Installations in 2016; Expert Assessment Panel of the OSPAR Radioactive Substances Committee: London, UK, 2018. [Google Scholar]
- United States Nuclear Regulatory Commission. Radioactive Material from Nuclear Power Plants; NUREG/CR-2907; USNRC: Washington, DC, USA, 1994; Volume 14.
- Korea Hydro and Power Co., Ltd. Environmental Radiation Monitoring and Assessment Report; KHNP: Gyeongju, Korea, 2018. [Google Scholar]
- Environmental Protection Agency. Guidance for Data Quality Assessment: Practical Methods for Data Analysis; EPA QA/G-9; EPA: Washington, DC, USA, 2000. [Google Scholar]
- Okafor, G.C.; Jimoh, O.D.; Larbi, K.I. Detecting changes in hydro-climatic variables during the last four decades (1975-2014) on downstream Kaduna river catchment, Nigeria. Atmos. Clim. Sci. 2017, 7, 161–175. [Google Scholar] [CrossRef] [Green Version]
- Kishi, O.; Ay, M. Comparison of Mann–Kendall and innovative trend method for water quality parameters of the Kizilirmak river, Turkey. Hydrology 2014, 513, 362–375. [Google Scholar] [CrossRef]
- Gocic, M.; Trajkovic, S. Analysis of changes in meteorological variables using MK and Sen’s slope estimator statistical tests in Serbia. Glob. Planet. Chang. 2013, 100, 172–182. [Google Scholar] [CrossRef]
- International Atomic Energy Agency. Radiological Characterization of Shutdown Nuclear Reactors for Decommissioning Purposes; Technical Report Series No. 389; IAEA: Vienna, Austria, 1998. [Google Scholar]
- United States Nuclear Regulatory Commission. Offsite Dose Calculation Manual Guidance: Standard Radiological Effluent Controls for Pressurized Water Reactors; NUREG-1301; USNRC: Washington, DC, USA, 1991.
- Hugo, B.R. Modeling Evaporation from Spent Nuclear Fuel Storage Pools: A Diffusion Approach. Ph.D. Thesis, Washington State University, Washington, DC, USA, 2015. [Google Scholar]
- United States Nuclear Regulatory Commission. Calculation of Releases of Radioactive Materials in Gaseous and Liquid Effluents from Pressurized Water Reactors; NUREG-0017, Revision 1; USNRC: Washington, DC, USA, 1985.
- International Atomic Energy Agency. Safety Considerations in the Transition from Operation to Decommissioning of Nuclear Facilities; Safety Report Series No. 36; IAEA: Vienna, Austria, 2004. [Google Scholar]
- International Atomic Energy Agency. Decommissioning Facilities Decommissioning Strategy; General Safety Requirements No. GSR Part 6; IAEA: Vienna, Austria, 2014. [Google Scholar]
- Nuclear Safety and Security Commission. Standards for Radiation Protection, Etc.; NSSC 2019-10; NSSC: Seoul, Korea, 2019. [Google Scholar]
- Korea Hydro and Power Co., Ltd. APR1400 Design Control Document Tire 2, Auxiliary Systems; Revision 3; USNRC: Washington, DC, USA, 2018. [Google Scholar]
- United States Nuclear Regulatory Commission. Methods for Estimating Atmospheric Transport And Dispersion of Gaseous Effluents In Routine Releases From Light-Water-Cooled Reactors; Regulatory Guide 1.111, Revision 1; USNRC: Washington, DC, USA, 1977.
- Electric Power Research Institute. Rancho Seco Decommissioning Experience Report Detailed Experiences 1989–2007; EPRI: Palo Alto, CA, USA, 2007. [Google Scholar]
- United States Nuclear Regulatory Commission (USNRC). Available online: https://www.nrc.gov/info-finder/decommissioning/power-reactor/ (accessed on 21 March 2020).
- SOGIN. Available online: https://www.sogin.it/en/closureoftheitaliannuclearcycle/italian-nuclear-sites/trinonuclearpowerplant/Pagine/default.aspx (accessed on 22 March 2020).
- Niedersachsen. Available online: https://www.umwelt.niedersachsen.de/startseite/themen/atomaufsicht_amp_strahlenschutz/kerntechnische_anlagen/stillgelegte_anlagen_stade/sachstandsinformation-zum-kernkraftwerk-stade-8850.html (accessed on 22 March 2020).
- Enresa. Available online: http://www.enresa.es/eng/index/activities-and-projects/dismantling-and-environmental-restoration/dismantling-of-the-jose-cabrera-nuclear-power-plant (accessed on 22 March 2020).
- International Atomic Energy Agency (IAEA). Decommissioning of Pools in Nuclear Facilities; Nuclear Energy Series No. NW-T-2.6; IAEA: Vienna, Austria, 2015. [Google Scholar]
- United States Nuclear Regulatory Commission. Available online: https://www.nrc.gov/info-finder/decommissioning/power-reactor/san-onofre-unit-1.html (accessed on 21 March 2020).
- Electric Power Research Institute. San Onofre Nuclear Generating Station Unit 1 Decommissioning Experience Report Detailed Experiences 1999–2008; EPRI: Palo Alto, CA, USA, 2008. [Google Scholar]
- EDISON. Defueled Safety Analysis Report San Onofre Nuclear Generating Station Unit 1; USNRC: Washington, DC, USA, 2018. [Google Scholar]
Figure 1.
Generalized source term model for radioactive effluent from NPPs after PS. Red- and blue-colored arrows represent release paths of RNs in airborne and liquid effluents, respectively. Symbols and parameters in Figure 1 are provided and explained in Table 3.

Figure 2.
Generalized profile of radioactive effluent discharges after PS of NPPs taking into account decommissioning activities and immediate/deferred dismantling strategies. Each peak represents increment of radioactive discharges to be induced by decommissioning activities including but not limited to shipping out SF, drainage of primary coolant and SFP water, dismantling and decontamination of SSCs using wet/dry processes. T represents transitional period after PS, and DI, DD, and S stand for respective decommissioning periods.

Figure 3.
Calculated values for annual releases of airborne and liquid radioactive effluents from PS NPPs of which sample size is higher than 10 (i.e., > 10). The red dotted line indicates the confidence level (CL) of 95%.
Figure 3.
Calculated values for annual releases of airborne and liquid radioactive effluents from PS NPPs of which sample size is higher than 10 (i.e., > 10). The red dotted line indicates the confidence level (CL) of 95%.

Figure 4.
Linear correlation between values for tritium discharged in airborne and liquid effluents from NPPs shown in Figure 3 except Rheinsberg, Greifswald-1,2,3,4, and 5, Muelheim-Kaerlich NPPs where either airborne or liquid effluent data is not available. The red line represents the resulting plots with a determinant R2 of the estimated linear regression equation.

Figure 5.
Annual radioactivity release of airborne effluent before and after permanent shutdown of NPPs: (a) Crystal River-3; (b) Kewaunee; (c) Rancho Seco; (d) Trino. The number ① indicates the year of shipment of SF and ② indicates the license termination year. T, DD and DI represent decommissioning phases depicted in Figure 2. The dotted line indicates the year of permanent shutdown.


Figure 6.
Annual radioactivity release of liquid effluent before and after permanent shutdown of nuclear power plants: (a) Crystal River-3; (b) Haddam Neck; (c) Stade; (d) Jose Cabrera. The number ②, ③, ④, and ⑤ indicate respective years for license termination, drainage of SFP, dismantling activities, and decontamination of buildings. T and DI indicate phases T and DI as specified Figure 2. The dotted line indicates the year of permanent shutdown.


Figure 7.
Annual variations of discharge conditions (i.e., , , and ) of liquid effluent from NPPs as: (a) Kewaunee; (b) San Onofre-2 and 3; (c) Fort Calhoun; (d) Crystal River-3. The dotted line indicates the year of permanent shutdown.
Figure 7.
Annual variations of discharge conditions (i.e., , , and ) of liquid effluent from NPPs as: (a) Kewaunee; (b) San Onofre-2 and 3; (c) Fort Calhoun; (d) Crystal River-3. The dotted line indicates the year of permanent shutdown.

Figure 8.
Annual trends of radioactive materials released from San Onofre-1 from 1974 to 2006: (a) Airborne effluent; (b) Liquid effluent [48]. The dotted line indicates the year of permanent shutdown.
Figure 8.
Annual trends of radioactive materials released from San Onofre-1 from 1974 to 2006: (a) Airborne effluent; (b) Liquid effluent [48]. The dotted line indicates the year of permanent shutdown.


Table 1.
Sources of information on radioactive effluent from NPPs open to the public together with respective categories of RNs.
Table 1.
Sources of information on radioactive effluent from NPPs open to the public together with respective categories of RNs.
| No. | Data Source (1) | Scope | Ref. | Categories of RNs in Effluent (2) | |||||||||||||
|---|---|---|---|---|---|---|---|---|---|---|---|---|---|---|---|---|---|
| Airborne | Liquid | ||||||||||||||||
| D1 | UNSCEAR | World | [18] | ○ | ○ | ○ | ○ | ○ | ○ | ||||||||
| D2 | DIRATA | World | [19] | ○ | ○ | ○ | ○ | ○ | ○ | ○ | ○ | ○ | ○ | ||||
| D3 | ECRP (3) | Europe | [20] | ○ | ○ | ○ | ○ | ○ | ○ | ○ | ○ | ○ | ○ | ||||
| D4 | RADD | Europe | [23] | ○ | ○ | ○ | ○ | ○ | ○ | ○ | ○ | ○ | ○ | ||||
| D5 | OSPAR | Europe | [24] | ○ | ○ | ○ | |||||||||||
| D6 | ARERRs (4) | USA | [3] | ○ | ○ | ○ | ○ | ○ | ○ | ○ | ○ | ○ | ○ | ||||
| D7 | USNRC | USA | [25] | ○ | ○ | ○ | ○ | ||||||||||
| D8 | NRA | JPN | [5] | ○ | ○ | ○ | ○ | ||||||||||
| D9 | CNSC | CAN | [4] | ○ | ○ | ○ | ○ | ○ | ○ | ○ | ○ | ||||||
| D10 | KHNP | KOR | [26] | ○ | ○ | ○ | ○ | ○ | ○ | ○ | ○ | ○ | ○ | ||||
(1) UNSCEAR: United Nations Scientific Committee on the Effects of Atomic Radiation, DIRATA: Database on Discharges of Radionuclides to the Atmosphere and the Aquatic Environment, ECRP: European Commission-Radiation Protection, RADD: RAdioactive Discharges Databases, OSPAR: Oslo and Paris Convention, ARERRs: Annual Radioactive Effluent Release Reports, USNRC: United States Nuclear Regulatory Commission, NRA: Nuclear Regulation Authority, CNSC: Canadian Nuclear Safety Commission, KHNP: Korea Hydro and Nuclear Power Co., Ltd. (2) : Gross alpha, : Beta/gamma activity, : 14C, : Dissolved and entrained gases, : Fission and activation products, : Fission and activation gases, : Iodines/halogens, : Particulates, : 3H, : Other than 3H. Subscripts ‘’ and ‘’ represent airborne and liquid, respectively. (3) European Commission published the radioactive effluent data in Radiation Protection Publications No. 127 (2001), No. 143 (2005), and No. 164 (2006), of which only the latest volume is specified as reference [20] for simplification. (4) ARERRs are prepared periodically by the operators of NPPs and reported to the USNRC. For the convenience, however, a representative example of ARERR for Crystal River-3 in 2018 is referred to in this table.
Table 2.
Permanently shut down PWRs around the world of which radioactive effluent data have been utilized in this study and types of analysis conducted.
Table 2.
Permanently shut down PWRs around the world of which radioactive effluent data have been utilized in this study and types of analysis conducted.
| No. | Unit of NPP (1) | Shutdown | Strategy (2) | Data Source (3) | Period of Used Data | Type of Analysis (4) | ||
|---|---|---|---|---|---|---|---|---|
| 1 | Crystal River-3 | 2013 | DD | D6 | 2006–2018 | ○ | ○ | ○ |
| 2 | Fort Calhoun | 2016 | DD | D6 | 2006–2018 | ○ | ||
| 3 | Haddam Neck | 1996 | ID | D6, D7 | 1974–2011 | ○ | ||
| 4 | Kewaunee | 2013 | DD | D6 | 2006–2018 | ○ | ○ | ○ |
| 5 | Maine Yankee | 1997 | ID | D6, D7 | 1974–2018 | ○ | ||
| 6 | Rancho Seco | 1989 | DD | D6, D7 | 1974–2017 | ○ | ○ | |
| 7 | San Onofre-1 | 1992 | DD to ID (5) | D6, D7 | 1974–2006 | ○ | ○ | |
| 8 | San Onofre-2 | 2013 | ID | D6, D7 | 2006–2018 | ○ | ○ | |
| 9 | San Onofre-3 | 2013 | ID | D6, D7 | 2006–2018 | ○ | ○ | |
| 10 | Yankee NPS | 1991 | ID | D6, D7 | 1974–2012 | |||
| 11 | Zion-1 | 1998 | DD | D6, D7 | 1974–2017 | ○ | ||
| 12 | Zion-2 | 1998 | DD | D6, D7 | 1974–2017 | ○ | ||
| 13 | Biblis-A | 2011 | ID | D3, D4 | 1995–2018 | ○ | ||
| 14 | Biblis-B | 2011 | ID | D3, D4 | 1995–2018 | ○ | ||
| 15 | Grafenrheinfeld | 2015 | ID | D3, D4 | 1995–2018 | |||
| 16 | Greifswald-1 | 1990 | ID | D3, D4 | 1999–2018 | ○ | ||
| 17 | Greifswald-2 | 1990 | ID | D3, D4 | 1999–2018 | ○ | ||
| 18 | Greifswald-3 | 1990 | ID | D3, D4 | 1999–2018 | ○ | ||
| 19 | Greifswald-4 | 1990 | ID | D3, D4 | 1999–2018 | ○ | ||
| 20 | Greifswald-5 | 1989 | ID | D3, D4 | 1999–2018 | ○ | ||
| 21 | Muelheim-Kaerlich | 1988 | Other | D3, D4 | 1999–2018 | ○ | ||
| 22 | Neckarwestheim-1 | 2011 | ID | D3, D4 | 1995–2018 | ○ | ||
| 23 | Obrigheim | 2005 | ID | D3, D4 | 1995–2018 | ○ | ||
| 24 | Rheinsberg | 1990 | ID | D3, D4 | 1999–2018 | ○ | ||
| 25 | Stade | 2003 | ID | D3, D4 | 1995–2018 | ○ | ○ | |
| 26 | Unterweser | 2011 | ID | D3, D4 | 1995–2018 | ○ | ||
| 27 | Trino | 1990 | ID | D3, D4 | 2001–2018 | ○ | ○ | |
| 28 | Jose Cabrera-1 | 2006 | ID | D3, D4 | 1995–2018 | ○ | ○ | |
(1) Effluents from the following PWRs at the same site are proportioned among the units since their data have been reported together: San Onofre-2 and 3, and Zion-1 and 2, Greifswald-1, 2, 3, 4 and 5. (2) With regard to decommissioning strategy, ID and DD stand for Immediate Dismantling and Deferred Dismantling, respectively. (3) Refer to Table 1 regarding the sources of effluent data. (4) Regarding types of analysis, Type , Type , and Type represent the quantitative analysis, qualitative analysis, and analysis of possible change of discharge conditions, respectively, conducted for the plant and discussed specifically in Section 3. (5) The decommissioning strategy for San Onoefre-1 has been changed from DD to ID in 2000. Refer to Section 3.4 for more details.
Table 3.
Symbols and parameters used in source term model for radioactive effluent in Figure 1 and relevant characteristics.
Table 3.
Symbols and parameters used in source term model for radioactive effluent in Figure 1 and relevant characteristics.
| Symbol (1) | Unit | Description | |
|---|---|---|---|
| Applicable Major RNs | Applicable Period or Meaning | ||
| Volatile RNs ( and ) | Until primary coolant is drained | ||
| All RNs in airborne effluent (2) | Until SF is shipped out | ||
| Volatile RNs ( and ) | Until SFP water is drained. | ||
| All RNs in liquid effluent | When primary coolant is drained | ||
| All RNs in liquid effluent | Until SF is shipped out | ||
| All RNs in liquid effluent | When SFP water is drained | ||
| All RNs in airborne effluent (2) | Until ventilation system is in operation | ||
| All RNs in liquid effluent | When wet dismantling or decontamination process is conducted | ||
| All RNs in liquid effluent | When laundry or shower area is in operation | ||
| , , and (2) | When dry dismantling or decontamination process is conducted | ||
| All RNs in airborne effluent (2) | Until ventilation system is in operation | ||
| All RNs in liquid effluent | When liquid waste processing or discharge system is in operation | ||
| [34] | - | (3) | Decontamination factor for airborne RN i |
| [34] | - | Removable RNs ( and ) | Decontamination factor for liquid RN i |
| - | Flow rate of liquid waste | ||
| - | Flow rate of dilution water supplied by cooling water pumps | ||
(1) represents a transfer rate from compartment i to compartment j. (2) Generally not applicable to radioiodines (except 129I) due to their short half-lives. (3) Generally not applicable to radioiodines since particulate filter rather than charcoal filter or fission gas delay/decay system is assumed to be installed.
Table 4.
Major arguments for characteristics of radioactive effluent releases from decommissioning NPPs derived from source term models proposed in this study.
Table 4.
Major arguments for characteristics of radioactive effluent releases from decommissioning NPPs derived from source term models proposed in this study.
| No. | Argument | Applicability |
|---|---|---|
| 1 | Generally decreasing trend of radioactive effluent releases from PS to LT | , , , , , , , , and (except short-lived , , , and ) |
| 2 | Enhanced homogeneity of composition of RNs in effluent streams after PS | , , , , , , , , and (except short-lived , , , and ) |
| 3A | No release of short-lived radioiodines (except 129I) in a very short period after PS | and (except 129I) |
| 3B | No release of short-lived fission gases (except 85Kr) in a very short period after PS | and (except 85Kr) |
| 4 | Enhanced release of airborne RNs with defueling | , , , , and (except short-lived and ) |
| 5 | Enhanced release of airborne RNs with shipping out SF | , , , , and (except short-lived and ) |
| 6 | Enhanced release of liquid RNs with drainage of primary coolant or SFP water | , , , and (except short-lived and ) |
| 7A | Release of airborne RNs with dry processes for decontamination and dismantling | , , , , and (except short-lived and ) |
| 7B | Release of liquid RNs with wet processes for decontamination and dismantling | , , , and (except short-lived and ) |
| 8 | High correlation between relative fractions of airborne and liquid tritium discharged | and |
| 9A | High variations in releases of RNs in Phase T | , , , , , , , , and (except short-lived , , , and ) |
| 9B | High variations in releases of RNs in Phase DI | , , , , , , , , and (except short-lived , , , and ) |
| 9C | Stabilized and gradual decreasing trend of RNs released in Phase S | , , , , , , , and (except short-lived , , , and ) |
| 9D | High variations in releases of RNs in Phase DD | , , , , , , , , and (except short-lived , , , and ) |
| 10 | Much variable rate of waste water flow (f) and generally decreasing trend of dilution flow (F) after PS | Dilution factor to be generally reduced |
Table 5.
Main events or activities of San Onofre-1 from permanent shutdown to termination of its effluent monitoring program.
Table 5.
Main events or activities of San Onofre-1 from permanent shutdown to termination of its effluent monitoring program.
| No. | Strategy | Time/Period | Plant Status or Conducted Activities | Reference |
|---|---|---|---|---|
| 1 | SAFSTOR | 30 November 1992 | Permanent shutdown | [46] |
| 2 | 6 March 1993 | Complete defueling of reactor core | [46] | |
| 3 | 4 August 1993 | Termination of airborne batch release | [3] (1) | |
| 4 | 15 December 1998 | Submission of PSDAR (2) | [46] | |
| 5 | DECON | 1999–2002 | Removal of large components | [47] |
| 6 | 2001–2002 | Segmentation and removal of RPV (3) internal | [47] | |
| 7 | 2003–2005 | Transfer of SF from SFP to ISFSI (4) | [47] | |
| 8 | 2003–2006 | Containment removal and decontamination | [47] | |
| 9 | 2004–2005 | Draining SFP water | [47] | |
| 10 | 31 August 2004 | All fuel was transferred to the ISFSI | [3] | |
| 11 | 3rd Quarter 2005 | Termination of liquid batch release | [3] | |
| 12 | 2005–2006 | Removal of fuel storage building | [3] | |
| 13 | 16 October 2006 | Termination of liquid continuous release | [3] | |
| 14 | 27 November 2006 | Termination of airborne continuous release | [3] | |
| 15 | 29 November 2006 | All remaining monitored effluent pathways were permanently removed from service | [3] |
(1) The EDISON published the Annual Radioactive Effluents Release Report for 2007 about San Onofre-1, 2, and 3 (2008), of which only the general volume is specified as reference [3] for simplification. (2) PSDAR: Post Shutdown Decommissioning Activities Report. (3) RPV: Reactor Pressure Vessel. (4) ISFSI: Independent Spent Fuel Storage Installation.
© 2020 by the authors. Licensee MDPI, Basel, Switzerland. This article is an open access article distributed under the terms and conditions of the Creative Commons Attribution (CC BY) license (http://creativecommons.org/licenses/by/4.0/).
Share and Cite
MDPI and ACS Style
Kang, J.S.; Cheong, J.H. Characteristics of Radioactive Effluent Releases from Pressurized Water Reactors after Permanent Shutdown. Energies 2020, 13, 2436. https://0-doi-org.brum.beds.ac.uk/10.3390/en13102436
AMA Style
Kang JS, Cheong JH. Characteristics of Radioactive Effluent Releases from Pressurized Water Reactors after Permanent Shutdown. Energies. 2020; 13(10):2436. https://0-doi-org.brum.beds.ac.uk/10.3390/en13102436
Chicago/Turabian StyleKang, Ji Su, and Jae Hak Cheong. 2020. "Characteristics of Radioactive Effluent Releases from Pressurized Water Reactors after Permanent Shutdown" Energies 13, no. 10: 2436. https://0-doi-org.brum.beds.ac.uk/10.3390/en13102436
Note that from the first issue of 2016, this journal uses article numbers instead of page numbers. See further details here.