The Role of Powertrain Electrification in Achieving Deep Decarbonization in Road Freight Transport


1
Division of Mechanical Science and Technology, Graduate School of Science and Technology, Gunma University, 1-5-1 Tenjincho, Kiryu, Gunma 376-8515, Japan
2
Division of Mechanical Science and Technology, Graduate School of Science and Technology, Gunma University, 29-1 Honcho, Ota, Gunma 373-0057, Japan
*
Author to whom correspondence should be addressed.
Energies 2020, 13(10), 2459; https://0-doi-org.brum.beds.ac.uk/10.3390/en13102459
Submission received: 14 April 2020
/
Revised: 6 May 2020
/
Accepted: 10 May 2020
/
Published: 13 May 2020
(This article belongs to the Special Issue Electric Systems for Transportation)
Abstract
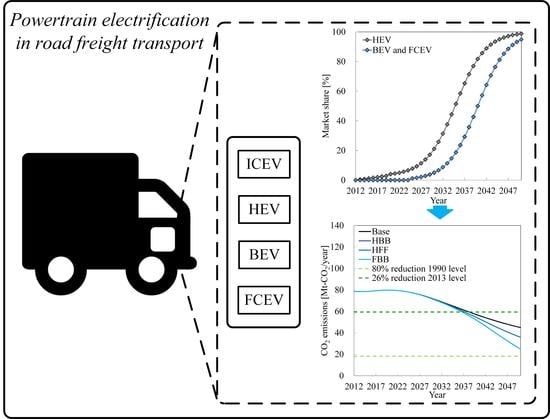
:Decarbonizing road freight transport is difficult due to its reliance on fossil fuel internal combustion engine vehicles (ICEVs). The role of powertrain electrification in achieving deep decarbonization in road freight transport was studied using a vehicle stock turnover model, focusing on Japan. Twelve vehicle types were considered; combining four powertrains, ICEV, hybrid electric vehicle (HEV), battery electric vehicle (BEV) and fuel cell electric vehicle (FCEV); and three vehicle size classes, normal, compact and mini-sized vehicles. A scenario-based approach was used; considering a Base scenario, and three alternative scenarios targeting powertrain electrification. Between 2012 and 2050, tank to wheel CO2 emissions decrease 42.8% in the Base scenario, due to the reduction of vehicle stock, the improvement of vehicle fuel consumption and the adoption of HEVs. Diffusion of FCEVs in normal vehicles and BEVs in compact and mini-sized vehicles achieves the largest tank to wheel CO2 emissions reductions, up to 44.6% compared with the 2050 baseline value. The net cash flow is positive over the whole time horizon, peaking at 6.7 billion USD/year in 2049 and reaching 6.6 billion USD/year by 2050. Powertrain electrification is not enough to achieve any of the CO2 emissions reduction targets in road freight transport.
1. Introduction
1.1. Motivation of the Research
Road freight transport accounts for a significant share of global energy consumption in the transport sector. Almost 45% of global transport energy consumption corresponds to freight transport, with heavy-duty vehicles (HDVs) using more than half of that energy [1]. Furthermore, road freight transport depends heavily on fossil fuels; with medium freight trucks and heavy freight trucks accounting for 24% of global oil-based fuel consumption [2]. Diesel is the main fuel used in road freight transport, accounting for 84% of all oil products used; and corresponding to half of the global diesel demand [3].
Road freight vehicles are difficult to characterize due to the variety of vocational uses that requires a large number of sizes and configurations. However, it is considered that goods delivery from production sites to factories, industries and/or final retailers is one of the essential roles of road freight vehicles [3]. Road freight vehicles consist of light-duty vehicles (LDVs), medium-duty vehicles (MDVs) and HDVs; including but not limited to trucks. One additional difficulty for road freight vehicle characterization is that criteria for vehicle size classification vary depending on the country or region.
Despite the small share in road vehicles, MDVs and HDVs contribute disproportionally to mobile greenhouse gas (GHG) and air pollutant emissions and fossil fuel use, due to high vehicle fuel consumption, large annual traveled distances and long idling times [4]. In the European Union, HDVs account for 30% of on-road CO2 emissions, despite representing only 4% of the road vehicle stock [5]. Similarly in the United States, MDVs and HDVs account for 26% of transport CO2 emissions [6]. Additionally, road freight vehicles produce half of particulate matter (PM) emissions and one third of NOx emissions of the transport sector in cities [7]. In the United States, MDVs and HDVs are responsible for 22%, 28% and 24% of transport sector PM2.5, NOx and CO emissions, respectively [4]. PM and NOx are associated with adverse health effects in human beings [8]; while exposure to low CO concentrations causes health problems such as headaches and lightheadness [9]. Furthermore, diesel exhaust gas is classified as carcinogenic to humans (Group 1) by the World Health Organization (WHO) [10].
Decarbonization in road freight transport will be difficult to realize [11]. Global road freight activity is expected to grow in the future, driven by economic development. For instance, heavy-duty truck use is expected to increase 2.7%/year between 2000 and 2030 [12]. Increased road freight activity and high dependence on fossil fuels will cause GHG emissions from road freight transport to keep growing in the future; requiring coordinated efforts by shippers, logistics service providers and policymakers to mitigate their growth [2].
Potential for energy consumption and CO2 emissions reduction through the improvement of internal combustion engine efficiency and aerodynamics is significant and can be cost-effective [13]. However, in the long-term, advanced biofuels and electric-drive vehicles (EDVs) will be the main option to achieve deep decarbonization in road freight vehicles [14]. Additionally, since the time scales involved in road freight vehicle stock turnover are long, it is necessary to consider the dynamics of technology diffusion in the vehicle fleet when assessing the role of powertrain electrification in the decarbonization of road freight transport.
Compared with passenger LDVs, deployment of EDVs in road freight vehicles is still at an early stage. While the global EDV stock in LDVs exceeded 5.1 million vehicles in 2018, EDV stock in the fleet of light commercial vehicles reached 250000 vehicles; and medium-sized trucks sales were in the range of 1000 to 2000 vehicles [15]. Considering that global road freight vehicle stock totaled approximately 186 million vehicles in 2015 [3], penetration of EDVs in road freight transport is almost negligible.
Nevertheless, EDV deployment in road freight vehicles is gaining momentum, with McKinsey projecting that EDVs can account for 15% of global truck sales by 2030 [16]. Currently, several Original Equipment Manufacturers (OEMs) are investing in the development of EDVs for road freight transport. BYD introduced a battery electric class 8 truck and a battery electric refuse truck in 2017 [17]. Isuzu presented the battery electric ELF EV truck at the 2017 Tokyo Motor Show [18]. Tesla announced plans to manufacture battery electric semi-trucks by 2019, with UPS pre-ordering 125 vehicles [19]. Renault plans to start selling battery electric 12–16 ton trucks to complement the line-up of battery electric 4.5 ton trucks in the market since 2010 [20]. Mitsubishi Fuso started mass production of the battery electric eCanter in 2019 [21].
Regarding FCEVs, a Swiss consortium with participation of ESORO announced the development of a 34 ton fuel cell truck [22]. Toyota is working on a fuel cell system for heady-duty trucks to be used at the port of Los Angeles, United States [23]. Ballard and Kenworth have been testing a class 8 drayage fuel cell truck in the United States [24]. Nikola Motors plans to start selling Class 8 fuel cell trucks by 2021 [25].
Compared with passenger LDVs, EDV adoption in road freight transport has several advantages, especially at the early stages of deployment. Under some operating conditions, high annual traveled distances for long-haul vehicles enable fast recovery of the incremental capital costs through lower fuel costs [26]. In the case of BEVs, road freight vehicles follow fixed driving routines based on their delivery routes, making range anxiety concerns less critical [27]. Furthermore, operation according to a predetermined mobility demand makes the requirement for public charging modest [28]. In the case of FCEVs, known daily traveled distance and central refueling station use make fleet-based operation attractive [4].
Nevertheless, EDV deployment in road freight transport also face barriers, such as diversity in terms of vehicle sizes and vocational uses [4], larger weight and longer traveled distances [12], and larger emphasis on economic profitability and reluctance to take risks regarding new automotive technologies [29]. Even though several studies have demonstrated that under some operating conditions EDVs are cost-effective [30,31,32], road freight vehicle fleet owners often focus on short payback times rather than cost-effectiveness over the vehicle life cycle, which can affect EDV adoption. For example, in the United States, the average payback time for large heavy-duty truck fleets is 24 months [33]; while payback times as short as 6 months are reported for small heavy-duty truck fleets [34].
1.2. Review of the Existing Literature
There is a growing interest in research about EDV applications for road freight transport; with most of the research assessing the performance of EDVs compared with internal combustion engine vehicles (ICEVs) from energy consumption, CO2 emissions and/or cost perspectives.
On a single-vehicle basis, Zhao et al. [35] estimated energy consumption, CO2 emissions and cost performance for a HEV, a BEV and a FCEV and compared them with a diesel-fueled ICEV for Class 8 trucks in the United States. Lee et al. [36] estimated energy consumption, GHG emissions and total cost of ownership (TCO) for ICEV and BEV urban delivery trucks. Lajunen [37] evaluated energy consumption for HEVs and compared them with ICEVs for HDVs in Finland. Gao et al. [38] assessed several energy consumption reduction technology measures for ICEVs and HEVs for Class 8 trucks in the United States. Lebeau et al. [39] assessed the cost-effectiveness of BEVs for freight transport in Brussels, Belgium, focusing on light commercial vehicles and quadricycles. Zhao et al. [40] assessed energy consumption and GHG emissions for ICEVs, HEVs and BEVs for Class 3–5 delivery trucks in the United States. Kast et al. [4,6] assessed the performance of FCEVs in the MDV and HDV segments in the United States. Sen et al. [31] estimated life cycle GHG and air pollutant emissions, costs and externalities for ICEVs, HEVs and BEVs for Class 8 trucks in the United States. Lee and Thomas [31] evaluated energy consumption, water use, GHG and air pollutant emissions for ICEVs, HEVs and BEVs in medium-duty trucks in the United States. Zhao and Tatari [41] evaluated energy consumption and GHG emissions for ICEVs, HEVs and plug-in hybrid electric vehicles (PHEVs) for refuse trucks in the United States. Zhou et al. [42] assessed life cycle GHG emissions and TCO for ICEVs and BEVs for Class 6 trucks in Toronto, Canada.
Other studies assessed the role of EDVs in road freight transport on a fleet basis without considering vehicle stock turnover. Davis and Figliozzi [43] assessed the economic competitiveness of ICEVs and BEVs for MDVs in the United States. Wikström et al. [28] evaluated BEVs and PHEVs for road freight transport in Sweden from technological and social perspectives. Zhao et al. [27] estimated the optimum penetration of HEVs and BEVs in a commercial delivery fleet of MDVs in the United States. Christensen et al. [44] studied the suitability of BEV introduction for road freight transport in LDVs and HDVs in Germany and Denmark. Though valuable, these studies did not capture the dynamics of technology diffusion in the road freight vehicle fleet.
Regarding studies on a fleet basis that considered vehicle stock turnover, Li et al. [45] estimated the most cost-effective pathways to reduce oil consumption in road freight transport in China, considering ICEVs and HEVs; without considering BEVs and FCEVs. Askin et al. [26] analyzed the factors that can influence deployment of advanced technologies in HDVs in the United States, considering natural gas-fueled ICEVs and diesel-fueled HEVs; without considering BEVs and FCEVs. Oshiro and Masui [46] studied the impact of EDV diffusion in road transport in Japan, focusing on HEVs and FCEVs as powertrain options for HDVs; without considering fuel consumption evolution in time and cost. Fridstrøm [47] evaluated the role of EDVs in GHG emissions reduction in road transport in Norway, including freight transport; without considering the impact on cost. Talebian et al. [47] studied the potential of BEVs and FCEVs to reduce GHG emissions in road freight transport in British Columbia, Canada; without considering the impact on cost. Mullholland et al. [48] assessed the CO2 emissions reduction potential of HEVs and BEVs in global road freight transport; without considering FCEVs and the impact on cost.
The main characteristics of the most relevant studies regarding powertrain electrification in road freight transport are summarized in Table 1. No research was found in the reviewed literature that assesses the potential of powertrain electrification to reduce CO2 emissions in road freight transport and the associated cost, considering the dynamics of technology diffusion.
1.3. Contribution
The objective of this research is to estimate the potential of powertrain electrification to reduce road freight transport fossil fuel consumption and CO2 emissions, and the impact on cost. The road freight vehicle fleet in Japan was chosen as the case study.
To the authors’ best knowledge, this is the first research that assesses the CO2 emissions reduction potential and the associated cost of powertrain electrification in road freight transport on a national scale, considering the dynamics of technology diffusion. The CO2 emissions reduction potential estimated here corresponds to the upper boundary for CO2 emissions reductions achievable through EDV deployment in the road freight vehicle fleet. Results from this research can help policymakers understand the maximum contribution of powertrain electrification to reduce CO2 emissions from road freight transport; and therefore, designing more effective policies for climate change mitigation in the transport sector. Furthermore, results presented here also show the requirements in terms of cost and supply of electricity and hydrogen needed to achieve powertrain electrification in road freight transport.
1.4. Organization of the Article
2. Methods
2.1. Formulation of the Vehicle Stock Turnover Model for the Road Freight Vehicle Fleet
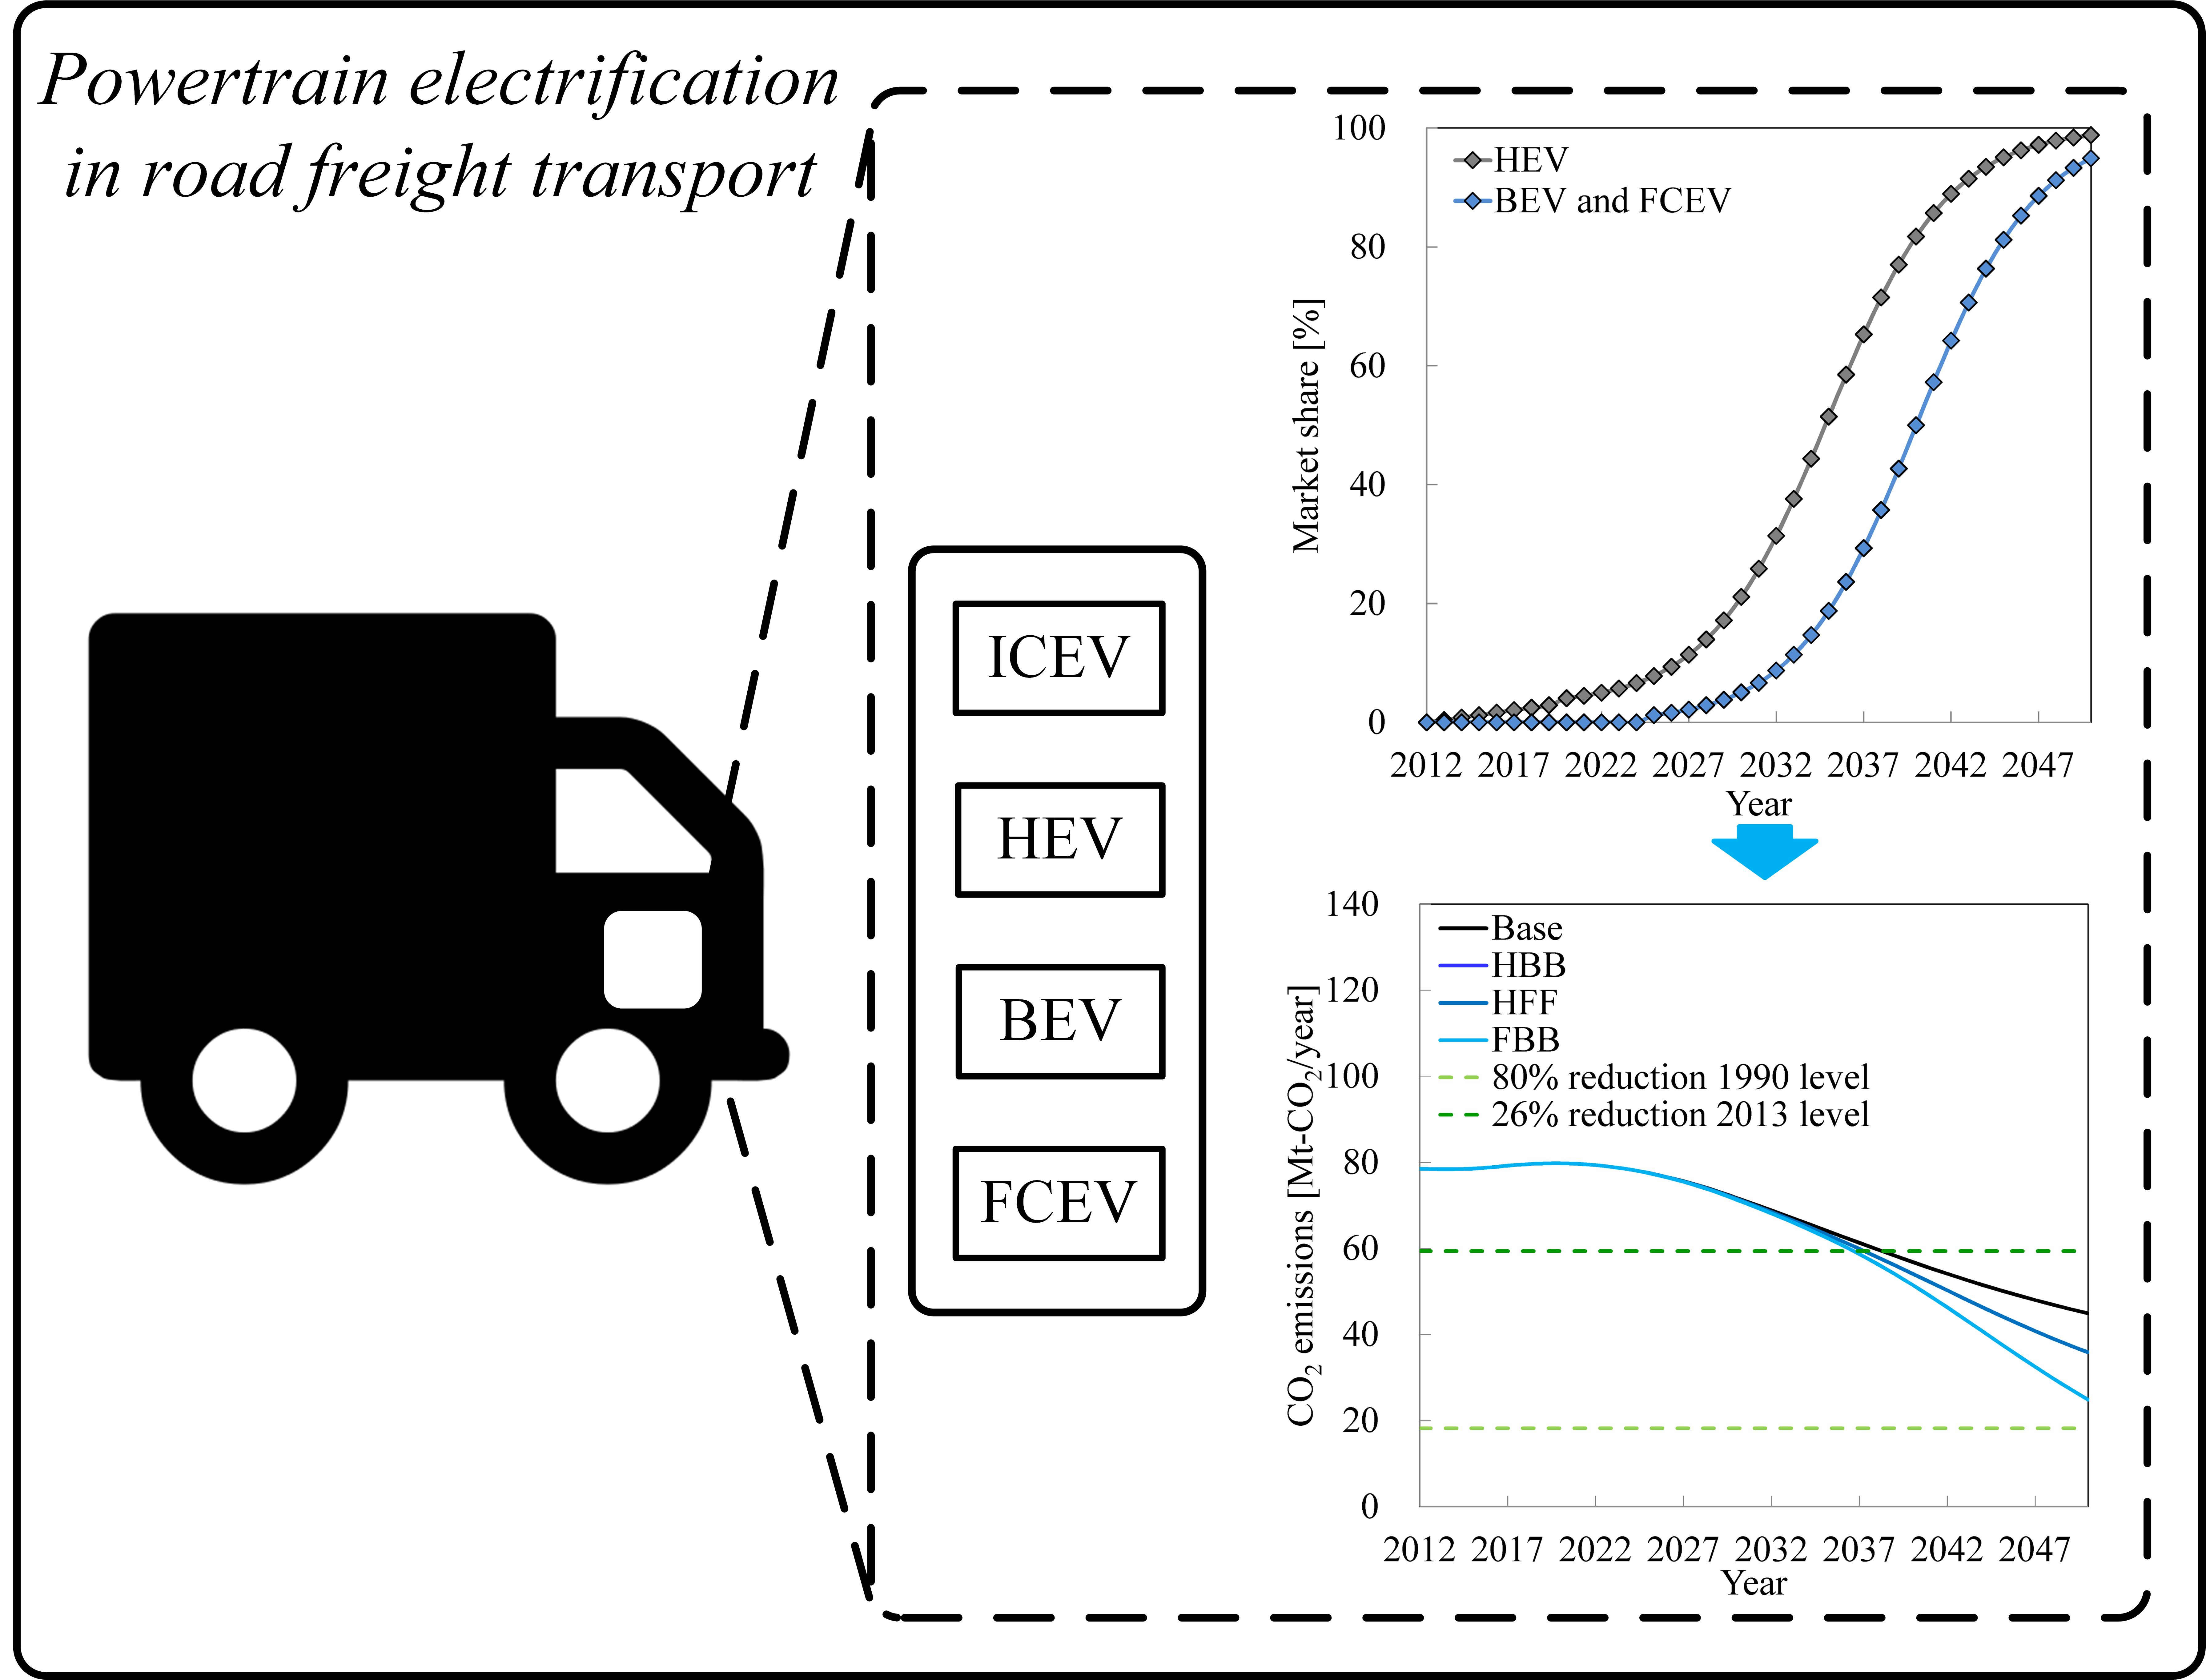
This research focused on energy end-use in road freight vehicles. Other stages of the vehicle cycle and the fuel cycle were not considered. Energy flows in the energy system are shown in Figure 1. The energy system is made of four energy carriers, diesel, gasoline, electricity, and hydrogen; which are used in 12 vehicle types. The 12 vehicle types result from combining four powertrains, ICEV, HEV, BEV, and FCEV; and three vehicle size classes, normal, compact and mini-sized vehicles.
The criteria from the Japan Ministry of Land Infrastructure, Transport and Tourism (MLIT) [49] were used for road freight vehicle size classification. These criteria divide road freight vehicles in normal, compact and mini-sized classes according to the external dimensions and engine displacement. It should be noted that according to MLIT’s classification, all mini-sized vehicles are LDVs. However, not all LDVs belong to the mini-sized vehicle size class; and there are LDVs that belong to the compact vehicle size class. MDVs belong to the compact and normal vehicle size classes; while HDVs belong to the normal vehicle size class. The Gross Vehicle Weight (GVW) ranges for road freight vehicles in Japan were extracted by analyzing MLIT data [50]; with GVW for mini-sized vehicles varying between 0.9 and 1.5 ton; compact vehicles between 1.6 and 3.4 ton; and normal vehicles between 2.8 and 59.1 ton.
The Long-range Energy Alternatives Planning system (LEAP) software was used to model the energy system [51]; based on previous work developed by the authors in [52,53]. The model developed can be classified as a dynamic bottom-up accounting energy-economics model. The description of the main components of the model is presented below. For more details, the reader can examine the previous references.
For a given fleet of vehicles type t and vintage v in a calendar year y, the vehicle fleet tank to wheel (TTW) energy consumption is calculated by multiplying the vehicle stock N, the annual traveled distance M and the vehicle fuel consumption R, as indicated in Equation (1):
The vehicle fleet TTW CO2 emissions are calculated by multiplying the fleet energy consumption ETTW,t,y,v and the CO2 emission factor EFTTW,t,y of the fuel used by the vehicle type t in the calendar year y, as indicated in Equation (2):
The vehicle fleet well to wheel (WTW) CO2 emissions are obtained similar to Equation (2), replacing the TTW CO2 emission factor with the WTW CO2 emission factor.
The economic assessment was performed using the relative cost of ownership (RCO), defined as the sum of the capital cost, the operating and maintenance (O&M) cost and the energy cost, as indicated in Equation (3):
where S is the new vehicle sales, ccap is the vehicle capital cost, CRF is the capital recovery factor, cOM is the annual O&M cost, and cene is the energy price.
It should be noted that Equations (1) and (2) are built under the assumption that annual traveled distance and vehicle fuel consumption are constant for all vehicles of a given type and vintage during a calendar year. In that sense, differences in vehicle usage across users cannot be captured in the model. Regarding the economic evaluation, it was assumed that costs other than capital cost, O&M cost and energy cost are identical for ICEVs and EDVs [54]; and therefore, excluded in the estimation of the RCO in Equation (3). Road vehicle fleet energy consumption, CO2 emissions and RCO for a given calendar year y are estimated by summing across all vehicle types and vintages existing in the road freight vehicle fleet.
2.2. Road Freight Vehicles Characteristics
Due to the variety of vocational uses, there is a large number of road freight vehicle types. In Japan, the MLIT reported fuel consumption data for 5272 road freight vehicle types [55], mainly ICEVs. Considering this number of vehicle types in the vehicle stock turnover model is not practical. Therefore, the structure of the road freight vehicle fleet was simplified, assuming there are only 12 vehicle types: ICEVs, HEVs, BEVs, and FCEV, available in three vehicle size classes, normal, compact and mini-sized vehicles. Additionally, based on the analysis of the same data from MLIT, it was assumed that all normal ICEVs use diesel; and all compact and mini-sized ICEVs use gasoline.
In order to calibrate the model against historical data, 2012 was selected as the base year. It was assumed that all road freight vehicles in the Base year were ICEVs. Each vehicle size class was represented only by one ICEV, with vehicle fuel consumption close to the average value reported in data from MLIT [56]. Mini-sized ICEVs were modeled as a Subaru Sambar with a GVW of 1.2 ton; compact ICEVs were modeled as a Toyota Hiace with a GVW of 3.1 ton; and normal ICEVs were modeled as a Fuso Canter with a GVW of 7.9 ton. Vehicle data for road freight EDVs were constructed extracting relationships between ICEVs and EDVs from the existing literature.
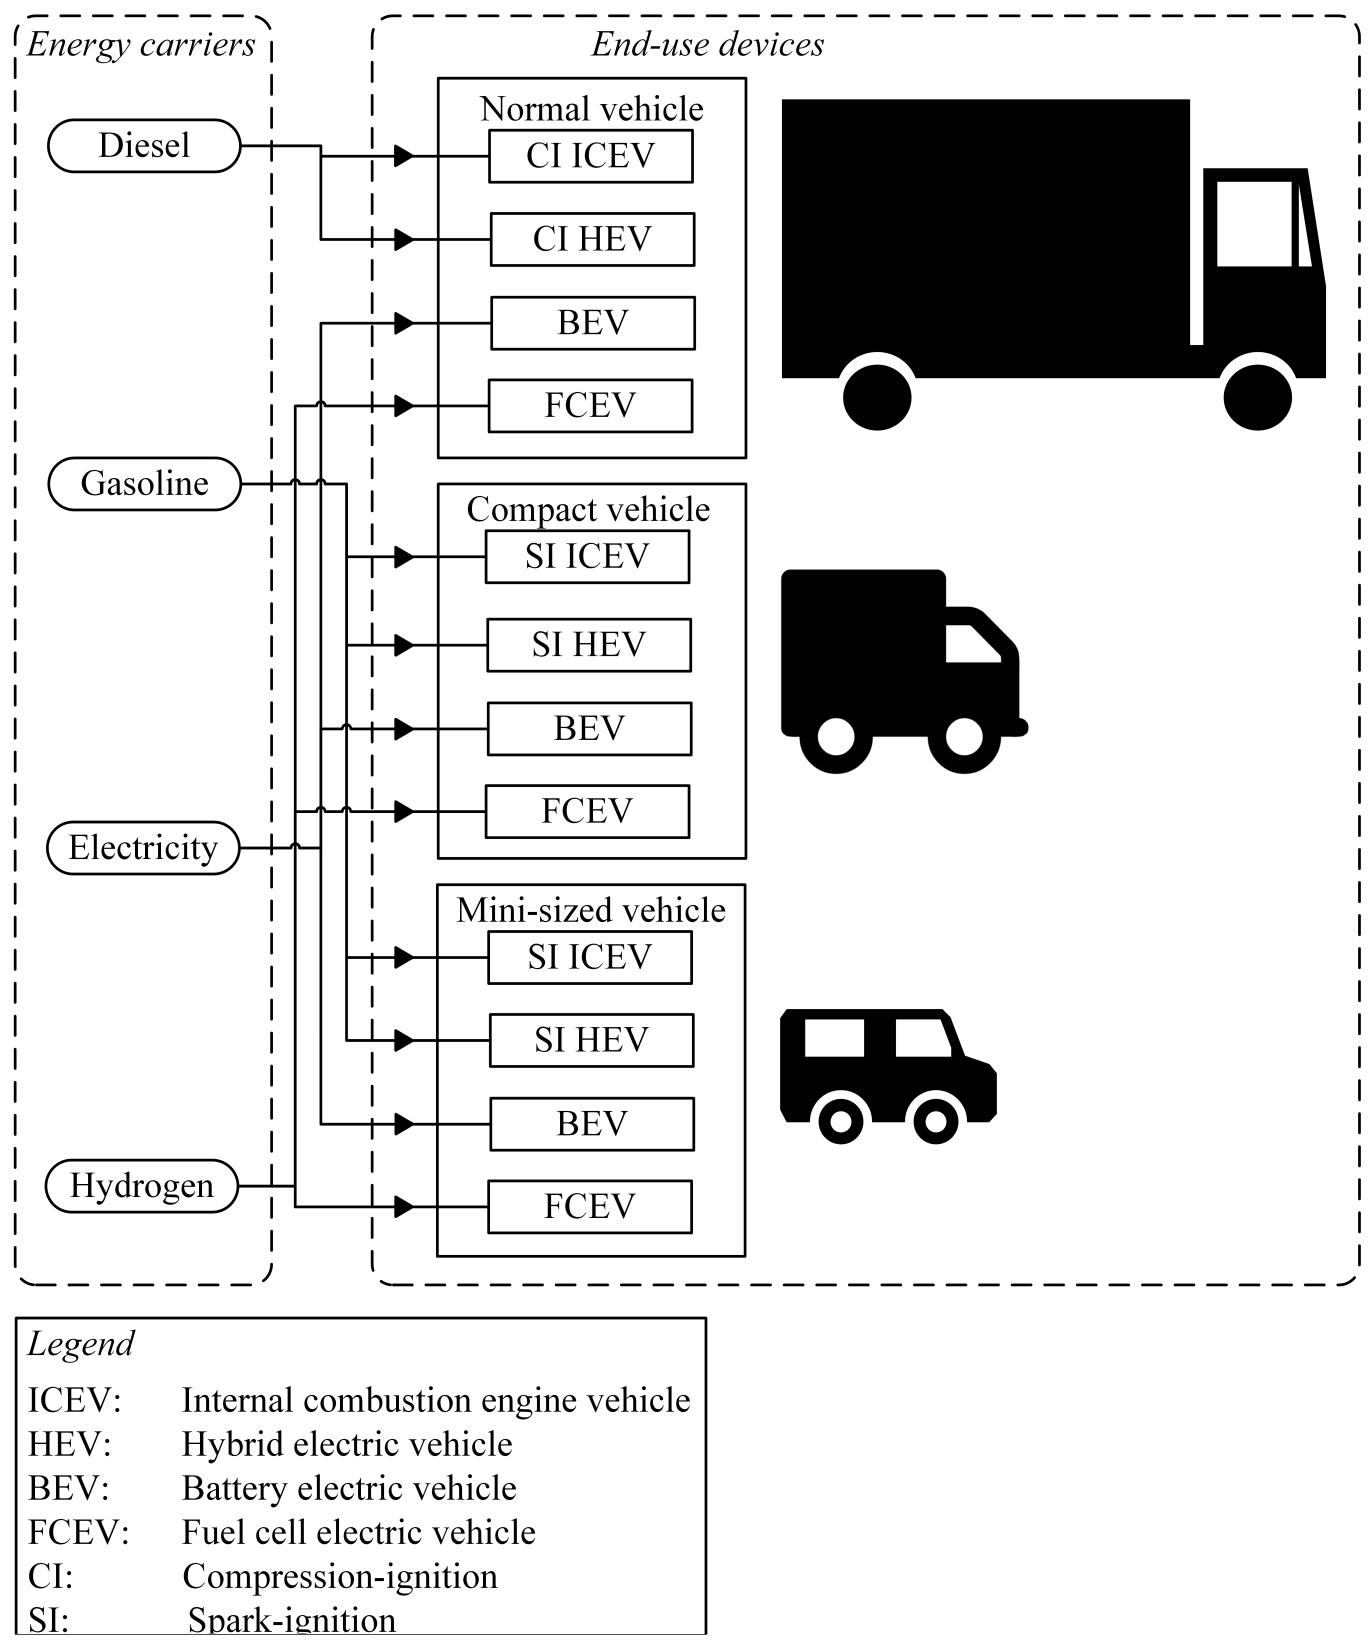
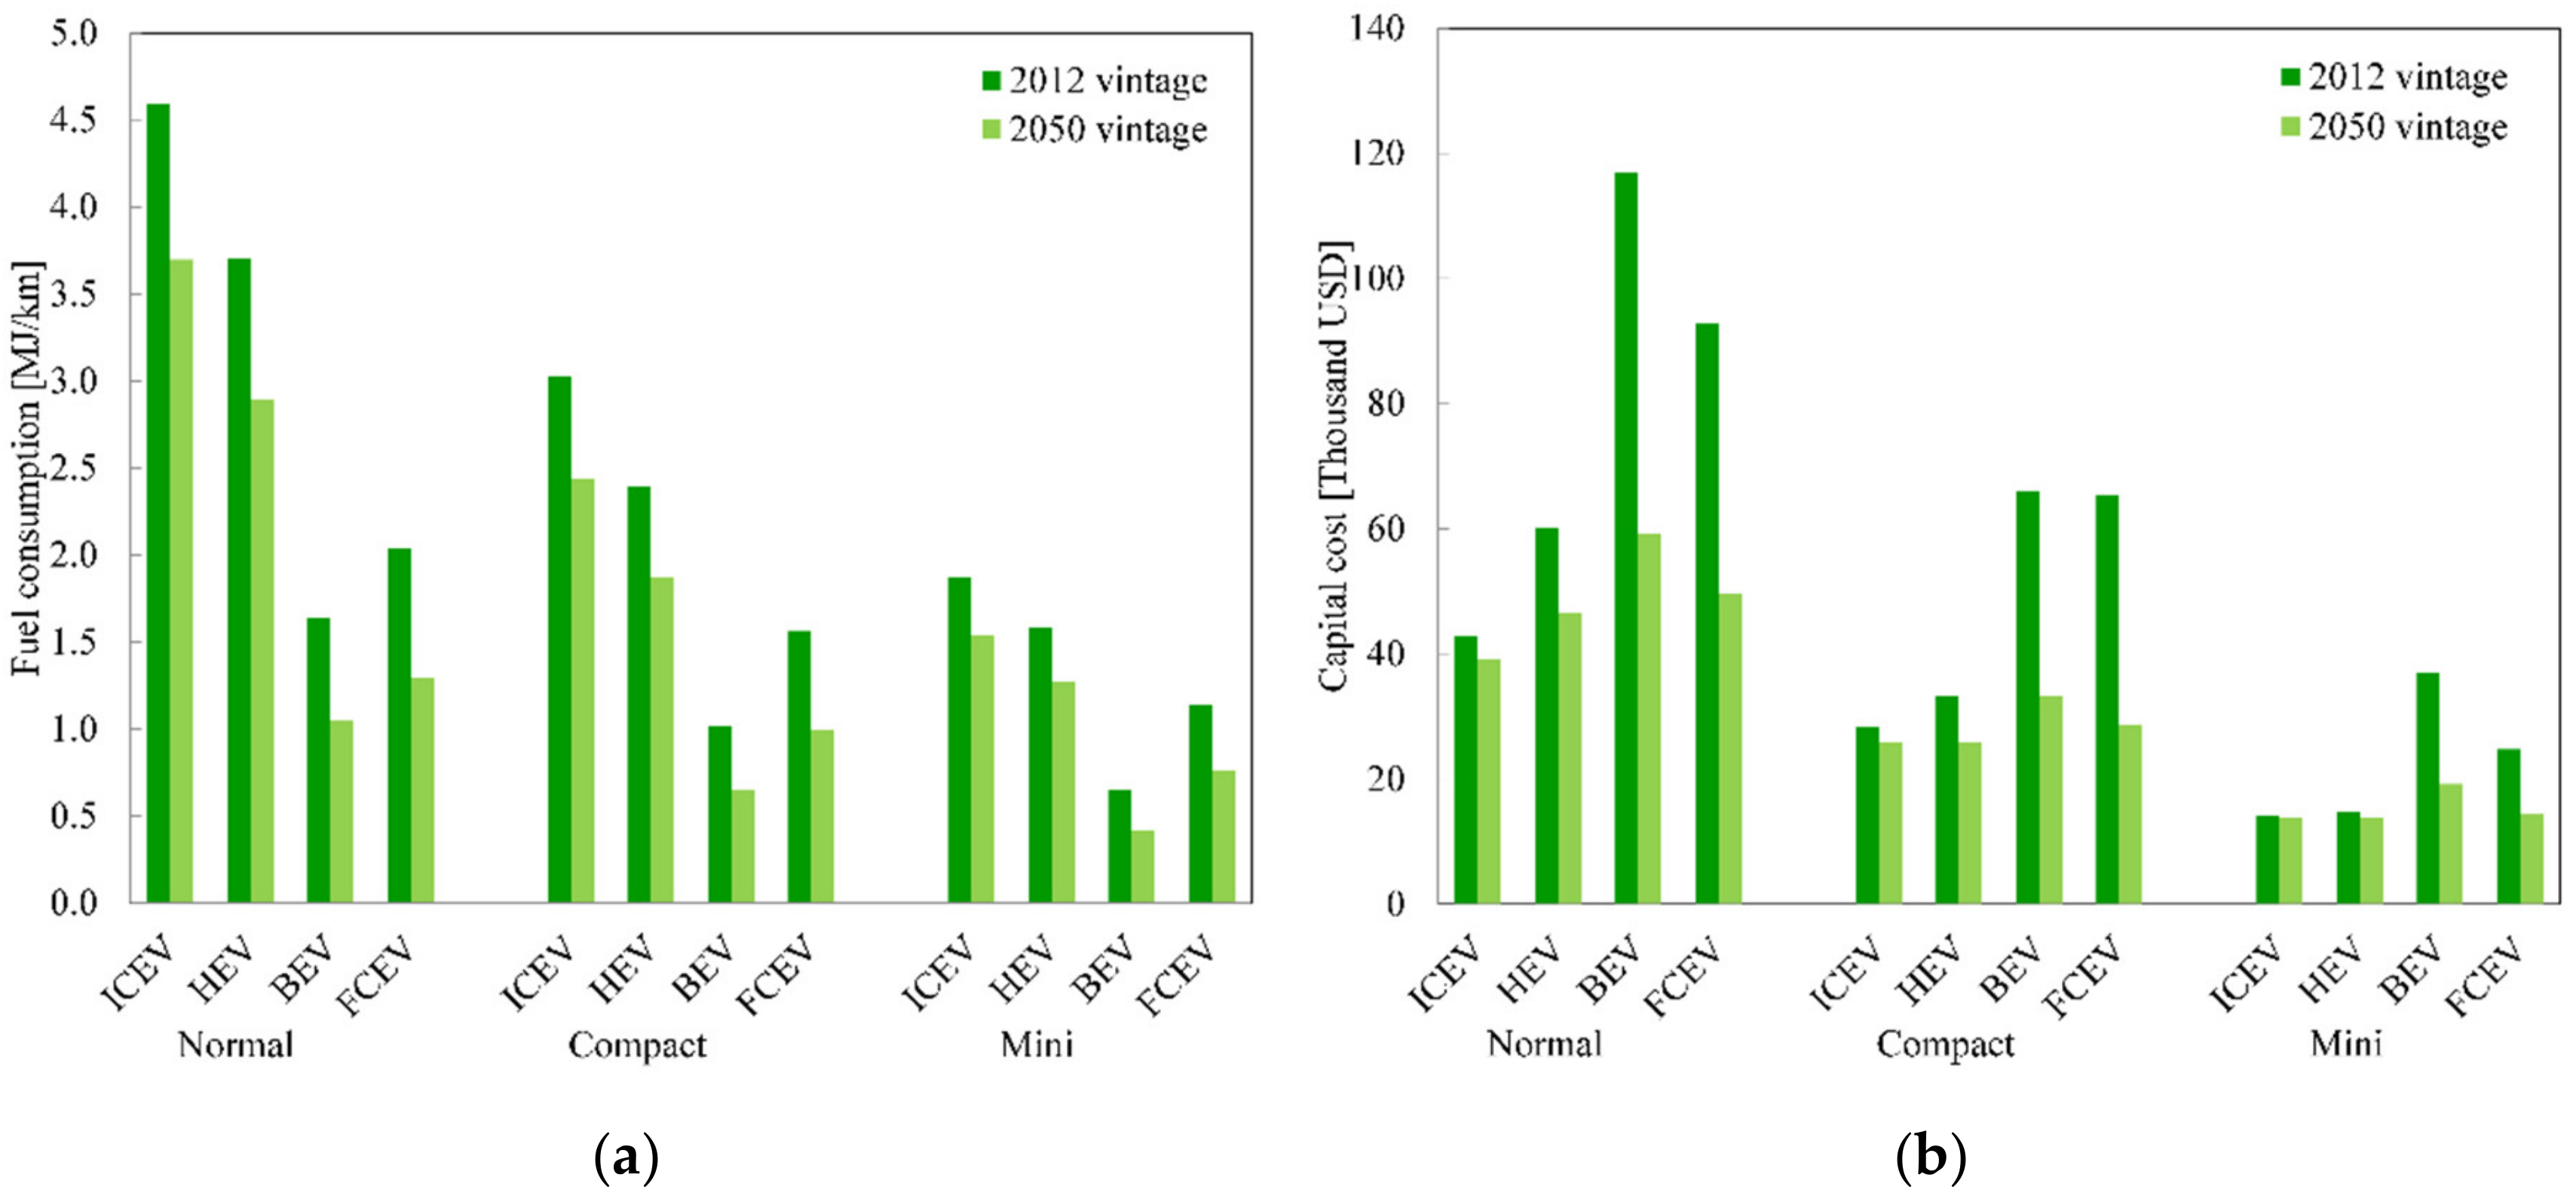
Fuel consumption and capital cost for the road freight vehicles in 2012 and 2050 are shown in Figure 2. Fuel consumption data for ICEVs in all vehicle size classes in 2012 were estimated using data reported by MLIT [56]. Using ICEV fuel consumption as a reference, 2012 fuel consumption for EDVs in the normal size class was estimated assuming the ICEV and EDV fuel consumption ratios are identical to values reported in [35] for HEVs, and in [57] for BEVs and FCEVs. Fuel consumption in 2012 for EDVs in the compact size class and the mini-sized BEV was estimated considering the ICEV and EDV fuel consumption ratios are identical to the values reported for normal LDVs in [53]. Fuel consumption in 2012 for the mini-sized HEV and FCEV was estimated assuming the fuel consumption ratios for ICEV and HEV and for ICEV and FCEV are identical to the values reported for LDVs in [58].
The capital costs for the normal ICEV, HEV and BEV were obtained from [40]; while the capital cost for the normal FCEV was estimated as the capital cost for the HEV minus the capital cost of the internal combustion engine plus the capital cost of the fuel cell, using data from [59,60]. Capital costs in 2012 for compact and mini-sized road freight vehicles were assumed equal to values for passenger vehicles reported in [53]. Fuel consumption and capital cost evolution between 2012 and 2050 were assumed identical to the trends reported in the previous reference.
In order to estimate the RCO, vehicle capital costs were annualized over the vehicle service lives using a discount rate of 10%; corresponding to the average value of the range for typical discount rates for trucks reported in [30]. The same reference was used for the O&M costs for the normal ICEV, HEV and BEV, estimated in 0.124, 0.099 and 0.087 USD/km, respectively. O&M costs for compact and mini-sized vehicles were considered identical, 0.056 USD/km for ICEVs and HEVs, and 0.057 USD/km for BEVs and FCEVs [61,62]. O&M costs for all vehicle types were assumed to remain constant throughout the time horizon.
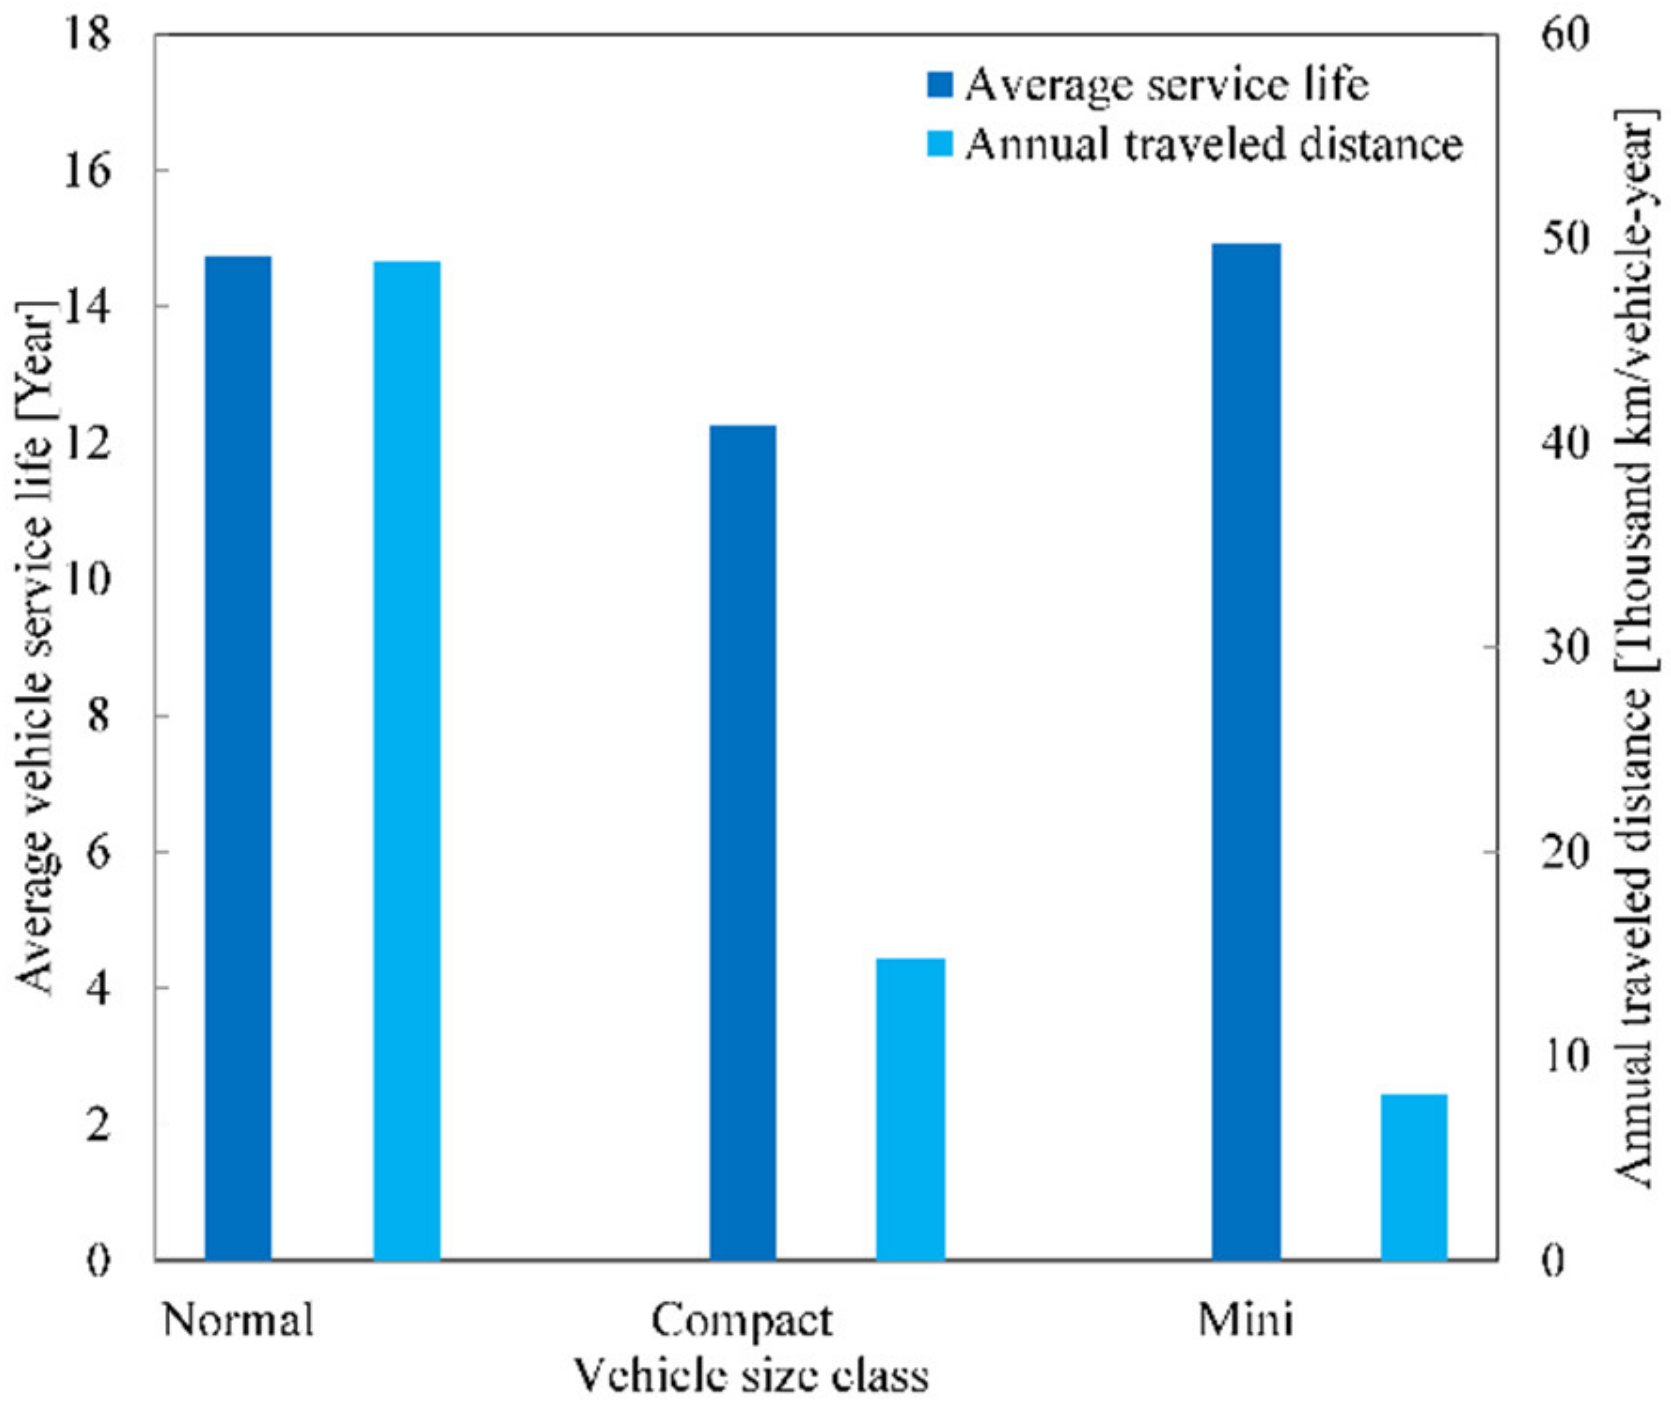
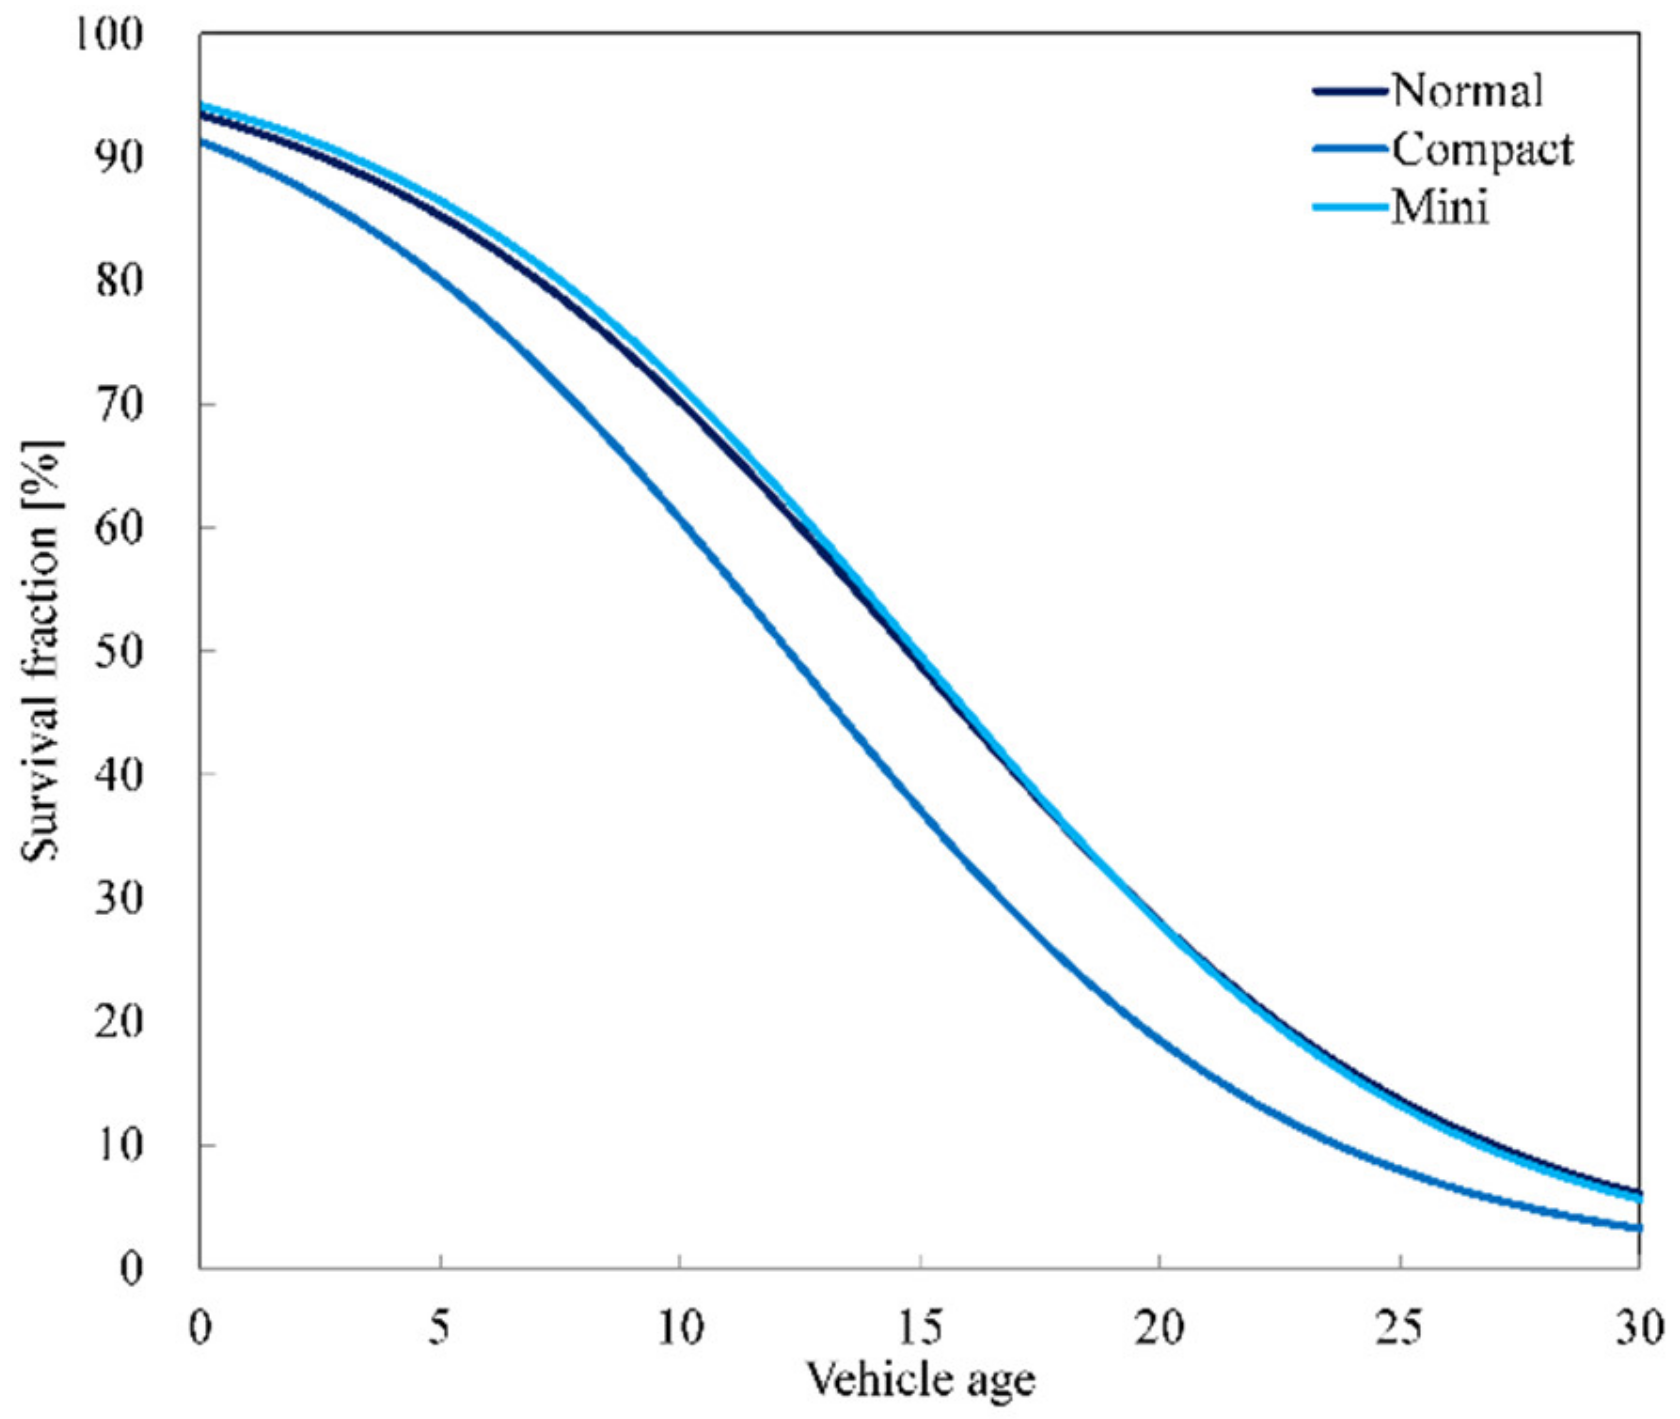
Vehicle usage characteristics are presented in Figure 3 and Figure 4. Annual traveled distance is reported for public and private vehicles for each vehicle size class by MLIT [63]. The shares of public and private vehicles in each vehicle size class were estimated using data from the Automobile Inspection & Registration Association (AIRIA) [64]. These values were used to calculate the annual traveled distance for each vehicle size class as the weighted sum of the annual traveled distances for public and private vehicles. The median vehicle service life for each vehicle size class corresponds to the average value reported by MOE [65]. Similar to Nishimura [66], survival profiles were estimated using the logistic curve shown in Equation (4):
where r is the vehicle survival rate, a is the vehicle age, a0 is the vehicle median service life, α is a model parameter set to 1, and β is a growth parameter. The growth parameter β was estimated equal to 0.180, 0.192 and 0.187 for normal, compact and mini-sized vehicles through model calibration against historical data for the road freight vehicle stock.
2.3. Road Freight Transport in Japan and Scenarios for Deep Decarbonization
Japan was selected as the case study, considering public acceptance of EDVs in the passenger LDV fleet; as well as being home to major OEMs. Historical data for road freight vehicle fleet stock, energy consumption and CO2 emissions for the years 2012 to 2016 were used to calibrate the model. Due to the long time scales involved in vehicle stock turnover, the time horizon was set between 2012 and 2050.
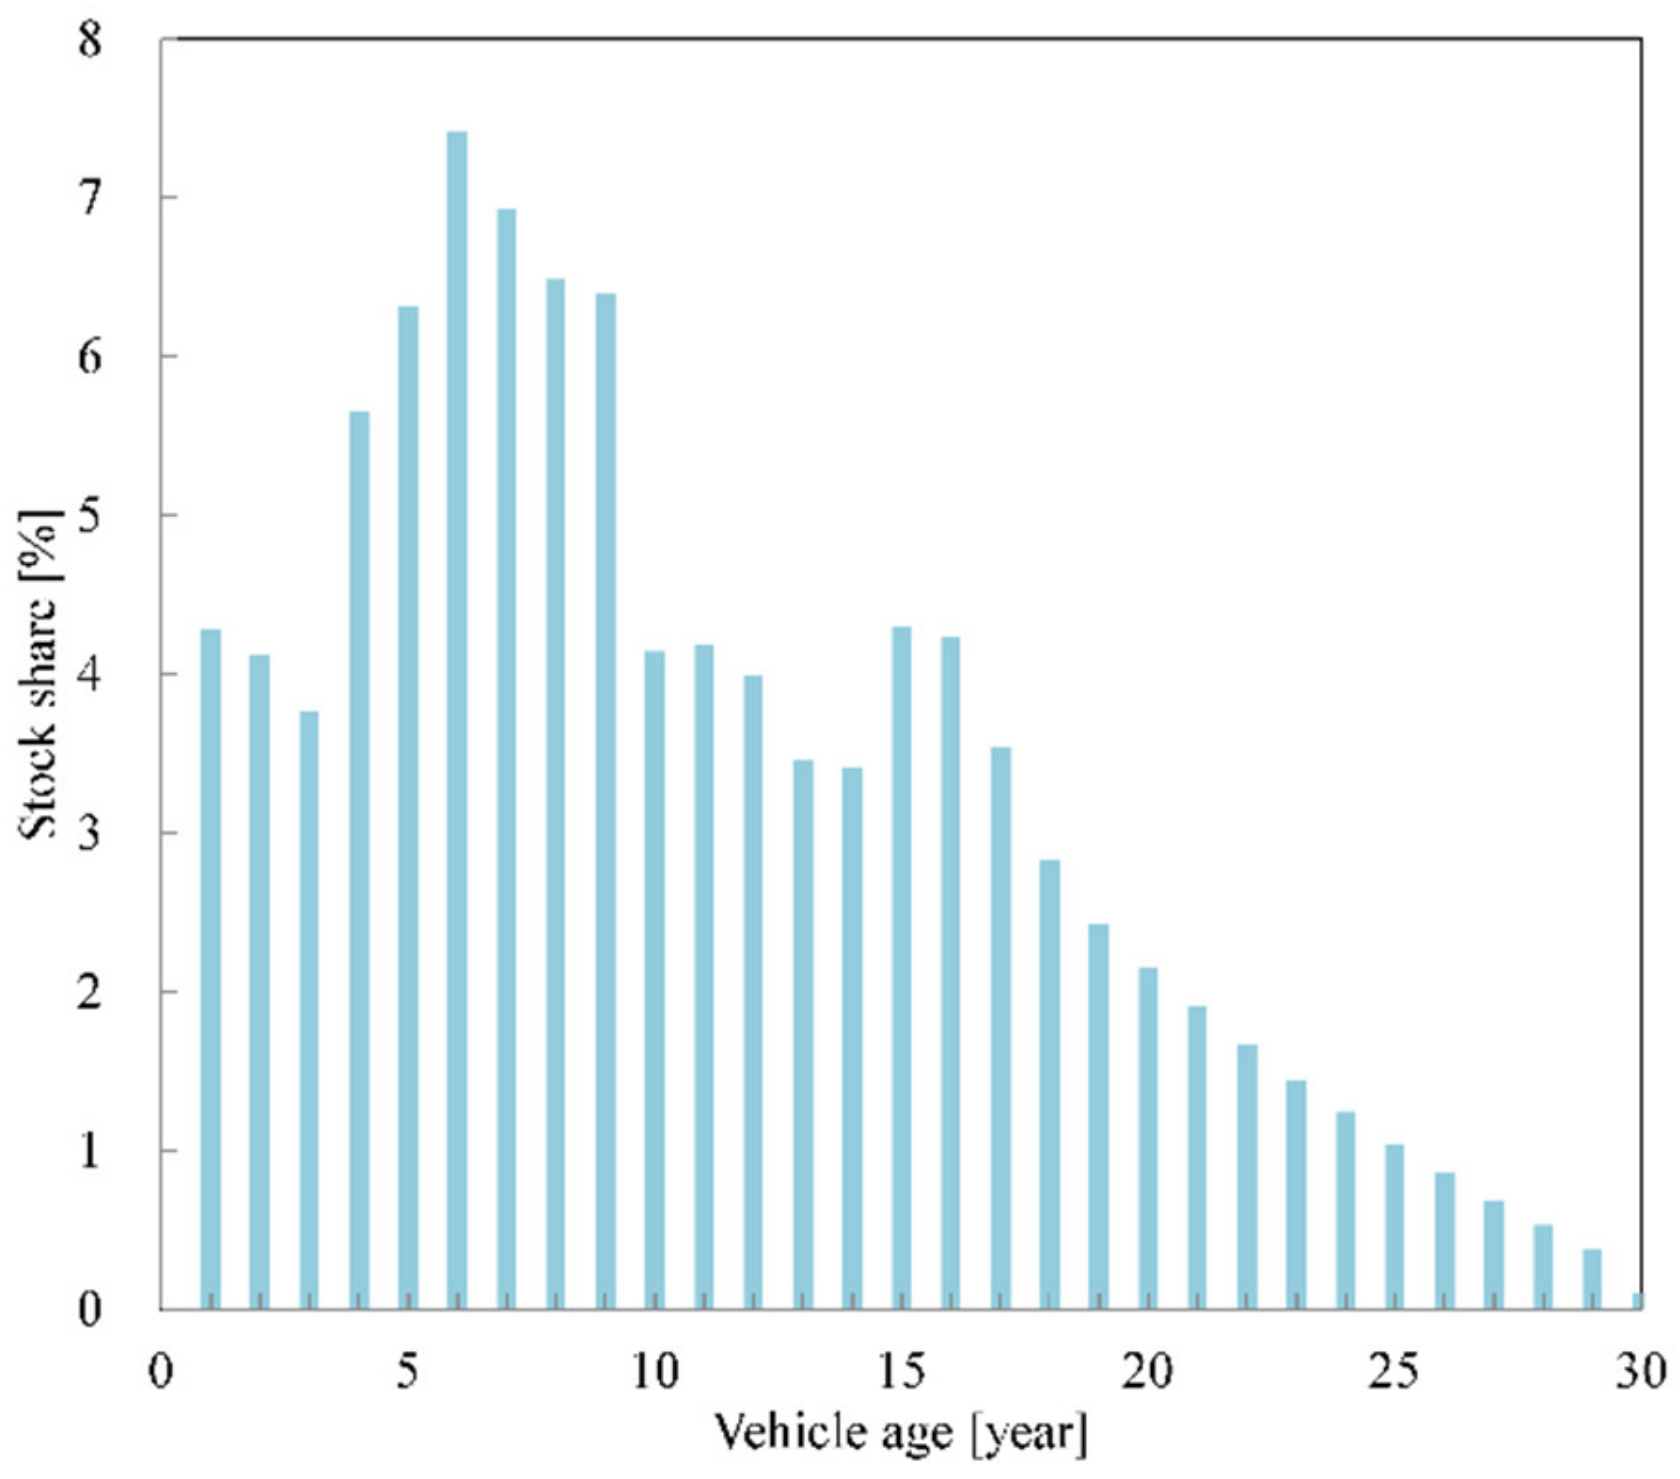
In the year 2012, road freight vehicle stock totaled 14.8 million vehicles; with normal, compact and mini-sized vehicles accounting for 15.3%, 24.8% and 60.0%, respectively [67]. The road freight vehicle stock distribution by vintage was constructed using data from AIRIA [68]. Data correspond to normal and compact vehicles. Due to data availability constraints, the same vehicle stock distribution was assumed for mini-sized road freight vehicles. Since available data only cover 20 vintages, in contrast with the 30 vintages considered in the model, the aggregated data for vintages 20 or older were redistributed by extrapolating the tendency for vintages newer than 20 years, guarantying that the sum of all vintages totaled 100%. The resulting vehicle stock distribution is shown in Figure 5.
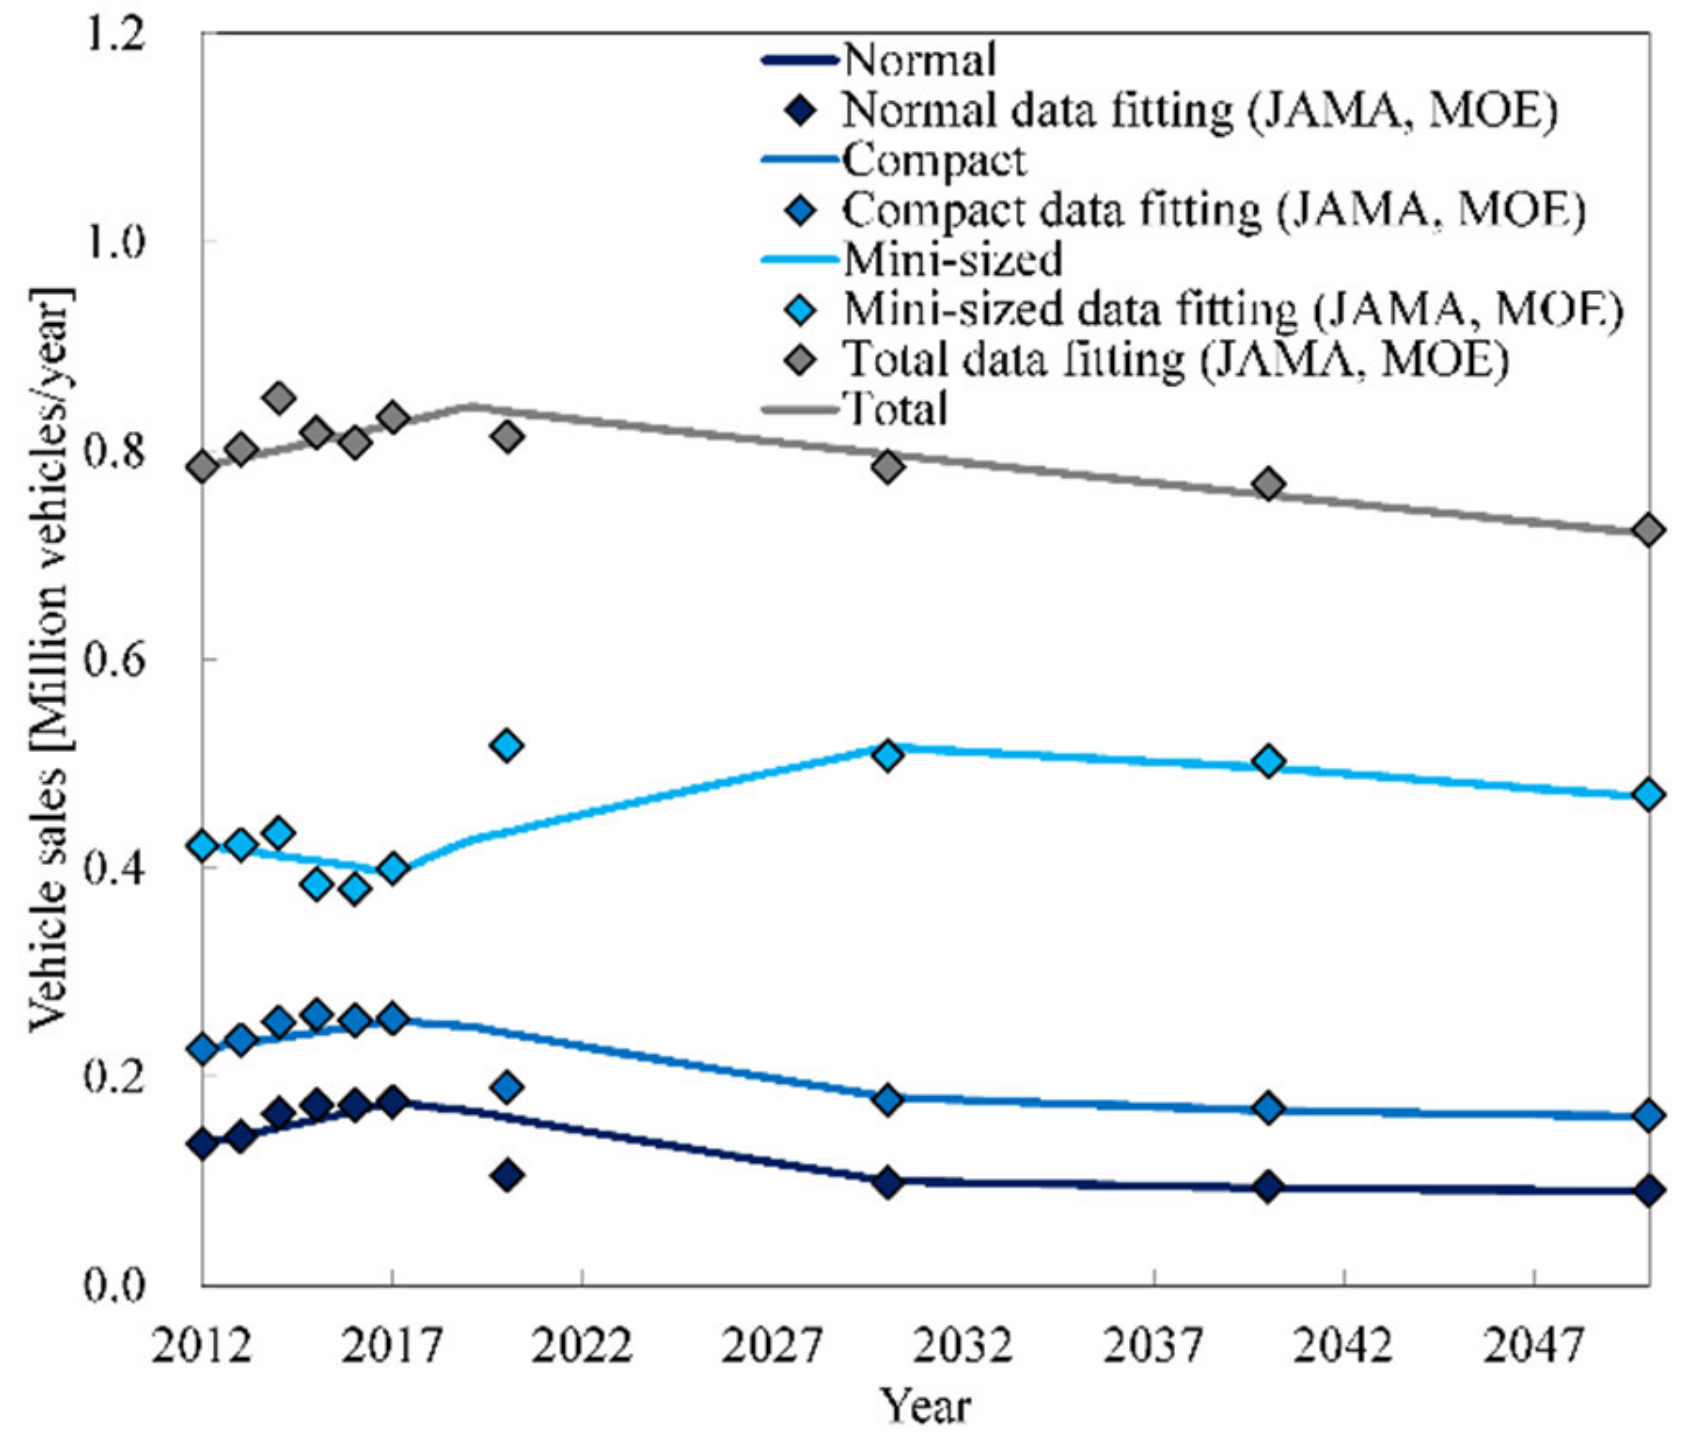
Annual sales for road freight vehicles in 2012 totaled 0.79 million vehicles; with normal, compact and mini-sized vehicles accounting for 17.4%, 28.9% and 53.7%, respectively [67]. Deployment of EDVs in road freight vehicles is still at an early stage, with 25 BEVs and 12204 HEVs in 2012 [69]. For matter of simplicity, it was considered that 2012 road freight vehicle stock and new vehicle sales were made only of ICEVs.
A scenario-based approach was used to assess the role of powertrain electrification in the decarbonization of the road freight vehicle fleet. Four scenarios, the Base scenario and three alternative scenarios for powertrain electrification were considered. All scenarios were defined in terms of the share of the powertrains in the 2050 new vehicle sales, as shown in Table 2.
The Base scenario represents the continuation of current trends, with HEVs and ICEVs dominating 2050 new vehicle sales, 38.3% and 55.1%; while BEVs and FCEVs do not achieve significant deployment, each of them accounting for 3.3% of the new vehicle sales [46]. New vehicle sales are shown in Figure 6. The growth trends for the new vehicle sales for each vehicle size class were adjusted using data from the Japan Ministry of Environment (MOE) [65] for future sales forecast, and from the Japanese Automobile Manufacturers Association (JAMA) [70] for historical sales. It was assumed that new vehicle sales do not vary across scenarios.
The HBB, HFF and FBB scenarios correspond to alternative scenarios where powertrain electrification is targeted by 2050. These alternative scenarios were built using a ‘silver bullet’ approach, where only one powertrain technology dominates each vehicle size class. Since normal road freight vehicles are usually used to travel the longest distances, corresponding to trips between cities often located in different prefectures, and are the heaviest, using BEV in this vehicle size class would require large batteries to complete each trip without stopping, or more frequent stops for battery charging; both of which increase the cost. Therefore, only HEVs or FCEVs were considered as candidates for powertrain electrification in normal vehicles. In compact and mini-sized vehicles, used typically for travels within cities that require shorter trips, powertrain electrification using BEVs and FCEVs was assessed. The HBB and HFF scenarios focus on mild decarbonization in normal vehicles using HEVs and deep decarbonization in compact and mini-sized vehicles using BEVs or FCEVs. The FBB scenario focuses on deep decarbonization across all vehicle size classes using FCEVs in normal vehicles and BEVs in compact and mini-sized vehicles.
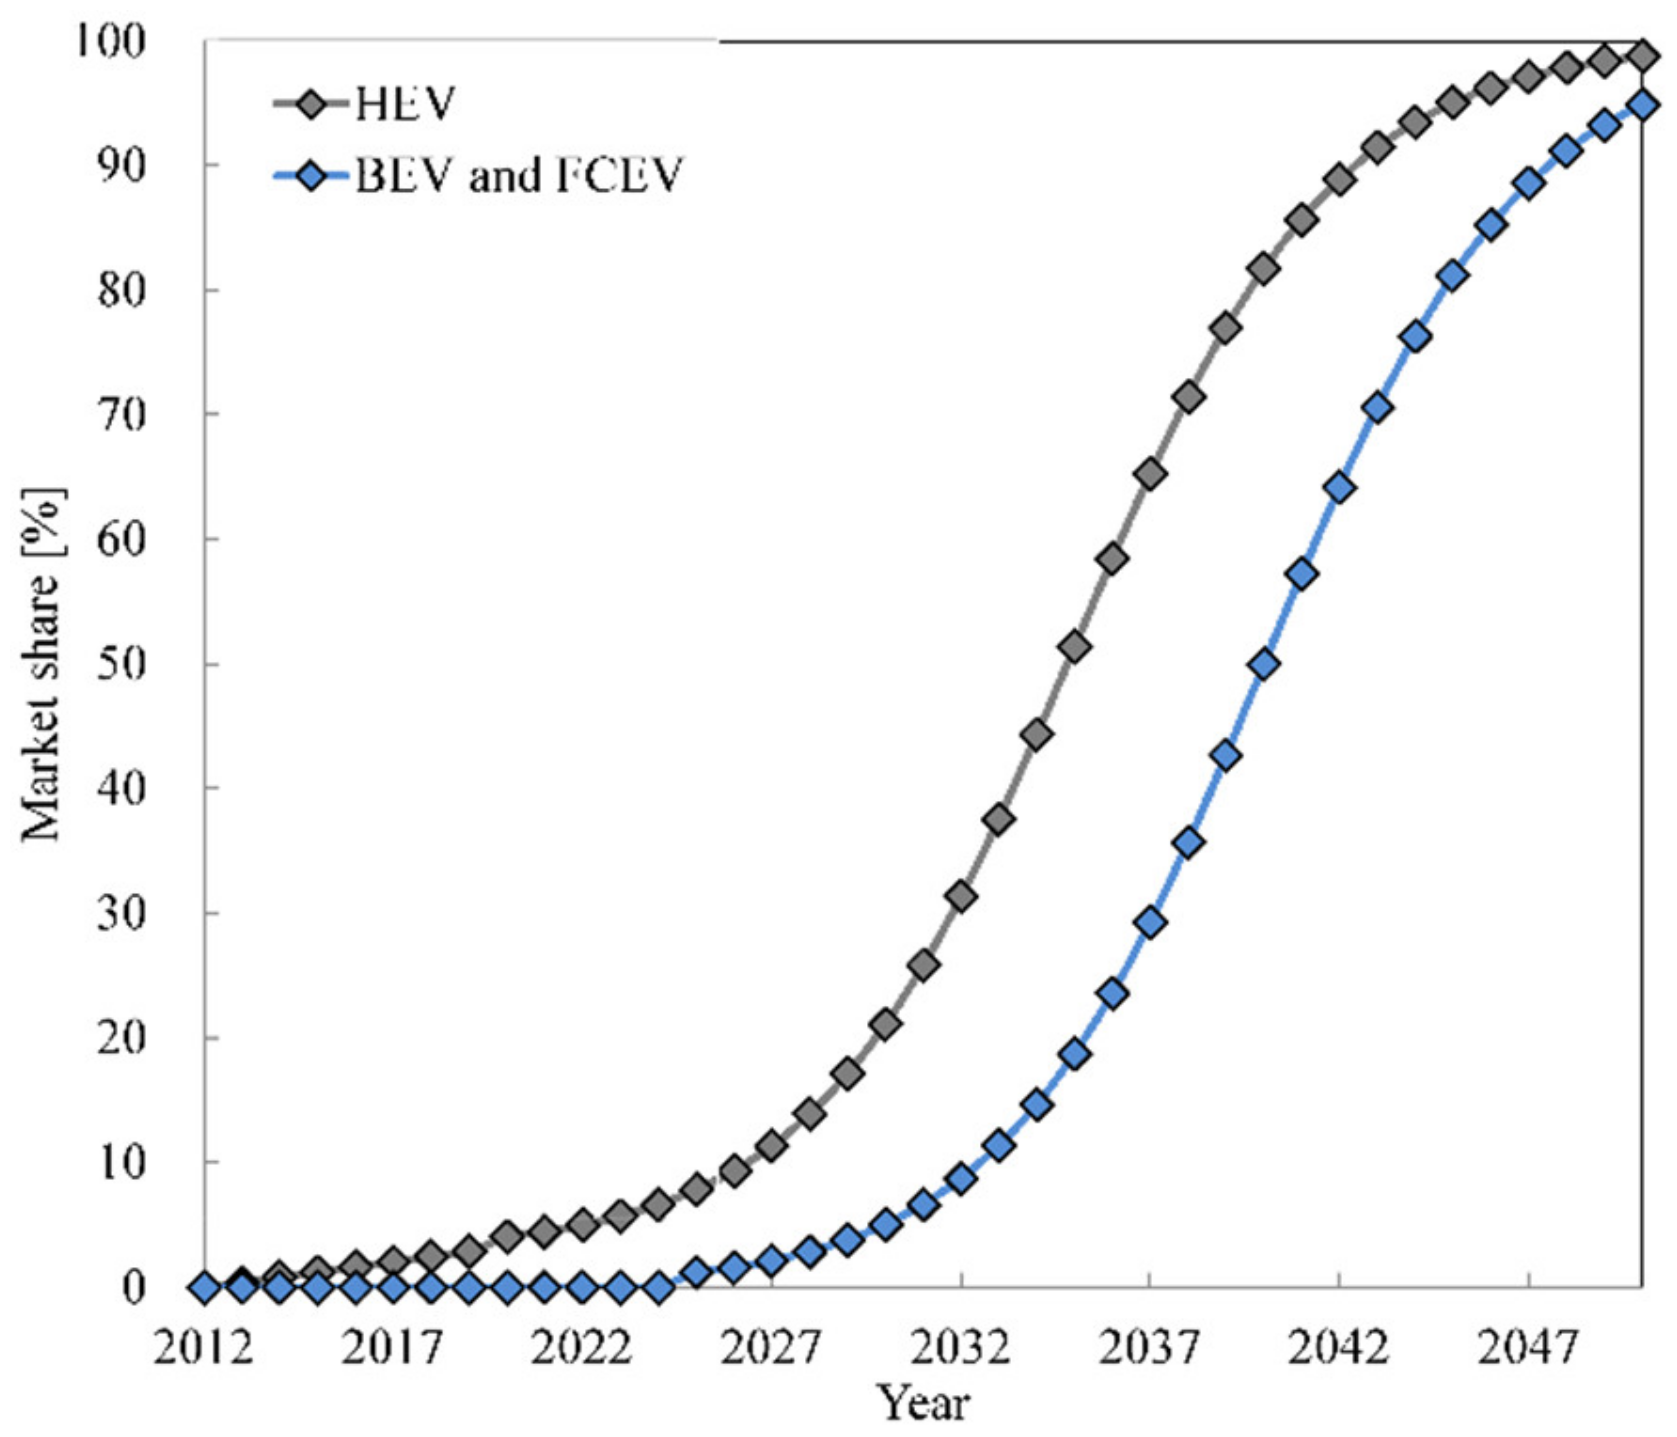
Market shares for EDVs in the alternative scenarios evolve as indicated in Figure 7. These technology diffusion curves were estimated following the methods described in [71]. It was assumed that 2020 is the initial year for HEV diffusion; while 2025 is the initial year for BEV and FCEV diffusion. EDV diffusion was considered symmetrical, with a technology diffusion span of 30 years [72].
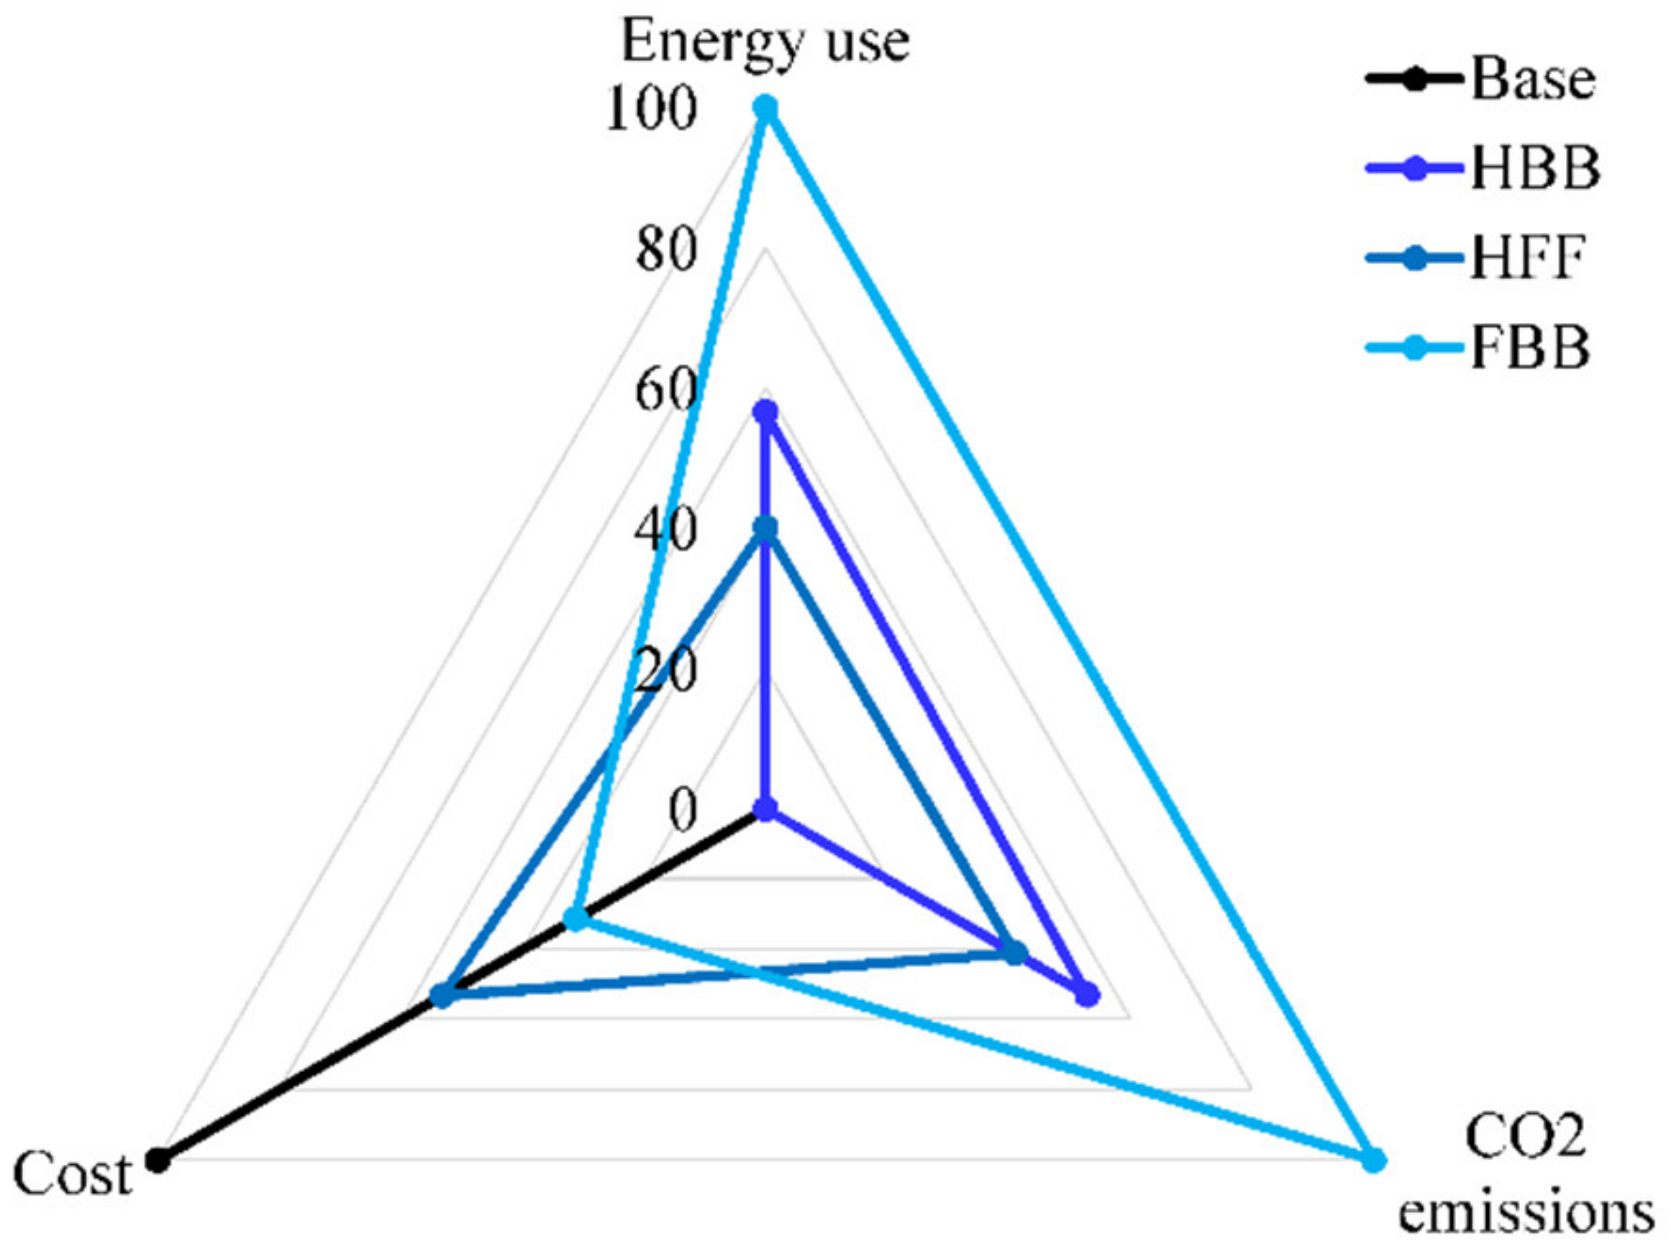
In order to compare the merit of each scenario in the decarbonization of the road freight vehicle fleet, a score analysis was performed. The performance of each scenario in 2050 was assessed in terms of the road freight vehicle fleet TTW energy consumption, WTW CO2 emissions and RCO. The scores were estimated following the methods developed in [73] using Equation (5):
2.4. Main Assumptions and Limitations
Alternative scenarios for powertrain electrification were built considering that each vehicle size class is dominated only by one powertrain. Even though this assumption is not realistic, it allows to estimate the maximum ‘technologically realizable’ CO2 emissions reduction potential of each powertrain electrification strategy. In that sense, CO2 emissions reduction potential estimated here corresponds to the largest possible CO2 emissions reductions of each strategy considering the dynamics of technology diffusion. Since there are several barriers that prevent the deployment of EDVs in road freight vehicles, the actual CO2 emissions reductions that can be achieved through powertrain electrification are smaller. Furthermore, since EDV diffusion is considered independently from vehicle RCO, road freight vehicle fleet energy consumption and CO2 emissions are not affected by changes in the RCO. This is a limitation of the study, as vehicle RCO affects consumer choices of vehicle type and therefore vehicle fleet energy consumption and CO2 emissions.
The composition of the Japanese road freight vehicle was simplified, assuming that each vehicle size class-powertrain combination is represented by only one vehicle type. Therefore, the model cannot capture the diversity of vehicle types existing in the real road freight vehicle fleet.
It was assumed that annual traveled distance and vehicle service life are identical for all vehicle types within each vehicle size class. Daily travel patterns were not considered and only the average annual traveled distance was used to characterize road freight transport activity. Vehicle service life and annual traveled distance were assumed to remain identical during the whole time horizon. Based on the model calibration for road freight vehicle fleet energy consumption and CO2 emissions, it was assumed that fuel consumption deteriorates as vehicles become older at a rate of 0.3%/year
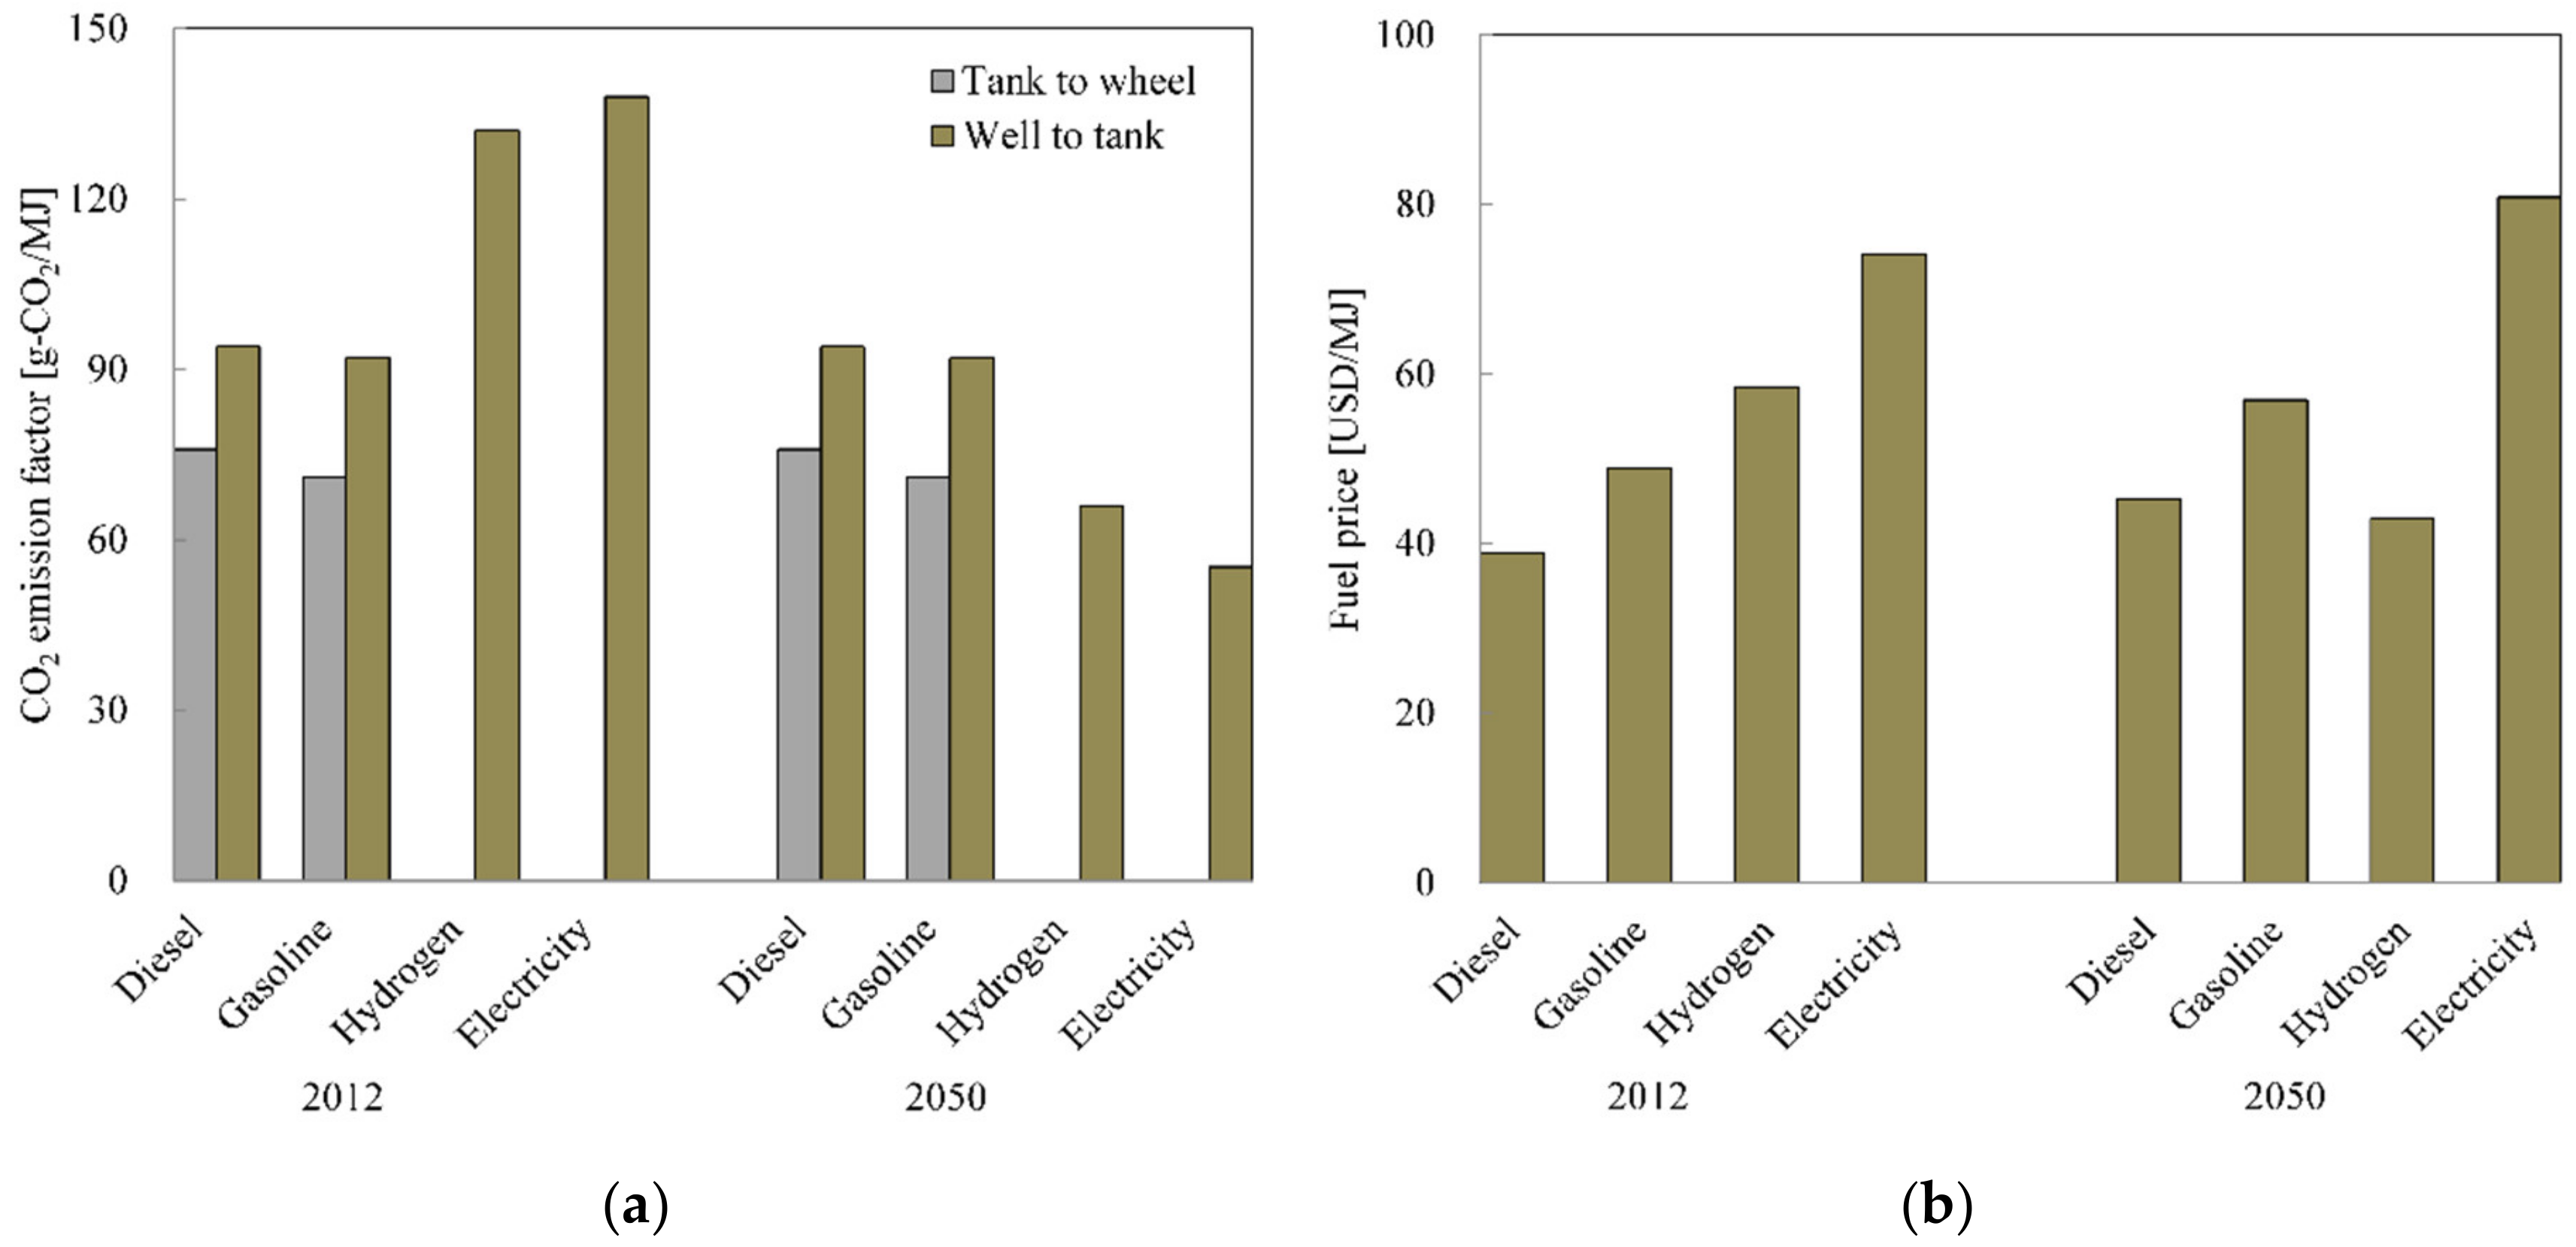
As fuel production is outside of the scope of this research, fuel prices and CO2 emission factors were considered exogenous to the vehicle stock turnover model. TTW and WTW CO2 emission factors for gasoline and diesel in 2012 were obtained from [74,75]. These values were assumed to remain constant over the time horizon, considering that TTW CO2 emissions are determined by the carbon content in the fuel, and gasoline and diesel production processes are mature. Gasoline and diesel prices in 2012 correspond to the values reported in [76]. Gasoline and diesel prices in 2050 were estimated under the assumption that the ratio between fuel price and crude oil price remains constant between 2012 and 2050. Values for the 4DS scenario from the International Energy Agency’s (IEA’s) Energy Technology Perspectives [77] were assumed for the crude oil price.
Electricity WTW CO2 emission factor in 2012 was the value reported by the IEA for the electricity generation mix in Japan [78]. Electricity WTW CO2 emission factor in 2050 corresponds to the value of the Nuclear Phase Out scenario from [79], which assumes electricity generation using 50% fossil fuels and 50% renewable energy. Electricity price in 2012 was the historical value reported in [76]; while the electricity price in 2050 was estimated based on the generation cost from [79] and network, retail and other costs from [80]. Steam Methane Reforming (SMR) share in hydrogen production was assumed to go from 100% in 2012 to 50% in 2050. The remaining hydrogen in 2050 is produced using 25% wind electrolysis and 25% solar photovoltaic electrolysis. Prices in 2012 and 2050 were estimated based on the share of each hydrogen production technology and the near term and future delivered hydrogen cost for each technology from [81]. WTW CO2 emission factors in 2012 and 2050 were estimated based on the share of each hydrogen production technology and the technology CO2 emission factor from [75]. Fuel prices and CO2 emission factors are presented in Figure 8.
3. Results and Discussion
3.1. Powertrain Electrification of the Road Freight Vehicle Stock
Results for the road freight vehicle fleet stock are presented in Figure 9. Differences between modeling results and historical data for the years 2012 to 2017 [70] are lower than 2%. Vehicle stock decreases in all scenarios from 14.7 to 12.3 million vehicles between 2012 and 2050. Compared with the base year, there is a small shift from normal and compact vehicles to mini-sized vehicles; with the stock share of mini-sized vehicles increasing to 66.6% and the stock shares of normal and compact vehicles decreasing to 13.3% and 20.1%, respectively. In this research, the selection of the vehicle size in road freight transport is considered exogenously. However, opportunities to reduce energy consumption and CO2 emissions can be unveiled by improving the selection of the vehicle size with a detailed analysis that includes the load capacity utilization rate and the daily travel patterns. This is suggested for future work.
By 2050, the share of ICEVs in the road freight vehicle stock decreases in all scenarios compared with the 2012 values; reaching 54.2% in the Base scenario, 40.9% in the HBB and HFF scenarios, and 42.8% in the FBB scenario. The largest diffusion for HEVs occurs in the Base scenario, reaching 42.9% of the vehicle stock by 2050. HEV diffusion is lower in other scenarios, accounting for 12.2% of the 2050 vehicle stock in the HBB and HFF scenarios, and 3.5% in the FBB scenario. Combining ICEVs and HEVs, diesel- and gasoline-fueled vehicles represent more than 46% of the road freight vehicle stock in all scenarios; evidencing the difficulty of reducing the dependence from fossil fuels in road freight transport.
Compared with EDV diffusion in the new vehicle market share presented in Figure 7, diffusion of EDVs in the road freight vehicle stock shown in Figure 9 is slower due to the time lag effect caused by the vehicle service lives; as most of the new vehicles replace current vehicles in use only after their service lives have finished. Long vehicle service lives are a barrier that prevents powertrain electrification in the road freight vehicle fleet. In the case of Japan, vehicle service lives for road freight vehicles are longer than values reported for other countries. For instance, service lives for heavy-duty trucks, medium-duty trucks, light-duty trucks, and mini-trucks in China are 12, 11, 9, and 8 years [82]; while in the United States, values between 7 and 10 years are reported for heavy-duty trucks [31], and 10 years for medium-duty trucks [27]. Even though reducing the vehicle service life for road freight vehicles might seem as a straight forward measure to accelerate penetration of EDVs in the vehicle stock, EDV manufacturing requires more energy and can produce more CO2 emissions than manufacturing ICEVs. Therefore, including vehicle cycle in the assessment of strategies for powertrain electrification in road freight transport is recommended for future research.
It should be noted that the road freight vehicle fleet was simplified considering only one vehicle type for each powertrain and vehicle size class combination. This is unrealistic, particularly for normal vehicles, given the broad range of GVWs for normal vehicles according to the MLIT classification. In that sense, a more detailed assessment of the normal road freight vehicle fleet is recommended. Furthermore, it was not possible to consider road freight EDVs as one existing vehicle model due to lack of data. Instead, vehicle data were constructed using different sources in the existing literature. A more realistic characterization of the road freight vehicle fleet can be achieved by modeling each vehicle type using vehicle modeling software such as Autonomie and PAMVEC. This is also suggested for future work.
3.2. Power Electrification Potential for Decarbonization of Road Freight Transport
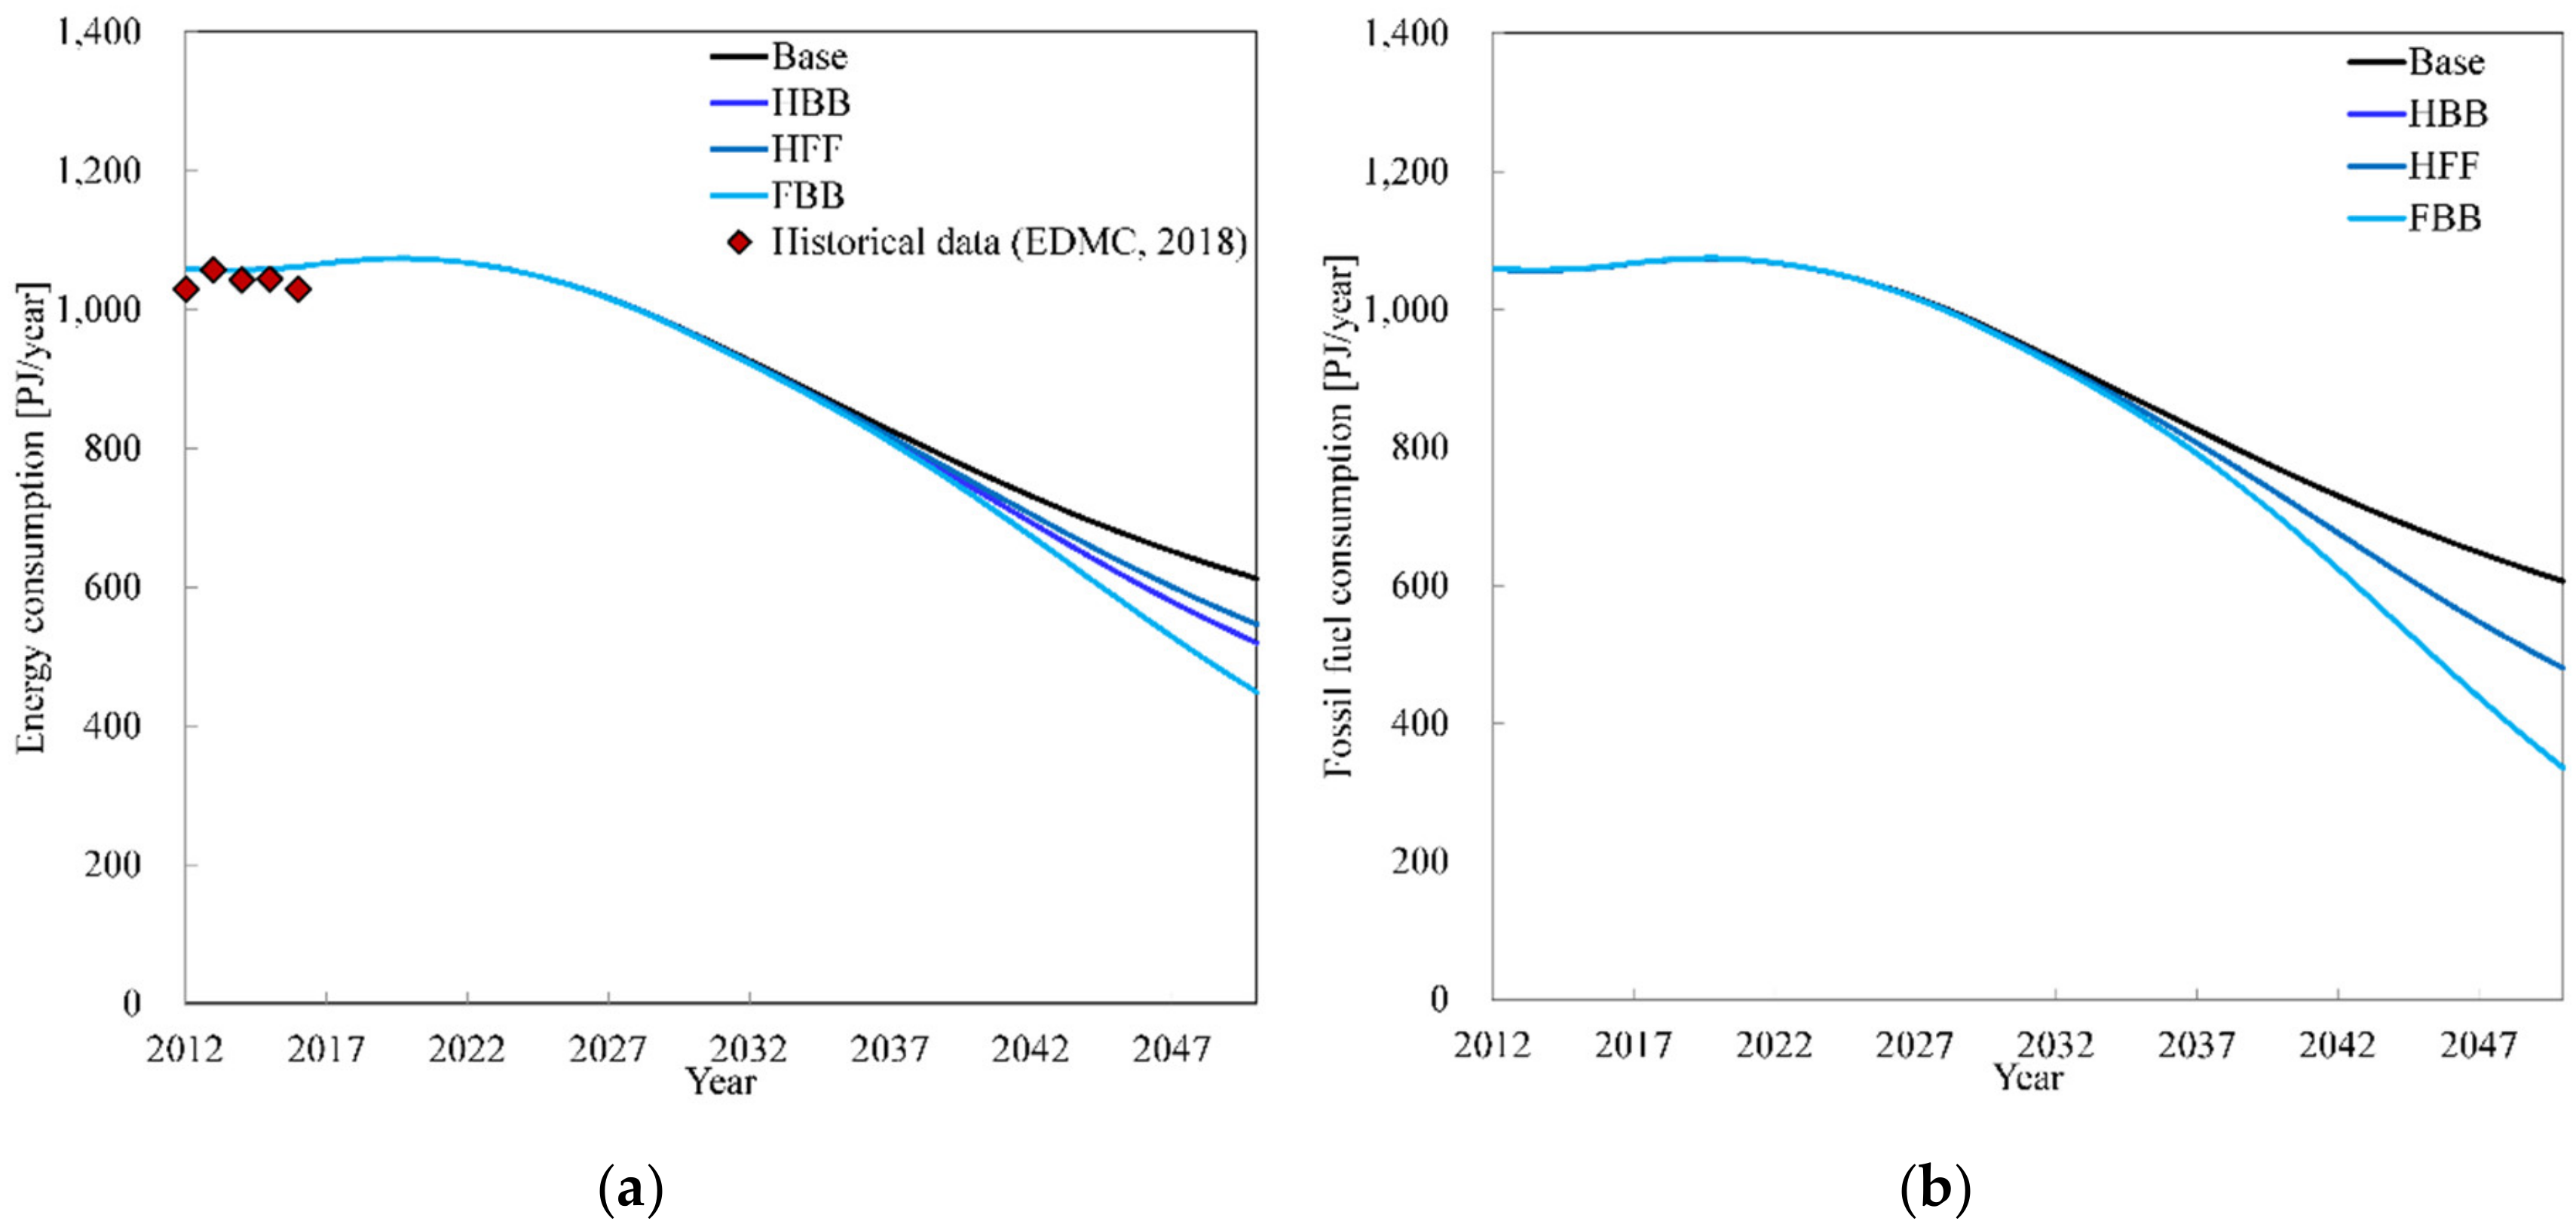
Results for TTW energy consumption along with historical data [16] are presented in Figure 10. Differences between results for the Base scenario and historical data are lower than 4%. TTW energy consumption in the Base scenario increases, reaching the peak at 1074 PJ/year in 2020, to decrease until reaching 613 PJ/year by 2050. Drivers for TTW energy consumption reduction in the Base scenario are vehicle stock reduction, vehicle fuel consumption improvement and HEV adoption. Since BEV and FCEV diffusion is small, diesel and gasoline account for 99.0% of TTW energy consumption.
In the alternative scenarios, TTW energy consumption remains identical to the Base scenario until EDV diffusion starts, 2020 in the HBB and HFF scenarios, and 2025 in the FBB scenario. By 2050, TTW energy consumption is reduced 15.1%, 10.7% and 26.7% in the HBB, HFF and FBB scenarios, compared with the baseline value. As fuel shift occurs in the alternative scenarios, reductions for fossil fuel consumption are larger than reductions for energy consumption; up to 20.8% in the HBB and HFF scenarios and 44.7% in the FBB scenario, compared with the 2050 baseline values.
Powertrain electrification increases electricity and/or hydrogen consumption in road freight transport. Electricity consumption and hydrogen consumption reach 3.3 and 2.6 PJ/year in the Base scenario by 2050, respectively. In contrast, electricity consumption increases up to 39.7 PJ/year in the HBB and FBB scenarios; while hydrogen consumption increases up to 66.6 and 73.6 PJ/year in the HFF and FBB scenarios. Since the stock share and vehicle fuel consumption of ICEVs and HEVs are larger than the values for BEVs and FCEVs, diesel and gasoline represent more than 74% of TTW energy consumption in all alternative scenarios by 2050, despite the large increments in electricity and hydrogen consumption.
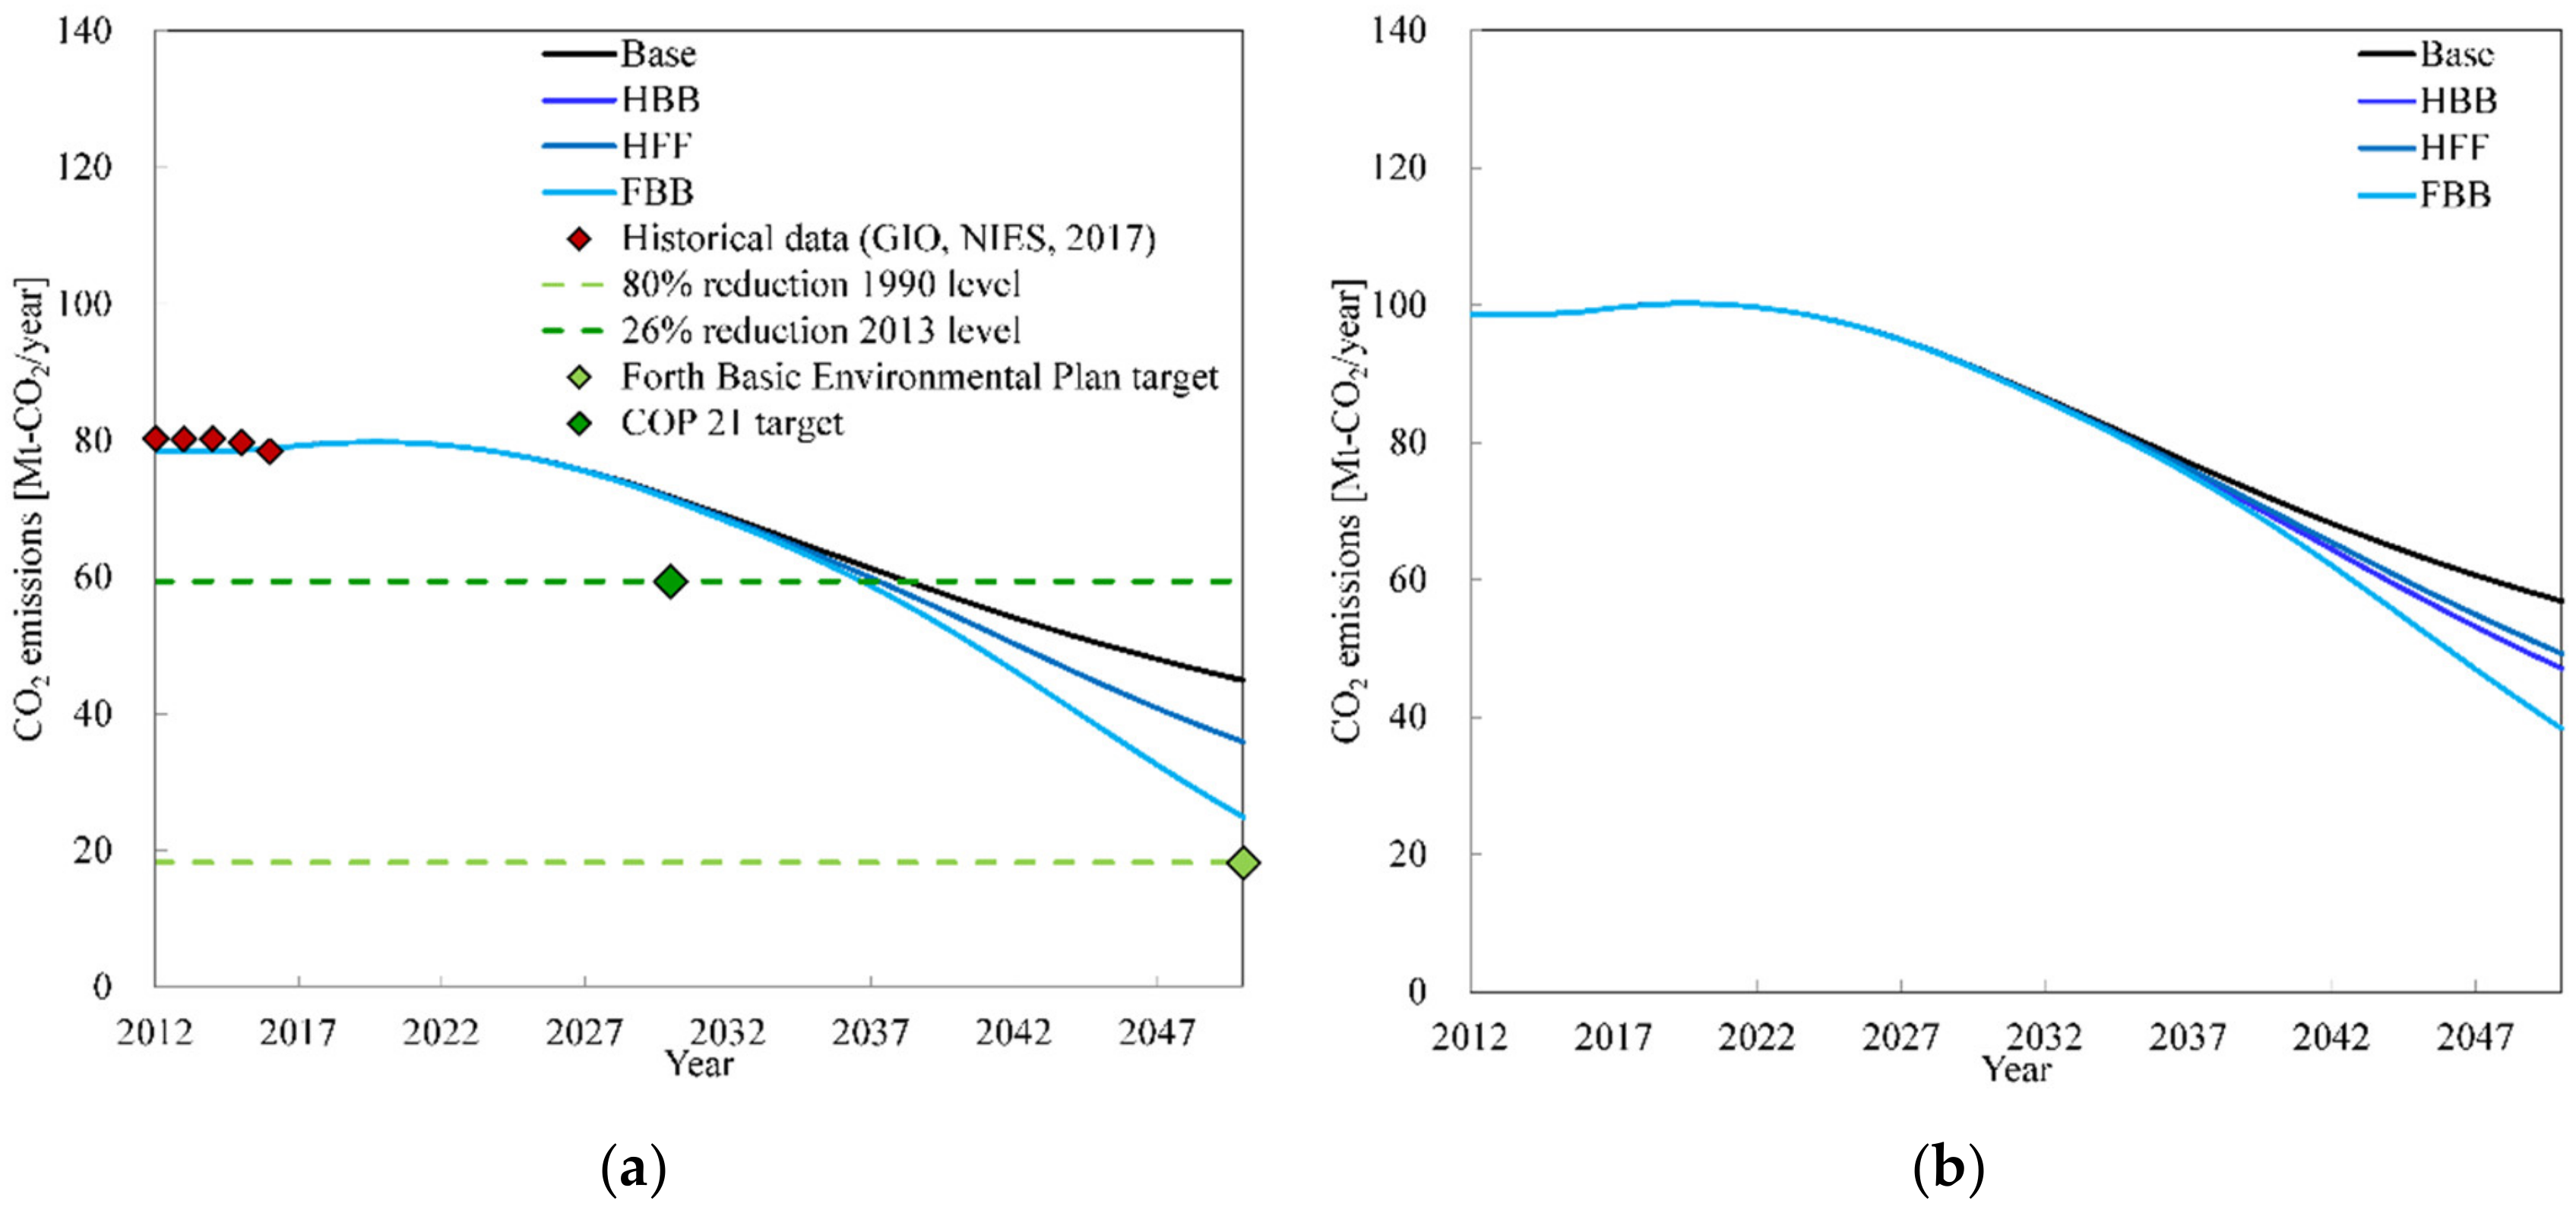
Even though the fuel cycle is out of the scope of this research, CO2 emissions are presented both on TTW and WTW basis, with the aim of providing more insights on the impact of powertrain electrification on the road freight vehicle fleet. TTW CO2 emissions along with historical data [83] are presented in Figure 11a. Differences between the modeling results for the Base scenario and historical data are lower than 3%. In the Base scenario, TTW CO2 emissions increase until reaching the peak in 2020 at 79.8 Mt-CO2/year; to decrease thereafter, until reaching 44.9 Mt-CO2/year by 2050. Since BEV and FCEV diffusion is small and CO2 emission factors for diesel and gasoline are constant throughout the time horizon, TTW CO2 emissions reduction is caused by the same drivers that cause TTW energy consumption reduction: vehicle stock reduction, vehicle fuel consumption reduction and HEV adoption.
TTW CO2 emissions can be reduced up to 20.1% in the HBB and HFF scenarios and 44.6% in the FBB scenario, compared with the 2050 baseline value. The Japanese government aims to achieve two CO2 emissions reduction targets: one for the medium-term, proposed at the 21st Conference of the Parties (COP21), corresponding to 26% CO2 emissions reduction compared with the 2013 values by 2030; and one for the long-term, proposed in the Forth Basic Environmental Plan, corresponding to 80% CO2 emissions reduction compared with the 1990 values by 2050. Results for the road freight vehicle fleet TTW CO2 emissions show that none of the CO2 emissions reductions target can be achieved in any of the alternative scenarios considering powertrain electrification. In that sense, meeting CO2 emissions reduction targets that involve proportional CO2 emissions reductions across all sectors in road freight transport requires measures other than powertrain electrification.
WTW CO2 emissions are shown in Figure 11b. Compared with TTW CO2 emissions, WTW CO2 emissions are larger in all scenarios, since CO2 is emitted during the production of electricity and hydrogen is included. In the Base scenario, WTW CO2 emissions decrease from 98.8 Mt-CO2/year in 2012 to 56.9 MT-CO2/year in 2050. Even including the CO2 emitted to produce electricity and hydrogen, powertrain electrification yields lower WTW CO2 emissions than the Base scenario; with maximum CO2 emissions reductions of 17.3%, 13.4% and 32.6% in the HBB, HFF and FBB scenarios, respectively. Since WTW CO2 emissions are determined by the energy resources used to produce electricity and hydrogen, it is necessary to focus on the simultaneous decarbonization of electricity and hydrogen production to enhance CO2 emissions reductions from powertrain electrification in road freight transport.
CO2 emissions reductions for powertrain electrification estimated in this research represent the maximum ‘technologically realizable’ CO2 emissions reduction potential; and they correspond to the upper limit of the CO2 emissions reductions achievable by replacing ICEVs with EDVs in road freight transport. However, in practice, powertrain electrification in road freight transport will lead to lower CO2 emissions reductions than estimated here due to barriers that prevent EDV diffusion such as public acceptance, vehicle use diversity, short payback times, and risk aversion. It is recommended to endogenize these barriers in future modeling of the road freight vehicle fleet.
3.3. Economic Impact of Powertrain Electrification on the Road Freight Vehicle Fleet
The evaluation of the economic impact of powertrain electrification on the road freight vehicle fleet was performed in terms of the net cash flow; defined as the difference between the road freight vehicle fleet RCO for a given scenario and the road freight vehicle fleet RCO for the Base scenario. The net cash flows for the alternative scenarios are presented in Figure 12. Since penetration of EDVs in the new vehicle sales is slow during the early stages of deployment, net cash flows for all alternative scenarios remain close to zero until 2030. Differences become larger thereafter. The HBB scenario has the largest net cash flows, with the peak outside the time horizon and reaching 9.6 billion USD/year by 2050. The second largest net cash flows are obtained for the FBB scenario, peaking at 6.7 billion USD/year in 2049, and reaching 6.6 billion USD/year by 2050. The lowest net cash flows are obtained for the HBB scenario, peaking at 4.6 billion USD/year in 2049, reaching 4.5 billion USD/year by 2050. It can be seen that the largest values for the net cash flow are obtained for scenarios with BEV diffusion. Furthermore, if BEVs were to be deployed in compact and mini-sized vehicles, it is more cost-effective to deploy FCEVs than HEVs in normal vehicles.
Powertrain electrification leads to lower energy consumption in the alternative scenarios than in the Base scenario; with energy savings reaching 4.2, 4.6 and 7.6 billion USD/year by 2050 in the HBB, HFF and FBB scenarios. However, incremental capital and O&M costs increase for all alternative scenarios, reaching 13.8, 9.0 and 14.2 billion USD/year by 2050 in the HBB, HFF and FBB scenarios. Since energy savings cannot outweigh capital cost increments when BEVs and FCEVs are deployed, net cash flows remain positive during the whole time horizon in all alternative scenarios.
3.4. Policy Implications
In order to obtain a complete perspective of the impact of powertrain electrification on the road freight vehicle fleet, the performance of all scenarios was assessed in terms of TTW energy use, WTW CO2 emissions and RCO. Scores for the Base scenario and the three alternative scenarios in 2050 are shown in Figure 13. Ideally, the goal is to reduce energy consumption and CO2 emissions while reducing or maintaining the fleet RCO. However, as seen from the net cash flow, powertrain electrification increases the road freight vehicle fleet RCO compared with the Base scenario. The Base scenario is the top performer in terms of cost. Nevertheless, it has the lowest performance in terms of energy use and CO2 emissions. In contrast, the HFF scenario has better performance in terms of CO2 emissions; however, cost performance is reduced by half compared to the Base scenario. The HBB scenario can offer larger CO2 emissions reductions compared with the HFF scenario; nevertheless, it has the lowest cost performance out of all scenarios. The best performance overall is obtained in the FBB scenario, showing the largest energy consumption and CO2 emissions reductions, with a cost performance between the HFF and HBB scenarios. Therefore, diffusion of FCEVs in normal vehicles and BEVs in compact and mini-sized vehicles is recommended as the best strategy for powertrain electrification in road freight transport in Japan.
In order to achieve powertrain electrification in road freight transport, it is important to incentivize OEMs to accelerate the development and mass production of road freight EDVs. As road freight vehicle owners often own several vehicles and are more focused on reducing cost than passenger LDV owners [16], policies to incentivize powertrain electrification can have a faster acceptance in road freight vehicles than in passenger LDVs. Therefore, it is also recommended to design measures to help road freight vehicle fleet owners investing in EDVs. Additionally, diffusion of EDVs in road freight transport can help improving social acceptance and developing infrastructure that can benefit EDV diffusion in passenger LDVs. In that sense, the assessment of powertrain electrification strategies that include passenger LDVs and road freight vehicles considering the dynamics of technology diffusion is suggested for future research.
A large asymmetry was found between the vehicle stock distribution by size class and the CO2 emissions. Normal vehicles account for 13.3% of the road freight vehicle stock in all scenarios. However, they account for more than 61% of TTW and WTW CO2 emissions. Considering normal vehicle stock is the smallest among all road freight vehicle size classes and it is concentrated in few users, it is recommended to prioritize normal vehicles when designing measures for powertrain electrification in road freight transport.
3.5. Sensitivity Analysis
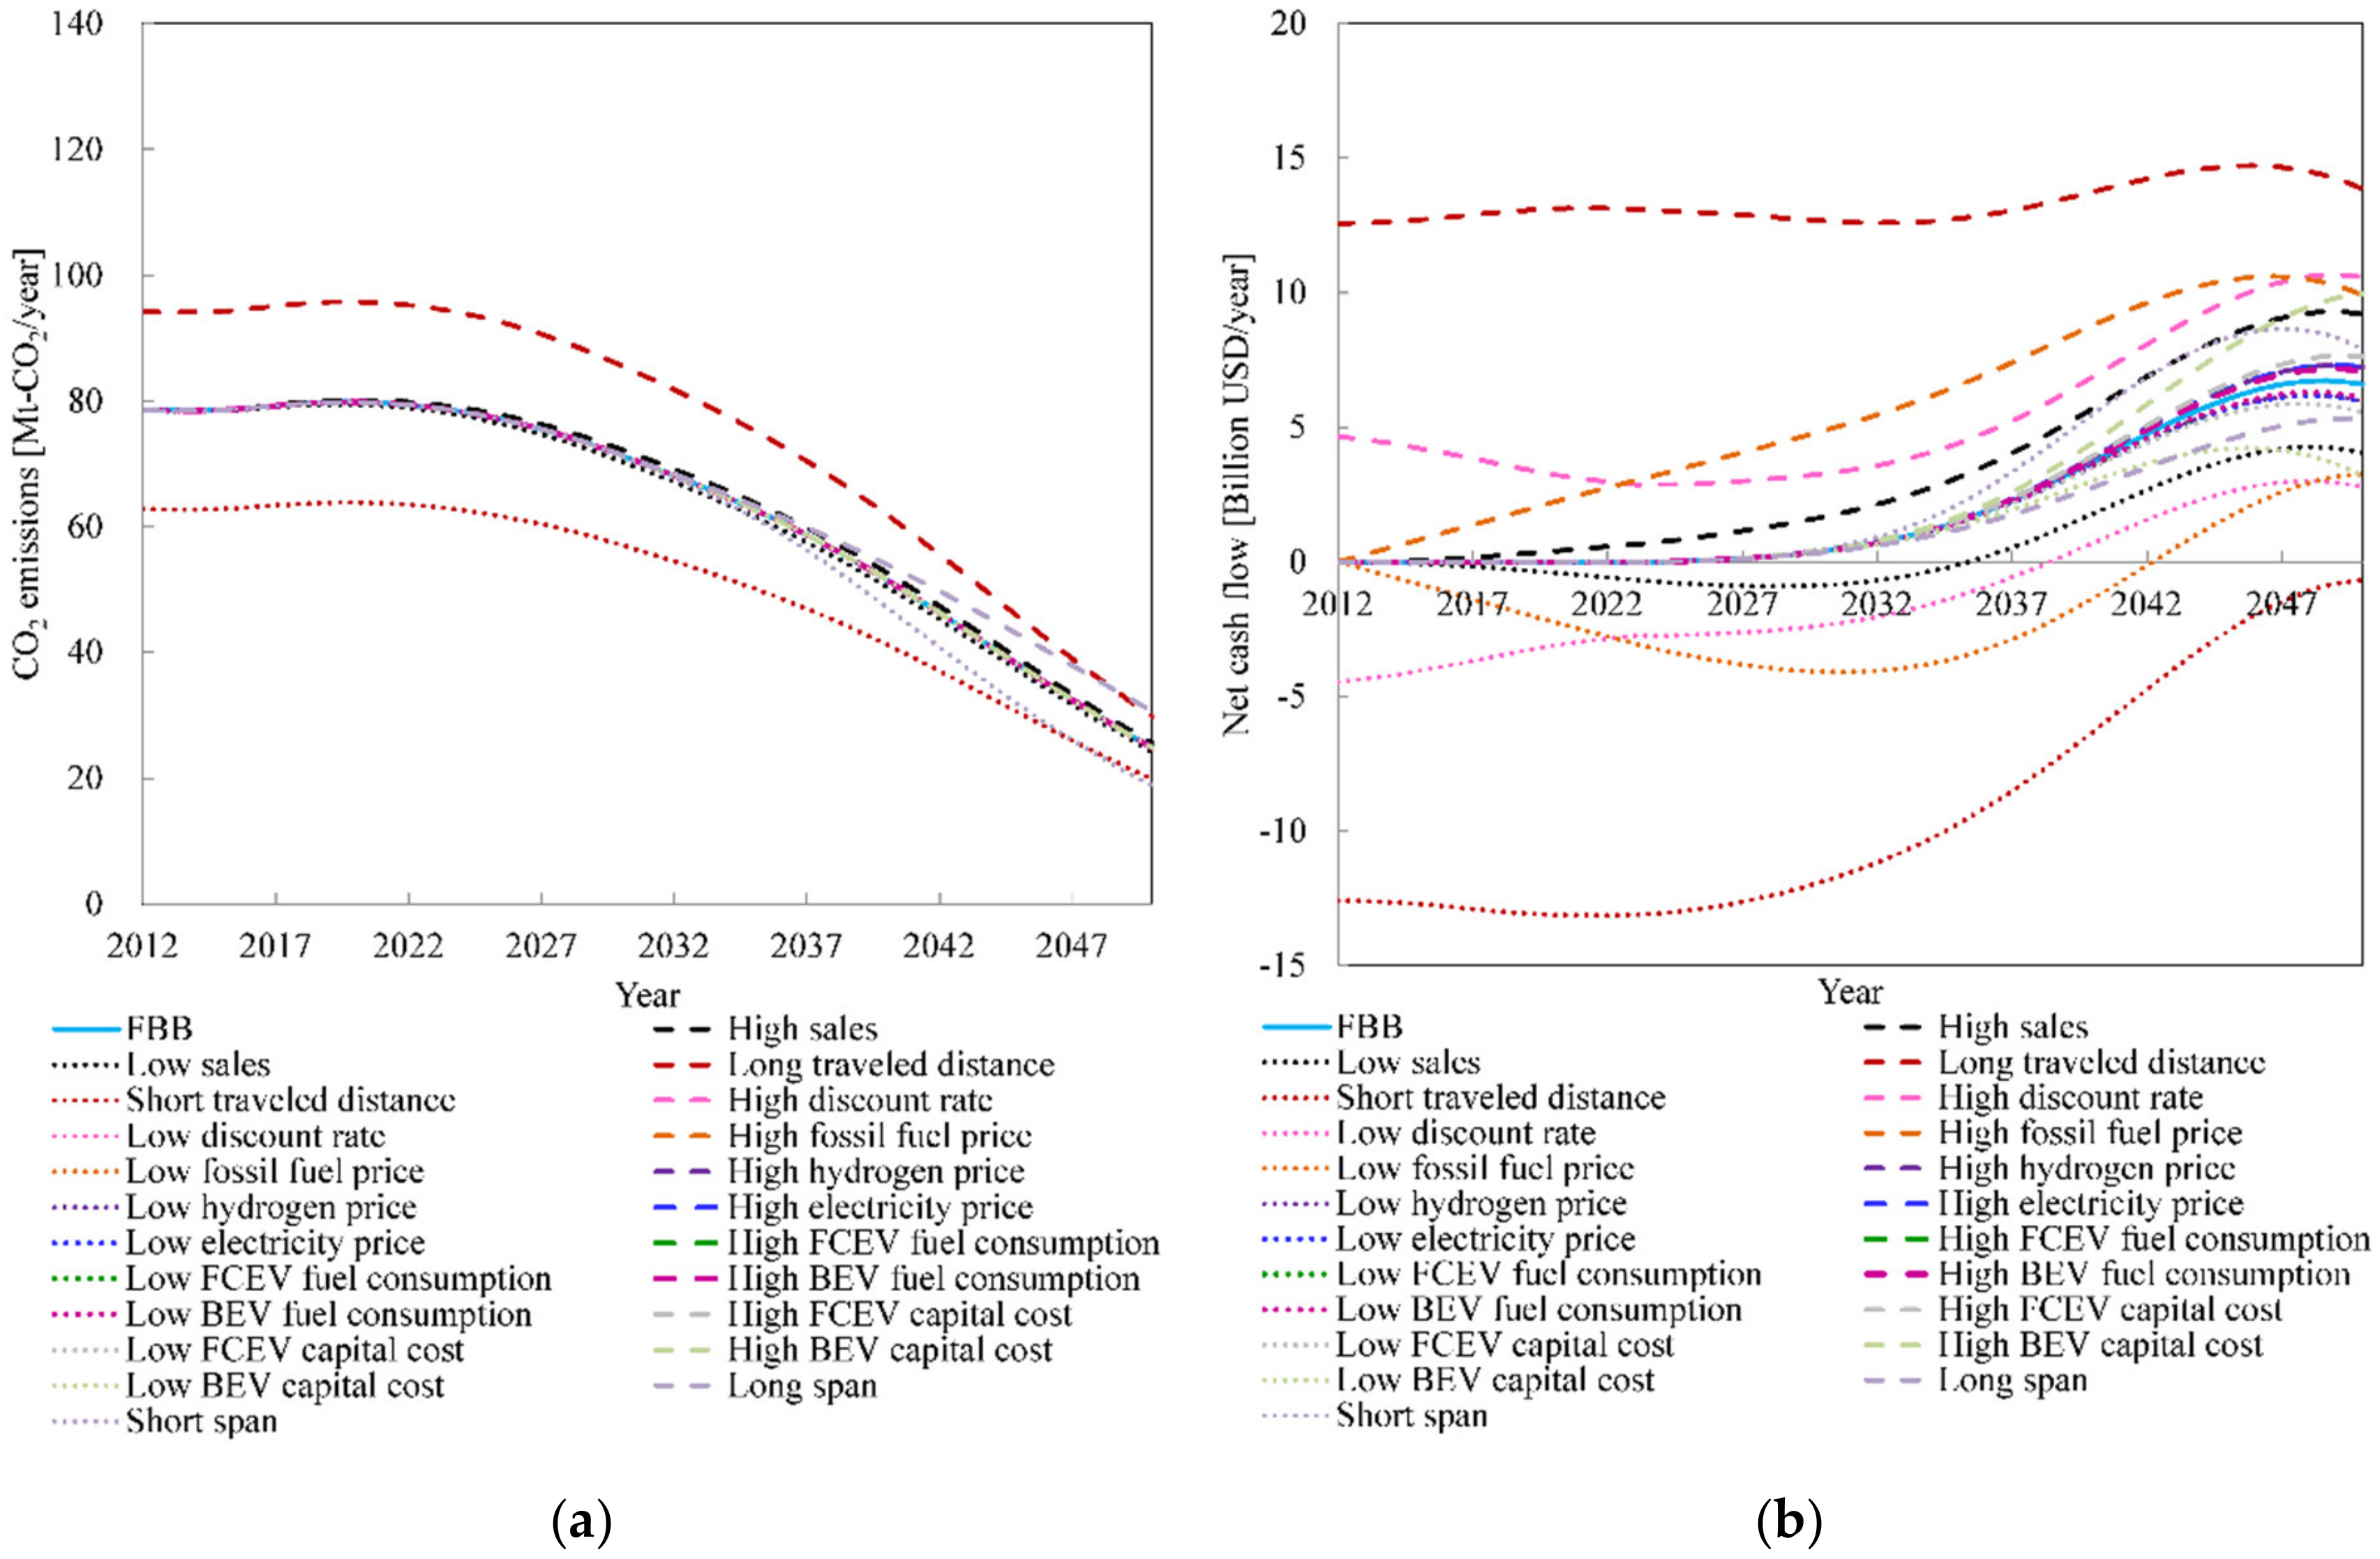
Since the time scales involved in technology diffusion in road transport are long, a time horizon between 2012 and 2050 was selected to study the role of powertrain electrification in the decarbonization of road freight transport. However, using a long time horizon implies large uncertainties in the parameters used to characterize the elements of the energy system. A sensitivity analysis was performed to understand the impact of those uncertainties on the modeling results. The impact of changes in fossil fuel price, hydrogen price, electricity price, annual traveled distance, new vehicle sales, discount rate, BEV fuel consumption, FCEV fuel consumption, BEV capital cost, FCEV capital cost, and technology diffusion span on the results for the FBB scenario was assessed. A variation of ±20% was considered for all the parameters. Results of the sensitivity analysis for the TTW CO2 emissions and net cash flow are presented in Figure 14.
TTW CO2 emissions are most sensitive to variations in annual traveled distance and technology diffusion span, as they affect the stock of ICEVs in the road freight vehicle fleet. Other parameters produce small or no variations on TTW CO2 emissions. This is a consequence of the ‘silver bullet’ approach used to determine the maximum ‘technologically realizable’ CO2 emissions reduction potential of powertrain electrification, which considers EDV diffusion independent of the vehicle fleet RCO. Linking EDV diffusion and cost in the vehicle stock turnover model of the road freight vehicle fleet is recommended for future work.
The net cash flow is most sensitive to variations in annual traveled distance. Changes in the discount rate, fossil fuel price, BEV capital cost, and new vehicle sales also affect significantly the results for the net cash flow. Since the ICEV stock is larger than the EDV stock and fuel consumption is higher for ICEVs than for EDVs, the net cash flow is more sensitive to variations in the fossil fuel price than to variations in electricity and hydrogen price. In that sense, variations in fossil fuel price have a larger impact on the economic competitiveness of EDVs than variations in hydrogen and electricity price. Variations in the capital cost of FCEVs and BEVs change both the value and timing for the net cash flow peak; with the effect of BEV capital cost being larger than the effect of FCEV capital cost.
4. Conclusions
A vehicle stock turnover model of the road freight vehicle fleet was used to assess the role of powertrain electrification in the decarbonization of road freight transport in the case of Japan between 2012 and 2050. Main conclusions are listed below:
- Driven by the reduction of the vehicle stock, the improvement of vehicle fuel consumption and the adoption of HEVs, energy consumption and CO2 emissions decrease around 42% between 2012 and 2050 in the Base scenario. In contrast, powertrain electrification can reduce TTW CO2 emissions up to 20.1% in the HBB and HFF scenarios and 44.6% in the FBB scenario, compared with the 2050 baseline value; while maximum WTW CO2 emissions reductions are 17.3%, 13.4% and 32.6% in the HBB, HFF and FBB scenarios. Despite the significant reductions in CO2 emissions, powertrain electrification alone is not enough to achieve any of the CO2 emissions reduction targets in road freight transport.
- Despite aggressive deployment of EDVs, diesel- and gasoline-fueled vehicles account for more than 46% of the vehicle stock and more than 74% of the road freight vehicle fleet TTW energy consumption in all scenarios. This evidences the difficulty of reducing the dependence of fossil fuels in road freight transport. In that sense, considering other measures to reduce CO2 emissions in road freight transport along with powertrain electrification is suggested for future research.
- The net cash flows are positive for all alternative scenarios considering powertrain electrification during the whole time horizon. The HFF scenario has the lowest net cash flows, peaking at 4.6 billion USD/year in 2049 and reaching 4.5 billion USD/year by 2050. Scenarios where BEVs are deployed have the largest net cash flows by 2050, 9.6 and 6.6 Billion USD/year for the HBB and FBB scenarios, respectively.
- Deployment of FCEVs for normal vehicles and BEVs for compact and mini-sized vehicles in the Japanese road freight vehicle fleet is recommended. Since road freight vehicles are concentrated in fewer owners than passenger LDVs, it is recommended to design policies to help road freight vehicle fleet owners investing in EDVs. EDV diffusion in road freight transport can help improving social acceptance of powertrain electrification and developing infrastructure that can benefit EDV diffusion in passenger LDVs. Assessing powertrain electrification in passenger LDVs and road freight vehicles considering the dynamics of technology diffusion is recommended for future work.
- A large asymmetry was found between the vehicle stock distribution by size class and the CO2 emissions; with normal vehicles accounting for more than 61% of the TTW and WTW CO2 emissions in all scenarios, despite representing only 13.3% of the vehicle stock. It is therefore recommended to prioritize normal vehicles when designing measures for powertrain electrification in road freight transport.
Author Contributions
The contribution of the authors to this article is as follows: conceptualization, J.C.G.P. and V.T.N.; methodology, J.C.G.P., V.T.N., M.A. and S.S.; software, J.C.G.P. and V.T.N.; validation, J.C.G.P., V.T.N., M.A. and S.S.; formal analysis, J.C.G.P., V.T.N., M.A. and S.S.; investigation, J.C.G.P., V.T.N., M.A. and S.S.; resources, J.C.G.P., M.A. and S.S.; data curation, J.C.G.P. and V.T.N.; writing—original draft preparation, J.C.G.P.; writing—review and editing, M.A. and S.S.; visualization, J.C.G.P.; supervision, M.A. and S.S. All authors have read and agreed to the published version of the manuscript.
Funding
This research received no external funding.
Acknowledgments
The authors appreciate the comments and suggestions made by the reviewers.
Conflicts of Interest
The authors declare no conflict of interest.
Nomenclature
| α | Model parameter |
| β | Growth parameter |
| a | Vehicle age |
| a0 | Vehicle median service life |
| AIRIA | Automobile Inspection & Registration Association |
| BEV | Battery electric vehicle |
| ccap | Vehicle capital cost |
| cene | Energy price |
| cOM | Vehicle operating and maintenance cost |
| COP | Conference of Parties |
| CRF | Capital recovery factor |
| E | Road freight vehicle energy consumption |
| EDV | Electric-drive vehicle |
| EF | Fuel CO2 emission factor |
| FCEV | Fuel cell electric vehicle |
| G | Road freight vehicle fleet CO2 emissions |
| GHG | Greenhouse gas |
| GVW | Gross Vehicle Weight |
| HDV | Heavy-duty vehicle |
| HEV | Hybrid electric vehicle |
| ICEV | Internal combustion engine vehicle |
| IEA | International Energy Agency |
| JAMA | Japanese Automobile Manufacturers Association |
| LDV | Light-duty vehicle |
| LEAP | Long-range Energy Alternatives Planning system |
| M | Annual traveled distance |
| MDV | Medium-duty vehicle |
| MLIT | Japan Ministry of Land, Infrastructure, Transport and Tourism |
| N | Vehicle stock |
| OEM | Original equipment manufacturer |
| O&M | Operating and maintenance |
| PHEV | Plug-in hybrid electric vehicle |
| PM | Particulate matter |
| r | Vehicle survival rate |
| R | Vehicle fuel consumption |
| RCO | Relative cost of ownership |
| S | New vehicle sales |
| SMR | Steam methane reforming |
| t | Vehicle type |
| TCO | Total cost of ownership |
| TTW | Tank to wheel |
| v | Vehicle vintage |
| WTW | Well to wheel |
| y | Calendar year |
References
- Sims, R.; Schaeffer, R.; Creutzig, F.; Cruz-Núñez, X.; D’Agosto, M.; Dimitriu, D.; Figueroa Meza, M.J.; Fulton, L.; Kobayashi, S.; Lah, O.; et al. Transport. In Climate Change 2014: Mitigation of Climate Change. Contribution of Working Group III to the Fifth Assessment Report of the Intergovernmental Panel on Climate Change; Edenhofer, O., Pichs-Madruga, R., Sokona, Y., Farahani, E., Kadner, S., Seyboth, K., Adler, A., Baum, I., Brunner, S., Eickemeier, P., Eds.; Cambridge University Press: Cambridge, UK; New York, NY, USA, 2014; pp. 599–670. [Google Scholar]
- IEA/OECD (Ed.) Energy Technology Perspectives 2017: Catalysing Energy Tehnology Transformations; International Energy Agency and Organization for Economic Cooperation and Development: Paris, France, 2017. [Google Scholar]
- IEA/OECD. The Future of Trucks: Implications for Energy and the Environment; International Energy Agency and Organization for Economic Cooperation and Development: Paris, France, 2017. [Google Scholar]
- Kast, J.; Morrison, G.; Gangloff, J.J.; Vijayagopal, R.; Marcinkoski, J. Designing hydrogen fuel cell electric trucks in a diverse medium and heavy duty market. Res. Transp. Econ. 2018, 70, 139–147. [Google Scholar] [CrossRef]
- ICCT. Overview of the Heavy-Duty Vehicle Market and CO2 Emissions in the European Union; The International Council on Clean Transportation. Available online: http://www.theicct.org/sites/default/files/publications/ICCT_EU-HDV_mkt-analysis_201512.pdf (accessed on 20 February 2020).
- Kast, J.; Vijayagopal, R.; Gangloff, J.J.; Marcinkoski, J. Clean commercial transportation: Medium and heavy duty fuel cell electric trucks. Int. J. Hydrog. Energy 2017, 42, 4508–4517. [Google Scholar] [CrossRef] [Green Version]
- Dablanc, L. City distribution, a key element of the urban economy: Guidelines for practitioners. In City Distribution and Urban Freight Transport: Multiple Perspectives; Macharis, C., Melo, S., Eds.; Edward Elgar Publishing: Cheltenham, UK, 2011; pp. 13–36. [Google Scholar]
- WHO. Review of Evidence on Health Aspects of Air Pollution—REVIHAAP Project; First Results; World Health Organization, Regional Office for Europe: Copenhagen, Denmark, 2013. [Google Scholar]
- HEI. Panel on the Health Effects of Traffic-Related Air Pollution. In Special Report 17; Traffic-Related Air Pollution: A Critical Review of the Literature on Emissions, Exposure, and Health Effects; Health Effects Institute: Boston, MA, USA, 2010; Available online: https://www.healtheffects.org/system/files/SR17TrafficReview.pdf (accessed on 4 May 2020).
- WHO. Press Release No 213: IARC: Diesel Engine Exhaust Carcinogenic; World Health Organization: Lyon, France, 2012; Available online: http://www.iarc.fr/en/media-centre/pr/2012/pdfs/pr213_E.pdf (accessed on 30 March 2020).
- OECD/ITF. The Carbon Footprint of Global Trade; Tackling Emissions from International Freight Transport. Organisation for Economic Co-operation and Development and International Transport Forum: Paris, France, 2016. Available online: http://www.itf-oecd.org/sites/default/files/docs/cop-pdf-06.pdf (accessed on 15 April 2020).
- Urban Foresight; EVI; IEA/OECD. EV City Casebook; 50 Big Ideas Shaping the Future of Electric Mobility; Urban Foresight, Electric Vehicles Initiative of the Clean Energy Ministerial and International Energy Agency and Organization for Economic Cooperation and Development: Newcastle, UK, 2014. [Google Scholar]
- ICCT. Transitioning to Zero-Emission Heavy-Duty Freight Vehicles; The International Council on Clean Transportation. Available online: https://www.theicct.org/sites/default/files/publications/Zero-emission-freight-trucks_ICCT-white-paper_26092017_vF.pdf (accessed on 20 April 2020).
- Den Boer, E.; Aarnik, S.; Kleiner, F.; Pagenkopf, J. Zero Emissions Trucks: An Overview of State-of-the-Art Technologies and Their Potential; CE Delft. Available online: https://www.cedelft.eu/publicatie/zero_emission_trucks/1399 (accessed on 7 April 2018).
- IEA/OECD. Global EV Outlook 2019: Scaling Up the Transition to Electric Mobility; International Energy Agency/Organization for Economic Cooperation and Development and Electric Vehicles Initiative of the Clean Energy Ministerial: Paris, France, 2019. [Google Scholar]
- Tryggestad, C.; Sharma, N.; van de Staaij, J.; Keizer, A. New Reality: Electric Trucks and Their Implications on Energy Demand; Energy Insights by McKinsey. Available online: https://www.mckinseyenergyinsights.com/insights/new-reality-electric-trucks-and-their-implications-on-energy-demand (accessed on 21 April 2020).
- BYD. BYD is Leading the Transition to a Zero-Emissions Future with Advanced Electric Trucks, Buses and Forklifts. Available online: https://en.byd.com/news-posts/press-release-byd-is-leading-the-transition-to-a-zero-emissions-future-with-advanced-battery-electric-trucks-buses-and-forklifts/ (accessed on 10 April 2020).
- Isuzu Motors Limited. Isuzu Exhibitions in the 45th Tokyo Motor Show 2017. Available online: http://www.isuzu.co.jp/world/press/2017/9_22tms.html (accessed on 24 April 2020).
- Carey, N. UPS Reserves 125 Tesla Semi-Trucks, Largest Public Pre-Order Yet; Reuters. Available online: https://www.reuters.com/article/us-ups-tesla-orders/ups-reserves-125-tesla-semi-trucks-largest-public-pre-order-yet-idUSKBN1ED1QM (accessed on 17 March 2020).
- Renault. Renault Trucks will Start Selling Electric Trucks in 2019. Available online: http://corporate.renault-trucks.com/en/press-releases/renault-trucks-will-start-selling-electric-trucks-in-2019.html (accessed on 20 April 2020).
- Mitsubishi Fuso Truck and Bus Corporation. The World’s First Mass-Produced All-Electric Compact Truck “eCanter”. Available online: http://www.mitsubishi-fuso.com/content/fuso/jp/truck/ecanter/lp.html (accessed on 13 December 2019). (In Japanese).
- FCB. Switzerland unveils fuel cell powered heavy truck, and first hydroelectric hydrogen station. Fuel Cells Bull. 2016, 2016(12), 14–15. [Google Scholar] [CrossRef]
- Toyota. Toyota Opens a Portal to the Future of Zero Emission Trucking. Available online: https://media.toyota.ca/releases/toyota-opens-a-portal-to-the-future-of-zero-emission-trucking (accessed on 17 April 2020).
- FCB. Ballard, Kenworth fuel cell truck validation moves to next stage. Fuel Cells Bull. 2018, 2018(2), 3. [Google Scholar]
- Nikola Motor Company; Bosch. A World-First: The Powertrain for the Electric Long-Haul Truck. Available online: https://www.bosch-presse.de/pressportal/de/en/a-world-first-the-powertrain-for-the-electric-long-haul-truck-126336.html (accessed on 24 March 2020).
- Askin, A.C.; Barter, G.E.; West, T.H.; Manley, D.K. The heavy-duty vehicle future in the United States: A parametric analysis of technology and policy tradeoffs. Energy Policy 2015, 81, 1–13. [Google Scholar] [CrossRef] [Green Version]
- Zhao, Y.; Ercan, T.; Tatari, O. Life cycle based multi-criteria optimization for optimal allocation of commercial delivery truck fleet in the United States. Sustain. Prod. Consum. 2016, 8, 18–31. [Google Scholar] [CrossRef]
- Wikström, M.; Hansson, L.; Alvfors, P. Socio-technical experiences from electric vehicle utilisation in commercial fleets. Appl. Energy 2014, 123, 82–93. [Google Scholar] [CrossRef]
- Vora, A.P.; Jin, X.; Hoshing, V.; Saha, T.; Shaver, G.; Varigonda, S.; Wasynczuk, O.; Tyner, W.E. Design-space exploration of series plug-in hybrid electric vehicles for medium-duty truck applications in a total cost-of-ownership framework. Appl. Energy 2017, 202, 662–672. [Google Scholar] [CrossRef]
- Lee, D.-Y.; Thomas, V.M. Parametric modeling approach for economic and environmental life cycle assessment of medium-duty truck electrification. J. Clean. Prod. 2017, 142, 3300–3321. [Google Scholar] [CrossRef] [Green Version]
- Sen, B.; Ercan, T.; Tatari, O. Does a battery-electric truck make a difference?—Life cycle emissions, costs, and externality analysis of alternative fuel-powered Class 8 heavy-duty trucks in the United States. J. Clean. Prod. 2017, 141, 110–121. [Google Scholar] [CrossRef]
- Feng, W.; Figliozzi, M.A. Conventional vs electric commercial vehicle fleets: A case study of economic and technological factors affecting the competitiveness of electric commercial vehicles in the USA. Procedia Soc. Behav. Sci. 2012, 39, 702–711. [Google Scholar] [CrossRef] [Green Version]
- Roeth, M.; Kircher, D.; Smith, J.; Swim, R. Barriers to the Increased Adoption of Fuel Efficiency Technologies in the North American On-Road Freight Sector; Report for the International Council on Clean Transportation (ICCT). Available online: https://www.theicct.org/sites/default/files/publications/ICCT-NACFE-CSS_Barriers_Report_Final_20130722.pdf (accessed on 9 April 2020).
- Schoettle, B.; Sivak, M.; Tunnell, M. A Survey of Fuel Econmy and Fuel Usage by Heavy-Duty Truck Fleets; University of Michigan and American Transportation Reserach Institute. Available online: http://atri-online.org/wp-content/uploads/2016/10/2016.ATRI-UMTRI.FuelEconomyReport.Final_.pdf (accessed on 29 April 2020).
- Zhao, H.; Burke, A.; Zhu, L. Analysis of Class 8 Hybrid-Electric Truck Technologies Using Diesel, LNG, Electricity, and Hydrogen, as the Fuel for Various Applications. In Proceedings of the EVS27 International Battery, Hybrid and Fuel Cell Electric Vehicle Symposium; Institute of Electrical and Electronics Engineers: Barcelona, Spain, 2013; p. 17. [Google Scholar]
- Lee, D.Y.; Thomas, V.M.; Brown, M.A. Electric urban delivery trucks: Energy use, greenhouse gas emissions, and cost-effectiveness. Environ. Sci. Technol. 2013, 47, 8022–8030. [Google Scholar] [CrossRef] [PubMed]
- Lajunen, A. Fuel economy analysis of conventional and hybrid heavy vehicle combinations over real-world operating routes. Transp. Res. Part D Transp. Environ. 2014, 31, 70–84. [Google Scholar] [CrossRef]
- Gao, Z.; Smith, D.E.; Stuart Daw, C.; Dean Edwards, K.; Kaul, B.C.; Domingo, N.; Parks, J.E.; Jones, P.T. The evaluation of developing vehicle technologies on the fuel economy of long-haul trucks. Energy Convers. Manag. 2015, 106, 766–781. [Google Scholar] [CrossRef] [Green Version]
- Lebeau, P.; Macharis, C.; Van Mierlo, J.; Lebeau, K. Electrifying light commercial vehicles for city logistics? A total cost of ownership analysis. Eur. J. Transp. Infrastruct. Res. 2015, 15, 551–569. [Google Scholar]
- Zhao, Y.; Onat, N.C.; Kucukvar, M.; Tatari, O. Carbon and energy footprints of electric delivery trucks: A hybrid multi-regional input-output life cycle assessment. Transp. Res. Part D Transp. Environ. 2016, 47, 195–207. [Google Scholar] [CrossRef]
- Zhao, Y.; Tatari, O. Carbon and energy footprints of refuse collection trucks: A hybrid life cycle evaluation. Sustain. Prod. Consum. 2017, 12, 180–192. [Google Scholar] [CrossRef]
- Zhou, T.; Roorda, M.J.; MacLean, H.L.; Luk, J. Life cycle GHG emissions and lifetime costs of medium-duty diesel and battery electric trucks in Toronto, Canada. Transp. Res. Part D 2017, 55, 91–98. [Google Scholar] [CrossRef]
- Davis, B.A.; Figliozzi, M.A. A methodology to evaluate the competitiveness of electric delivery trucks. Transp. Res. Part E Logist. Transp. Rev. 2013, 49, 8–23. [Google Scholar] [CrossRef]
- Christensen, L.; Klauenberg, J.; Kveiborg, O.; Rudolph, C. Suitability of commercial transport for a shift to electric mobility with Denmark and Germany as use cases. Res. Transp. Econ. 2017, 64, 48–60. [Google Scholar] [CrossRef] [Green Version]
- Li, W.; Dai, Y.; Ma, L.; Hao, H.; Lu, H.; Albinson, R.; Li, Z. Oil-saving pathways until 2030 for road freight transportation in China based on a cost-optimization model. Energy 2015, 86, 369–384. [Google Scholar] [CrossRef]
- Oshiro, K.; Masui, T. Diffusion of low emission vehicles and their impact on CO2 emission reduction in Japan. Energy Policy 2015, 81, 215–225. [Google Scholar] [CrossRef]
- Fridstrøm, L. From innovation to penetration: Calculating the energy transition time lag for motor vehicles. Energy Policy 2017, 108, 487–502. [Google Scholar] [CrossRef]
- Mulholland, E.; Teter, J.; Cazzola, P.; McDonald, Z.; Ó Gallachóir, B.P. The long haul towards decarbonising road freight—A global assessment to 2050. Appl. Energy 2018, 216, 678–693. [Google Scholar] [CrossRef]
- MLIT. Road Transport Vehicle Law Enforcement Act, Ordinance of the Ministry No 74, August 16 of 1951; Last modification in December 28 of 2016; Ministry of Land, Infrastructure,Transport and Tourism: Tokyo, Japan, 1951. (In Japanese)
- MLIT. Vehicle Fuel Consumption List (March 2018); Ministry of Land, Infrastructure, Transport and Tourism: Tokyo, Japan, 2018. (In Japanese)
- SEI. LEAP User Guide; Heaps, C., Ed.; Stockholm Environment Institute—SEI: Somerville, MA, USA, 2018; Available online: https://www.energycommunity.org/Help/leap.htm (accessed on 1 March 2020).
- González Palencia, J.C.; Araki, M.; Shiga, S. Energy consumption and CO2 emissions reduction potential of electric-drive vehicle diffusion in a road freight vehicle fleet. Energy Procedia 2017, 142, 2936–2941. [Google Scholar] [CrossRef]
- González Palencia, J.C.; Sakamaki, T.; Araki, M.; Shiga, S. Impact of powertrain electrification, vehicle size reduction and lightweight materials substitution on energy use, CO2 emissions and cost of a passenger light-duty vehicle fleet. Energy 2015, 93, 1489–1504. [Google Scholar] [CrossRef]
- Teoh, T.; Kunze, O.; Teo, C.C.; Wong, Y.D. Decarbonisation of urban freight transport using electric vehicles and opportunity charging. Sustainability 2018, 10, 3258. [Google Scholar] [CrossRef] [Green Version]
- González Palencia, J.C.; Araki, M.; Shiga, S. CO2 emissions reduction potential of powertrain electrification, lightweight materials use and vehicle size reduction in a passenger light-duty vehicle fleet. In Proceedings of the International Conference on Power Engineering-15 (ICOPE-15); Japan Society of Mechanical Engineers (JSME), American Society of Mechanical Engineers (ASME) and Chinese Society of Power Engineering (CSPE): Yokohama, Japan, 2015; p. 12. [Google Scholar]
- MLIT. Vehicle Fuel Consumption List (March 2013); Ministry of Land, Infrastructure, Transport and Tourism: Tokyo, Japan, 2013. (In Japanese)
- Talebian, H.; Herrera, O.E.; Tran, M.; Mérida, W. Electrification of road freight transport: Policy implications in British Columbia. Energy Policy 2018, 115, 109–118. [Google Scholar] [CrossRef]
- Pagerit, S.; Sharer, P.; Rousseau, A. Fuel Economy Sensitivity to Vehicle Mass for Advanced Vehicle Powertrains. In Proceedings of the SAE World Congress & Exhibition, SAE paper 2006-01-0665; Society of Automotive Engineers: Detroit, MI, USA, 2006. [Google Scholar]
- Contestabile, M.; Offer, G.J.; Slade, R.; Jaeger, F.; Thoennes, M. Battery electric vehicles, hydrogen fuel cells and biofuels. Which will be the winner? Energy Environ. Sci. 2011, 4, 3754–3772. [Google Scholar] [CrossRef]
- DOE. DOE Hydrogen and Fuel Cells Program Record # 14012; Department of Energy United States of America: Washington, DC, USA, 2013. Available online: http://energy.gov/sites/prod/files/14012_fuel_cell_system_cost_2013.pdf (accessed on 10 February 2020).
- Van Vliet, O.P.R.; Kruithof, T.; Turkenburg, W.C.; Faaij, A.P.C. Techno-economic comparison of series hybrid, plug-in hybrid, fuel cell and regular cars. J. Power Sources 2010, 195, 6570–6585. [Google Scholar] [CrossRef]
- Van Vliet, O.; Brouwer, A.S.; Kuramochi, T.; van den Broek, M.; Faaij, A. Energy use, cost and CO2 emissions of electric cars. J. Power Sources 2011, 196, 2298–2310. [Google Scholar] [CrossRef] [Green Version]
- MLIT. Results of the Basic Survey on Motor Vehicle Inspection and Maintenance for the 2004 Fiscal Year (in Japanese); Ministry of Land, Infrastructure, Transport and Tourism: Tokyo, Japan, 2004. Available online: http://www.mlit.go.jp/jidosha/iinkai/seibi/6houkokusyo.pdf (accessed on 16 March 2020).
- AIRIA. 2012 Vehicle stock. Automobile Inspection & Registration Association: Tokyo, Japan, 2012. Available online: http://www.airia.or.jp/publish/file/e49tph00000004t7-att/e49tph00000004te.pdf (accessed on 9 April 2020). (In Japanese).
- MOE. The Strategy to Promote Environmentally Friendly Vehicles; Ministry of Environment: Tokyo, Japan, 2010. Available online: http://www.env.go.jp/air/report/h22-02/index.html (accessed on 18 February 2020). (In Japanese)
- Nishimura, E. Assessing the Fuel Use and Greenhouse Gas Emissions of Future Light-Duty Vehicles in Japan. Master’s Thesis, Engineering System Division, Massachussetts Institute of Technology, Cambridge, MA, USA, 2011. [Google Scholar]
- JAMA. The Motor Industry of Japan 2013; Japanese Automobile Manufacturers Association: Tokyo, Japan, 2013; Available online: http://www.jama-english.jp/publications/MIJ2013.pdf (accessed on 23 March 2020).
- AIRIA. New Vehicle Registration by Year; Light-Duty Vehicle Fleet; Automobile Inspection & Registration Association: Tokyo, Japan, 2012. (In Japanese) [Google Scholar]
- NeV. Electric Vehicle Stock Statistics (Estimate); Next Generation Vehicle Promotion Center: Tokyo, Japan, 2016; Available online: http://www.cev-pc.or.jp/tokei/hanbai.html (accessed on 28 January 2016). (In Japanese)
- JAMA. The Motor Industry of Japan 2018; Japanese Automobile Manufacturers Association: Tokyo, Japan, 2018; Available online: http://www.jama-english.jp/publications/MIJ2018.pdf (accessed on 10 March 2020).
- Grübler, A. Technology and Global Change; Cambridge University Press: Cambridge, UK, 2003. [Google Scholar]
- Hollinshead, M.J.; Eastman, C.D.; Etsell, T.H. Forecasting performance and market penetration of fuel cells in transportation. Fuel Cells Bull. 2005, 2005, 10–17. [Google Scholar] [CrossRef]
- Acar, C.; Dincer, I. Review and evaluation of hydrogen production options for better environment. J. Clean. Prod. 2019, 218, 835–849. [Google Scholar] [CrossRef]
- Bandivadekar, A.; Bodek, K.; Cheah, L.; Evans, C.; Groode, T.; Heywood, J.; Kasseris, E.; Kromer, M.; Weiss, M. On the Road in 2035: Reducing Transportation’s Petroleum Consumption and GHG Emissions; Massachusetts Institute of Technology: Cambridge, MA, USA, 2008. [Google Scholar]
- Akerlind, I.B.; Bastani, P.; Berry, I.; Bhatt, K.; Chao, A.; Chow, E.; Karplus, V.; Keith, D.; Khusid, M.; Nishimura, E.; et al. On the Road toward 2050: Potential for Substantial Reductions in Light-Duty Vehicle Energy Use and Greenhouse Gas Emissions; Heywood, J., MacKenzie, D., Eds.; Massachusetts Institute of Technology: Cambridge, MA, USA, 2015. [Google Scholar]
- EDMC; IEEJ. EDMC Handbook of Energy & Economic Statistics 2019; The Energy Data and Modelling Center, The Institute of Energy Economic, The Energy Conservation Center: Tokyo, Japan, 2019. (In Japanese) [Google Scholar]
- IEA/OECD (Ed.) Energy Technology Perspectives 2012; Pathways to a Clean Energy System; Energy Technology Perspectives; International Energy Agency and Organization for Economic Cooperation and Development: Paris, France, 2012. [Google Scholar]
- IEA/OECD (Ed.) CO2 Emissions from Fuel Combustion Highlights 2013; International Energy Agency and Organization for Economic Cooperation and Development: Paris, France, 2013. [Google Scholar]
- Berraho, D. Options for the Japanese Electricity Mix by 2050. Master’s Thesis, School of Industrial Engineering and Management, Division of Energy and Climate Studies, KTH Royal Institute of technology, Stockholm, Sweden, 2012. [Google Scholar]
- IEA/OECD. World Energy Outlook 2012; International Energy Agency and Organization for Economic Cooperation and Development: Paris, France, 2012. [Google Scholar]
- Delucchi, M.A.; Yang, C.; Burke, A.F.; Ogden, J.M.; Kurani, K.; Kessler, J.; Sperling, D. An assessment of electric vehicles: Technology, infrastructure requirements, greenhouse-gas emissions, petroleum use, material use, lifetime cost, consumer acceptance and policy. Phil. Trans. R. Soc. A 2014, 372, 20120325. [Google Scholar] [CrossRef] [Green Version]
- Hao, H.; Wang, H.; Ouyang, M. Fuel consumption and life cycle GHG emissions by China’s on-road trucks: Future trends through 2050 and evaluation of mitigation measures. Energy Policy 2012, 43, 244–251. [Google Scholar] [CrossRef]
- GIO; NIES. Japan’s GHG Emissions Data (FY1990-2016, Final Figures); Greenhouse Gas Inventory Office of Japan, National Institute of Environmental Studies: Tsukuba, Japan, 2018. Available online: http://www-gio.nies.go.jp/aboutghg/nir/nir-e.html (accessed on 12 February 2020).
Figure 1.
Energy system diagram.

Figure 2.
Main characteristics of the road freight vehicles: (a) fuel consumption; (b) capital cost.
Figure 2.
Main characteristics of the road freight vehicles: (a) fuel consumption; (b) capital cost.

Figure 3.
Vehicle service lives and annual traveled distances.

Figure 4.
Vehicle survival profiles.

Figure 5.
Vehicle stock distribution.

Figure 6.
New vehicle sales.

Figure 7.
Technology diffusion profiles.

Figure 8.
Fuel information: (a) Tank to wheel and well to wheel CO2 emission factors; (b) price.

Figure 9.
Road freight vehicle fleet stock: (a) Base scenario; (b) HBB scenario; (c) HFF scenario; and (d) FBB scenario.
Figure 9.
Road freight vehicle fleet stock: (a) Base scenario; (b) HBB scenario; (c) HFF scenario; and (d) FBB scenario.

Figure 10.
Road freight vehicle fleet tank to wheel energy consumption: (a) total energy consumption; (b) fossil fuel consumption.
Figure 10.
Road freight vehicle fleet tank to wheel energy consumption: (a) total energy consumption; (b) fossil fuel consumption.

Figure 11.
Road freight vehicle fleet CO2 emissions. (a) Tank to wheel CO2 emissions; (b) Well to wheel CO2 emissions.
Figure 11.
Road freight vehicle fleet CO2 emissions. (a) Tank to wheel CO2 emissions; (b) Well to wheel CO2 emissions.

Figure 12.
Net cash flow.

Figure 13.
Scenario scores in 2050.

Figure 14.
Results of the sensitivity analysis: (a) Tank to wheel CO2 emissions; (b) net cash flow.


Table 1.
Main characteristics of previous studies regarding powertrain electrification in road freight transport on a fleet basis.
Table 1.
Main characteristics of previous studies regarding powertrain electrification in road freight transport on a fleet basis.
| Author | Year | EDV | Stock Turnover | Effects Assessed | |||
|---|---|---|---|---|---|---|---|
| HEV | BEV | FCEV | CO2 Emissions | Cost | |||
| Davis | 2013 | ✓ | ✓ | ||||
| Wikström | 2015 | ✓ | |||||
| Zhao | 2016 | ✓ | ✓ | ✓ | ✓ | ||
| Christensen | 2017 | ✓ | |||||
| Askin | 2015 | ✓ | ✓ | ✓ | ✓ | ||
| Li | 2015 | ✓ | ✓ | ✓ | ✓ | ||
| Oshiro | 2015 | ✓ | ✓ | ✓ | ✓ | ||
| Fridstrøm | 2017 | ✓ | ✓ | ✓ | ✓ | ✓ | |
| Mulholland | 2018 | ✓ | ✓ | ✓ | ✓ | ||
| Talebian | 2018 | ✓ | ✓ | ✓ | ✓ | ||
| This study | 2020 | ✓ | ✓ | ✓ | ✓ | ✓ | ✓ |
Table 2.
Dominant powertrain in the 2050 new vehicle sales in each scenario.
| Size Class | Powertrain | ||||
|---|---|---|---|---|---|
| Scenario | ICEV | HEV | BEV | FCEV | |
| Base | Normal | △ | △ | ||
| Compact | △ | △ | |||
| Mini | △ | △ | |||
| HBB | Normal | ○ | |||
| Compact | ○ | ||||
| Mini | ○ | ||||
| HFF | Normal | ○ | |||
| Compact | ○ | ||||
| Mini | ○ | ||||
| FBB | Normal | ○ | |||
| Compact | ○ | ||||
| Mini | ○ |
△ Partial dominance; ○ total dominance.
© 2020 by the authors. Licensee MDPI, Basel, Switzerland. This article is an open access article distributed under the terms and conditions of the Creative Commons Attribution (CC BY) license (http://creativecommons.org/licenses/by/4.0/).
Share and Cite
MDPI and ACS Style
González Palencia, J.C.; Nguyen, V.T.; Araki, M.; Shiga, S. The Role of Powertrain Electrification in Achieving Deep Decarbonization in Road Freight Transport. Energies 2020, 13, 2459. https://0-doi-org.brum.beds.ac.uk/10.3390/en13102459
AMA Style
González Palencia JC, Nguyen VT, Araki M, Shiga S. The Role of Powertrain Electrification in Achieving Deep Decarbonization in Road Freight Transport. Energies. 2020; 13(10):2459. https://0-doi-org.brum.beds.ac.uk/10.3390/en13102459
Chicago/Turabian StyleGonzález Palencia, Juan C., Van Tuan Nguyen, Mikiya Araki, and Seiichi Shiga. 2020. "The Role of Powertrain Electrification in Achieving Deep Decarbonization in Road Freight Transport" Energies 13, no. 10: 2459. https://0-doi-org.brum.beds.ac.uk/10.3390/en13102459
Note that from the first issue of 2016, this journal uses article numbers instead of page numbers. See further details here.