A Compact Thermally Driven Cooling System Based on Metal Hydrides

Institute of Engineering Thermodynamics, German Aerospace Center (DLR), Pfaffenwaldring 38-40, D-70569 Stuttgart, Germany
*
Author to whom correspondence should be addressed.
Energies 2020, 13(10), 2482; https://0-doi-org.brum.beds.ac.uk/10.3390/en13102482
Submission received: 14 April 2020
/
Revised: 4 May 2020
/
Accepted: 7 May 2020
/
Published: 14 May 2020
(This article belongs to the Special Issue Refrigeration, Air Conditioning and Heat Pumps: Energy and Environmental Issues II)
Abstract
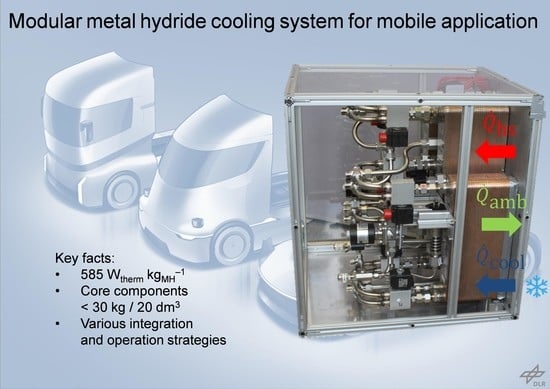
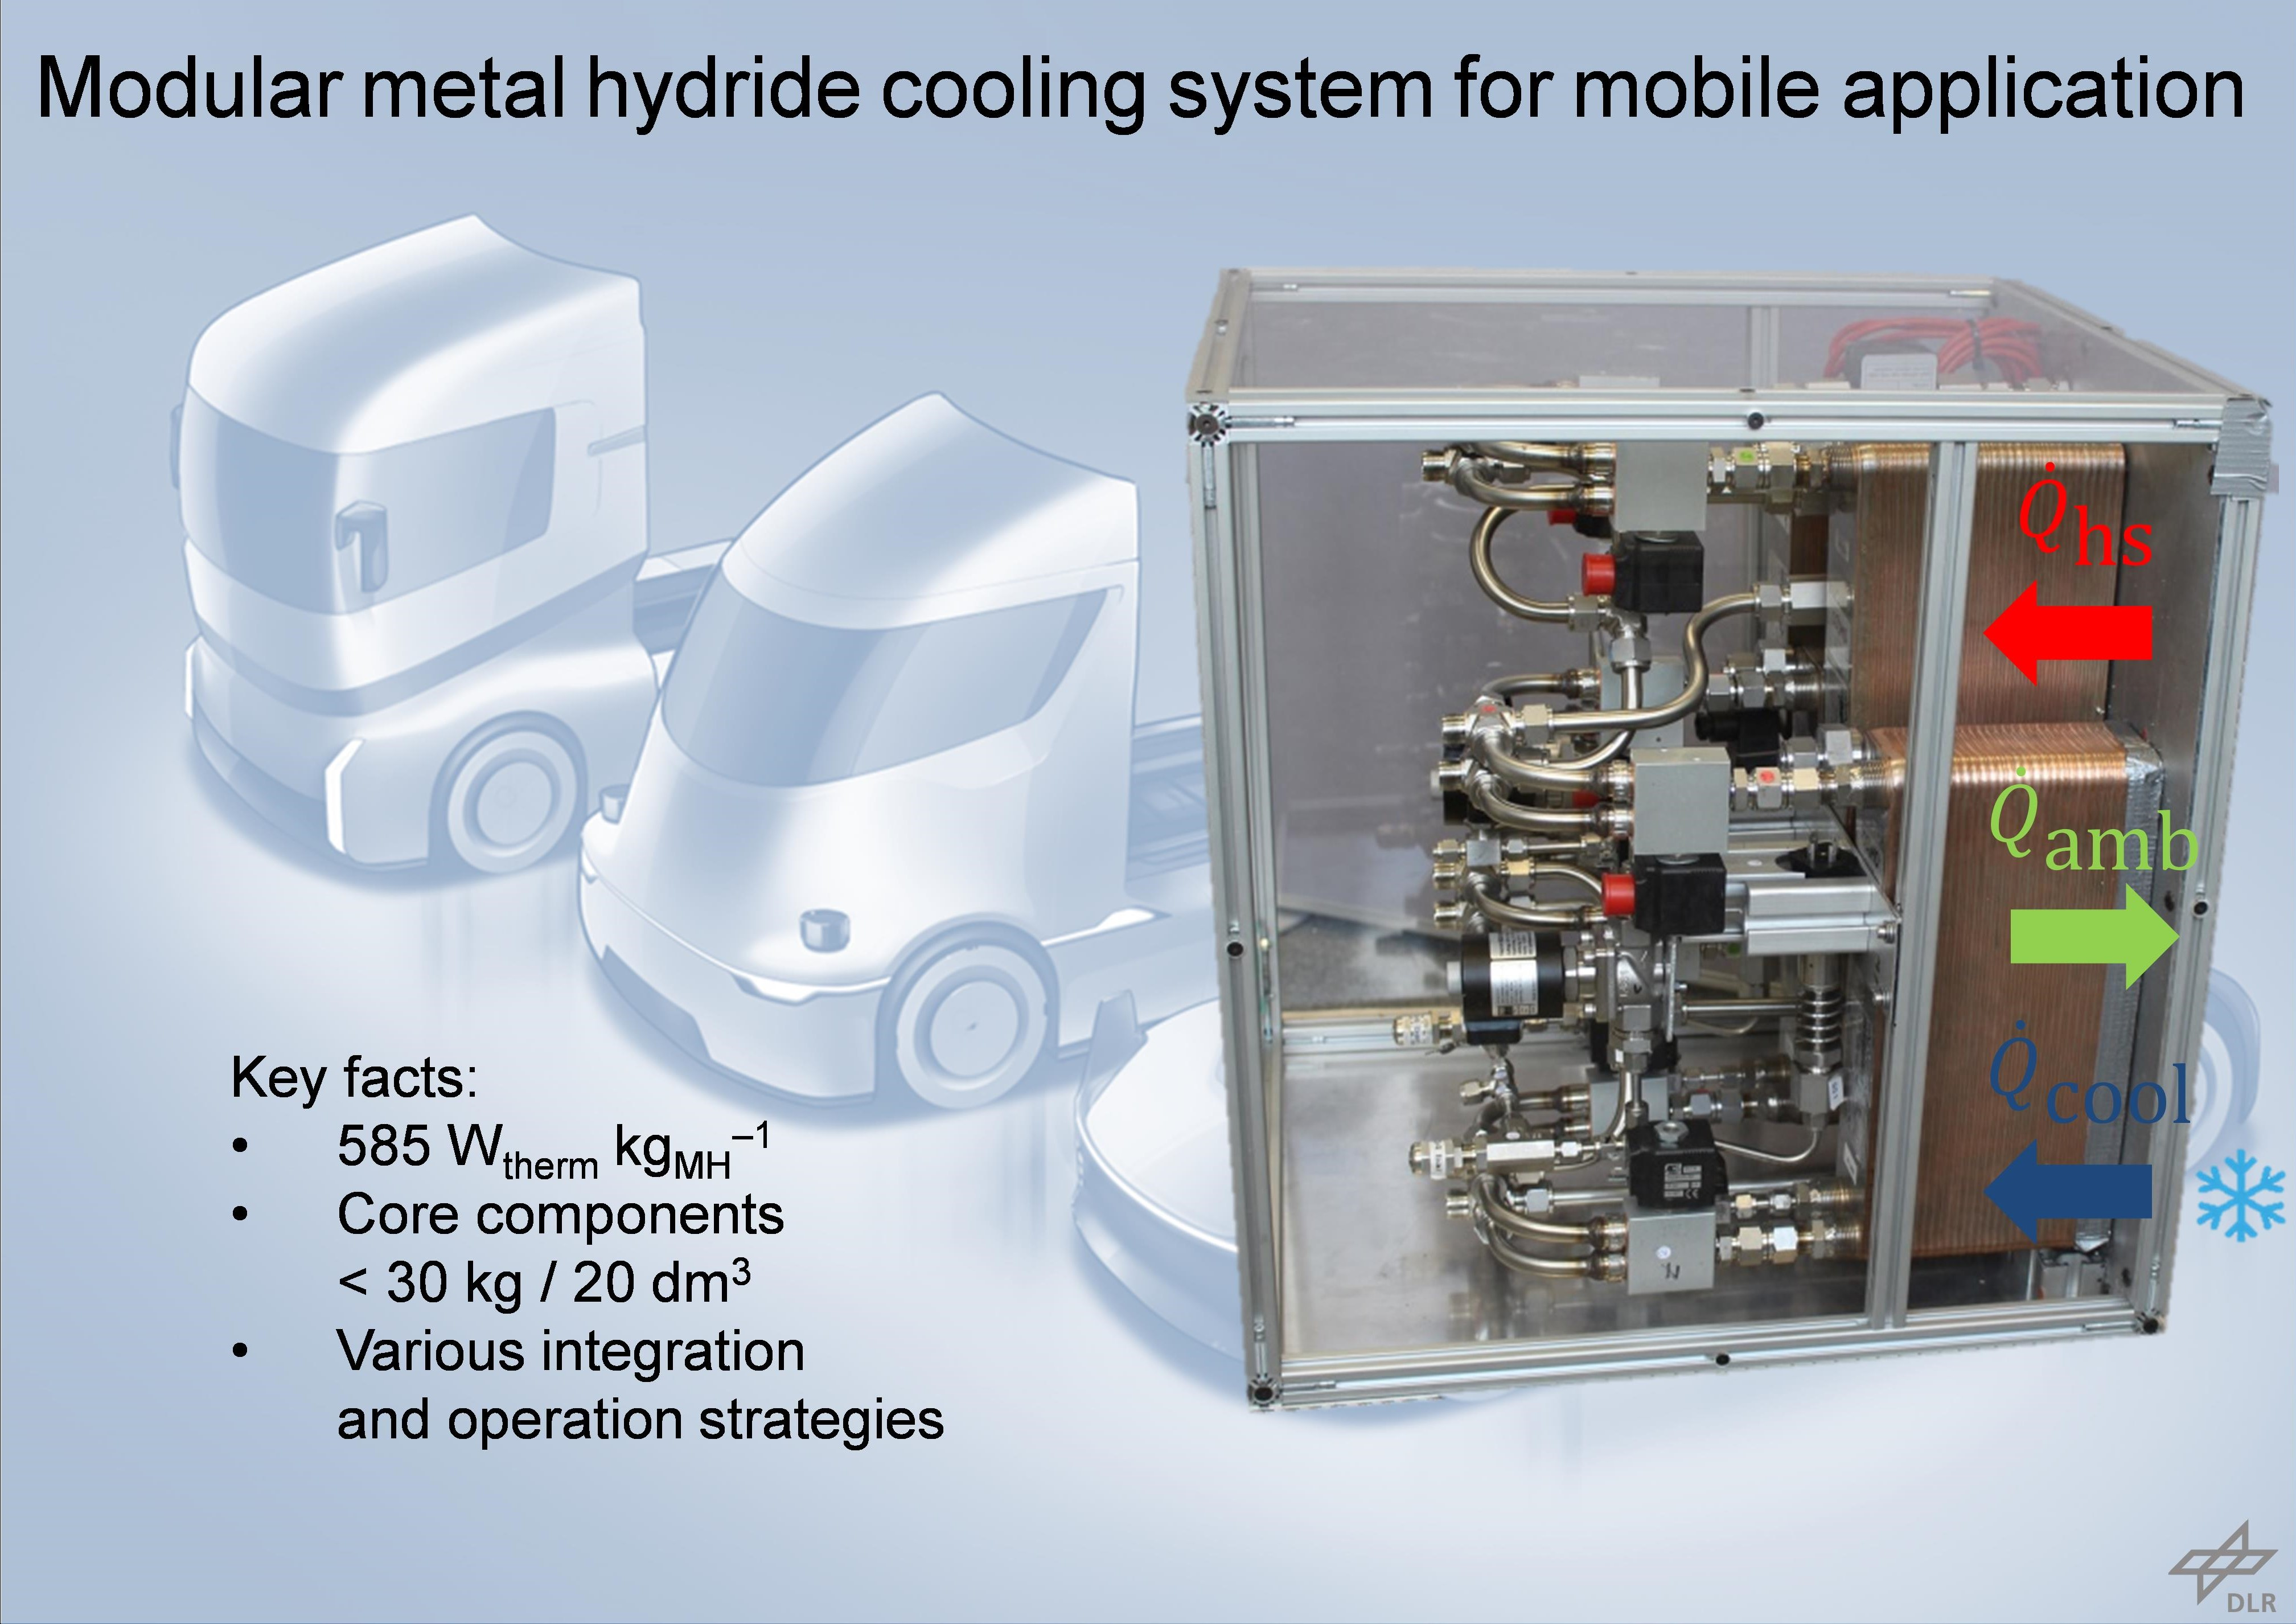
:Independent of the actual power train, efficiency and a high driving range in any weather conditions are two key requirements for future vehicles. Especially during summertime, thermally driven air conditioning systems can contribute to this goal as they can turn the exhaust heat of internal combustion engines, fuel cells or of any additional fuel-based heating system into a cooling effect. Amongst these, metal hydride cooling systems (MHCSs) promise very high specific power densities due to the short reaction times as well as high reaction enthalpies. Additionally, the working fluid hydrogen has a very low global warming potential. In this study, the experimental results of a compact and modular MHCS with a specific cooling power of up to 585 W referred to one cold generating MH are presented, while reactor and MH weight in total is less than 30 kg and require a volume < 20 dm3. The system is driven by an auxiliary fuel heating system and its performance is evaluated for different operating conditions, e.g., temperature levels and half-cycle times. Additionally, a novel operation optimization of time-shifted valve switching to increase the cooling power is implemented and investigated in detail.
1. Introduction
A prediction of how future mobility will develop is difficult and different scenarios focus on battery-electric vehicles, fuel cell electric vehicles or improved internal combustion engines. However, it is obvious that for any of these options, efficiency will play a major role. Next to the energy required for the power train itself, the energy consumption by the heating and air-conditioning (AC) system is a crucial aspect, e.g., the driving range of battery-electric vehicles can be reduced by up to 50% when a conventional compressor driven AC system is used to transform electricity into heat or cold [1]. For conventional internal combustion engines on the other hand, after the cold-start enough waste heat is available that is actually used for heating purposes. It is an approach to use this heat also during summertime to support the AC and thus increase the overall efficiency of the power train.
For this purpose, thermally driven AC systems are one option to avoid the consumption of high-value electrical energy of battery-electric vehicles or to reutilize the waste heat of internal combustion engines for providing cold. They could be based on a medium temperature heat source like waste heat of the engine or additional fuel burners that are also onboard in some battery-electric vehicles to enable heating without loss of driving range. Next to sorption systems based on silica-gel, zeolites or activated carbon [2,3,4,5], closed metal hydride cooling systems (MHCSs) are a promising technology in this field. As in these systems, hydrogen is the working fluid and they also help to reach another important goal of the European Union: the usage of chemical refrigerants with a global warming potential higher than 150 is avoided [6].
The operation principle of MHCSs is based on the reversible gas–solid reaction of gaseous hydrogen (H2) and a metal (M) to form a metal hydride (MHx) according to:
The strong exothermic or endothermic character of this reaction ( ~20–35 kJ mol−1) can be used to generate either a heating or cooling effect. The equilibrium between the left- and right-hand side of this equation depends on the temperature and hydrogen pressure and can be graphically illustrated in so-called van’t Hoff plots. Due to these properties, metal hydrides are also commonly studied for hydrogen storage applications [7] and hydrogen compression [8], next to the utilization of their thermal effects considered in the present manuscript.
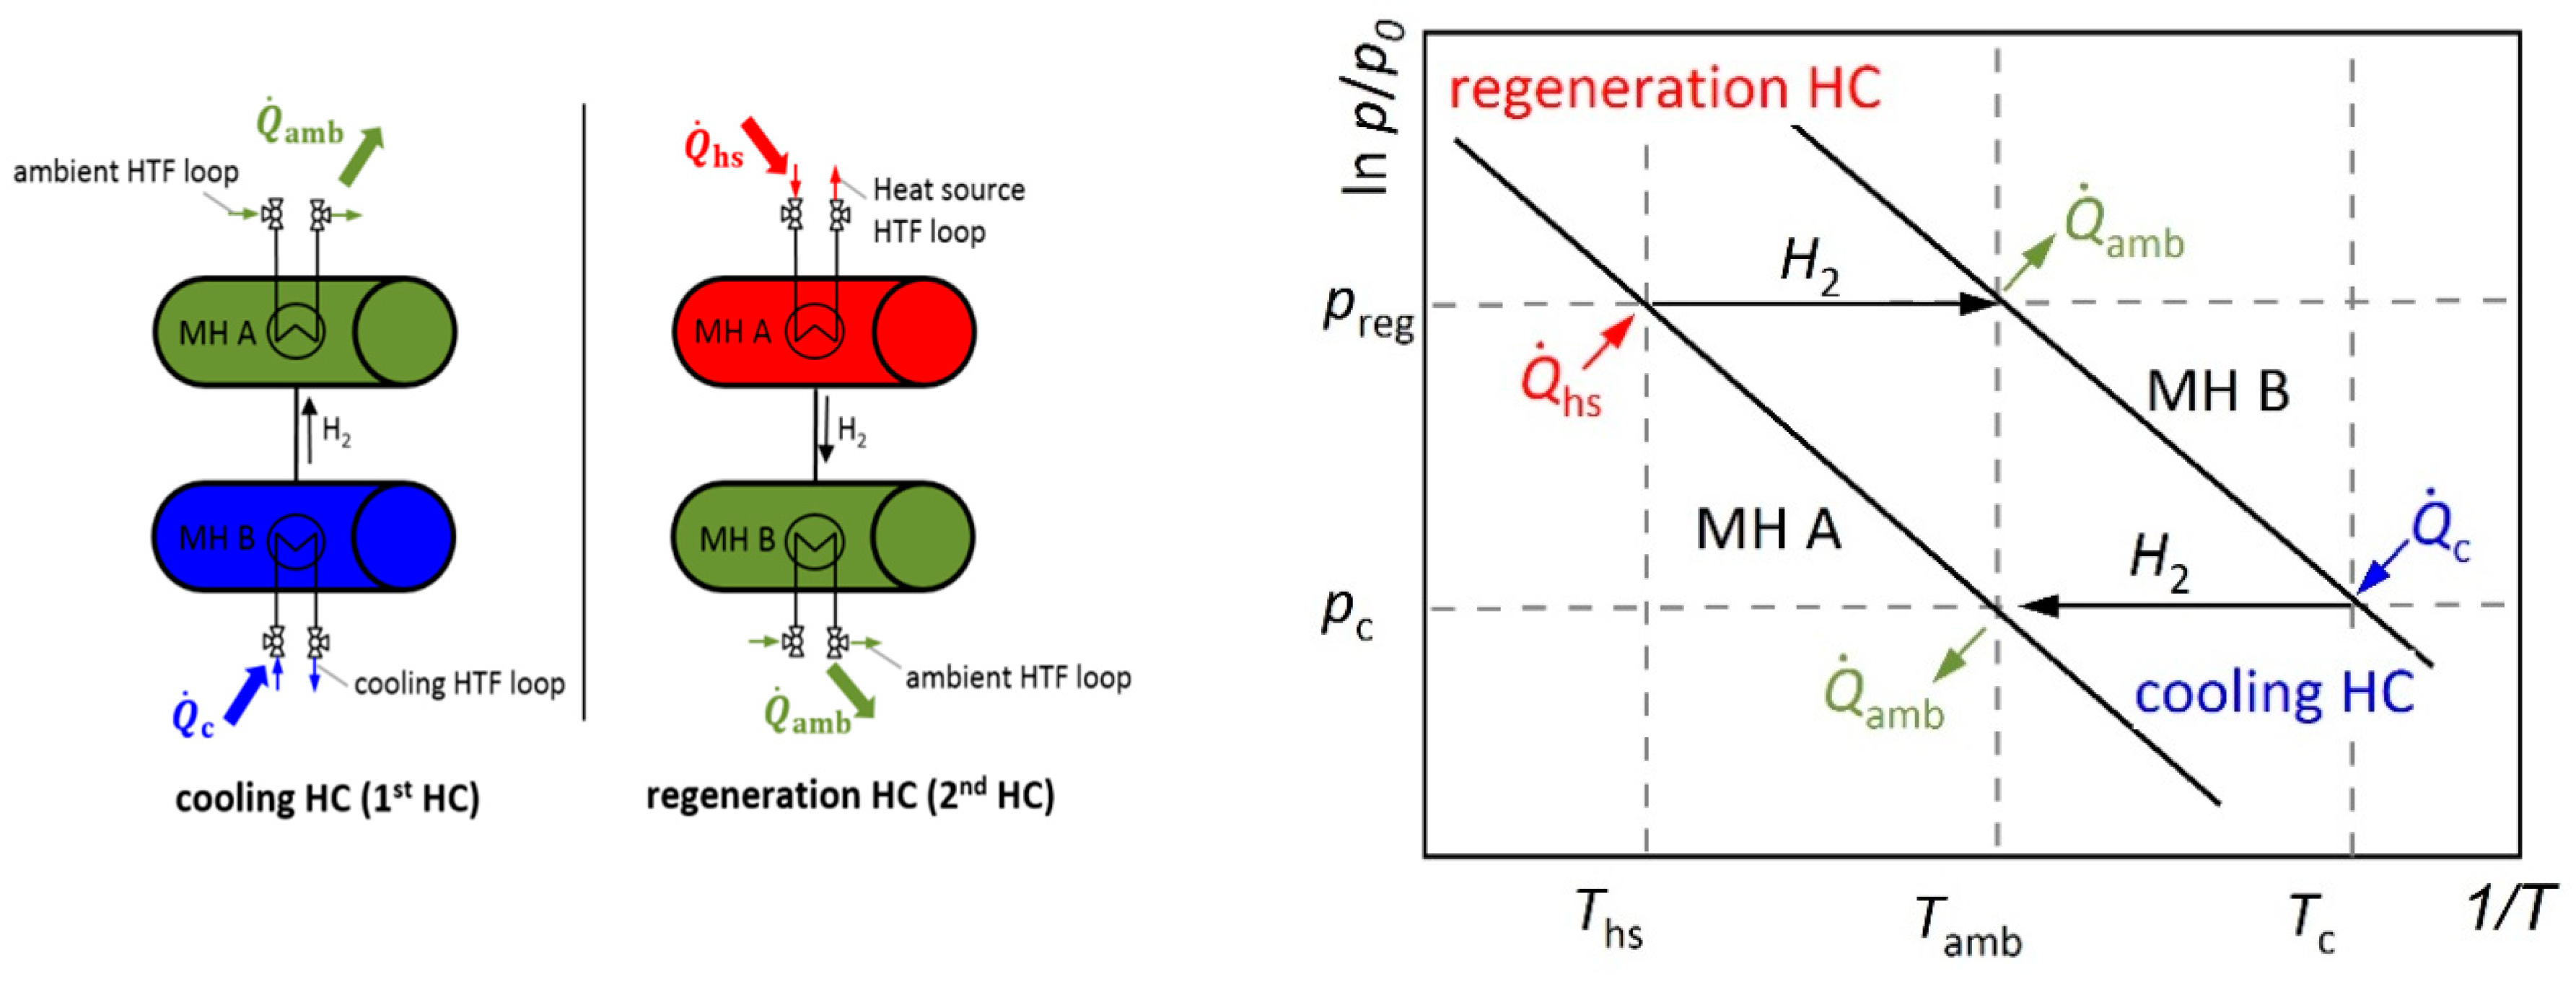
In order to illustrate the detailed working principle of a thermally driven AC system, a schematically van’t Hoff plot including two representative equilibrium lines for MH A and MH B is shown in Figure 1 (right). The basic configuration of the closed MHCS consists of these two MH materials with different thermodynamic properties [9]. MH B is the low-temperature hydride, which is used for the cold generating process, thus it is operated between the ambient temperature and the cooling temperature . MH A is operated between the highest temperature (heat source temperature) and , and it is used to regenerate the system for the next cooling process. Both materials are able to exchange hydrogen between each other.
The operation is principally separated in two successive half-cycles (HCs), compare Figure 1 (left). In the cooling HC, initially, MH B is completely charged, while MH A is in a dehydrogenated state. When both materials are connected, hydrogen flows from MH B to MH A as the equilibrium pressure of MH A is higher than that of MH B. Due to the endothermic desorption of hydrogen in MH B, the desired cooling effect at the temperature level is generated until the maximum obtainable transformed fraction is reached. In the following regeneration HC, heat at the temperature level is supplied to MH A, causing it to desorb hydrogen when its equilibrium pressure is above MH B. The released hydrogen flows back to MH B and the hydrogen cycle is closed. In both HCs, the heat of formation has to be released to the ambient environment at .
In order to realize a continuous cooling effect, two alternately working MH pairs consisting of in total four reactors are used. Due to the continuous operation of reactor B at two different temperature levels and , thermal losses occur as part of the reaction enthalpy are required while switching from the regeneration HC to the cooling HC. Therefore, special care has to be taken on the sensible reactor mass to avoid a substantial reduction in the resulting cooling power of such a quasi-continuously operation.
It has to be mentioned at this point, that the same system can also be used as a heat pump during wintertime as long as the outside temperature is sufficiently high to guarantee desorption of MH B during the cooling HC. In this case, the thermal energy previously released to the ambient environment can be used to heat the cabin. However, the focus of the remainder of this manuscript is on an AC operation of the system.
Overall, the characteristics of a thermally driven MHCS are the following:
- No consumption of electrical power, thus no dependency in driving range on AC operation;
- No moving parts leading to a quiet and low maintenance system;
- No environmentally unfriendly refrigerants are required (hydrogen as working fluid);
- Potentially small systems due to high thermal power density of MH based systems (this aspect is material intrinsic but its effect on the complete system depends highly on the available reactor design).
The feasibility of the thermally driven closed MHCS was first proposed by Gruen et al. in 1978 [10]. Since then, a variety of thermally driven systems have been demonstrated. In 1984, Ron [11] developed a system that could be driven by the exhaust gas of a bus. Upon cycling operation, a specific cooling power of 200–250 W for the material pair LaNi4.7Al0.3 and MmNi4.15Fe0.85 was obtained. The MH reactors were based on a tubular design with an outside diameter of 14 mm and integrated aluminum fins to improve the heat transfer characteristics. Using the MH pair LmNi4.91Sn0.15 and Ti0.99Zr0.01V0.43Fe0.09Cr0.05Mn1.5, Linder [12] demonstrated a specific cooling power of 640 W under operating conditions of 130 °C/28 °C/15 °C in 2010. The applied capillary tube bundle reactors consisted of 372 stainless steel tubes with an inner diameter of 1.4 mm, in which the shell sides were filled with the MH. Further characteristics of closed MHCS including the working pair selection and an overview of applied reactor designs are presented in the review articles by Muthukumar and Groll [9], and Bhuiya et al. [13].
Variations of the operation principle of the closed MHCS are also proposed and discussed in several publications. To increase the cooling effect and to enhance the performance, multi-stage arrangements have been investigated [14,15]. Furthermore, the required pressure difference can also be generated by a mechanical or electrochemical hydrogen compressor instead of using MH A [16,17]. This approach has been transferred by Linder and Kulenovic [18] to a so-called open MHCS for fuel cell-driven vehicles, where the compressor can be spared as the existing pressure difference between the hydrogen storage and fuel cell is used.
The existing studies on closed MHCSs have in common that they are usually based on a single pair of hydrides to demonstrate the functionality of the selected materials. However, only a system based on two pairs and four reactors can provide a continuous cooling effect. Furthermore, the studies have been performed in laboratory systems, thus no effort has been taken to reduce the space for piping, sensors or valves. Therefore, in this study, a compact modular and continuous working closed MHCS consisting of two coupled reactor pairs is realized and experimentally characterized for a wide range of operating conditions. In order to reduce thermal losses, two optimization strategies are presented that principally require the integration of only one extra valve. The fully automatic system is driven by an auxiliary heating system that is generally used for heating during winter months.
With regards to the structure of the paper, in the first section, the experimental details and the realized compact MHCS are presented, including a description of the applied MH, the reactor design as well the implemented operation optimizations. Then, the results of a reference experiment are presented in detail. The third part of the paper summarizes the experimental results for a variation of seven characteristic operation conditions. From this analysis, optimal operating conditions for the present MHCS are derived and an outlook for further system improvements is given.
2. Experimental
In this section details on the compact MHCS module based on two pairs of hydrides with four reactors are presented. As the MH pair defines the possible cooling temperature and the required heat source temperature, its selection is presented first, followed by details on the reactor design, which significantly determines the final cooling power output of the system. Finally, details of the flow chart of the MCHS and the integrated components are described, and the working principle of the operation optimization is presented that aims to increase the system efficiency.
2.1. Metal Hydride Working Pair
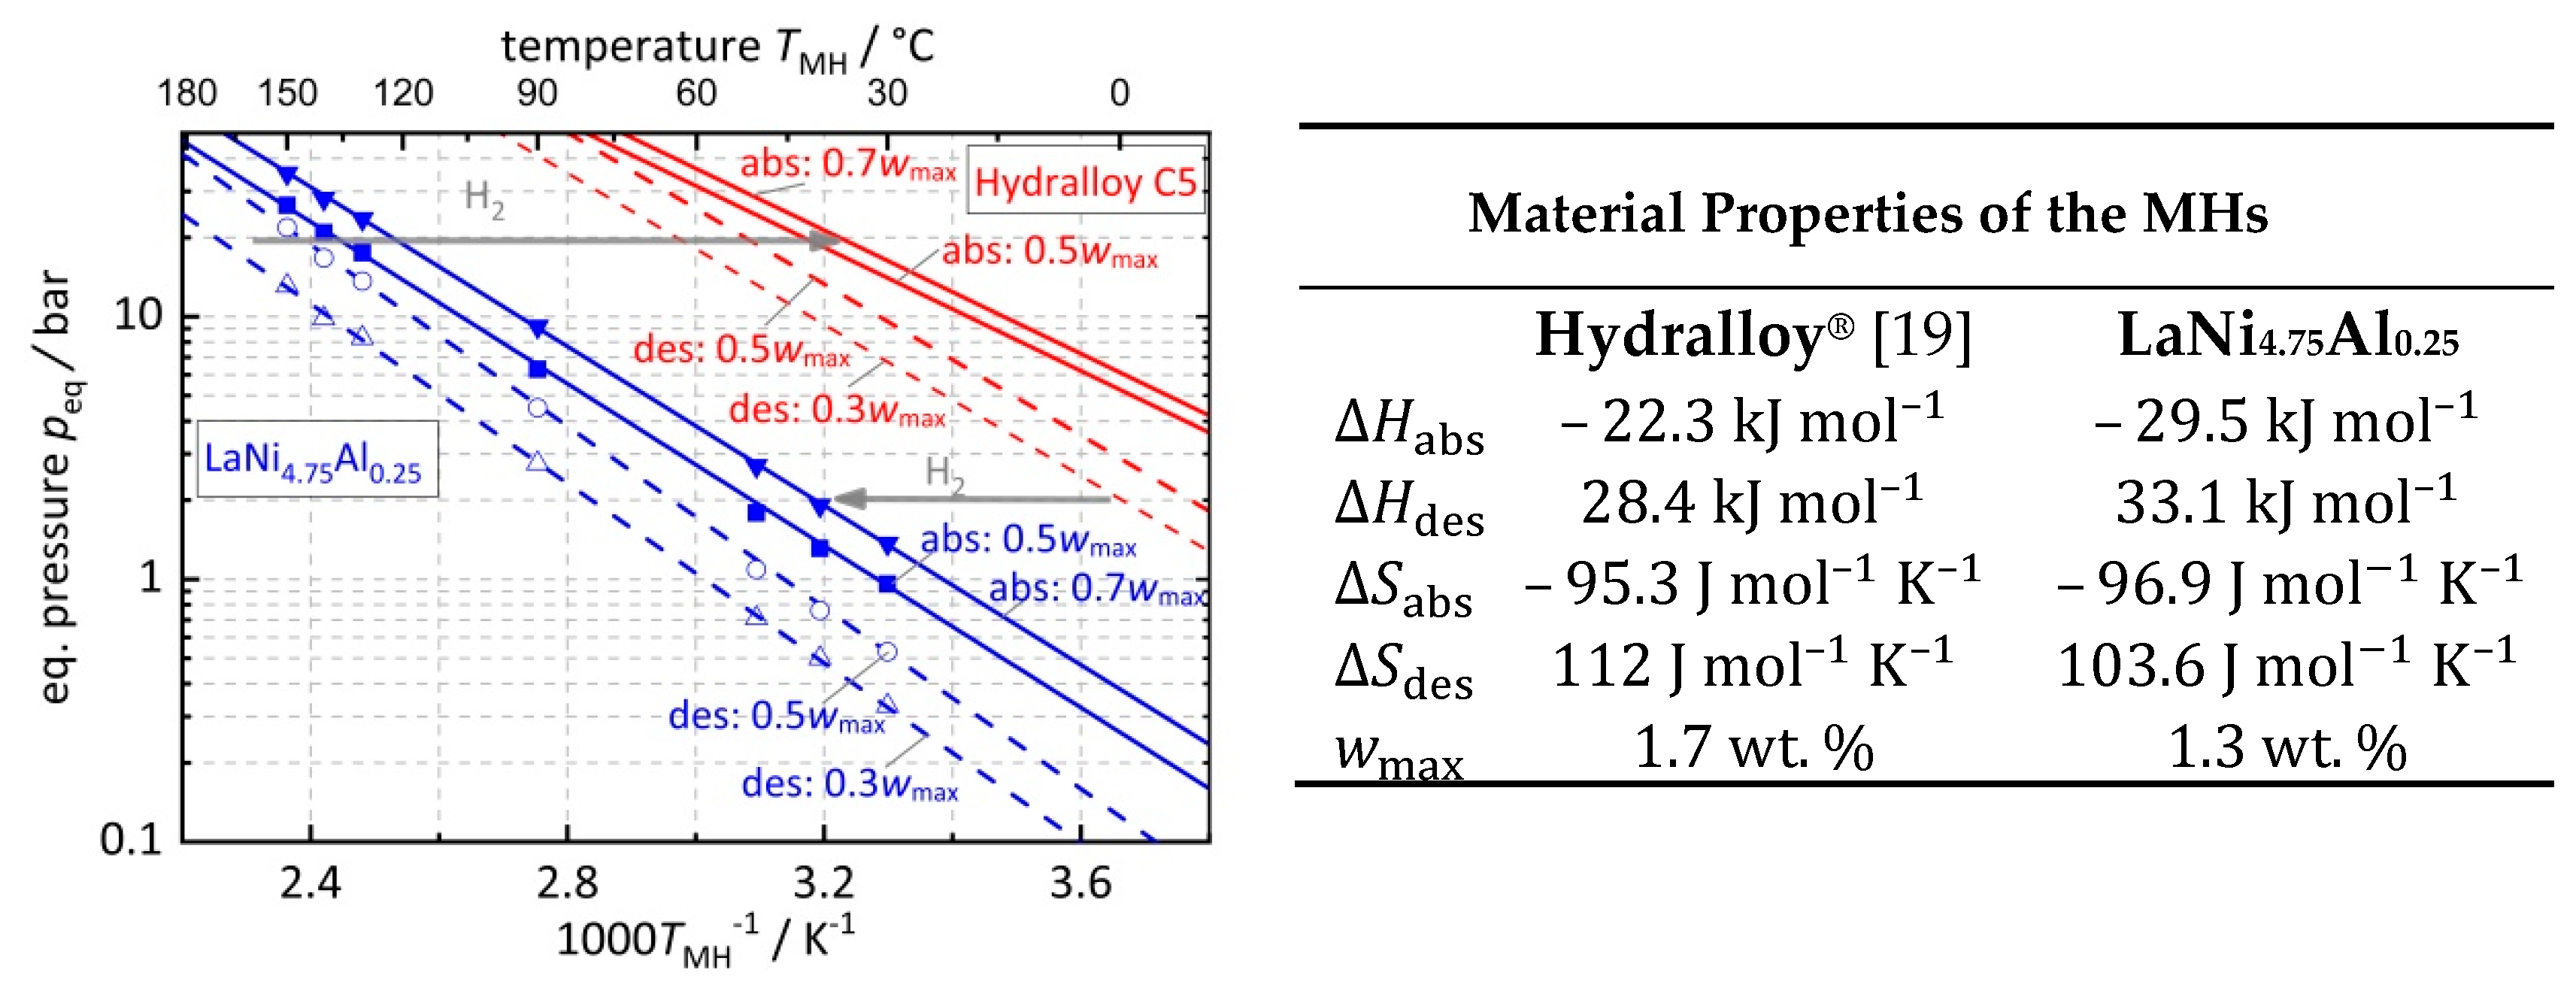
The MH pair consisting of AB5-alloy Hydralloy® C5 (Ti0.95Zr0.05Mn1.46V0.41Fe0.09Cr0.05) and LaNi4.75Al0.25 was chosen for the present MHCS. The thermodynamic details for absorption and desorption at various hydrogen capacities w are summarized in Figure 2 based on our own experimental data for LaNi4.75Al0.25 and a model of pressure-concentration isotherms for Hydralloy® C5 [19]. In this combination, Hydralloy® C5 is the cold producing material, while LaNi4.75Al0.25 stores and thermally compresses the hydrogen. Overall, the pair of materials have been selected to produce a cooling effect in the heat transfer fluid (HTF) at ~10–20 °C using regeneration temperatures between 120–170 °C, while the ambient temperature is assumed to be ~30–40 °C.
The operation process is exemplarily indicated by grey arrows at the reference temperature conditions: in the cooling HC, Hydralloy® C5 is desorbing at MH temperature of ~0 °C, while LaNi4.75Al0.25 is absorbing at a temperature of ~40 °C. Therefore, in this HC, a system pressure of ~2 bar is expected. When a heat source in the range of 150–160 °C is used, the pressure in the subsequent regeneration HC will be around 20 bar as indicated with the upper hydrogen arrow. At this pressure, Hydralloy® C5 will absorb hydrogen for regeneration at ~40 °C. As indicated by the given temperature and pressure ranges, the exact values and operating conditions depend on the state of hydrogen capacity that is exemplarily given for 30%, 50% and 70% . These values are highly relevant for the operation as they determine the maximum amount of hydrogen that can be exchanged between the two MHs. They are deduced from the sloping plateau in the underlying pressure-concentration isotherms for absorption and desorption, respectively.
One intrinsic limitation for all thermally driven ACs is the requirement of a minimum temperature level for the regeneration HC in order to be able to produce a cooling effect. For temperatures below this limit, the pressure in MH A during the regeneration HC is too low to close the hydrogen cycle and enable the hydrogen to flow back to MH B. This will lead to a reduced amount of exchanged hydrogen, thus reduced cooling power in case the ambient temperature cannot be decreased, e.g., for the present material pair, below 130 °C, the corresponding pressure level of ~6.5 bar would even require ambient cooling below 20 °C and, therefore, stop the generation of cold.
Next to this thermodynamic consideration of the suitability of the materials, the following issues are also important when selecting the hydrides for an MHCS. First, they should not show a strong dependence of temperature and pressure on the amount of hydrogen that can be exchanged (a low plateau slope and hysteresis between absorption and desorption). Second, assuming an operation of around 200–300 h per year (assumption for the operation of an AC in Central Europe) and a half-cycle time of 3 min, up to 2000 cycles per year can be expected. A simple regeneration as well as a good cycling stability up to several 10,000 cycles at moderate temperatures and pressures for the applied MHs is reported in [20,21]. Therefore, the selected materials fulfill these criteria. Finally, fast reaction rates of the materials play a major role in the performance of an MHCS, as they are crucial for high thermal power densities required in mobile applications. In contrast to other gas–solid reactions, the selected metal hydrides, show a complete reaction in the timeframe of <100 s even at the lowest temperatures of ~0 °C for Hydralloy® C5 and ~30 °C for a material of the La-Ni-Al family (LaNi4.85Al0.25 [22]).
2.2. Reactor Design
The maximum thermal power that can be achieved in an MHCS is defined by:
where is fixed by the maximum exchangeable hydrogen capacity (compare Figure 2, left), the molar weight the applied MH mass and the heat of formation . As mentioned before, reaches very high specific values for MH and reaction rates in the order of a few seconds are possible on a material basis, thus, in theory, high values for the specific cooling power can be reached [23]. However, in technical systems, the MH reactor is the performance limiting factor, as its heat transfer characteristic defines the minimum time for the fully transformed fraction of the hydride material. This half-cycle time, in turn, refers to the shortest possible cycling time of a system of two coupled reactors.
Overall, several aspects have to be considered for an optimal reactor design. Firstly, due to the low thermal conductivity of the hydride material, short heat transfer distances in the MH bed to/from the HTF have to be enabled to avoid heat transfer limitations. Secondly, in order to reduce thermal losses that occur in continuous system operation at different temperature levels, the reactor should have a low ratio of the passive reactor mass to the active MH mass ( . Additionally, mechanical strains due to periodic swelling of the material as well as the hydrogen gas pressure have to be considered in the layout of the reactor [24].
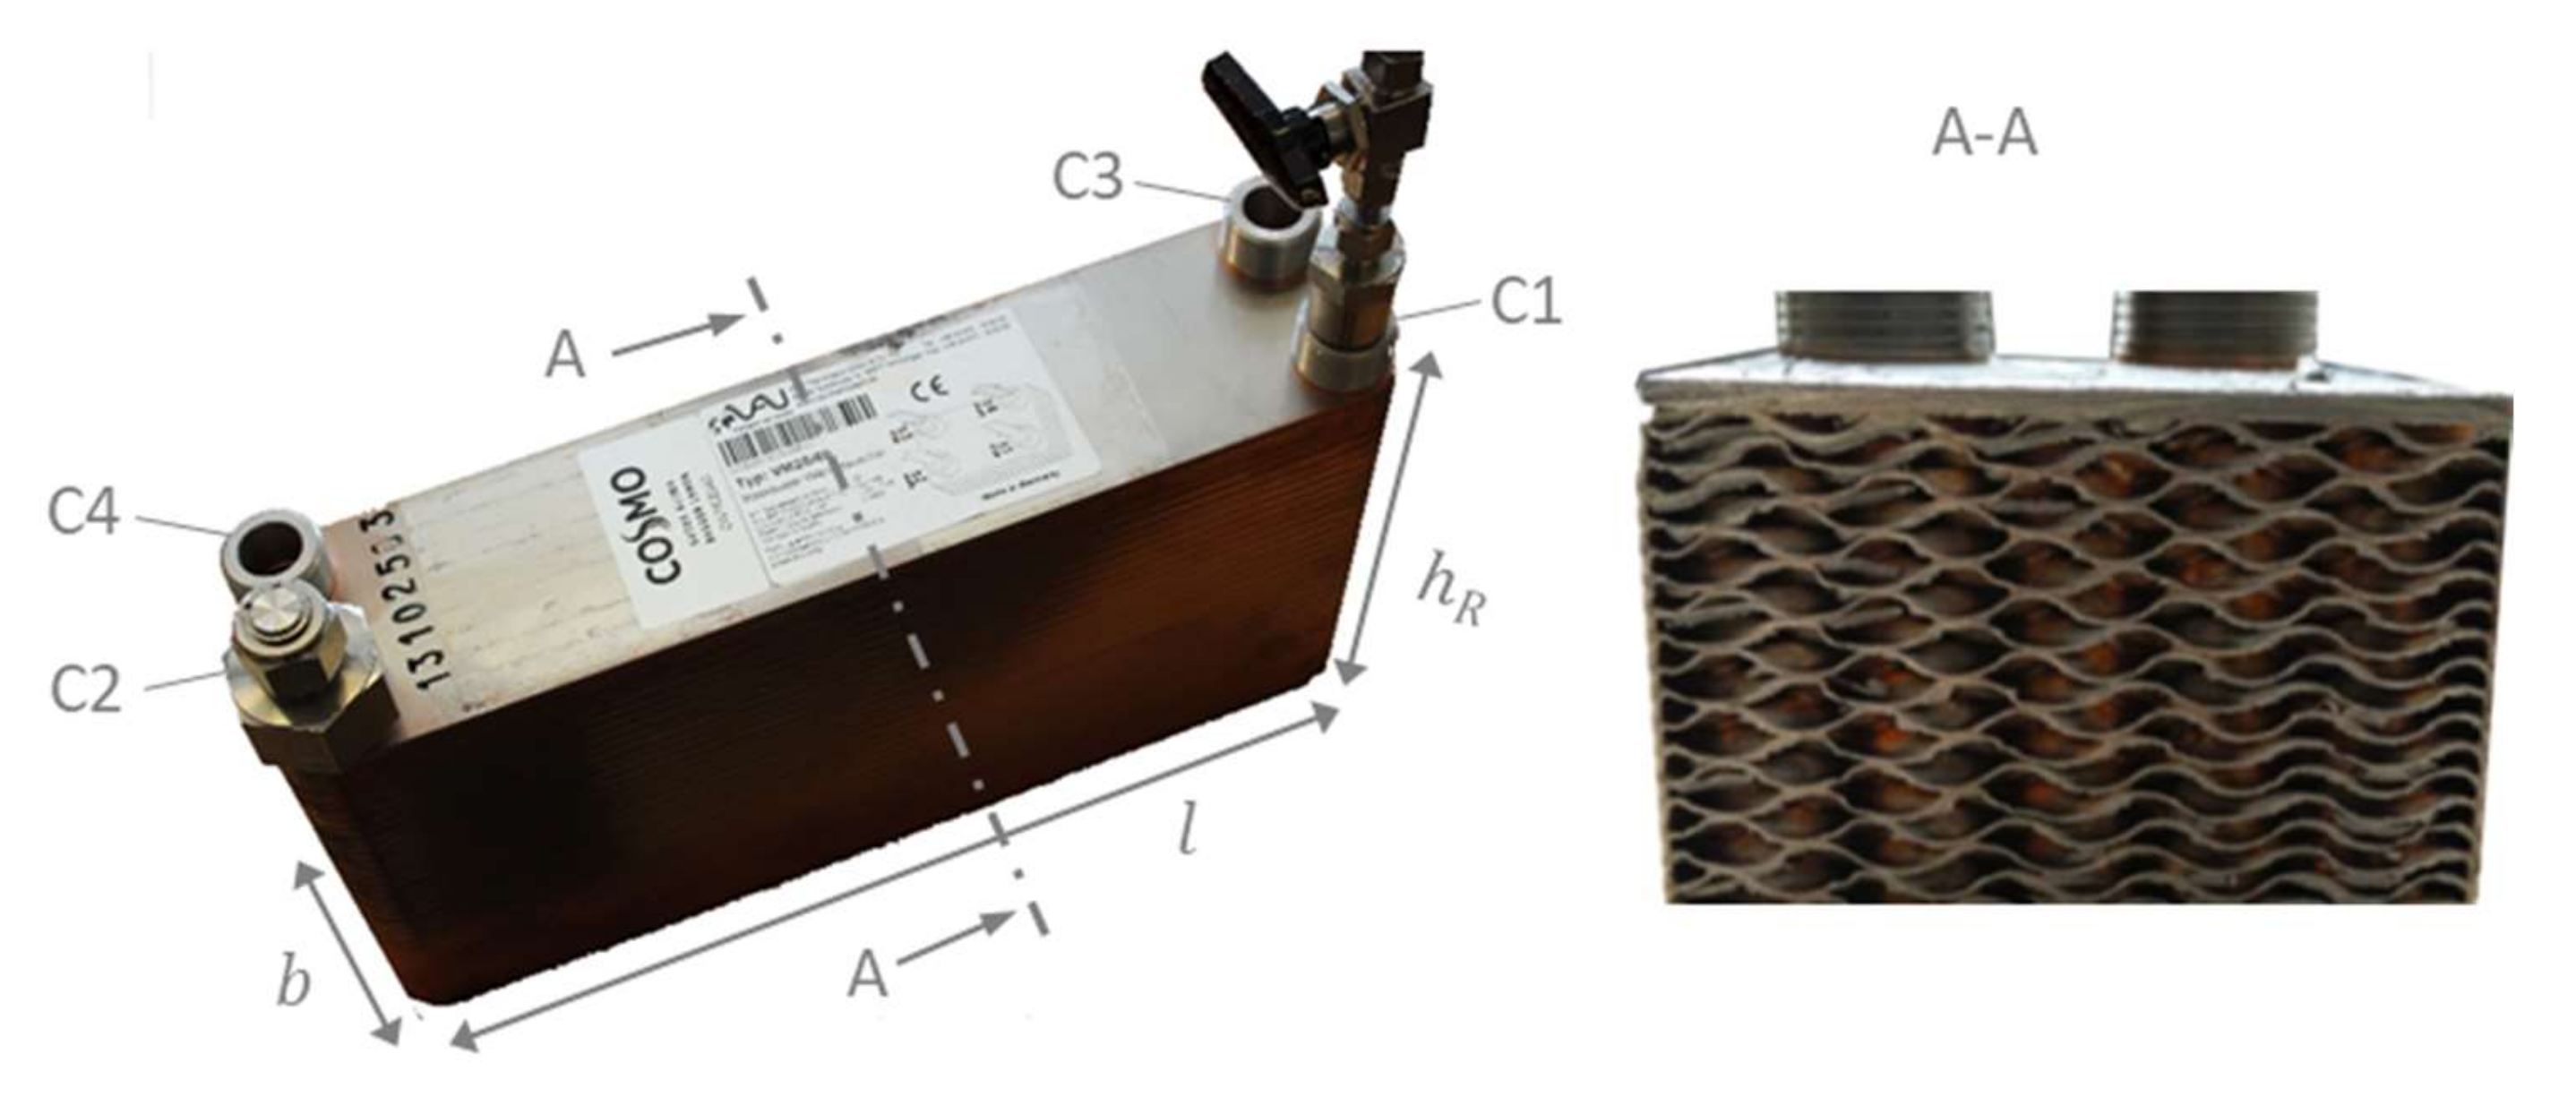
Based on these design criteria, a plate reactor concept is used in the present study, that was first proposed in [25]. Similarly to a recent study of the authors on the open MHCS [26,27,28], in this study, an up-scaled version of this reactor concept is used for the identical reactors containing the MH A and B (see Figure 3). It is based on the soldered plate heat reactor from VAU Thermotech GmbH & Co. KG with a single-pass system. In the primary and secondary sides of the reactor, the MH and the HTF are arranged alternately in very small channels with an average thickness of around 1.5 × 10⁻³ m. The MH and HTF channels are separated by 60 plates made of stainless steel 1.4404. On the HTF side, stamped plates enable a high heat transfer coefficient from the reactor wall to the HTF (see cross-sectional view at the bottom right in Figure 3).
For the uptake and release of hydrogen, the connection C1 is used. In this connection, a filter candle with a filtration ratio of 3 µm is integrated to exclude MH extraction and to realize a uniform distribution of hydrogen in the MH channels. The connection C2 is used for the MH filling procedure and remains closed during the operation of the MHCS. On the HTF side, the connections C3 and C4 are used as inlet and outlet for the HTF. Table 1 summarizes further relevant design parameters of the applied plate reactor.
Before filling the reactors, both MHs (Hydralloy® C5 andLaNi4.75Al0.25) were pre-cycled 20 times to avoid the high mechanical stresses that occur in the first cycles and to fragment the MH in small particles, which can be filled in the reactor. During the operation, the reactor is positioned vertically and hydrogen is supplied from the bottom. Thus, densification and segregation at the bottom of the reactor are counteracted. Before assembling the closed MHCS, each reactor was pressure tested up to a pressure of 30 bar. As an initial hydrogen capacity, both A reactors were evacuated to a pressure of 50 mbar, while both B reactors were connected to a hydrogen pressure of 30 bar at an HTF temperature of 26 °C until the reaction was completed. This filling procedure leads to a hydrogen mass of around 29 g per reactor pair.
2.3. Description of the Modular MHCS
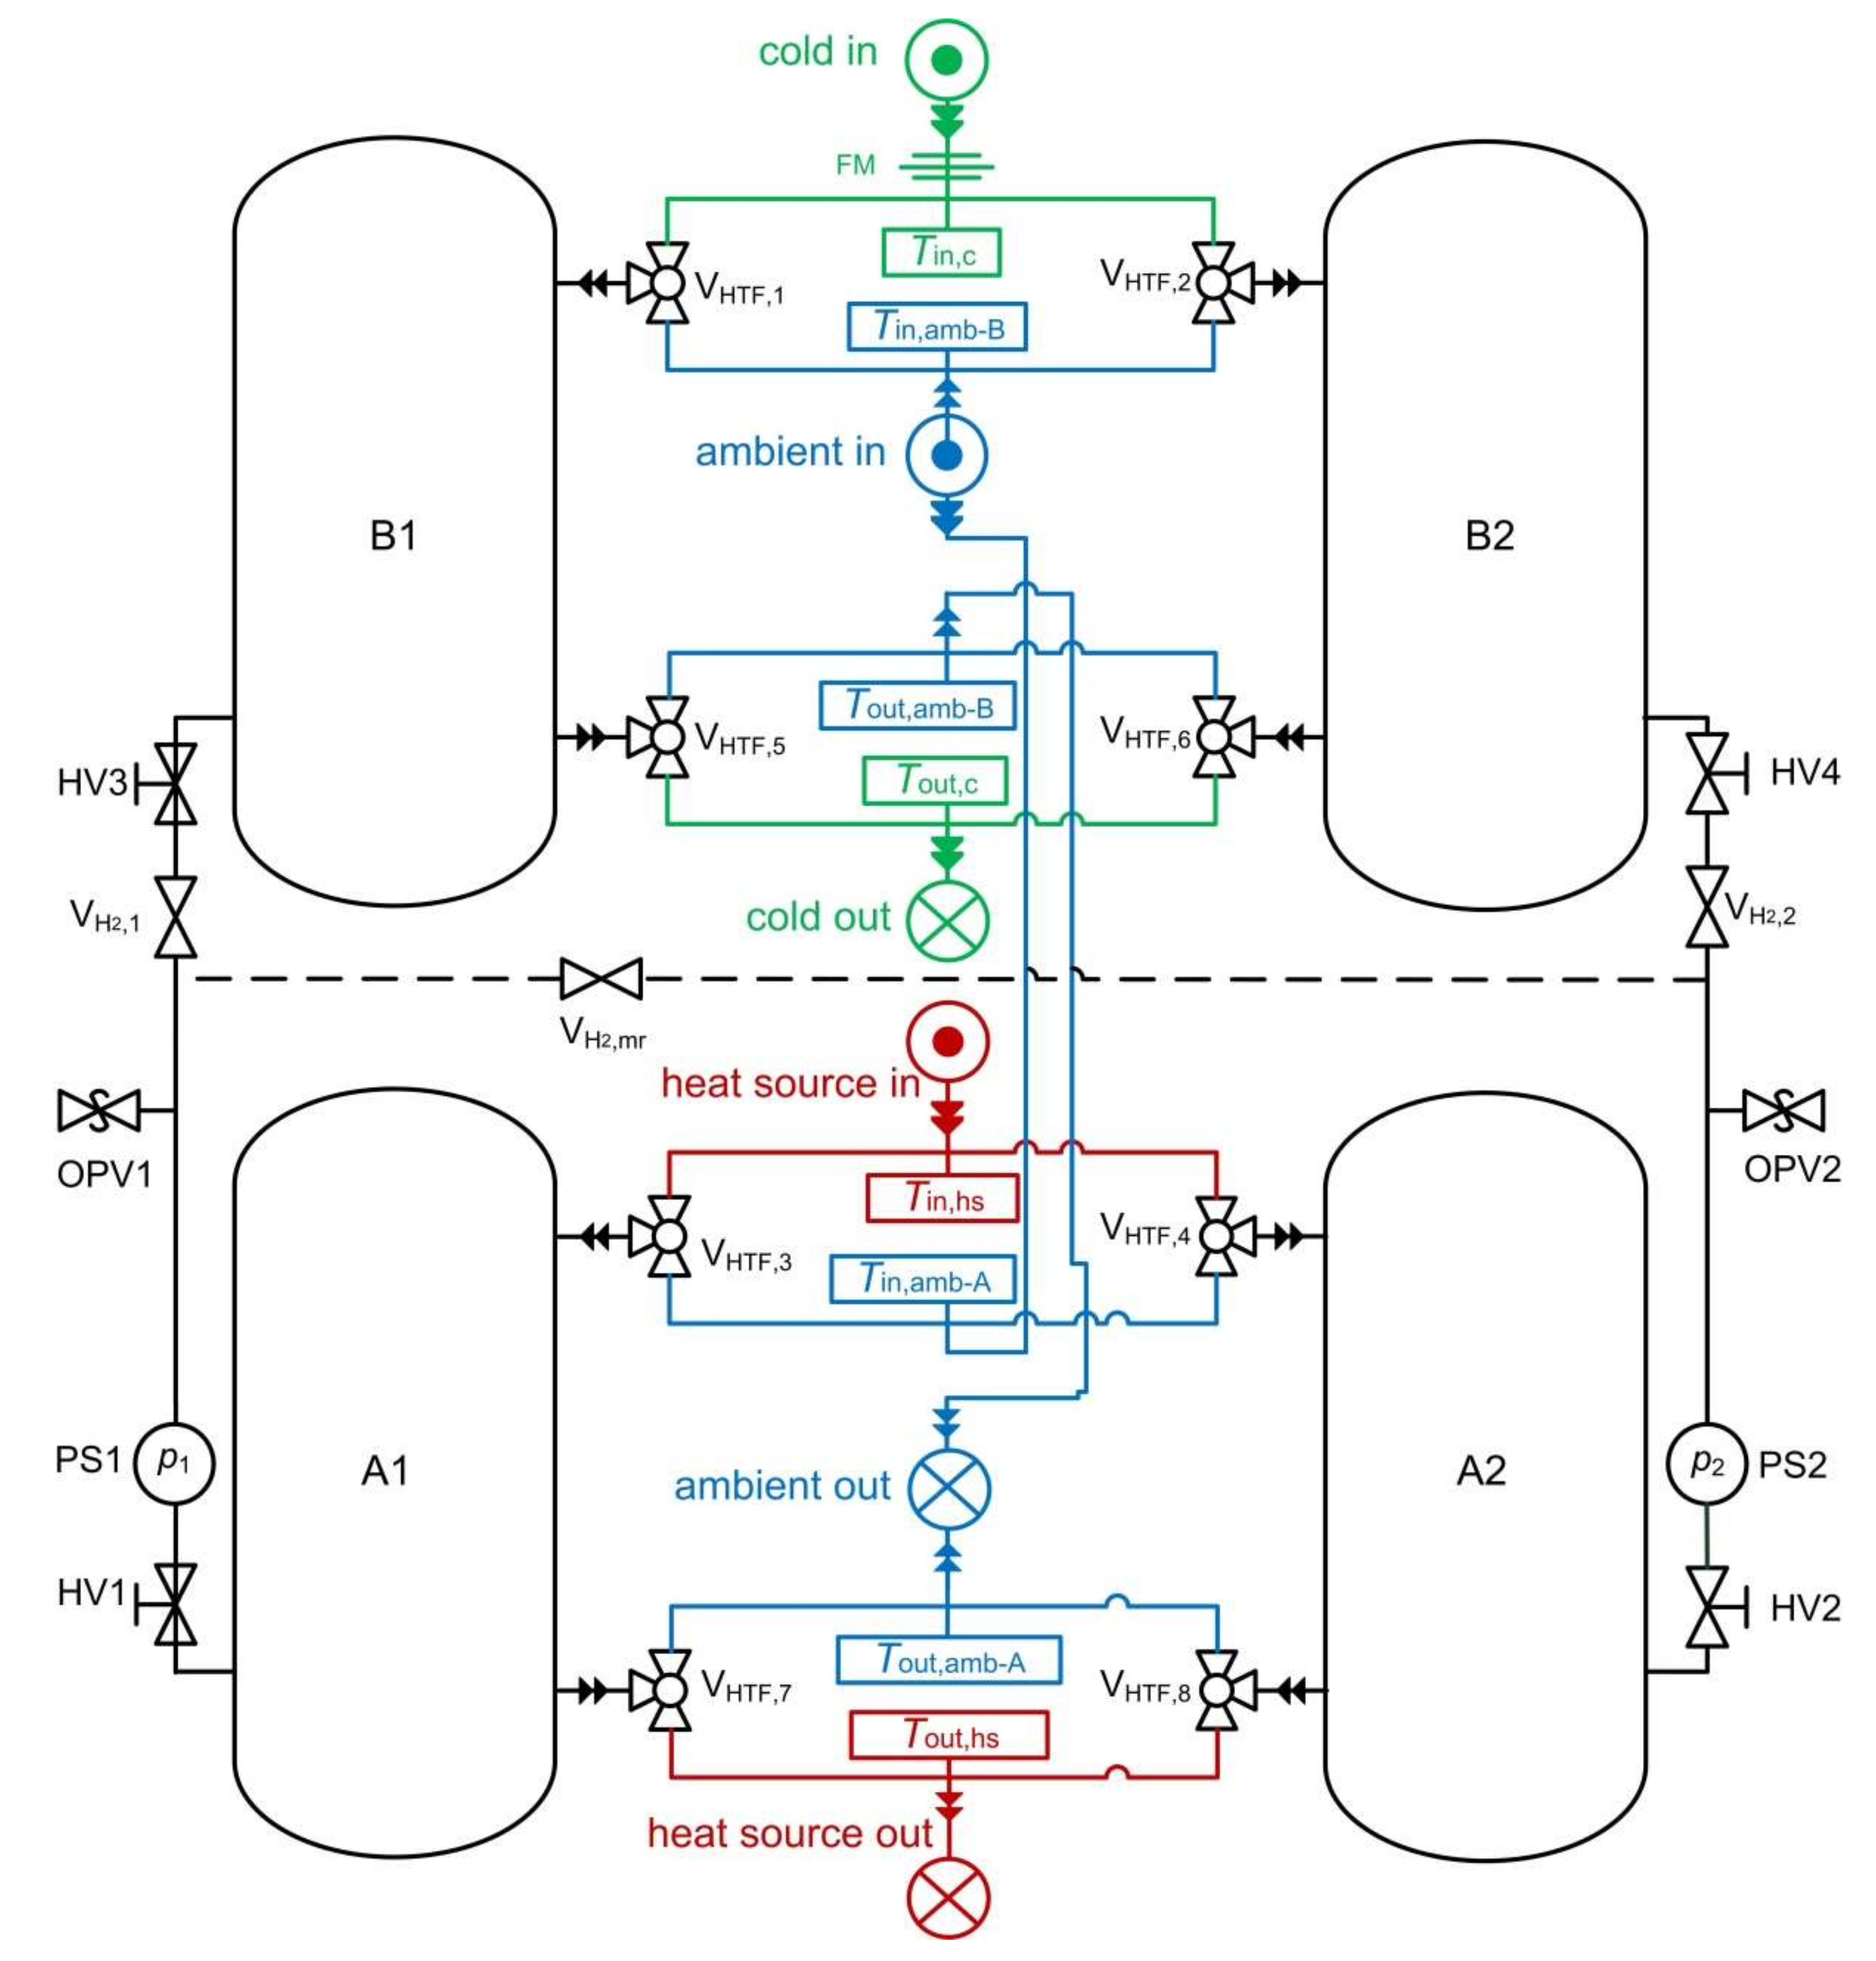
After presenting the MH materials and the reactor design, in the following, details on the complete modular MHCS are given. According to the schematic flow diagram in Figure 4, the module can be divided into two symmetrical parts, a hydrogen section, an HTF section (colored lines) and the two coupled reactor pairs A1,2–B1,2. Each reactor pair consists of reactor B filled with cold generating MH Hydralloy® C5 and reactor A filled with hydrogen-compressing MH LaNi4.75Al0.25.
Hydrogen section:
In the hydrogen section, reactors A and B are each coupled by means of stainless steel tubes with an inner diameter of 4 mm. According to the working principle of the MHCS (cf. Figure 1), in the regeneration, HC hydrogen is supplied by reactor A and absorbed by B and vice versa in the cooling HC. In order to monitor the pressure in corresponding reactor pairs, the pressure sensors (PS) 1 and 2 are included, which are installed next to the in-/outlet of reactor A1,2.
Safety valves are also implemented in the hydrogen section: since the maximum permitted reactor pressure is limited to 30 bar, the mechanical overpressure valves (OPV) 1 and 2 are installed that release hydrogen to the ambient environment for pressures above this value. The hand valves (HV) 1–4, which are at the inlet of each reactor, protect the MH from an oxygen atmosphere after the filling procedure in the glove box or in case of leakage in the hydrogen piping.
The electromagnetic valves VH2,1,2 enable a separation of the reactors A/B, while the electromagnetic valve VH2,mr allows a connection of A1 and A2 via the stainless steel tube (dashed line). This functionality of mass recovery aims to reduce thermal losses during the switching of the HC and will be discussed in Section 2.4.
HTF section:
Corresponding to the working principle of the system, the HTF section in the middle of Figure 4 consists of a cooling HTF loop (green, connected to reactors B), an ambient HTF loop (blue, connected to reactors A and B) as well as a heat source HTF loop (red, connected to reactors A). As the complete MHCS module is designed as a “black box” that only provides heat or cold, for each of these loops, there is only one in- and outlet connection at the backside of the module (see module section below).
The electromagnetic three-way valves VHTF,1–8 at the inlet and outlet of the reactors connect these three HTF loops with the alternately working MH reactors corresponding to the required operation. During the 1st HC, the cooling HTF loop is connected to B1, and heat is supplied for the desorption of hydrogen, which results in a decrease of the outlet temperature in the cooling HTF loop due to an endothermic reaction. At the same time, the ambient HTF loop flows through the reactor A1, and the exothermic heat of formation, owing to the absorption of released hydrogen from B1, is released. In the following second HC, the positions of the HTF valves are changed, and the reactors B1 and A1 are connected to the ambient HTF loop and heat source HTF loop, respectively. Thus, heat is supplied to A1 causing it to desorb hydrogen, which is absorbed by B1 and the hydrogen cycle is closed again. The corresponding heat of formation is released to the ambient HTF loop. The reactor pair A2/B2 alternately passes the same operation for a continuous cooling effect.
In order to determine the transferred thermal power, a flow meter (FM) and two thermocouples (calibrated by temperature difference) are integrated into the inlet and outlet of the cooling HTF loop. The resulting transferred cooling power is calculated according to:
Positive values of the HTF power correspond to a cooling effect, while negative values show a heat input in the HTF cooling loop. Further thermocouples in the ambient and heat source HTF loop survey the temperatures in these loops.
The implemented measurement sensors and components of the module (see Table A1) as well as the uncertainty analysis used to determine the corresponding error bars for the cooling power reported in Section 3 are described in the Appendix A.
Module:
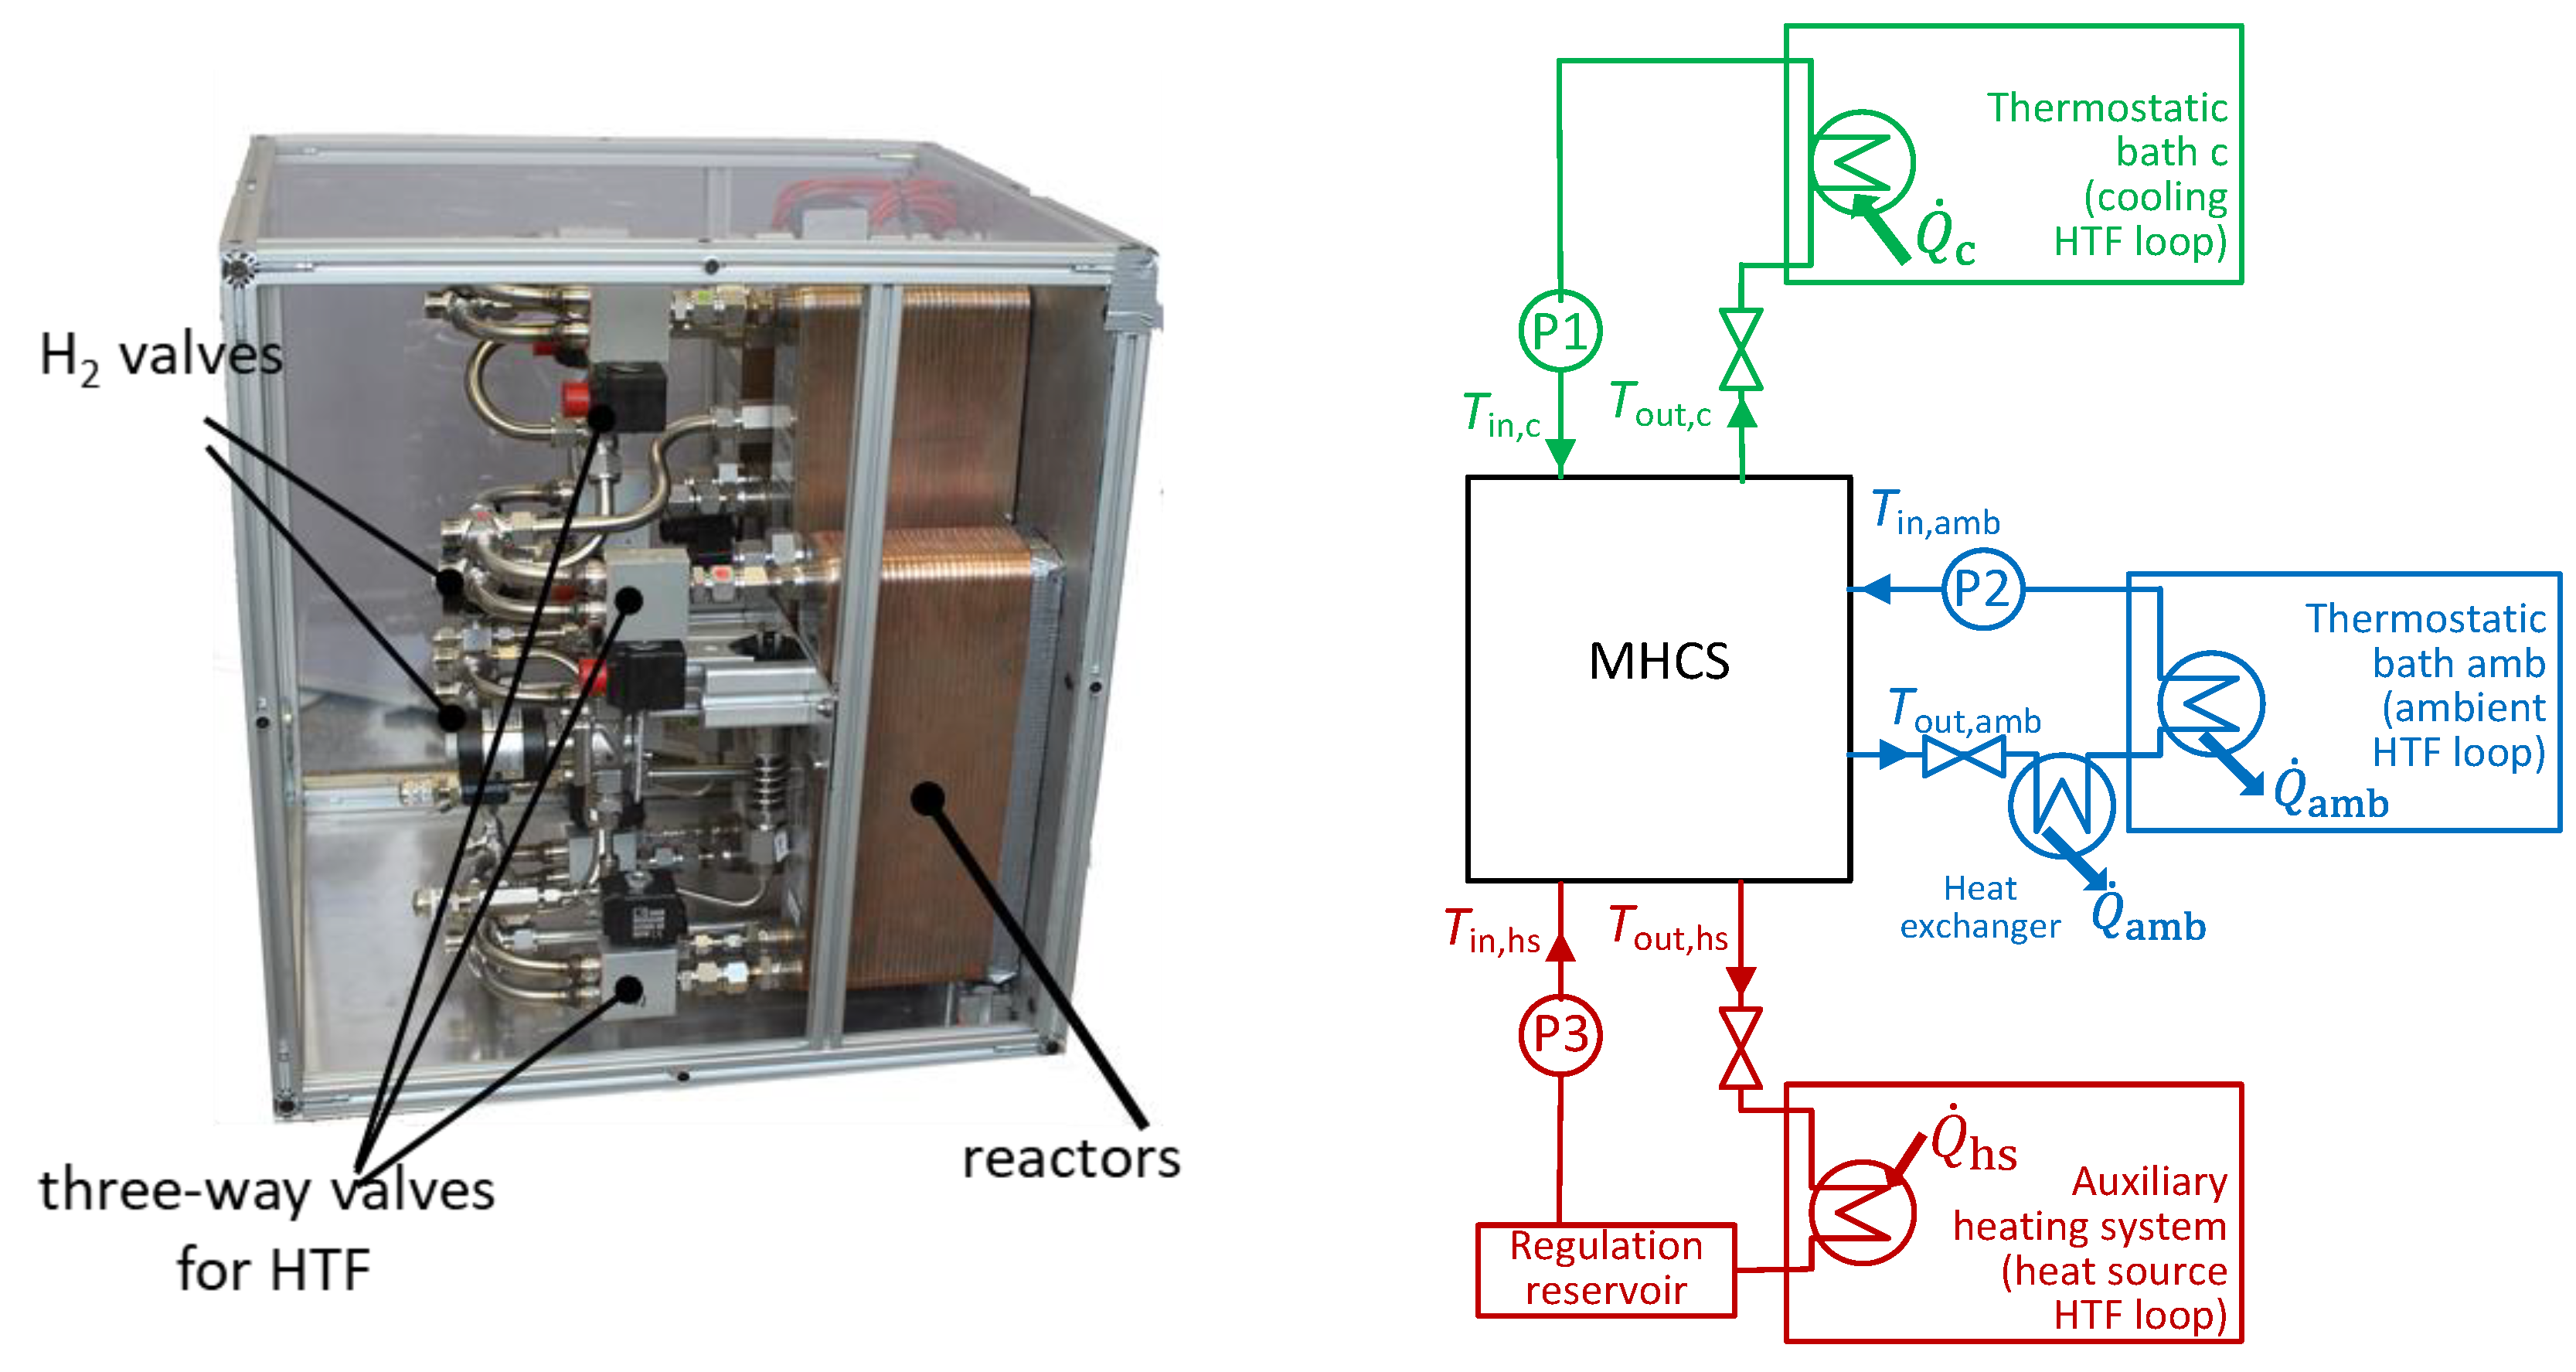
A picture of the realized MHCS module can be seen on the left side of Figure 5. All components of the hydrogen section and HTF section (including reactors) are integrated into a compact housing of around 8 × 10⁻² m3 (reactor and MH volume < 20 × 10−3 m3) with the dimensions of 0.4 m × 0.4 m × 0.5 m ( × × ) and a total system weight of 65 kg (reactor and MH weight < 30 kg).
The MHCS is automatically operated by a control unit based on an Arduino Mega 2560 microcontroller (24 V), which automatically switches the HC in a user-specified way. An Agilent 34970A data acquisition unit is used for the experimental data logging of temperature, hydrogen pressure and cooling HTF flow rate.
As mentioned before, this module is designed as a “black box”, which can provide a cooling effect with simple connections for the HTF loops at the back side. In order to validate the MHCS, a testing infrastructure was built that provides these connections with HTF at the temperature levels , and (see Figure 5, right). The thermostatic bath TBamb is connected to the ambient HTF loop and this loop is extended by an additional liquid-to-liquid heat exchanger to release the heat to the cooling infrastructure of the laboratory in case the cooling power of the thermostatic bath TBamb is not sufficient. The thermostatic bath TBc is connected as the heat source to the cooling HTF loop. Finally, a diesel-powered auxiliary heating system is connected to the heat source HTF loop, which is used as a thermal driving force for the MHCS. An additional reservoir is implemented to guarantee a constant inlet temperature in case of fluctuations in the auxiliary heating system.
For the sensitivity study in Section 3.2, the desired inlet temperatures of the HTF loops can be varied by the thermostatic baths and the auxiliary heating system. The corresponding HTF flow rates can be adjusted by means of the pumps P1–3. As HTF, Huber SilOil M40.165 is used, which has a specific heat capacity of and a density of at 25 °C.
For future applications, the module could be integrated in a user-defined way by connecting the desired HTF loops to the “black box” connections. One possible mobile application is the integration into a truck with a diesel engine, where the waste heat of the exhaust is reutilized as the heat source and driving force of the MHCs to increase vehicle efficiency. Thereby, the cooling loop is connected to the cabin (the refrigerant cycle) and the ambient HTF loop releases its heat to the ambient environment using the vehicle radiator. Another option is a battery-electric bus, where the MHCS can provide sufficient cooling for the driver cabin. In this case, the heat source would be connected to an additional burner (e.g., based on bioethanol), which is used for heating purposes during wintertime.
2.4. MHCS Operation and Optimization Strategy
There exist several studies in the literature, indicating that for thermally driven sorption systems, system optimization strategies are required to increase the achieved thermal power. For example, internal heat recovery or mass recovery options are proposed [2,3,14,15,29]. However, for all of these approaches, either an increased number of MH reactors is required (multi-stage systems) or further valves have to be integrated (heat recovery). Thus, in the present MHCS, two innovative strategies are implemented that focus on a significant improvement in performance while requiring minimal effort in the overall system layout.
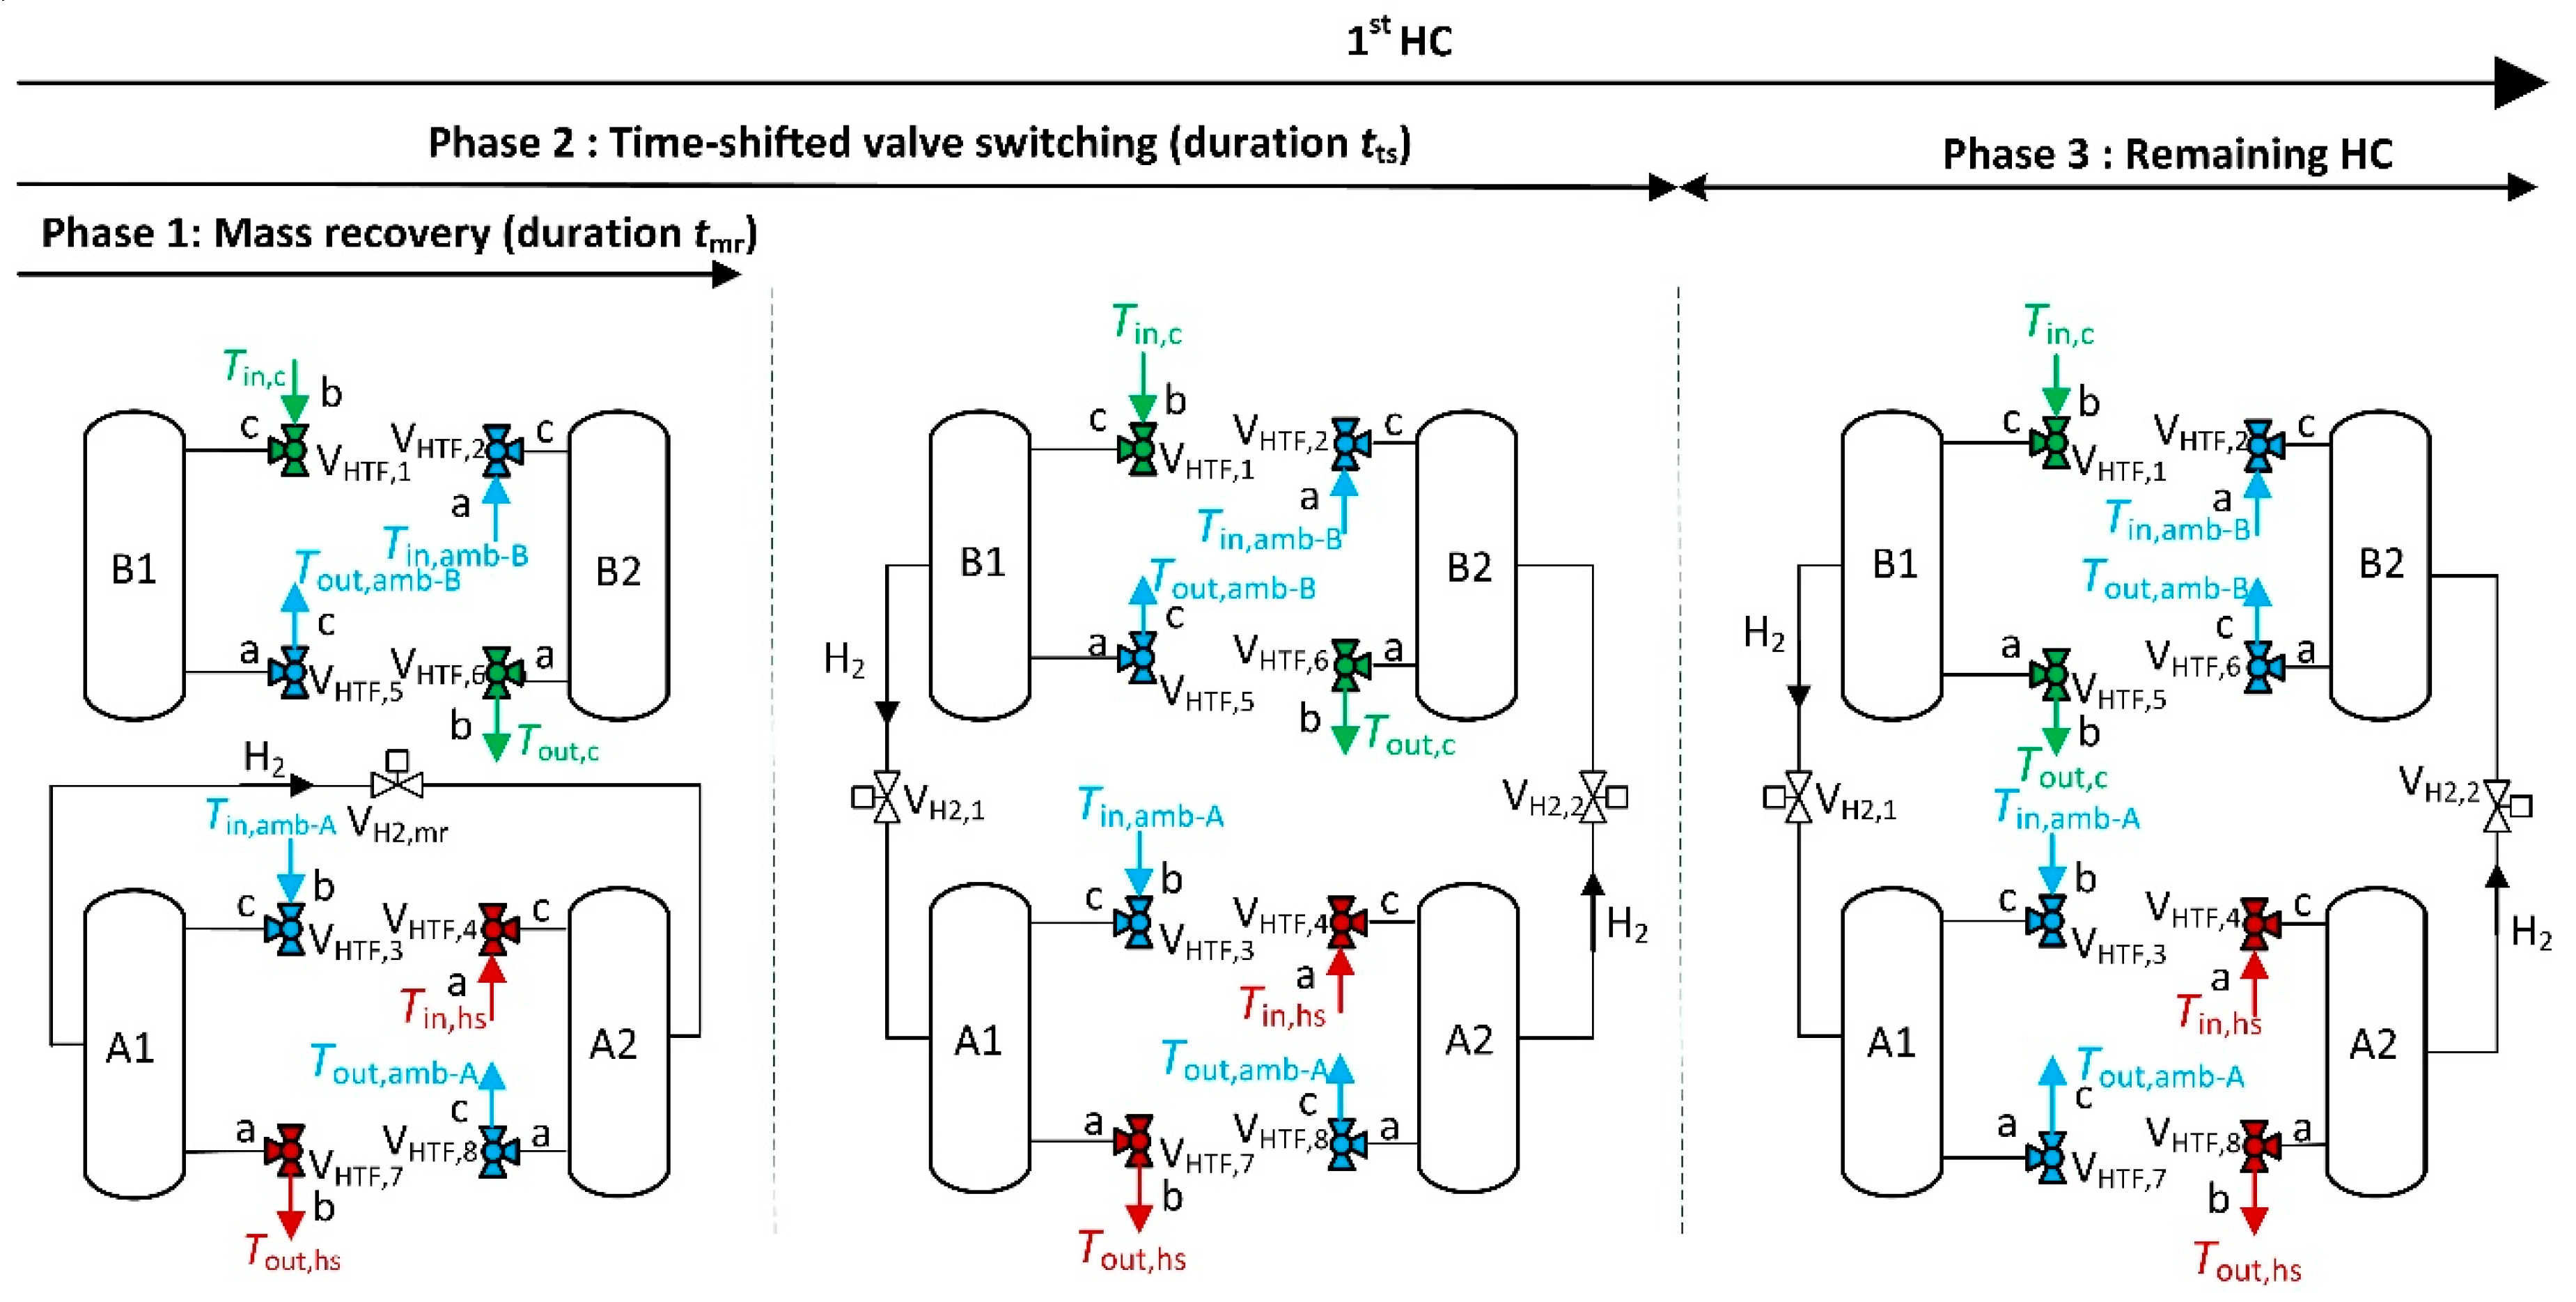
First of all, a strategy called optimized “time-shifted valve switching” has been implemented that has first been presented in a previous publication of the open MHCS [26]. Thereby, the HTF valves at the inlet and outlet of the reactors are not switched at the same time to avoid the following situation: at the beginning of each cooling HC, ambient HTF from the previous HC is present in the HTF volume of the currently desorbing reactor (volume between the HTF inlet valves VHTF,1–4 and the corresponding HTF outlet valves VHTF,5–8). Consequently, when the HTF inlet valves and the HTF outlet valves are switched at the same time, there is a heat input from the ambient HTF loop in the cooling HTF loop. This heat input would reduce the resulting cooling power and is referred to as fluid exchange losses.
The present valve switching strategy aims to avoid these losses. Therefore, in each HC (cf. Figure 6), first the positions of the HTF valves at the reactor inlet VHTF,1–4 are changed and the positions of the HTF outlet valves VHTF,5–8 remain unchanged from the previous HC for the duration . This implies that the outlet of the previously absorbing reactor is initially still connected to the hot ambient HTF loop until the remaining hot HTF inside of the reactor has flown into the intended ambient HTF loop. At the same time, the remaining cold HTF in the other reactor flows into the cooling HTF loop. After the interval the HTF outlet valves are switched simultaneously and complete the valve switching strategy.
An optimal interval length of around can be estimated using the HTF volume of around 1.1 × 10⁻³ m3 between the HTF valves of the reactor as well as the HTF flow rate of 6.3 10−3 m3 min−1. However, this value needs to be optimized and a detailed evaluation of the operation optimization for various durations is shown in Section 3.2. As this operation optimization is based on an intelligent control only, no additional pipes or valves have to be integrated in the MHCS.
The second measure that has been taken to reduce the loss in efficiency is a hydrogen mass recovery option. The effort to implement this strategy is also quite small, as principally only one extra hydrogen valve is required to connect the MHs A1 and A2 [30]. The effect of this strategy is based on the fact that at the end of each half-cycle, there is a pressure difference between the reactors A1 and A2 with the same hydride material. For instance, in the 1st HC reactor A1 desorbs hydrogen during the regeneration phase and is at a high-pressure level, while reactor A2 is absorbing, yet at the low-pressure level. By closing the connections between the reactor pairs A1/B1 and A2/B2 at the end of the HC, and instead connecting the two reactors A1 and A2 by opening VH2,mr, the pressure will reach an intermediate level and lead to a hydrogen “mass recovery”: reactor A1 continues to endothermically desorb hydrogen, whereas at the same time A2 absorbs. Thus, this short mass recovery phase increases the mass of exchangeable hydrogen between the reactor pairs. Furthermore, the mass recovery supports the required temperature change of the two reactors and therefore reduces the thermal energy consumption of the whole system.
3. Results and Discussion
In this section, the experimental results of the compact MHCS for a reference experiment are presented including detailed transient profiles of pressures and temperatures. Furthermore, it is shown how representing average values are deduced from these profiles, which will be used in the subsequent part for a sensitivity study on factors influencing the achieved cooling power. Finally, from this sensitivity study, optimized operation conditions for the present MHCS are defined and options for further system improvement are discussed.
3.1. Results of the Reference Experiment
The reference experimental conditions have been chosen as follows: the inlet temperatures of the heat source HTF, ambient HTF and cooling HTF loop are adjusted to , and , respectively, and the flow rate in the cooling HTF loop is . The HCs are switched after a fixed duration of 180 s and, at the beginning of each new HC, the duration of the time-shifted HTF valve switching is set to , while the duration of the mass recovery is . After an initial running-in period of three HCs, when constant operating conditions are reached, the reference experiment (as well as all further experiments) was run for around 15 min of which an extract of 1000 s is shown. The presented values of the average cooling power are calculated for the entire duration of the experiment based on Equation (3).
Corresponding to the description of the experimental setup, first, the hydrogen section is shown in detail, before the temporal course of the HTF temperature and the resulting cooling power in the cooling HTF loop is evaluated. Finally, the effects of the optimized operation strategy implementing time-shifted valve switching and mass recovery are discussed.
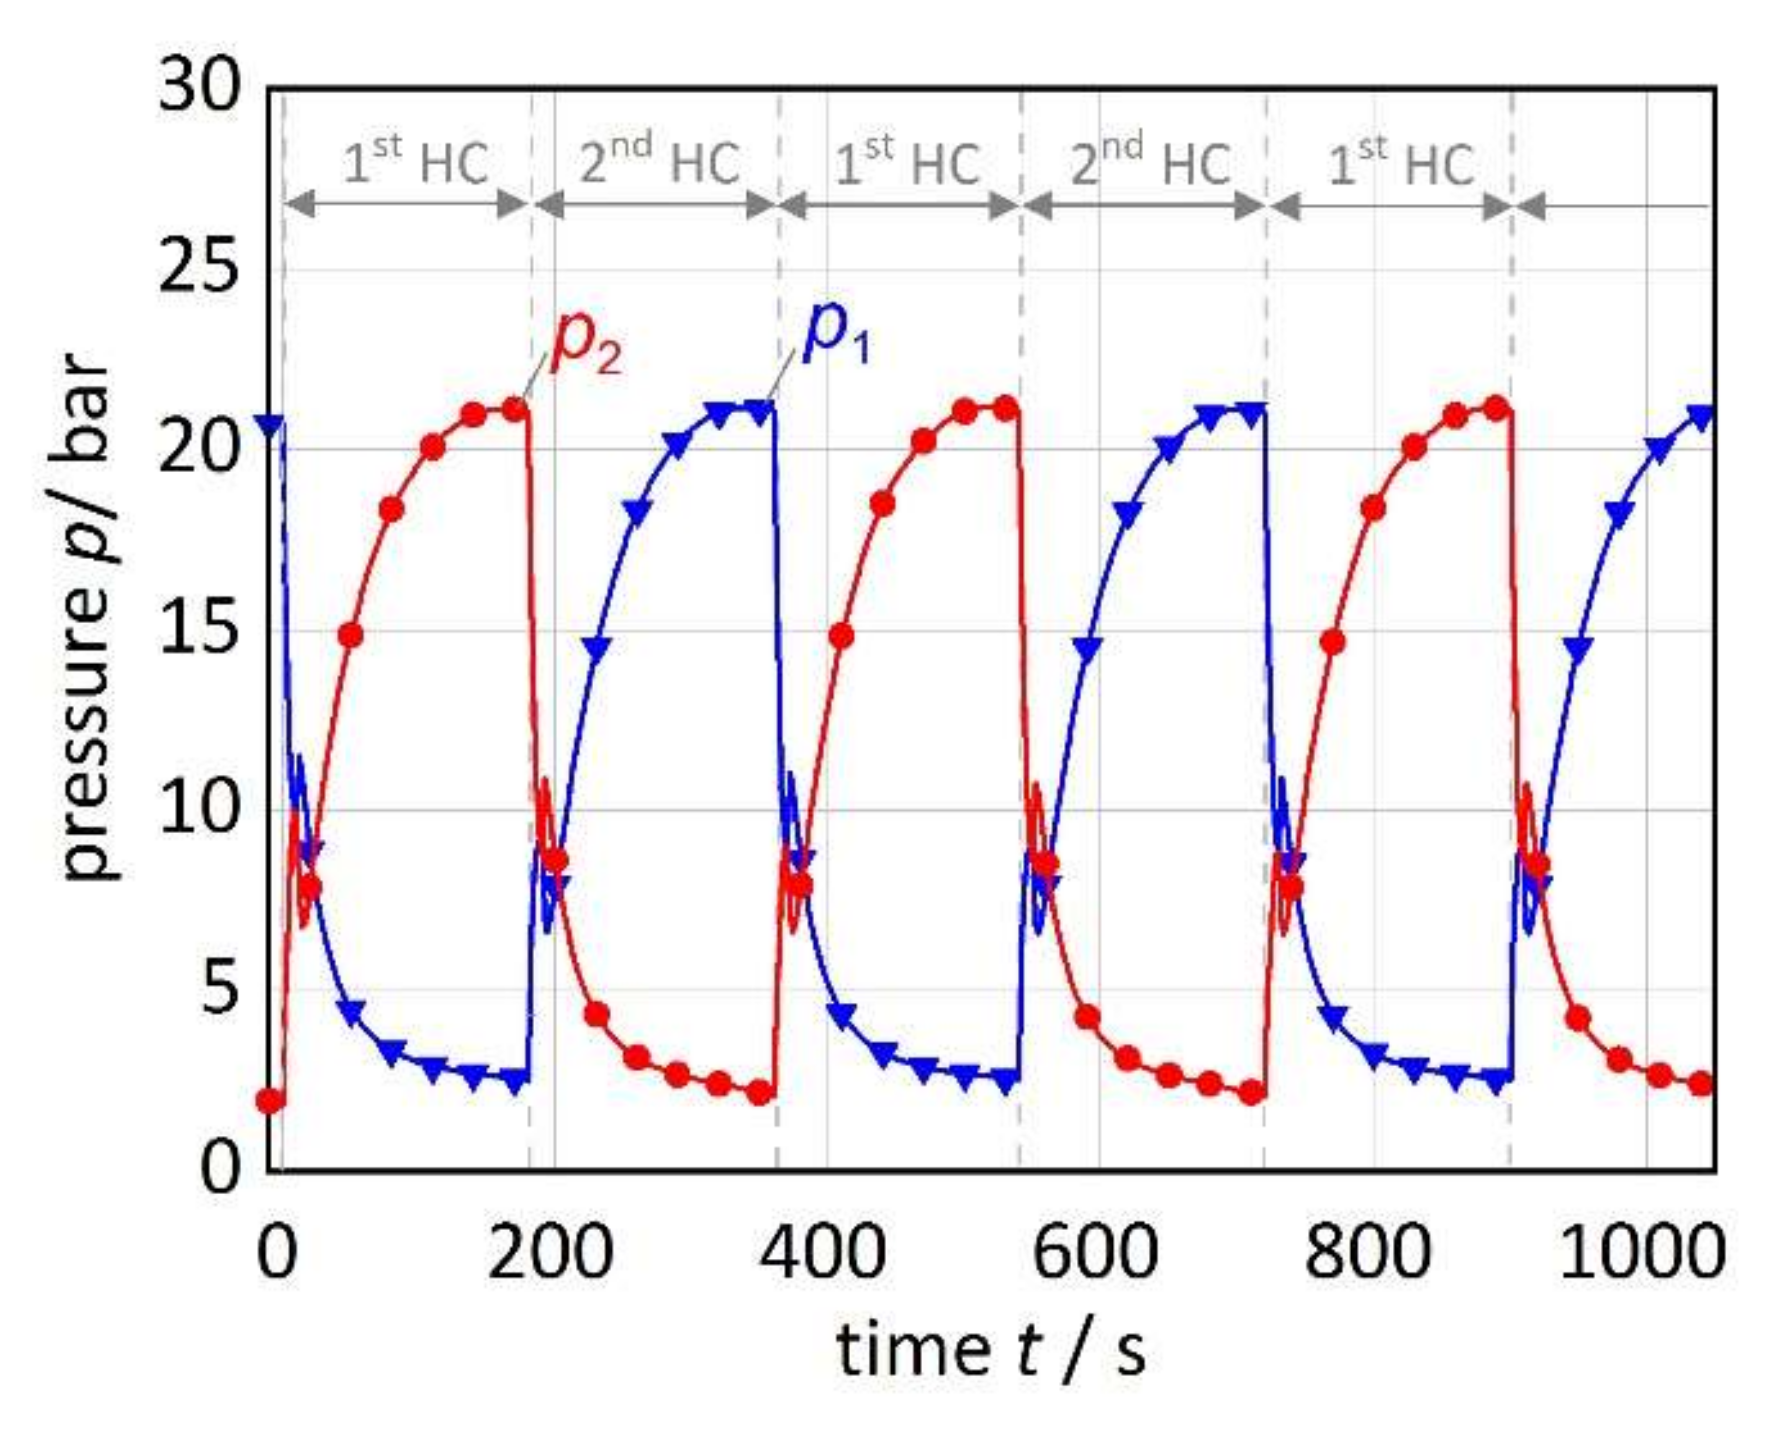
Figure 7 shows the temporal course of the pressure and for reactor pairs 1 and 2, respectively. From these pressure profiles, the alternating and quasi-continuous operation of the two reactor pairs between a minimum pressure of around and a maximum pressure of around can be observed. These pressures correspond to the material characteristics at the set temperatures and . According to the defined states of operation in Section 2.4 and Table 2, in the 1st HC (e.g., at t = 0–180 s), pair 1 is in the cooling HC and a decrease of can be observed. In the subsequent second HC (e.g., at t = 180–360 s), the pressure of pair 1 increases during the regeneration HC due to the rise in temperature of reactor A1 to . At the same time, reactor pair 2 alternately passes the same pressure and temperature levels. The corresponding HC are automatically switched after the fixed duration of . An inset, focusing on details of the characteristic pressure changes of the 1st HC behavior, will be shown for the time between 720 and 900 s in Figure 9.
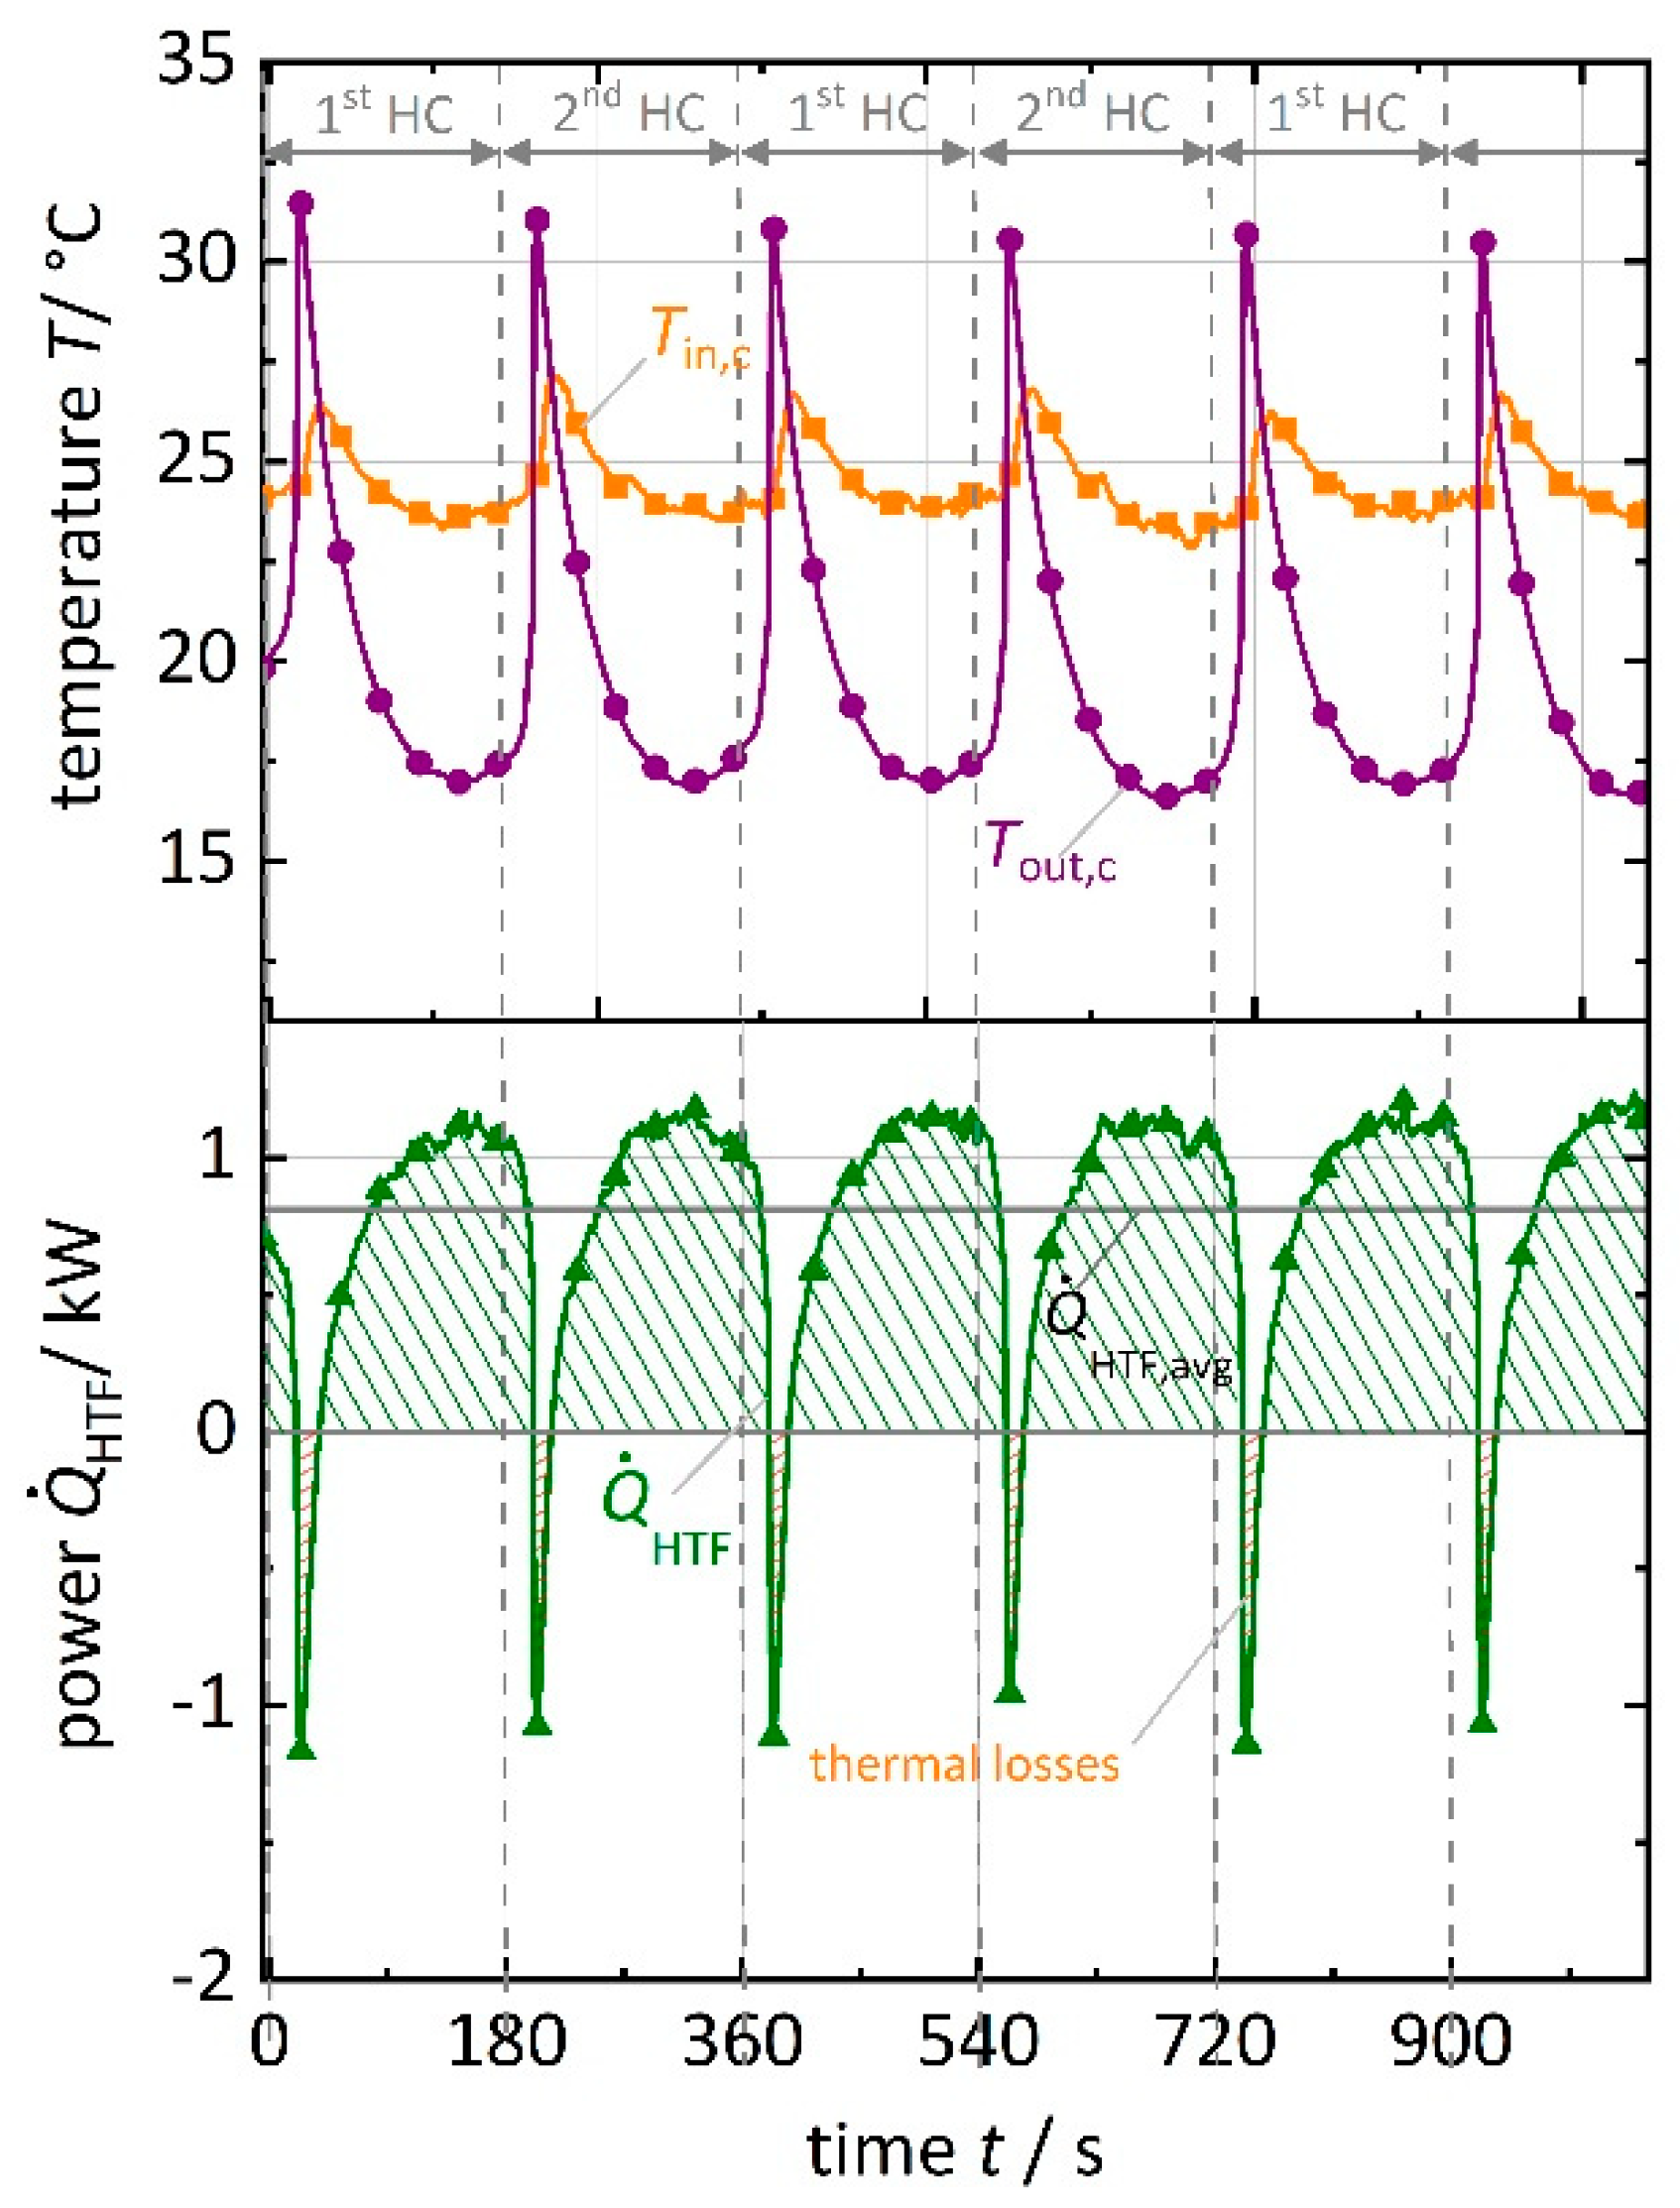
Next to the pressure profiles, Figure 8 shows the transient evolution of the inlet and outlet temperatures in the cooling HTF loop, as well as the calculated resulting power. Again, the quasi-continuous operation of the reactor pairs is obvious due to the periodic behavior following the HC times of 180 s. The temperature peak at the outlet of the HTF loop indicates the heat input due to the temperature switching from the previous regeneration cycle. During the actual cooling phase, a maximum temperature decrease between the inlet and outlet of the cooling HTF loop of can be reached, which refers to a maximum cooling power of 1.18 kW (green). Considering the total HC, the average cooling power is important. This value is calculated using the total thermal energy (area below the curve) divided by the time of the HC. As indicated by the grey horizontal line in Figure 8, it is reduced to 0.83 kW due to the discussed negative peak with a maximum value of –1.17 kW.
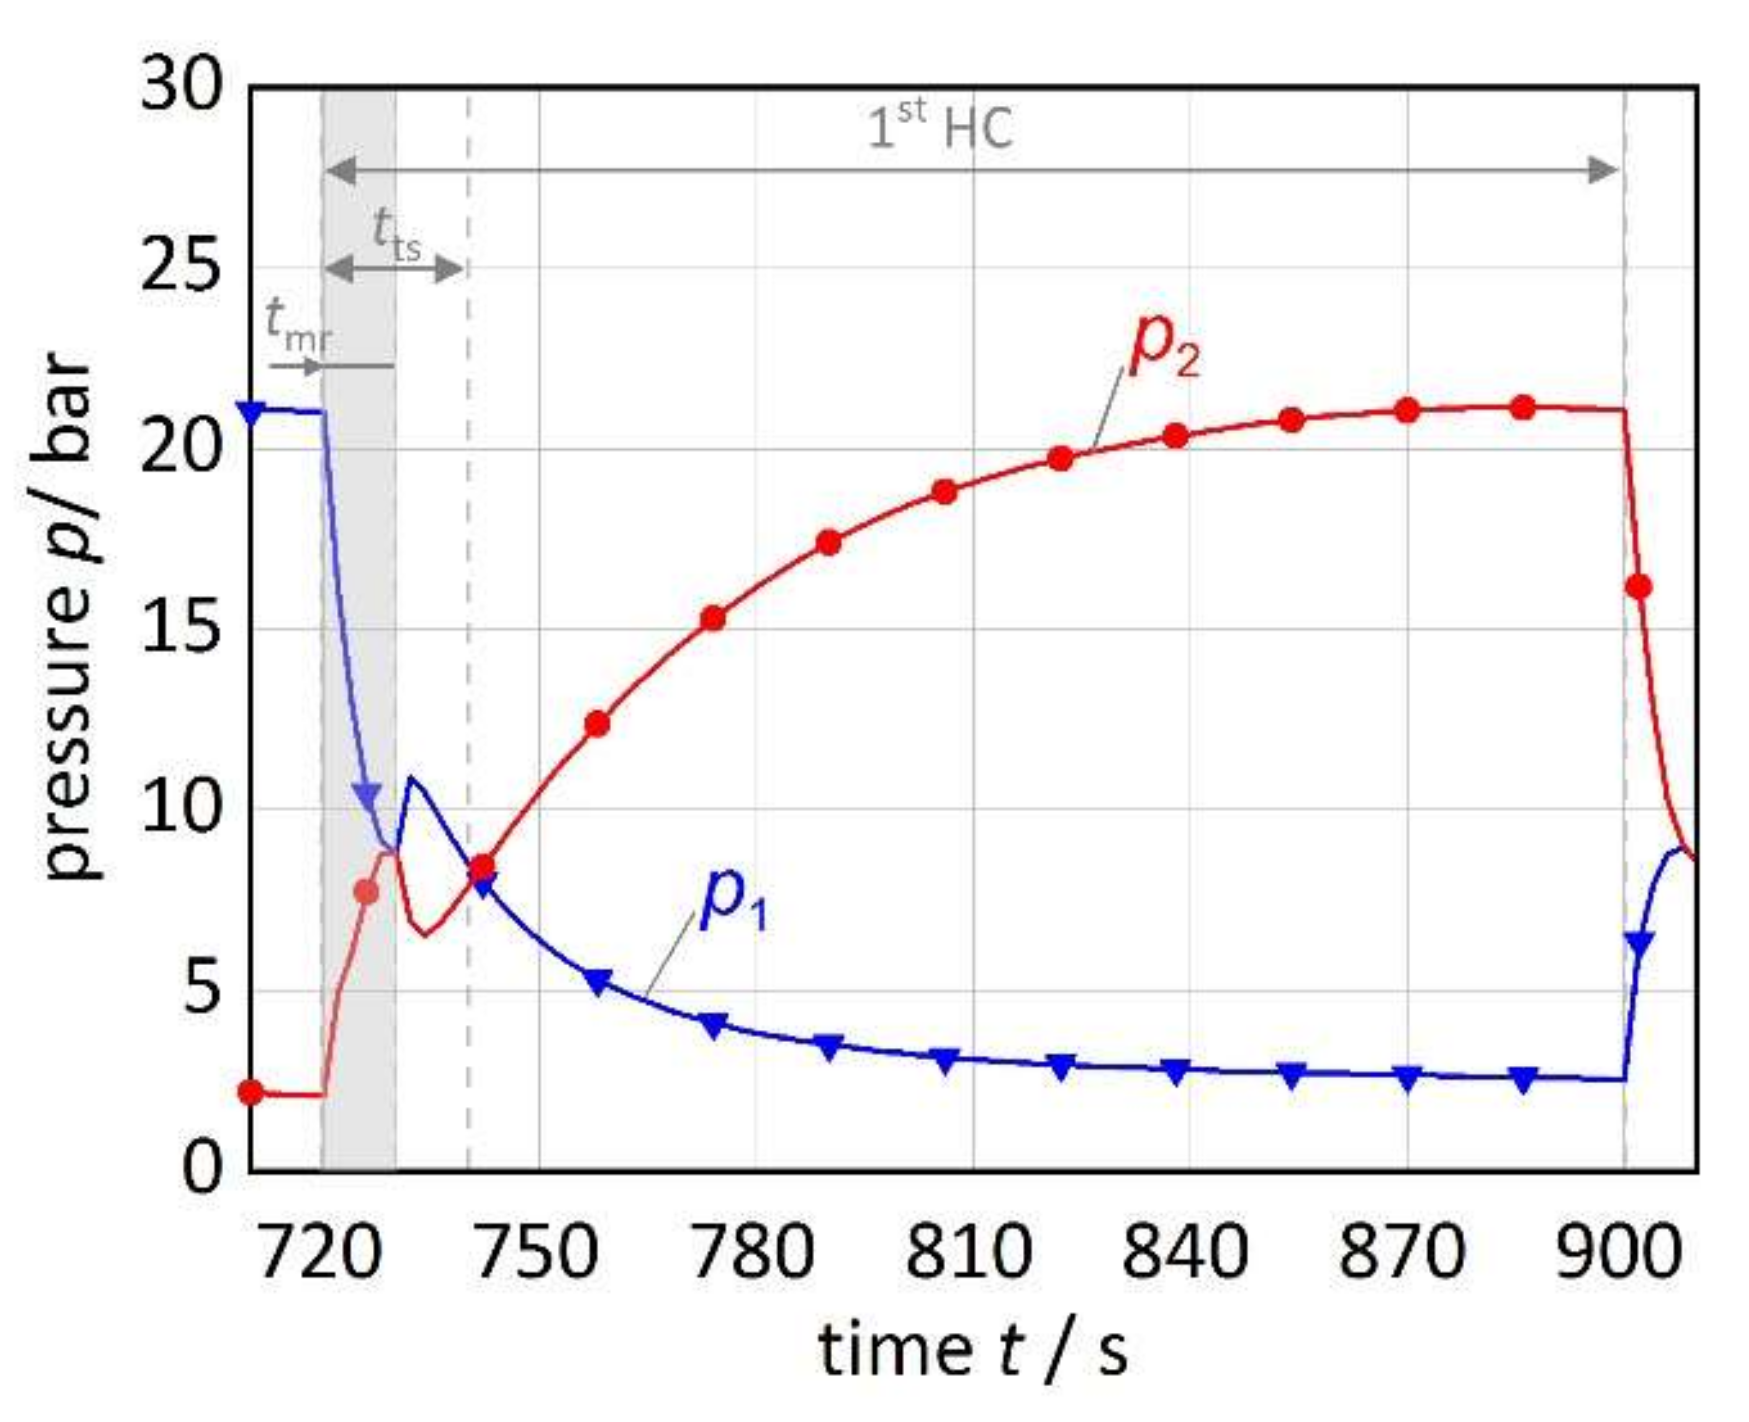
As mentioned before, next to the design of a compact module, a focus of the present MHCS has been on the implementation of two simple strategies to reduce the thermal losses due to switching between the operating temperatures. In order to discuss the effects of these two measures, exemplarily the 1st HC behavior during of the reference experiment has been chosen. Figure 9 shows the transient course of the pressures focusing on mass recovery, while Figure 10. shows the effect of time-shifted valve switching on the HTF temperatures. The corresponding phases 1–3 are defined according to the states of operation in Figure 6.
Phase 1: Hydrogen mass recovery (duration of , here from ):
At the beginning of the considered HC (at ), the reactor pairs are in a state resulting from the previous HC. Thus, reactor pair 1 was in the regeneration HC and is at the high-pressure level , while reactor pair 2 was operating at the low-pressure level during the cooling HC. Then, the HTF inlet valves, as well as the hydrogen valves, are switched according to the MHCS operation strategy.
During the mass recovery phase, the reactors A1 and A2 are coupled on the hydrogen side by opening the hydrogen valve VH2,mr. As a result, the pressure in reactor A1 is decreasing sharply by about (Figure 9, blue). At the same time in reactor A2, the pressure increases by (red) and the thermodynamic conditions are changed in a way that it can continue to absorb some hydrogen released by reactor A1. After reaching an equalized pressure of 8.8 bar at , the mass recovery is finished and for both pairs, the reactors A and B are again connected on the hydrogen side. As soon as the mass recovery phase is over, the equilibrium pressure of reactor B1 is higher than in the reactor A1, resulting in a sudden rise in that can be observed at . In contrast to this, in pair 2 the equilibrium pressure of the discharged reactor B2 leads to a sudden drop of at the same time.
Phase 2: Time-shifted valve switching (duration of , from ):
This phase is also initiated at by switching the HTF inlet valves VHTF,1-4, but it is kept on for a longer interval than the mass recovery (duration of ). The purpose of the time-shifted valve switching is to avoid any unnecessary mixing of HTF loops with different temperatures, which can be explained by the following.
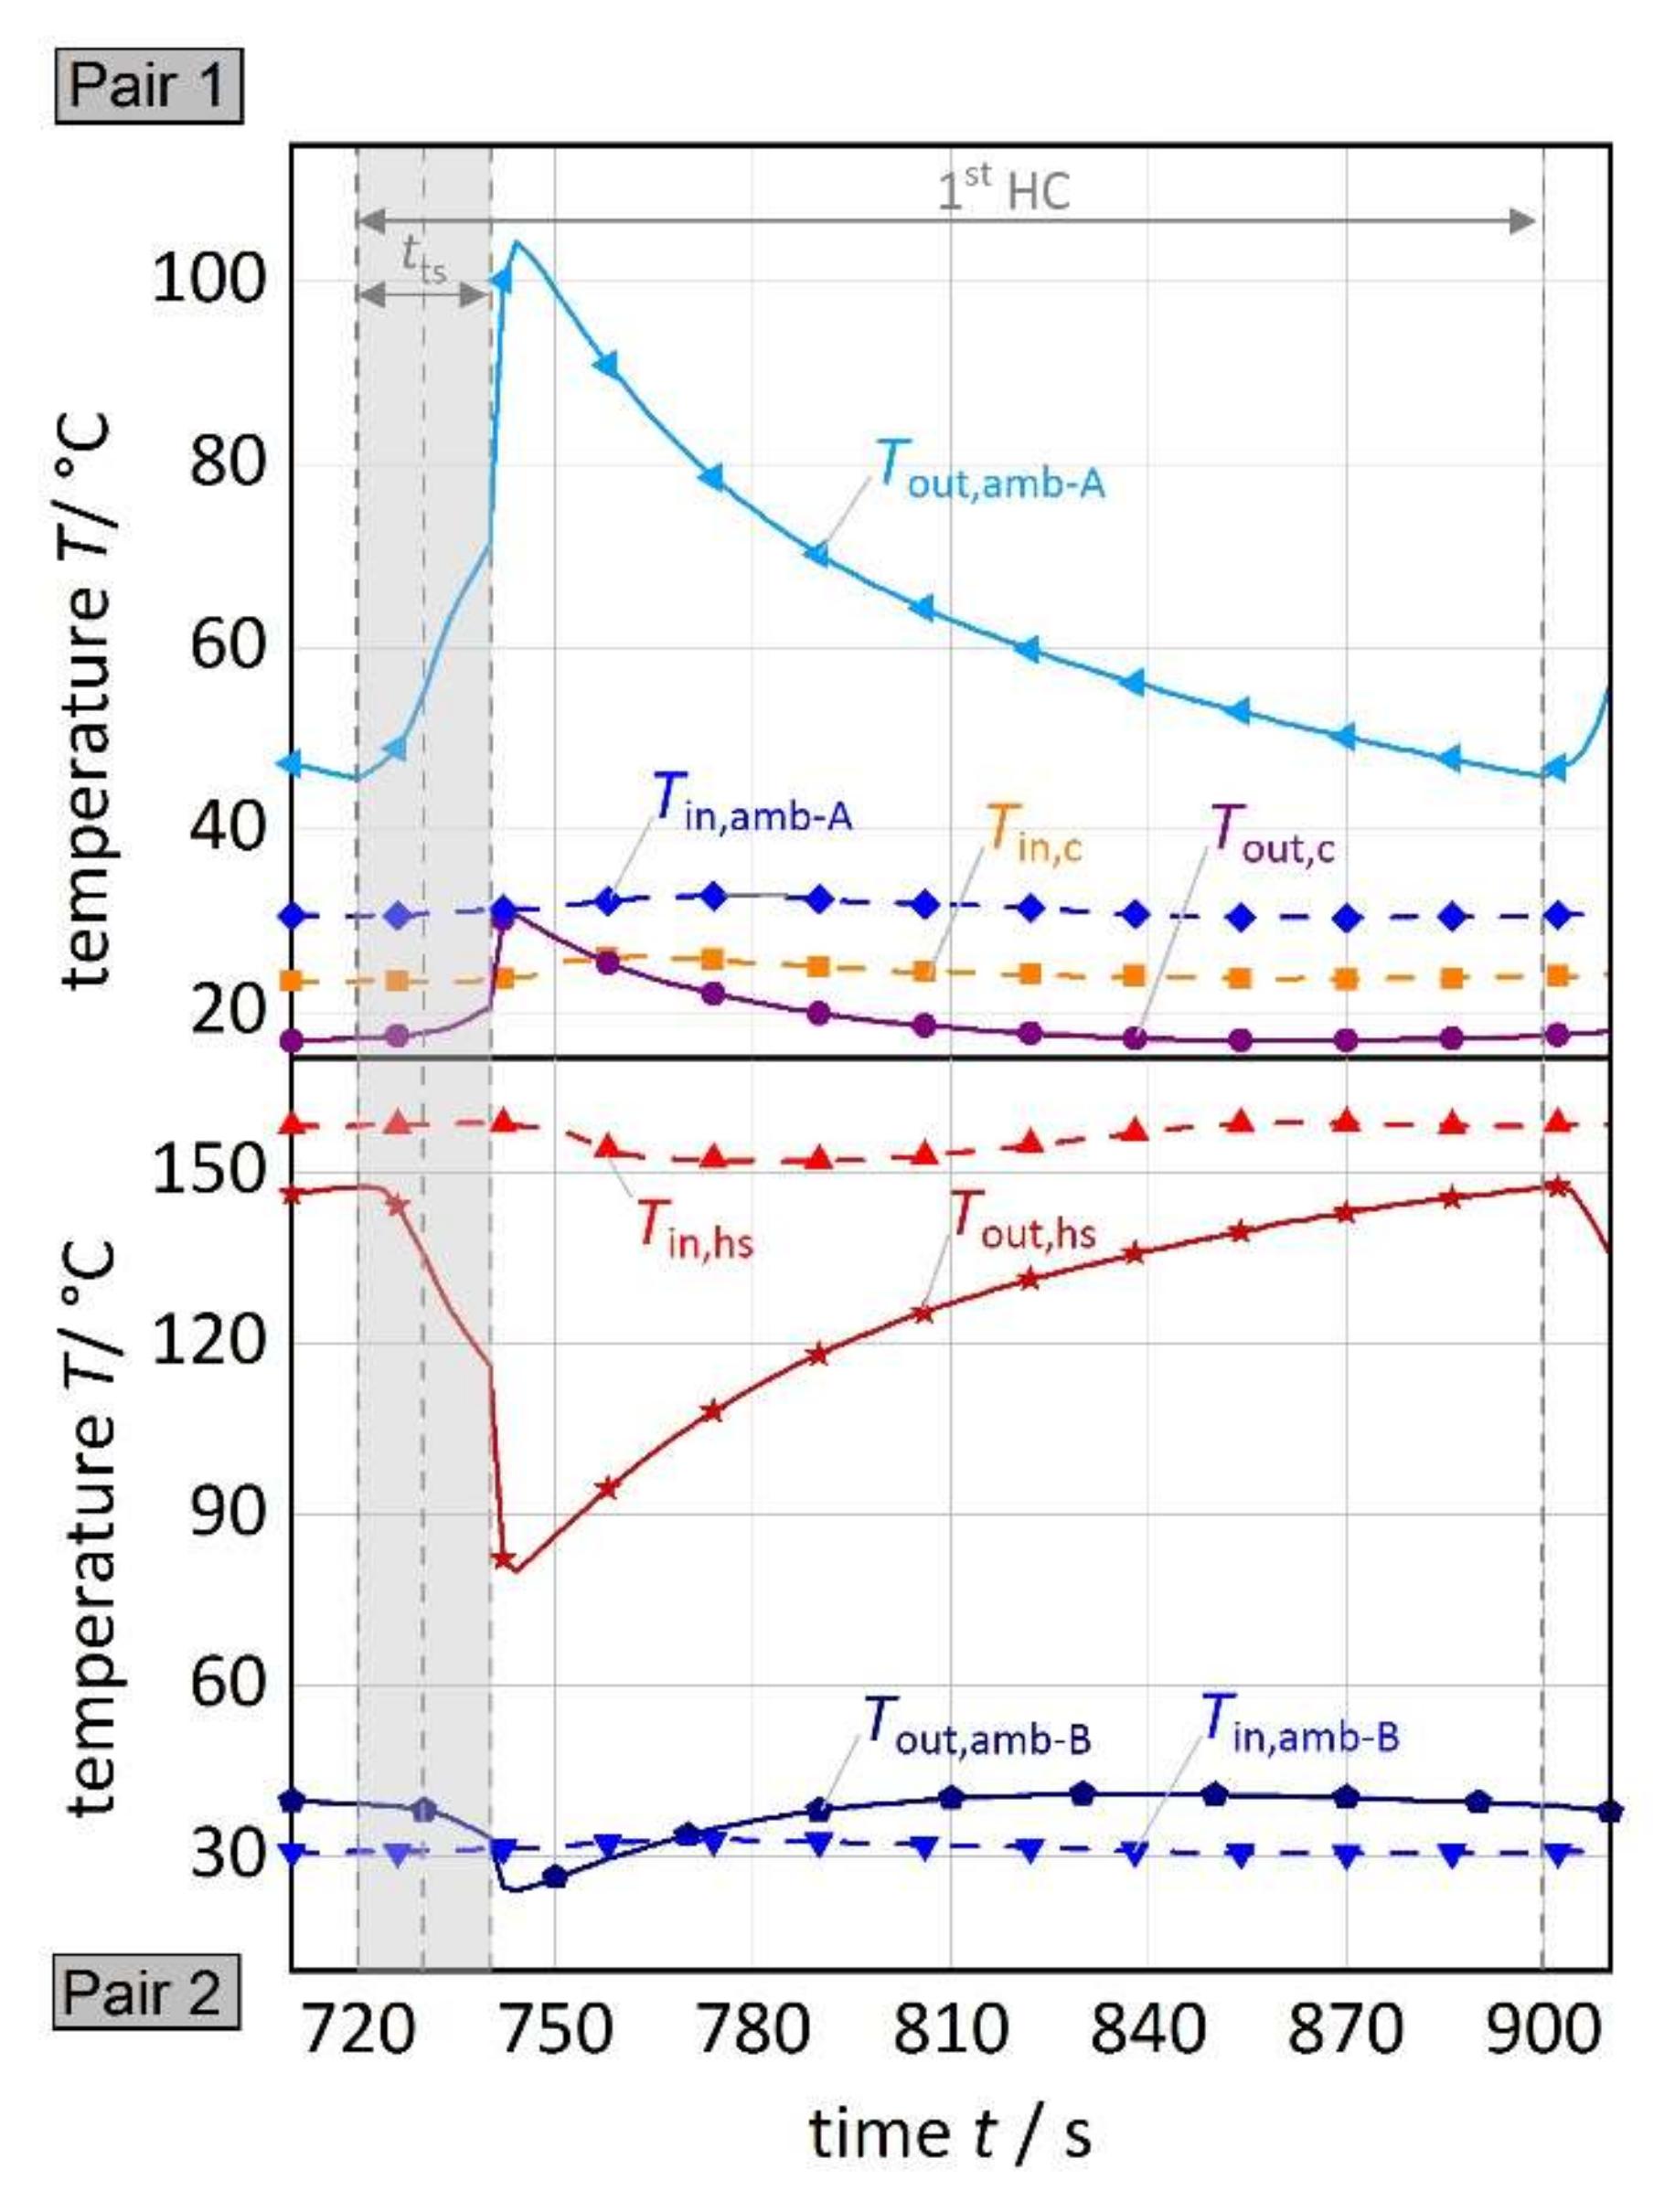
According to Figure 8, a cooling effect is generated in the cooling HTF loop direct after each point of switching (e.g., at ), although the operating temperature levels are changed. This can be explained by the detailed transient course of the HTF temperatures in Figure 10. (for the detailed assignment of the temperatures to the corresponding reactors it is referred to Figure 6). Due to the time-shifted valve switching, remaining cold HTF from the outlet of reactor B2 with an initial temperature of at flows into the cooling HTF loop. Therefore, the observed cooling effect is generated. After the time interval , the HTF outlet valves are switched. At this point, the outlet temperature of B2 has increased to as the thermal energy of the cold HTF loop is recovered and HTF on ambient temperature level enters at the inlet of the reactor. Meanwhile, the outlet temperature of reactor B1 (corresponds to during ) has decreased from 39.3 to 33.5 °C. As this heat is released to the ambient HTF loop and not to the cooling HTF loop in case without the implementation of the time-shifted valve switching, thermal losses in the cooling HTF are strongly reduced, which increases the resulting average cooling power.
In analogy, fluid exchange losses between the heat source HTF loop and the ambient HTF loop for the reactors A1 and A2 are reduced. A detailed evaluation of the optimum duration for a maximum cooling power of the present MHCS is evaluated in Section 3.2.
Phase 3: Remaining half-cycle (from to )
In the remaining HC, the actual processes to generate the cooling effect in the MHCS take place. Pair A1/B1 is producing cold, by absorption of H2 in A1 and desorption in B1, which results in a continuous decrease of . At the same time, pair A2/B2 is regenerating and an increase of can be observed. When the HC is switched at , the second HC is initiated and the previously described processes of phases 1–3 take place in reverse order for the MH pairs 1 and 2.
3.2. Sensitivity Study on Cooling Power
In order to analyze the influencing factors on the present MHCS, a sensitivity study has been performed for seven parameters with regard to the maximum average cooling power achieved. Next to the influence of the system boundary conditions, the three temperature levels, the cooling HTF rate and the HC time, the efficiency of the previously described measures, mass recovery and time-shifted valve switching are evaluated. Table 3 gives an overview of the varied operating conditions and the varied range. Starting from the conditions of the reference experiment, in the study only one parameter has been varied at a time. In order to compare the achieved cooling power for different operation conditions, not the temporal curves are given, but the resulting average cooling power values. The discussion of the single influencing factors is then extended by the discussion of optimal operating conditions for the present system followed by general recommendations for further development of such an MHCS.
3.2.1. Temperature of the Heat Source
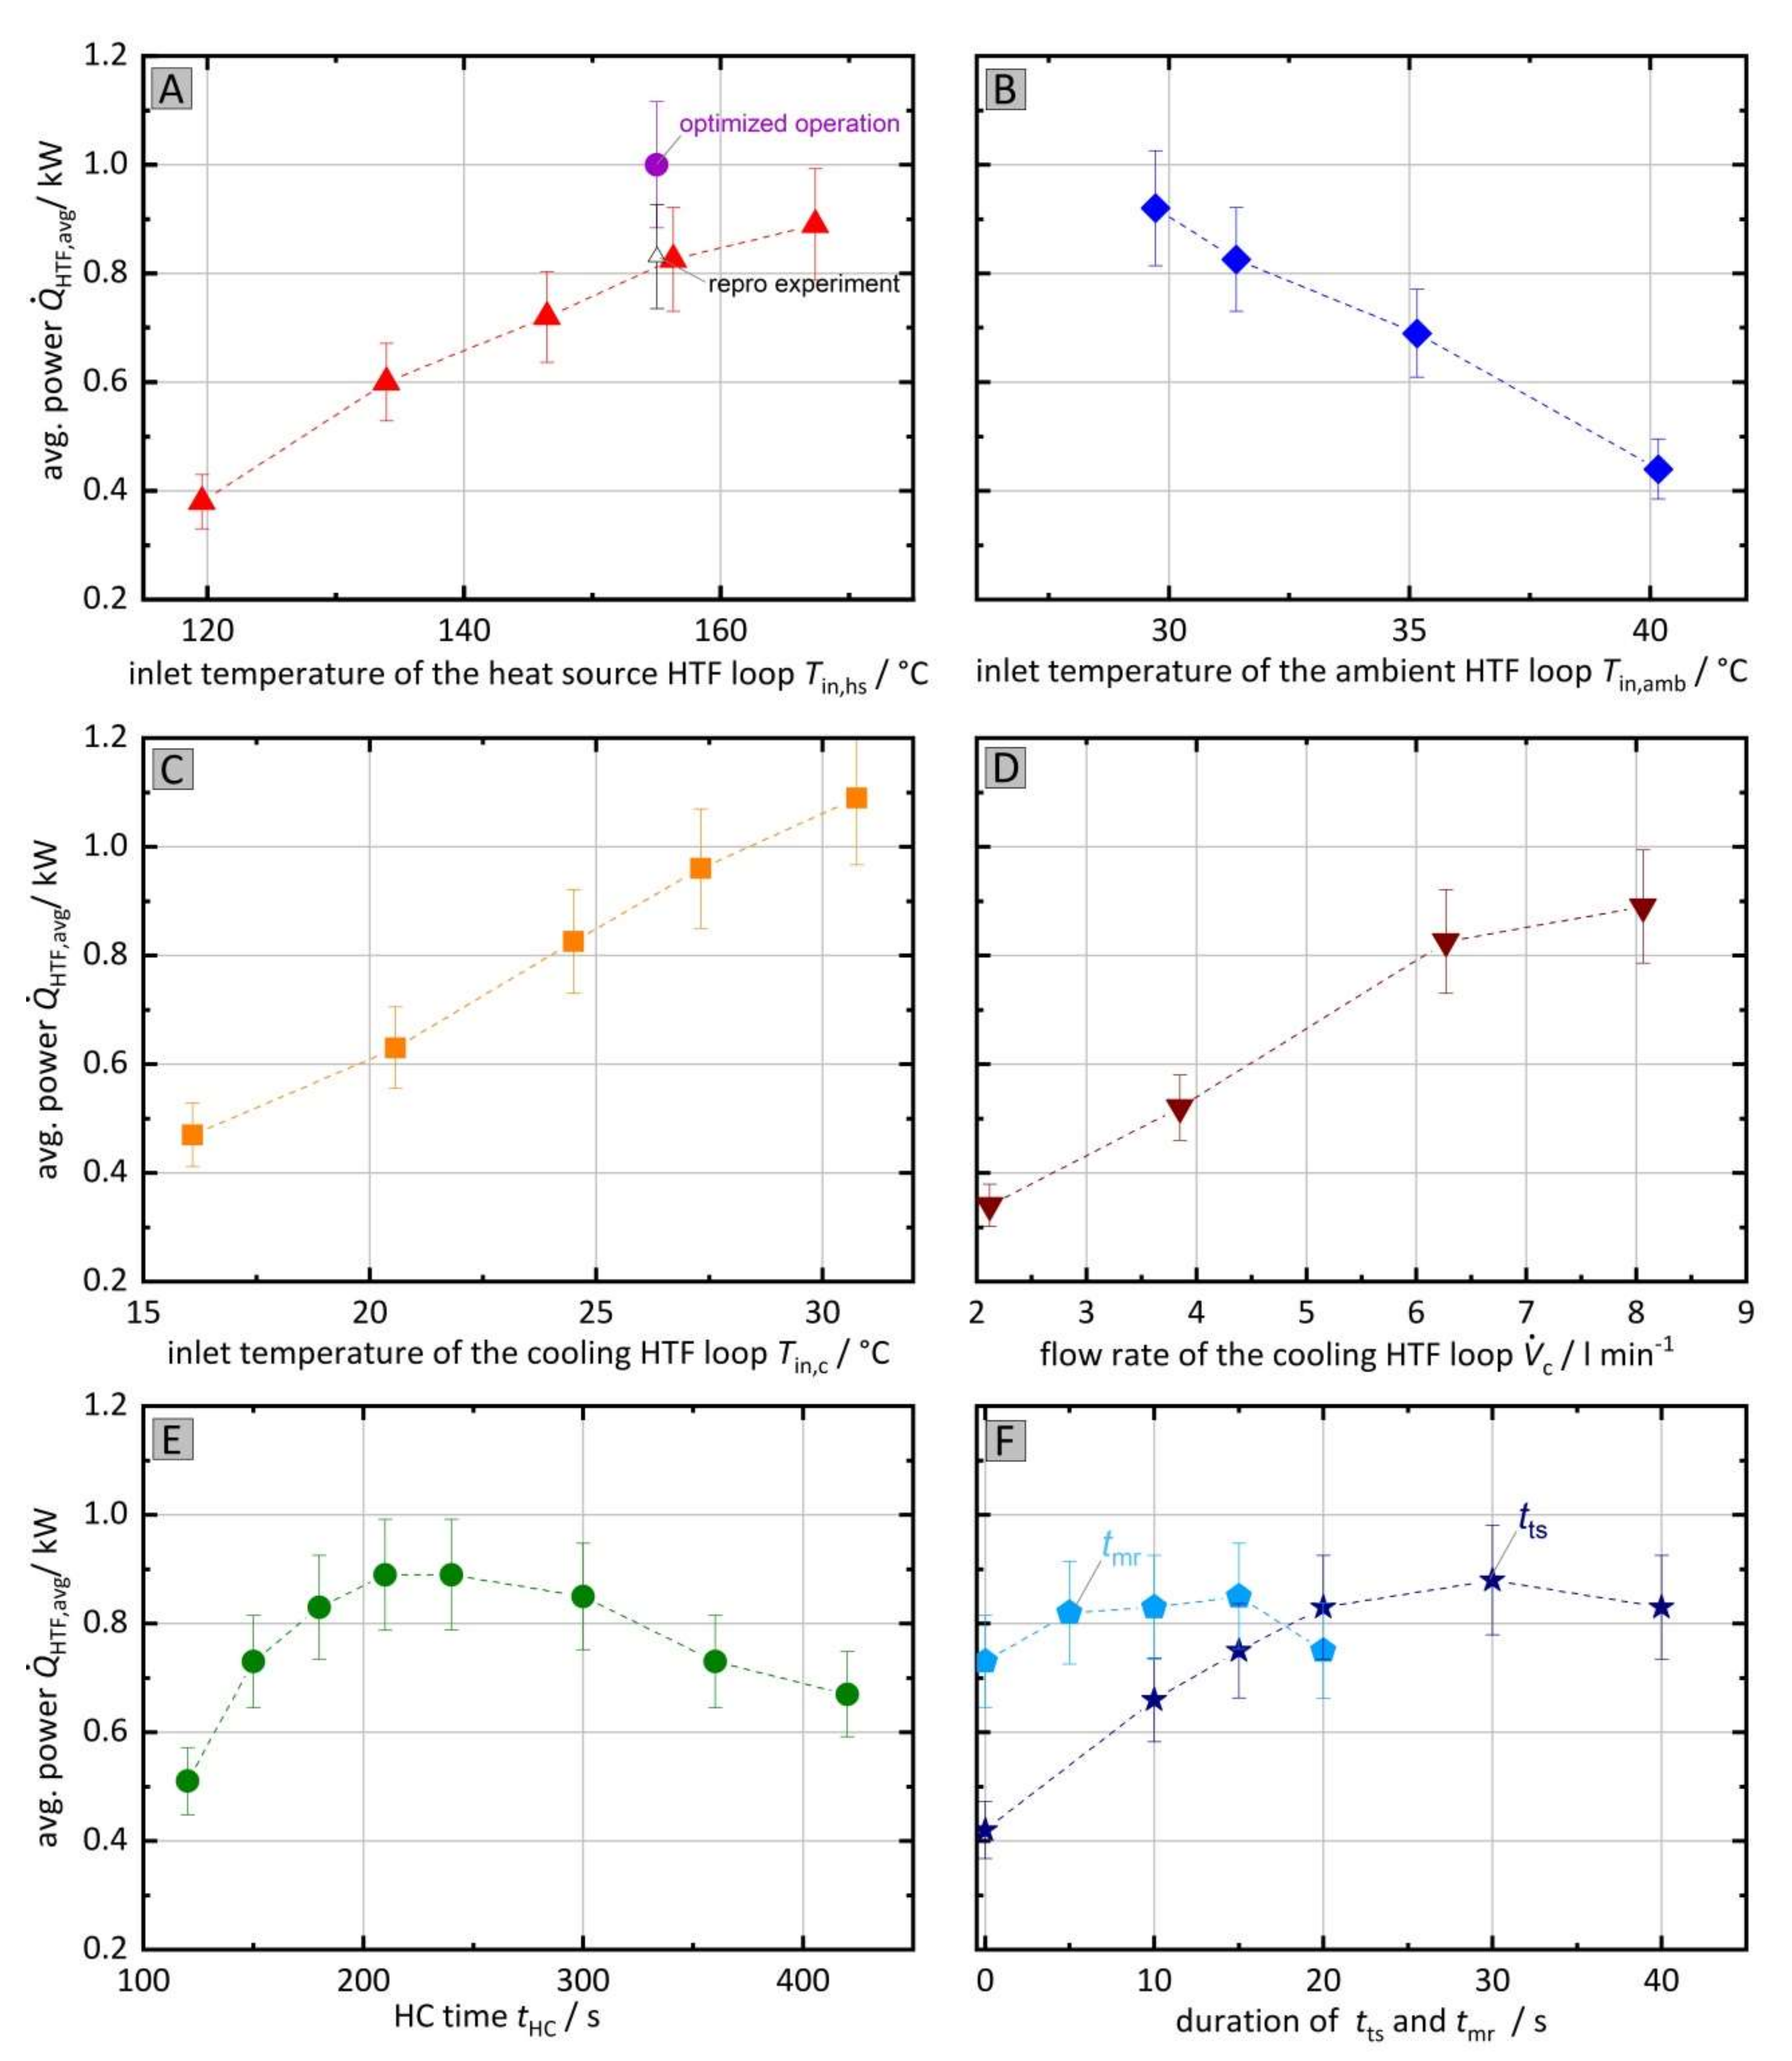
The influence of the heat source inlet temperature (regeneration temperature) is examined in the temperature range from 120 to 167 °C. As it can be seen in Figure 11A, to a large extent, the average system cooling power is increasing with rising heat source temperature, e.g., the system cooling power can be increased from 0.38 to 0.89 kW (+134%) by increasing the heat source inlet temperature from 120 to 167 °C. The reasons for the improved cooling power at higher heat source temperature are the improved conditions for the regeneration of the system and the increase of exchanged hydrogen capacity. The measurements indicate that the linear increase in the gradient of the cooling power is reduced for higher temperatures. This behavior is reasonable since at a heat source temperature of around 155 °C, the exchanged hydrogen capacity Δwmax reaches already a high amount of the total hydrogen capacity and a further increase to 167 °C only leads to an improvement of 8%. In contrast, below 120 °C, the system can be hardly regenerated leading to a small cooling power.
3.2.2. Ambient Temperature
The ambient temperature level varied between 29 to 40 °C and the effects on the cooling power are shown in Figure 11B. In the considered temperature range, an almost linear decrease with increasing ambient temperature can be observed from 0.92 to 0.44 kW (−52%). As the ambient temperature level has an influence on both, the regeneration HC as well as the cooling HC, the following effects overlap, yet, they all point in the same direction.
- For lower in the regeneration HC, the absorption process in reactor B proceeds at a lower pressure leading to an improved desorption in reactor A at . Therefore, Δwmax is increased during the following cooling HC.
- For lower in the cooling HC, the pressure level is lower as well, leading to improved thermodynamic conditions for desorption at . This, again, leads to an increase in Δwmax.
- For lower additionally, the thermal losses in the cooling HC are reduced due to a smaller temperature difference ΔT = Tamb-Tc of reactor B, when the HCs are switched. As a consequence, Δwmax can be better utilized for effective cold generation.
3.2.3. Cooling Temperature
Figure 11C shows the variation of the cooling inlet temperature in the range from 16 to 31 °C. Obviously, the cooling power grows linearly with a rising cooling temperature from 0.47 kW at 16 °C to 1.1 kW at 31 °C (+134%). First, the same effects as for the heat source temperature variation can be observed: with increasing cooling temperature, the amount of exchanged hydrogen capacity increases leading to a higher cooling power. Second, for the cooling HTF loop, the effect of thermal losses is also relevant. As the decreasing temperature difference between and reduces the thermal losses this effect is overlapping and further improving the cooling power. Finally, as 30 °C is very close to ambient temperature, in this case, the thermal losses are negligible. This temperature level, however, is obviously not reasonable for cooling in a vehicle interior.
3.2.4. Cooling HTF Flow Rate
The flow rate in the cooling HTF loop is measured by the mass flow controller FM and can be varied by changing the speed of the applied HTF pumps in the range of 2.1 to 8.1 10−3 m3 min−1. The maximum flow rate is here limited by the performance of the applied HTF gear type pumps and the allowed pressure drop of the integrated three-way HTF valves. Figure 11 D shows the effect of different cooling HTF mass flow rates on the cooling power. By increasing the flow rate from 2.1 to 6.3 10−3 m3 min−1, the cooling power rises from 0.34 to 0.83 kW (value of the reference experiment), which corresponds to an increase of around 144%. However, from 6.3 to 8.1 10−3 m3 min−1 the increase is only 6% more (0.83 to 0.88 kW). These results show that the system and the applied MH reactors are limited on convective heat transfer from the HTF to the MH bed at flow rates below 6.3 10−3 m3 min−1. This finding was expected, as similar observations have been shown in previous single reactor characterizations [25].
3.2.5. HC Time
Figure 11 E shows the effect of a variation of the HC time on the cooling power. Starting from the reference conditions for the HC time is varied from 120 to 420 s. In this case, it is obvious that there exists a maximum in the HC time, which is at 210 s with 0.89 kW for the present system. In general, one could expect that for low cycling times the highest cooling power can be achieved as . This is actually the case for HC times above the maximum of 210 s. However, for shorter cycling times this correlation is overcompensated by two effects: first, due to the previously mentioned heat transfer limitations and further mass transport limitations of the reactors [28], short cycle times lead to an incomplete reaction and therefore a smaller amount of hydrogen can be exchanged. Second, the short cycling times also require an increased number of switching events between the temperatures between and leading to an increased impact of thermal losses. Due to these overlapping effects, the maximum will vary for different operation conditions and heat transfer rates.
3.2.6. Operation Optimization
In the present MHCS, two measures to improve the cooling power are included (see Section 2.4). Figure 11F shows the effect of the duration of the time-shifted valve switching (violet) and the mass recovery (light blue) on the average cooling power.
The interval for the time-shifted valve switching varied from 0 to 40 s. The experiments show that for the present MHCS a duration of leads to a maximum average power of 0.88 kW. Without this measure (the interval is lowered to = 0 s) the cooling power would only reach a value of 0.42 kW (−52%). Furthermore, when the interval exceeds its optimum duration, the cooling power decreases as well. Thus, it is obvious that the effectiveness of avoiding fluid exchange losses depends on the chosen duration of time-shifted valve switching. If the interval is too short (in the range 0 to 10 s) just part of the fluid exchange losses are avoided and available cooling potential is wasted. For a too long interval, the thermal energy of the cold HTF loop is recovered, but at the same time, fresh ambient HTF that enters the reactor gets into the cooling HTF loop, which reduces the resulting average cooling power.
The mass recovery time interval varied from 0 to 20 s. The experiments show that compared to the experiment without implementation of the mass recovery phase, the cooling power can be increased by around 0.12 kW (+16%). This effect is already visual for very short of about 5 s, where values close to the maximum value of 0.85 kW for can be reached. In case the interval is increased above this value, the cooling power decreases again since the mass recovery process prevents the generation of cold (no hydrogen flow from the reactor B to the reactor A). Thus, a too long duration leads to a decreased average cooling power.
3.2.7. Evaluation of Cooling Power, Specific Cooling Power and Efficiency for Ooptimal Experimental Conditions
In order to find the global optimum for the operating conditions at the three reference temperature levels, the simple variations starting from the reference experiment would have to be extended to a full matrix. However, as it is not expected that the general trends for each parameter will significantly vary, the following optimized conditions have been defined for the present MHCS: the flow rate in the cooling HTF loop is min−1, while the HCs are switched after a fixed duration of 210 s. Time-shifted valve switching and mass recovery are set to , and , respectively. The inlet temperatures of the heat source, ambient and cooling HTF loop are adjusted corresponding to the reference experiment before.
As indicated in Figure 11A, a maximum cooling power of 1 kW was measured, which is an increase of 20% compared to the reference experiment. When referring to the cold generating reactor B2, a specific cooling power of 585 W can be calculated for these optimized conditions. This value is in the range of by far the best specific cooling powers reported for a thermally driven metal hydride based AC system by Linder et al. [12] with 640 W . Regarding the weight of all four MH materials, the value is reduced to 128 W . For the specific cooling power of the total module, the mass of auxiliary components, such as valves and piping, has to be taken into account next to the mass of the reactors. Since these auxiliary components are not completely optimized in the present MHCS, the specific cooling power of the total system is not applied here.
As the MHCS is a thermally driven AC system that might not always be driven by waste heat (e.g., in case of the diesel-powered auxiliary heating system), the achieved coefficient of performance of the present module is also important. As the mass flow rate in the heat source HTF loop was not measured at the applied high temperatures, the mass of consumed diesel fuel by the burner (heat source) was determined using a scale. Based on these values, an overall COP in the order of 0.15–0.2 was estimated for reference conditions, which is lower than originally expected for the system. As the LaNi4.75Al0.25 material showed a stronger slope in its PCIs with transformed fraction than expected from literature data, the required temperature level for regeneration of 155 °C was much higher than estimated in the layout with 120 °C. Therefore, the thermal losses due to the switching between the two temperature levels increased and consequently the COP was reduced.
3.3. Recommendations for System Improvement
It has been shown that the present MHCS can compete with state of the art MHCSs regarding specific thermal power output, while it is designed as a compact, modular and scalable “black-box” system. As the specific cooling power as well as the efficiency of the system indicated by the COP still require some improvement before an MHCS can be integrated in a real application, the following suggestions can be deduced from the present work.
As the temperature difference between the two temperature levels of the regeneration HC and the cooling HC have a strong influence on the overall performance, special care needs to be taken to avoid the thermal losses or to diminish its impact. Besides the presented time-shifted valve switching strategy this implies a reduction of HTF mass inside the reactors as well as a reduction of the passive reactor mass, thus reducing the ratio to values close to 1. One suggestion addressing both points can be the design of asymmetric plate reactors, where the channel thickness for the HTF is smaller than the one for the MH.
As mentioned before, for high specific cooling powers, the HC time should also be as short as possible while exchanging the maximum amount of hydrogen Δwmax. The intrinsic reaction rate of the used materials would, at least, allow doubling of the specific cooling power. However, this again requires an optimization of the reactors in terms of heat and mass transfer as suggested in [28], considering not only the reactor design itself but also the flow characteristic of the entire system.
Finally, besides the design of the four reactors and the operation strategy, the module itself can also be further improved. From Figure 5 it is obvious that there is still some free space, thus a further optimized packaging can reduce the system volume by around 30%. Additionally, the development of improved components like valves and the usage of flexible tubes instead of stainless steel pipes will reduce the system weight by approx. 33%.
4. Conclusions
A compact and modular metal hydride cooling system (MHCS) has been designed and set up for application as a thermally driven air conditioning system in mobile applications.
Considering a heat source at 120–170 °C and a cooling temperature of 10–20 °C, the materials LaNi4.75Al0.25 and Hydralloy® C5 (Ti0.95Zr0.05Mn1.46V0.41Fe0.09Cr0.05) have been selected. The four reactors based on a plate heat exchanger design have been filled with 1.71/1.74 kg and 2.24/2.14 kg of the two materials, respectively. The reactors show very small channels for the metal hydride with an average thickness of around 1.5 × 10⁻³ m and the ratio reaches values between 2.37 and 3.1.
The reactors have been integrated into a “black-box” module with a size of 8 10−2 m3 (reactor and MH volume < 20 10−3 m3), where three different heat transfer loops can be connected to. The control of the system is fully automatic and two optimization strategies have been implemented: mass recovery and time-shifted valve switching.
A sensitivity study is performed in seven parameters. Regarding the cooling power, the influence of the temperature levels is mainly dominated by thermodynamic constraints and thermal losses. The cooling power more than doubles when the heat source temperature is increased from 120 to 167 °C, and when the cooling temperature is increased from 16 to 31 °C. An increase in the ambient temperature from 29 to 40 °C shows the inverse effect. The variation in the flow rate of the cooling HTF showed a strong limitation for values below 6.3 × 10⁻³ m3 min−1. For the present setup, the half-cycle time shows an optimum with 0.89 kW at 210 s indicating the best relation between the exchanged mass of hydrogen and thermal losses due to the switching of the HCs. The optima for the two optimization strategies are determined to 5 s for mass recovery and 30 s for time-shifted valve switching, respectively. Thereby, the first has a small impact of +0.12 kW (+16%) and the latter a very strong impact of more than +0.4 kW (+110%) compared to the case without its implementation. An optimized set of parameters has been deduced for the present system, showing a thermal cooling power output of 1 kW, which refers to 585 W based on the mass of one cold generating MH.
Author Contributions
Conceptualization, C.W., M.L. and I.B.; software, M.D., formal analysis, C.W. and M.D.; investigation, C.W., M.D. and I.B.; writing—original draft preparation, C.W. and I.B.; writing—review and editing, M.D. and M.L.; visualization, C.W. and M.D.; supervision, M.L. and I.B.; project administration, M.L. and I.B.; All authors have read and agreed to the published version of the manuscript.
Funding
This research received no external funding.
Acknowledgments
The authors thank Christian Brack (Institute of Engineering Thermodynamics, German Aerospace Center (DLR), Stuttgart, Germany) for his support while assembling the MHCS and running the experiments.
Conflicts of Interest
The authors declare no conflict of interest.
Abbreviations
| AC | Air-conditioning |
| C | Connection |
| COP | Coefficient of Performance |
| FM | Flowmeter |
| FS | Full scale |
| FM | Flowmeter |
| HC | Half-cycle |
| HTF | Heat transfer fluid |
| HV | Hand valve |
| M | Metal |
| MH | Metal hydride |
| MHCS | Metal hydride cooling system |
| OPV | Overpressure valve |
| P | Pump |
| PS | Pressure sensor |
| repro | Reproduced experiment |
| Rd | Reading |
| TB | Thermostatic bath |
| V | Valve |
Nomenclature
| b | Reactor width, m |
| Reactor height, m | |
| Mass ratio, - | |
| Reactor length, m | |
| Molar weight | |
| Number, - | |
| Thermal Energy, J | |
| Entropy of reaction, J mol−1K−1 | |
Greek Letters
Subscripts
| abs | Absorption |
| amb | Ambient |
| avg | Average |
| c | Cooling |
| des | Desorption |
| eq | Equilibrium |
| H2 | Hydrogen |
| hs | Heat source |
| in | Inlet |
| max | Maximum |
| min | Minimum |
| mr | Mass recovery |
Appendix A
Uncertainty Analysis
The systematical uncertainty in the calculated has been determined assuming independent and random errors in the corresponding parameters according to:
The uncertainty for the HTF flow is determined by the setup and reported to 2% of reading (RD). The uncertainty in the temperature difference has been calibrated to . Furthermore, for the uncertainty in the density of Huber SilOil M40.165 a value of has been assumed for the values reported in the data sheet (0 °C: 0.960 kg m−3; 25 °C: 0.938 kg m−3; 40 °C: 0.925 kg m−3). The temperature dependence of the heat capacity has been determined by experiments to with . The resulting error bars are indicated in Figure 11. For instance, for the reference experiment, a value of 11.5% is calculated.

Table A1.
Equipment of the MHCS and the testing infrastructure.
| Description | Type |
|---|---|
| Hydrogen section | |
| Electromagnetic valves VH2,1–2 | Bürkert 0355-C |
| Hand valve HV1–4 | Swagelok SS-6P4T-MM-BK |
| Overpressure valve OPV1-2 | Swagelok SS-6R3A-MM |
| Pressure sensors PS1-2 | Wagner P-3278 0.5% FS) |
| HTF infrastructure section | |
| Electromagnetic three-valves VHTF,1–8 | Bürkert 0355-C |
| Impeller HTF flow meter FM | Meister DHGA-10 (A: 2% v.Rd) |
| Thermocouples | 1.5 K, temperature difference calibrated) |
| Control unit and data acquisition | |
| Control unit | Arduino Mega 2560 microcontroller |
| Data acquisition | Agilent 34970A |
| Testing infrastructure | |
| Auxiliary heating system | Webasto Thermo Pro 90, 24 V |
| HTF gear type pumps P1-P3 | Kracht KF6 RF 3 |
| Liquid-to-liquid heat exchanger | VAU VM 15/20 |
| Thermostatic bath TBc | Lauda Proline P8 |
| Thermostatic bath TBamb | Lauda Proline RP890 |
References
- Kambly, K.; Bradley, T. Geographical and temporal differences in electric vehicle range due to cabin conditioning energy consumption. J. Power Sources 2015, 275, 468–475. [Google Scholar] [CrossRef]
- Zhai, X.; Wang, R.; Wu, J.; Dai, Y.; Ma, Q. Design and performance of a solar-powered air-conditioning system in a green building. Appl. Energy 2008, 85, 297–311. [Google Scholar] [CrossRef]
- Tso, C.; Chan, K.C.; Chao, C.; Wu, C. Experimental performance analysis on an adsorption cooling system using zeolite 13X/CaCl2 adsorbent with various operation sequences. Int. J. Heat Mass Transf. 2015, 85, 343–355. [Google Scholar] [CrossRef]
- Sharafian, A.; Mehr, S.M.N.; Thimmaiah, P.C.; Huttema, W.; Bahrami, M. Effects of adsorbent mass and number of adsorber beds on the performance of a waste heat-driven adsorption cooling system for vehicle air conditioning applications. Energy 2016, 112, 481–493. [Google Scholar] [CrossRef]
- Palomba, V.; Dawoud, B.; Sapienza, A.; Vasta, S.; Frazzica, A. On the impact of different management strategies on the performance of a two-bed activated carbon/ethanol refrigerator: An experimental study. Energy Convers. Manag. 2017, 142, 322–333. [Google Scholar] [CrossRef]
- Regulation (EU) No 517/2014 of the European Parliament and of the Council of 16 April 2014 on Fluorinated Greenhouse Gases and Repealing Regulation (EC) No 842/2006 2014; European Parliament: Brussels, Belgium.
- Von Colbe, J.B.; Ares, J.-R.; Barale, J.; Baricco, M.; Buckley, C.; Capurso, G.; Gallandat, N.; Grant, D.M.; Guzik, M.N.; Jacob, I.; et al. Application of hydrides in hydrogen storage and compression: Achievements, outlook and perspectives. Int. J. Hydrog. Energy 2019, 44, 7780–7808. [Google Scholar] [CrossRef]
- Lototskyy, M.V.; Yartys, V.A.; Pollet, B.G.; Bowman, R. Metal hydride hydrogen compressors: A review. Int. J. Hydrog. Energy 2014, 39, 5818–5851. [Google Scholar] [CrossRef] [Green Version]
- Muthukumar, P.; Groll, M. Metal hydride based heating and cooling systems: A review. Int. J. Hydrog. Energy 2010, 35, 3817–3831. [Google Scholar] [CrossRef]
- Gruen, D.; Mendelsohn, M.; Sheft, I. Metal hydrides as chemical heat pumps. Sol. Energy 1978, 21, 153–156. [Google Scholar] [CrossRef]
- Ron, M. A hydrogen heat pump as a bus air conditioner. J. Less Common Met. 1984, 104, 259–278. [Google Scholar] [CrossRef]
- Linder, M. Automotive Cooling Systems based on Metal Hydrides. Ph.D. Thesis, University of Stuttgart, Stuttgart, Germany, 2010. [Google Scholar]
- Bhuiya, M.H.; Kumar, A.; Kim, K.J. Metal hydrides in engineering systems, processes, and devices: A review of non-storage applications. Int. J. Hydrog. Energy 2015, 40, 2231–2247. [Google Scholar] [CrossRef] [Green Version]
- Satheesh, A.; Muthukumar, P. Performance investigation of double-stage metal hydride based heat pump. Appl. Therm. Eng. 2010, 30, 2698–2707. [Google Scholar] [CrossRef]
- Willers, E.; Groll, M. The two-stage metal hydride heat transformer. Int. J. Hydrog. Energy 1999, 24, 269–276. [Google Scholar] [CrossRef]
- Muthukumar, P.; Patil, M.S.; Raju, N.N.; Imran, M. Parametric investigations on compressor-driven metal hydride based cooling system. Appl. Therm. Eng. 2016, 97, 87–99. [Google Scholar] [CrossRef]
- Park, J.-G.; Han, S.-C.; Jang, H.-Y.; Lee, S.-M. The development of compressor-driven metal hydride heat pump (CDMHHP) system as an air conditioner. Int. J. Hydrog. Energy 2002, 27, 941–944. [Google Scholar] [CrossRef]
- Linder, M.; Kulenovic, R. An energy-efficient air-conditioning system for hydrogen driven cars. Int. J. Hydrog. Energy 2011, 36, 3215–3221. [Google Scholar] [CrossRef]
- Herbrig, K.; Röntzsch, L.; Pohlmann, C.; Weissgaerber, T.; Kieback, B. Hydrogen storage systems based on hydride–graphite composites: Computer simulation and experimental validation. Int. J. Hydrog. Energy 2013, 38, 7026–7036. [Google Scholar] [CrossRef]
- Wanner, M.; Hoffmann, G.; Groll, M. Thermodynamic and Structural Changes of an Ab2-Laves-Phase Alloy (Ti0.98 Zr0.02 V0.43 Fe0.06 Cr0.05 Mn1.52) During Extended Thermal Cycling. Hydrog. Power Theor. Eng. Solut. 1998, 9, 257–262. [Google Scholar] [CrossRef]
- Friedlmeier, G.; Manthey, A.; Wanner, M.; Groll, M. Cyclic stability of various application-relevant metal hydrides. J. Alloy. Compd. 1995, 231, 880–887. [Google Scholar] [CrossRef]
- Kölbig, M.; Bürger, I.; Linder, M. Characterization of metal hydrides for thermal applications in vehicles below 0 °C. Int. J. Hydrog. Energy 2019, 44, 4878–4888. [Google Scholar] [CrossRef]
- Skripnyuk, V.; Ron, M. Hydrogen desorption kinetics in intermetallic compounds C2, C5 and C5 with Laves phase structure. Int. J. Hydrog. Energy 2003, 28, 303–309. [Google Scholar] [CrossRef]
- Yang, F.; Wang, G.; Zhang, Z.; Meng, X.; Rudolph, V. Design of the metal hydride reactors—A review on the key technical issues. Int. J. Hydrog. Energy 2010, 35, 3832–3840. [Google Scholar] [CrossRef]
- Weckerle, C.; Bürger, I.; Linder, M. Novel reactor design for metal hydride cooling systems. Int. J. Hydrog. Energy 2017, 42, 8063–8074. [Google Scholar] [CrossRef]
- Weckerle, C.; Bürger, I.; Linder, M. Experimental demonstration of a metal hydride air-conditioning system for fuel cell vehicles—Functional demonstration. Appl. Energy 2020, 259, 114187. [Google Scholar] [CrossRef]
- Weckerle, C.; Nasri, M.; Hegner, R.; Linder, M.; Bürger, I. A metal hydride air-conditioning system for fuel cell vehicles—Performance investigations. Appl. Energy 2019, 256, 113957. [Google Scholar] [CrossRef]
- Weckerle, C.; Bürger, I.; Linder, M. Numerical optimization of a plate reactor for a metal hydride open cooling system. Int. J. Hydrog. Energy 2019, 44, 16862–16876. [Google Scholar] [CrossRef]
- Li, T.; Wang, R.; Li, H. Progress in the development of solid–gas sorption refrigeration thermodynamic cycle driven by low-grade thermal energy. Prog. Energy Combust. Sci. 2014, 40, 1–58. [Google Scholar] [CrossRef]
- Cot-Gores, J.; Castell, A.; Cabeza, L.F. Thermochemical energy storage and conversion: A-state-of-the-art review of the experimental research under practical conditions. Renew. Sustain. Energy Rev. 2012, 16, 5207–5224. [Google Scholar] [CrossRef]
Figure 1.
Schematic illustration (left) and van’t Hoff plot (right) of thermally driven closed metal hydride cooling systems (MHCSs).
Figure 1.
Schematic illustration (left) and van’t Hoff plot (right) of thermally driven closed metal hydride cooling systems (MHCSs).

Figure 2.
Left: Van’t-Hoff plot of Hydralloy® C5 [19] and LaNi4.75Al0.25 (own data) for various hydrogen capacities. The operation is indicated by the grey hydrogen arrows. Right: material properties for 0.5.
Figure 2.
Left: Van’t-Hoff plot of Hydralloy® C5 [19] and LaNi4.75Al0.25 (own data) for various hydrogen capacities. The operation is indicated by the grey hydrogen arrows. Right: material properties for 0.5.

Figure 3.
Design of the realized plate reactor. Right: cross-sectional view.

Figure 4.
Schematic flow diagram of the realized modular MHCS.

Figure 5.
Picture of the realized modular MHCS (left) and schematic flow diagram of the testing infrastructure (right).
Figure 5.
Picture of the realized modular MHCS (left) and schematic flow diagram of the testing infrastructure (right).

Figure 6.
Illustration of the states of operation of the realized MHCS for the 1st HC.

Figure 7.
Transient course of the pressures of reactor pairs 1 and 2 for reference conditions.

Figure 8.
Top: transient course of the inlet and outlet temperatures of the cooling HTF loop. Bottom: transient course of the resulting cooling power.
Figure 8.
Top: transient course of the inlet and outlet temperatures of the cooling HTF loop. Bottom: transient course of the resulting cooling power.

Figure 9.
Transient course of the pressures for an exemplary 1st HC of the reference experiment between 720 and 900 s.
Figure 9.
Transient course of the pressures for an exemplary 1st HC of the reference experiment between 720 and 900 s.

Figure 10.
Top: transient course of the inlet and outlet temperatures of the ambient HTF loop and cooling HTF loop for reactor pair 1 for an exemplary 1st HC of the reference experiment between 720 and 900 s. Bottom: transient course of the inlet and outlet temperatures of the heat source HTF loop and ambient HTF loop for reactor pair 2 during the 1st HC.

Figure 11.
Average cooling power with error bars for varied operating conditions. A: variation of the inlet temperature of the heat source HTF loop, B: variation of the inlet temperature of the ambient HTF loop, C: variation of the inlet temperature of the cooling HTF loop, D: variation of the flow rate of the cooling HTF loop, E: variation of the HC time, F: variation of the duration of the mass recovery and time-shifted valve switching.

Table 1.
Characteristics of the plate reactors.
| Description | Value |
|---|---|
| Average channel thickness | 1.5 × 10⁻³ m |
| Empty reactor mass | 5.3 kg (without connections) |
| Free MH volume | 1.03 × 10⁻³ m3 |
| Mass ratio of reactor A1 and A2 | |
| Mass ratio of reactor B1 and B2 | |
| Max. permitted pressure | 30 bar |
| Max. permitted temperature | 195 °C |
| MH mass of reactor A1 and A2 | |
| MH mass of reactor B1 and B2 | |
| Number of HTF channels | |
| Number of MH channels | |
| Number of separating steel plates | |
| Reactor dimensions | 0.308 m × 0.072 m × 0.158 m |
| Reactor volume | 3.5 × 10⁻³ m3 |
Table 2.
States of operation and HTF/H2 valve positions.
| Reactor | A1 | B1 | A2 | B2 | ||||||||
|---|---|---|---|---|---|---|---|---|---|---|---|---|
| Operation Mode | 1st HC: Cooling HC 2nd HC: Regeneration HC | 1st HC: Regeneration HC 2nd HC: Cooling HC | ||||||||||
| HTF Valve Position | ||||||||||||
| Valve | 1st HC | 2nd HC | Valve | 1st HC | 2nd HC | Valve | 1st HC | 2nd HC | Valve | 1st HC | 2nd HC | |
| Phase 1 and Phase 2 | VHTF,3 | b-c | a-c | VHTF,1 | b-c | a-c | VHTF,4 | a-c | b-c | VHTF,2 | a-c | b-c |
| VHTF,7 | a-b | a-c | VHTF,5 | a-c | a-b | VHTF,8 | a-c | a-b | VHTF,6 | a-b | a-c | |
| Phase 3 | VHTF,3 | b-c | a-c | VHTF,1 | b-c | a-c | VHTF,4 | a-c | b-c | VHTF,2 | a-c | b-c |
| VHTF,7 | a-c | a-b | VHTF,5 | a-b | a-c | VHTF,8 | a-b | a-c | VHTF,6 | a-c | a-b | |
| H2 Valve Position | ||||||||||||
| Valve | 1st HC (H2 Flow) | 2nd HC (H2 Flow) | Valve | 1st HC (H2 Flow) | 2nd HC (H2 Flow) | |||||||
| Phase 1 | VH2,mr | Open (A1 A2) | Open (A2 A1) | VH2,mr | Open (A1 A2) | Open (A2 A1) | ||||||
| VH2,1 | closed | closed | VH2,1 | closed | closed | |||||||
| Phase 2 and Phase 3 | VH2,mr | closed | closed | VH2,mr | closed | closed | ||||||
| VH2,1 | Open (B1 A1) | Open (A1 B1) | VH2,1 | Open (A2 B2) | Open (B2 A2) | |||||||
Table 3.
Overview of varied operating conditions.
| Parameter | Symbol | Reference Value | Range |
|---|---|---|---|
| Inlet temperature of the heat source HTF loop | 156.3 °C | 120–167 °C | |
| Inlet temperature of the ambient HTF loop | 31.4 °C | 29–40 °C | |
| Inlet temperature of the cooling HTF loop | 24.5 °C | 16–31 °C | |
| Volume flow of the cooling HTF loop | 6.3 × 10⁻³ m3 min−1 | 2.1–8.1 × 10⁻³ m3 min−1 | |
| Duration of the HC | 180 s | 120–420 s | |
| Duration of the time-shifted switching | 20 s | 0–40 s | |
| Duration of the mass recovery | 10 s | 0–20 s |
© 2020 by the authors. Licensee MDPI, Basel, Switzerland. This article is an open access article distributed under the terms and conditions of the Creative Commons Attribution (CC BY) license (http://creativecommons.org/licenses/by/4.0/).
Share and Cite
MDPI and ACS Style
Weckerle, C.; Dörr, M.; Linder, M.; Bürger, I. A Compact Thermally Driven Cooling System Based on Metal Hydrides. Energies 2020, 13, 2482. https://0-doi-org.brum.beds.ac.uk/10.3390/en13102482
AMA Style
Weckerle C, Dörr M, Linder M, Bürger I. A Compact Thermally Driven Cooling System Based on Metal Hydrides. Energies. 2020; 13(10):2482. https://0-doi-org.brum.beds.ac.uk/10.3390/en13102482
Chicago/Turabian StyleWeckerle, Christoph, Marius Dörr, Marc Linder, and Inga Bürger. 2020. "A Compact Thermally Driven Cooling System Based on Metal Hydrides" Energies 13, no. 10: 2482. https://0-doi-org.brum.beds.ac.uk/10.3390/en13102482
Note that from the first issue of 2016, this journal uses article numbers instead of page numbers. See further details here.