Article

Impact of MPL on Temperature Distribution in Single Polymer Electrolyte Fuel Cell with Various Thicknesses of Polymer Electrolyte Membrane

1
Division of Mechanical Engineering, Graduate School of Engineering, Mie University, 1577 Kurimamachiya-cho, Tsu, Mie 514-8507, Japan
2
School of Mechanical Engineering, the University of Adelaide, Adelaide 5005, SA, Australia
*
Author to whom correspondence should be addressed.
Submission received: 7 April 2020 / Revised: 7 May 2020 / Accepted: 12 May 2020 / Published: 15 May 2020
(This article belongs to the Special Issue Polymer Electrolyte Membrane Fuel Cell Systems)

Abstract

:
The impact of micro porous layer (MPL) with various thicknesses of polymer electrolyte membrane (PEM) on heat and mass transfer characteristics, as well as power generation performance of Polymer Electrolyte Fuel Cell (PEFC), is investigated. The in-plane temperature distribution on cathode separator back is also measured by thermocamera. It has been found that the power generation performance is improved by the addition of MPL, especially at higher current density condition irrespective of initial temperature of cell (Tini) and relative humidity condition. However, the improvement is not obvious when the thin PEM (Nafion NRE-211; thickness of 25 μm) is used. The increase in temperature from inlet to outlet without MPL is large compared to that with MPL when using thick PEM, while the difference between without MPL and with MPL is small when using thin PEM. It has been confirmed that the addition of MPL is effective for the improvement of power generation performance of single PEFC operated at higher temperatures than normal. However, the in-plane temperature distribution with MPL is not even.

1. Introduction

We can know from the NEDO roadmap 2017 in Japan [1] that polymer electrolyte fuel cell (PEFC) is required to be operated at around 90 °C for stationary applications. However, the PEFC having Nafion membrane is operated at the temperature ranging from 60 °C to 80 °C commonly [2,3]. If PEFC is operated at higher temperature than normal, the following advantages can be obtained: (1) enhancement in electrochemical kinetics in catalyst layer at anode and cathode; (2) reduction of the cooling equipment for vehicle use; (3) progress in the durability of CO which can provide the usage of lower quality reformed H2 [4]. However, we are afraid of some problems e.g., (1) degradation of polymer electrolyte membrane (PEM); (2) catalyst elution; (3) non-uniform distributions of gas flow, pressure, temperature, voltage and current in PEFC. We should have this resolved before the PEFC operated at higher temperature is commercialized [5]. Consequently, we should clarify the heat and mass transfer mechanisms in the PEFC to enhance the power generation performance and stability.
The present study pays attention to the analysis of in-plane temperature distribution in single PEFC. The performance of PEFC is strongly influenced by the operating temperature because the operational temperature has a powerful effect on electrochemical reaction kinetics. PEM can be damaged and destroyed by a local hot spot and thermal stress, respectively, when the temperature distribution is non-uniform [6,7]. Additionally, the temperature distribution causes problems such as water flooding, dehydration of PEM and breakdown of the cell due to overheating [8]. Consequently, the heat transfer in PEFC should be managed at a relatively higher than normal temperature.
Thermocouples are widely used to measure temperature. However, it is known that it influences power generation characteristics and temperature measurement accuracy significantly due to gas leak [9,10]. Since temperature and mass distribution is not disturbed due to a non-contact and in-situ procedure, it is known that a thermocamera can measure the temperature more accurately even in differing operation conditions. According to the previous reports [7,11,12], the temperature distribution was measured by thermocamera below 60 °C under dry gas supply condition. There is no report to reveal the temperature distribution in PEFC at a temperature over 80 °C, excluding the studies investigated by authors [13,14,15].
Moreover, according to previous studies [14,15], the effect of PEM thickness on heat and mass transfer characteristics, as well as power generation performance at relatively higher operating temperature, e.g., 90 °C, was reported. The thinner PEM can provide lower ohmic resistance, higher H+ flux ratio and back diffusion [16,17]. Consequently, it is expected that a decrease in the thickness of PEM provides the promotion of heat and mass transfer mechanism, as well as the power generation performance.
In this study, the target operation temperature is set to be 90 °C according to the NEDO roadmap 2017 [1]. This study selects the popular and commercial PEM and GDL for the operation at 90 °C, which is a higher than usual operation temperature. The new material membranes have been developing for HT-PEMFC [18,19,20]. However, the new material membranes have not been developed for commercial usage yet. If the popular and commercial PEM and GDL can be used at high temperatures, the authors think the stationary application of PEFC system will become popular easily. The authors have selected the thinnest thickness of PEM and GDL, including larger types, which are commercialized, in this study. Therefore, the target temperature of this study is set to be 90 °C. According to the previous study [21], Nafion performs good H+ conductivity in fully hydration state at the temperature which is lower than 80 °C. However, it was reported that this Nafion struggles with some drawbacks, including poor H+ conductivity at temperatures over 80 °C and low humidity, high fuel crossover (specially at high temperature) and high cost of production. Therefore, it is thought that the impact of increase in the operation temperature on heat and mass transfer characteristics is important, even in an increase of 10 °C.
In addition, a micro porous layer (MPL) can enhance the through-plane thermal conductivity of GDL [22] and the gas diffusion performance due to enhancement of discharging water in GDL [23]. Chen et al. [22] studied the impact of MPL on the power generation performance at the cell temperature of 40, 60 and 80 °C under both high and low relative humidity conditions. They reported that the improvement in power generation performance due to the effect of MPL was significant at a low cell temperature i.e., 40 °C, 60 °C, irrespective of relative humidity condition, while it was less at the cell temperature of 80 °C. According to the previous study of numerical simulation using 3D single-phase model [24], the in-plane temperature distribution in PEM is more uniform with MPL at the cell temperature of 180 °C since the MPL decreases the local temperature and helps to obtain a more even temperature distribution. Liu and Chang [25] investigated the impact of polytetrafluorethylene (PTFE) content and carbon loading of MPL on the power generation performance at the cell temperature of 180 °C experimentally. They revealed the optimum PTFE content and carbon loading. However, the impact of addition of MPL on not only heat and mass transfer characteristics, but also power generation performance operated at higher temperature e.g., 90 °Chas not been experimentally well investigated.
In this study, the aim is to analyze the impact of MPL on not only heat and mass transfer characteristics, but also power generation performance with various thicknesses of PEM. The flow rate and relative humidity of the supply gas are varied at higher temperature condition such as 90 °C. We have measured the in-plane temperature distributions on cathode separator back by thermocamera with different PEFC power generation conditions and relative humidity of inflow gases. The voltage, local current, ohmic resistance and activation and mass transfer resistance have been measured to evaluate the performance of PEFC.

2. Experimental PEFC System

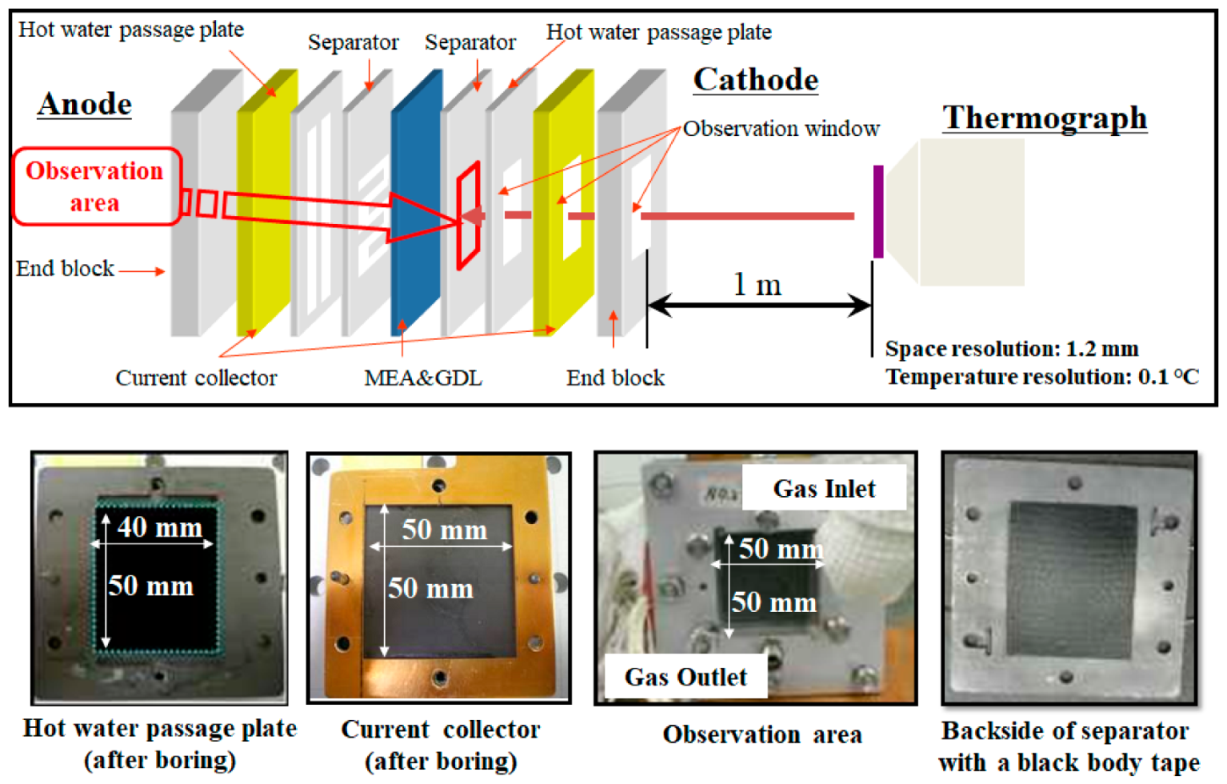
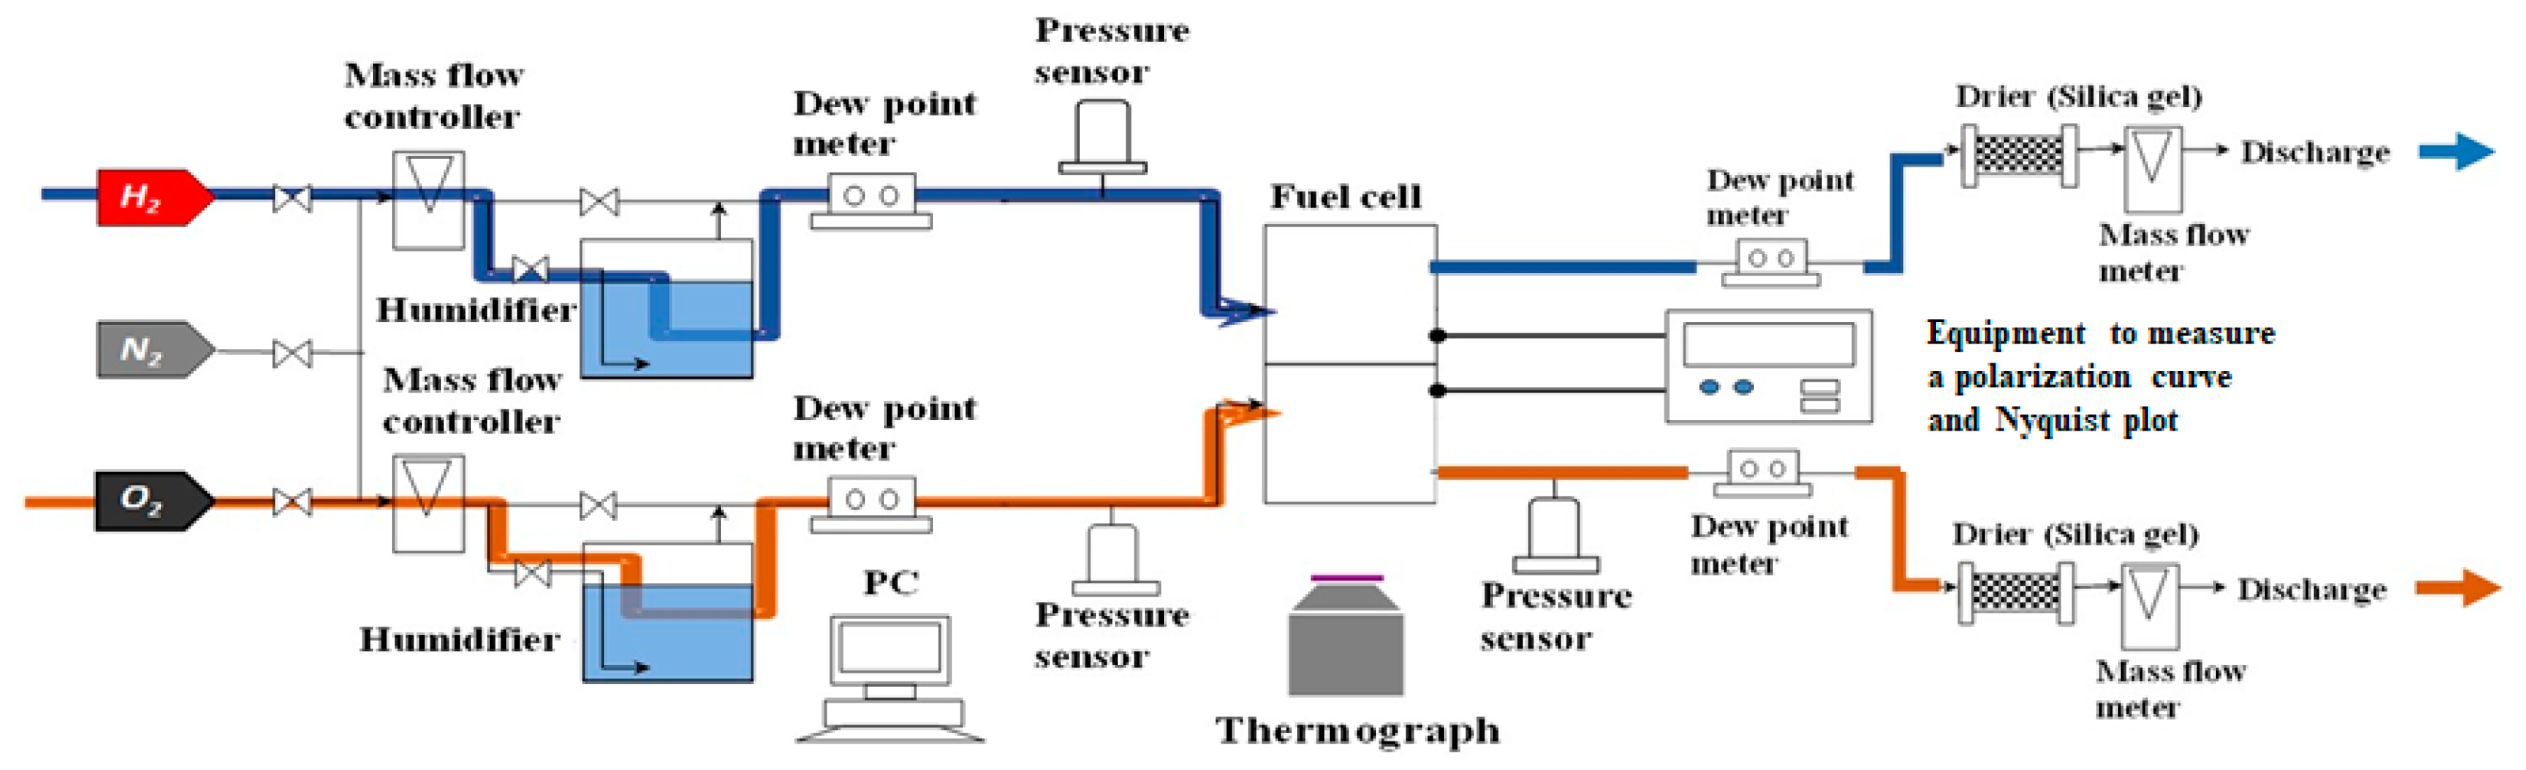
2.1. Experimental Set-Up and Procedure

The single PEFC (MC-25-SC-NH; manufacture: Reactive Innovations) was used. Nafion 115 and Nafion NRE-211 (manufacture: DuPont Corp.), having a thickness of 127 μm and 25 μm under dry condition [26,27], respectively, were applied as target PEM. The GDL used was TGP-H-060 (manufacture: Toray Corp.), whose thickness was 190 μm [28]. Table 1 lists the characteristics of cell parts. Figure 1 illustrates the experimental method to measure temperature [13,14,15]. Additionally, Figure 1 also shows the cell structures to measure temperature [13,14,15]. The hole to measure temperature had a size of 50 mm × 50 mm, which is the same as the electrode. Hot water passage plate also had a hole whose size was 40 mm × 50 mm. The water to heat the single cell didn’t flow in the plate exactly.
We measure in-plane temperature distributions on cathode separator back through the observation hole with thermocamera (Thermotracer TH9100WL; manufacture: NIPPON AVONICS Co. Ltd., Tokyo, Japan). In Figure 1, the space resolution means the length guaranteeing the accuracy of measured temperature. The temperature resolution means the temperature difference guaranteeing the accuracy of measured temperature. Since it is thought that in-plane temperature distributions on cathode separator back is influenced due to the transfer of water generated by electrochemical reaction in the cathode catalyst layer, this study focused on the in-plane temperature distributions on separator back at the cathode. Additionally, we analyzed temperature data using the dedicated software (TH91-702; manufacture: NIPPON AVIONICS Co., Ltd.). A black body tape (HB-250; manufacture: OPTIX) having thickness of 0.1 mm is attached on the separator back in order to prevent measurement inaccuracy, which is caused by roughness and emissivity distribution of separator surface. According to the manufacture catalog, the thermal conductivity of the black body tape is 7.2 W/(m K). This study estimates the temperature on observation surface with and without black body tape under the condition that the current is 20 A, the voltage is 0.5 V, the temperature of interface between GDL and separator is 90 °C, resulting that the difference between the temperature on observation surface with and without black body tape is 0.055 °C. Therefore, it is believed that the impact of black body tape on the temperature distribution on the separator back is small. We measured the emissivity of black body tape pre-experimentally. As pre-experimental conditions, the initial temperature of single cell was maintained at 70 °C and the relative humidity (RH) of both inflow gases were maintained at 80%RH with and without observation hole [13,14]. It has been confirmed from the pre-experiment that the impact of the observation window on power generation performance can be ignored. The voltage reduces due to the observation window at current (load) density of 0.80 A/cm2 under anode and cathode observation conditions have been only 4% and 7%, respectively. Consequently, we can ignore the impact of the observation window on the power generation performance. In addition, we estimated the in-plane temperature distribution on the interface between PEM and cathode catalyst layer using the temperature data measured by thermograph and the proposed heat transfer model, and compared with the temperature distribution calculated by 3D numerical simulation considering the electrochemical reaction, fluid dynamics, heat transfer and gas diffusion [29]. As a result, the maximum and the minimum temperature difference between these studies was 0.7 °C and 0.1 °C respectively for anode 80% RH and cathode 80% RH at Tini = 90 °C. Additionally, the tendency of in-plane temperature distribution was almost similar, e.g., the temperature rise and drop were observed at the same points, respectively, among these studies. Therefore, it is thought that we can discuss the tendency of in-plane temperature distribution measured by thermograph in this study.
All sides of the cell excluding observation window side and opposite side are covered by the adiabatic material. We measure in-plane temperature distribution by thermocamera at the current density of 0.80 A/cm2. We keep the temperature of single cell over the initial temperature with no heating by the electric heater [13,14,15]. According to the manufacture’s descriptions, the thermal conductivities of PEM, GDL and separator are 0.195, 1.7, 25 W/(m K), respectively, while those of the hot water passage plate, current collector and end block are 25, 380 and 220 W/(m K), respectively. Since the thermal conductivities of the latter—which are located outside of separator—are higher than those of former, the heat transfer among the latter is dominant in the whole cell compared to that among the former [13,14,15]. In other words, the parts located outside the separator are not dominant for heat transfer compared to those located inside the separator, resulting that the impact of observation window boring end block, current collector and hot water passage plate on the in-plane temperature distribution on the separator back is a small. The gas leakage was confirmed when hot water passage plate was not installed. Consequently, this study used a hot water passage plate in order to avoid the gas leak.
Table 2 and Figure 2 show the experimental operating conditions, including parameters and the experimental set-up [13,14,15], respectively. The temperatures of inflow gases are controlled in order to maintain the same temperatures as initial temperature of cell (Tini). The relative humidity of inflow gases is controlled by humidifiers and dew point meters (MHT337FC; manufacture: VAISALA). We keep the flow rates of inflow gases at the stoichiometric ratios of 1.5, 2.0 and 3.0, where we use high purity H2 and high purity O2 for the anode and cathode gases as fuel and oxidant. We control the flow rates of inflow gases by the mass flow controller (5850E; manufacture: BROOKS INSTRUMENT). The stoichiometric ratio of 1.0 for the flow rate of inflow gas can be defined by Equation (1).
CH2 = I/nF
where CH2 is the molar flow rate of consumed H2 [mol/s], I is the loaded current [A], n is the valence ion (=2) [-], F is Faraday constant (=) [C/mol]. CH2 is the molar flow rate corresponding to the stoichiometric ratio of 1.0. The CO2 is the molar flow rate of consumed O2 [mol/s], which is a half of CH2 (can be defined by Equation (2)).
H2 + 1/2O2 = H2O
The loaded current of PEFC is controlled by the equipment to measure the polarization curve and Nyqyuist plot of EIS (electrochemical impedance spectroscopy) spectra (PLZ603W; manufacture: KIKUSUI ELECTRONICS CORP.). In this study, the polarization curve is obtained using an electric load connected to a single cell of PEFC. The loaded current increases from 0 A to 20 A by 1 A and decreases from 20 A to 0 A by 1 A controlling the electric load, resulting in the voltage corresponding to each load current being acquired by a recorder. When each voltage is acquired, the loaded current is kept for 60 s to attain the steady state. We confirmed the constant voltage under the steady state. Two polarization curves are obtained from these measurements. The polarization curves shown in this study are obtained by averaging the above mentioned two curves. Nyquist plot of EIS spectra is also obtained to evaluate ohmic resistance, activation and mass transfer resistance.
We heat the cell using electric heaters (Silicon rubber heater MG; manufacture: OM Heater) installed around the end block for start-up. We also heat H2 and O2 to Tini before providing into the cell. After reaching Tini, the PEFC power generation starts to be loaded. We have confirmed that the flow rates of inflow gases and temperature distribution are kept in a steady state over 30 min with constant loaded current. The steady state is defined to keep the in-plane temperature distribution and the voltage corresponding to the loaded current a constant, respectively, in this study.

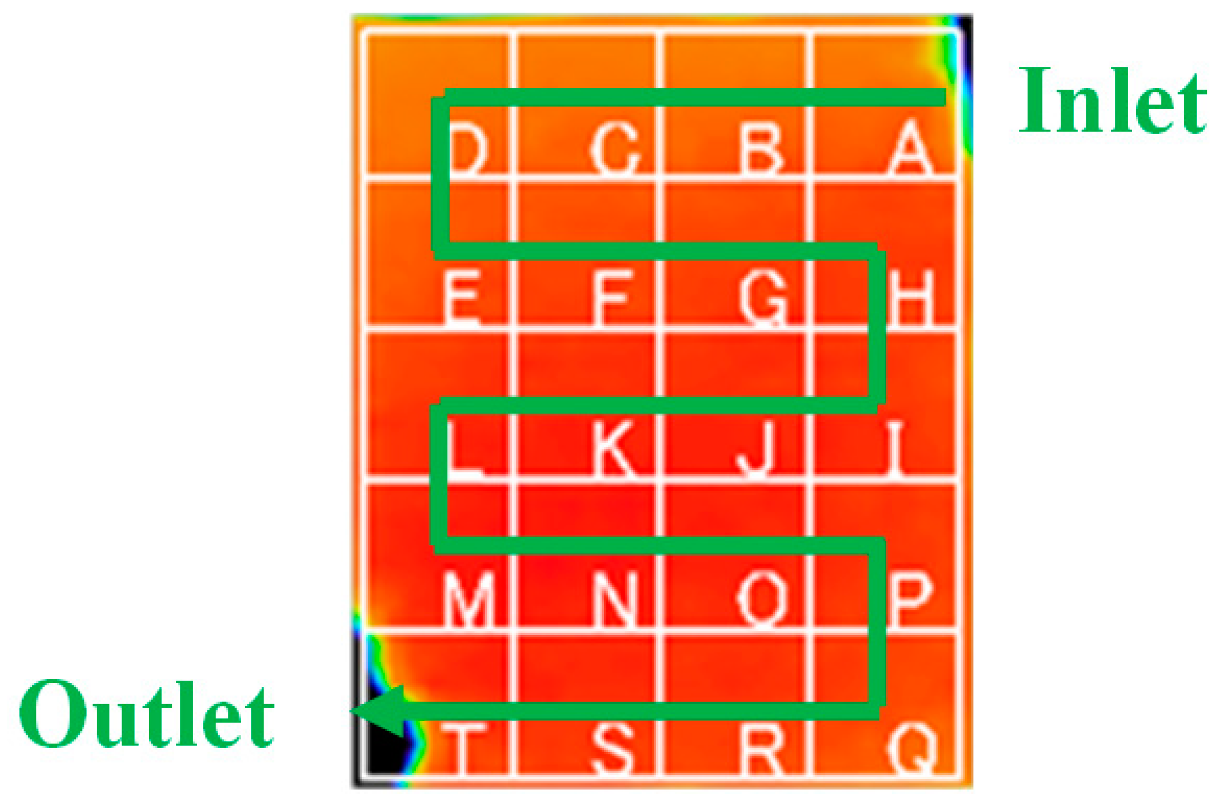
2.2. Method of Temperature Image/Thermocamera Evaluation

Figure 3 shows the 10 mm × 10 mm observation/measurement area. It has been divided into 20 sections whose names are A to T along the gas flow [13,14,15]. The mean temperature is calculated for each section by use of the temperature image. The temperatures of the sections named A and T are averaged by ridding the data in the area, where the adiabatic material covering the gas pipe disrupts measuring by thermocamera. In this study, the data in 145 pixels × 117 pixels correspond to the temperature distribution in the area of 50 mm × 40 mm, and the systematic and the random errors were 0.1 °C.
The temperature difference TiTave [°C] is used as an objective evaluation way of in-plane temperature distribution, where Ti is the mean temperature in respective section, e.g., A. On the other hand, Tave is the mean temperature among all sections. Therefore, Tave can be defined by the following equation:
T a v e i = A T T i 20

3. Results and Discussion

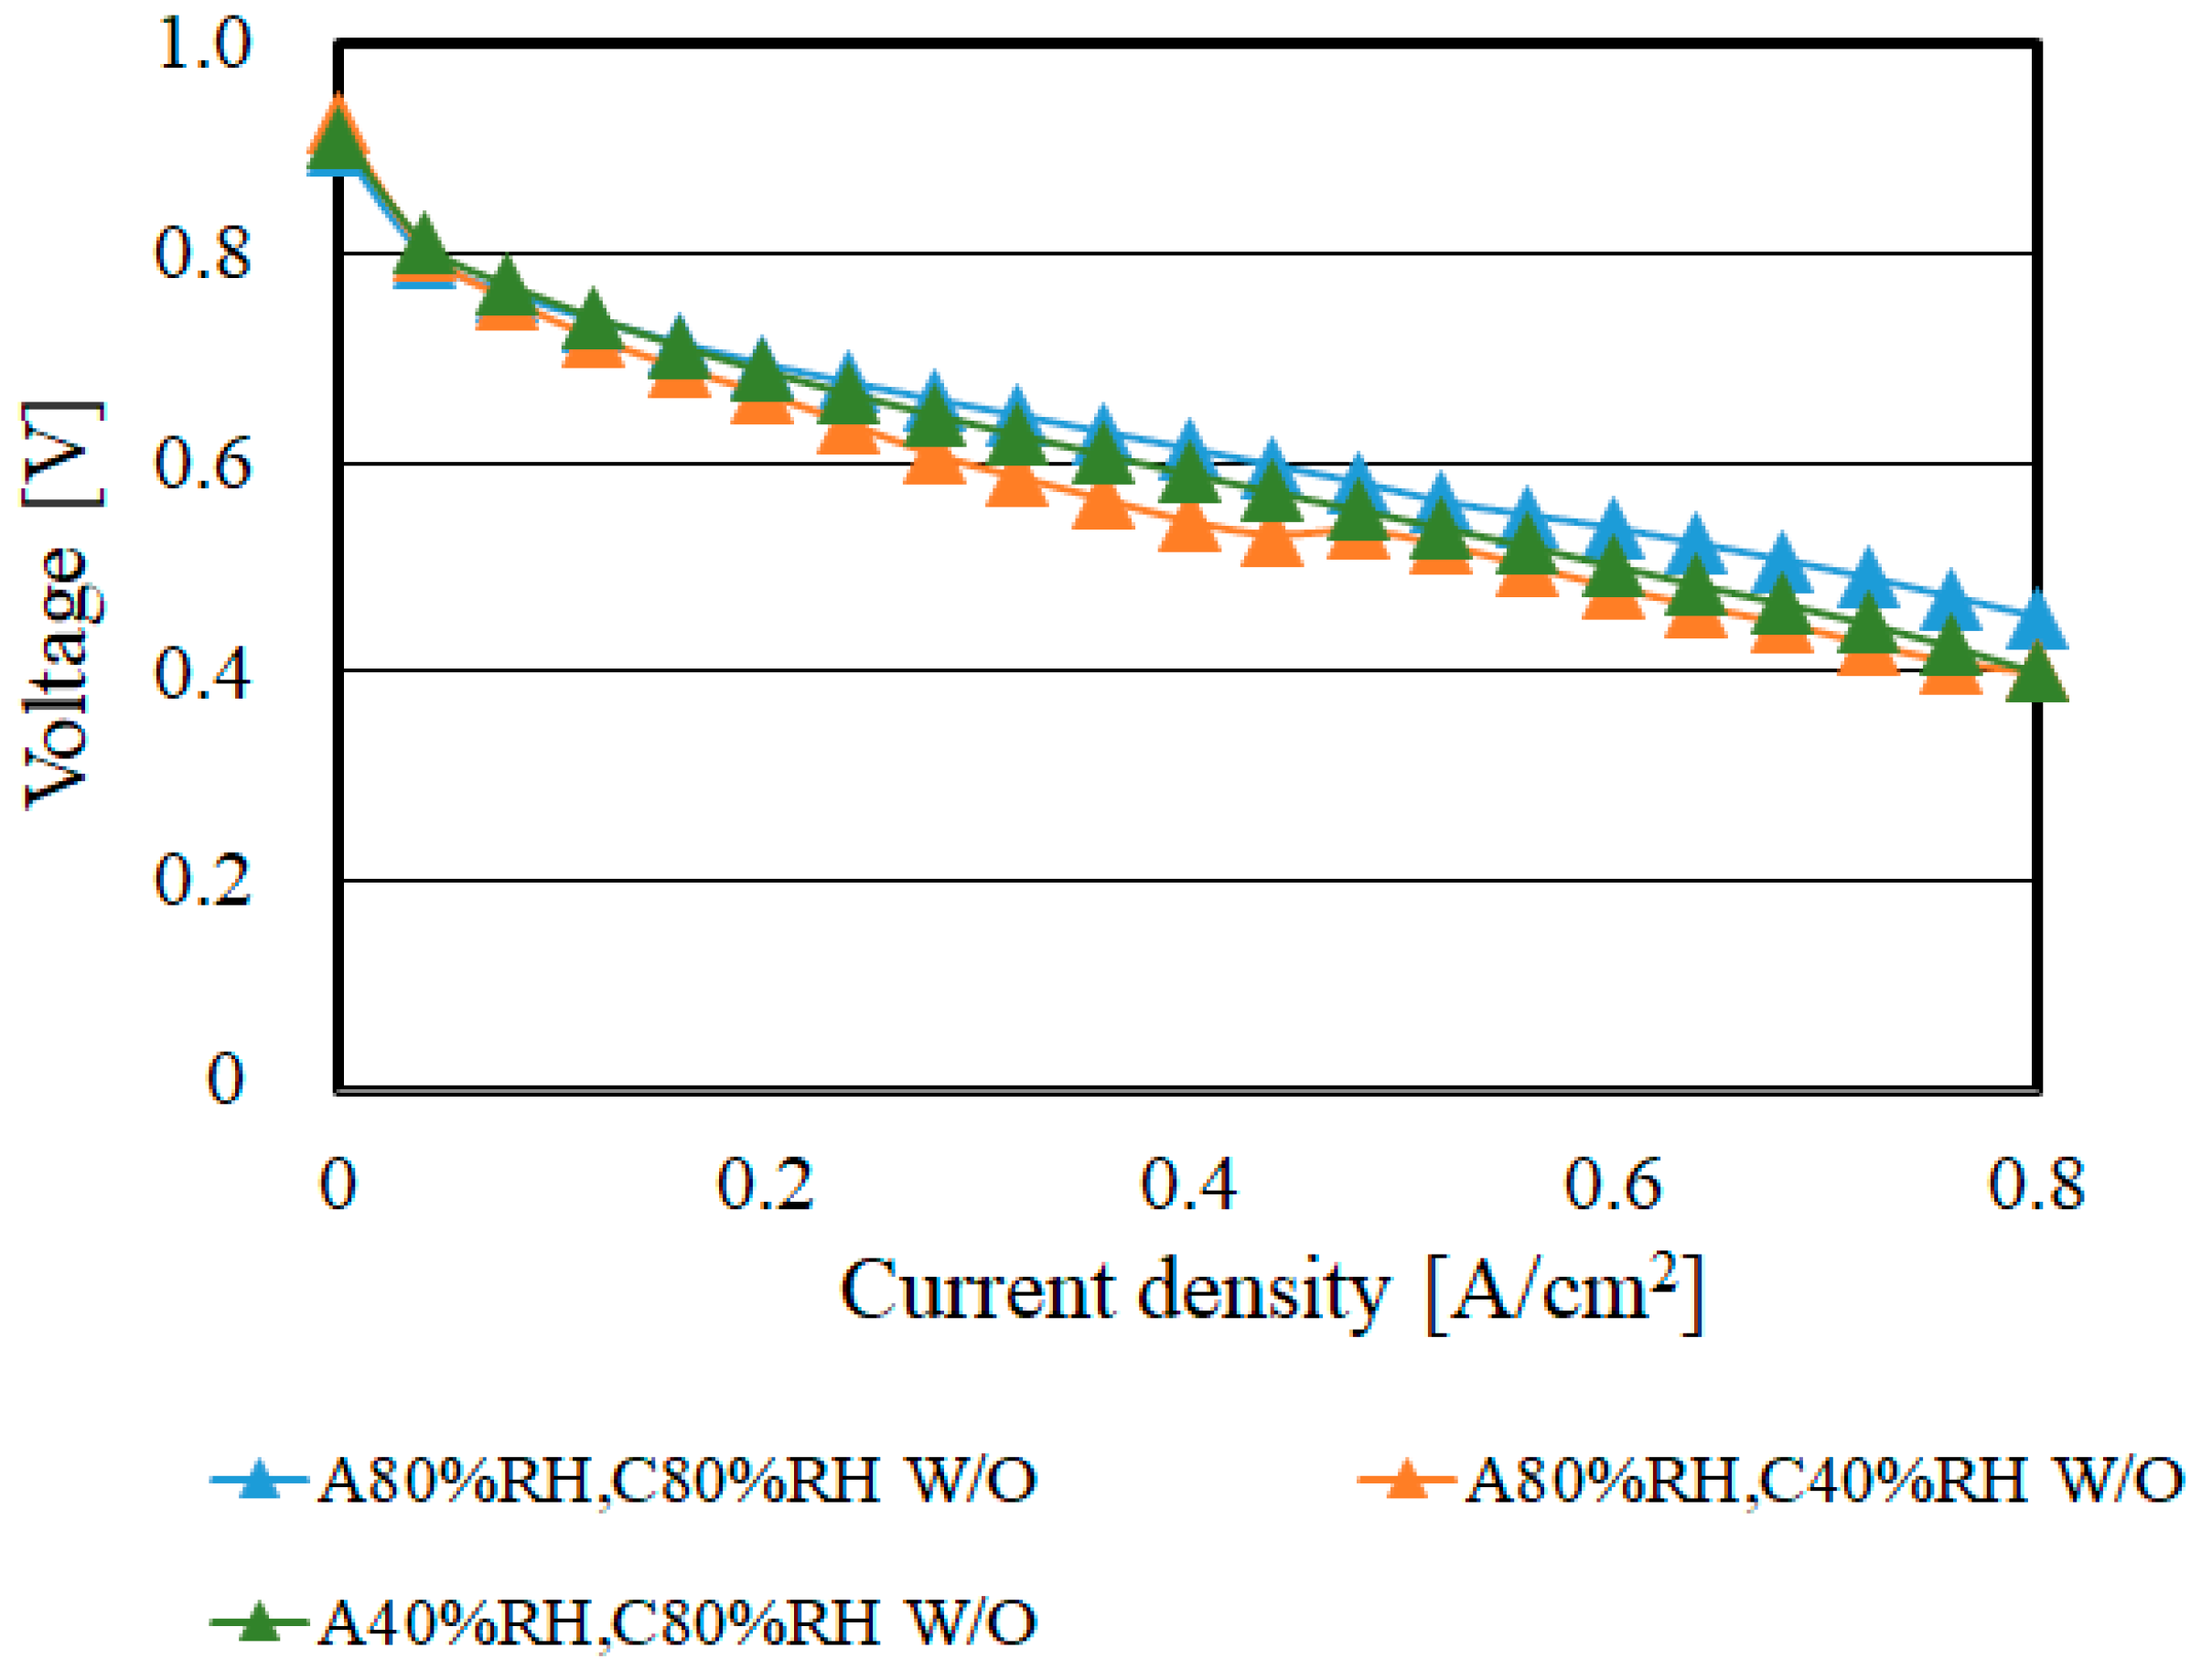
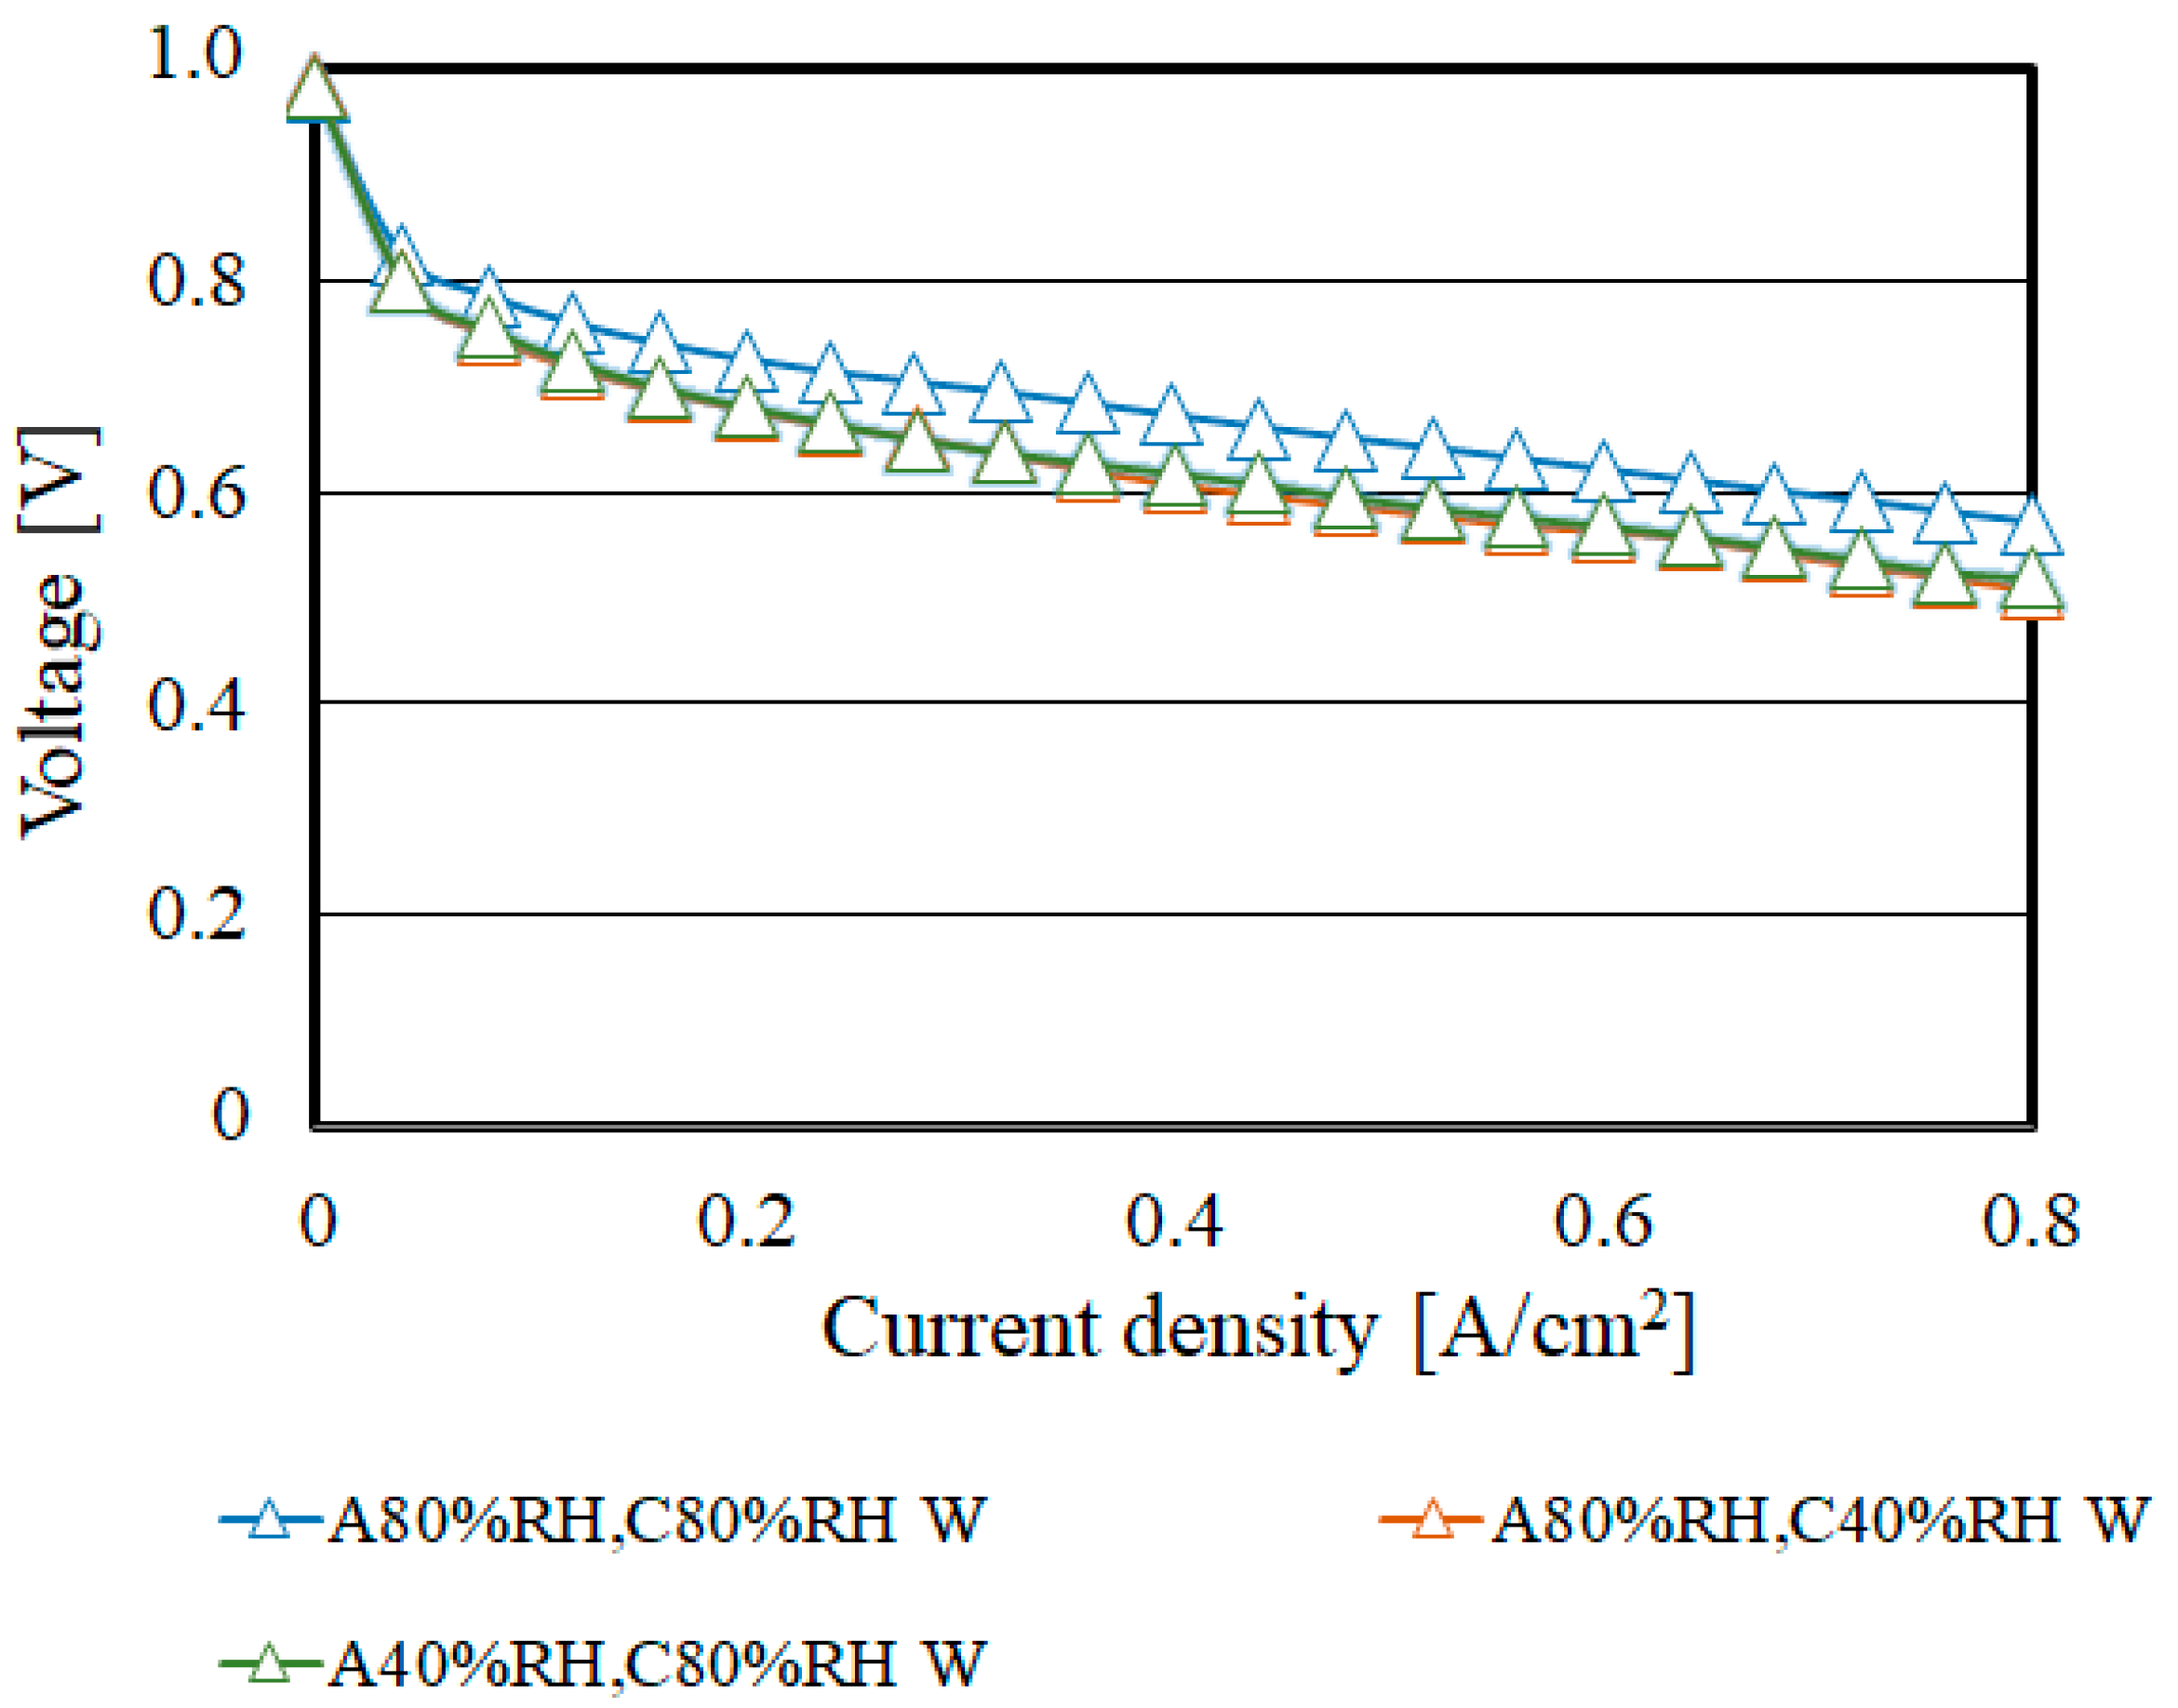
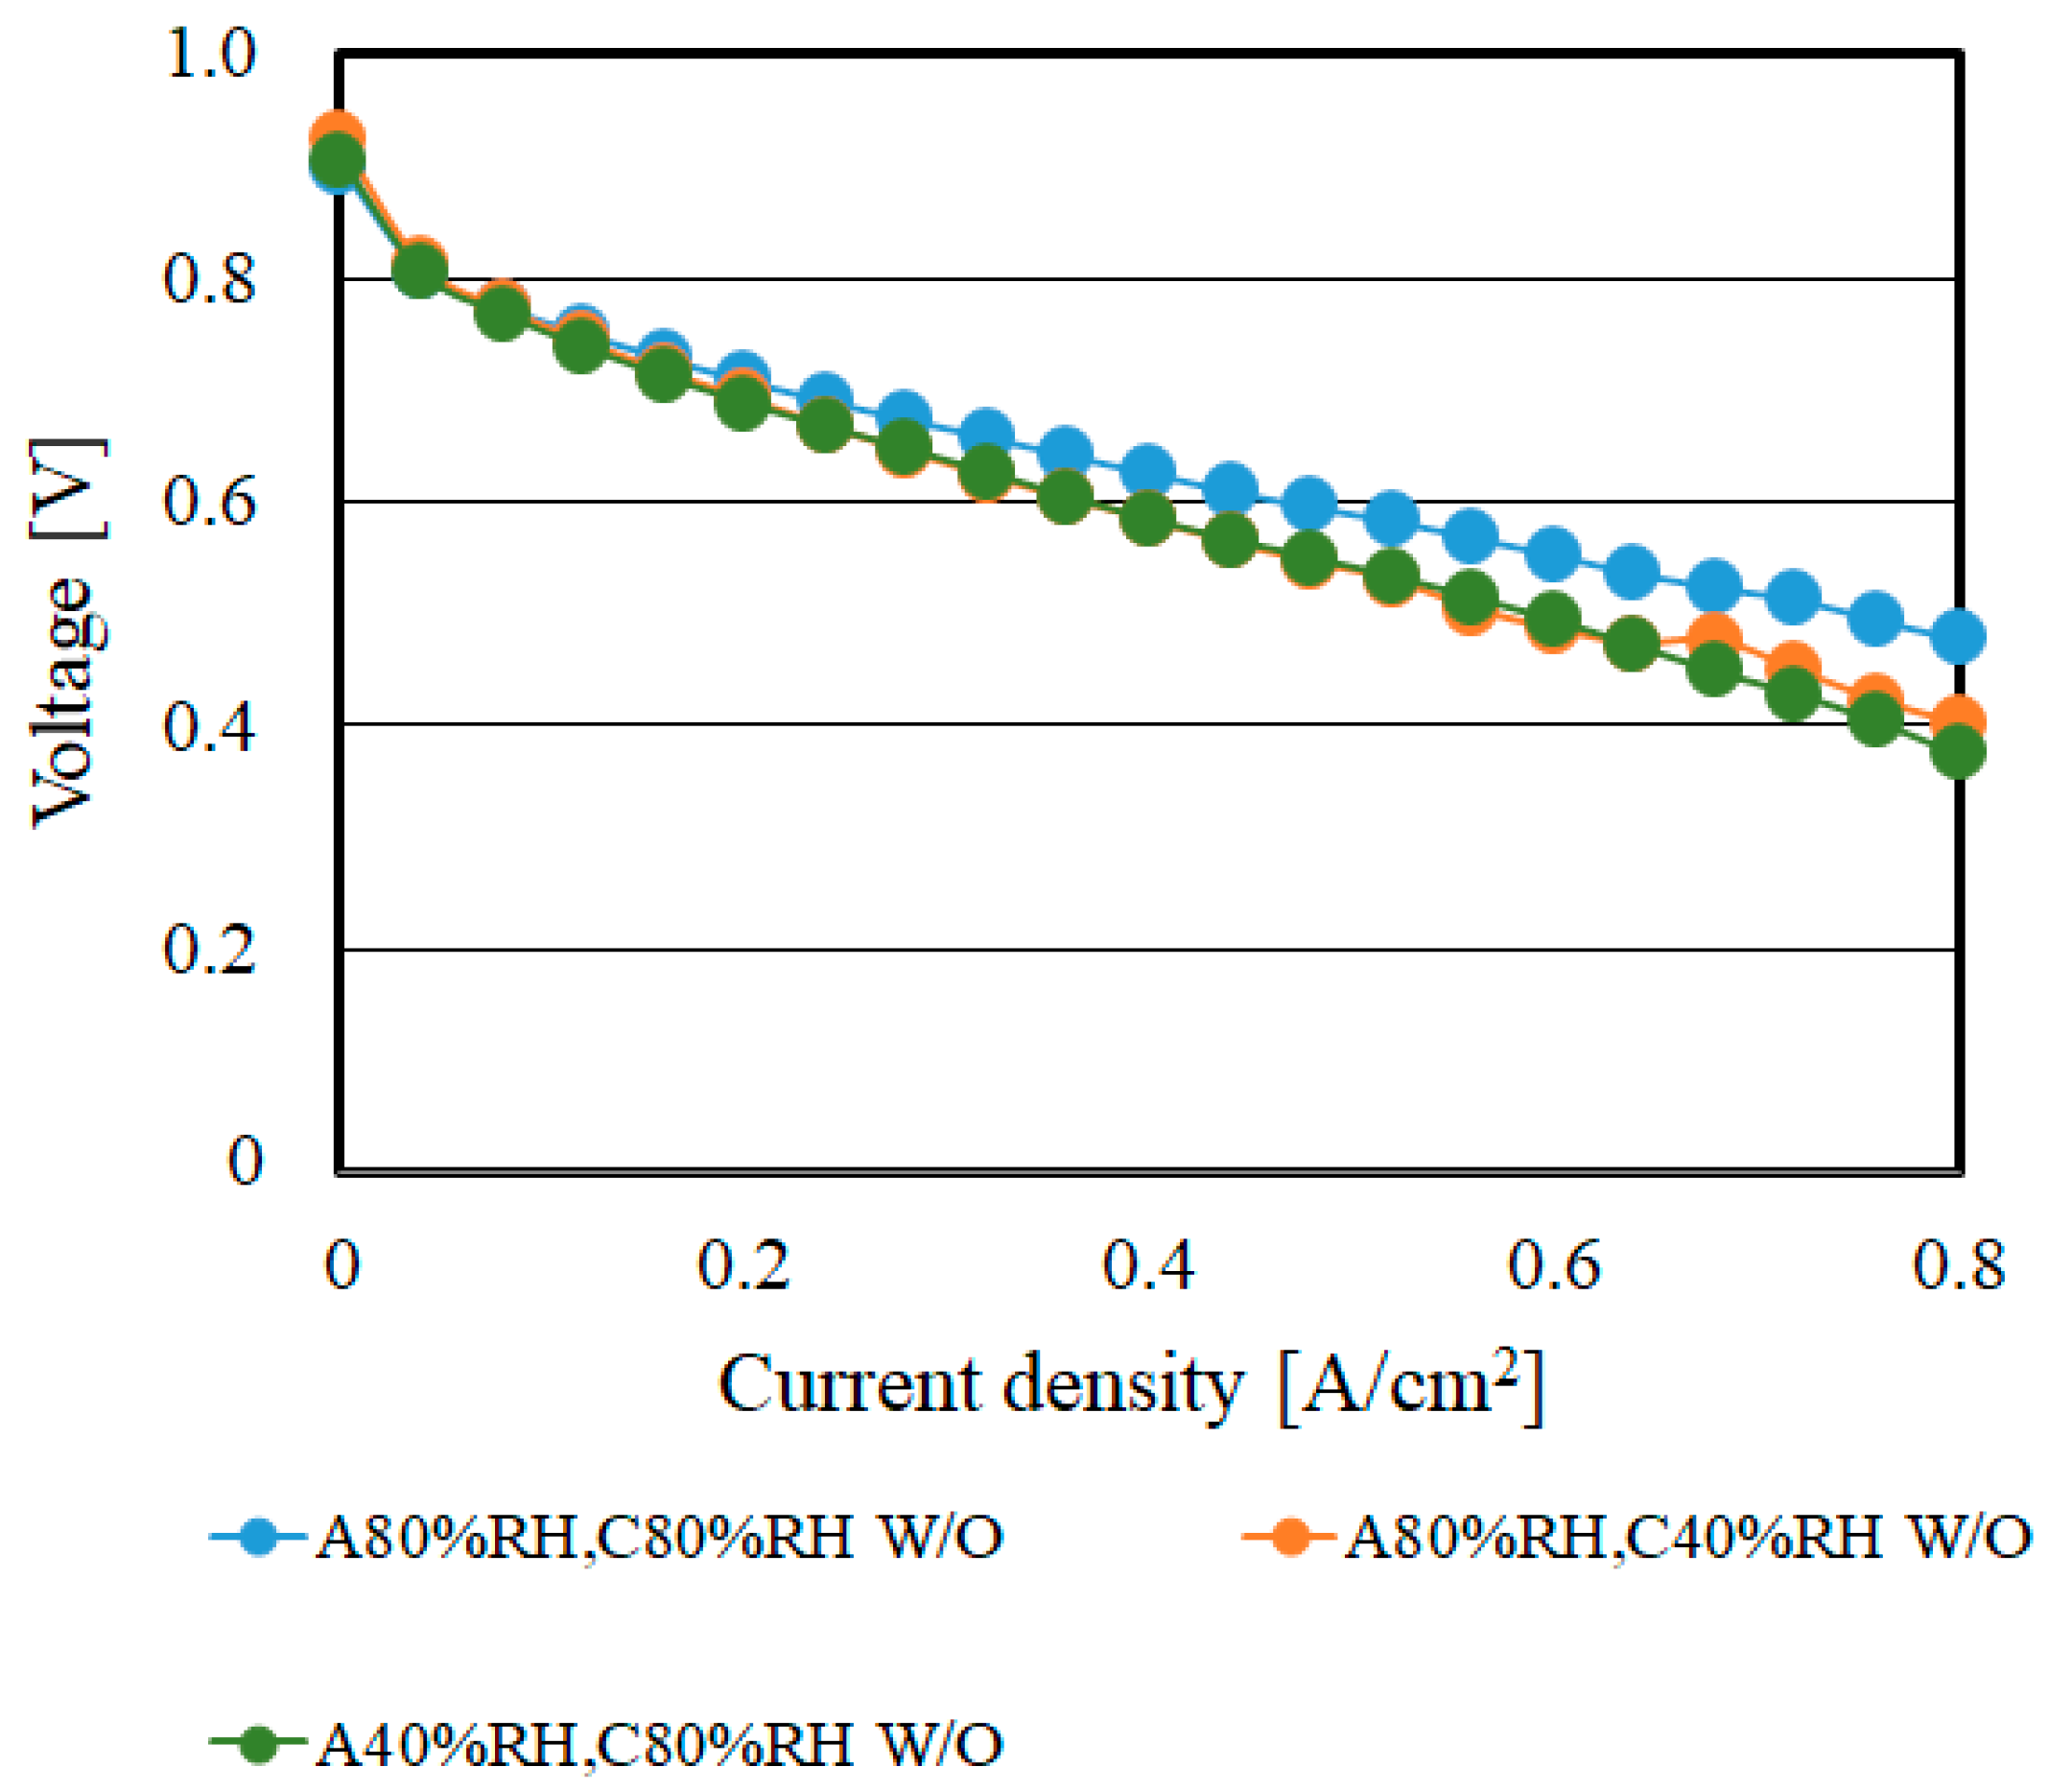
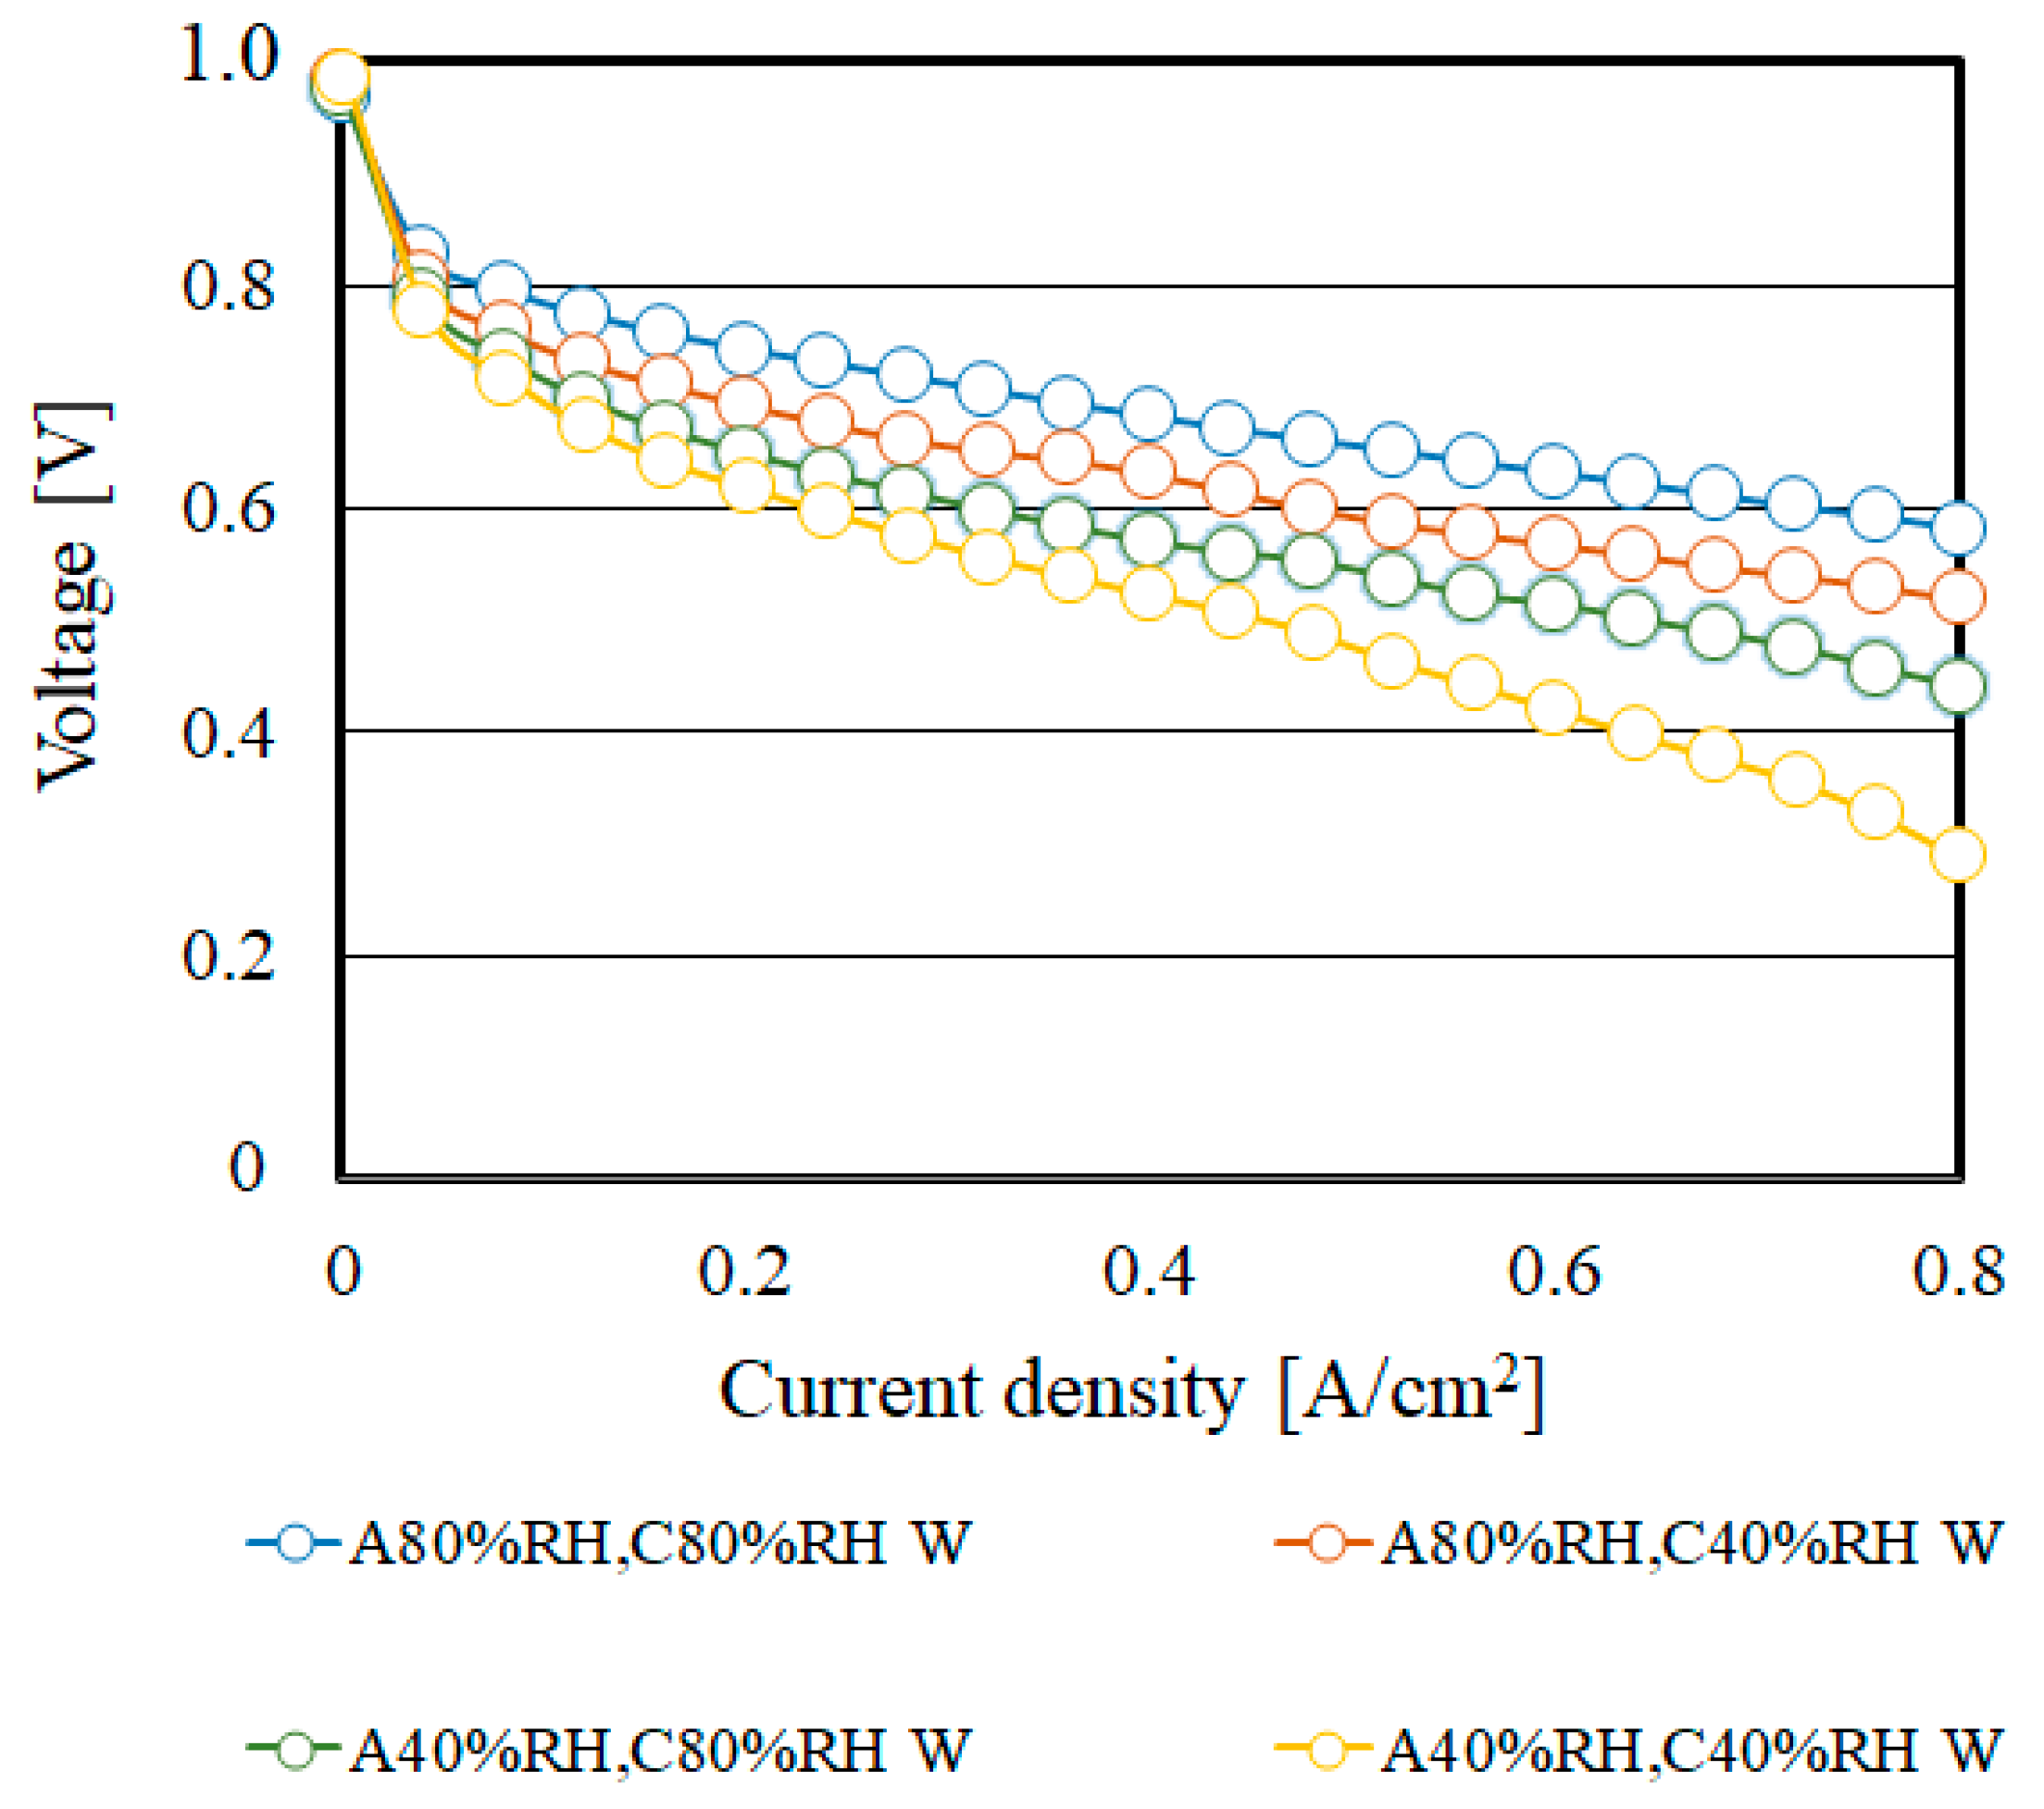
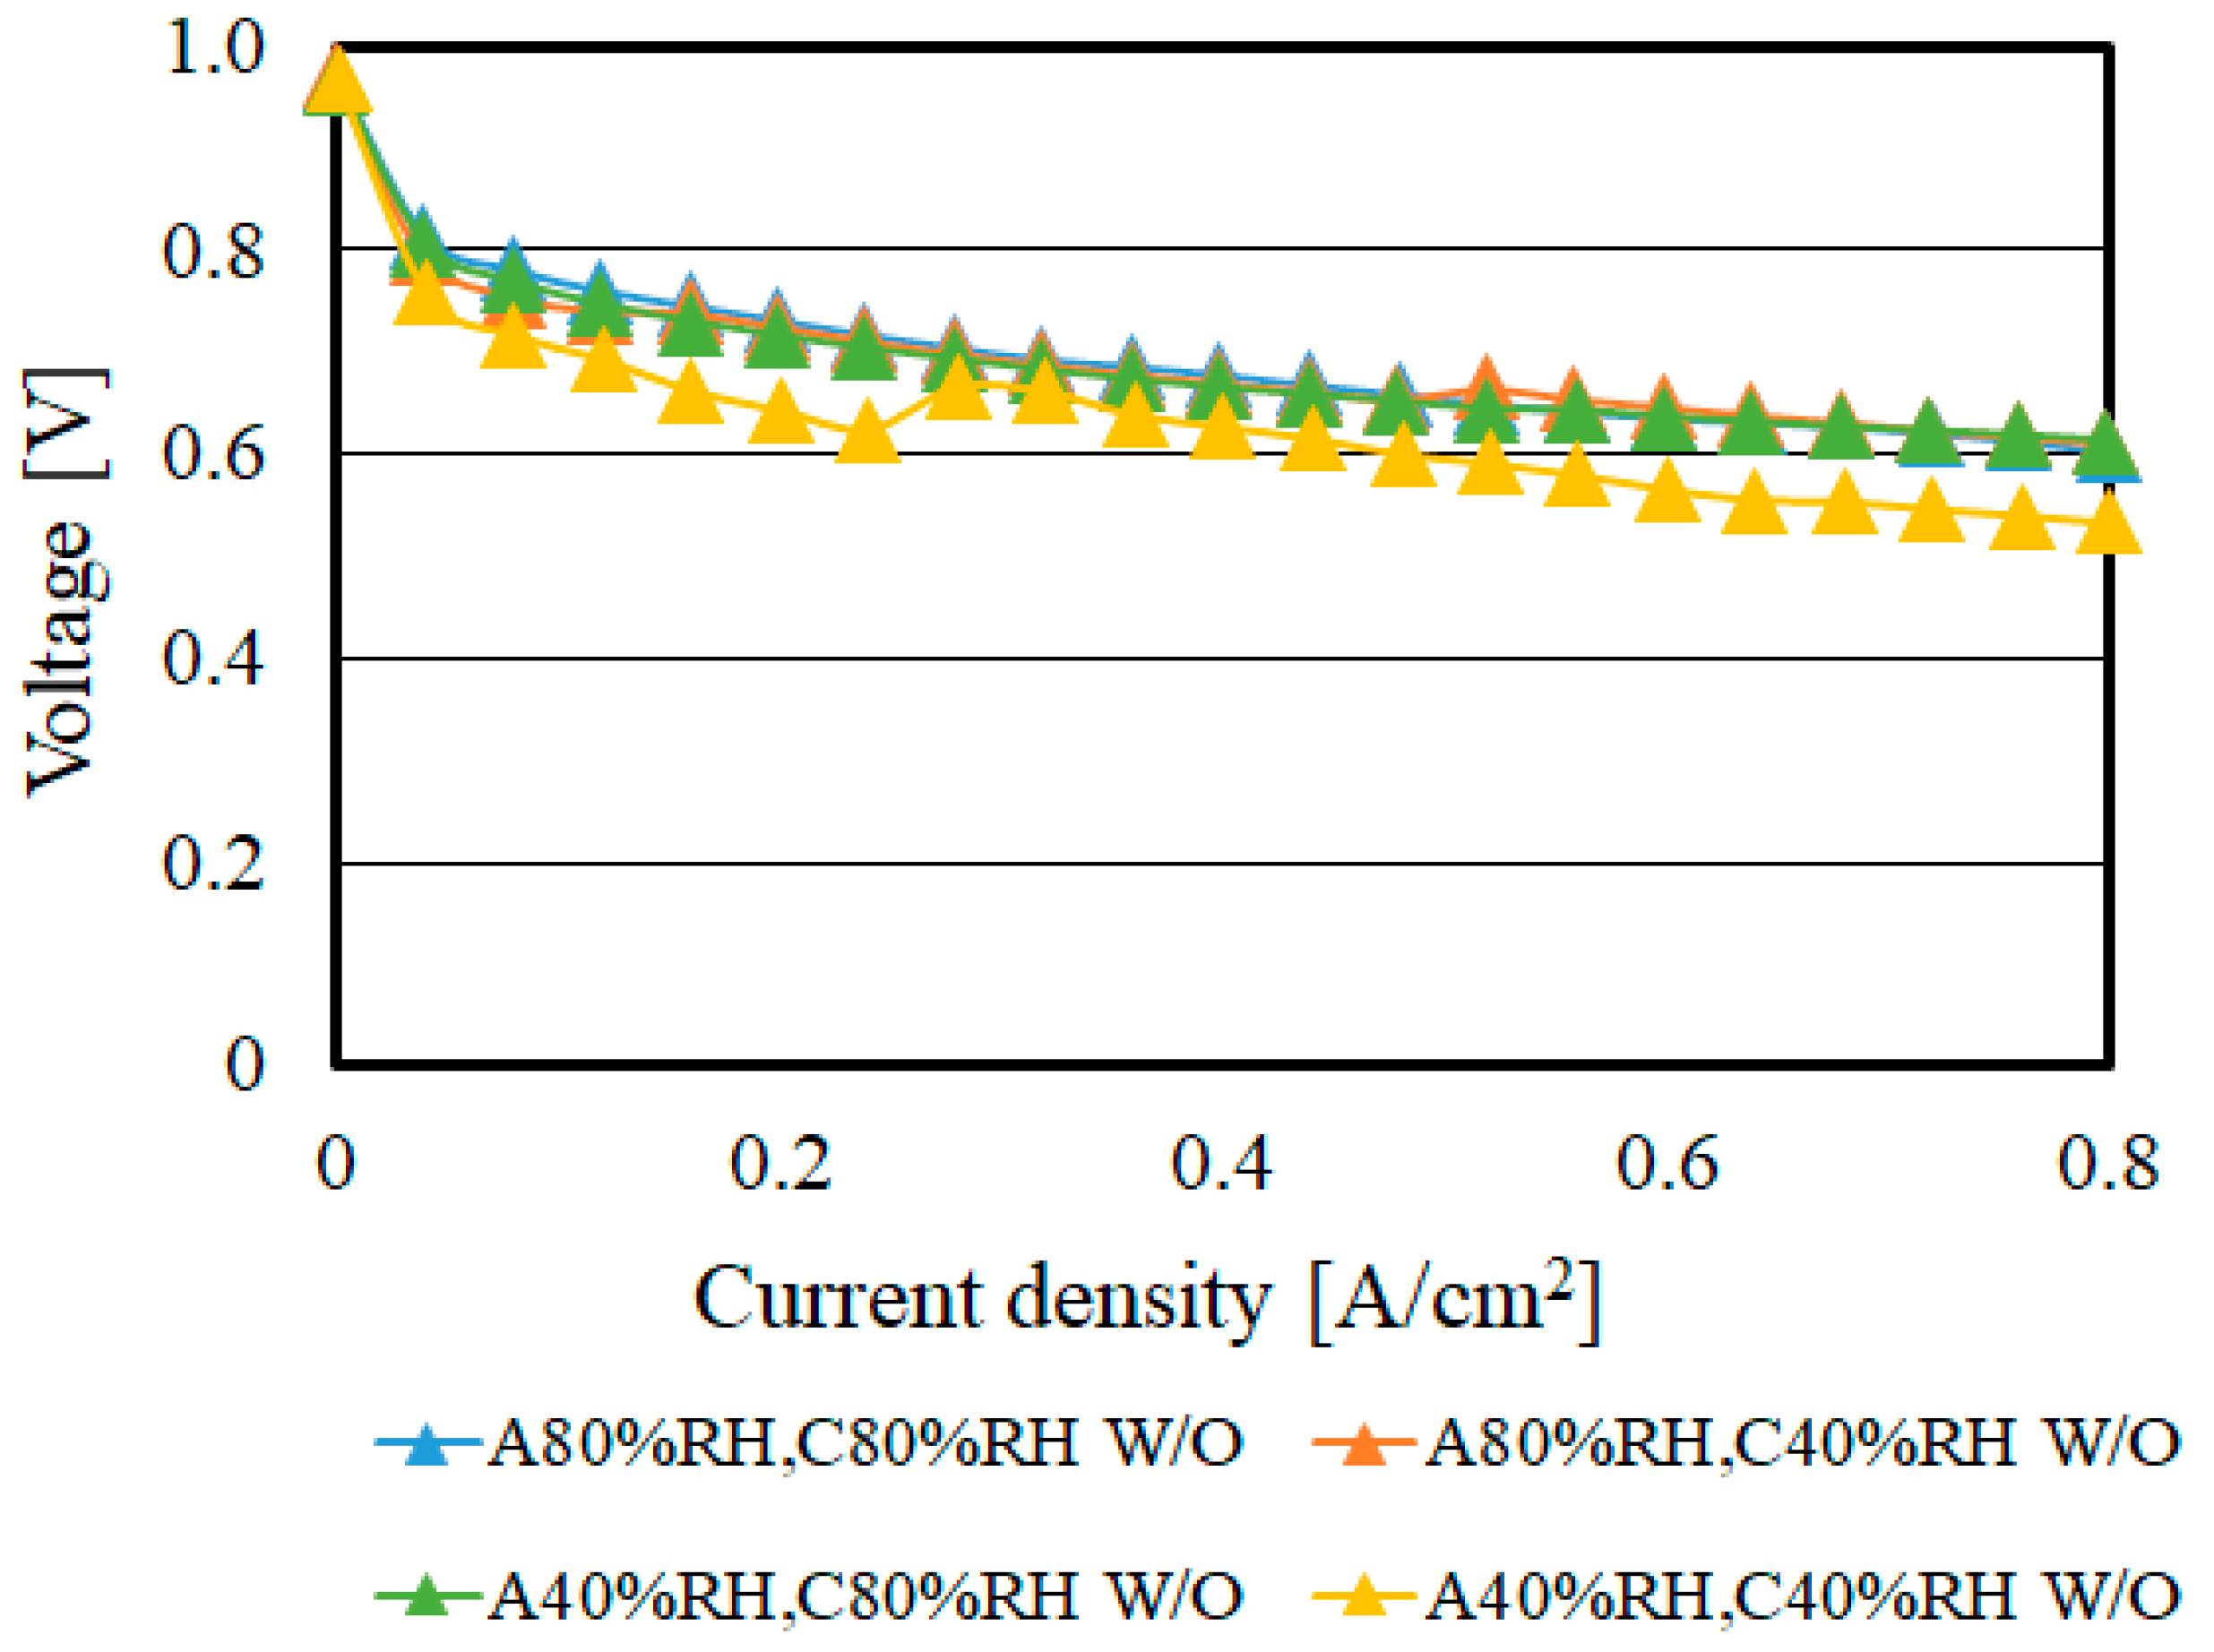
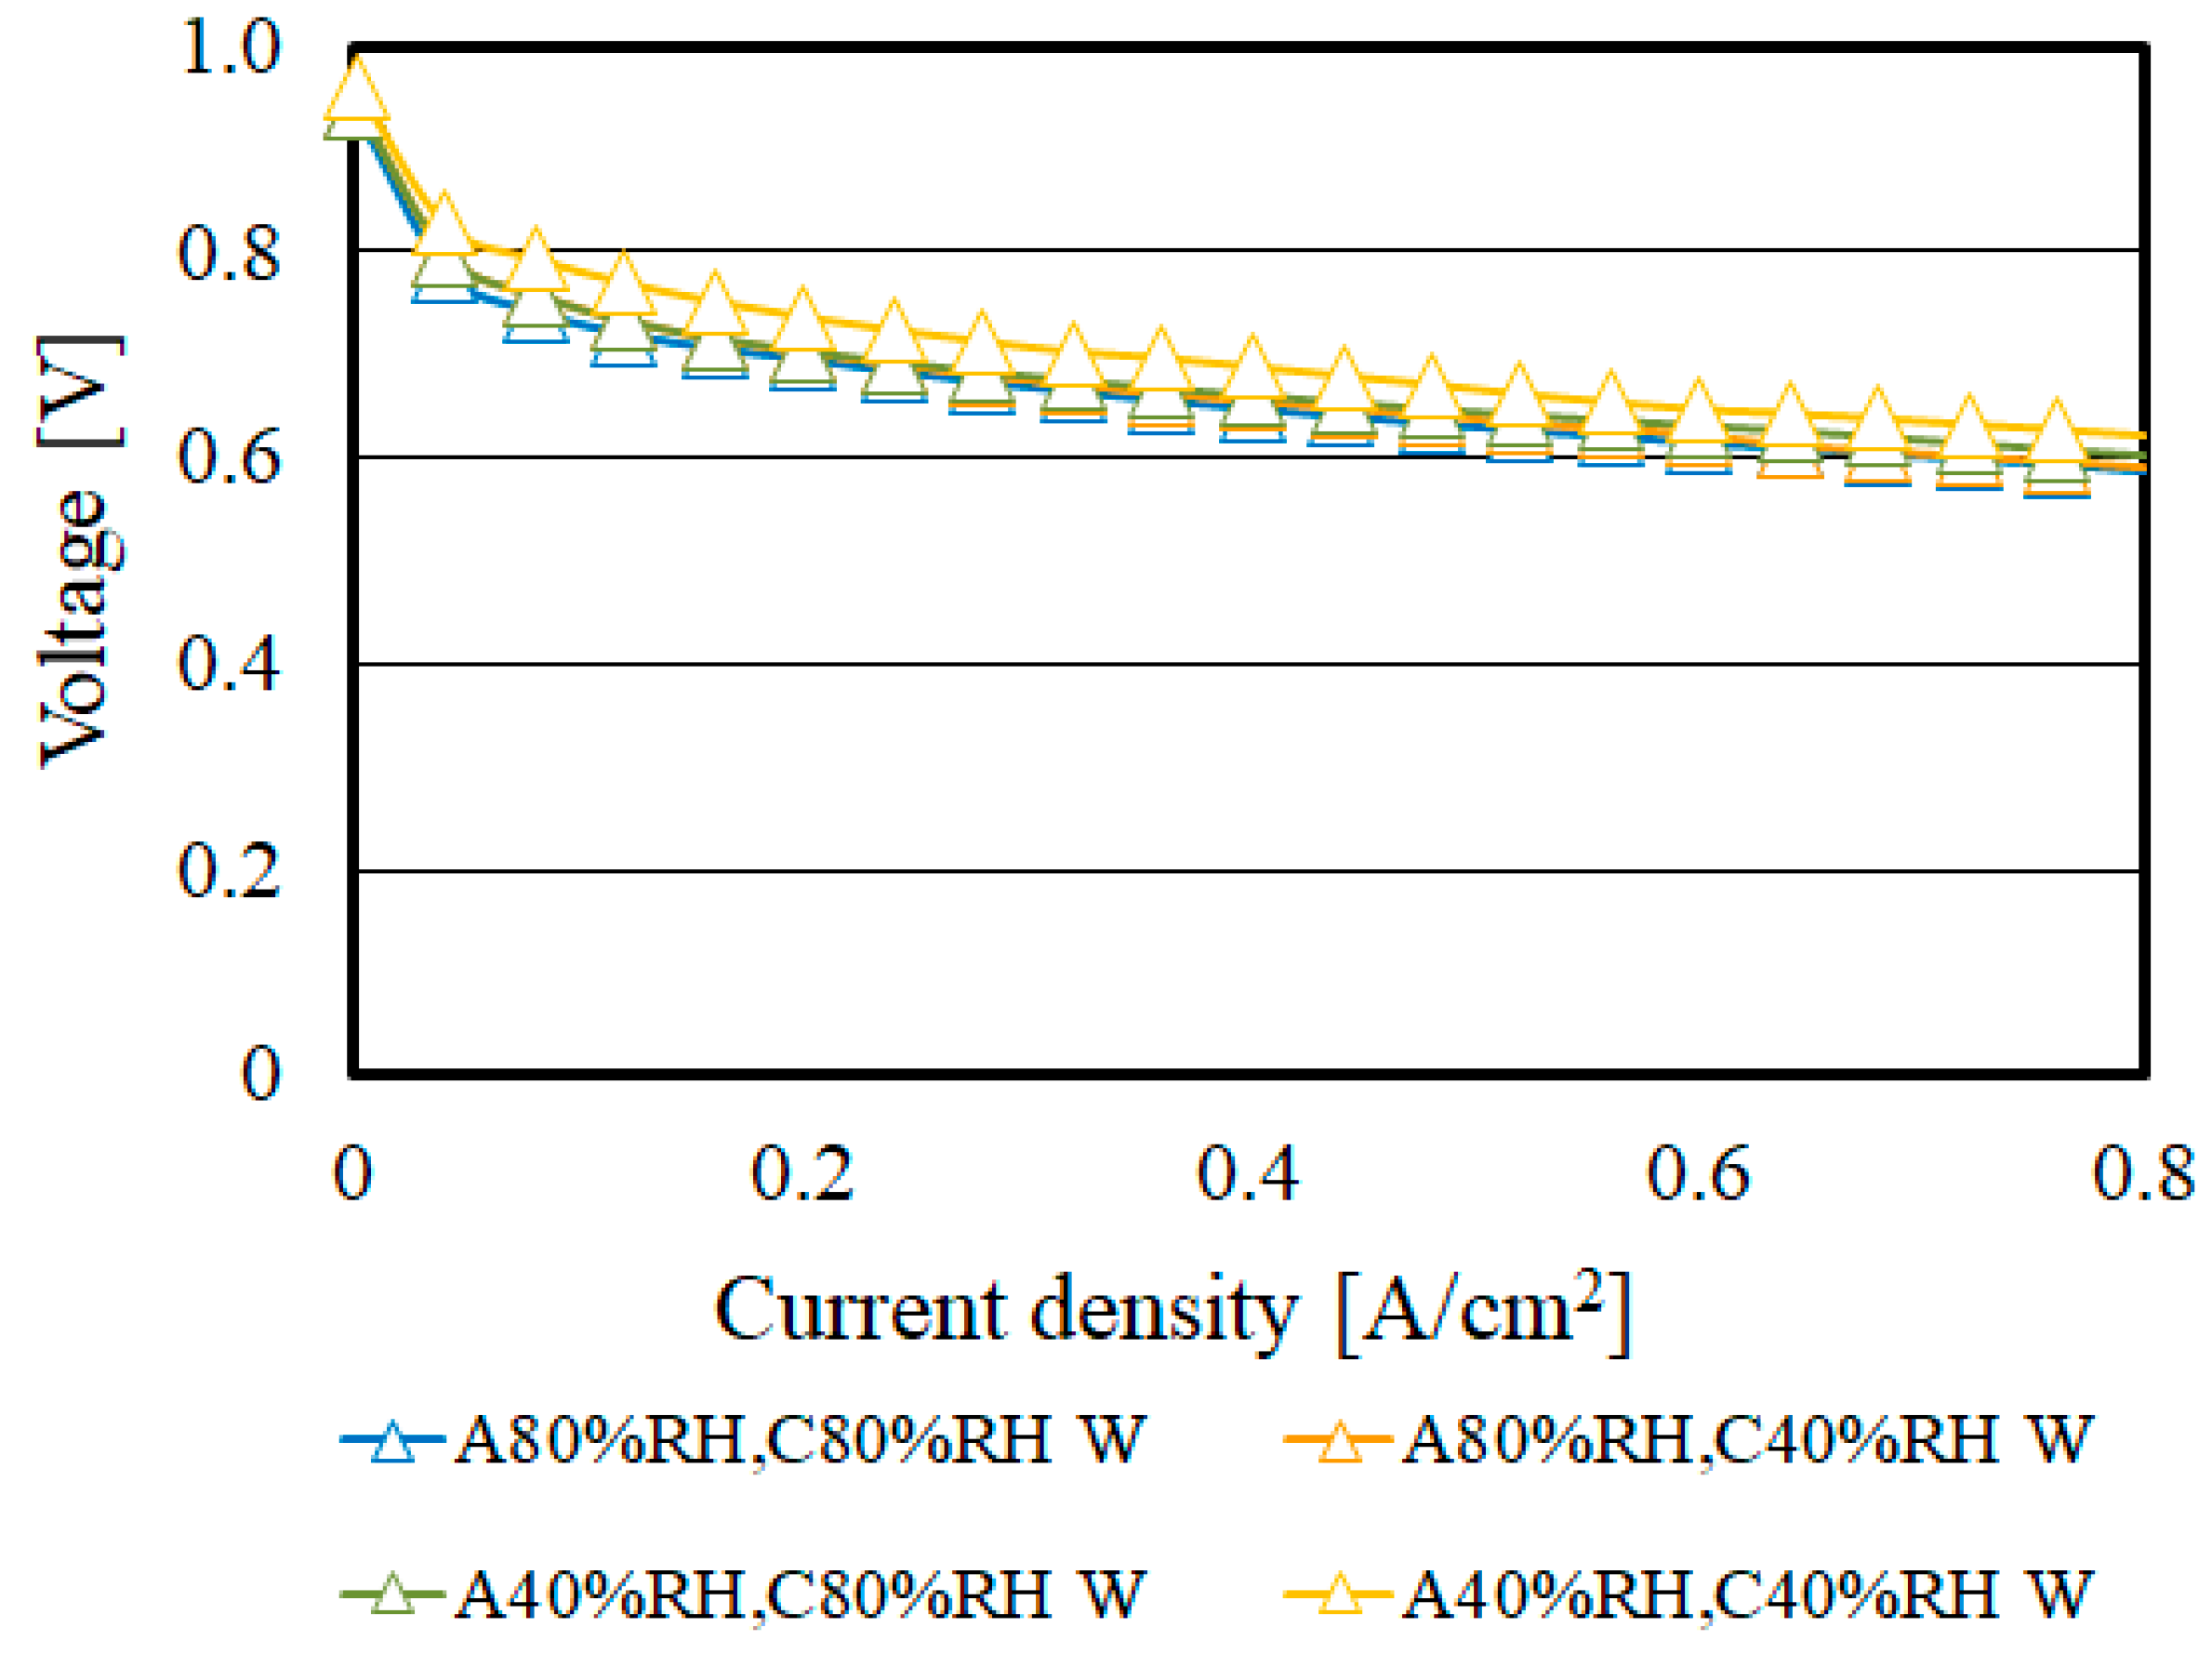
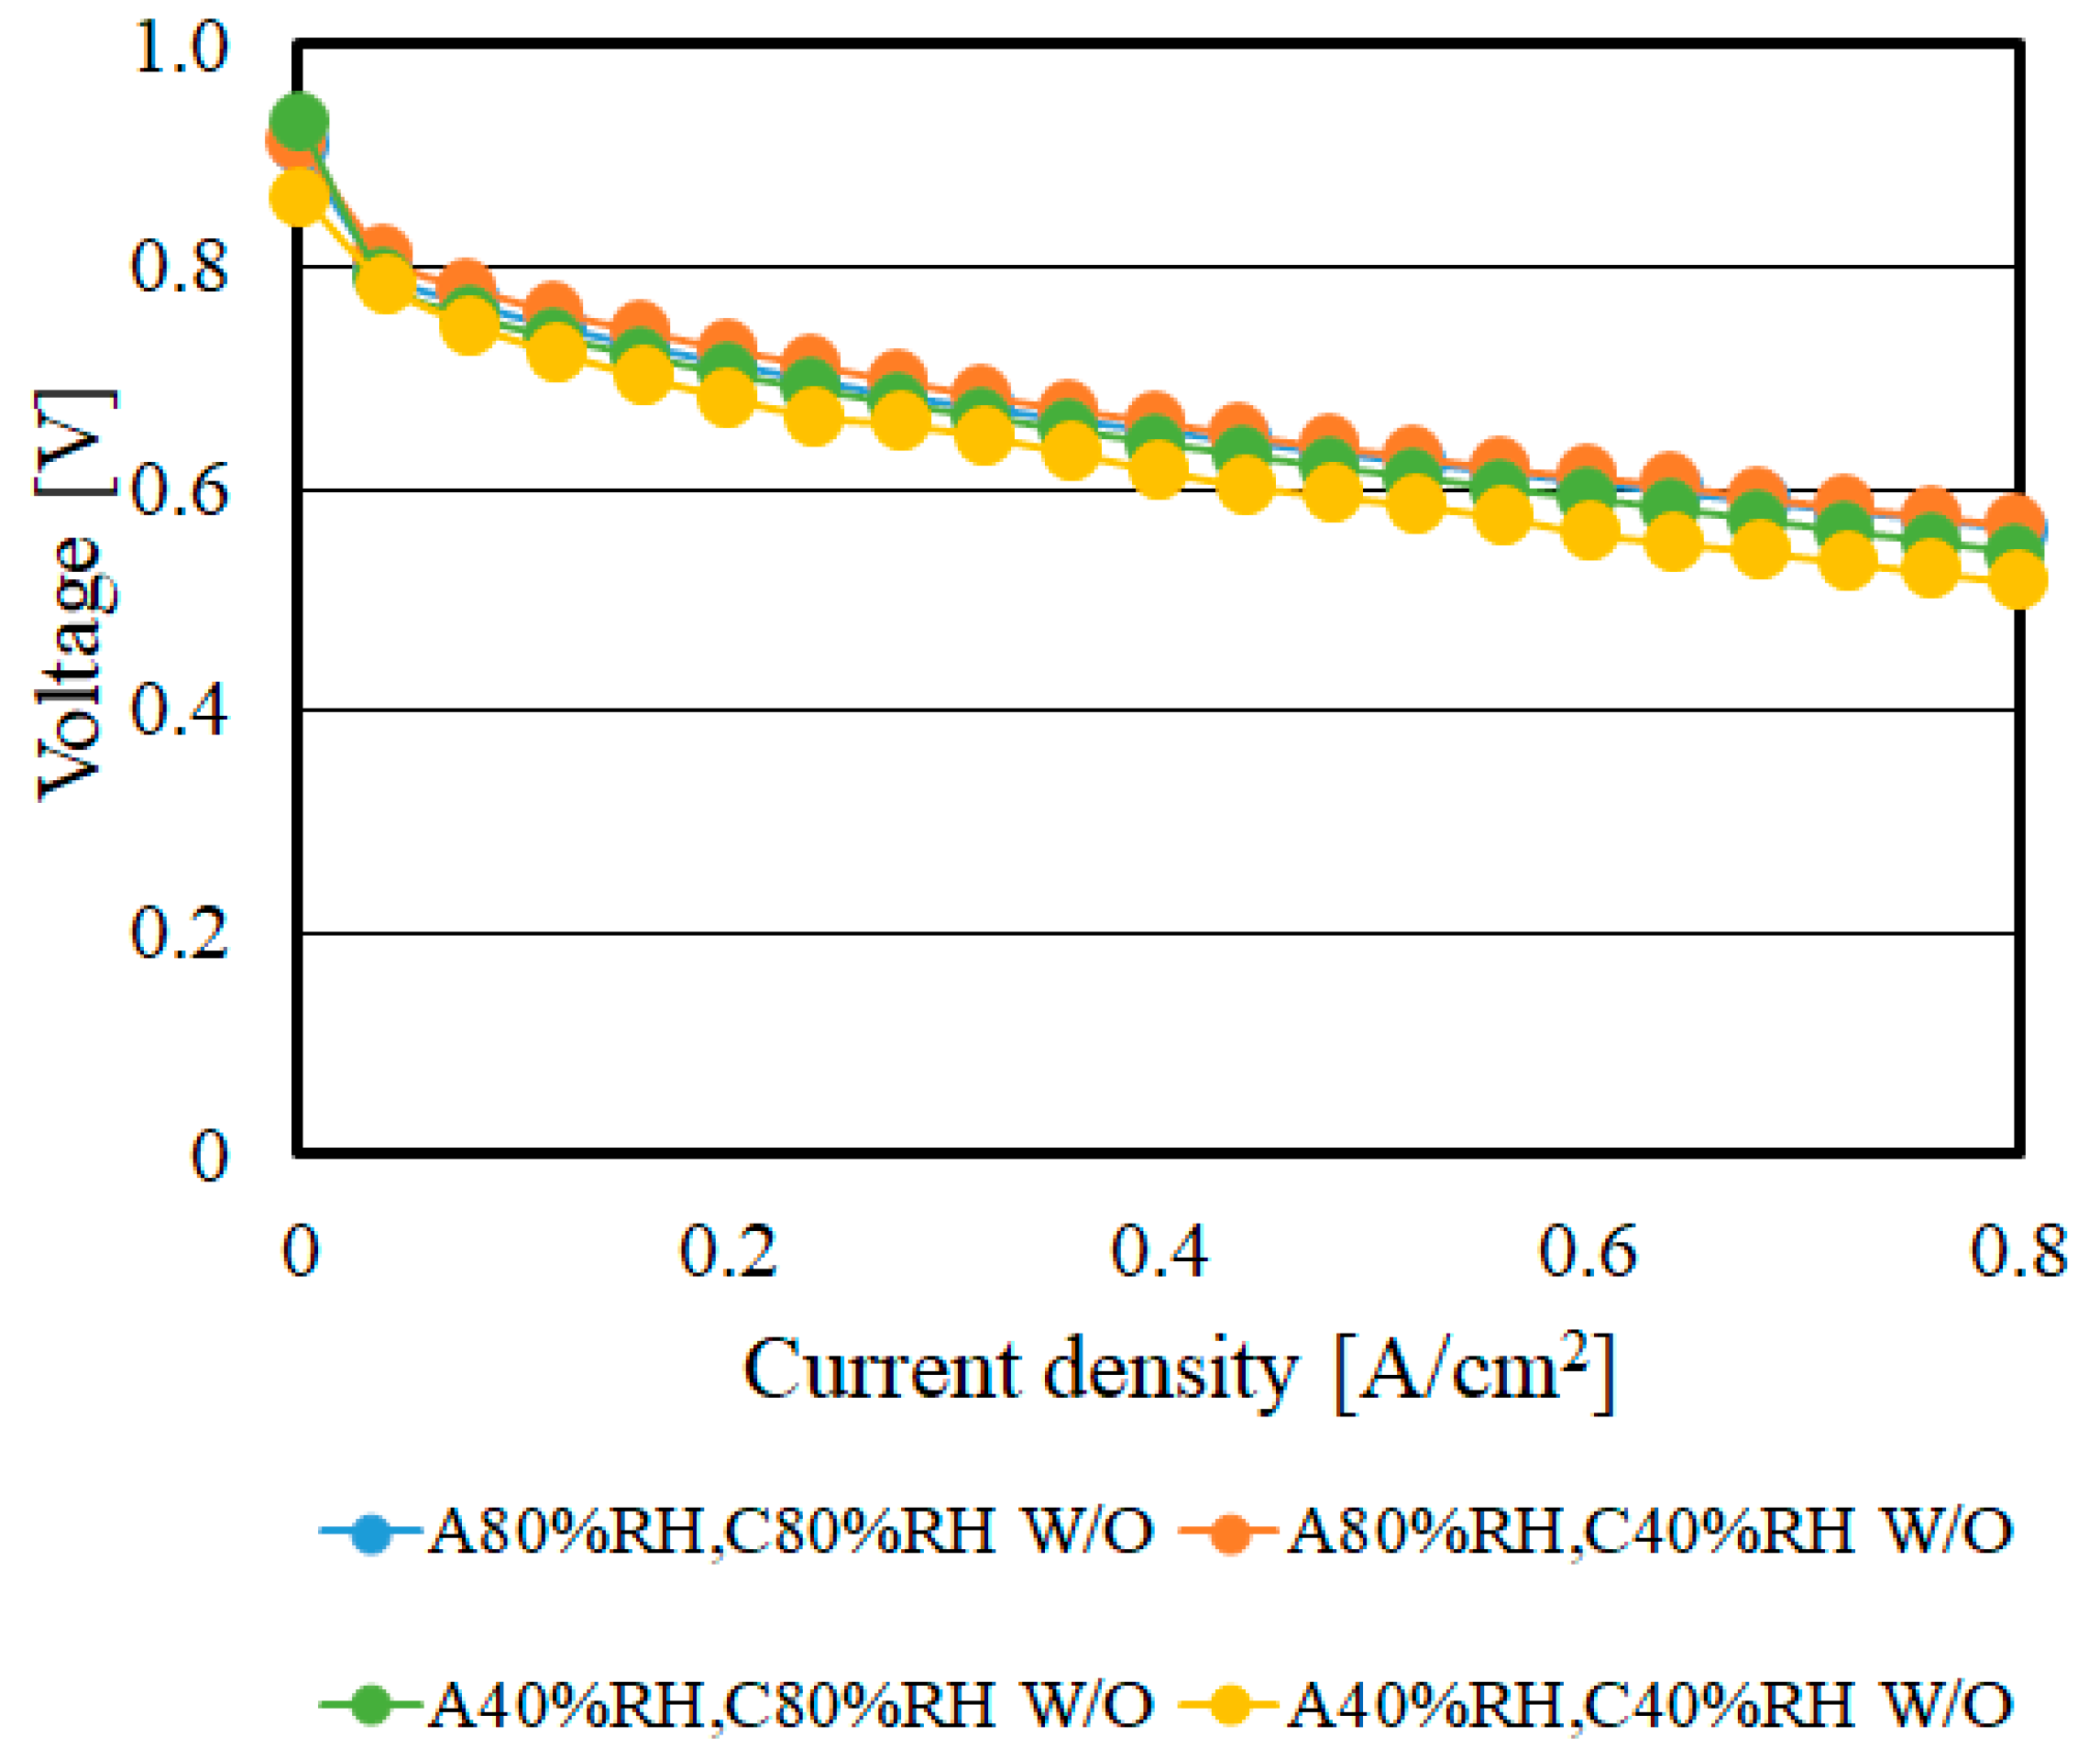
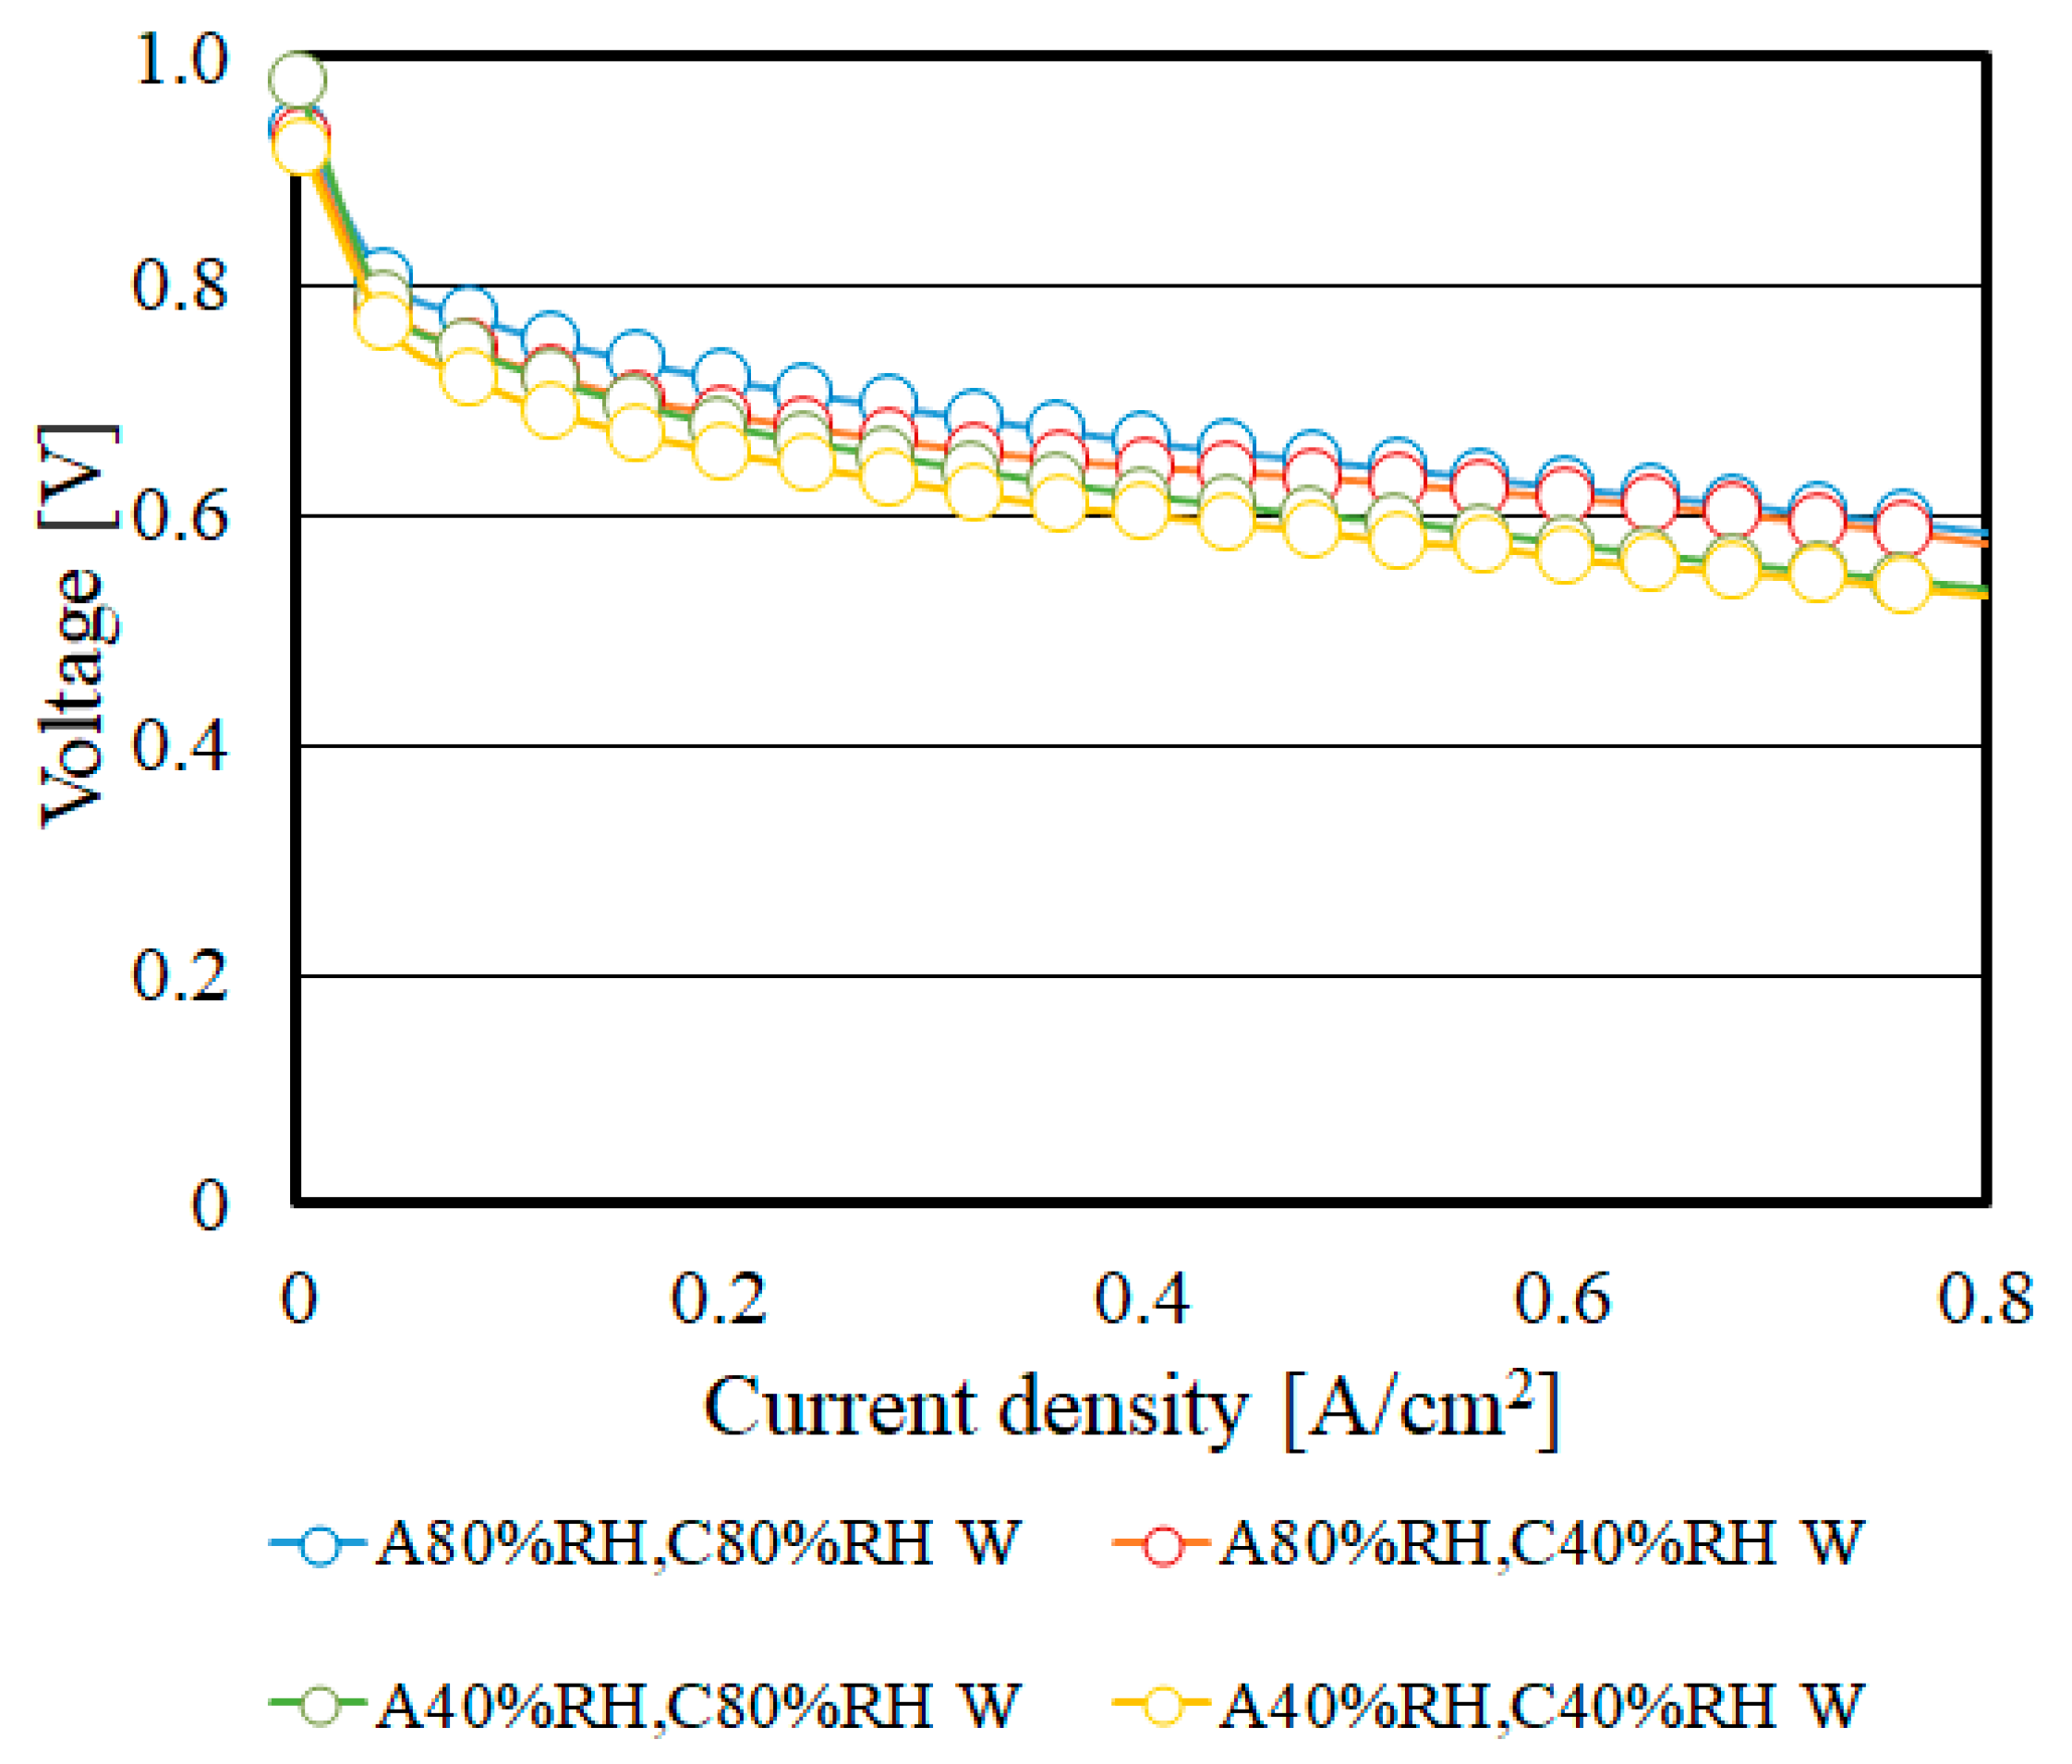
3.1. Impact of MPL on Power Generation Performance

Figure 4, Figure 5, Figure 6 and Figure 7 show the polarization curves with and without MPL in the case of Nafion 115 at Tini = 80 °C and 90 °C changing relative humidity, respectively. In these figures, the data at lower relative humidity, i.e., anode 40%RH and cathode 40%RH are not shown because the power generation is not conducted since H+ conductivity would be decreased and the ionomer in catalyst layer is dehydrated due to low humidity conditions [30], reducing H+ activity [31]. However, the previous study reported that MPL improves PEM hydration mainly due to the added mass transfer resistance to avoid water loss to the gas channel when the vapor pressure is much lower than its saturation pressure, which is a dry condition [22]. Therefore, the power generation was carried out for anode 40%RH and cathode 40%RH at Tini = 90 °C with MPL, whose data are shown in Figure 7. However, the power generation was not conducted under the same relative humidity and Tini condition without MPL since the water transfer for humidifying PEM would not be conducted well.
We can see from Figure 4, Figure 5, Figure 6 and Figure 7 that the power generation performance is enhanced by MPL irrespective of Tini and relative humidity condition. This improvement can be observed in ohmic and concentration resistance regions, and the difference between the polarization curves with MPL and that without MPL is larger at high current density under high relative humidity condition. It is easy for flooding to occur under this condition due to the promotion of generated water [22]. The water transfer by the function of MPL helps to prevent flooding. In addition, the water transfer, such as back diffusion and/or discharging water from cathode catalyst layer to GDL, might be promoted by MPL. As a result, the ohmic loss is reduced by PEM hydration [22,32]. Consequently, the power generation performance with MPL is better than without MPL.
Figure 8, Figure 9, Figure 10 and Figure 11 show the polarization curves with and without MPL using Nafion NRE-211 at Tini = 80 °C and 90 °C changing relative humidity, respectively. According to Figure 8, Figure 9, Figure 10 and Figure 11, the effect of MPL on power generation performance is not significant. Thinner PEM provides lower ohmic resistance, higher H+ flux ratio and back diffusion [16,17]. In general, the power generation performance is enhanced with MPL because the flooding in the catalyst layer is prevented with the aid of capillary pressure of pores in MPL [22]. The water can be removed from the cathode catalyst layer and moved to GDL at the cathode under high relative humidity conditions due to the function of MPL. On the other hand, MPL provides the water transfer from the catalyst layer at the cathode to the anode through PEM under low relative humidity conditions, e.g., at high current density [31]. When the thickness of PEM is thinner, the water transfer resistance of PEM is smaller. Therefore, the humidification of thin PEM is well even no MPL. Consequently, it is thought that the impact of MPL is influenced by the thickness of PEM.
It is observed from Figure 8 and Figure 10 that the step-like increase of voltage is occurred at the current density of approximately 0.3 A/cm2 for anode 40%RH and cathode 40%RH. It might be due to humidifying PEM by generated water as the loaded current increases. It is thought that this humidifying PEM is temporal since anode 40% and cathode 40% is a relatively dry condition in this study. Therefore, this step-like increase might be observed locally.
Table 3 lists ohmic resistance, activation and mass transfer resistance with and without MPL using Nafion 115 and Nafion NRE-211 at Tini = 80 °C and 90 °C changing relative humidity. These data were obtained at the current density of 0.80 A/cm2. It is seen from Table 3 that ohmic resistance, activation and mass transfer resistance using Nafion 115 are higher than those using Nafion NRE-211 irrespective of relative humidity condition and addition of MPL. In addition, it is known that ohmic resistance, activation and mass transfer resistance with MPL are approximately smaller than those with MPL irrespective of Tini and relative humidity condition. Consequently, it is revealed that thin PEM and MPL are effective to promote the gas and water transfer in the cell.

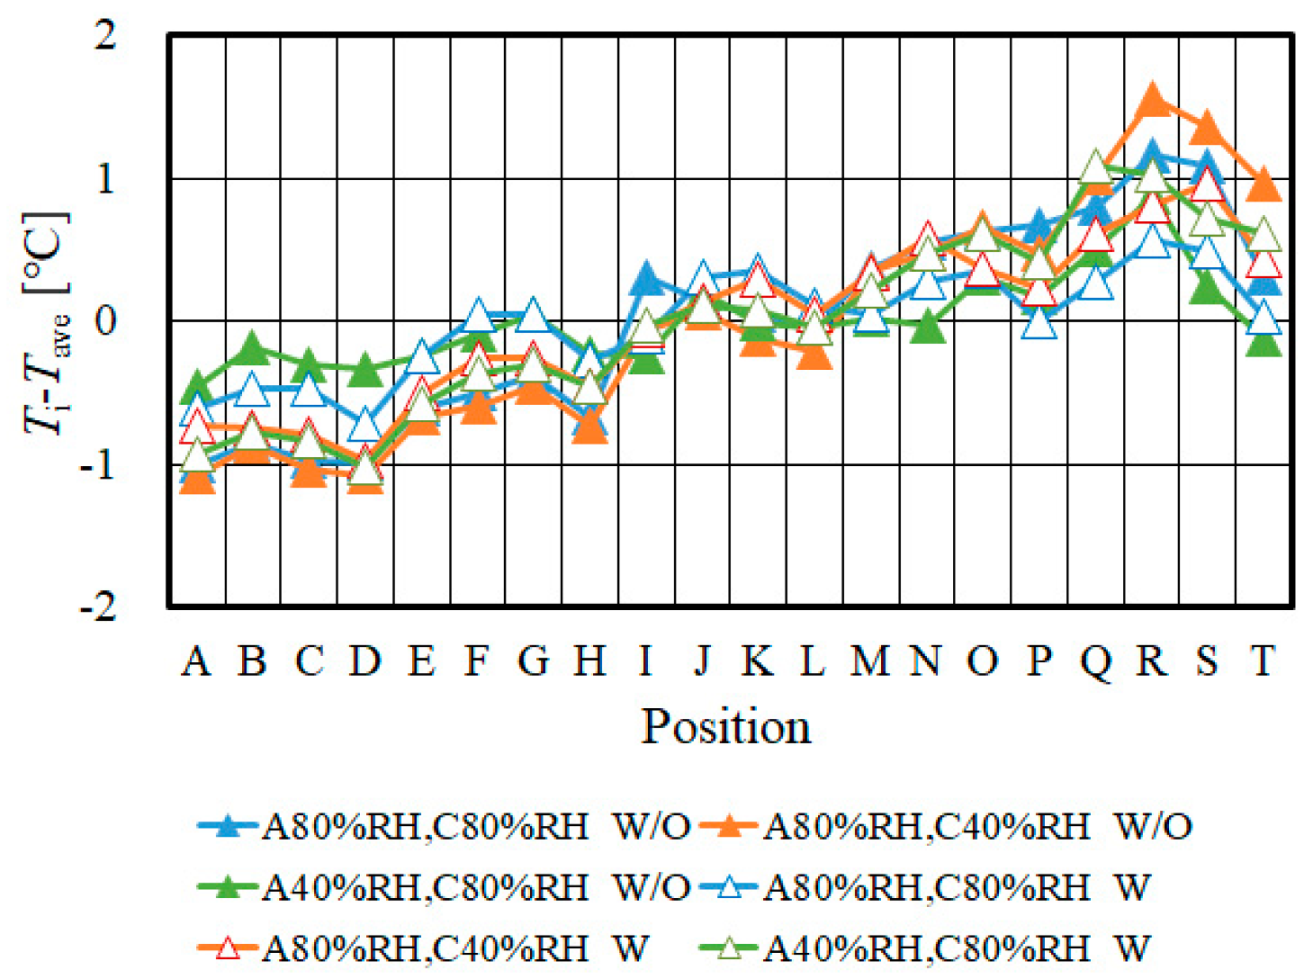
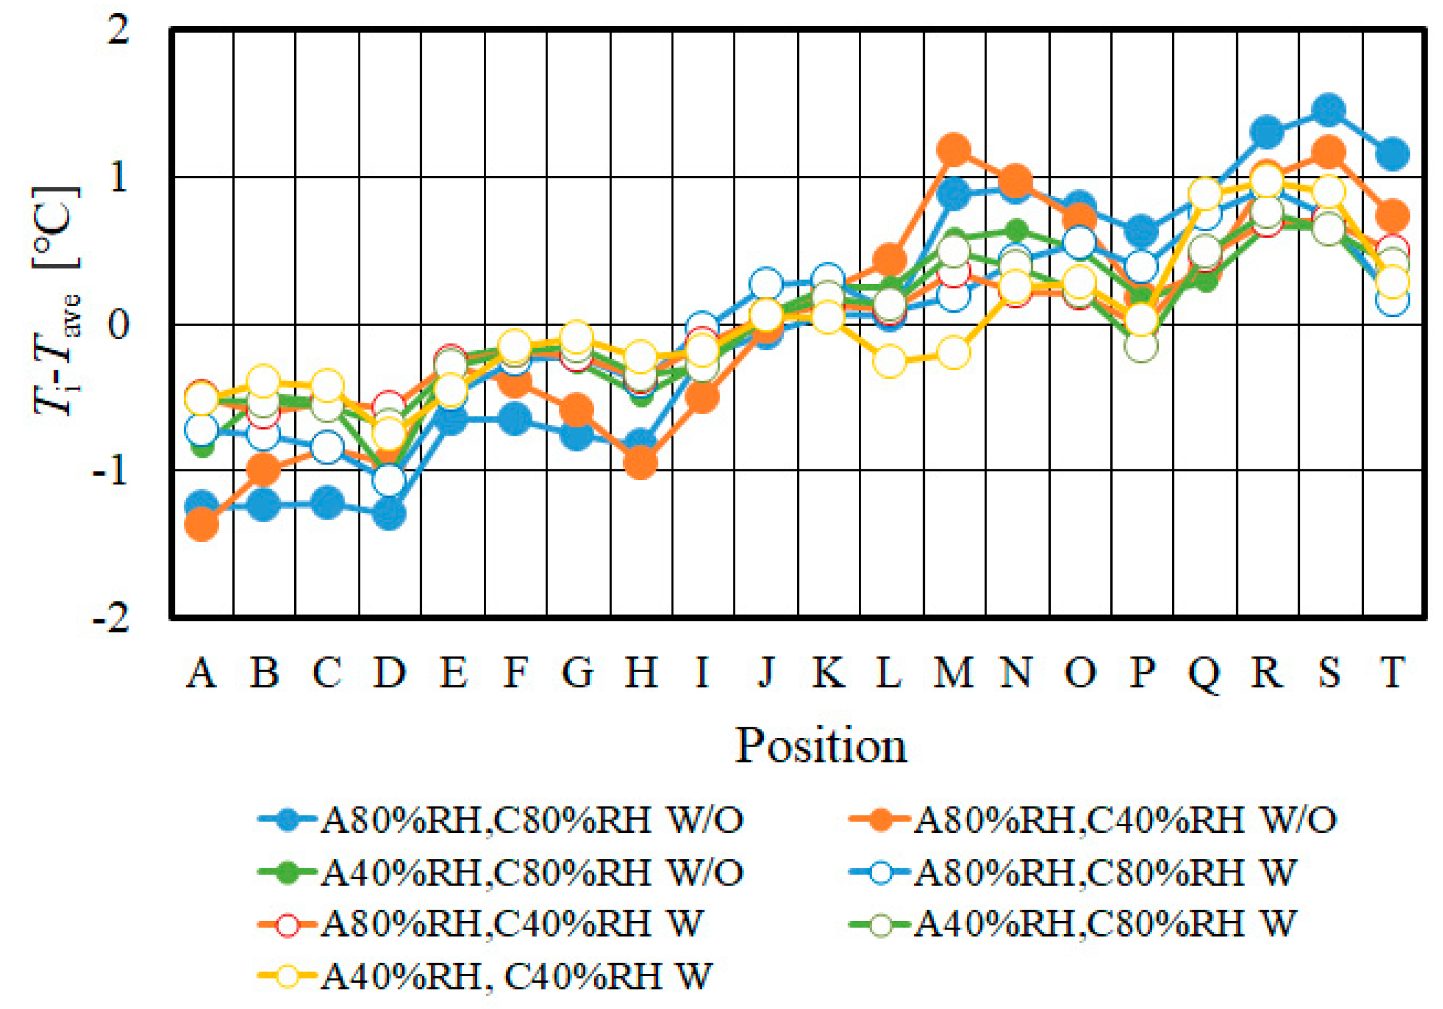
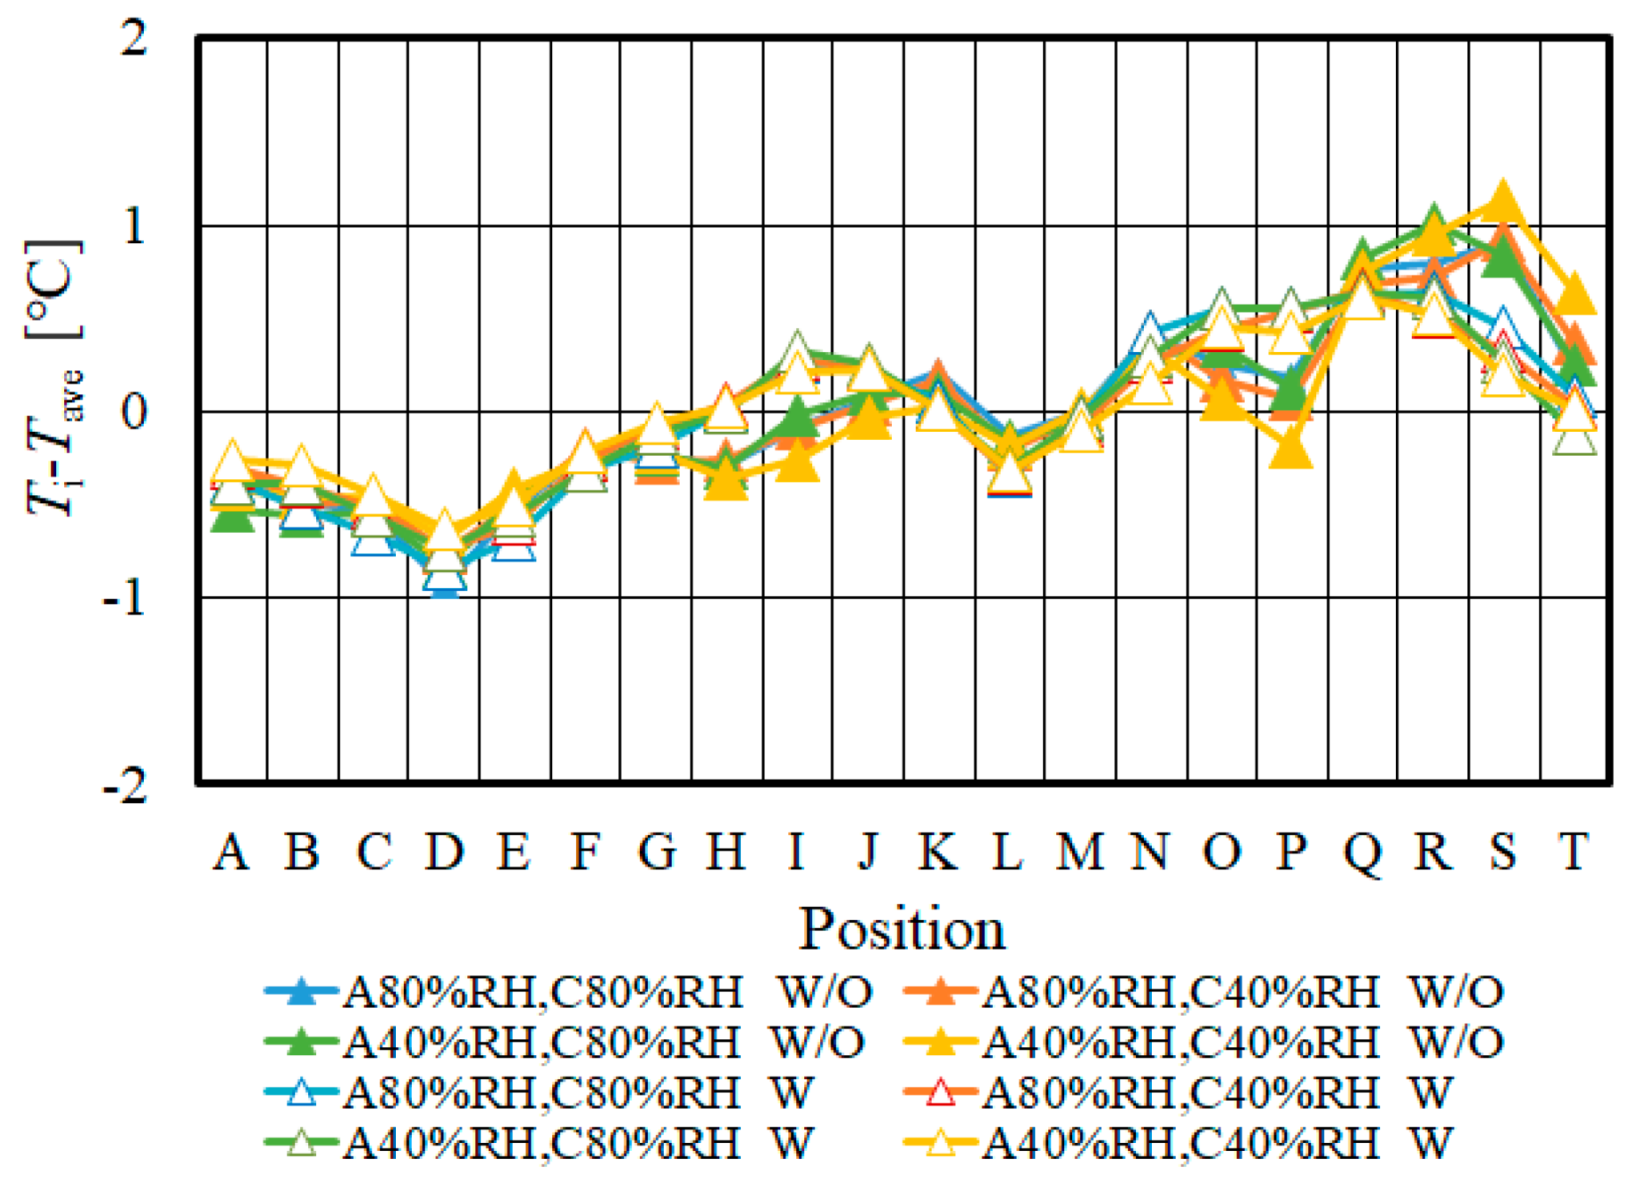
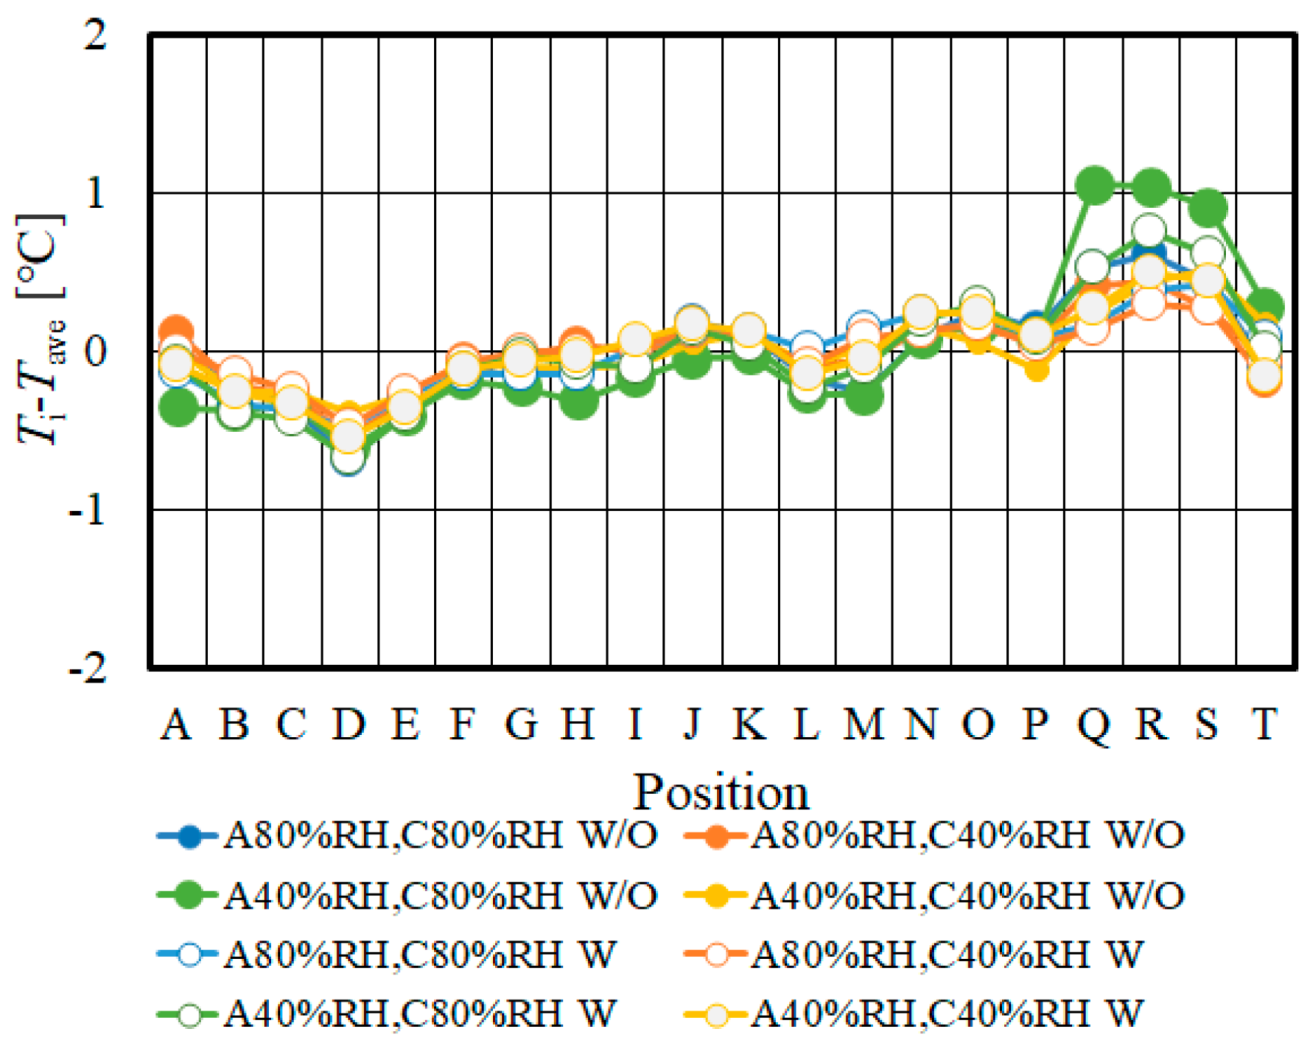
3.2. Impact of MPL on In-Plane Temperature Distribution

Figure 12 shows in-plane temperature distributions with and without MPL in the case of Nafion 115 at Tini = 80 °C changing relative humidity, respectively. As shown in these figures, as well as the other figures on in-plane temperature distributions, the temperature difference among several conditions is not extend beyond approximately 0.5 °C. As explained in Figure 1, the temperature resolution, which means the temperature difference guaranteeing the accuracy of measured temperature, is 0.1 °C. When measuring the temperature distribution by thermocamera, we confirmed the steady state of temperature distribution over 30 min. The local temperature was kept the same value under the steady state. Therefore, this temperature difference of approximately 0.5 °C is meaningful to discuss the heat and mass transfer characteristics in this study. It is obvious from Figure 12 that the temperature increases from inlet to outlet without MPL larger than that with MPL for anode 80%RH and cathode 80%RH as well as anode 80%RH and cathode 40%RH. The generated water is thought to be accumulated along the gas flow, causing the PEM to have been humidified well. Therefore, the temperature is increased by the heat generated in power generation since the ohmic loss would be decreased by humidifying PEM [15]. In the case of the other study simulating in-plane distribution of temperature, current density and water saturation in MEA considering serpentine gas flow field [33], it was reported that the temperature and water saturation increased along the gas flow from the inlet region to the outlet region, while the current density distribution was almost even. This numerical simulation was carried out at 70 °C. According to the other study simulating in-plane distribution of temperature, current density, water saturation in catalyst layer and GDL at the anode and the cathode by 2D model with two phase flow [34], it was reported that the water saturation increased in both electrodes as the current density increased. The water saturation was relatively high near the outlets in both electrodes. Additionally, the temperature increased along the gas flow at the cathode and decreased from the cathode to the anode through the membrane. This numerical simulation was carried out at 70 °C. It was afraid that the current density drops at the outlet by the concentration loss due to flooding in the case of high relative humidity condition, causing the decrease in temperature at the outlet. In this case, MPL might be effective since the water movement such as back diffusion and/or discharging water from the cathode catalyst layer to GDL is promoted by the function of MPL [22,32]. However, it is though that the liquid water would not be generated well near the outlet since we investigated under relatively high temperature condition. As a result, the effect of humidifying PEM is obtained mainly, causing the increase in temperature due to the decrease in the ohmic loss.
However, it is found in Figure 12 that the temperature increases from inlet to outlet with MPL larger than that without MPL for anode 40%RH and cathode 80%RH. For the anode low humidity condition, i.e., anode 40%RH and cathode 80%RH, the cell performance is influenced by the ohmic loss significantly, which is known to be closely associated with water content in the membrane [35]. Though it is thought that the back diffusion from the cathode to the anode might occur by the function of MPL [22,32] when the relative humidity at the cathode is higher compared to that at the anode [35], the back diffusion would not occur well in case of thick PEM. This is because the water transfer resistance of the thick PEM is large. The water in the cathode catalyst layer would transfer toward GDL by the function of MPL [22,32], which causes the dehydration of PEM and catalyst layer. Therefore, the temperature increase near the outlet is smaller since the ohmic loss becomes large. Consequently, it is thought that the in-plane temperature distribution with MPL is more uniform compared to without MPL.
In addition, it is seen from Figure 12 that the temperature decreases at the positions D, H, L and P. Since the positions H, L and P are at the corner of serpentine channel of separator, the liquid waters would have remained there [36,37,38]. Moreover, the accumulation of liquid water in GDL and the gas channel would have occurred [15]. Since the gas diffusion inhibition could be caused by retention of the liquid water at these positions, the PEFC power generation may decrease [13]. According to Ref [39], the cross flow of water in GDL might occur under the rib area. As a result, the power generation performance is promoted around the area due to the accumulation of liquid water [14]. As to the position D, it was comparable to the inlet of gas flow at the opposite side through the cell. Since its temperature is colder than the actual cell temperature, the temperature decreases [13].
Figure 13 shows the in-plane temperature distributions with and without MPL in the case of Nafion 115 at Tini = 90 °C changing relative humidity. As we can see in Figure 13, the temperature increases from inlet to outlet without MPL, larger than that with MPL for anode 80%RH and cathode 80%RH, as well as anode 80%RH and cathode 40%RH. The reason for these tendencies is thought to be the same as discussed in the case of Tini = 80 °C. However, it is known that the in-plane temperature distribution with MPL is almost the same as that without MPL for anode 40%RH and cathode 80%RH at Tini = 80 °C, while the temperature increases from inlet to outlet with MPL larger than that without MPL. For the low humidity condition, i.e., anode 40%RH and cathode 80%RH, the cell performance is mainly influenced by the ohmic loss, relating the water content in the membrane closely [35]. It can be believed that the back diffusion from the cathode to the anode would occur due to higher relative humidity at the cathode compared to the anode [35].
Figure 14 shows the in-plane temperature distributions with and without MPL in the case of Nafion NRE-211 at Tini = 80 °C changing relative humidity. It is revealed from Figure 14 that the temperature increases from inlet to outlet almost equally with and without MPL. Since Nafion NRE-211 is thin PEM, the power generation performance is promoted due to lower ohmic resistance, higher H+ flux ratio and back diffusion [16,17]. The generated water is thought to be accumulated along the gas flow, causing the PEM to have been humidified well. Therefore, the temperature increases since the power generation performance would be improved by humidifying PEM [15] even without MPL. However, it is found that the increase in temperature around the outlet i.e., the positions R, S without MPL, is larger than that with MPL irrespective of relative humidity condition. The generated water would be accumulated along the gas flow channel to the outlet more without MPL, compared to that with MPL. In addition, MPL can remove the excess water. Consequently, it is believed that the increase in temperature around the outlet i.e., the positions R, S without MPL is larger than that with MPL.
Figure 15 shows the in-plane temperature distributions with and without MPL in the case of Nafion NRE-211 at Tini = 90 °C changing relative humidity. Figure 15 shows that the temperature increases from inlet to outlet almost equally with and without MPL, which is similar to the tendency shown in Figure 14. It is clear that the thin PEM has more uniform in-plane temperature distribution compared to the thick PEM irrespective of Tini. Additionally, it can be revealed that the temperature around the outlet i.e., the positions R, S without MPL increases larger than that with MPL for anode 40%RH and cathode 80%RH. As described above, it is believed that the anode 40%RH and cathode 80%RH condition causes the back diffusion from the cathode to the anode easily. It is seen that there is little difference between the in-plane temperature distribution with MPL and that without MPL at Tini = 90 °C. Since thin PEM provides a good water transfer, the power generation performance is promoted due to humidifying PEM even no MPL. As a result, the similar in-plane temperature distribution is obtained for both conditions with MPL and without MPL.

3.3. Relationship between MPL and Temperature Distribution

According to the above discussions, the relationship between MPL and temperature distribution can be classified as follows: (1) When using thick PEM i.e., Nafion 115, the temperature distribution without MPL is larger than that with MPL for anode 80%RH and cathode 80%RH as well as anode 80%RH and cathode 40%RH, while the temperature distribution with MPL is larger than that without MPL for anode 40%RH and cathode 80%RH. It is thought that the water transfer between anode and cathode is not good, resulting that the function of MPL, which is enhancement of water transfer, might influence the temperature distributions under the anode or the cathode low relative humidity conditions.; (2) When using thin PEM i.e., Nafion NRE-211, the temperature distribution with MPL is similar to that with MPL. This is because thin PEM provides good water transfer, resulting that the power generation can be promoted even no MPL.
Table 4 lists the temperature gap between the maximum and average temperature of in-plane temperature distribution with and without MPL. It is seen in Table 4 that the temperature gap between the maximum and average temperature of in-plane temperature distribution with MPL is smaller than without MPL, irrespective of Tini and relative humidity condition. Though we can see the tendency that the temperature increases from inlet to outlet according to Figure 12, Figure 13, Figure 14 and Figure 15, it is revealed from Table 4 that the in-plane temperature distribution with MPL is narrower than that without MPL due to the function of MPL [22,32]. In addition, this effect of MPL on the in-plane temperature distribution is larger when using thick PEM. Since the water transfer resistance of thick PEM is large, the function of MPL [22,32] which causes the dehydration of PEM and catalyst layer is more effective.

3.4. Performance Evaluation on MPL at Higher Temperature Operation

In summary, the present study reveals that MPL is effective for the improvement of power generation performance of single PEFC operated at a high temperature such as 90 °C. The power generation performance is promoted with MPL significantly when using thick PEM. However, it is found that the in-plane temperature distribution with MPL is not even irrespective of thickness of PEM. According to the previous study by the authors [15], thin GDL was effective to unify in-plane temperature distribution operated at high temperature though MPL was not applied to GDL. Consequently, further study will investigate the impact of combination of thinner PEM and thinner GDL with MPL operated at high temperature on not only high power generation performance but also uniform in-plane temperature distribution in the near future. If the authors select the thinner PEM and GDL than the investigated types in this study, it would be thought that the better power generation performance and more uniform in-plane temperature distribution can be obtained due to lower ohmic resistance, higher H+ flux and back diffusion as well as better gas and water transfer [15,16].

4. Conclusions

The impact of MPL with various thicknesses of PEM on not only heat and mass transfer characteristics, but also power generation performance of the single PEFC in a high temperature range around 90 °C is herein investigated. Conclusions, as a result, are drawn as follows:
(1)
When the thick PEM, i.e., Nafion 115 was used, the power generation performance with MPL was better than without MPL, irrespective of Tini and relative humidity condition. This improvement can be observed in ohmic and concentration resistance regions, and the difference between the polarization curves with MPL and that without MPL is larger at high current density under a high relative humidity condition.
(2)
When the thin PEM, i.e., Nafion NRE-211 was used, the effect of MPL on power generation performance was not significant. It is believed due to good humidification of thin PEM.
(3)
When using thick PEM i.e., Nafion 115, the temperature distribution without MPL was larger than with MPL for anode 80%RH and cathode 80%RH, as well as anode 80%RH and cathode 40%RH, while the temperature distribution with MPL is larger than that without MPL for anode 40%RH and cathode 80%RH.
(4)
When using thin PEM i.e., Nafion NRE-211, the temperature distribution with MPL was similar to that with MPL.
(5)
This study finds that MPL is effective for the improvement in power generation performance of single PEFC operated at a high temperature, such as 90 °C. However, the in-plane temperature distribution with MPL is not uniform, irrespective of thickness of PEM.

Author Contributions

Conceptualization, A.N.; data curation, T.O. and Y.K.; supervision, M.H.; writing—original draft preparation, A.N.; writing—review and editing, E.H.; supervision, E.H. All authors have read and agreed to the published version of the manuscript.

Funding

This study was not funded.

Acknowledgments

This study was supported by Mie Industrial Research Institute.

Conflicts of Interest

The authors declare no conflict of interest.

References

  1. NEDO (New Energy and Industry Technology Development Organization). Available online: http://www.nedo.go.jp/content/100871973.pdf (accessed on 9 March 2020). (In Japanese).
  2. Zhang, G.; Kandlikar, S.G. A Critical Review of Cooling Technique in Proton Exchange Membrane Fuel Cell Stacks. Int. J. Hydrogen Energy 2012, 37, 2412–2429. [Google Scholar] [CrossRef]
  3. Agbossou, K.; Kolhe, M.; Hamelin, J.; Bose, T.K. Performance of a Stand-Alone Renewable Energy System Based on Energy Storage as Hydrogen. IEEE Trans. Energy Convers. 2004, 19, 633–640. [Google Scholar] [CrossRef]
  4. Li, Q.; He, R.; Jensen, J.O.; Bjerrum, N.J. Approaches and Recent Development Polymer Electrolyte Membrane for Fuel Cells Operating above 100 °C. Chem. Mater. 2003, 15, 4896–4915. [Google Scholar] [CrossRef] [Green Version]
  5. Lee, C.Y.; Wng, F.; Kuo, Y.W.; Tsai, C.H.; Cheng, Y.T.; Cheng, C.K.; Lin, J.T. In-situ Measurement of High-temperature Proton Exchange Membrane Fuel Cell Stack Using Flexible Five-in-one Micro Sensor. Sensors 2016, 16, 1731. [Google Scholar] [CrossRef] [PubMed] [Green Version]
  6. Tsuji, K.; Yamada, K.; Kamada, H. Development of High-Robust MEA for PEFC. Nenryou Denchi 2010, 10, 47–50. [Google Scholar]
  7. Wang, M.; Guo, H.; Ma, C. Temperature Distribution on the MEA Surface of a PEMFC with Serpentine Channel Flow Bed. J. Power Sources 2006, 157, 181–187. [Google Scholar] [CrossRef]
  8. Zhang, G.; Guo, L.; Ma, L.; Liu, H. Simultaneous Measurement of Current and Temperature Distributions in a Proton Exchange Membrane Fuel Cell. J. Power Sources 2010, 195, 3597–3604. [Google Scholar] [CrossRef]
  9. Ogawa, T.; Hohara, N.; Chikahisa, T.; Hishimura, Y. Observation of Water Production and Temperature Distribution in PEM Fuel Cell. In Proceedings of the 41st National Heat Transfer Symposium of Japan, Toyama, Japan, 26–28 May 2004; pp. 235–236. [Google Scholar]
  10. Ogawa, T.; Chikahisa, T.; Kikuta, K. Measurement of Fluctuating Distribution in PEFC Due to Produced Water. In Proceedings of the Thermal Engineering Conference, Kanazawa, Japan, 15–16 November 2003; pp. 483–484. [Google Scholar]
  11. Hakenjos, A.; Muenter, H.; Wittstadt, U.; Hebling, C. A PEM Fuel Cell for Combined Measurement of Current and Temperature Distribution, and Flow Field Flooding. J. Power Sources 2004, 131, 213–216. [Google Scholar] [CrossRef]
  12. Ogawa, T.; Hohan, N.; Chikahisa, T.; Hishimura, Y. Prospect of Water Production and Temperature Distribution in PEM Fuel Cell. Therm. Sci. Eng. 2004, 23, 93–94. [Google Scholar]
  13. Nishimura, A.; Yoshimura, M.; Mahadi, A.H.; Hirota, M.; Kolhe, M.L. Impact of Operation Condition on Temperature Distribution in Single Cell of Polymer Electrolyte Fuel Cell Operated at Higher Temperature than Usual. Mech. Eng. J. 2016, 3, 1–14. [Google Scholar] [CrossRef] [Green Version]
  14. Nishimura, A.; Yoshimura, M.; Kamiya, S.; Hirota, M.; Hu, E. Impact of Relatively Humidity of Supply Gas on Temperature Distributions in Single Cell of Polymer Electrolyte Fuel Cell when Operated at High Temperature. J. Energy Power Eng. 2017, 11, 706–718. [Google Scholar]
  15. Nishimura, A.; Kamiya, S.; Okado, T.; Sato, Y.; Hirota, M.; Kolhe, M.L. Heat and Mass Transfer Analysis in Single Cell of PEFC Using Different PEM and GDL at Higher Temperature. Int. J. Hydrogen Energy 2019, 44, 29631–29640. [Google Scholar] [CrossRef]
  16. Springer, T.E.; Zawodzinski, T.A.; Gottesfeld, D. Polymer Electrolyte Fuel Cell Models. J. Electrochem. Soc. 1991, 138, 2334–2341. [Google Scholar] [CrossRef]
  17. Penga, Z.; Tolj, I.; Barbir, F. Computational Fluid Dynamics Study of PEM Fuel Cell Performance for Isothermal and Non-uniform Temperature Boundary Conditions. Int. J. Hydrogen Energy 2016, 41, 17585–17594. [Google Scholar] [CrossRef]
  18. Devrim, Y.; Arica, E.D.; Albostan, A. Graphene Based Catalyst Supports for High Temperature PEM Fuel Cell Application. Int. J. Hydrogen Energy 2018, 43, 11820–11829. [Google Scholar] [CrossRef]
  19. Kannan, A.; Kaczerowski, J.; Kabza, A.; Scholta, J. Operation Strategies Based on Carbon Corrosion and Lifetime Investigations for High Temperature Polymer Electrolyte Membrane Fuel Cell Stacks. Fuel Cells 2018, 18, 287–298. [Google Scholar] [CrossRef]
  20. Bevilacqua, N.; George, M.G.; Galbiati, S.; Bazylak, A.; Zeis, R. Phosphoric Acid Invasion in High Temperature PEM Fuel Cell Gas Diffusion Layers. Electrochim. Acta 2017, 257, 89–98. [Google Scholar] [CrossRef]
  21. Molavian, M.R.; Abdolmaleki, A.; Tadavani, K.F.; Zhiani, M. A New Sulfonated Poly (Ether Sulfone) Hybrid with Low Humidity Dependence for High-temperature Proton Exchange Membrane Fuel Cell Applications. J. Appl. Polym. Sci. 2017. [Google Scholar] [CrossRef]
  22. Chen, G.; Zhang, G.; Guo, L.; Liu, H. Systematic Study on the Functions and Mechanisms of Micro Porous Layer on Water Transport in Proton Exchange Membrane Fuel Cells. Int. J. Hydrogen Energy 2016, 41, 5063–5073. [Google Scholar] [CrossRef]
  23. Zamel, N.; Becker, J.; Wiegmann, A. Estimating the Thermal Conductivity and Diffusion Coefficient of the Microporous Layer of Polymer Electrolyte Membrane Fuel Cells. J. Power Sources 2012, 207, 70–80. [Google Scholar] [CrossRef]
  24. Nanadegani, F.S.; Lay, E.N.; Sunden, B. Computational Analysis of the Impact of a Micro Porous Layer (MPL) on the Characteristics of a High Temperature PEMFC. Electrochim. Acta 2020, 333. [Google Scholar] [CrossRef]
  25. Liu, C.T.; Chang, M.H. Effects of Microporous Layer on PBI-based Proton Exchange Membrane Fuel Cell Performance. Int. J. Electrochem. Sci. 2013, 8, 3687–3695. [Google Scholar]
  26. DuPont. Available online: https://www.nafionstore.com/Shared/Bulletines/N115-N117-N1110.pdf (accessed on 22 April 2020).
  27. DuPont. Available online: https://www.fuelcellstore.com/spec-sheets/nafion-211-212-spec-sheet.pdf (accessed on 22 April 2020).
  28. Toray. Available online: https://www.torayca.com/lineup/composites/com_009_01.html (accessed on 22 April 2020). (In Japanese).
  29. Nishimura, A.; Zamami, K.P.; Yoshimura, M.; Hirota, M.; Kolhe, M.L. Numerical Analysis of Temperature Distributions in Single Cell of Polymer Electrolyte Fuel Cell when Operated in Elevated Temperature Range. J. Energy Power Eng. 2017, 11, 393–408. [Google Scholar] [CrossRef] [Green Version]
  30. Thomas, S.; Vang, J.R.; Araya, S.S.; Kar, S.K. Experimental Study to Distinguish the Effects of Methanol Slip and Water Vapour on a High Temperature PEM Fuel Cell at Different Operating Conditions. Appl. Energy 2017, 192, 422–436. [Google Scholar] [CrossRef]
  31. Ferreira, R.B.; Falcao, D.S.; Oliveira, V.B.; Pinto, A.M.F.R. Experimental Study on the Membrane Electrode Assembly of a Proton Exchange Membrane Fuel Cell: Effects of Microporous Layer, Membrane Thickness and Gas Diffusion Layer Hydrophobic Treatment. Electrochim. Acta 2017, 224, 337–345. [Google Scholar] [CrossRef]
  32. Zhou, J.; Shukla, S.; Putz, A.; Secanell, M. Analysis of the Role of the Microporous Layer in Improving Polymer Electrolyte Fuel Cell Performance. Electrochim. Acta 2018, 268, 366–382. [Google Scholar] [CrossRef]
  33. Rahimi-Esbo, M.; Ranjbar, A.A.; Ramiar, A.; Alizadeh, E.; Aghaee, M. Improving PEM Fuel Cell Performance and Effective Water Removal by Using a Novel Gas Flow Field. Int. J. Hydrogen Energy 2016, 41, 3023–3037. [Google Scholar] [CrossRef]
  34. Xing, L.; Du, S.; Chen, R.; Mamlouk, M.; Scott, K. Anode Partial Flooding Modeling of Proton Exchange Membrane Fuel Cells: Model Development and Validation. Energy 2016, 96, 80–95. [Google Scholar] [CrossRef] [Green Version]
  35. Kim, H.Y.; Kim, K. Numerical Study on the Effects of Gas Humidity on Proton-exchange Membrane Fuel Cell Performance. Int. J. Hydrogen Energy 2016, 41, 11776–11783. [Google Scholar] [CrossRef]
  36. Quan, P.; Zhou, B.; Sobiesiak, A.; Liu, Z. Water Behavior in Serpentine Micro-channel for Proton Exchange Membrane Fuel Cell Cathode. J. Power Sources 2005, 152, 131–145. [Google Scholar] [CrossRef]
  37. Quan, P.; Lai, M.C. Numerical Study of Water Management in the Air Flow Channel of a PEM Fuel Cell Cathode. J. Power Sources 2007, 164, 222–237. [Google Scholar] [CrossRef]
  38. Jiao, K.; Park, J.; Li, X. Experimental Investigations on Liquid Water Removal from the Gas Diffusion Layer by Reactant Flow in PEM Fuel Cell. Appl. Energy 2010, 87, 2770–2777. [Google Scholar] [CrossRef]
  39. Antonacci, P.; Chevalier, S.; Lee, J.; Ge, N.; Hinebaugh, J.; Yip, R.; Tabuchi, Y.; Kotaka, T. Balancing Mass Transport Resistance and Membrane Resistance when Tailoring Microporous Layer Thickness for Polymer Electrolyte Membrane Fuel Cells Operating at High Current Densities. Electrochim. Acta 2016, 188, 888–897. [Google Scholar] [CrossRef]
Figure 1. Polymer Electrolyte Fuel Cell (PEFC) structure to measure temperature using thermocamera.
Energies 13 02499 g001
Figure 2. Schematic diagram of experimental set-up.
Energies 13 02499 g002
Figure 3. Illustration to divide the temperature image.
Energies 13 02499 g003
Figure 4. Comparison of polarization curves without MPL in the case of Nafion 115 at Tini = 80 °C changing relative humidity.
Energies 13 02499 g004
Figure 5. Comparison of polarization curves with MPL in the case of Nafion 115 at Tini = 80 °C changing relative humidity.
Energies 13 02499 g005
Figure 6. Comparison of polarization curves without MPL in the case of Nafion 115 at Tini = 90 °C changing relative humidity.
Energies 13 02499 g006
Figure 7. Comparison of polarization curves with MPL in the case of Nafion 115 at Tini = 90 °C changing relative humidity.
Energies 13 02499 g007
Figure 8. Comparison of polarization curves without MPL in the case of Nafion NRE-211 at Tini = 80 °C changing relative humidity.
Energies 13 02499 g008
Figure 9. Comparison of polarization curves with MPL in the case of Nafion NRE-211 at Tini = 80 °C changing relative humidity.
Energies 13 02499 g009
Figure 10. Comparison of polarization curves without MPL in the case of Nafion NRE-211 at Tini = 90 °C changing relative humidity.
Energies 13 02499 g010
Figure 11. Comparison of polarization curves with MPL in the case of Nafion NRE-211 at Tini = 90 °C changing relative humidity.
Energies 13 02499 g011
Figure 12. In-plane temperature distribution with and without MPL in the case of Nafion 115 at Tini = 80 °C changing relative humidity.
Energies 13 02499 g012
Figure 13. In-plane temperature distribution with and without MPL in the case of Nafion 115 at Tini = 90 °C changing relative humidity.
Energies 13 02499 g013
Figure 14. In-plane temperature distribution with and without MPL in the case of Nafion NRE-211 at Tini = 80 °C changing relative humidity.
Energies 13 02499 g014
Figure 15. In-plane temperature distribution with and without MPL in the case of Nafion NRE-211 at Tini = 90 °C changing relative humidity.
Energies 13 02499 g015
Table 1. Specification of PEFC parts.
PartsSizeCharacteristics
Polymer electrolyte membrane (PEM)50.0 mm × 50.0 mm, thickness: 0.127, 0.025 mmNafion 115, Nafion NRE-211 (manufacture: DuPont Corp.)
Catalyst layer50.0 mm × 50.0 mm (fitted on PEM)Carbon with loaded Pt (Pt: 20 wt%.)
Micro porous layer (MPL)50.0 mm × 50.0 mm, thickness: 0.003 mmCarbon black + PTFE
Gas diffusion layer (GDL)50.0 mm × 50.0 mm, thickness: 0.19 mmTGP-H-060 (manufacture: Toray Corp.)
Gas separator75.4 mm × 75.4 mm, thickness: 2.00 mm (Gas supply area is 50.0 mm × 50.0 mm.)Produced by carbon graphite; Serpentine flow
Hot water passage plate75.4 mm × 75.4 mm, thickness: 2.00 mmProduced by carbon graphite
Current collectorPower generation area: 6937 mm2, thickness: 2.00 mmProduced by copper coated with gold
End block110 mm × 110 mm, thickness: 12.7 mmProduced by alumina
Table 2. Experimental conditions.
Initial temperature of cell (Tini) (°C)80, 90
Loaded current (A) (Current density (A/cm2))0–20 (0–0.80)
Inflow gases conditions
AnodeCathode
CharacteristicsH2 (purity: 99.995 vol%)O2 (purity: 99.995 vol%)
Temperature of inflow gas (°C)80, 9080, 90
Relative humidity of inflow gas (%RH)40, 8040, 80
Pressure of inflow gas (absolute) (MPa)0.40.4
Flow rate of inflow gas (NL/min) (Stoichiometric ratio (-))0.210, 0.280, 0.420 (1.5, 2.0, 3.0)0.105, 0.140, 0.210 (1.5, 2.0, 3.0)
Table 3. Comparison of ohmic resistance, activation and transfer resistance.
Ohmic resistance (mΩ)
Tini (°C)8090
PEMNafion 115Nafion NRE-211Nafion 115Nafion NRE-211
MPLWW/OWW/OWW/OWW/O
A80%RH, C80%RH4.258.933.062.984.158.813.063.32
A80%RH, C40%RH4.739.043.379.054.558.693.583.16
A40%RH, C80%RH5.3310.933.613.134.588.803.723.46
Activation and mass transfer resistance (mΩ)
Tini (°C)8090
PEMNafion 115Nafion NRE-211Nafion 115Nafion NRE-211
MPLWW/OWW/OWW/OWW/O
A80%RH, C80%RH4.115.994.6111.724.286.385.1712.38
A80%RH, C40%RH4.235.664.938.214.175.295.546.59
A40%RH, C80%RH4.175.485.397.454.376.204.945.16
Table 4. Comparison of the temperature gap between the maximum and average temperature of in-plane temperature distribution with and without MPL.
Tini (°C)8090
PEMNafion 115Nafion NRE-211Nafion 115Nafion NRE-211
MPLWW/OWW/OWW/OWW/O
A80%RH, C80%RH0.71.20.90.91.01.50.50.7
A80%RH, C40%RH1.01.60.70.90.71.30.50.5
A40%RH, C80%RH1.10.90.71.00.70.80.71.0
A40%RH, C40%RHN/AN/A0.71.11.0N/A0.50.5

