A Cost-Effective and Transferable Methodology for Rooftop PV Potential Assessment in Developing Countries

1
Institute for Industrial Production, Karlsruhe Institute of Technology, 76187 Karlsruhe, Germany
2
Energy Systems Analysis, Sustainability Division, Department of Technology, Management and Economics, Technical University of Denmark, 2800 Kgs. Lyngby, Denmark
*
Author to whom correspondence should be addressed.
Energies 2020, 13(10), 2501; https://0-doi-org.brum.beds.ac.uk/10.3390/en13102501
Submission received: 31 March 2020
/
Revised: 6 May 2020
/
Accepted: 9 May 2020
/
Published: 15 May 2020
(This article belongs to the Special Issue Analysis of Solar Photovoltaic Self-Consumption)
Abstract
:The efficient uptake of decentralized solar rooftop photovoltaics (PV) is in some cases hindered by ineffective energy and political framework conditions. These may be based on inaccurate and uncertain potential assessments in the early development stage of the solar market. This paper develops a more accurate, cost-effective, and robust potential assessment for emerging and developing economies. Adjusting the module efficiency corresponding to regional and household conditions improves the output accuracy. The rooftop PV market changes are simulated regarding different input changes and policy designs, including changing the Feed-In Tariff (FIT), grid tariff, and technology development. In the case study, the market potential in Vietnam is estimated at 260–280 TWh/a and is clustered into six groups in priority order, in which Hanoi and Ho Chi Minh need the most policy focus. Changing the FIT from 8.83 to 9 Euro cent/kWh and using different regional FITs can activate an additional 16% of the market and lead to a possible 28 million Euro benefit. Increasing the grid tariff to 8.7 cents/kWh could activate the self-consumption model, and the self-sufficient market can be guaranteed in the case of CAPEX and OPEX being lower than 650 Euro/kWp. Future developments of the method should focus on combining this top-down method with detailed bottom-up approaches.
1. Introduction
Renewable energy technologies have gained momentum in cost competition with conventional thermal electricity generation and have become significant in the global electricity transition. They had a share of 14% in global electricity generation by 2018, with around 53% of all renewable energy investments in developing and emerging economies [1]. In the countries concerned, distributed solar PV systems not only play a prominent role in spreading energy access to households in remote areas [1] but also promise an effective alternative to serving the highly increased urban electricity demand [2,3,4].
Many sub-national governments have become leaders of solar development by setting even more ambitious targets than their national counterparts [1]. However, national and local governments in the countries are dependent on generic rooftop PV assessments. These assessments often have a rather low accuracy, which could direct investors into suboptimal locations and configurations [5,6]. As a result, the diffusion of PV power projects is spatially heterogeneous between the different regions in a country [7,8,9]. If the development goes in one direction only, this could have a far-reaching impact on both grid and market congestion [9,10,11,12]. To avoid this, policymakers urgently need a superior method to provide their market with transparent targets and stable policies so that the market will continue growing without threatening the stability of national electricity systems.
Previous studies focus on investigating rooftop areas for solar PV with many different methodologies such as GIS [13,14,15,16,17], 3D models [18,19,20], and LIDAR technology [16,19,21,22,23]. The 3D model is the most advanced and accurate method that allows the digitization of features, followed by simulations of insolation and shading of buildings [5,18,19,20,21]. However, it is challenging to employ this approach at the national level in developing countries because their data conditions and financial budgets will take years to reach the sufficiency for 3D model estimation.
In this context, this paper proposes an accurate, cost-effective, and transferable potential assessment method with a geostatistical approach across cities to assist policymakers in assessing their local and national rooftop PV potential. The proposed method is suitable for application in a country with unfavorable data conditions and a meager investment budget for conducting a high-resolution assessment. To improve the accuracy of the technical assessment, this paper adjusts solar irradiation and corrects the module efficiency of the PV system corresponding to the geographic and climate conditions, as well as dwelling design. A novel approach to control model accuracy is introduced by identifying and classifying the impact level of the uncertain parameters used in this paper. Considering the findings, we build different scenarios to observe market reactions as a result of various technological, investment, and policy changes. The paper comprehensively presents a three-step model, which is instantly applicable to different levels of detail of rooftop PV potential assessment and policy design, such as sub-regional, regional, and national scales. This model is used for deploying the rooftop PV potential strategically, and for preventing aggressive local development and structure-inherent rooftop PV conflicts between different regions. The results provide a more realistic picture of the medium-term growth and the interaction of various impacts, e.g., technology and policy changes, on the rooftop PV market in the considered country.
The paper is structured into six sections. Section 2 provides a succinct comparison between different levels of spatial resolution techniques and points out the advantages of our methodology. The detailed method is described in Section 3, including the methodology flow chart, methods for geographical, technical, and economic potential assessments as well as the case study. Section 4 reports the study results, and Section 5 contains the discussion and suggestions for policymakers based on shifting and bending market distribution under different possible framework conditions. The final section is the conclusion and outlook.
2. Literature Review of Potential Assessments for Rooftop PV
The studies of photovoltaic energy potential assessment can be categorized into three groups: low-, medium-, and high-level spatial resolution techniques [24,25]. Low-level assessment is usually based on statistical data, which are supposed to be homogeneous throughout the investigated area [24,26]. It can be employed on a large scale, e.g., many cities all around the world, based on the correlation between solar insolation and population density. However, due to the uneven distribution of population and buildings between different areas, this type of assessment provides poor quality and inaccurate results due to the general assumptions.
The existing medium-resolution assessment is claimed to be inaccurate for tailored policy designs [24]. Because they are faced with the uncertainty caused by using many assumptions due to data deficiency [27], their outputs tend to vary widely from 16% to 207% when compared with other resolution assessments over the same geographies [5,6]. To conquer the uncertain and applicable issues, studies in this field usually focus on developing high-level assessments on a small scale, e.g., for buildings [18,21,22] or district(s) [5], to avoid inaccurate results. When studying a larger scale, e.g., at city-level or multi-cities level, researchers are limited to estimating only geographic potential based on different assumptions such as roof area available [15,26,28,29], land use data [8,26], and type of building [26]. Some studies investigate the technical potential [14,16,30], but detailed uncertainty analyses to measure the error are not covered.
To calculate a high-resolution PV potential, previous studies have used advanced and accurate technologies such as 3-D models to calculate geometry, insolation, and shading of buildings [5,18,19,20,21]. Even though the methods are more precise, the main barrier to employing them at national and international scales is the associated challenge of an exponentially increasing number of uncertain parameters with an increase in the sample size or studied space. This leads to computationally intensive models and expensive data collection [25], especially for 3D models [18,19,20] or solar detective models [31]. Therefore, these methods are not currently economically viable for developing countries [24,27].
This paper provides a less costly and more accurate solution that is able to cover a large scale by estimating rooftop PV potential for each region corresponding to its climatic, geographic, and demographic conditions. The available roof for installing solar PV and the expected electricity production are calculated based on housing characteristics such as the type of roof, the azimuth of the building, and the roof. Statistical data and previous research results are used to determine housing architecture. Uncertainty in the data coming from the natural variability of the data generating, measuring, and sampling processes is then simulated by using an iterative process. The results of the simulation are the output distributions (Section 5.3). The details of the method are presented in Section 3.
3. Methodology for Rooftop PV Potential Assessment
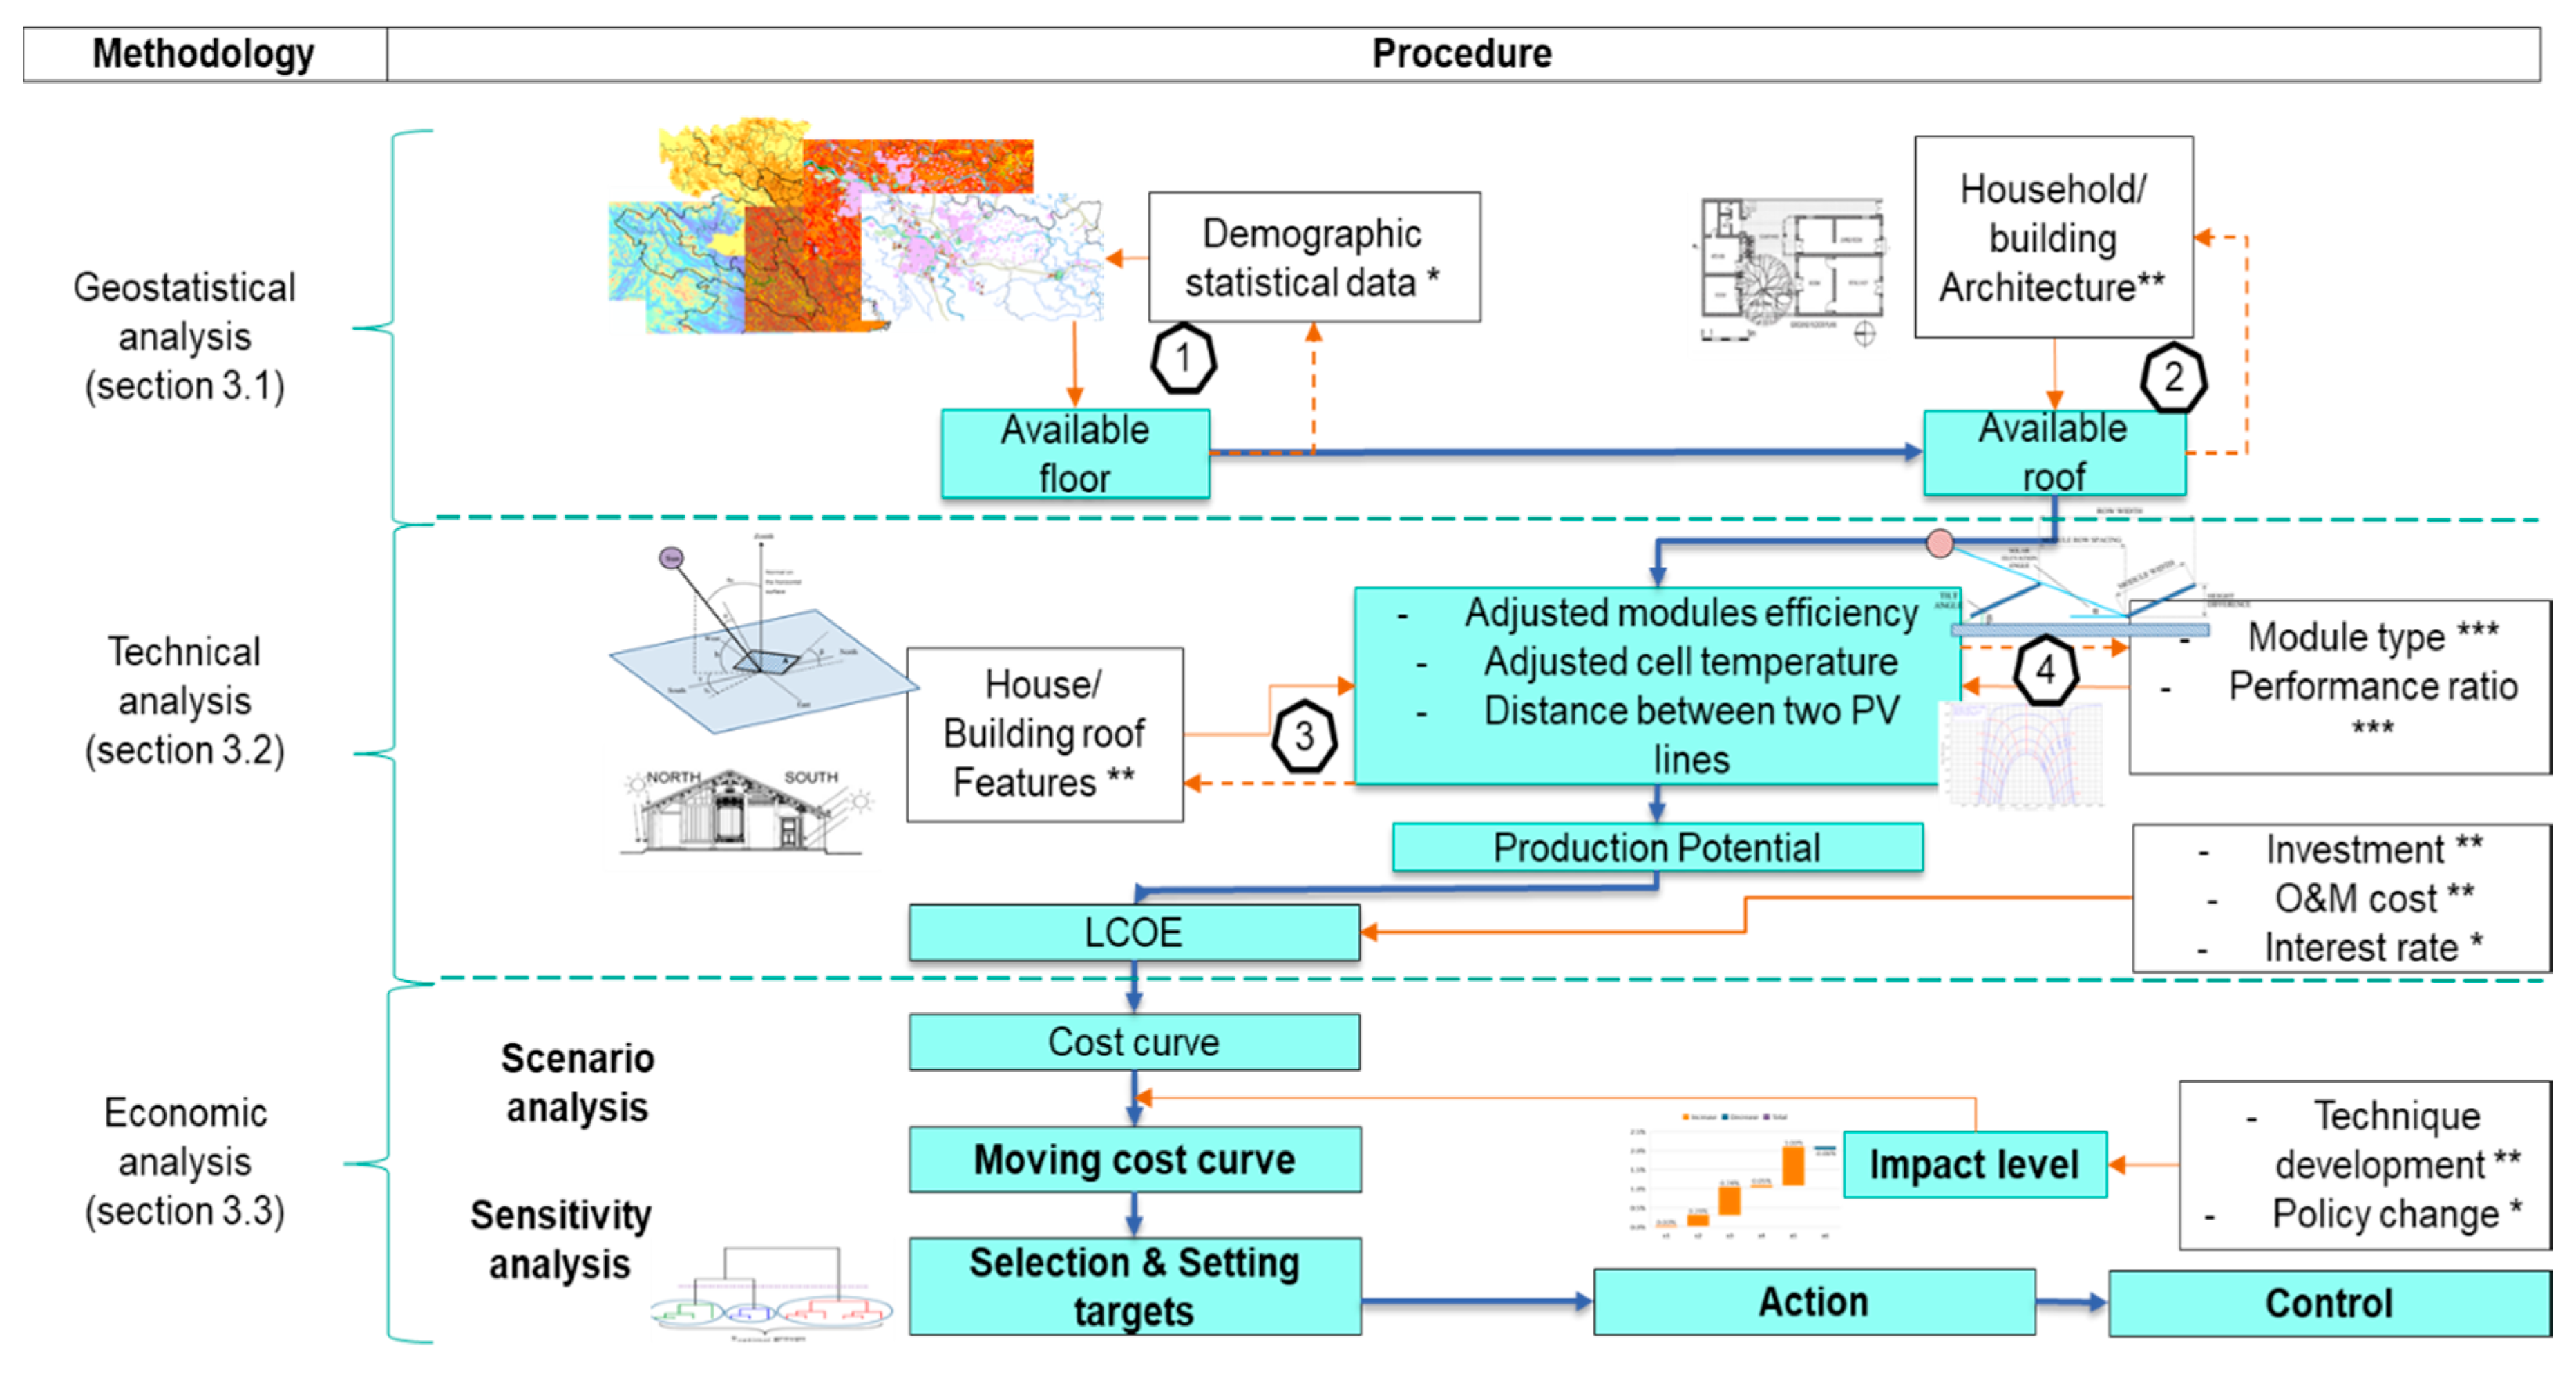
Figure 1 describes the method of PV potential assessment proposed in this paper. The outputs of each step are highlighted in blue, and the dark blue arrows show the direction of the mathematical flow. Input data are collected from (*) national/international statistical sources, (**) the assumptions based on previous studies, and/or (***) a collection from manufacturers’ catalogues. The iterative process to create datasets are represented by orange arrows. There are in total four different loops numbered in Figure 1.
The method proposed in the paper consists of three steps. The first step is determining the geographical potential using ArcGis and geostatistical analysis (Section 3.1), which is proposed in previous studies [25]. The second step is identifying the technical potential (Section 3.2), in which the authors improve the assessment accuracy by determining the electricity output of the solar cell regarding the expected operating temperature of the PV module and the corresponding solar cell efficiency for the specific considered region. The last step is the economic and sensitivity analyses (Section 3.3). Section 4 presents data, assumptions and results for our case study, which is used to illustrate the methodology proposed.
3.1. Geographical Potential
In the case of unavailable high-resolution street maps, household data from government statistical offices can be used to calculate the available roof area for PV installation (m2) for detached houses and apartment buildings. Equation (1) is suggested based on previous studies [25].
The total roof area, (m2), is calculated by subtracting the exterior area, (percent of total roof area), such as garden, back yard, etc., and adding the interior area, (percent of total roof area), such as stairway, corridors, etc. for an apartment building, to the ground area of a household (m2). For apartment buildings, is the average number of apartments, , in a building on one floor, .
The available roof for installing rooftop PV, (m2), is determined by multiplying the total roof area, (m2), with the utilization factor, (%), which is a percentage of the roof area that can be used for PV installations. The factor excludes the utilized area of antennas, chimneys, HVAC systems, and unusable area such as shades from the total roof area, (m2). It can be identified based on national statistical data of household architecture or based on previous studies [25]. is the average house/building roof slope (degrees).
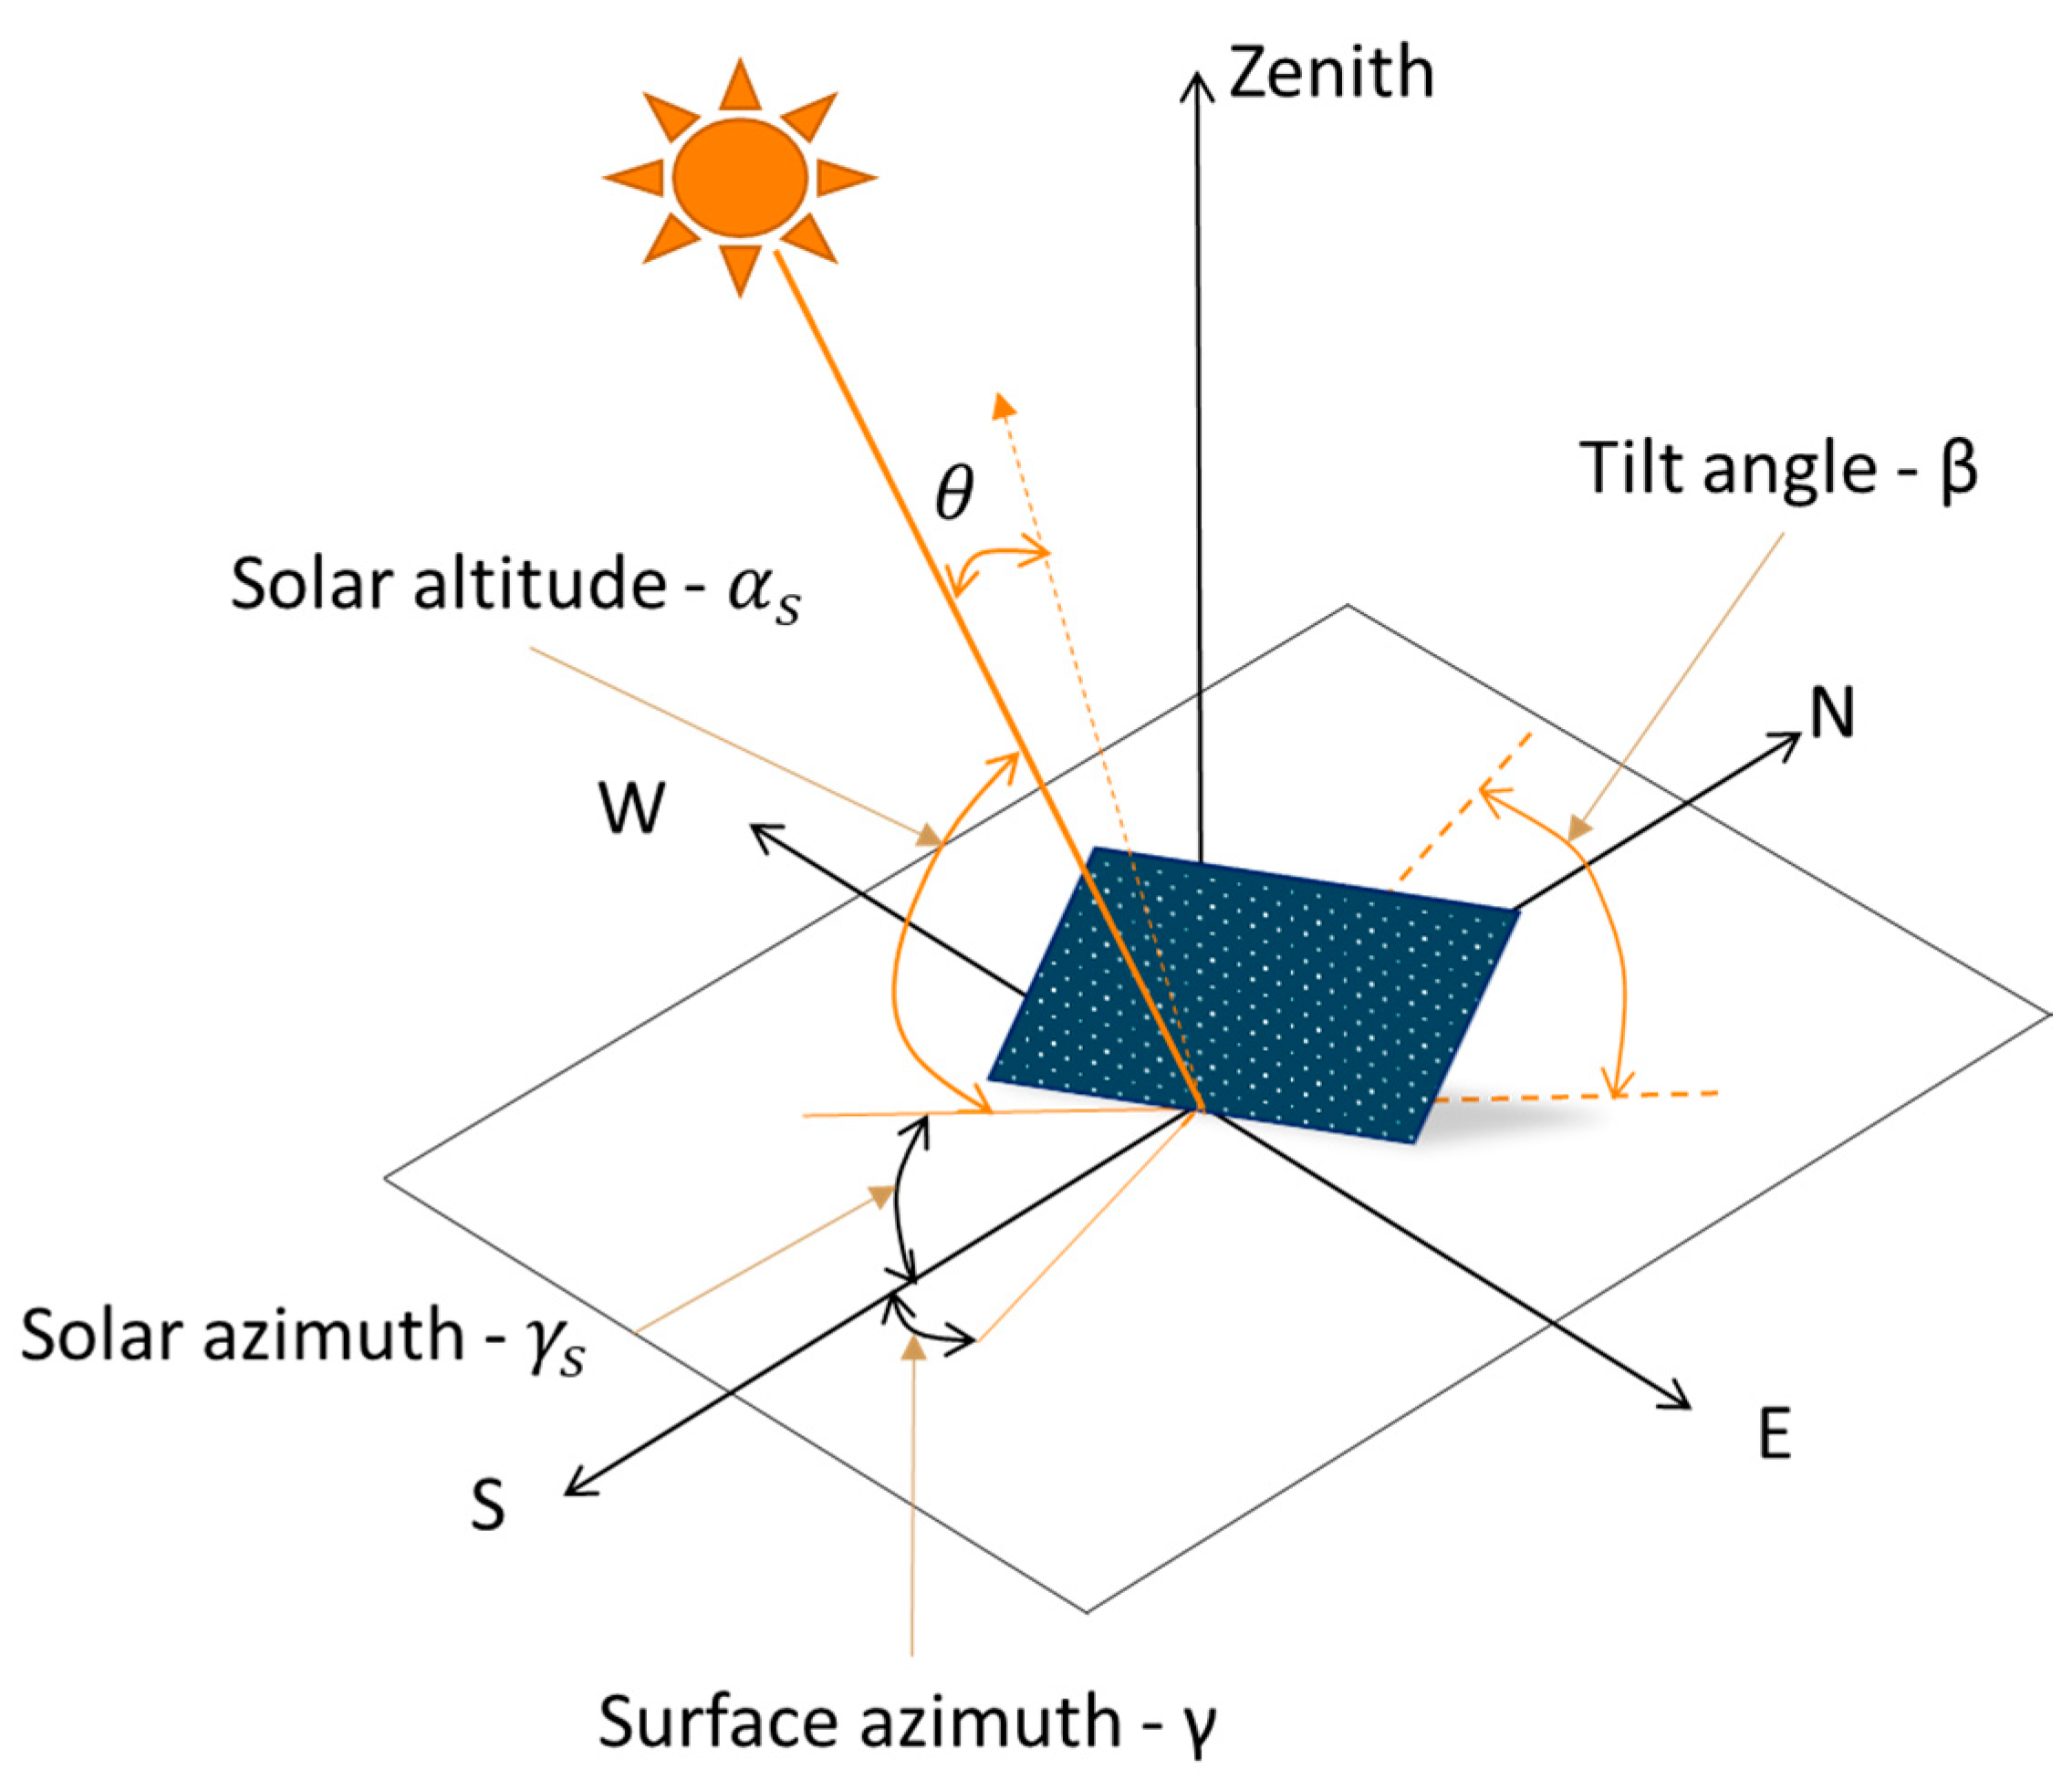
Figure 2 demonstrates the two angles related to the sun position, which are the solar altitude angle αs, and the solar azimuth angle γs, the angles β and γ that define the PV module position. β is the tilt angle, and γ is the surface azimuth angle. Further, the angle between the normal to the PV surface and the incident beam radiation is indicated [33,34].
The solar irradiation at different azimuths, inclination angles, and horizontal positions regarding different locations is calculated as in Equation (2), in which and are the direct and diffuse solar irradiations, respectively.
The geographical potential is determined by using ArcGis to match available roof area, , and relative solar irradiation with data of the topographic, population distribution, and cadastral maps.
The raster maps [17,35] only provide the solar irradiation at 90° to the horizontal. However, the irradiation changes depending on the solar position and its relation to an oriented panel. To improve the accuracy of the geographical potential, this paper calculates relative solar irradiations corresponding to the northern, central, and southern horizontal surface in different azimuth and inclination angles.
The geographical potential is determined by using ArcGis to match available roof area, , and relative solar irradiation with data of the topographic, population distribution, and cadastral maps.
3.2. Technical Potential
A PV module will typically be rated at standard test conditions (STC), which indicates a condition of a cell temperature of 25 °C and an irradiance of 1000 W/m2 with an air mass 1.5 (AM1.5) spectrum [36], ensuring a relatively independent comparison and output evaluation of different modules. However, when operating in the field, they typically operate at higher temperatures and at somewhat lower insolation conditions. To improve the accuracy of technical potential assessments, the paper determines the power output of the solar cell regarding the expected operating temperature of the PV module and the corresponding solar cell efficiency.
First, the paper identifies the operating cell temperature (°C) based on nominal operating cell temperature (NOCT °C) Equation (3).
NOCT is defined as the temperature reached by open-circuited cells in a module under the conditions of the maximum irradiance, = 800 W/m2, air temperature is 20 °C, wind velocity is 1 m/s, and an open rear surface mounting. NOCT can be calculated from the NOCT model [37] or taken from the information given by the module specification. The equation is a literature model [38] that gives a reasonable estimate of the operating temperature of the module as a function of the ambient temperature ( °C) and the irradiance at the instant (W/m2) when the ambient temperature is (°C). (°C) can be obtained from Raster data or extracted manually from the climate map [39]. As can be seen in Equation (3), because the irradiance and temperature changes over a calendar year, we would see an effect of both irradiance and temperature on the electricity output of a solar cell across the seasons.
Another factor that affects the electricity output is the solar cell efficiency. Because the efficiency depends on the spectrum and intensity of the incident sunlight and the temperature of the solar cell [40], the paper calculates the corrected energy conversion efficiency () of a solar cell corresponding to the operating temperature , which is reflected in the latitude and climate of the considered region. The corrected temperature factor and the corrected efficiency of the module cell are determined via Equation (4). A constant value (CT) can be extracted from the module datasheet (%/K). and are the temperature and efficiency at STC conditions.
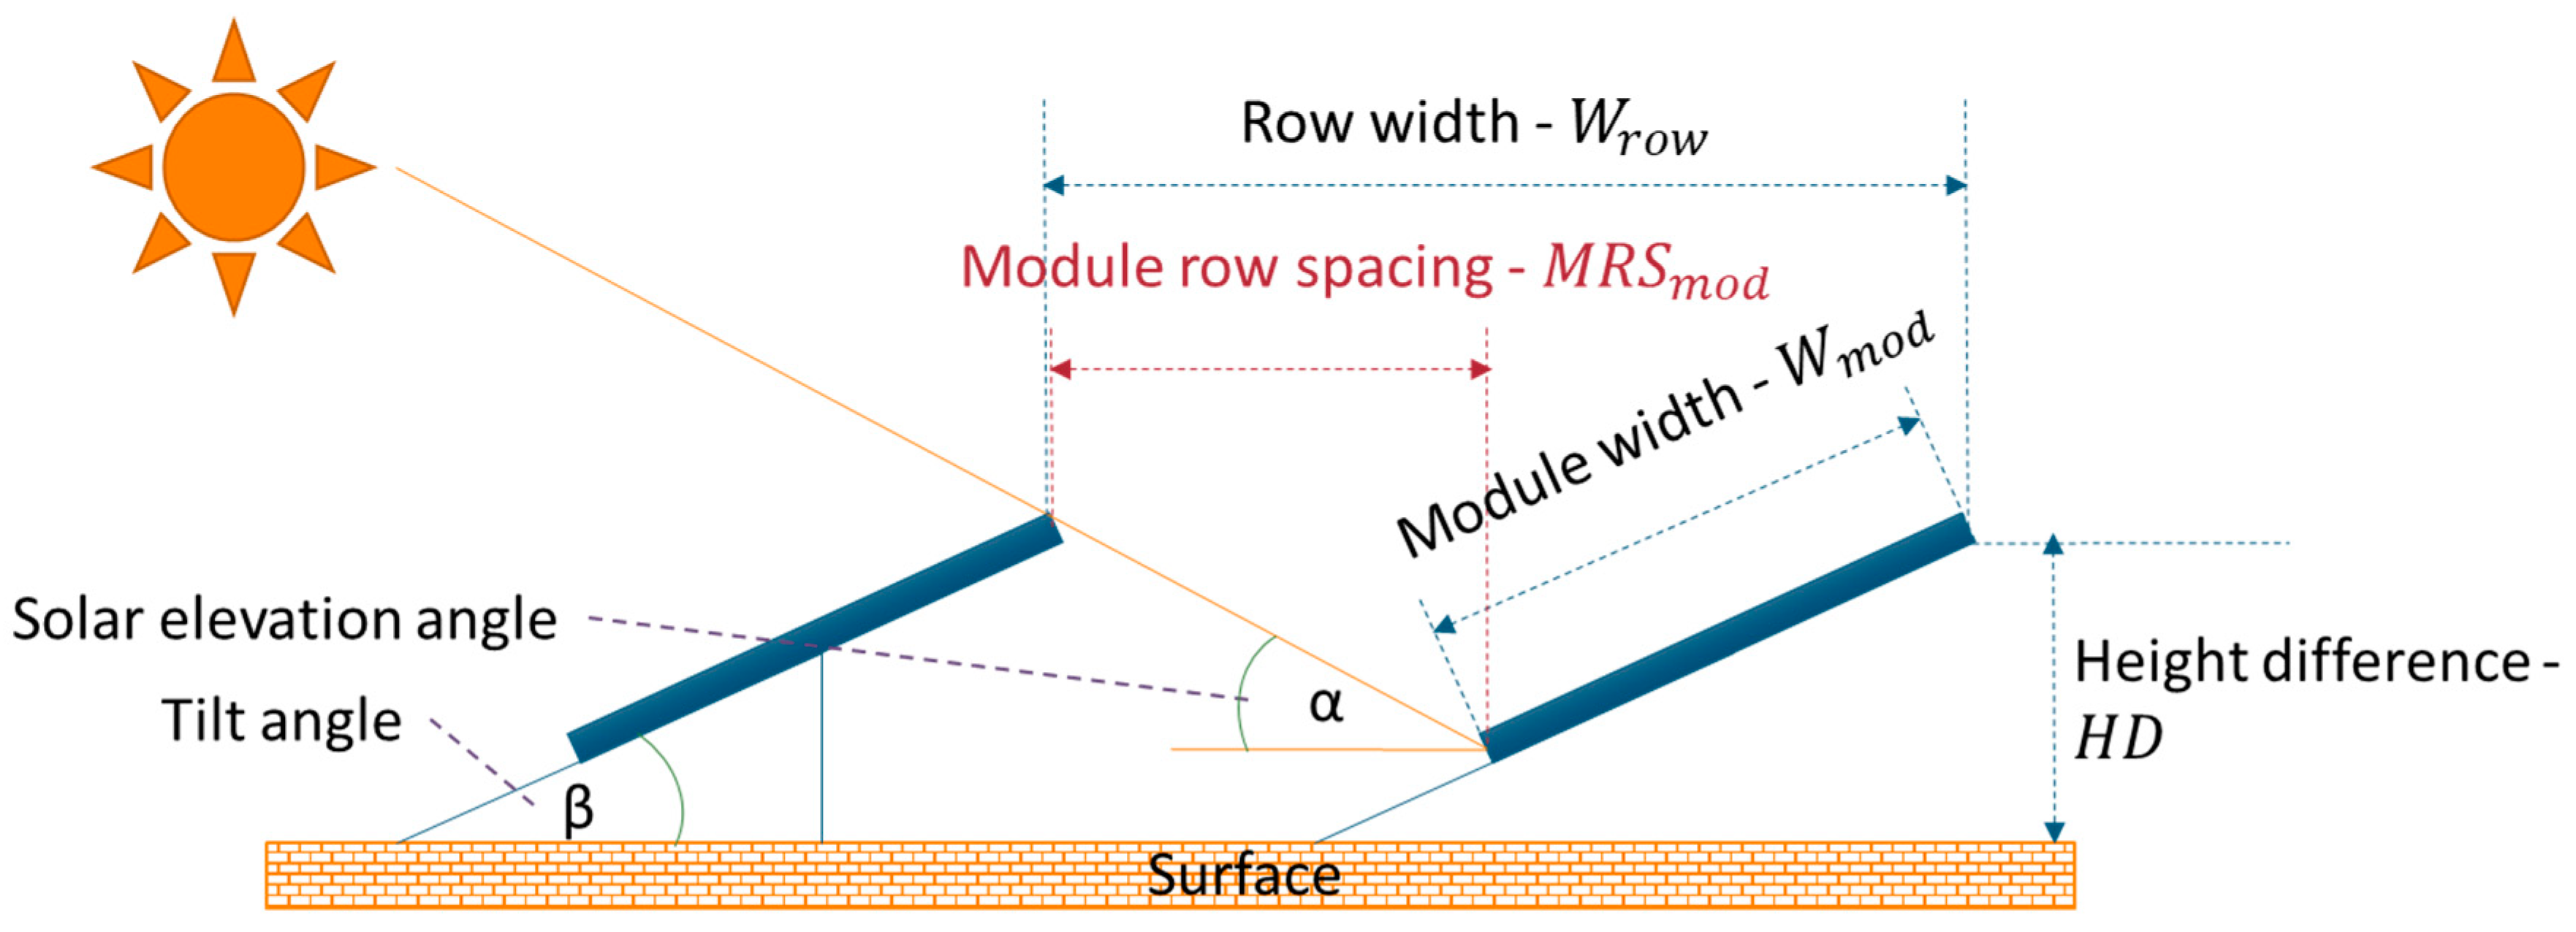
Moreover, to be more precise in assessing technical potential, this paper identifies the least space distance between PV modules to minimize shading effects. To calculate the module row spacing between two lines of modules, the first step is to calculate the height difference, HD (m), from the back edge of the module to the surface [34]. Equation (5) is used for this purpose. β (degrees) is the tilt angle and (m) is the module width.
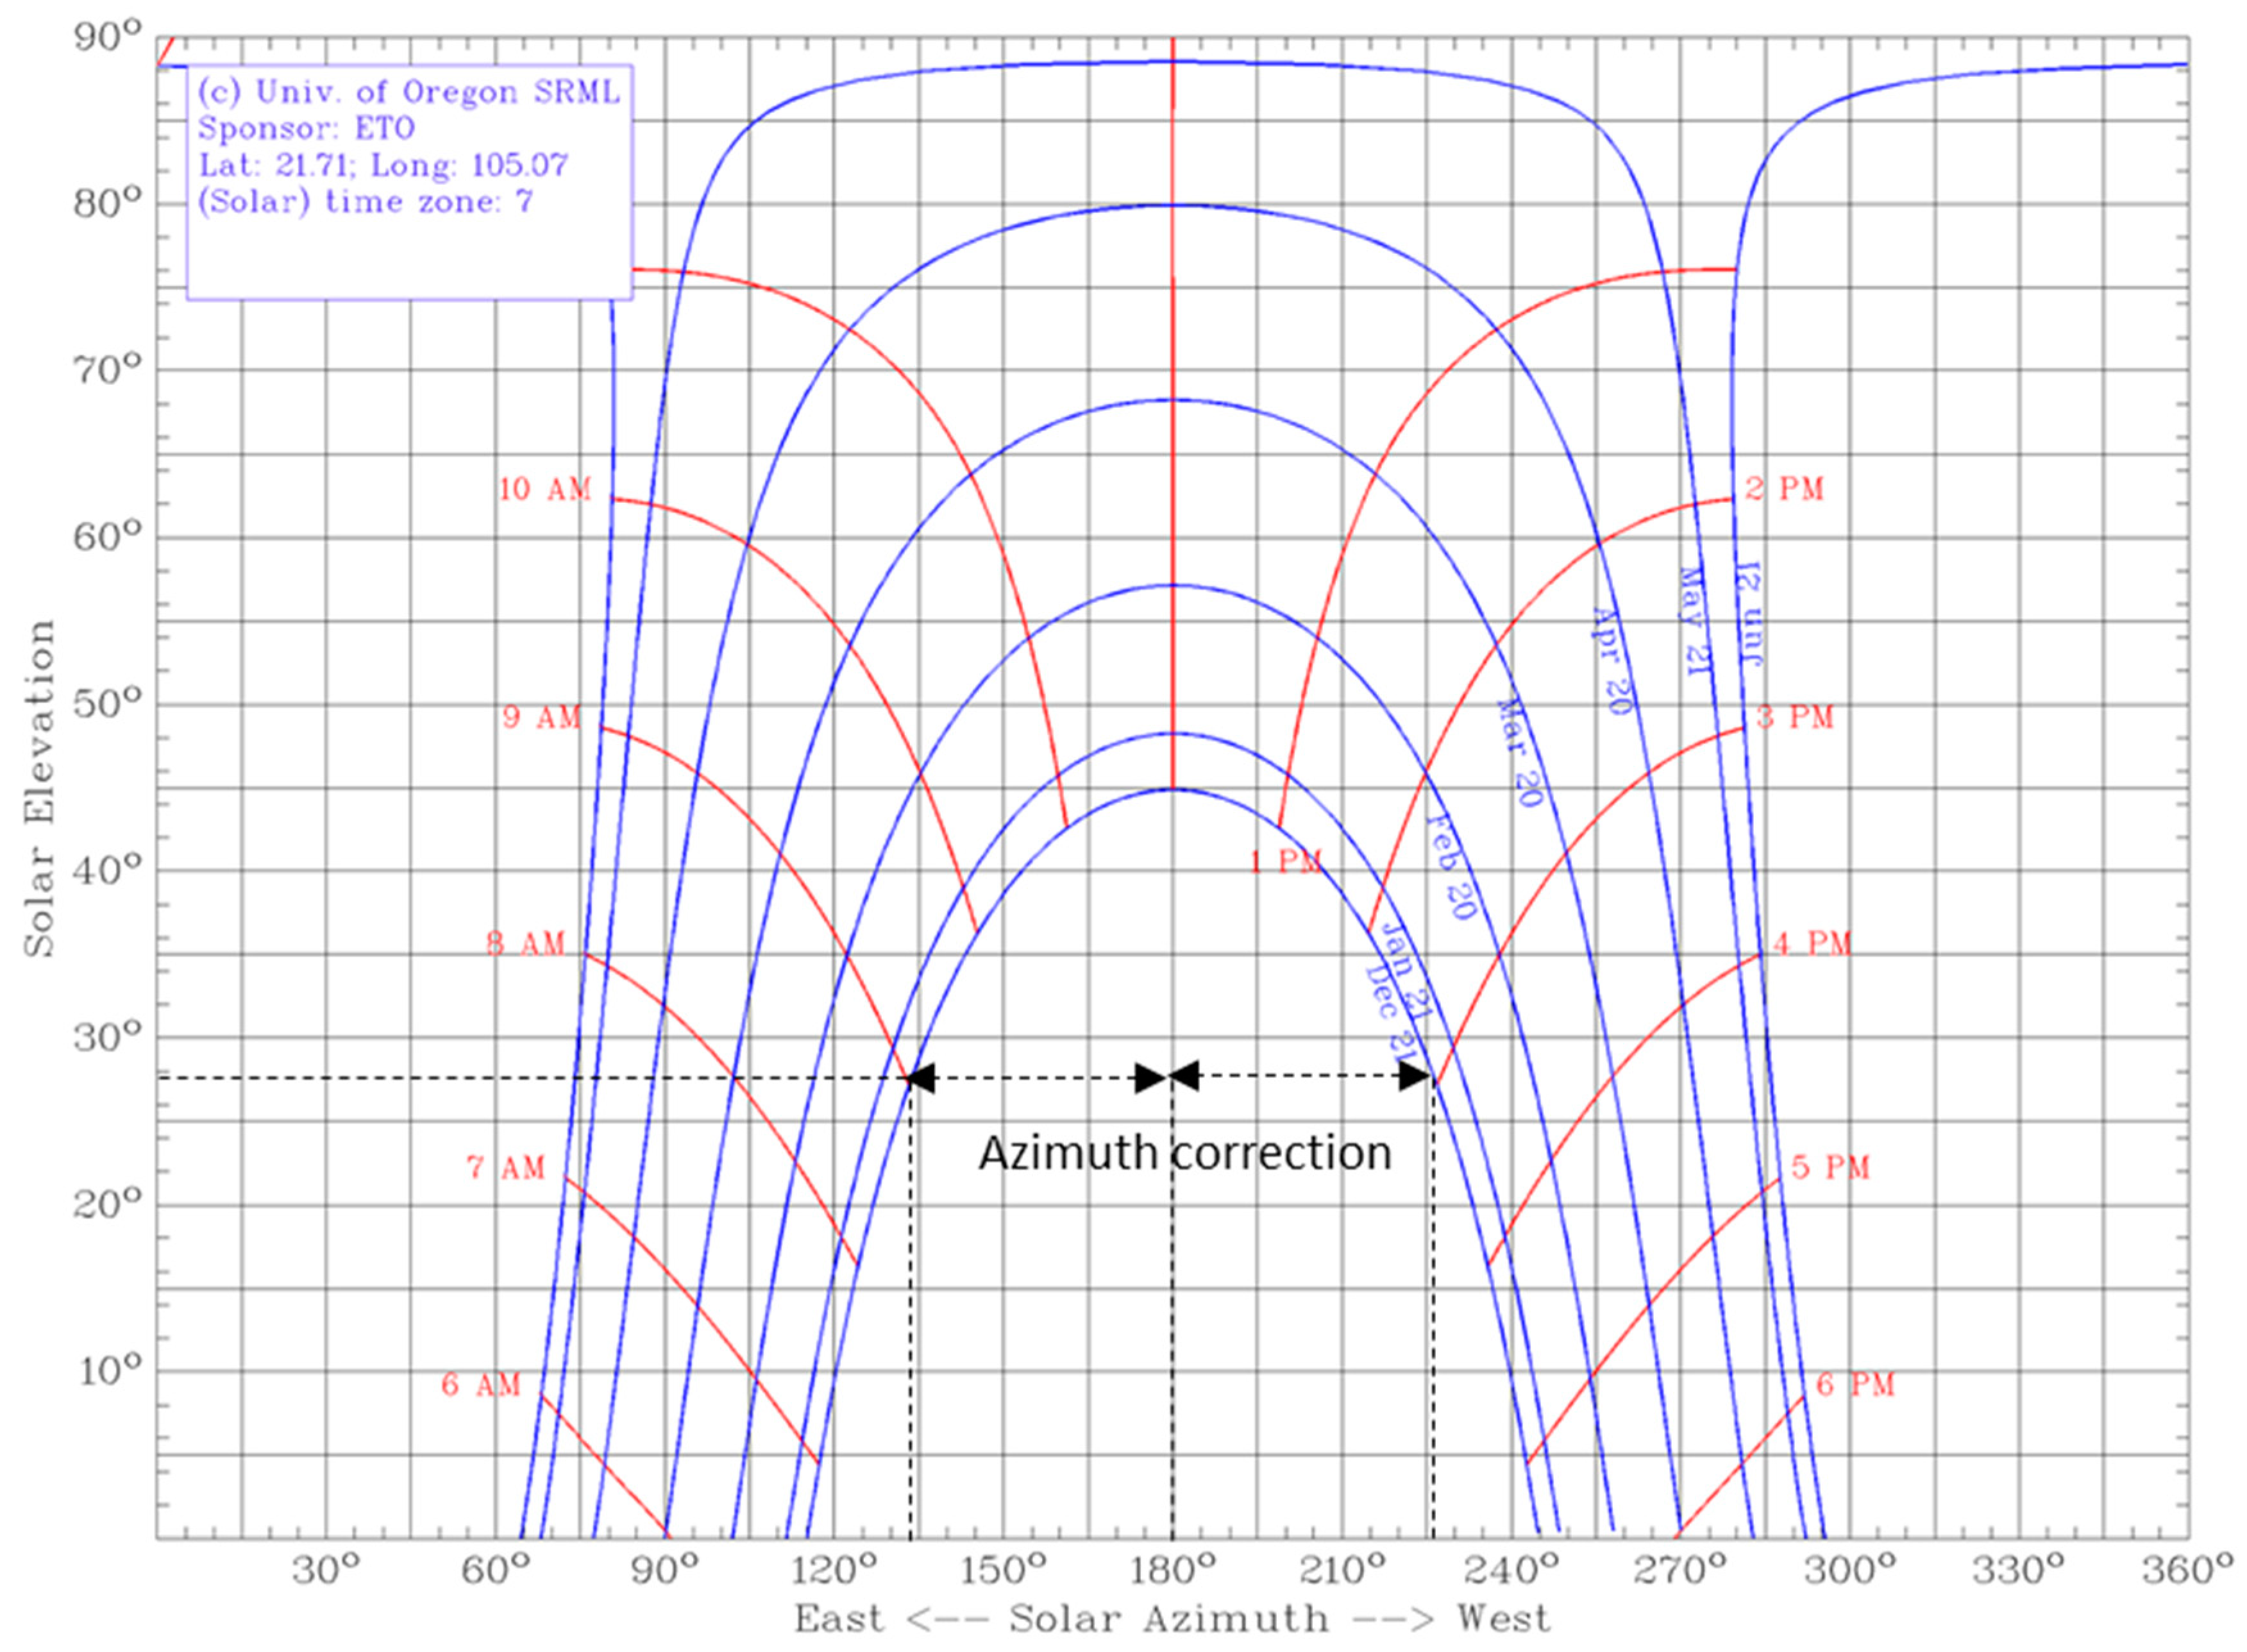
The module row spacing () is determined by using the Sun Elevation Angle. The row width, , which is the distance from the trailing edge of one row to the trailing edge of the subsequent row, is calculated as in Equation (6), in which α is the solar elevation angle (degrees) (Figure 3) and κ is the azimuth correction angle (degrees) (Figure 4). The shadow between rows falls perpendicular to a south-facing array only when the sun is located at true south in the sky. At solar noon, the length of the shadow cast between rows would be equal to the minimum row spacing (. In this paper, is calculated in the worst case from 9 AM to 3 PM of the winter solstice, therefore an azimuth angle correction is required (Figure 4).
The number of PV modules, , on a rooftop for each raster map unit corresponding to the available roof area for PV, , is obtained from Equation (7), in which is the length of the PV module (m).
The electricity output of the solar system, , is obtained from Equation (8), in which PR is performance ratio of the module, SI is the adjusted solar irradiation (kWh/m2) and is the module area (m2)
3.3. Levelized Cost of Electricity (LCOE)
The Levelized Cost of Electricity (LCOE) is a measure of the average net present cost of electricity generation for a generating plant over its lifetime, which is assumed to be 20 years in this study [41]. The LCOE depends on costs (i.e., the initial capital investment, maintenance, and operational costs), local condition (load profile), and financial condition (i.e., the discount rate).
The LCOE is calculated as in Equation (9) [42]
where (Euro) stands for the total initial investment, which is the product of module size (in kW) and specific investment as the investment cost per installed kW (€/kW); (Euro) is the yearly operating cost; i (%) is the discount rate; (year) is the life span; and (kWh) is the annual electricity production.
3.4. Sensitivity Analysis
The proposed model is computationally intensive and highly parameterized with model input uncertainty, which can reduce the accuracy of the model outputs. To provide a robust assessment at medium resolution, this paper suggests a solution to estimate the impact and significance of uncertain parameters in the model by using variance-based sensitivity analysis. A variance-based method is a probabilistic approach, which quantifies the input and output uncertainties as probability distributions and decomposes the output variance into parts attributable to input variables and combinations of variables.
The sensitivity of the output to an input variable is therefore measured by the amount of variance in the output caused by that input.
Considering our model in Equation (10):
As for , a measure of the sensitivity of the ith variable Xi is given as{\displaystyle \operatorname {Var} \left(E_{{\textbf {X}}_{\sim i}}\left(Y\mid X_{i}\right)\right)} , where “Var” and “E” denote the variance and expected value operators, respectively, and denotes the set of all input variables except . This expression essentially measures the contribution of alone to the uncertainty (variance) in Y (averaged over variations in other variables) and is known as the first-order sensitivity index or main effect index, , which is determined as in Equation (11). Importantly, it does not measure the uncertainty caused by interactions with other variables.
This method allows exploration of the input space, accounting for linear and nonlinear responses. As demonstrated in Figure 1, four loops, represented by orange arrows, repeatedly run to generate the final outputs until all the possibilities of the inputs are covered. The first input set is built based on the available data and assumptions from previous studies.
Subsequently, this paper fits a linear and/or nonlinear regression to the model response and the standardized regression coefficients are used to measure the level of impact of each uncertain parameter on the output. The relationship between the uncertain parameters and the output is presented as in Equation (12), for example.
This paper uses hierarchal clustering in the manner of the Pareto principle to generate the ranking of the uncertainty factors xi according to their relative contribution to the output variability. The influencers are categorized into different groups, including “strong influencer”, “moderate influencer”, and “negligible influencer”. The goals of the analysis are to provide different references for policymakers and stakeholders to choose an appropriate interaction with the current rooftop PV market status. One goal focuses on quantifying the uncertainty in the output of the model, thus it is used as a control tool for modelers and policymakers in order to ensure the accuracy of the output. The other goal focuses on apportioning output uncertainty to the different sources of uncertainty inputs and will be used for designing policy and for supporting the decision-making of investors in the rooftop PV market.
4. Case Study and Results
4.1. Data and Assumptions
Vietnam is taken as a case study for demonstrating our method and findings. It is one of the 65 emerging countries in the world with typical features and struggles to develop solar PV [2,3,4]. The Vietnamese population is 94 million people, with annual GDP growth of around 7%, the total electricity demand of 227,421 GWh, total supply capacity of 48.57 GW [43], and power demand surging at an average rate of 12% per year since 2010 and expected to continue growing by 8%/year until 2030 (Vietnam energy outlook 2018). Residential demand for electricity accounts for almost a third of the total electricity demand [43], with the average retail tariff of 9.3 Euro cents/kWh (Appendix A Table A1). However, during the period 2016–2030, the original estimation of the additional capacity is estimated to be decreased by 16% (~15.2 GW) because of the delay of some natural gas projects. This would be likely to increase the power shortage in the south, especially from 2022 onwards (EVN June 2019).
Under these circumstances, solar and wind power are expected to play significant roles as alternative resources and turn Vietnam into a hot spot for energy investors. Renewable energy supply, including small hydro, wind, solar, and biomass power plants, currently covers 7.16% of total national supply [43]. However, given a local overload, transmission losses, and uneven infrastructure between different regions, the Vietnamese government has been provoking significant investment in power infrastructure with net metering. As a result, by June 2019, the country has shown a surge of centralized solar capacity connected to the national grid of 4.46 GW. This accounts for 8.28% of the Vietnamese electricity supply mix, which is far more than the 1000 MW target set for 2020 (EVN report, June 2019), while PV rooftop projects only grow at a very modest level. Moreover, because of lacking integrating policy, management, and compensation mechanisms to support rooftop PV development in the whole country, it has developed rapidly solely in Ninh Thuan. This region accounts for 90% of the total national solar capacity, which has caused significant grid congestion and reduced the spread of the development.
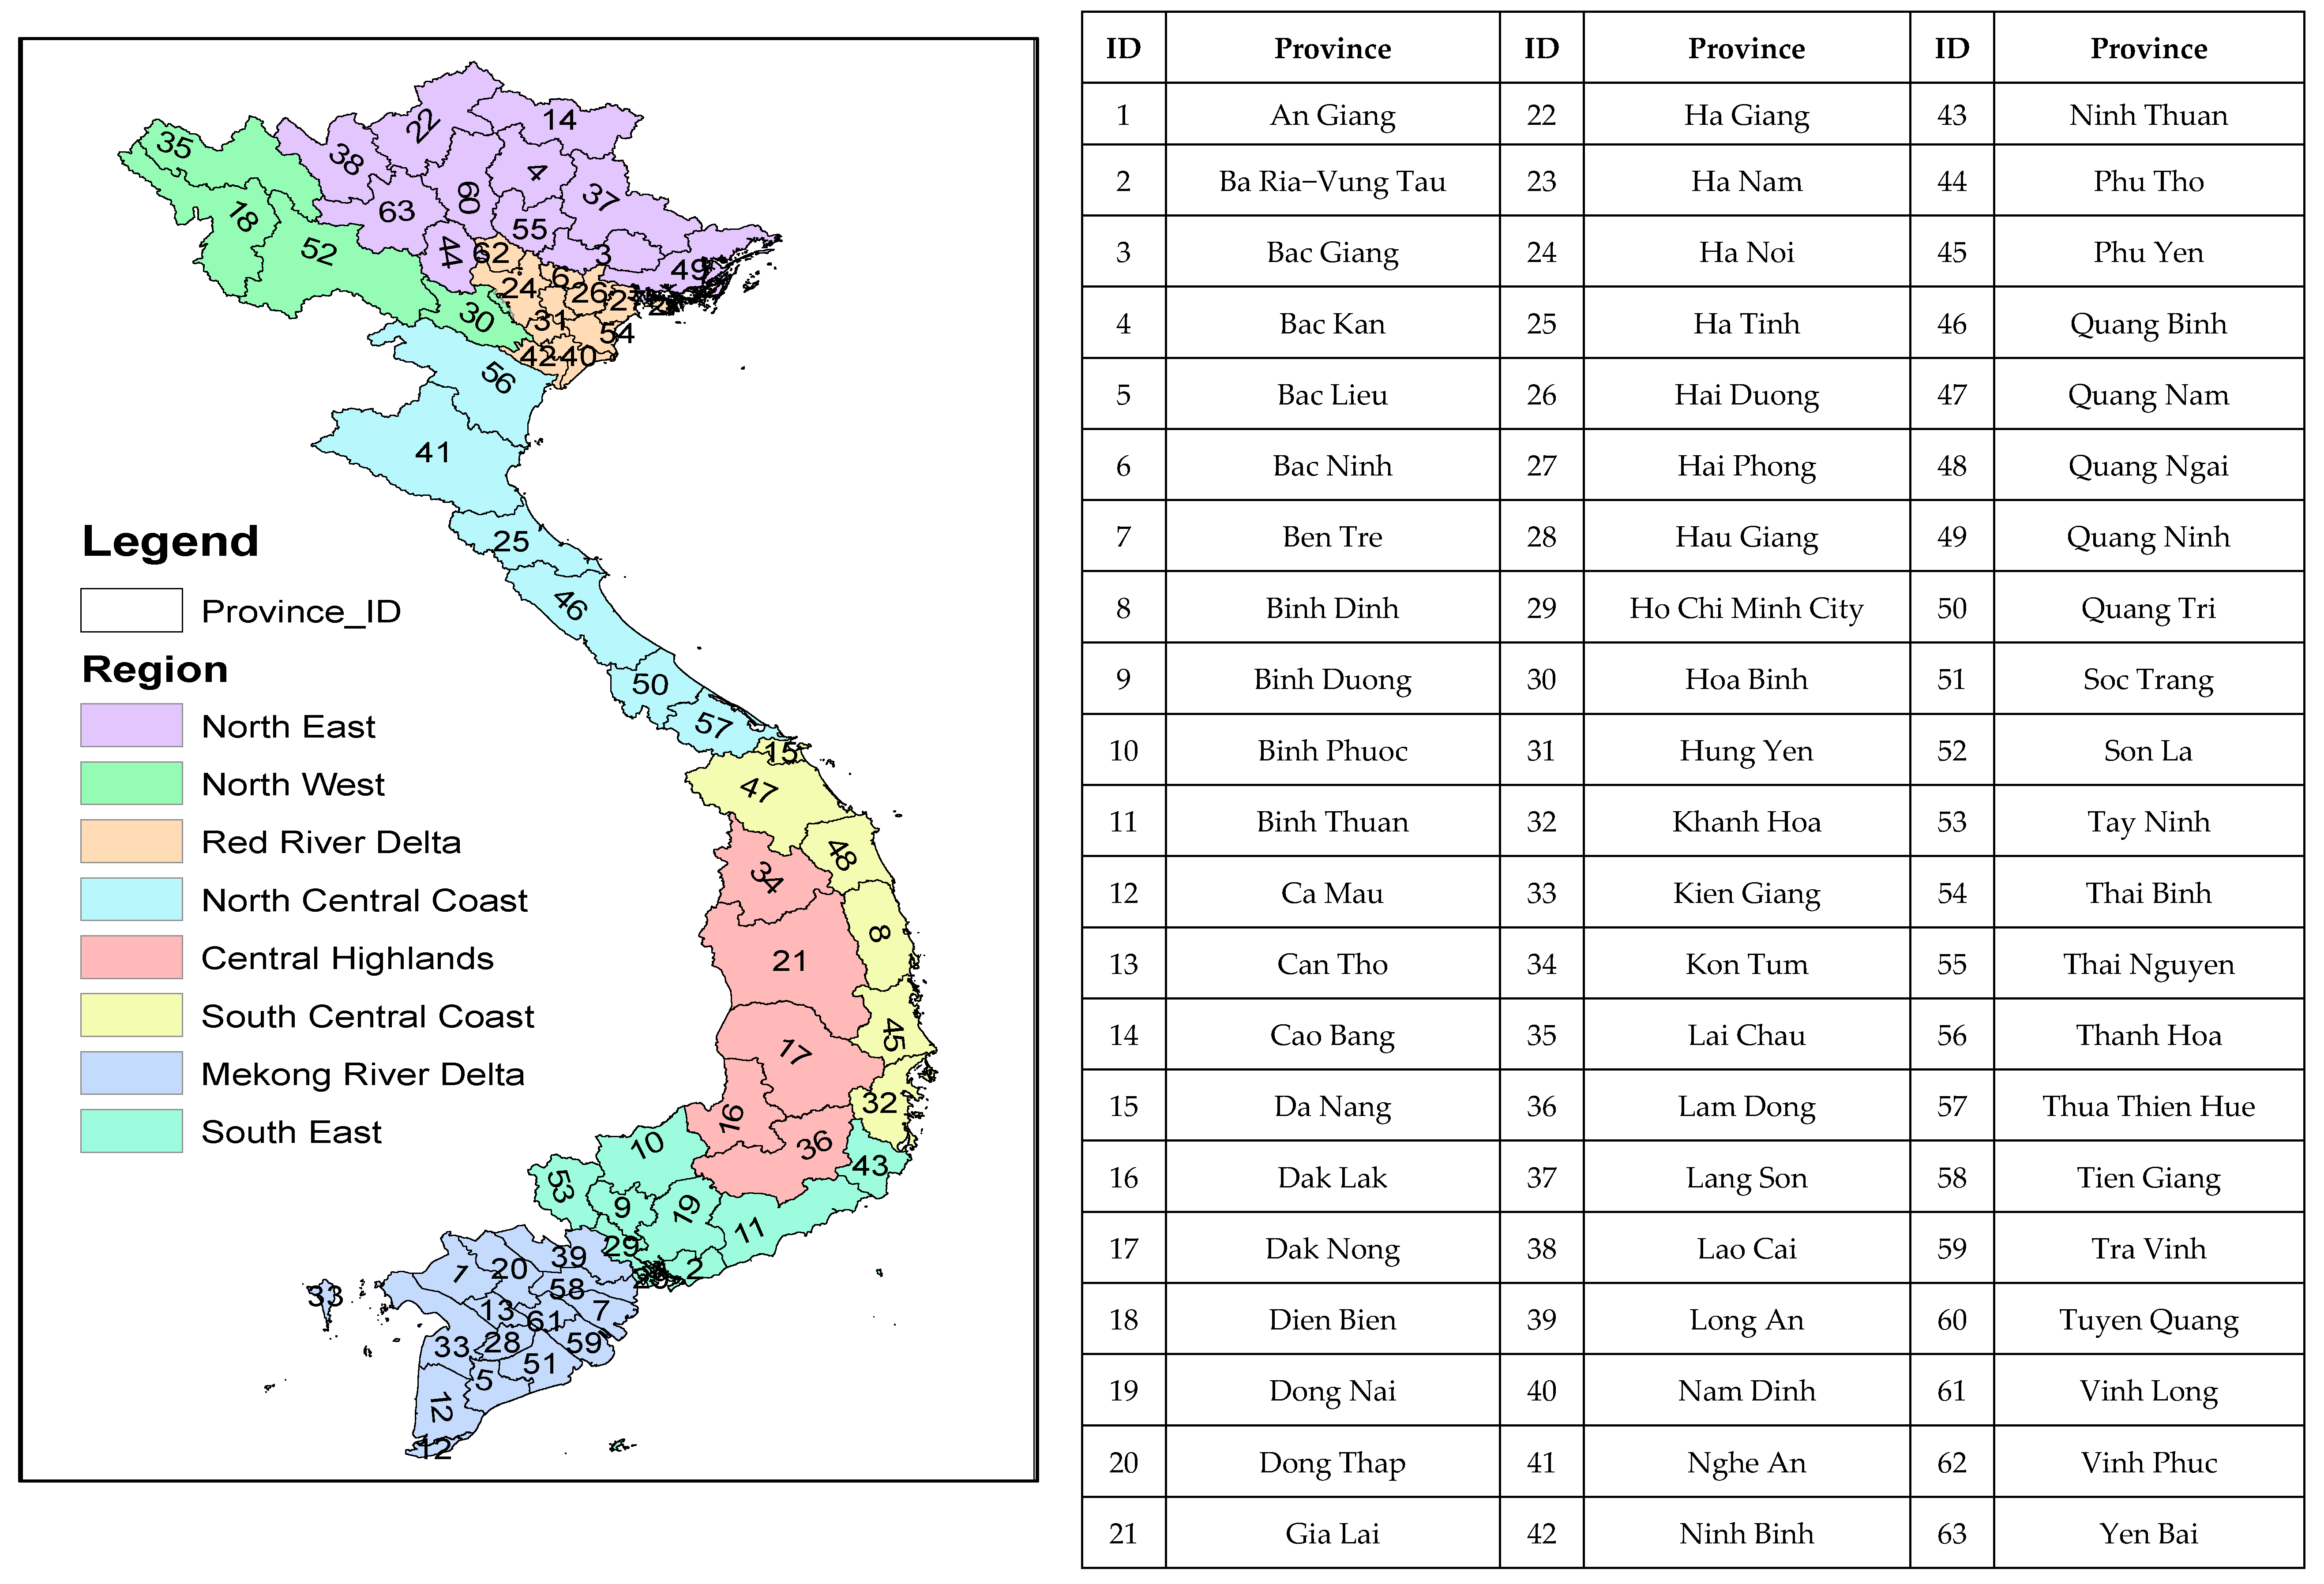
To solve the issue of the lacking integrating policy and mechanisms to support rooftop PV development, this paper focuses on assessing rooftop PV potentials in 63 provinces in Vietnam and proposes different suggestions for the government to unleash their PV potentials.
This paper uses a previous study of house design in Vietnam [32], in which the average number of apartments on one floor of the building, , is 5, the exterior area, , is 0.2, and the interior area, , is 0.1 to calculate the available roof area for installing rooftop PV. The roof of the apartment buildings is considered flat, so for them is 0. For single-detached houses, is presented in Table 1. A sensitivity analysis for these assumptions is conducted in this paper.
The utilization factor of the flat roof is estimated to be 50% based on previous studies [5,9,14,44], which concluded that 35% to 65% of residential flat roofs are available for PV because 5% of the roof is covered by HVAC equipment or other building components, which would shade over 35% of the entire rooftop, and trees and other construction would shelter from 0% to 30% of the rest. The utilization factor of a slanted roof is assumed to be 58%, which considers that a north-facing roof also has the potential for installing PV systems [25].
Based on Equation (2), the relative solar irradiation for different roof types in three different parts of Vietnam is calculated. The results are presented in Table 1.
In this paper, two main models of PV modules, i.e., monocrystalline and polycrystalline, are considered. The characteristics of these two models, extracted from the catalogue, are given in Table 2. The performance ratio is considered as 0.85 [25].
To assess the effect of uncertainty parameters on the outputs, this paper alters the assumptions and the values of input variables, which have been referenced from other studies but for which sensitivity analyses have not been performed in previous studies. The used values of these inputs and the considered variation range are presented in Table 3.
4.2. Results of the Potential Analysis
Section 4.2.1, firstly, presents the spatial potential distribution of rooftop PV with detailed potential for 63 provinces as well as the cumulative potential for eight classified territories of the country: Northern Midlands (NML), Northern Mountains (NM), Red River Delta (RRD), North-Central Coast (NCC), South-Central Coast (SCC), Central Highlands (CH), Southeast (SE), and Mekong River Delta (MRD). Section 4.2.2 then presents the results of the sensitivity analysis for two purposes: (1) to control the accuracy of the output; and (2) to measure the output variability regarding possible input changes in order to support policy decision making.
4.2.1. Spatial Potential Distribution of Rooftop PV
This paper breaks down the estimated theoretical potential of solar with a total of around 120 thousand TWh per year (TWh/a) from the solar irradiation raster map [17,34,49] to geographical and technical potentials of rooftop PV with 1407.2 km2 available rooftop and 278 TWh/a, respectively. The technical potential is calculated with the results of roof-mounted solar cells in the whole country being 228.3 and 215.8 GWp or 278.1 and 262.7 TWh/a with monocrystalline and polycrystalline solar cells, respectively (detailed results for each region are given in Table A3).
Comparing different regions in Vietnam, 58% of the total national rooftop PV potential is concentrated in three territories, including the two river deltas and the southeast with an almost equally divided potential of around 20%, equivalent to an average installable capacity of 43.9 GWp. The remaining potential is divided among the coastal areas and the midlands at approximately 10% or 22 GWp, and the mountains and highlands have the lowest potential with about 5% or 11 GWp in each territory.
Taking economic factors into account, the cost per kWh of rooftop PV varies greatly depending on the region and the prevailing economic conditions, in particular regarding different capital costs and discount rates. This paper determines the LCOE (Euro/kWh) of rooftop PV for each province in order to assess the economic attractiveness of the rooftop PV assumed at the current discount rate of 8%.
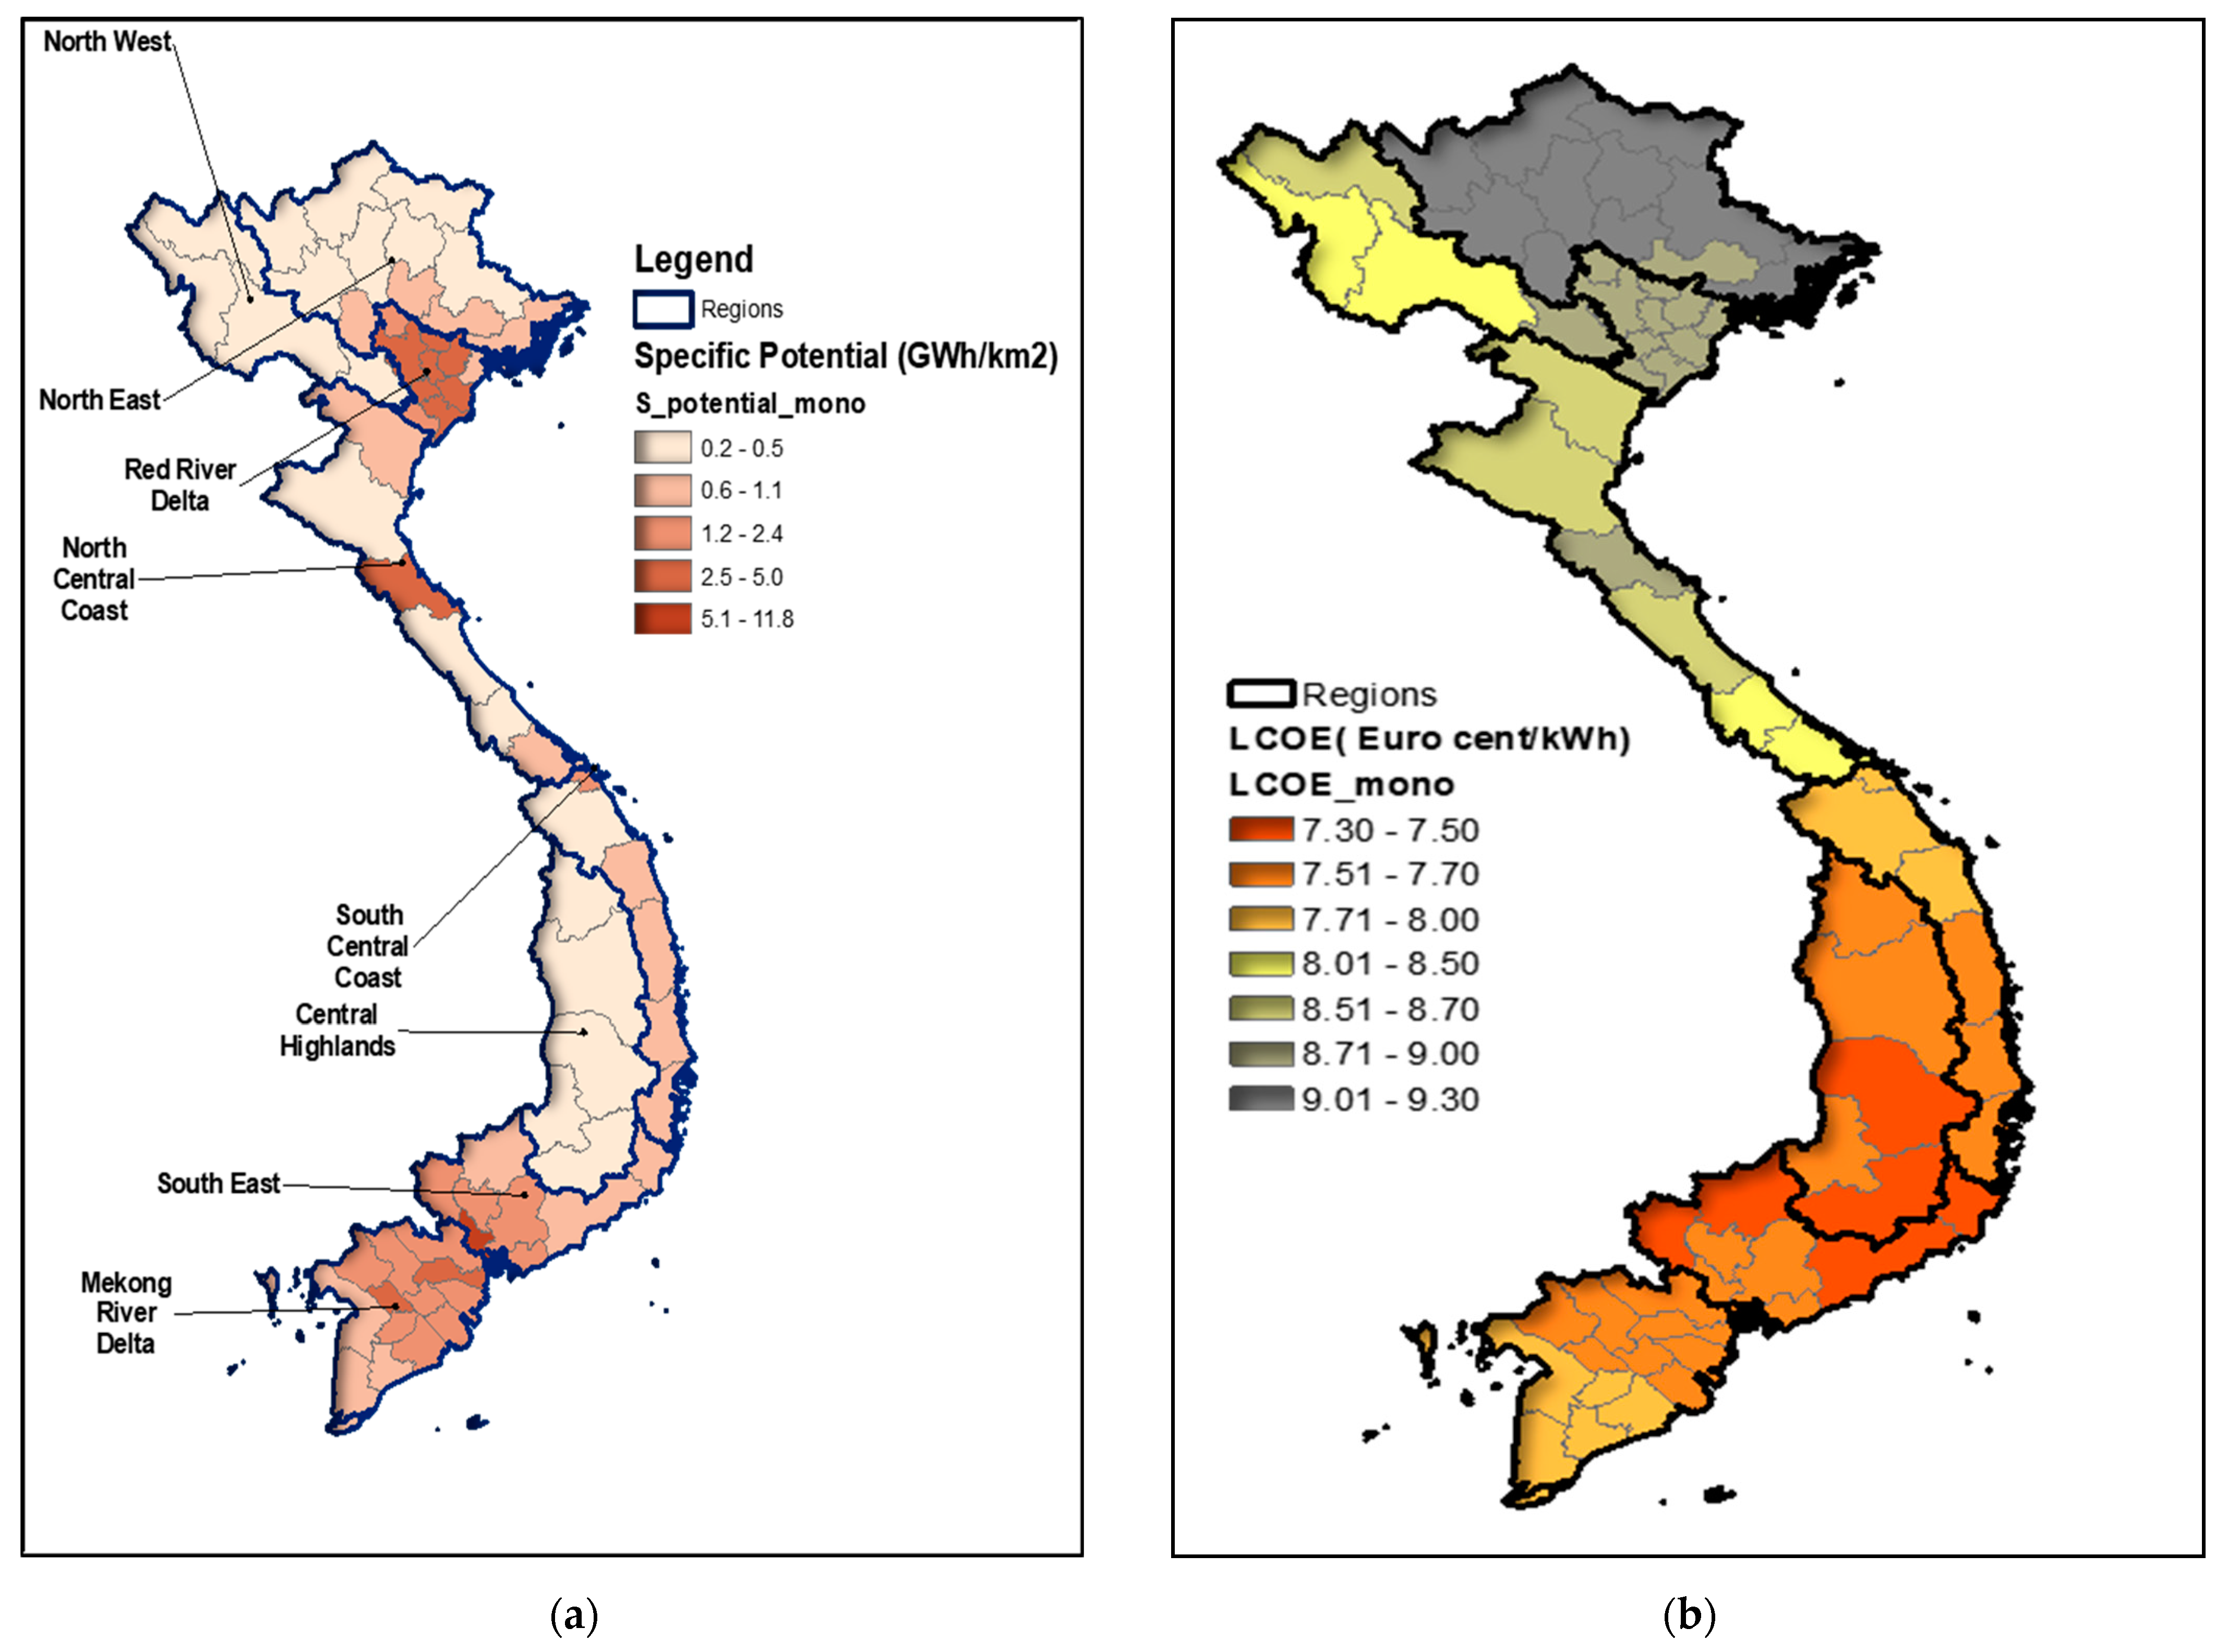
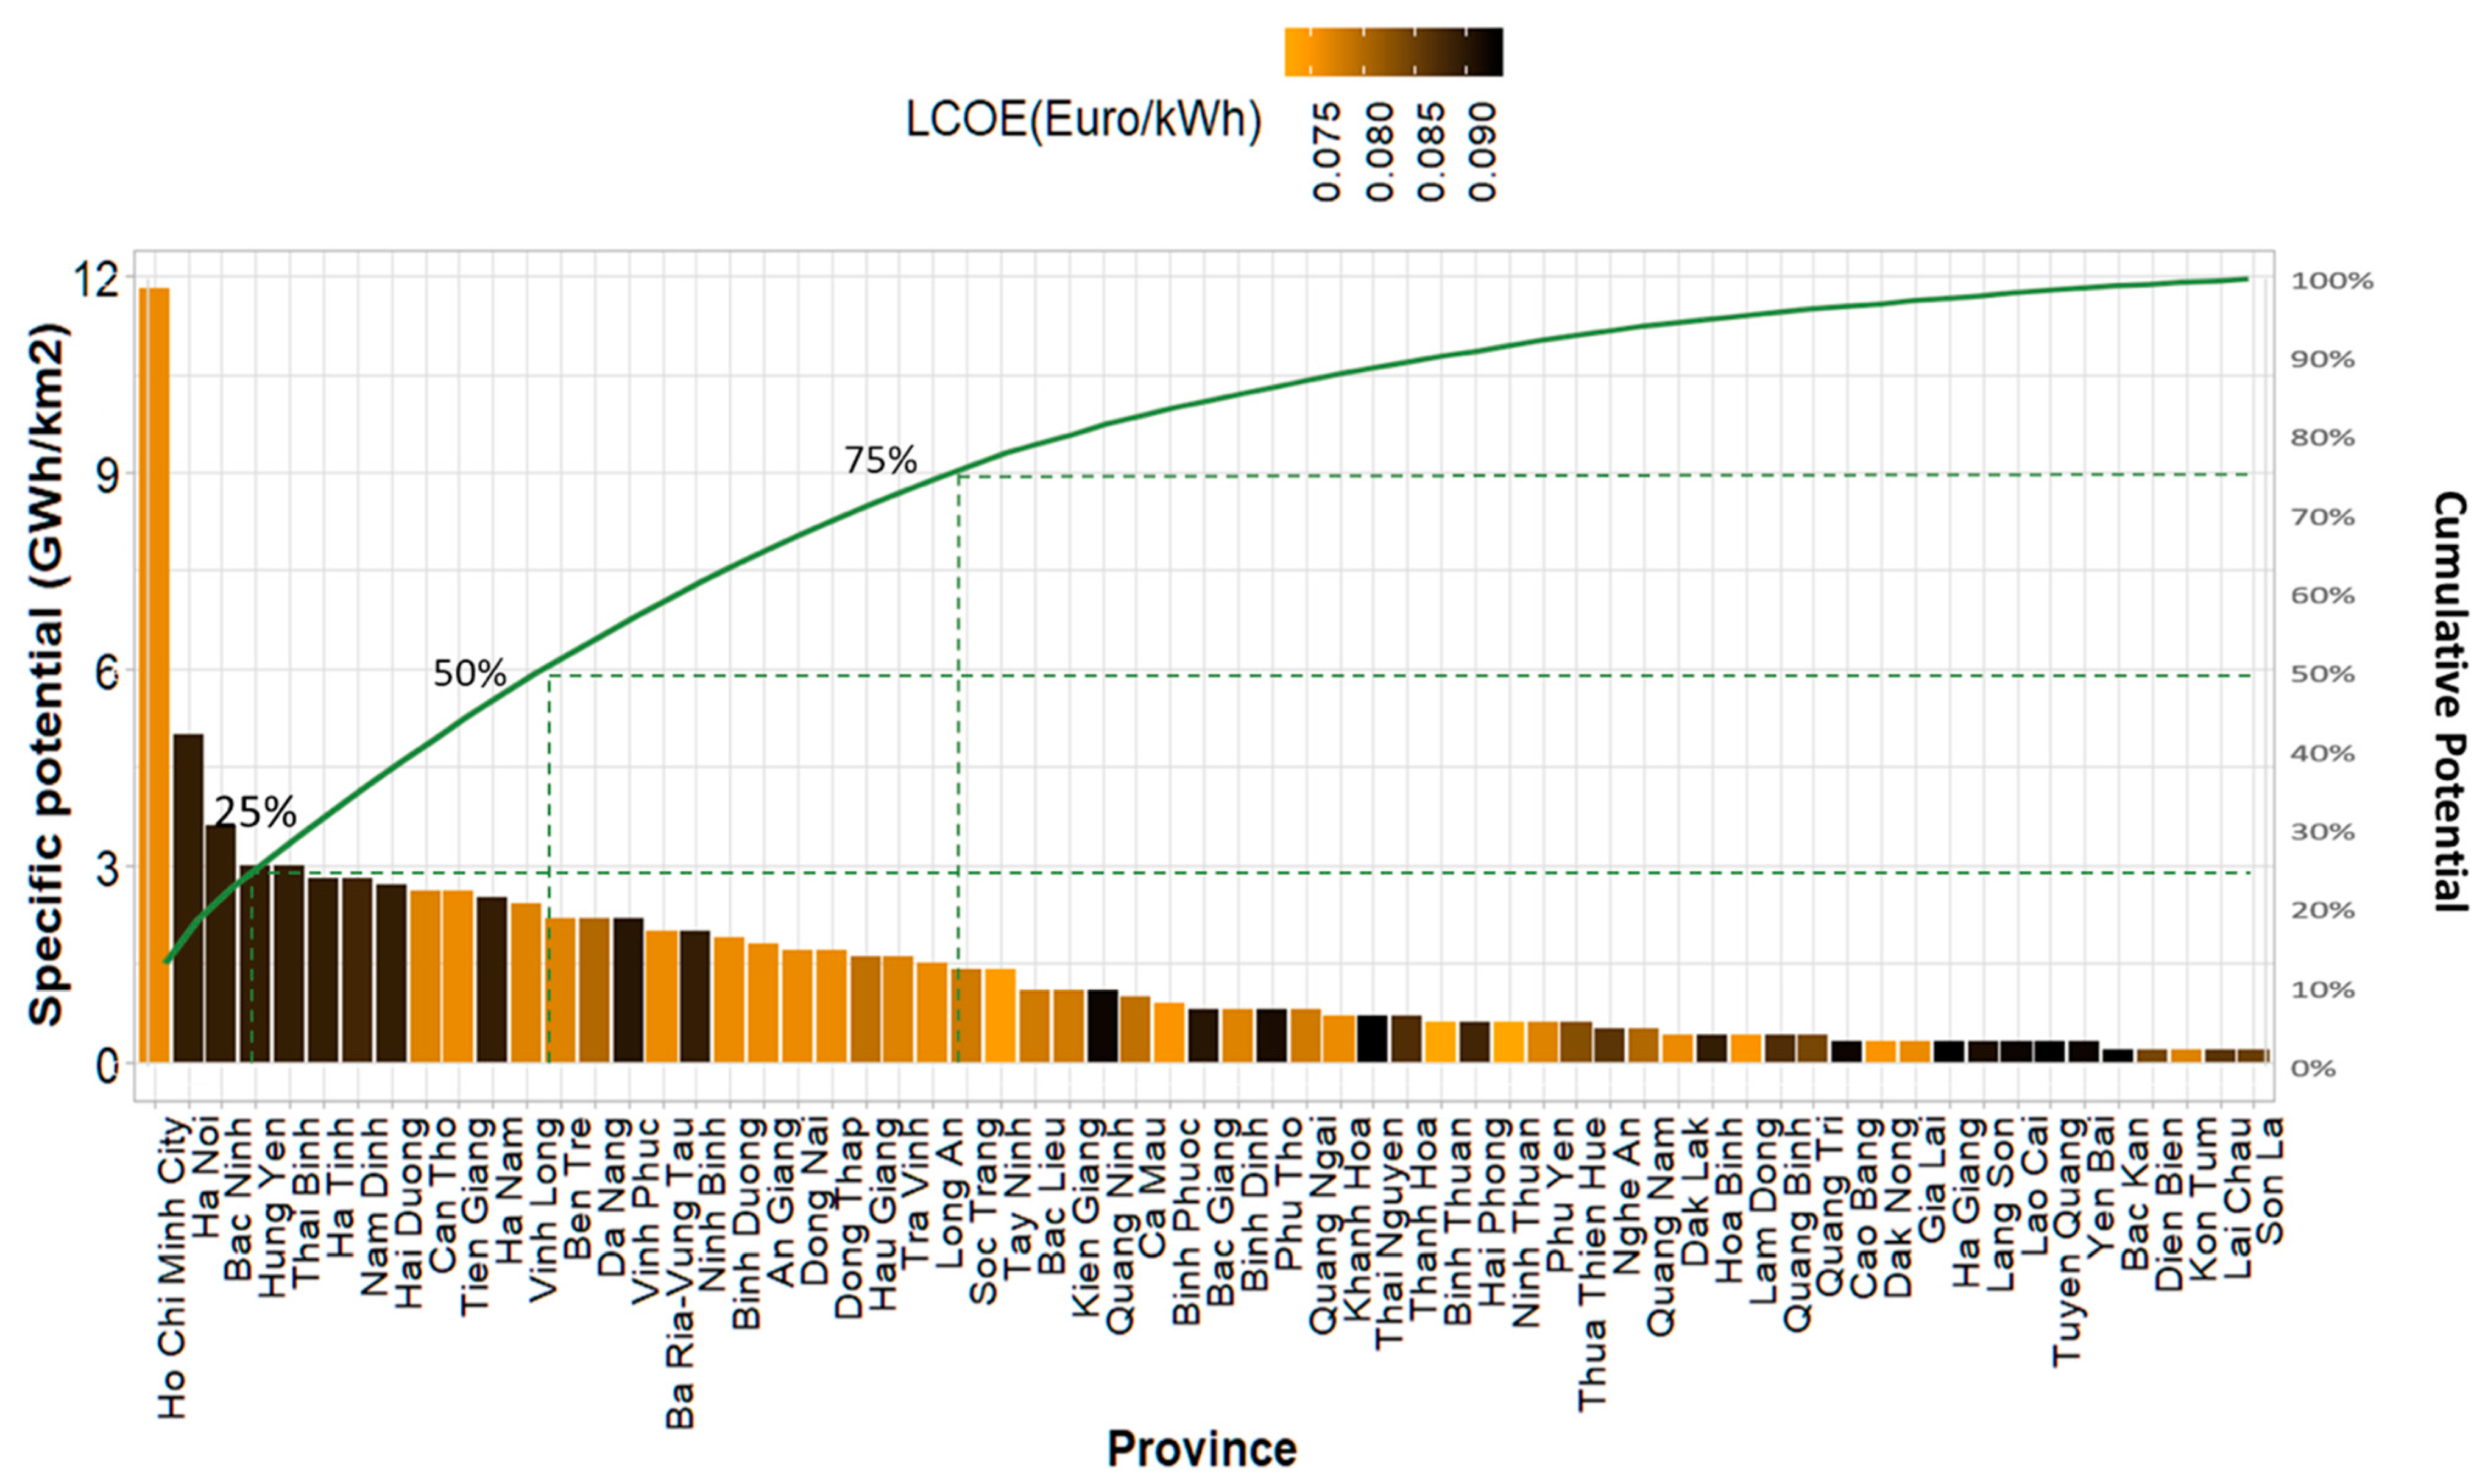
The distributed PV potentials, including the specific production potential per total area (GWh/km2) and the LCOE (Euro/kWh) in Vietnam, are shown in Figure 5 and Figure 6. The potential density is significantly high in the two river delta regions, which are Red River Delta (RRD) and Mekong River Delta (MRD) in Vietnam, especially in the two largest cities of the country, Hanoi (in the RRD) and Ho Chi Minh (in the MRD), with the most enormous potential of electricity production of about 12 and 5 GWh/km2 (Figure 6) or around 24.8 and 15.2 TWh/a or 18 and 15.1 GWp, respectively. These cities are the largest metropolitans and most populous cities with an estimated population of 7.7 million and 8.4 million, corresponding to 8.6% and 9.3% of the national population, respectively, and they also have the largest household area in Vietnam (Government statistical reports, 2018). Hanoi has 407 km2 of housing land, of which around 93.9 km2 rooftop available to install solar cells, while Ho Chi Minh City has about 282 km2 housing land but can provide an estimated 110 km2 roof for installing solar. Moreover, since Ho Chi Minh City is in the southern part of Vietnam, it could potentially generate in total 24.8 or 23.4 TWh/a with monocrystalline or polycrystalline solar cells, respectively, which is nearly 60% more than the electricity production potential from solar in Hanoi. This gives Ho Chi Minh City the most significant potential for solar power throughout the country, while Hanoi is ranked second. Currently, Ho Chi Minh City has only installed around 44.56 MWp of its 18 GWp total potential [50].
The LCOE ranges from 7.5 to 9.2 Euro cents/kWh at a discount rate of 8% across 63 provinces in Vietnam (Figure 5). In the regions with a vigorous radiation intensity such as Central Highland, Mekong River Delta, South Central Coast, and Southeast (see Figure 5 for regions), rooftop PV is more economical than in other areas with the LCOE being around 0.075 Euro/kWh. Among the eleven cities, which account for 50% of the total specific potential (GWh/km2) in the whole country, there are only four cities, namely Ho Chi Minh City, Can Tho, Tien Giang, and Vinh Long, with the average LCOE being less than 0.076 Euro/kWh (Figure 6). Despite having a sizeable available roof area, Hanoi and the rest do not have a convincing economic potential due to their low radiation intensity, which leads to a relatively high LCOE of around 0.085–0.089 Euro/kWh. The other quarter of potentials consists of 12 provinces that are relatively promising for investment with high potentials of approximately 2–3 GWh/km2 and a low LCOE of about 0.075–0.080 Euro/kWh, except for Vinh Phuc and Ninh Binh. However, Ninh Thuan and Binh Thuan, which are the best places for investing in rooftop PV with the lowest LCOE in Vietnam at around 0.073 Euro/kWh, have relatively small solar resources at about only 0.6 GWh/km2.
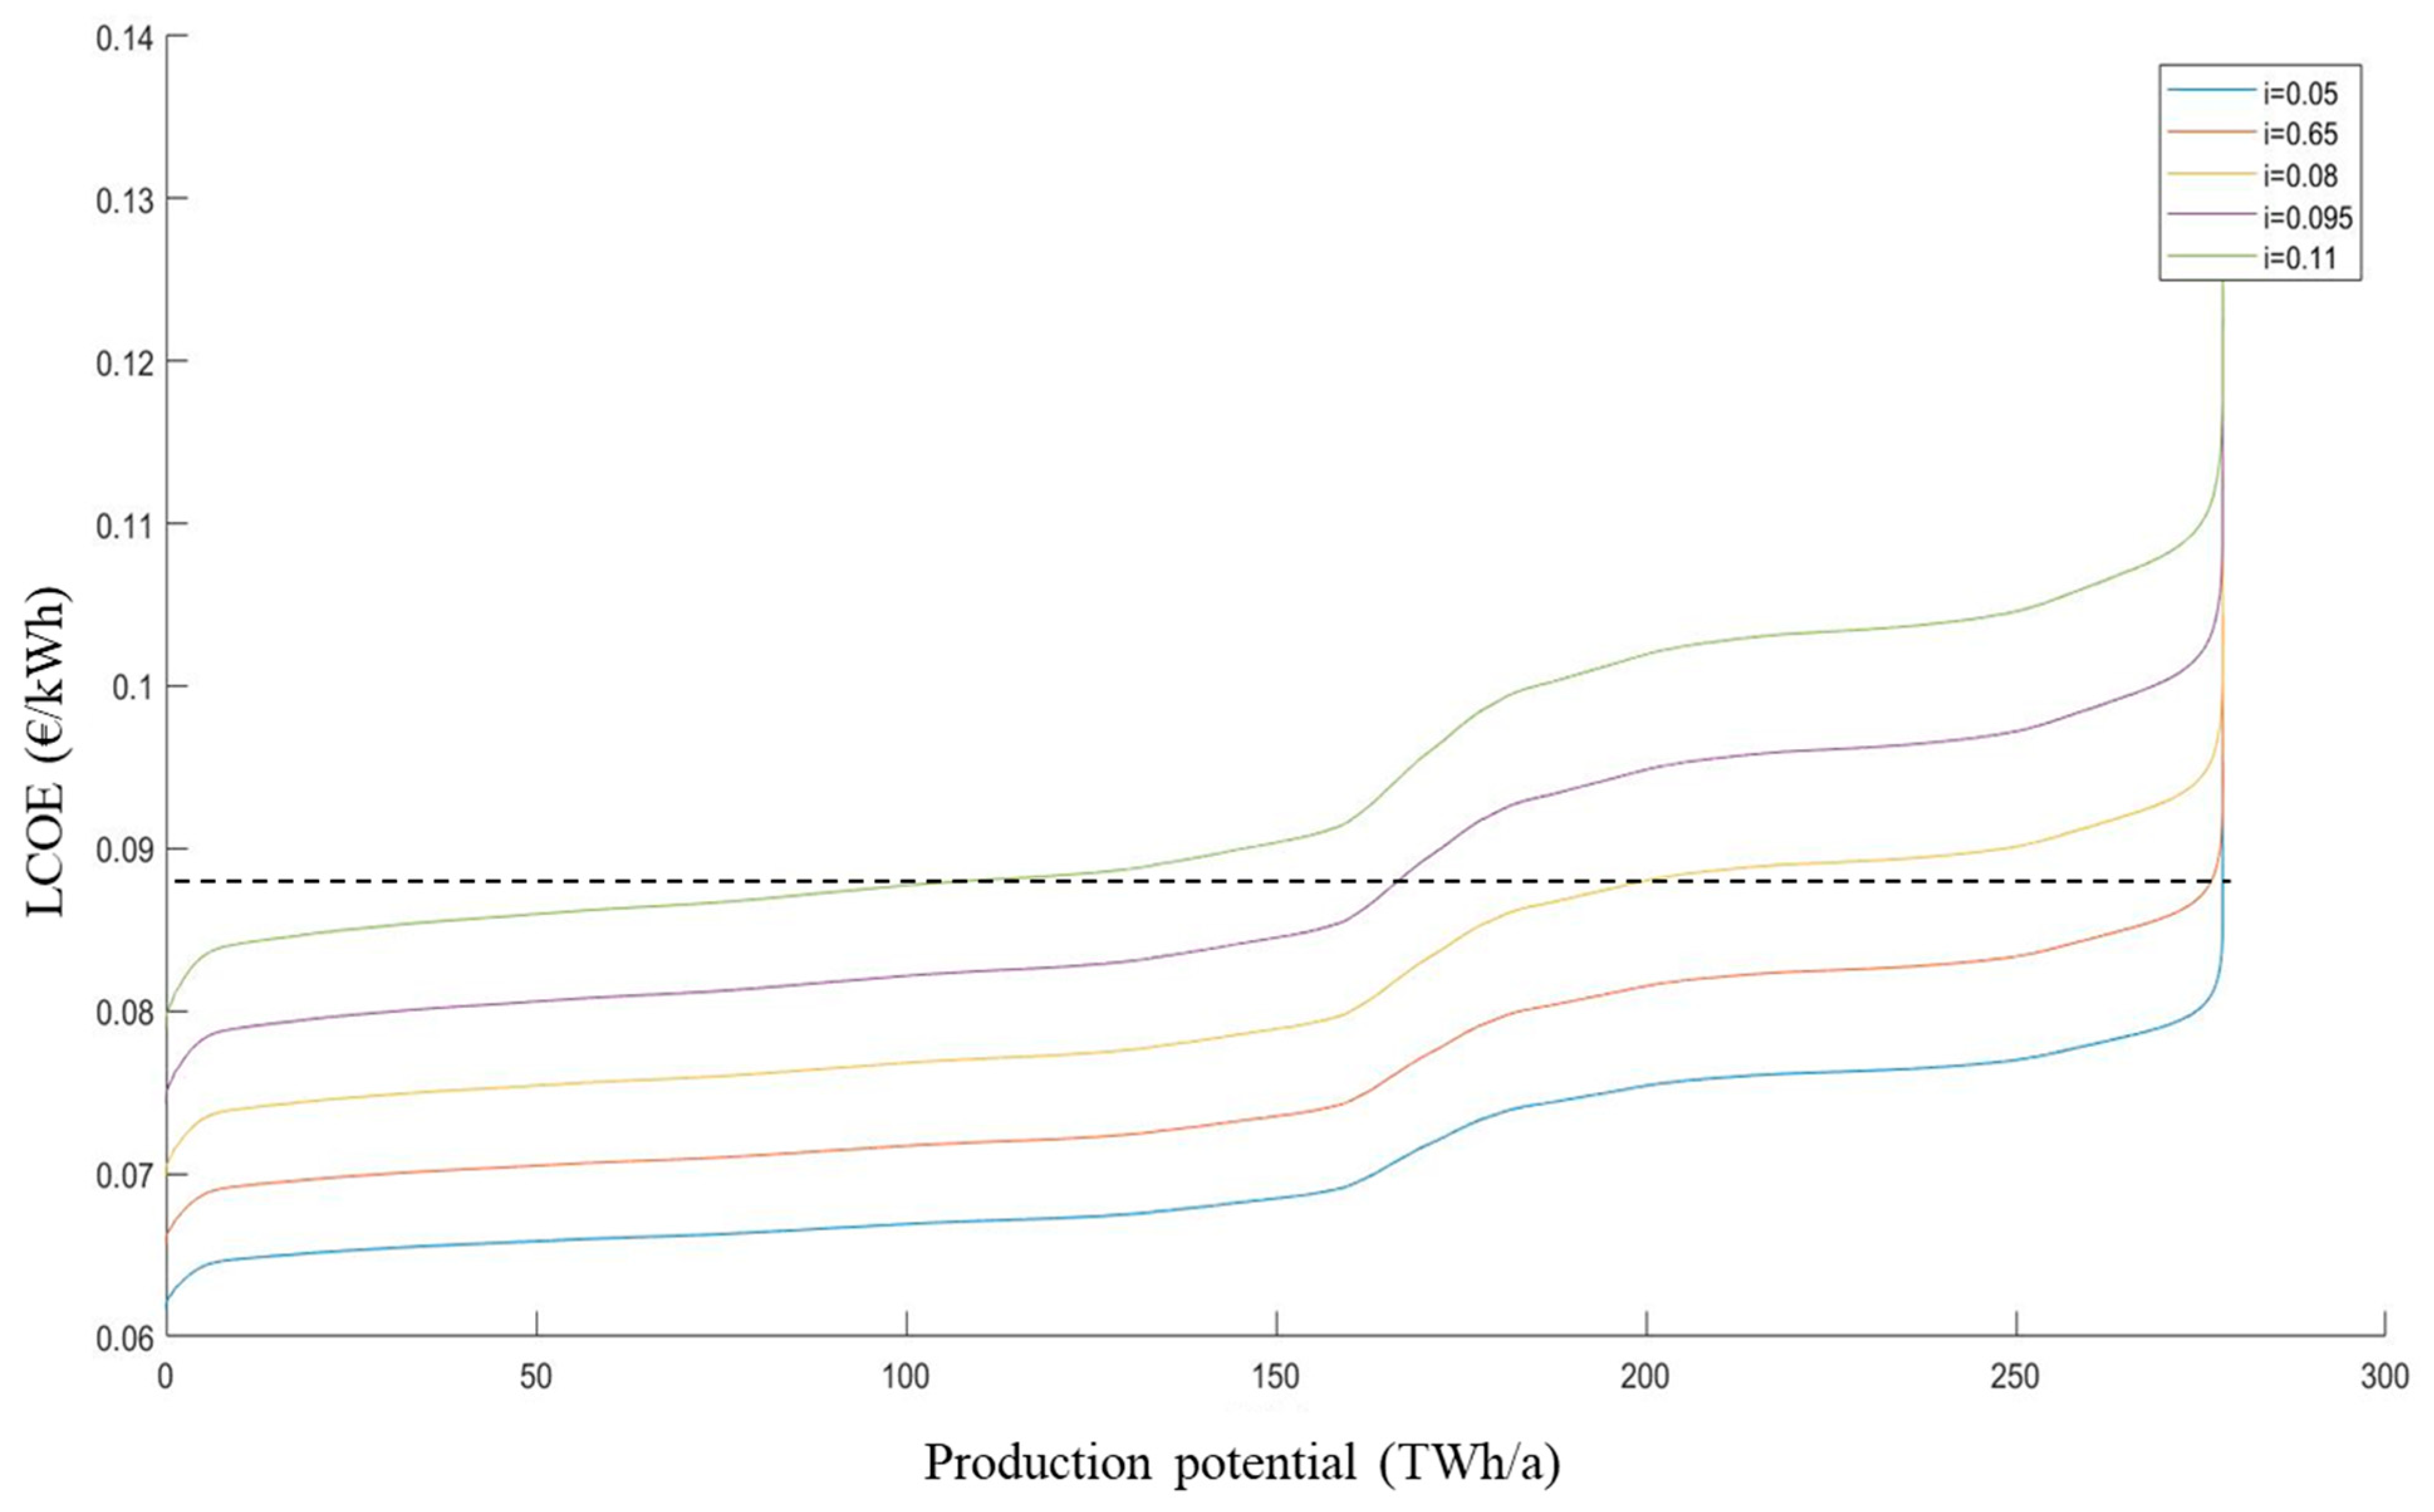
Figure 7 illustrates the cost–potential curves for monocrystalline solar deployment in Vietnam at different discount rates ranging from 5% to 11%. With varying rates of discount, the cost curve for solar PV in Vietnam shifts vertically. The total electricity potential in the case of considering monocrystalline and polycrystalline cells adds up to around 278 and 262 TWh/a, respectively. The total electricity demand in 2018 in Vietnam is 192.36 TWh, which implies that the total solar rooftop could cover the current demand of the country. However, Vietnam has only exploited about 0.1% of its potential [43].
The step in the curve (see Figure 7) results from the LCOE jumping from high irradiation in the southern part to low radiation to the northern part of Vietnam. It reveals the significant difference in solar irradiation along with the country, which causes a drastic increase in LCOE from south to north. Referring the LCOE results to FIT [51] reveals a favorable condition for the rooftop solar development because the FIT can cover the LCOE cost. Details of the relation between LCOE and FIT are discussed in Section 5.2.
Finally, we analyze the results of the present paper in the context of additional studies relating to rooftop PV in Vietnam. As compared to other studies in Vietnam, this method poses its advantages of providing a reasonably accurate result at low-cost (Table 4), even though it deals with insufficient data and meager budget. When normalizing for the area covered to 80% of the cities’ area, this paper determines the potentials for rooftop PV in HCM and DN with a relative error of 4% and 6% compared with the field study, respectively.
4.2.2. Sensitivity Analyses
Similar to many other developing countries, Vietnam has deficient and inadequate data conditions even to estimate rooftop PV potential at medium spatial resolution. It is worth mentioning that conducting such an assessment for countries with similar unfavorable data condition requires significant manual processing of inputs and maps, for example matching geographic and population distributions and building densities with 11,050 clusters of the topographic map in the case of Vietnam.
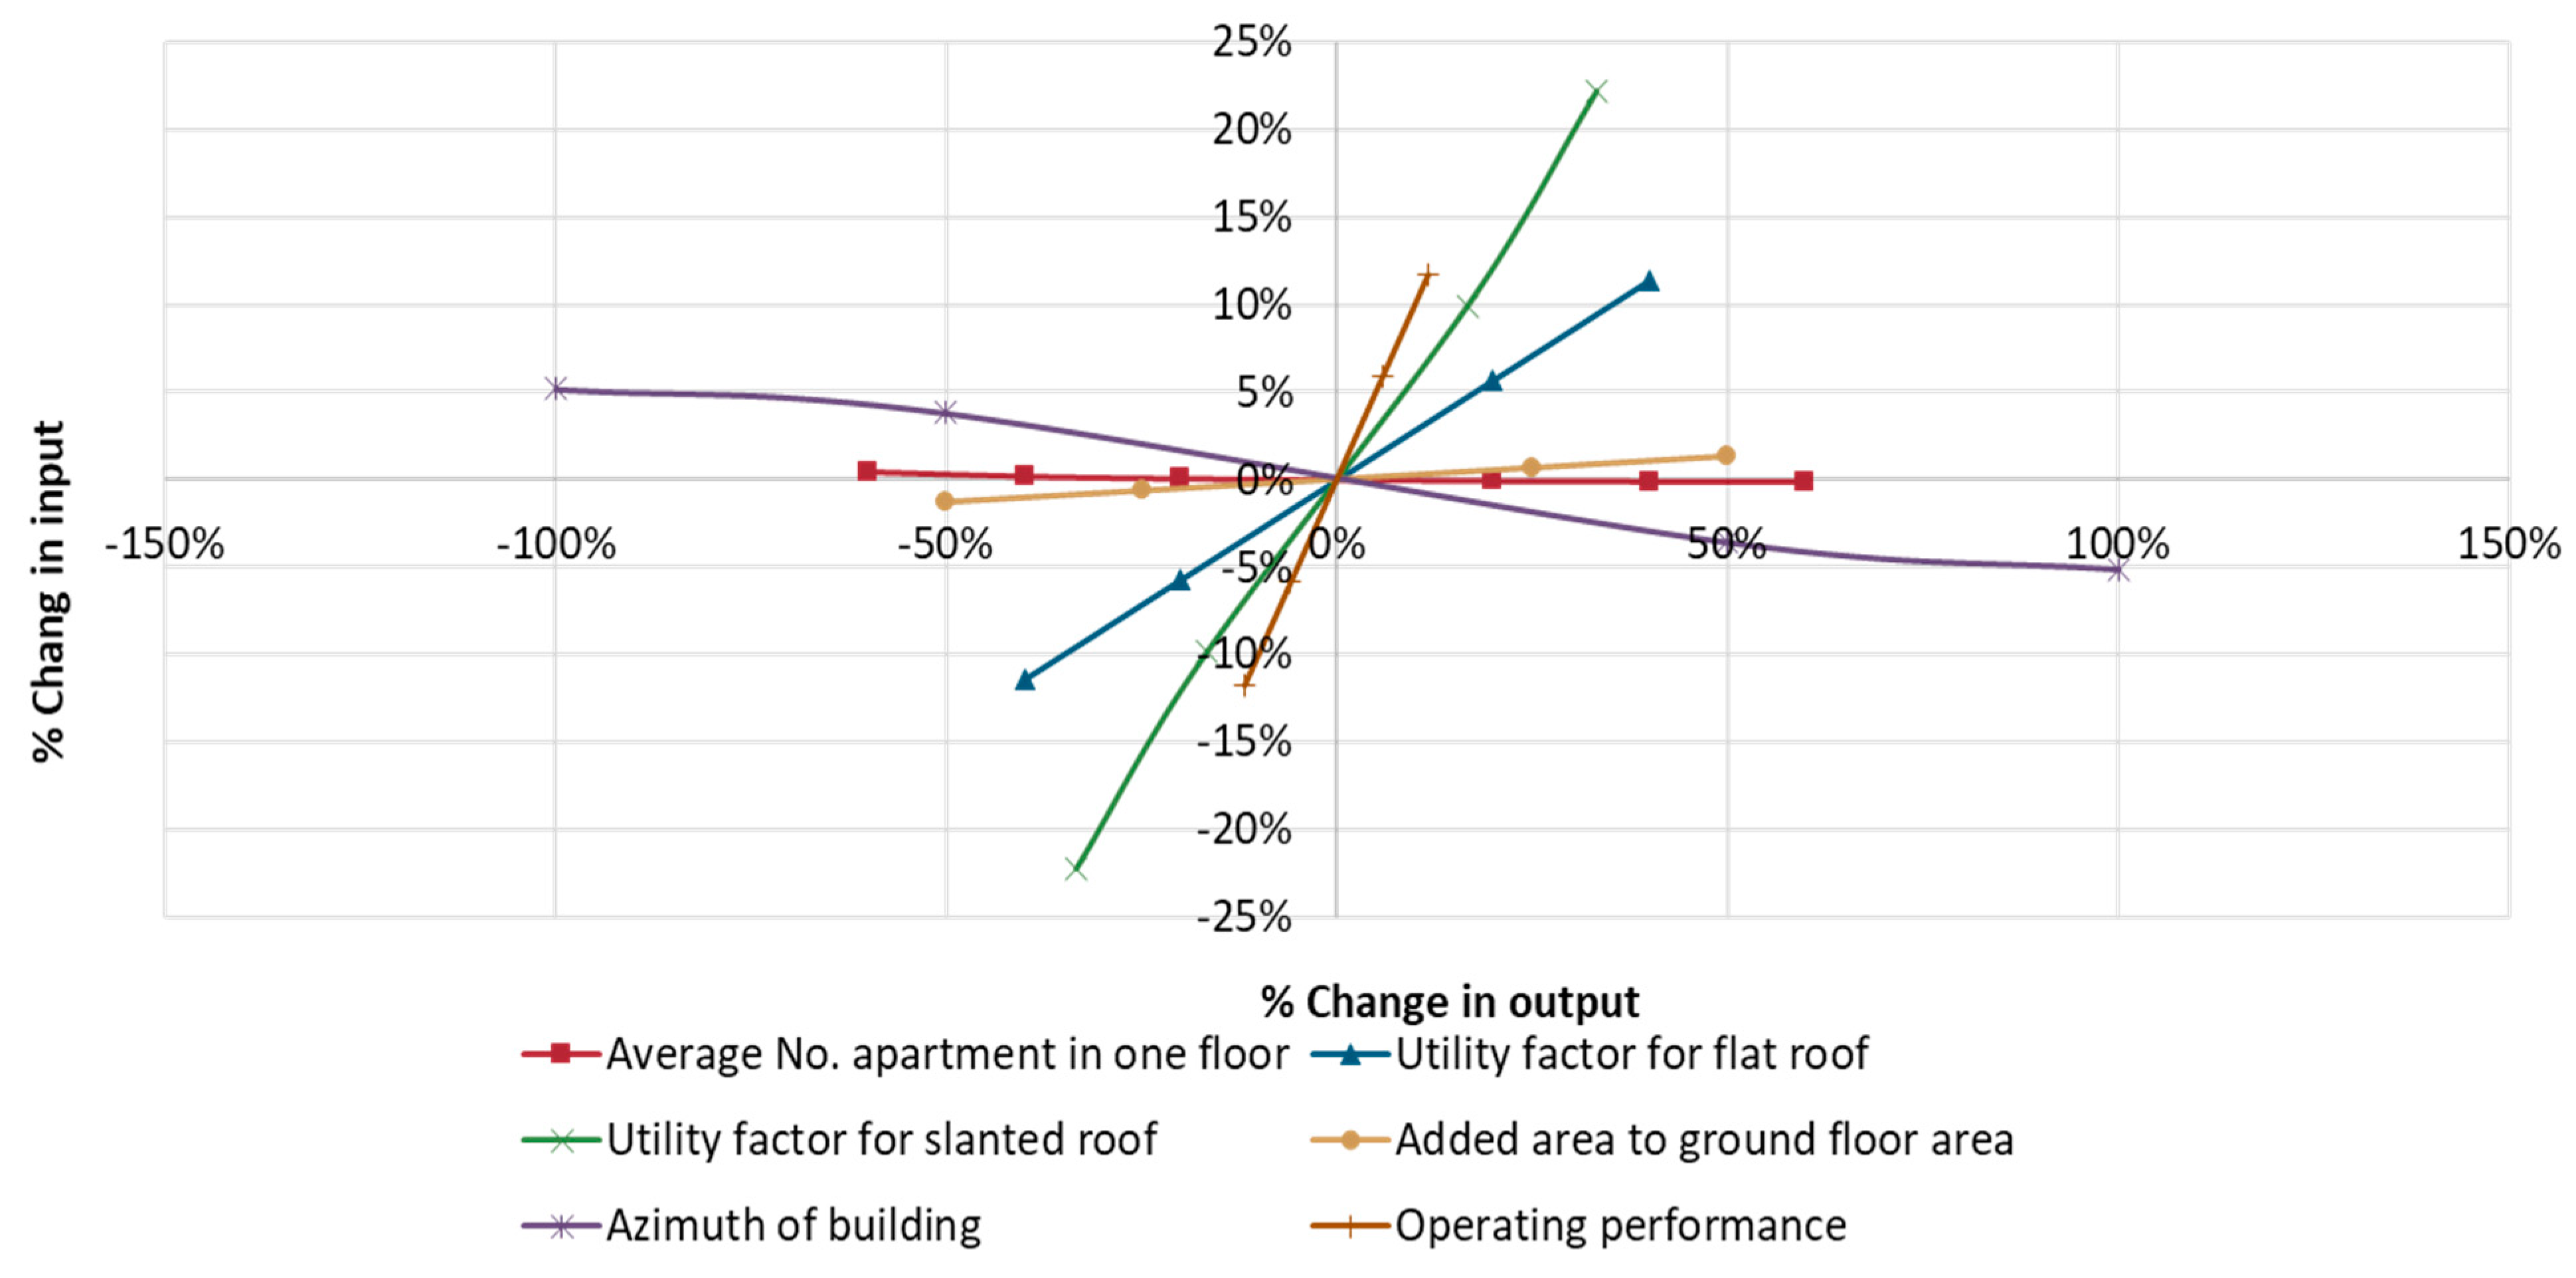
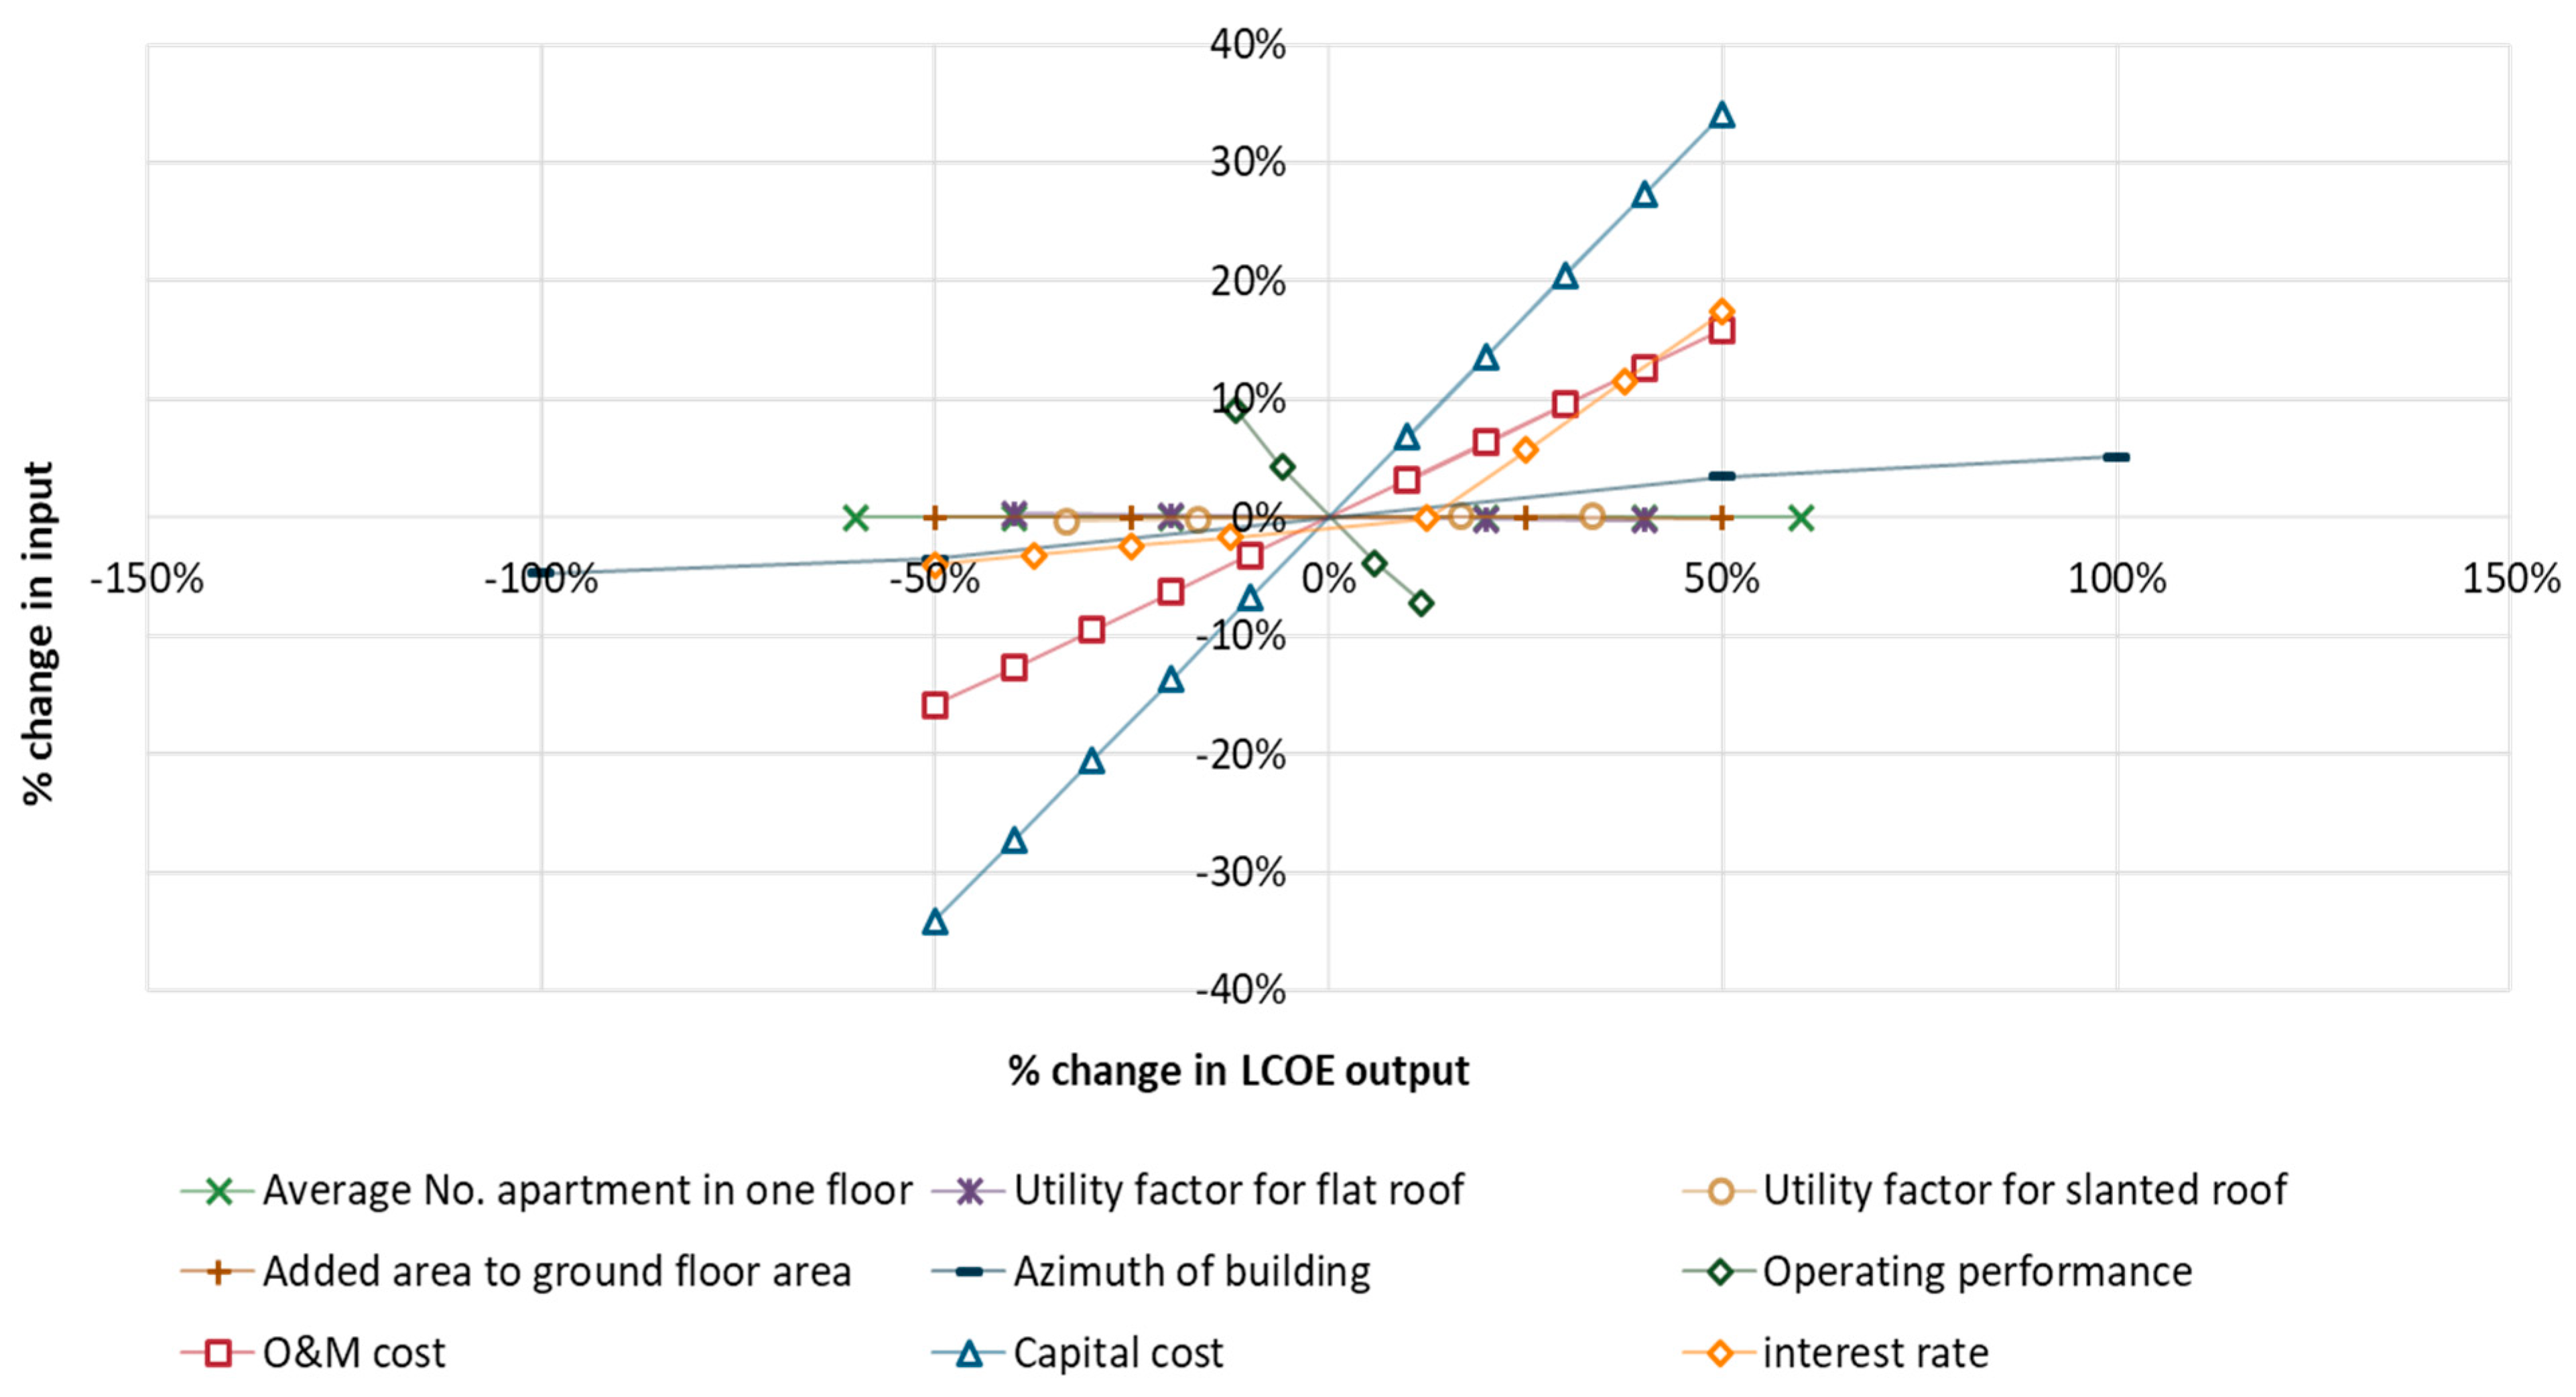
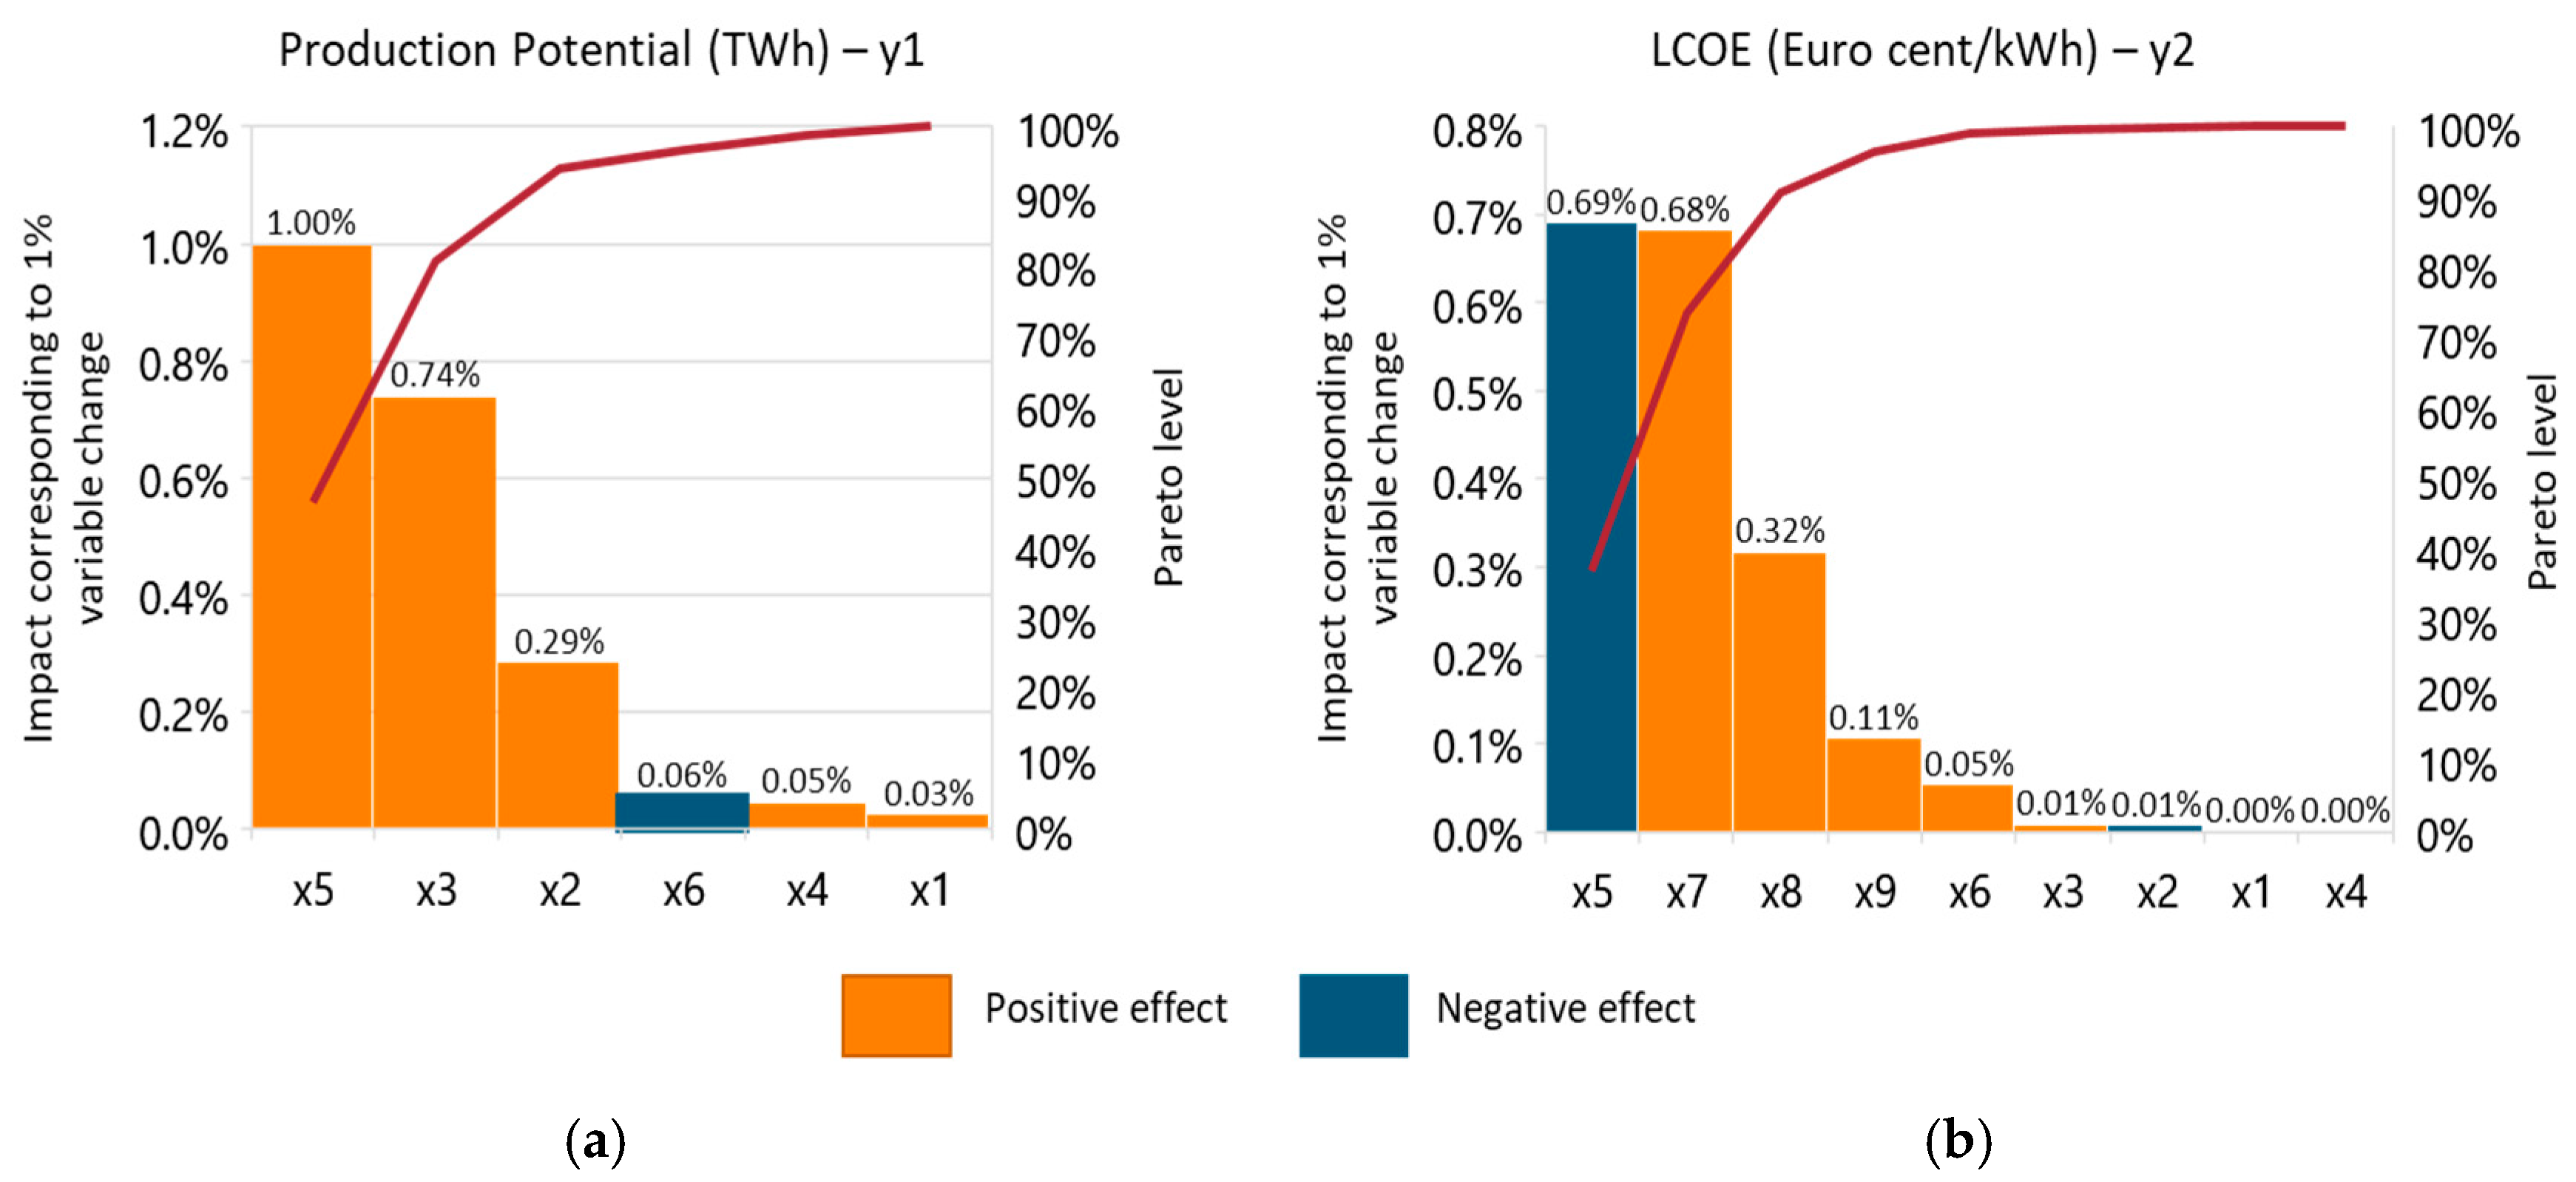
This section assesses the effect of each mentioned input or assumption on technical and economic potentials and identifies an acceptable confidence interval of every particular variable required to achieve specific confidence in the result. The results are demonstrated in Figure 8 and Figure 9.
The results show that, among the uncertain parameters that are used to calculate the geographical and technical potentials, the utilization factors for flat and slanted roofs and the efficiency or performance ratio of a considered PV system are the most critical parameters influencing the accuracy of the technical potential output (Figure 8). Considering the economic potential, all the uncertain geographical inputs, such as the average number of apartments on one floor in a building, area added to the ground floor area, and utilization factors for different roofs, are irrelevant to the LCOE output. However, technical inputs, especially the efficiency of the PV module, show significant effects on the LCOEs. Lastly, the economic data, such as costs and interest, have the most significant impact on the LCOE output, especially the capital cost (Figure 9).
To verify the correlation of the variation of these variables with the output, we use regression techniques, including curve fitting and linear fitting, to specify the model that provides the best explanation of the relationships between the uncertain parameters and outputs. The considered outputs are the technical potential (y1) and the LCOE (y2). The uncertain parameters are indicated below:
| x1 | Area added to a ground floor area | x6 | Azimuth of building | |
| x2 | Utilization factor for flat roof | x7 | Capital cost | |
| x3 | Utilization factor for slanted roof | x8 | O&M cost | |
| x4 | Average number of apartments on one floor | x9 | Discount rate | |
| x5 | Performance ratio |
Figure 10 shows the strong influence of the uncertain parameters on the outputs in descending order. Using the Pareto principle [53,54] indicating that roughly 80% of the effects come from 20% of the causes, this paper divides them into three groups. The first group is called “strong influencer”, which consists of x3, x5, x5, and x7 that are responsible for more than 80% of the impact on the technical and economic outputs, respectively. The second one is the “moderate influencer”, which includes x2 for technical output and x8 for economic output, and accounts for the next 15% of the impact on the outputs. The other factors belong to the “negligible influencer” group. By selecting impacts based on their strength, we can measure the change of the outputs based on the different possible alterations of the uncertain parameters, as in Equations (13) and (14).
y1 = 0.2851 x2 + 0.7401 x3 + x5 + 0.025
y2 = −0.6908 x5 + 0.6827 x7 + 0.3173 x8 + 0.3128x92 + 0.1965x9 + 0.364
The results show how dependent the output is on a particular input value. The performance ratio - x5 has the most significant impact on both outputs of the model, which are the electricity potential - y1, and the LCOE - y2. While the electricity potential is also changed considerably when the utilization factors change, the LCOE is not be affected by these two variables. It alters when the costs and discount rates vary.
These results can be used to assist policymakers for decision making by predicting the outcome of a decision in case they intend to change inputs using policy incentive/subsidy. It helps in assessing the riskiness of a strategy and in making informed and appropriate decisions. A detailed discussion of and examples for this argument are presented in Section 5.
5. Deriving Policy Implications from the Potential Assessment Results
Based on the results from the sensitivity analysis, we identified that factors including the performance ratio of the PV system, capital and O&M costs, and the discount rate are the variables with the most significant impact on the results of LCOE. To design a practical and transferable tool for policymakers in planning rooftop PV and a reference for stakeholders, this paper explores changes in each area when these variables change. First, we identify target groups based on their PV potential and demographic characteristics (Section 5.1). Then, we build the market distribution curves based on the techno-economic results and then observe the possibilities of shifting and bending distribution curves under different possible impact changes (Section 5.2 and Section 5.3). This paper compares different desirable policies to help policymakers select effective strategies to promote their desire for the rooftop PV market.
5.1. Defining Target Groups
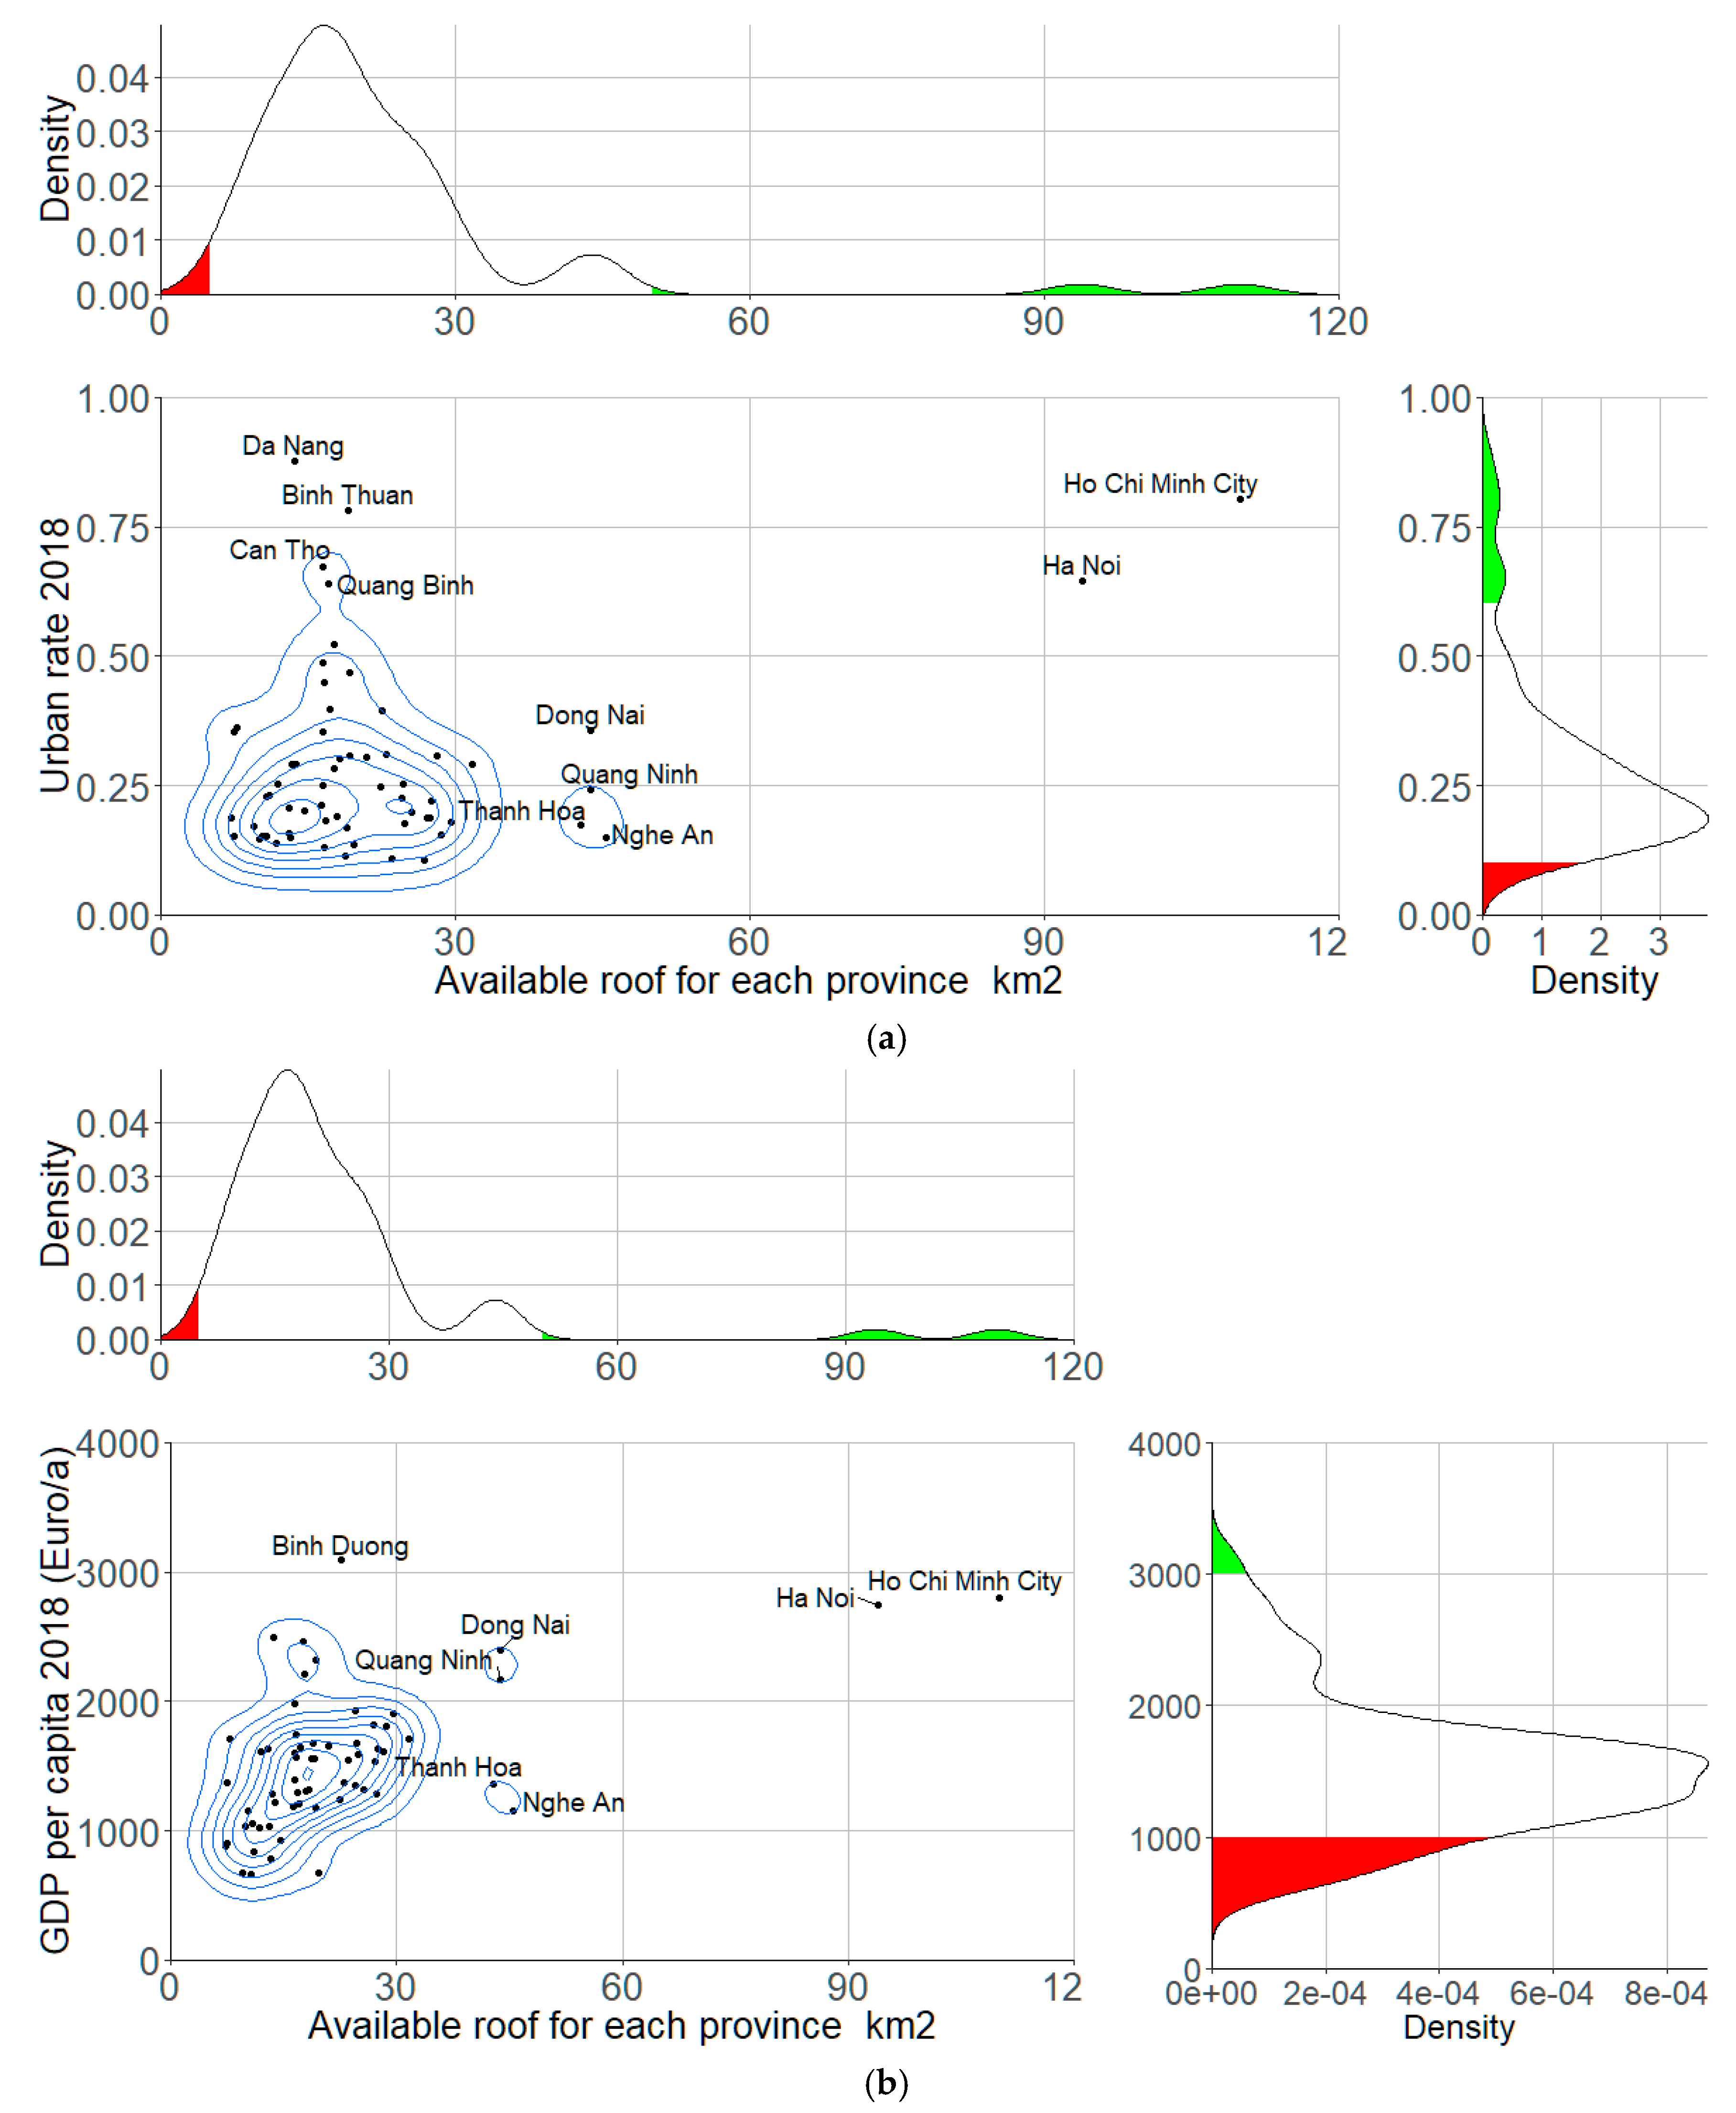
From the results in Section 4.2.1, national and regional governments can choose the most economic provinces directly from the potential ranking in Figure 6. However, the main drivers for solar development in developing countries are urbanization and GDP [2,55]. This means the chance of higher-income people investing in rooftop solar PV is higher in urban than in rural areas.
Figure 11 shows the available rooftop PV distribution corresponding to the level of urbanization (left) and the GDP per capita in 2018 (right) distributions in 63 regions in Vietnam. The distributions highlighted in red, which consist of 14 provinces, indicate the minimal potential area, with less than 5 km2 of roof area, 15% of urbanization, and 1000 Euro/a income. The green distributions illustrate the outstanding potential area, including nine provinces with more than 35 km2 of the available roof, 60% of urbanization, and 2000 Euro/a income. Details of potential assessment results and demographic indicators can be found in Table A2 and Table A3.
Because most of the provinces have a relatively low (15–60%) urban rate and humble economic (1000–2000 Euro/a income) development, the success of the first adopters plays a crucial role in the new market due to their potential impacts on followers. To improve rooftop solar development, the role of local and government authorities is equally essential. However, in practice, sub-national or local governments are constrained by limited resources, weak institutional capacity, inadequate mechanisms, and limited availability of information [3,7,26,29]. These circumstances, as well as the complication of land ownership and attractiveness, constitute a narrow space for the policymakers to encourage rooftop PV development at the local level without significant support from the government. This means that there is an obvious need for selecting target groups that is unified from national to local levels.
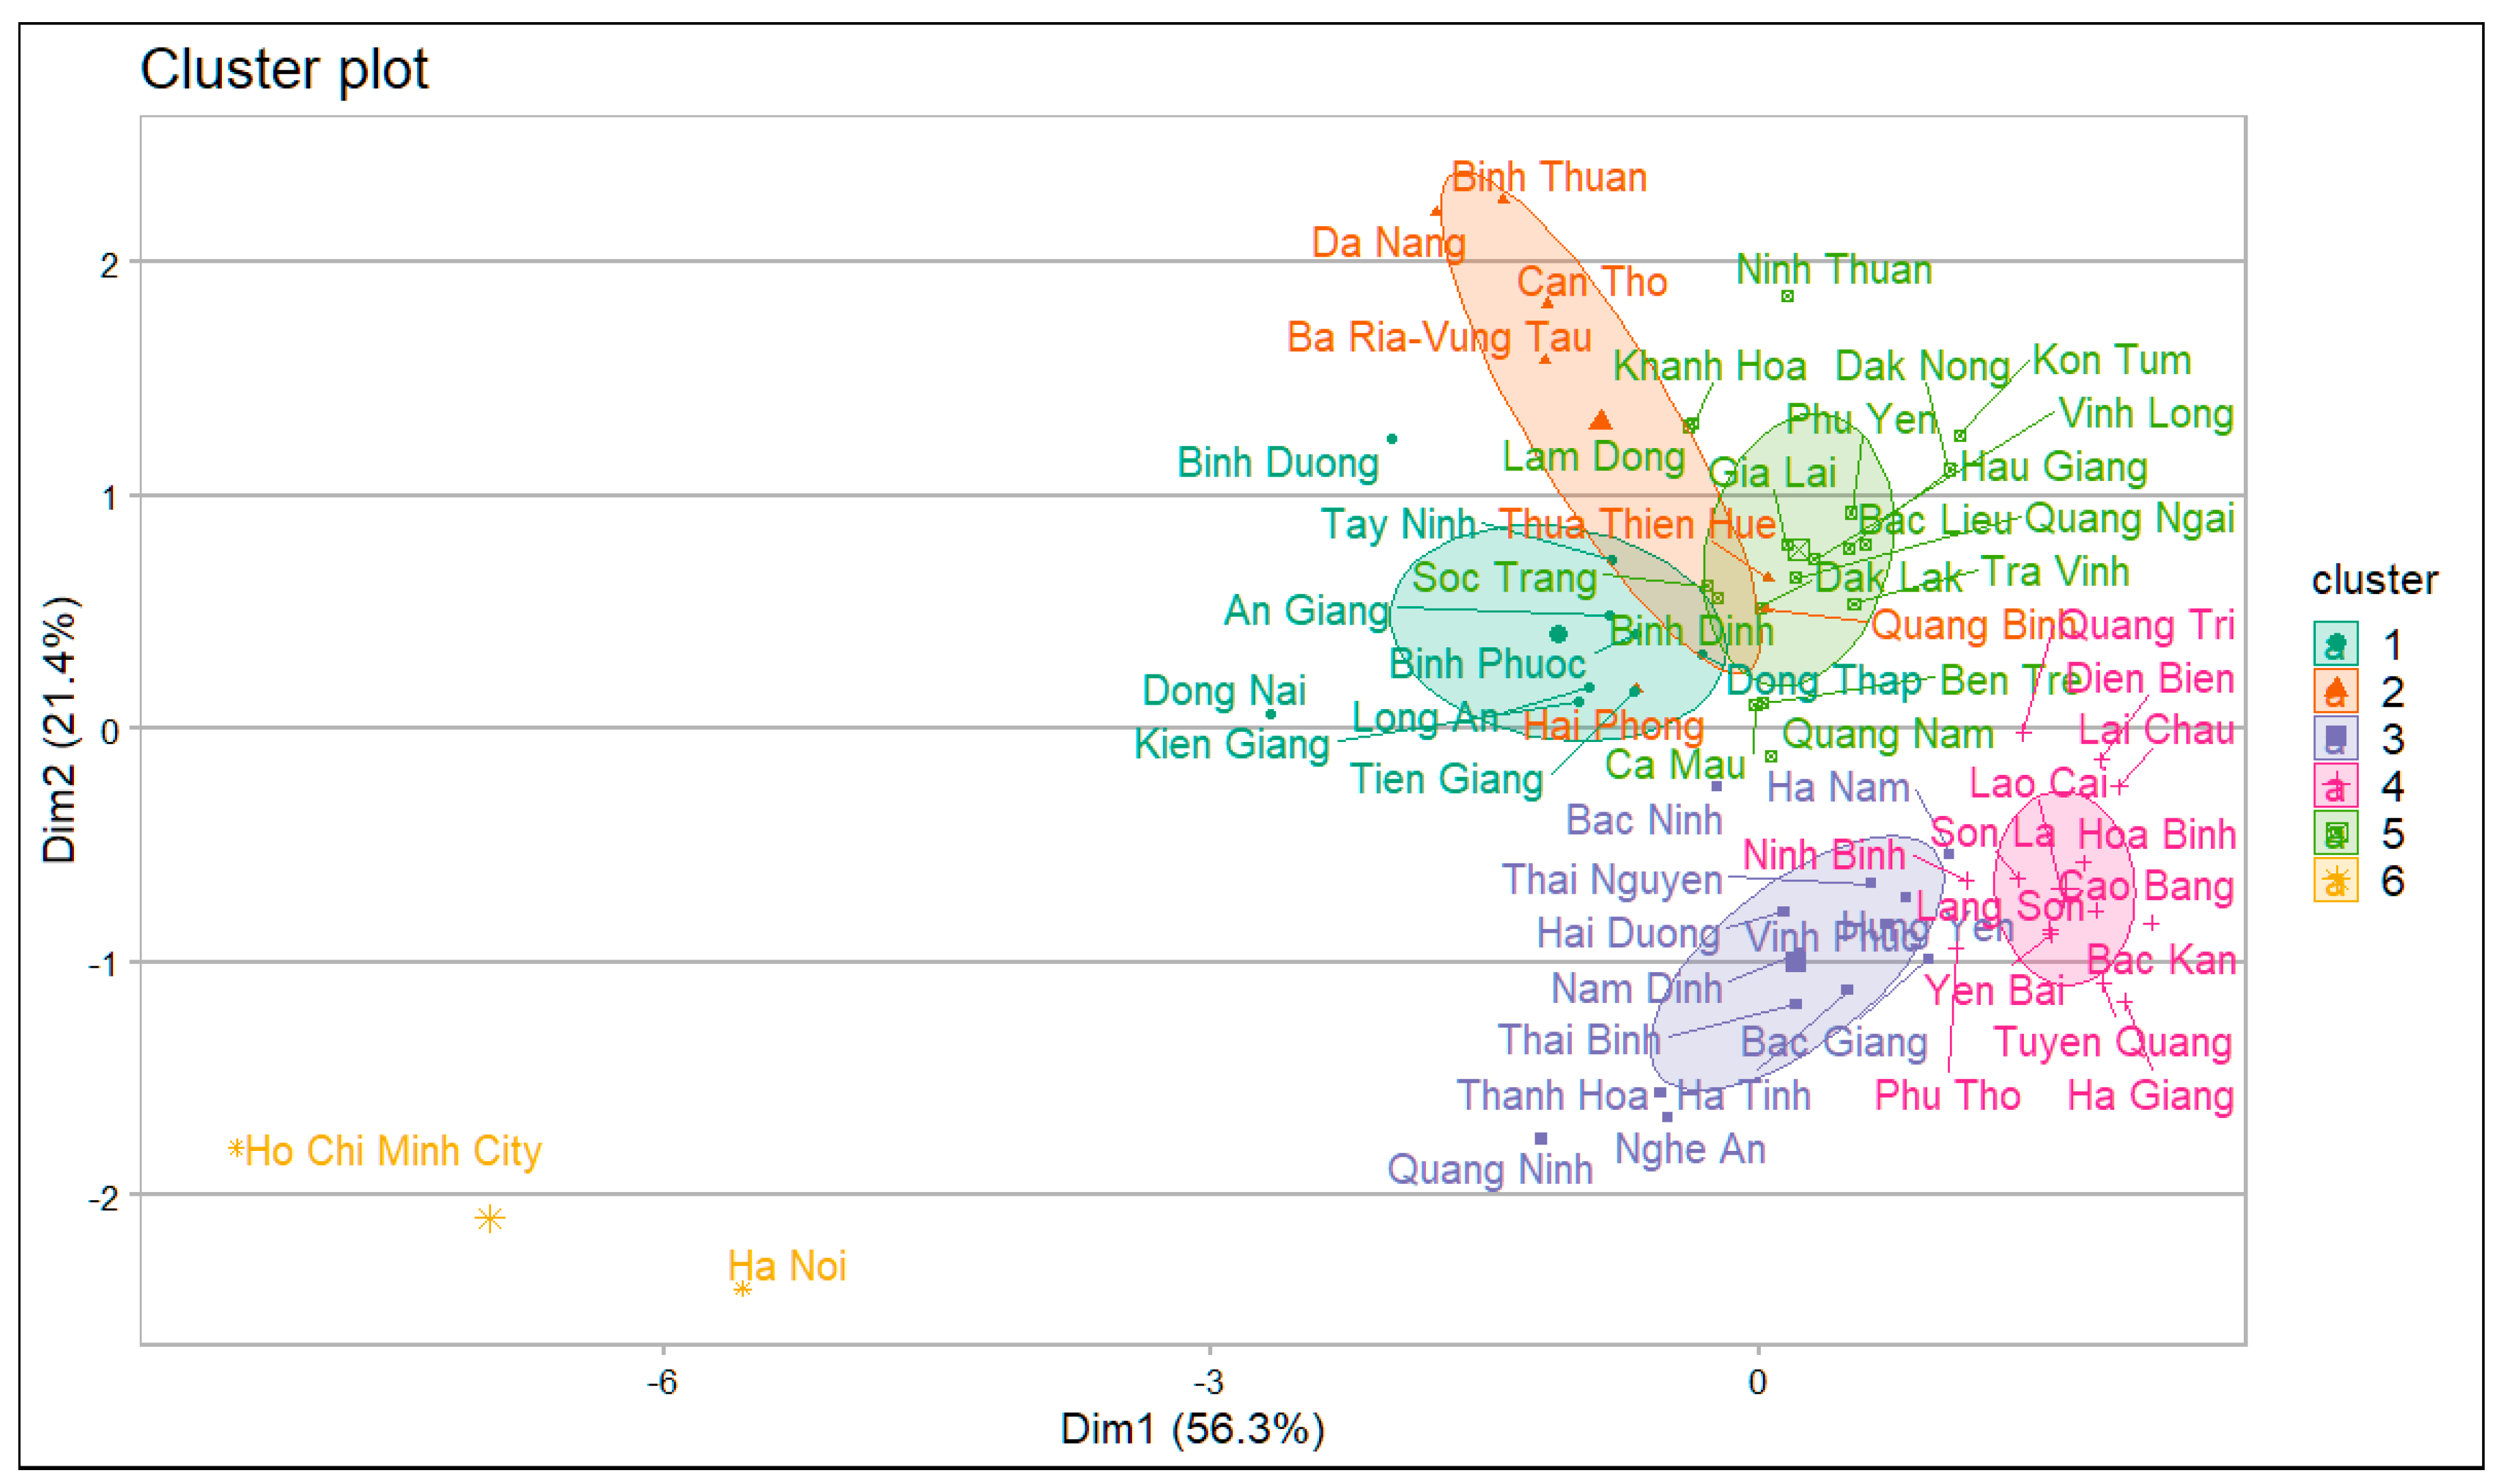
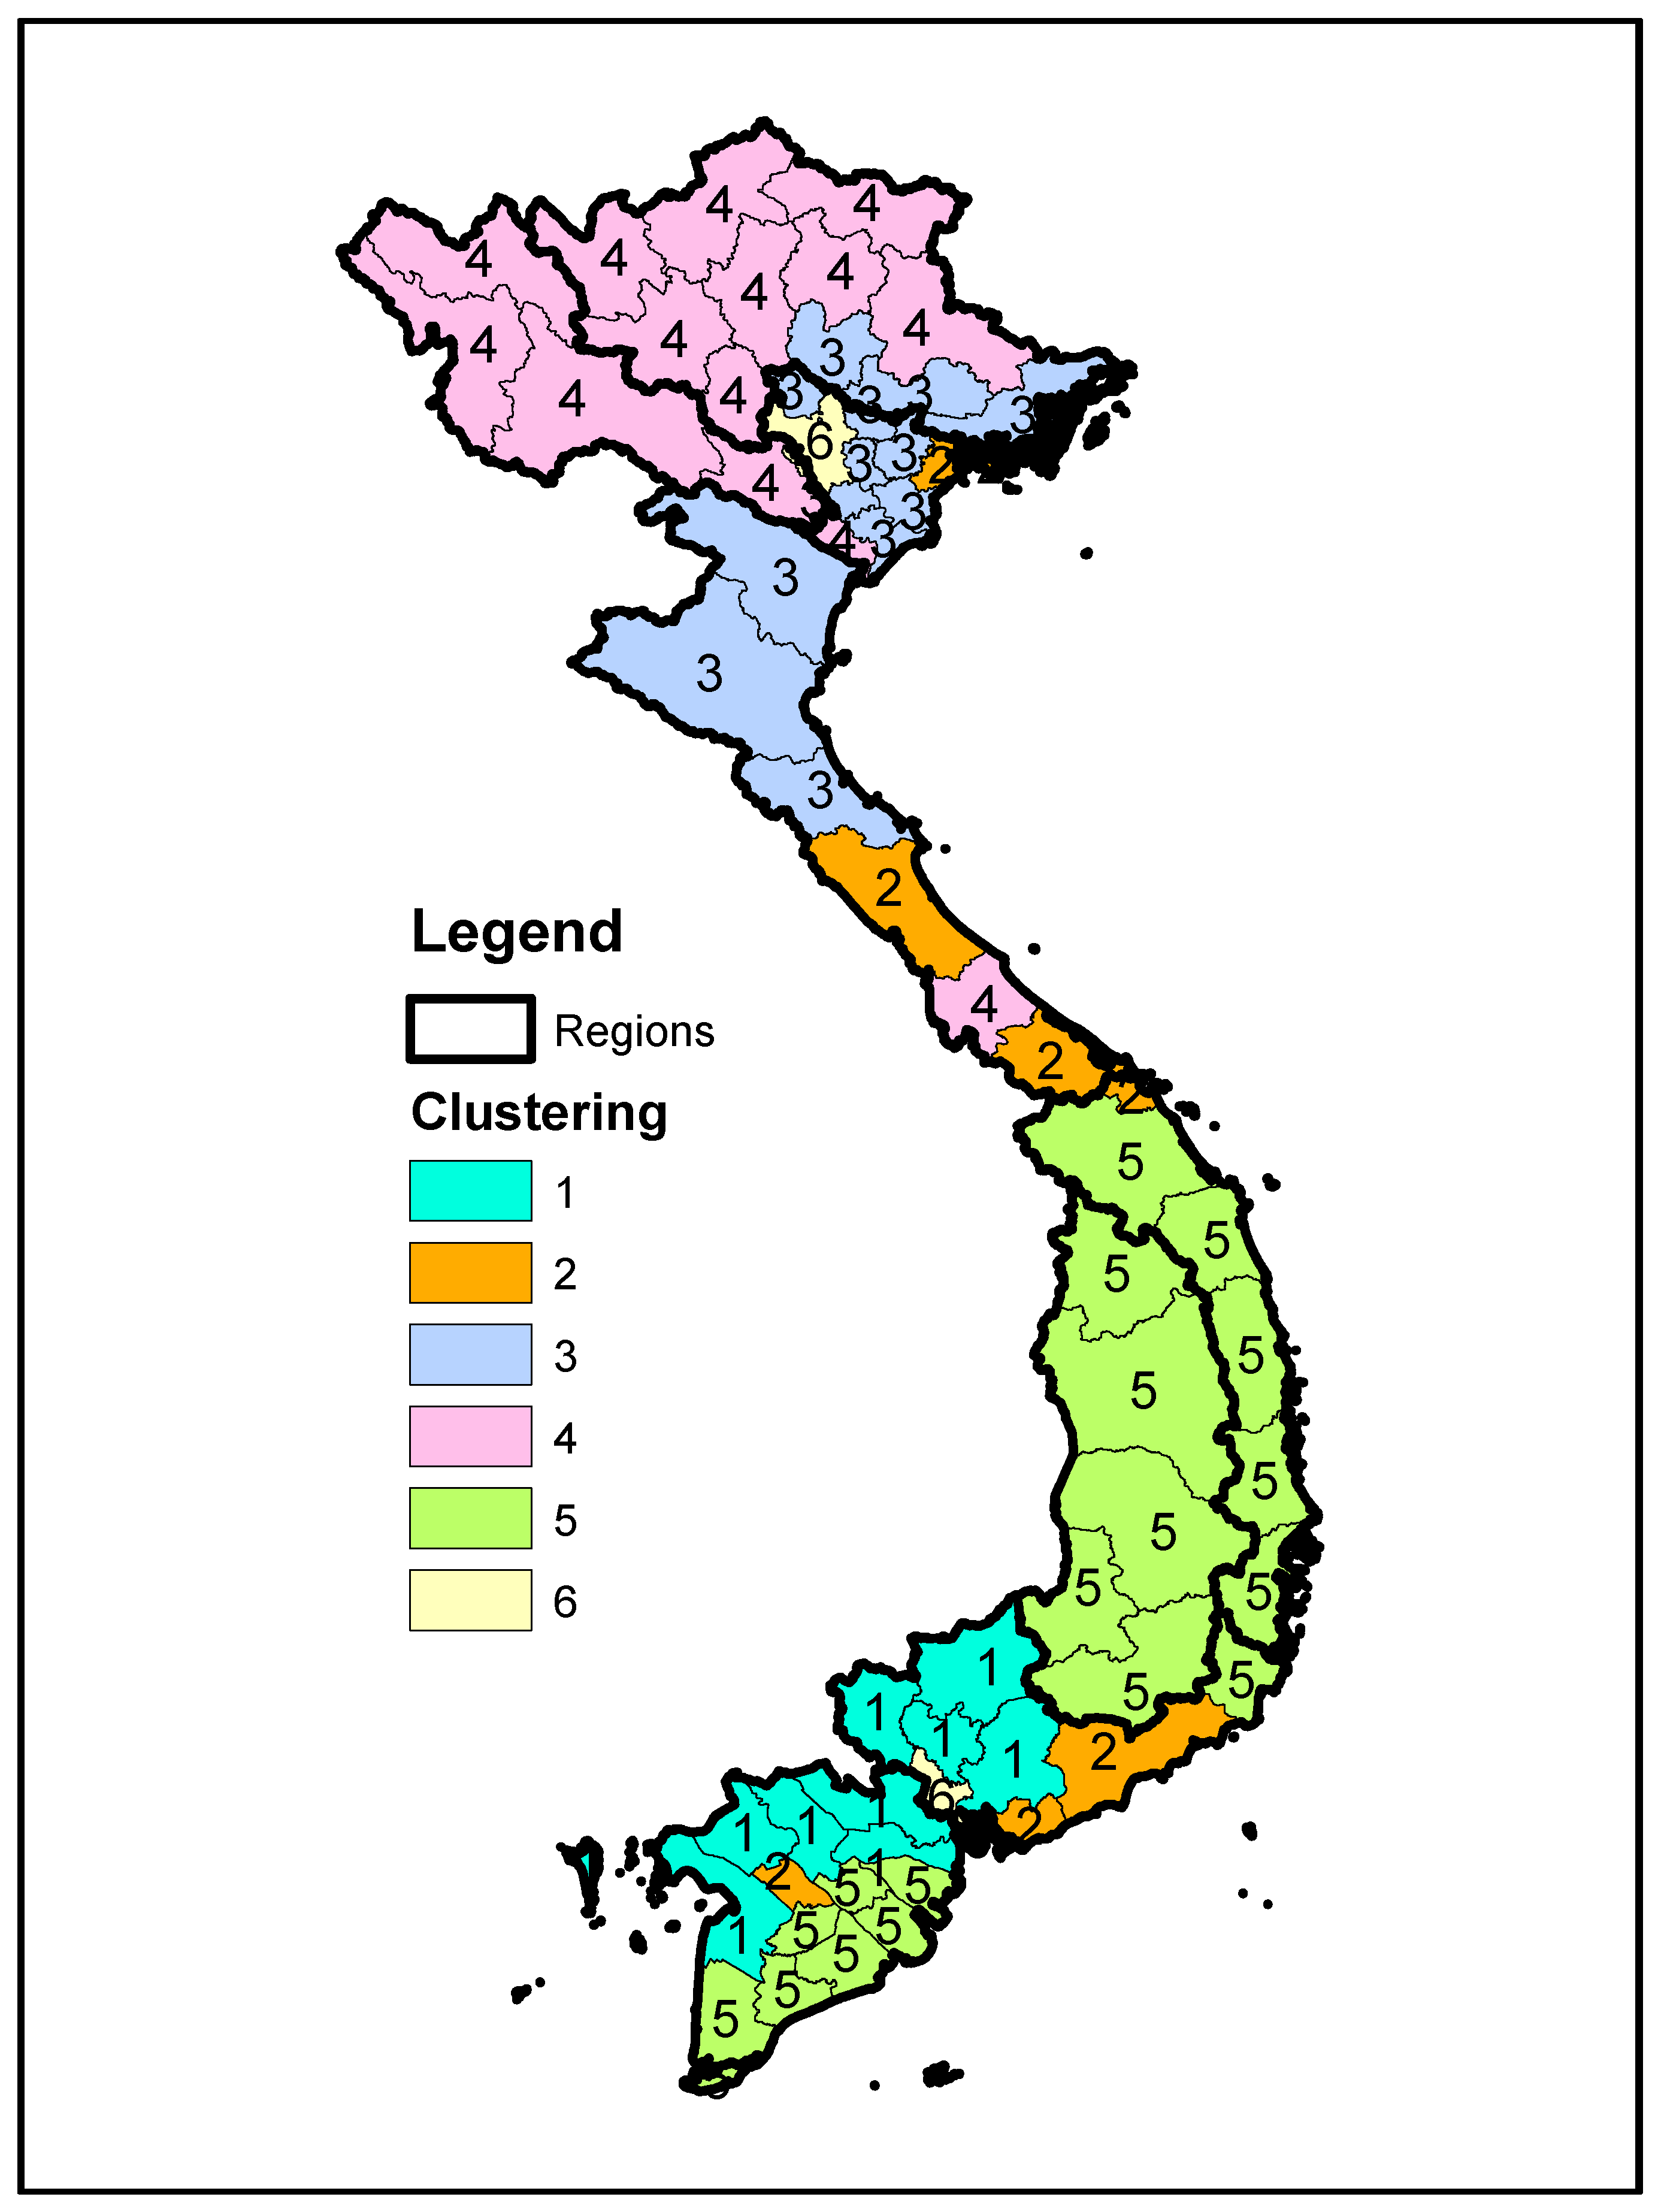
Based on the market characteristics, this paper suggests determining target groups based on k-means clustering of the development dynamics of 63 provinces in Vietnam with the criteria, i.e., their techno-economic potentials including the available roof (km2), the production potential (TWh/a), LCOE (Euro cent/kWh), the level of urbanization (%) [47], and GDP (Euro/a) [47] (See Table A2 for detailed information). The results are shown in Table 5, Figure 12, and Figure A1. Because there are more than two dimensions (variables), Table 5 shows the principal component analysis and plots the data points according to the first two principal components (Dim1 and Dim2) that explain the majority of the variance and shows an illustration of the clusters. Figure A1 shows the clusters corresponding to their geographic position in the country.
Ranked in order of priority for rooftop PV policies, Hanoi and Ho Chi Minh are classified as Priority 1, which requires the most policy focus due to their most favorable condition for rooftop PV development, followed by Ba Ria Vung Tau, Binh Duong, Can Tho, and Da Nang. Detailed clustering and priority ranking results for each region can be found in Table A4.
The results do not only recommend policy priority but also support national policymakers to redirect and balance the PV development between different regions. For example, the government can provide a favorable policy to the higher LCOE but potentially fast-uptake regions, e.g., cities and provinces of Priorities 1 and 2.
5.2. Assessing the Market Attractiveness and FIT
Rather than just analyzing the sensitivity of the output analysis to changes in the variable assumptions, as above, this section also looks at the probability distribution of the outcome in order to make decisions or take actions accordingly. Scenario analysis is designed to analyze the change of output regarding the different sets of inputs and then based on the various possible outcomes. In this paper, we use competitive prices to compare the potential benefit of installing rooftop PV between different scenarios. The competitive prices are the differences between the FIT and LCOE and between LCOE and the grid tariff ((Equation (15)).
Table 6 summarizes the different possibilities of different metering models concerning LCOEs and grid tariffs. The business model indicates that residential customers can sell generated electricity on the grid to the system operator. The self-consumption model indicates that consumption of PV electricity takes place directly at the house/building—either immediately or delayed through the use of storage systems.
The results support policymakers in making decisions and testing the robustness of an effect. By understanding the relationships between input and output variables, policymakers can encourage rooftop PV market development in certain areas by keeping the risk of investors at a comfortable level. With each specific decision, policymakers can measure the effect coverage, as well as the cost and benefit of their choice, and can compare and therefore decide which action should be taken.
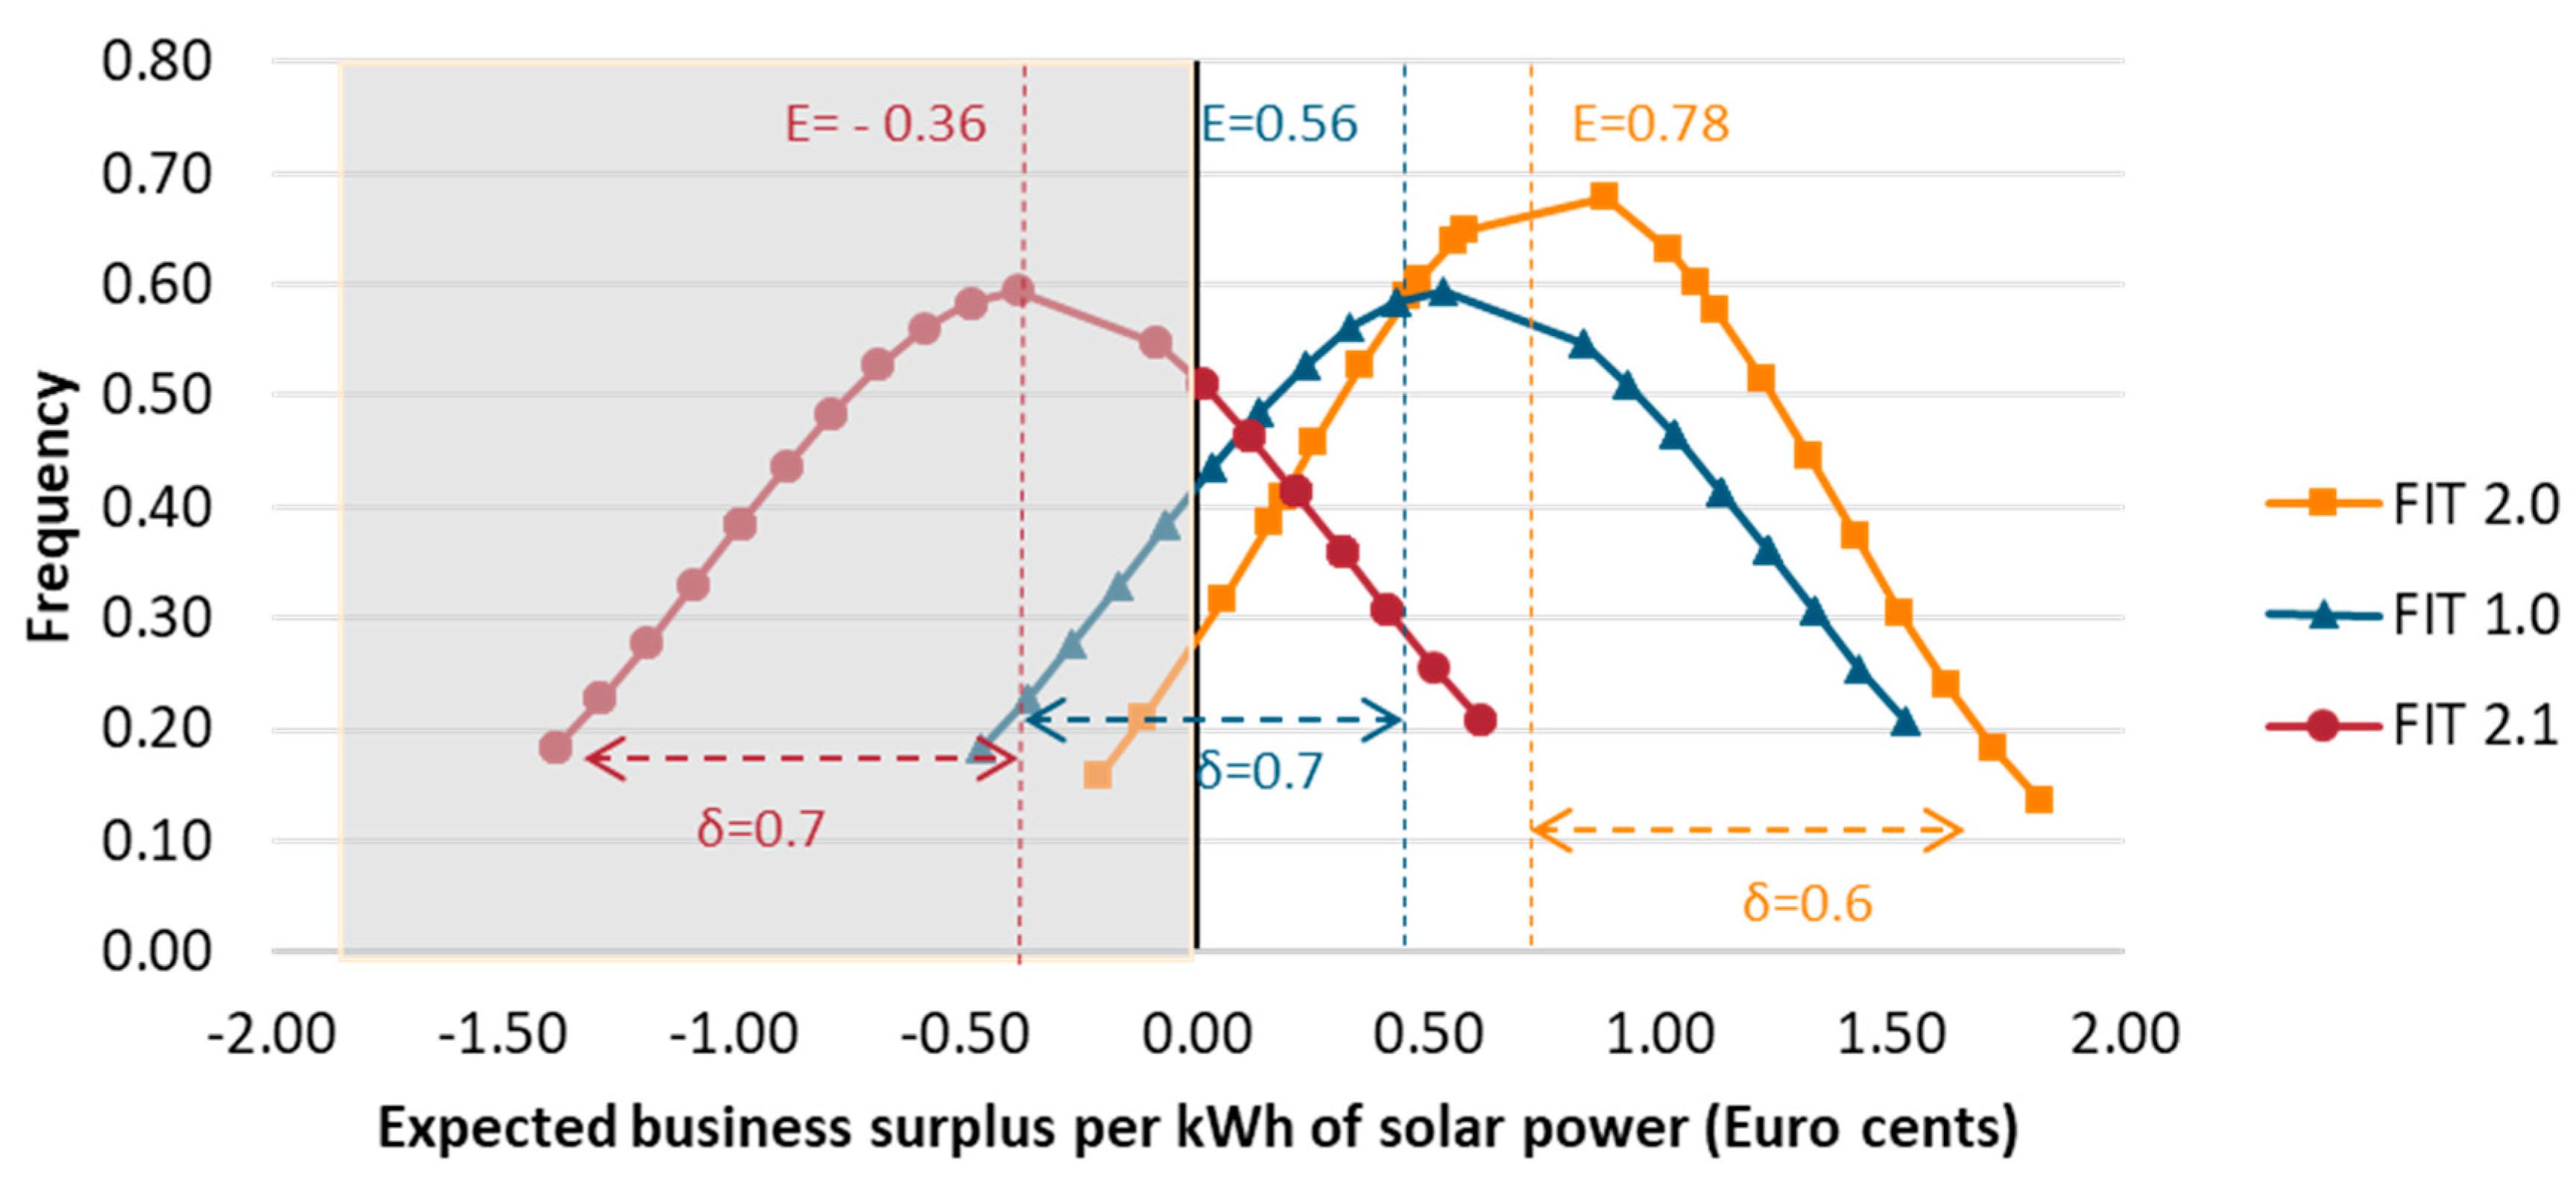
Vietnam has an attractive solar market. However, it is undergoing a period of intense transformation. In 2017, the Vietnamese Ministry of Industry and Trade (MOIT) introduced the first FIT, called FIT 1.0, of 8.83 Euro cent/kWh for all solar projects under Decision No. 11. It officially laid the primary foundation for solar power development. To promote market development, in February 2019, MOIT released the draft Decision with new FITs, called FIT 2.0, of an average of 9 Euro cents/kWh for rooftop solar [56] to replace Decision No. 11. FIT 2.0 proposed FITs ranging from 7.45 to 10.26 Euro cents/kWh depending on the four classified irradiation regions of Vietnam. However, in December 2019, a final draft submission letter from MOIT (with a signature but no stamp) for another FIT, called FIT 2.1, has been internally circulated. The FIT 2.1 for rooftop PV projects would be set at 7.91 Euro cents/kWh (Currency exchange rate (Nov 2019): 1 Euro = 1.06 Dollar US), which is around 1 Euro cent/kWh less than the first proposal.
This paper compares the effect of the three FITs on the fledgling market (Figure 13). FIT 1.0, set at 8.83 Euro cent/kWh, generated significant interest in the whole market, especially in the southern regions of Vietnam, which have the highest levels of irradiation. If this price was maintained, the Vietnamese rooftop market would continue to flourish. The expected total return per kWh of the whole market for rooftop PV would be 0.56 Euro cents (blue line). However, 24% of areas would remain unattractive.
If the FIT 2.0 was approved, it would create a momentum pushing the entire market moving up and to the right of the coordinate axes. This means the expected profit per kWh would increase by 0.12 cents in all localities (orange line). By increasing 0.07 cents/kWh of the average FIT and specified regional price, FIT 2.0 would increase the possible activated market from 76% to 92% and create an additional exploitable 56 TWh potential, equivalent to a possible of 28 million Euro of profits. More than 30 provinces could show their aggressive competition of more than 1 Euro cent profit per kWh.
While the FIT 2.0 promises a bright future for rooftop PV, only some areas may qualify for the FIT 2.1 if the Prime Minister agrees with this approach. More than 60% of the market would be pushed into a difficult situation (red line), causing damage of 900 million Euro in the whole market (Table A5). The possibility of suppressing development or even market recession due to this FIT 2.1 needs to be borne in mind [57].
5.3. The Role of Grid Tariffs and PV Module Costs in Self-Sufficiency Developments
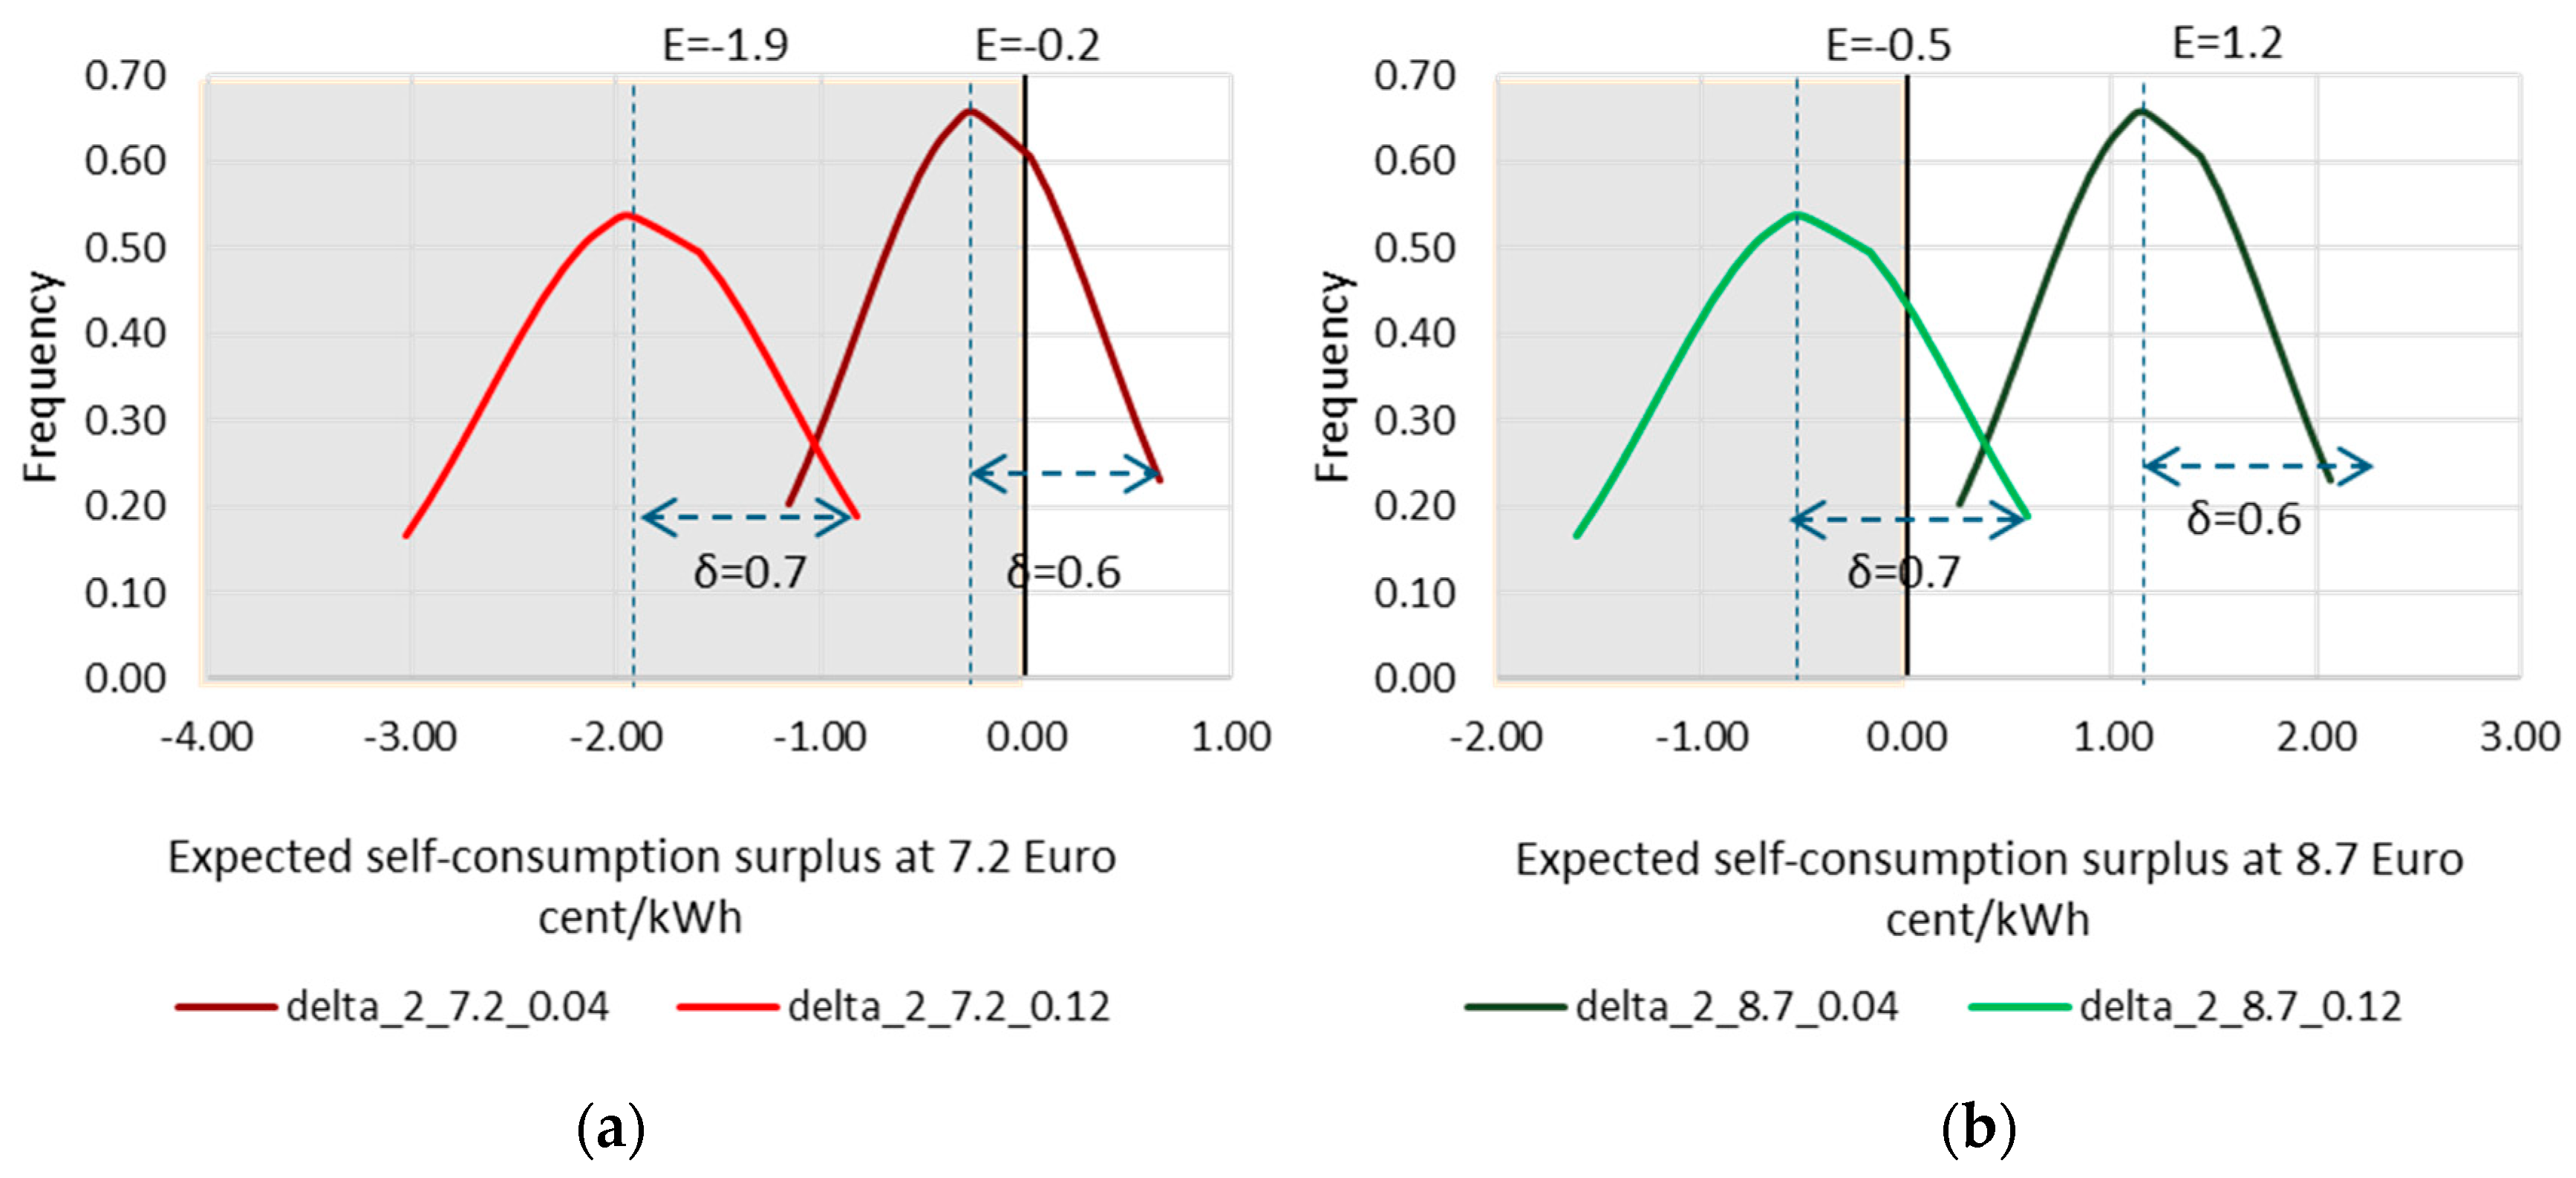
According to Vietnam EVN reports, the country’s retail electricity price is projected to gradually increase by around 6.12% per year so that the electricity supply units, including EVNs, can offset costs. This paper analyzes the grid tariff changes reflecting on the self-consumption rooftop PV market by ranging it from 7.2 Euro cent/kWh in 2018 to a projected tariff of 8.7 Euro cent/kWh in 2025 (Figure 14). The left chart displays the current market with the grid tariff of 7.2 Euro cent/kWh with different discount rates of 4% and 12%. The right one presents the market when the grid tariff increases to 8.7 Euro cent/kWh. Increasing the grid tariff undeniably creates a favorable condition for the self-consumption business by increasing the expected benefit to −0.5 and 1.2 Euro cent/kWh at a 12% and 4% discount rate, respectively. Detail results for each region can be found in Table A6. As the grid tariff increases, the chance for self-consumption will also increase. However, it should be noted that, even though the policy seems to be effective in encouraging rooftop PV development, it faces many mixed reactions from the public. While researchers and banks complain that electricity price policy in Vietnam is inappropriate for investment because of its relative low grid tariff compared with the grid tariff in neighbor countries [58,59], the increasing grid tariff has led to an increase in the price of finished products, making it particularly tricky for domestic manufacturing enterprises and public consumers.
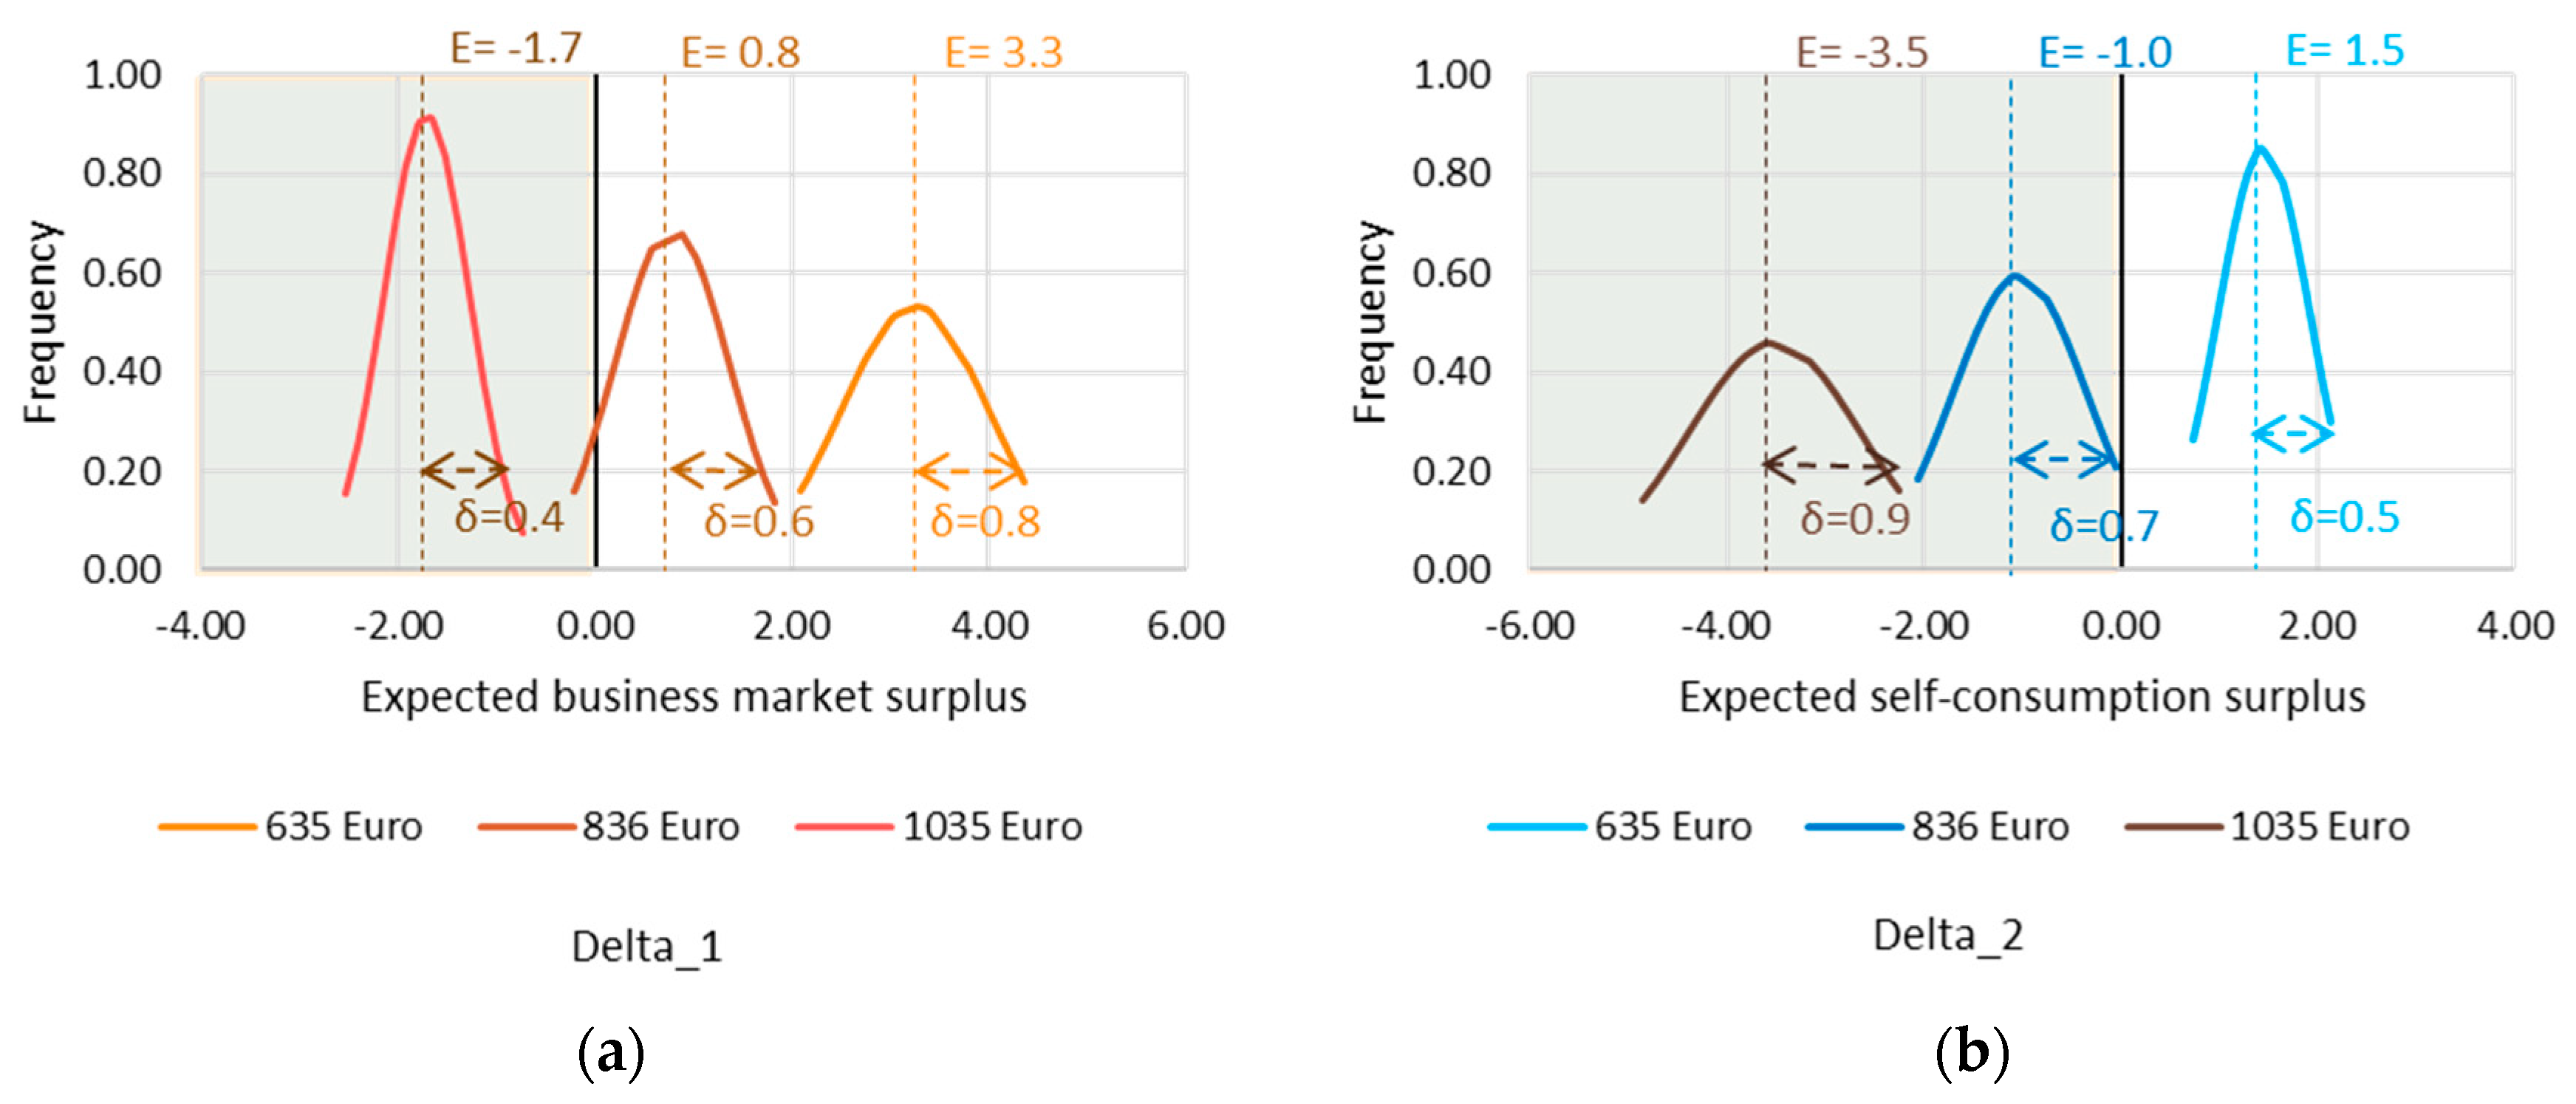
In this paper, we observe the effect of the reduction in specific investment for rooftop PV in Vietnam by adjusting the capital expenditure (CAPEX) of the small rooftop PV systems (1–15 kWp), which will also affect O&M costs (OPEX). The current total costs (CAPEX + OPEX) range from 635 to 1038 Euros/kWp in Vietnam. At a discount rate of 8% and under the FIT 1.0 or FIT 2.0, the business project can expect an average benefit ranging from −1.7 to 3.3 Euro cent/kWh and the self-consumption project can expect from −3.5 to 1.5 Euro cent return per kWh (Figure 15). If the total cost is lower than 650 Euros/kWp, it is feasible to invest in either of the metering models. However, the projects, whose total cost is higher than 836 Euros/kWp, are not recommended in Vietnam.
Rooftop PV technology is becoming more efficient and cost-competitive compared to other traditional energies. A dramatic decrease in the average wholesale price for crystalline modules is reported in China with a reduction from about 530 to 400 Euros/kWp in less than two years from 2016 to the first quarter of 2018 [60]. Moreover, while in 2005 solar modules constituted almost 75% of the system costs, this share amounts to around 50% today, even for rooftop PV systems [60]. In light of the reduced prices for crystalline modules in the global market [60,61], if the total cost for a rooftop PV system is lower than 650 Euros/kWp, it will provide a significant impetus to self-sufficient developments for the rooftop PV market in Vietnam.
5.4. Critical Discussion
A cost-effective and transferable methodology for rooftop PV potential assessment in developing countries has been developed. The accuracy of the proposed method has been improved. However, challenges related to the data input still exist. The paper uses digital maps, which are prepared by using satellite imagery, combined with a manual spatial data collection method to conduct geospatial analysis. For example, the final map of Vietnam requires matching geographic and population distributions and building densities within 11,050 clusters of the topographic map in the case of Vietnam. The uncertainty issue arises when different maps often exhibit different accuracy levels depending on their application and spatial extent. The final map incorporates the mistakes of all component maps. The geo-referencing errors, the tilt angle of the sensor, the spatial resolution of the digital data, etc. affect the accuracy of the final map. The performance of the raster map of Vietnam in monthly means compared to measurements at 11 ground stations results in a mean bias error of −0.05 kWh m−2 day−1 (which represents −1.2% in relative mean bias error) and a root mean square error of 0.32 kWh m−2 day−1 (8.3% in relative root mean square error) [49]. The data collecting methods and the limitations/errors associated with those methods disturb the spatial accuracy. For example, different classification and interpolation methods were used in preparing the population distribution map for data presented with different errors of around 2–5% in the final map [47]. This paper conducts a sensitivity analysis to assess the effect of these uncertainties on the final results.
This paper considers the temperature and solar radiation, which have significant effects on the performance of photovoltaic (PV) systems; PV cell temperature, which is related to the ambient temperature; and the solar radiation incident on the PV surface, which depends on the slope and azimuth of the PV panels. Another factor that affects the solar radiation incident on the PV surface and hence influences its performance is the ground reflectance (albedo). This paper does not consider this factor due to the renowned complicated vertical distribution of cloud and aerosol layers of Vietnam [62]. Moreover, based on the literature, the albedo effect seems to be relatively small in Vietnam. Vietnam has a diffuse broadband solar irradiance (310–2100 nm) with the normalized solar wavelength of 532 mm [62]. The corresponding albedo spectrum and the effective albedo value, thus, range from around 5% to 15% and 0.1 to 0.35, depending on the rooftop materials such as brick, red shingle, ceramic tiles, and green paint, respectively [63]. The effective albedo can lead to errors of less than 1.6% and 6.7% for the module tilt angles from horizontal of 40° and 90° [64]. Further studies, especially field studies on a small scale, can use this effective albedo value to optimize PV system design and take advantage of the reflected albedo resource.
This study improves the accuracy of technical potential output by calculating the corrected temperature based on the NOCT model. As mentioned in Section 3, NOCT is obtained under predetermined environmental conditions, while STC is the test condition used to rate the performance of a PV panel. STC is the idealized condition, which can overpredict PV performance [65,66]. Since the NOCT is based on realistic data, it is simple and easy to apply. Manufacturers usually include NOCT in the module characteristic data. However, NOCT can overpredict the PV cell temperature by around 10% [67], and can also vary around 2–5 °C, depending on the module materials [68]. Thus, it can underpredict the PV performance [36]. Another option for calculating the expected PV system yield for specific provinces or even buildings is the free online tool PVGIS, provided by the European Commission [69]. The tool uses the real measured values of solar radiation at specific location and provides an overview information about PV system performance. However, while PVGIS is certainly more accurate for a specific building, it would not be feasible to perform a national analysis with this tool.
When calculating the cost for decentralized PV generation technologies, this paper uses LCOE, which is the most widely used metric for a cost comparison between different generation technologies. However, since the renewable energy share in total electricity supply increases, it poses a difficulty for LCOE to make comparisons between different categories of supply, e.g., residual load, load following, and variable load. Another concern regarding LCOE is that it is becoming more difficult to justify applying the same weighted average cost of capital to technologies with very different climate policy risks. To deal with these drawbacks, the new measure, called the Value-Adjusted Levelized Cost of Electricity (VALCOE), is now recommended by the IEA [70], which includes three adjustments to LCOE: energy, value, and flexibility. Although the VALCOE may be a better measure of cost for grid managers, the IEA needs to provide the data for the added factors from their World Energy Model (WEM) regional hourly dispatch models. Once these data are available and the flexibility value, outside of the WEM model, in the VALCOE equation, are well defined, future studies can replace LCOE by this new measurement.
6. Conclusions and Policy Implications
Rooftop PV is driving the decentralization of electricity production, which is a cornerstone of the sustainable development concept, whereby households become more independent of the electricity grid due to a thorough integration of renewable energy sources. However, it is still often seen as a novelty, and legally, local authorities have difficulties enforcing this specific technology in their detailed development plans partly because of the lack of expertise and capital. Therefore, it is relevant to address decentralized PV potentials as early as possible when the state and local governments start planning for the type of energy source. Since different regions have different climatic, geographic, and demographic profiles, this paper provides an affordable, robust and high-resolution potential assessment for rooftop PV and suggests target groups alongside policy solutions with clear national and local goals, based on the findings. The proposed method considers construction and design constraints, obstacles on the rooftop, and the proper orientation on the roof, including shading effects and the slum areas (informal settlements). The paper considers Vietnam as an example for other emerging countries to apply the method. The results can provide an overview plan as well as an integrated strategy for developing rooftop PV between different administrative levels.
The physical potential in the raster maps, which encompasses the maximum amount of solar energy received in a particular area, is broken down into the geographic potential of in total 1407 km2 available rooftop by gradually excluding the zones reserved for other uses and restricting the locations where solar energy can be gathered. The technical potential is calculated with the results of roof-mounted solar cells in the whole country being about 228 and 216 GWp or about 278 and 263 TWh/a with monocrystalline and polycrystalline solar cells, respectively. The LCOE is also calculated, ranging from about 7.6 to 9.2 Euro cents/kWh at a discount rate of 8% in 63 provinces in Vietnam. However, since the techno-economic potential of PV is associated with a certain degree of uncertainty, we measure the error regarding the uncertainty of data assumptions and inputs and the inherently unknowable reaction of the market. Overcoming the unfavorable data conditions, this paper provides a practical and useful tool for policy-making processes. We suggest dividing the market by target group and priority level based on their PV potentials, demographics, and economic status. Hanoi and Ho Chi Minh City should be classified as the highest priority cities for policy focus based on their high potential and robust internal economic and demographic conditions.
This paper also provides systematic guidance to help policymakers design political strategies to support market development. For example, only projects with total costs (CAPEX + OPEX) and discount rates lower than 850 Euros/kWp and 8% respectively, can be beneficial in the current market. With total costs of around 650–850 Euros/kWp, the only attractive investment option is the business model, which is selling generated PV electricity directly on the state grid, while total costs lower than 650 Euros/kWp make a choice between the business and the self-consumption models possible for their rooftop PV projects. For self-consumption, there is no clear strategy, but the situation improves due to increasing grid tariffs. Consumers must, however, wait until around 2025 when their grid tariff should rise to at least about 8.7 cents/kWh and self-consumption will become attractive, but this date could be sooner if costs for solar technology continue to decrease. By simulating the rooftop PV market in different projected FITs, we recommend that the government consider their tariff strategies carefully. In the case of changing the average FIT from 8.83 to 9 Euro cents/kWh and establishing regional FITs, they can activate an additional 16% of the total market, equivalent to around 56 TWh and approximately 28 million Euro of profit. However, if they were to reduce the FIT to 7.79 Euro cents/kWh, it would deactivate about 60% of the rooftop PV market and would reduce total market benefits of approximately 900 million Euro (Table A5).
This paper presents a methodology to carry out resource assessments for rooftop PV in developing countries, as applied to Vietnam. The method is a top-down method that can be employed where detailed, accurate data on buildings, their outlines, and associated infrastructure are lacking. It represents an improvement beyond state of the art and has an absolute error of about 5% compared to detailed bottom-up city models, which is very low for a method at this spatial scale and resolution. Uncertainties relating to the input data are significant but are considered in the sensitivity analysis, which should be borne in mind when interpreting the results. Especially the accuracy of the assumptions relating to the building location, size, orientation, and shading impacts are country-specific and require further research to be employed elsewhere. One promising avenue in this context is the combination of open mapping data with satellite images to automatically identify suitable geometries for rooftop PV [31]. By further validating the top-down results from this study with bottom-up results from 3D models (e.g., Effigis Geo-Solutions 2018), the method could be improved and applied to other contexts. Finally, this and related studies have tended to focus on the supply side for rooftop PV, but there is a need for future research to analyze the demand side, especially public opinion and willingness to pay for PV systems.
Author Contributions
Conceptualization, P.M.K., R.M. and W.F.; Data curation, P.M.K.; Formal analysis, P.M.K.; Investigation, P.M.K.; Methodology, P.M.K. and R.M.; Supervision, R.M. and W.F.; Validation, R.M. and W.F.; Visualization, P.M.K.; Writing—original draft, P.M.K.; Writing—review & editing, P.M.K., R.M. and W.F. All authors have read and agreed to the published version of the manuscript.
Funding
The first author gratefully acknowledges the financial support of the Ministry of Education and Training (MOET) of Vietnam and the International Scholars and Welcome Office (IScO) from Karlsruhe Institute of Technology and DAAD STIBET for funding this research.
Conflicts of Interest
The authors declare no conflict of interest.
Nomenclature
| PV | Photovoltaics |
| LIDAR | Light detection and ranging |
| HVAC | Heating, Ventilation and Air Conditioning |
| STC | Standard test conditions |
| AM | Air mass |
| NOCT | Nominal operating cell temperature |
| CT | Constant value |
| HD | Height difference |
| MRS | Module row spacing |
| PR | Performance ratio |
| LCOE | Levelized Cost of Electricity |
| GDP | Gross domestic product |
| Dim | Dimension |
| FIT | Feed-in tariff |
| MOIT | Vietnamese Ministry of Industry and Trade |
| EVN | Vietnam Electricity Enterprise |
| CAPEX | Capital expenditure |
| OPEX | Operational and maintenance expenditure |
Appendix A

Table A1.
Retail electricity tariff for household customers (published 20/03/2019).
| Customer Group | Rate (VND/kWh) | Rate (Euro cents/kWh) | |
|---|---|---|---|
| 1 | Retail price for household electricity | ||
| Rate 1: For 0–50 kWh | 1678 | 6.33 | |
| Rate 2: For 51–100 kWh | 1734 | 6.54 | |
| Rate 3: For 101–200 kWh | 2014 | 7.60 | |
| Rate 4: For 201–300 kWh | 2536 | 9.57 | |
| Rate 5: For 301–400 kWh | 2834 | 10.69 | |
| Rate 6: For 401 kWh onwards | 2927 | 11.05 | |
| 2 | Retail price for household electricity via prepaid card meter | 2461 | 9.29 |
Table A2.
Provinces in Vietnam and their demographic characteristics.
| ID | Province | Region | Total Area (km2) | Household Area (km2) | % of Household Area | Population | Urban Rate 2018 (%) | Gdp/a/person 2018 (Euro/a) |
|---|---|---|---|---|---|---|---|---|
| 1 | An Giang | Mekong river delta | 3536 | 135 | 3.8% | 2164.2 | 30.8% | 1612.1 |
| 2 | Ba Ria-Vung Tau | Southeast | 1979 | 71 | 3.6% | 1112.9 | 52.4% | 2210.3 |
| 3 | Bac Giang | Northern midlands | 3895 | 185 | 4.7% | 897.0 | 11.5% | 1562.3 |
| 4 | Bac Kan | Northern midlands | 4860 | 26 | 0.5% | 327.9 | 18.8% | 880.8 |
| 5 | Bac Lieu | Mekong river delta | 2668 | 49 | 1.8% | 1691.8 | 29.1% | 1222.2 |
| 6 | Bac Ninh | Red river delta | 822 | 104 | 12.7% | 1247.5 | 28.3% | 2466.1 |
| 7 | Ben Tre | Mekong river delta | 2395 | 81 | 3.4% | 1268.2 | 10.8% | 1543.7 |
| 8 | Binh Dinh | South central coast | 6066 | 94 | 1.5% | 2163.6 | 31.0% | 1369.4 |
| 9 | Binh Duong | Southeast | 2696 | 136 | 5.0% | 1534.8 | 39.4% | 3089.7 |
| 10 | Binh Phuoc | Southeast | 6878 | 65 | 0.9% | 979.6 | 22.0% | 1632.0 |
| 11 | Binh Thuan | South central coast | 7946 | 89 | 1.1% | 1239.2 | 78.2% | 1560.0 |
| 12 | Ca Mau | Mekong river delta | 5221 | 65 | 1.2% | 1229.6 | 22.7% | 1352.2 |
| 13 | Can Tho | Mekong river delta | 1439 | 82 | 5.7% | 540.4 | 67.3% | 1979.3 |
| 14 | Cao Bang | Northern midlands | 6701 | 56 | 0.8% | 1282.3 | 23.2% | 840.5 |
| 15 | Da Nang | South central coast | 1286 | 75 | 5.8% | 1080.7 | 87.8% | 2493.3 |
| 16 | Dak Lak | Central highlands | 13030 | 150 | 1.2% | 1919.2 | 24.7% | 1244.4 |
| 17 | Dak Nong | Central highlands | 6513 | 55 | 0.8% | 645.4 | 15.3% | 1372.1 |
| 18 | Dien Bien | Northern Mountains | 9542 | 50 | 0.5% | 3086.1 | 15.1% | 668.8 |
| 19 | Dong Nai | Southeast | 5863 | 177 | 3.0% | 1693.3 | 35.6% | 2400.0 |
| 20 | Dong Thap | Mekong river delta | 3383 | 146 | 4.3% | 576.7 | 17.8% | 1584.9 |
| 21 | Gia Lai | Central highlands | 15511 | 183 | 1.2% | 1458.5 | 30.9% | 1171.0 |
| 22 | Ha Giang | Northern midlands | 7929 | 71 | 0.9% | 846.5 | 15.1% | 781.1 |
| 23 | Ha Nam | Red river delta | 859 | 63 | 7.3% | 808.2 | 15.9% | 1633.8 |
| 24 | Ha Noi | Red river delta | 3360 | 407 | 12.1% | 7520.7 | 64.6% | 2741.4 |
| 25 | Ha Tinh | North central coast | 5990 | 121 | 2.0% | 1277.5 | 18.7% | 1287.8 |
| 26 | Hai Duong | Red river delta | 1666 | 167 | 10.0% | 1807.5 | 25.3% | 1672.3 |
| 27 | Hai Phong | Red river delta | 1561 | 145 | 9.3% | 2013.8 | 46.8% | 2316.7 |
| 28 | Hau Giang | Southeast | 1622 | 45 | 2.8% | 776.7 | 25.4% | 1606.6 |
| 29 | Ho Chi Minh City | Mekong river delta | 2062 | 282 | 13.7% | 8598.7 | 80.5% | 2797.1 |
| 30 | Hoa Binh | Northern Mountains | 4591 | 140 | 3.0% | 846.1 | 14.8% | 1039.2 |
| 31 | Hung Yen | Red river delta | 929 | 96 | 10.3% | 3558.2 | 13.0% | 1740.2 |
| 32 | Khanh Hoa | South central coast | 5139 | 67 | 1.3% | 1188.9 | 45.0% | 1564.5 |
| 33 | Kien Giang | Mekong river delta | 6348 | 137 | 2.2% | 1232.4 | 29.2% | 1711.2 |
| 34 | Kon Tum | Central highlands | 9675 | 84 | 0.9% | 1810.5 | 35.5% | 908.8 |
| 35 | Lai Chau | Northern Mountains | 9069 | 29 | 0.3% | 535.0 | 17.3% | 676.1 |
| 36 | Lam Dong | Central highlands | 9780 | 125 | 1.3% | 790.5 | 39.8% | 1648.8 |
| 37 | Lang Son | Northern midlands | 8310 | 81 | 1.0% | 1312.9 | 20.3% | 926.9 |
| 38 | Lao Cai | Northern Mountains | 6366 | 52 | 0.8% | 456.3 | 22.9% | 1052.4 |
| 39 | Long An | Mekong river delta | 4496 | 266 | 5.9% | 705.6 | 18.0% | 1908.7 |
| 40 | Nam Dinh | Red river delta | 1669 | 112 | 6.7% | 1503.1 | 18.7% | 1532.4 |
| 41 | Nghe An | North central coast | 16482 | 256 | 1.6% | 1854.4 | 15.1% | 1151.5 |
| 42 | Ninh Binh | Red river delta | 1385 | 68 | 4.9% | 3157.1 | 21.1% | 1191.4 |
| 43 | Ninh Thuan | South central coast | 3354 | 49 | 1.5% | 973.3 | 36.2% | 1710.8 |
| 44 | Phu Tho | Northern midlands | 3535 | 106 | 3.0% | 611.8 | 19.1% | 1309.6 |
| 45 | Phu Yen | South central coast | 5022 | 54 | 1.1% | 1404.2 | 29.1% | 1284.7 |
| 46 | Quang Binh | North central coast | 7999 | 63 | 0.8% | 909.5 | 63.9% | 1207.2 |
| 47 | Quang Nam | South central coast | 10574 | 204 | 1.9% | 887.6 | 19.8% | 1315.9 |
| 48 | Quang Ngai | South central coast | 5157 | 116 | 2.2% | 1501.1 | 30.3% | 1313.2 |
| 49 | Quang Ninh | Northern midlands | 6179 | 82 | 1.3% | 1272.8 | 24.3% | 2163.2 |
| 50 | Quang Tri | North central coast | 4623 | 43 | 0.9% | 1266.5 | 15.2% | 1151.5 |
| 51 | Soc Trang | Mekong river delta | 3314 | 57 | 1.7% | 630.6 | 30.6% | 1654.2 |
| 52 | Son La | Northern Mountains | 14124 | 86 | 0.6% | 1315.9 | 13.7% | 671.5 |
| 53 | Tay Ninh | Southeast | 4042 | 92 | 2.3% | 1242.7 | 22.6% | 1928.2 |
| 54 | Thai Binh | Red river delta | 1588 | 136 | 8.6% | 1133.4 | 10.5% | 1818.1 |
| 55 | Thai Nguyen | Northern midlands | 3526 | 123 | 3.5% | 1793.2 | 35.3% | 1606.2 |
| 56 | Thanh Hoa | North central coast | 11116 | 552 | 5.0% | 1268.3 | 17.3% | 1365.3 |
| 57 | Thua Thien Hue | North central coast | 4901 | 95 | 1.9% | 1163.6 | 48.9% | 1396.5 |
| 58 | Tien Giang | Mekong river delta | 2512 | 100 | 4.0% | 1762.3 | 15.5% | 1804.1 |
| 59 | Tra Vinh | Mekong river delta | 2356 | 49 | 2.1% | 1049.8 | 18.3% | 1299.2 |
| 60 | Tuyen Quang | Northern midlands | 5868 | 61 | 1.0% | 780.1 | 13.9% | 1024.3 |
| 61 | Vinh Long | Mekong river delta | 1524 | 60 | 3.9% | 1051.8 | 25.0% | 1398.8 |
| 62 | Vinh Phuc | Red river delta | 1237 | 79 | 6.4% | 1092.4 | 17.0% | 1675.0 |
| 63 | Yen Bai | Northern Mountains | 6887 | 54 | 0.8% | 815.6 | 20.7% | 1037.0 |
Table A3.
Results of potential assessment.
| ID | Province | Available Roof (km2) | LCOE Mono (Euro cents/ kWh) | LCOE Poly (Euro cents/ kWh) | Production Potentials Mono (TWh/a) | Production Potentials Poly (TWh/a) | Installable Potentials Mono (GWP) | Installable Potentials Poly (GWP) | Specific Potential Mono (GWh/ km2) | Specific Potential Poly (GWh/ km2) |
|---|---|---|---|---|---|---|---|---|---|---|
| 1 | An Giang | 28.2 | 7.6 | 7.2 | 6.3 | 6 | 4.6 | 4.4 | 1.8 | 1.7 |
| 2 | Ba Ria-Vung Tau | 17.7 | 7.6 | 7.2 | 4 | 3.8 | 2.9 | 2.7 | 2 | 1.9 |
| 3 | Bac Giang | 18.8 | 9 | 8.5 | 3.1 | 2.9 | 3 | 2.8 | 0.8 | 0.8 |
| 4 | Bac Kan | 7.2 | 9.3 | 8.7 | 1.1 | 1.1 | 1.2 | 1.1 | 0.2 | 0.2 |
| 5 | Bac Lieu | 13.8 | 7.8 | 7.4 | 3 | 2.8 | 2.3 | 2.1 | 1.1 | 1.1 |
| 6 | Bac Ninh | 17.6 | 8.9 | 8.4 | 2.9 | 2.8 | 2.8 | 2.7 | 3.6 | 3.4 |
| 7 | Ben Tre | 23.5 | 7.7 | 7.2 | 5.3 | 5 | 3.9 | 3.6 | 2.2 | 2.1 |
| 8 | Binh Dinh | 23 | 7.7 | 7.3 | 5.1 | 4.8 | 3.8 | 3.6 | 0.8 | 0.8 |
| 9 | Binh Duong | 22.6 | 7.6 | 7.2 | 5.2 | 4.9 | 3.7 | 3.5 | 1.9 | 1.8 |
| 10 | Binh Phuoc | 27.5 | 7.5 | 7.1 | 6.4 | 6 | 4.5 | 4.2 | 0.9 | 0.9 |
| 11 | Binh Thuan | 19.1 | 7.3 | 6.9 | 4.6 | 4.4 | 3.1 | 2.9 | 0.6 | 0.6 |
| 12 | Ca Mau | 24.5 | 7.9 | 7.5 | 5.2 | 4.9 | 4 | 3.8 | 1 | 0.9 |
| 13 | Can Tho | 16.5 | 7.7 | 7.3 | 3.6 | 3.4 | 2.7 | 2.6 | 2.6 | 2.4 |
| 14 | Cao Bang | 11 | 9.2 | 8.7 | 1.7 | 1.6 | 1.7 | 1.7 | 0.3 | 0.2 |
| 15 | Da Nang | 13.7 | 8 | 7.6 | 2.8 | 2.7 | 2.2 | 2.1 | 2.2 | 2.1 |
| 16 | Dak Lak | 22.4 | 7.6 | 7.2 | 5.1 | 4.8 | 3.6 | 3.4 | 0.4 | 0.4 |
| 17 | Dak Nong | 7.5 | 7.5 | 7.1 | 1.7 | 1.6 | 1.2 | 1.1 | 0.3 | 0.2 |
| 18 | Dien Bien | 10.7 | 8.4 | 7.9 | 1.9 | 1.8 | 1.7 | 1.6 | 0.2 | 0.2 |
| 19 | Dong Nai | 43.8 | 7.6 | 7.2 | 9.9 | 9.4 | 7.1 | 6.8 | 1.7 | 1.6 |
| 20 | Dong Thap | 24.9 | 7.6 | 7.2 | 5.7 | 5.3 | 4.1 | 3.8 | 1.7 | 1.6 |
| 21 | Gia Lai | 19.3 | 7.6 | 7.2 | 4.3 | 4.1 | 3.1 | 2.9 | 0.3 | 0.3 |
| 22 | Ha Giang | 13.2 | 9.3 | 8.7 | 2 | 1.9 | 2.1 | 2 | 0.3 | 0.2 |
| 23 | Ha Nam | 13 | 8.9 | 8.4 | 2.2 | 2.1 | 2.1 | 2 | 2.5 | 2.4 |
| 24 | Ha Noi | 93.9 | 8.9 | 8.4 | 15.6 | 14.8 | 15.1 | 14.3 | 5 | 4.7 |
| 25 | Ha Tinh | 27.4 | 8.9 | 8.4 | 4.6 | 4.3 | 4.4 | 4.2 | 2.8 | 2.6 |
| 26 | Hai Duong | 24.7 | 8.9 | 8.3 | 4.2 | 3.9 | 4 | 3.8 | 2.7 | 2.6 |
| 27 | Hai Phong | 19.2 | 8.8 | 8.3 | 3.4 | 3.2 | 3.2 | 3 | 0.6 | 0.5 |
| 28 | Hau Giang | 11.9 | 7.9 | 7.4 | 2.5 | 2.4 | 2 | 1.8 | 1.6 | 1.5 |
| 29 | Ho Chi Minh City | 110 | 7.6 | 7.2 | 24.8 | 23.4 | 18 | 17 | 11.8 | 11.2 |
| 30 | Hoa Binh | 10 | 8.9 | 8.4 | 1.7 | 1.6 | 1.6 | 1.5 | 0.4 | 0.3 |
| 31 | Hung Yen | 16.6 | 8.9 | 8.4 | 2.8 | 2.6 | 2.7 | 2.5 | 3 | 2.9 |
| 32 | Khanh Hoa | 16.7 | 7.6 | 7.2 | 3.8 | 3.6 | 2.7 | 2.6 | 0.7 | 0.7 |
| 33 | Kien Giang | 31.7 | 7.8 | 7.4 | 6.8 | 6.5 | 5.2 | 4.9 | 1.1 | 1 |
| 34 | Kon Tum | 7.5 | 7.7 | 7.3 | 1.6 | 1.5 | 1.2 | 1.1 | 0.2 | 0.2 |
| 35 | Lai Chau | 9.5 | 8.6 | 8.1 | 1.6 | 1.6 | 1.5 | 1.4 | 0.2 | 0.2 |
| 36 | Lam Dong | 17.2 | 7.5 | 7.1 | 3.9 | 3.7 | 2.8 | 2.6 | 0.4 | 0.4 |
| 37 | Lang Son | 14.6 | 9.1 | 8.6 | 2.3 | 2.2 | 2.3 | 2.2 | 0.3 | 0.3 |
| 38 | Lao Cai | 10.8 | 9.2 | 8.7 | 1.7 | 1.6 | 1.7 | 1.6 | 0.3 | 0.3 |
| 39 | Long An | 29.6 | 7.6 | 7.2 | 6.8 | 6.4 | 4.8 | 4.6 | 1.5 | 1.4 |
| 40 | Nam Dinh | 27.1 | 8.8 | 8.3 | 4.7 | 4.4 | 4.4 | 4.1 | 2.8 | 2.7 |
| 41 | Nghe An | 45.4 | 8.6 | 8.1 | 8.1 | 7.7 | 7.4 | 7 | 0.5 | 0.5 |
| 42 | Ninh Binh | 16.3 | 8.9 | 8.3 | 2.8 | 2.6 | 2.6 | 2.5 | 2 | 1.9 |
| 43 | Ninh Thuan | 7.8 | 7.3 | 6.9 | 1.9 | 1.8 | 1.3 | 1.2 | 0.6 | 0.5 |
| 44 | Phu Tho | 17.9 | 9.1 | 8.6 | 2.9 | 2.7 | 2.9 | 2.7 | 0.8 | 0.8 |
| 45 | Phu Yen | 13.4 | 7.7 | 7.3 | 3 | 2.8 | 2.2 | 2.1 | 0.6 | 0.6 |
| 46 | Quang Binh | 17.1 | 8.7 | 8.2 | 3 | 2.9 | 2.8 | 2.7 | 0.4 | 0.4 |
| 47 | Quang Nam | 25.6 | 8 | 7.6 | 5.3 | 5 | 4.2 | 4 | 0.5 | 0.5 |
| 48 | Quang Ngai | 18.3 | 7.8 | 7.4 | 3.9 | 3.7 | 3 | 2.8 | 0.8 | 0.7 |
| 49 | Quang Ninh | 43.8 | 9.2 | 8.6 | 7 | 6.6 | 7 | 6.6 | 1.1 | 1.1 |
| 50 | Quang Tri | 10.3 | 8.4 | 7.9 | 1.9 | 1.8 | 1.7 | 1.6 | 0.4 | 0.4 |
| 51 | Soc Trang | 20.9 | 7.8 | 7.4 | 4.5 | 4.3 | 3.4 | 3.2 | 1.4 | 1.3 |
| 52 | Son La | 19.7 | 8.5 | 8 | 3.5 | 3.3 | 3.1 | 3 | 0.2 | 0.2 |
| 53 | Tay Ninh | 24.5 | 7.4 | 7.1 | 5.8 | 5.4 | 4 | 3.8 | 1.4 | 1.3 |
| 54 | Thai Binh | 26.9 | 8.9 | 8.3 | 4.6 | 4.3 | 4.3 | 4.1 | 3 | 2.8 |
| 55 | Thai Nguyen | 16.5 | 9.3 | 8.7 | 2.6 | 2.4 | 2.7 | 2.5 | 0.7 | 0.7 |
| 56 | Thanh Hoa | 42.8 | 8.7 | 8.2 | 7.5 | 7.1 | 6.9 | 6.6 | 0.7 | 0.6 |
| 57 | Thua Thien Hue | 16.5 | 8.3 | 7.8 | 3.2 | 3 | 2.7 | 2.5 | 0.6 | 0.6 |
| 58 | Tien Giang | 28.6 | 7.6 | 7.2 | 6.4 | 6.1 | 4.7 | 4.4 | 2.6 | 2.4 |
| 59 | Tra Vinh | 16.8 | 7.7 | 7.3 | 3.7 | 3.5 | 2.7 | 2.6 | 1.6 | 1.5 |
| 60 | Tuyen Quang | 11.7 | 9.3 | 8.7 | 1.8 | 1.7 | 1.9 | 1.8 | 0.3 | 0.3 |
| 61 | Vinh Long | 16.5 | 7.7 | 7.3 | 3.6 | 3.4 | 2.7 | 2.6 | 2.4 | 2.3 |
| 62 | Vinh Phuc | 18.9 | 9 | 8.5 | 3.1 | 2.9 | 3 | 2.9 | 2.2 | 2.1 |
| 63 | Yen Bai | 13.1 | 9.2 | 8.7 | 2.1 | 1.9 | 2.1 | 2 | 0.3 | 0.3 |
Table A4.
Results of clustering.
| ID | Province | Available Roof (km2) | LCOE Mono (Euro cents/kWh) | Production Potentials Mono (TWh/a) | Urban Rate 2018 (%) | gdp/a/Person 2018 (Euro/a) | Clustering Result | Priority |
|---|---|---|---|---|---|---|---|---|
| 1 | An Giang | 28.2 | 7.6 | 6.3 | 30.8% | 1612.1 | 1 | 5 |
| 2 | Ba Ria-Vung Tau | 17.7 | 7.6 | 4.0 | 52.4% | 2210.3 | 2 | 3 |
| 3 | Bac Giang | 18.8 | 9.0 | 3.1 | 11.5% | 1562.3 | 3 | 4 |
| 4 | Bac Kan | 7.2 | 9.3 | 1.1 | 18.8% | 880.8 | 4 | 6 |
| 5 | Bac Lieu | 13.8 | 7.8 | 3.0 | 29.1% | 1222.2 | 5 | 2 |
| 6 | Bac Ninh | 17.6 | 8.9 | 2.9 | 28.3% | 2466.1 | 3 | 4 |
| 7 | Ben Tre | 23.5 | 7.7 | 5.3 | 10.8% | 1543.7 | 5 | 2 |
| 8 | Binh Dinh | 23.0 | 7.7 | 5.1 | 31.0% | 1369.4 | 5 | 2 |
| 9 | Binh Duong | 22.6 | 7.6 | 5.2 | 39.4% | 3089.7 | 1 | 5 |
| 10 | Binh Phuoc | 27.5 | 7.5 | 6.4 | 22.0% | 1632.0 | 1 | 5 |
| 11 | Binh Thuan | 19.1 | 7.3 | 4.6 | 78.2% | 1560.0 | 2 | 3 |
| 12 | Ca Mau | 24.5 | 7.9 | 5.2 | 22.7% | 1352.2 | 5 | 2 |
| 13 | Can Tho | 16.5 | 7.7 | 3.6 | 67.3% | 1979.3 | 2 | 3 |
| 14 | Cao Bang | 11.0 | 9.2 | 1.7 | 23.2% | 840.5 | 4 | 6 |
| 15 | Da Nang | 13.7 | 8.0 | 2.8 | 87.8% | 2493.3 | 2 | 3 |
| 16 | Dak Lak | 22.4 | 7.6 | 5.1 | 24.7% | 1244.4 | 5 | 2 |
| 17 | Dak Nong | 7.5 | 7.5 | 1.7 | 15.3% | 1372.1 | 5 | 2 |
| 18 | Dien Bien | 10.7 | 8.4 | 1.9 | 15.1% | 668.8 | 4 | 6 |
| 19 | Dong Nai | 43.8 | 7.6 | 9.9 | 35.6% | 2400.0 | 1 | 5 |
| 20 | Dong Thap | 24.9 | 7.6 | 5.7 | 17.8% | 1584.9 | 1 | 5 |
| 21 | Gia Lai | 19.3 | 7.6 | 4.3 | 30.9% | 1171.0 | 5 | 2 |
| 22 | Ha Giang | 13.2 | 9.3 | 2.0 | 15.1% | 781.1 | 4 | 6 |
| 23 | Ha Nam | 13.0 | 8.9 | 2.2 | 15.9% | 1633.8 | 3 | 4 |
| 24 | Ha Noi | 93.9 | 8.9 | 15.6 | 64.6% | 2741.4 | 6 | 1 |
| 25 | Ha Tinh | 27.4 | 8.9 | 4.6 | 18.7% | 1287.8 | 3 | 4 |
| 26 | Hai Duong | 24.7 | 8.9 | 4.2 | 25.3% | 1672.3 | 3 | 4 |
| 27 | Hai Phong | 19.2 | 8.8 | 3.4 | 46.8% | 2316.7 | 2 | 3 |
| 28 | Hau Giang | 11.9 | 7.9 | 2.5 | 25.4% | 1606.6 | 5 | 2 |
| 29 | Ho Chi Minh City | 110.0 | 7.6 | 24.8 | 80.5% | 2797.1 | 6 | 1 |
| 30 | Hoa Binh | 10.0 | 8.9 | 1.7 | 14.8% | 1039.2 | 4 | 6 |
| 31 | Hung Yen | 16.6 | 8.9 | 2.8 | 13.0% | 1740.2 | 3 | 4 |
| 32 | Khanh Hoa | 16.7 | 7.6 | 3.8 | 45.0% | 1564.5 | 5 | 2 |
| 33 | Kien Giang | 31.7 | 7.8 | 6.8 | 29.2% | 1711.2 | 1 | 5 |
| 34 | Kon Tum | 7.5 | 7.7 | 1.6 | 35.5% | 908.8 | 5 | 2 |
| 35 | Lai Chau | 9.5 | 8.6 | 1.6 | 17.3% | 676.1 | 4 | 6 |
| 36 | Lam Dong | 17.2 | 7.5 | 3.9 | 39.8% | 1648.8 | 5 | 2 |
| 37 | Lang Son | 14.6 | 9.1 | 2.3 | 20.3% | 926.9 | 4 | 6 |
| 38 | Lao Cai | 10.8 | 9.2 | 1.7 | 22.9% | 1052.4 | 4 | 6 |
| 39 | Long An | 29.6 | 7.6 | 6.8 | 18.0% | 1908.7 | 1 | 5 |
| 40 | Nam Dinh | 27.1 | 8.8 | 4.7 | 18.7% | 1532.4 | 3 | 4 |
| 41 | Nghe An | 45.4 | 8.6 | 8.1 | 15.1% | 1151.5 | 3 | 4 |
| 42 | Ninh Binh | 16.3 | 8.9 | 2.8 | 21.1% | 1191.4 | 4 | 6 |
| 43 | Ninh Thuan | 7.8 | 7.3 | 1.9 | 36.2% | 1710.8 | 5 | 2 |
| 44 | Phu Tho | 17.9 | 9.1 | 2.9 | 19.1% | 1309.6 | 4 | 6 |
| 45 | Phu Yen | 13.4 | 7.7 | 3.0 | 29.1% | 1284.7 | 5 | 2 |
| 46 | Quang Binh | 17.1 | 8.7 | 3.0 | 63.9% | 1207.2 | 2 | 3 |
| 47 | Quang Nam | 25.6 | 8.0 | 5.3 | 19.8% | 1315.9 | 5 | 2 |
| 48 | Quang Ngai | 18.3 | 7.8 | 3.9 | 30.3% | 1313.2 | 5 | 2 |
| 49 | Quang Ninh | 43.8 | 9.2 | 7.0 | 24.3% | 2163.2 | 3 | 4 |
| 50 | Quang Tri | 10.3 | 8.4 | 1.9 | 15.2% | 1151.5 | 4 | 6 |
| 51 | Soc Trang | 20.9 | 7.8 | 4.5 | 30.6% | 1654.2 | 5 | 2 |
| 52 | Son La | 19.7 | 8.5 | 3.5 | 13.7% | 671.5 | 4 | 6 |
| 53 | Tay Ninh | 24.5 | 7.4 | 5.8 | 22.6% | 1928.2 | 1 | 5 |
| 54 | Thai Binh | 26.9 | 8.9 | 4.6 | 10.5% | 1818.1 | 3 | 4 |
| 55 | Thai Nguyen | 16.5 | 9.3 | 2.6 | 35.3% | 1606.2 | 3 | 4 |
| 56 | Thanh Hoa | 42.8 | 8.7 | 7.5 | 17.3% | 1365.3 | 3 | 4 |
| 57 | Thua Thien Hue | 16.5 | 8.3 | 3.2 | 48.9% | 1396.5 | 2 | 3 |
| 58 | Tien Giang | 28.6 | 7.6 | 6.4 | 15.5% | 1804.1 | 1 | 5 |
| 59 | Tra Vinh | 16.8 | 7.7 | 3.7 | 18.3% | 1299.2 | 5 | 2 |
| 60 | Tuyen Quang | 11.7 | 9.3 | 1.8 | 13.9% | 1024.3 | 4 | 6 |
| 61 | Vinh Long | 16.5 | 7.7 | 3.6 | 25.0% | 1398.8 | 5 | 2 |
| 62 | Vinh Phuc | 18.9 | 9.0 | 3.1 | 17.0% | 1675.0 | 3 | 4 |
| 63 | Yen Bai | 13.1 | 9.2 | 2.1 | 20.7% | 1037.0 | 4 | 6 |
Table A5.
Market benefit changes according to different FIT strategies.
| ID | Province | FIT_2.0 (Euro cents/kWh) | Delta_1_1.0 (Euro cents/kWh) | Delta_1_2.0 (Euro cents/kWh) | Delta_1_2.1 (Euro cents/kWh) | Benefit_1.0 (10^6 Euro) | Benefit_2.0 (10^6 Euro) | Benefit_2.1 (10^6 Euro) |
|---|---|---|---|---|---|---|---|---|
| 1 | An Giang | 7.95 | 1.23 | 0.35 | 0.31 | 77.49 | 22.25 | 19.53 |
| 2 | Ba Ria-Vung Tau | 7.95 | 1.23 | 0.35 | 0.31 | 49.20 | 14.13 | 12.40 |
| 3 | Bac Giang | 10.32 | −0.17 | 1.32 | −1.09 | −5.27 | 40.90 | −33.79 |
| 4 | Bac Kan | 10.32 | −0.47 | 1.02 | −1.39 | −5.17 | 11.21 | −15.29 |
| 5 | Bac Lieu | 7.95 | 1.03 | 0.15 | 0.11 | 30.90 | 4.60 | 3.30 |
| 6 | Bac Ninh | 10.32 | −0.07 | 1.42 | −0.99 | −2.03 | 41.16 | −28.71 |
| 7 | Ben Tre | 7.95 | 1.13 | 0.25 | 0.21 | 59.89 | 13.42 | 11.13 |
| 8 | Binh Dinh | 7.95 | 1.13 | 0.25 | 0.21 | 57.63 | 12.91 | 10.71 |
| 9 | Binh Duong | 7.95 | 1.23 | 0.35 | 0.31 | 63.96 | 18.37 | 16.12 |
| 10 | Binh Phuoc | 7.95 | 1.33 | 0.45 | 0.41 | 85.12 | 29.01 | 26.24 |
| 11 | Binh Thuan | 7.48 | 1.53 | 0.18 | 0.61 | 70.38 | 8.47 | 28.06 |
| 12 | Ca Mau | 7.95 | 0.93 | 0.05 | 0.01 | 48.36 | 2.77 | 0.52 |
| 13 | Can Tho | 7.95 | 1.13 | 0.25 | 0.21 | 40.68 | 9.12 | 7.56 |
| 14 | Cao Bang | 10.32 | −0.37 | 1.12 | −1.29 | −6.29 | 19.03 | −21.93 |
| 15 | Da Nang | 8.88 | 0.83 | 0.88 | −0.09 | 23.24 | 24.61 | −2.52 |
| 16 | Dak Lak | 7.48 | 1.23 | −0.12 | 0.31 | 62.73 | −5.91 | 15.81 |
| 17 | Dak Nong | 7.95 | 1.33 | 0.45 | 0.41 | 22.61 | 7.70 | 6.97 |
| 18 | Dien Bien | 8.88 | 0.43 | 0.48 | −0.49 | 8.17 | 9.10 | −9.31 |
| 19 | Dong Nai | 7.95 | 1.23 | 0.35 | 0.31 | 121.77 | 34.97 | 30.69 |
| 20 | Dong Thap | 7.95 | 1.23 | 0.35 | 0.31 | 70.11 | 20.13 | 17.67 |
| 21 | Gia Lai | 7.48 | 1.23 | −0.12 | 0.31 | 52.89 | −4.98 | 13.33 |
| 22 | Ha Giang | 10.32 | −0.47 | 1.02 | −1.39 | −9.40 | 20.38 | −27.80 |
| 23 | Ha Nam | 10.32 | −0.07 | 1.42 | −0.99 | −1.54 | 31.22 | −21.78 |
| 24 | Ha Noi | 10.32 | −0.07 | 1.42 | −0.99 | −10.92 | 221.40 | −154.44 |
| 25 | Ha Tinh | 10.32 | −0.07 | 1.42 | −0.99 | −3.22 | 65.29 | −45.54 |
| 26 | Hai Duong | 10.32 | −0.07 | 1.42 | −0.99 | −2.94 | 59.61 | −41.58 |
| 27 | Hai Phong | 10.32 | 0.03 | 1.52 | −0.89 | 1.02 | 51.65 | −30.26 |
| 28 | Hau Giang | 7.95 | 0.93 | 0.05 | 0.01 | 23.25 | 1.33 | 0.25 |
| 29 | Ho Chi Minh City | 7.95 | 1.23 | 0.35 | 0.31 | 305.04 | 87.60 | 76.88 |
| 30 | Hoa Binh | 10.32 | −0.07 | 1.42 | −0.99 | −1.19 | 24.13 | −16.83 |
| 31 | Hung Yen | 10.32 | −0.07 | 1.42 | −0.99 | −1.96 | 39.74 | −27.72 |
| 32 | Khanh Hoa | 7.48 | 1.23 | −0.12 | 0.31 | 46.74 | −4.40 | 11.78 |
| 33 | Kien Giang | 7.95 | 1.03 | 0.15 | 0.11 | 70.04 | 10.42 | 7.48 |
| 34 | Kon Tum | 7.95 | 1.13 | 0.25 | 0.21 | 18.08 | 4.05 | 3.36 |
| 35 | Lai Chau | 10.32 | 0.23 | 1.72 | −0.69 | 3.68 | 27.51 | −11.04 |
| 36 | Lam Dong | 7.95 | 1.33 | 0.45 | 0.41 | 51.87 | 17.68 | 15.99 |
| 37 | Lang Son | 10.32 | −0.27 | 1.22 | −1.19 | −6.21 | 28.04 | −27.37 |
| 38 | Lao Cai | 10.32 | −0.37 | 1.12 | −1.29 | −6.29 | 19.03 | −21.93 |
| 39 | Long An | 7.95 | 1.23 | 0.35 | 0.31 | 83.64 | 24.02 | 21.08 |
| 40 | Nam Dinh | 10.32 | 0.03 | 1.52 | −0.89 | 1.41 | 71.40 | −41.83 |
| 41 | Nghe An | 10.32 | 0.23 | 1.72 | −0.69 | 18.63 | 139.26 | −55.89 |
| 42 | Ninh Binh | 10.32 | −0.07 | 1.42 | −0.99 | −1.96 | 39.74 | −27.72 |
| 43 | Ninh Thuan | 7.48 | 1.53 | 0.18 | 0.61 | 29.07 | 3.50 | 11.59 |
| 44 | Phu Tho | 10.32 | −0.27 | 1.22 | −1.19 | −7.83 | 35.36 | −34.51 |
| 45 | Phu Yen | 7.48 | 1.13 | −0.22 | 0.21 | 33.90 | −6.48 | 6.30 |
| 46 | Quang Binh | 10.32 | 0.13 | 1.62 | −0.79 | 3.90 | 48.58 | −23.70 |
| 47 | Quang Nam | 8.88 | 0.83 | 0.88 | −0.09 | 43.99 | 46.58 | −4.77 |
| 48 | Quang Ngai | 8.88 | 1.03 | 1.08 | 0.11 | 40.17 | 42.08 | 4.29 |
| 49 | Quang Ninh | 10.32 | −0.37 | 1.12 | −1.29 | −25.90 | 78.35 | −90.30 |
| 50 | Quang Tri | 8.88 | 0.43 | 0.48 | −0.49 | 8.17 | 9.10 | −9.31 |
| 51 | Soc Trang | 7.95 | 1.03 | 0.15 | 0.11 | 46.35 | 6.89 | 4.95 |
| 52 | Son La | 10.32 | 0.33 | 1.82 | −0.59 | 11.55 | 63.67 | −20.65 |
| 53 | Tay Ninh | 7.95 | 1.43 | 0.55 | 0.51 | 82.94 | 32.09 | 29.58 |
| 54 | Thai Binh | 10.32 | −0.07 | 1.42 | −0.99 | −3.22 | 65.29 | −45.54 |
| 55 | Thai Nguyen | 10.32 | −0.47 | 1.02 | −1.39 | −12.22 | 26.50 | −36.14 |
| 56 | Thanh Hoa | 10.32 | 0.13 | 1.62 | −0.79 | 9.75 | 121.44 | −59.25 |
| 57 | Thua Thien Hue | 8.88 | 0.53 | 0.58 | −0.39 | 16.96 | 18.52 | −12.48 |
| 58 | Tien Giang | 7.95 | 1.23 | 0.35 | 0.31 | 78.72 | 22.61 | 19.84 |
| 59 | Tra Vinh | 7.95 | 1.13 | 0.25 | 0.21 | 41.81 | 9.37 | 7.77 |
| 60 | Tuyen Quang | 10.32 | −0.47 | 1.02 | −1.39 | −8.46 | 18.35 | −25.02 |
| 61 | Vinh Long | 7.95 | 1.13 | 0.25 | 0.21 | 40.68 | 9.12 | 7.56 |
| 62 | Vinh Phuc | 10.32 | −0.17 | 1.32 | −1.09 | −5.27 | 40.90 | −33.79 |
| 63 | Yen Bai | 10.32 | −0.37 | 1.12 | −1.29 | −7.77 | 23.50 | −27.09 |
Note: FIT 1.0 = 8.83 Euro cents/kWh & FIT 2.1 = 7.91 (Euro cents/kWh) are applied for all regions.
Table A6.
Market benefit changes according to different grid tariff strategies.
| ID | Province | Delta_2_2019 (Euro cents/kWh) | Delta_2_2025 (Euro cents/kWh) | Benefit_2019 (10^6 Euro) | Benefit_2025 (10^6 Euro) |
|---|---|---|---|---|---|
| 1 | An Giang | −0.40 | 1.10 | −25.20 | 69.30 |
| 2 | Ba Ria−Vung Tau | −0.40 | 1.10 | −16.00 | 44.00 |
| 3 | Bac Giang | −1.80 | −0.30 | −55.80 | −9.30 |
| 4 | Bac Kan | −2.10 | −0.60 | −23.10 | −6.60 |
| 5 | Bac Lieu | −0.60 | 0.90 | −18.00 | 27.00 |
| 6 | Bac Ninh | −1.70 | −0.20 | −49.30 | −5.80 |
| 7 | Ben Tre | −0.50 | 1.00 | −26.50 | 53.00 |
| 8 | Binh Dinh | −0.50 | 1.00 | −25.50 | 51.00 |
| 9 | Binh Duong | −0.40 | 1.10 | −20.80 | 57.20 |
| 10 | Binh Phuoc | −0.30 | 1.20 | −19.20 | 76.80 |
| 11 | Binh Thuan | −0.10 | 1.40 | −4.60 | 64.40 |
| 12 | Ca Mau | −0.70 | 0.80 | −36.40 | 41.60 |
| 13 | Can Tho | −0.50 | 1.00 | −18.00 | 36.00 |
| 14 | Cao Bang | −2.00 | −0.50 | −34.00 | −8.50 |
| 15 | Da Nang | −0.80 | 0.70 | −22.40 | 19.60 |
| 16 | Dak Lak | −0.40 | 1.10 | −20.40 | 56.10 |
| 17 | Dak Nong | −0.30 | 1.20 | −5.10 | 20.40 |
| 18 | Dien Bien | −1.20 | 0.30 | −22.80 | 5.70 |
| 19 | Dong Nai | −0.40 | 1.10 | −39.60 | 108.90 |
| 20 | Dong Thap | −0.40 | 1.10 | −22.80 | 62.70 |
| 21 | Gia Lai | −0.40 | 1.10 | −17.20 | 47.30 |
| 22 | Ha Giang | −2.10 | −0.60 | −42.00 | −12.00 |
| 23 | Ha Nam | −1.70 | −0.20 | −37.40 | −4.40 |
| 24 | Ha Noi | -1.70 | -0.20 | -265.20 | -31.20 |
| 25 | Ha Tinh | -1.70 | -0.20 | -78.20 | -9.20 |
| 26 | Hai Duong | -1.70 | -0.20 | -71.40 | -8.40 |
| 27 | Hai Phong | -1.60 | -0.10 | -54.40 | -3.40 |
| 28 | Hau Giang | -0.70 | 0.80 | -17.50 | 20.00 |
| 29 | Ho Chi Minh City | -0.40 | 1.10 | -99.20 | 272.80 |
| 30 | Hoa Binh | -1.70 | -0.20 | -28.90 | -3.40 |
| 31 | Hung Yen | -1.70 | -0.20 | -47.60 | -5.60 |
| 32 | Khanh Hoa | −0.40 | 1.10 | −15.20 | 41.80 |
| 33 | Kien Giang | −0.60 | 0.90 | −40.80 | 61.20 |
| 34 | Kon Tum | −0.50 | 1.00 | −8.00 | 16.00 |
| 35 | Lai Chau | −1.40 | 0.10 | −22.40 | 1.60 |
| 36 | Lam Dong | −0.30 | 1.20 | −11.70 | 46.80 |
| 37 | Lang Son | −1.90 | −0.40 | −43.70 | −9.20 |
| 38 | Lao Cai | −2.00 | −0.50 | −34.00 | −8.50 |
| 39 | Long An | −0.40 | 1.10 | −27.20 | 74.80 |
| 40 | Nam Dinh | −1.60 | −0.10 | −75.20 | −4.70 |
| 41 | Nghe An | −1.40 | 0.10 | −113.40 | 8.10 |
| 42 | Ninh Binh | −1.70 | −0.20 | −47.60 | −5.60 |
| 43 | Ninh Thuan | −0.10 | 1.40 | −1.90 | 26.60 |
| 44 | Phu Tho | −1.90 | −0.40 | −55.10 | −11.60 |
| 45 | Phu Yen | −0.50 | 1.00 | −15.00 | 30.00 |
| 46 | Quang Binh | −1.50 | 0.00 | −45.00 | 0.00 |
| 47 | Quang Nam | −0.80 | 0.70 | −42.40 | 37.10 |
| 48 | Quang Ngai | −0.60 | 0.90 | −23.40 | 35.10 |
| 49 | Quang Ninh | −2.00 | −0.50 | −140.00 | −35.00 |
| 50 | Quang Tri | −1.20 | 0.30 | −22.80 | 5.70 |
| 51 | Soc Trang | −0.60 | 0.90 | −27.00 | 40.50 |
| 52 | Son La | −1.30 | 0.20 | −45.50 | 7.00 |
| 53 | Tay Ninh | −0.20 | 1.30 | −11.60 | 75.40 |
| 54 | Thai Binh | −1.70 | −0.20 | −78.20 | −9.20 |
| 55 | Thai Nguyen | −2.10 | −0.60 | −54.60 | −15.60 |
| 56 | Thanh Hoa | −1.50 | 0.00 | −112.50 | 0.00 |
| 57 | Thua Thien Hue | −1.10 | 0.40 | −35.20 | 12.80 |
| 58 | Tien Giang | −0.40 | 1.10 | −25.60 | 70.40 |
| 59 | Tra Vinh | −0.50 | 1.00 | −18.50 | 37.00 |
| 60 | Tuyen Quang | −2.10 | −0.60 | −37.80 | −10.80 |
| 61 | Vinh Long | −0.50 | 1.00 | −18.00 | 36.00 |
| 62 | Vinh Phuc | −1.80 | −0.30 | −55.80 | −9.30 |
| 63 | Yen Bai | −2.00 | −0.50 | −42.00 | −10.50 |
Note: Grid tariff in 2019 = 7.2 Euro cents/kWh & Grid tariff in 2025 = 8.7 (Euro cents/kWh) are applied for all regions.
Figure A1.
The clustering distribution on map.

Figure A2.
Administration map of Vietnam: Regions and Name & ID of Provinces.

References
- REN21. Renewables 2019—Global Status Report; 2019; ISBN 978-3-9818911-7-1. Available online: https://www.ren21.net/wp-content/uploads/2019/05/gsr_2019_full_report_en.pdf (accessed on 31 January 2020).
- Khuong, M.P.; McKenna, R.; Fichtner, W. Multi-level decomposition of ASEAN urbanization effects on energy. Int. J. Energy Sect. Manag. 2019, 13, 1107–1132. [Google Scholar] [CrossRef]
- Moorthy, K.; Patwa, N.; Gupta, Y. Breaking barriers in deployment of renewable energy. Heliyon 2019, 5, e01166. [Google Scholar] [CrossRef] [Green Version]
- IRENA; OECD/IEA; REN21. Renewable Energy Policies in a Time of Transition; 2018; ISBN 978-92-9260-061-7. Available online: https://www.irena.org/-/media/Files/IRENA/Agency/Publication/2018/Apr/IRENA_IEA_REN21_Policies_2018.pdf (accessed on 31 January 2020).
- Hong, T.; Lee, M.; Koo, C.; Jeong, K.; Kim, J. Development of a method for estimating the rooftop solar photovoltaic (PV) potential by analyzing the available rooftop area using Hillshade analysis. Appl. Energy 2017, 194, 320–332. [Google Scholar] [CrossRef]
- Hofierka, J.; Kaňuk, J. Assessment of photovoltaic potential in urban areas using open-source solar radiation tools. Renew. Energy 2009, 34, 2206–2214. [Google Scholar] [CrossRef]
- Mansouri Kouhestani, F.; Byrne, J.; Johnson, D.; Spencer, L.; Hazendonk, P.; Brown, B. Evaluating solar energy technical and economic potential on rooftops in an urban setting: The city of Lethbridge, Canada. Int. J. Energy Environ. Eng. 2019, 10, 13–32. [Google Scholar] [CrossRef] [Green Version]
- Singh, R.; Banerjee, R. Estimation of rooftop solar photovoltaic potential of a city. Sol. Energy 2015, 115, 589–602. [Google Scholar] [CrossRef]
- Yan, J.; Yang, Y.; Elia Campana, P.; He, J. City-level analysis of subsidy-free solar photovoltaic electricity price, profits and grid parity in China. Nat. Energy 2019, 4, 709–717. [Google Scholar] [CrossRef]
- Sweerts, B.; Pfenninger, S.; Yang, S.; Folini, D.; van der Zwaan, B.; Wild, M. Estimation of losses in solar energy production from air pollution in China since 1960 using surface radiation data. Nat. Energy 2019, 4, 657–663. [Google Scholar] [CrossRef]
- Kappagantu, R.; Daniel, S.A. Challenges and issues of smart grid implementation: A case of Indian scenario. J. Electr. Syst. Inf. Technol. 2018, 5, 453–467. [Google Scholar] [CrossRef]
- Chaianong, A.; Bangviwat, A.; Menke, C.; Darghouth, N.R. Cost–Benefit Analysis of Rooftop PV Systems on Utilities and Ratepayers in Thailand. Energies 2019, 12, 2265. [Google Scholar] [CrossRef] [Green Version]
- Choi, Y.; Suh, J.; Kim, S.-M. GIS-Based Solar Radiation Mapping, Site Evaluation, and Potential Assessment: A Review. Appl. Sci. 2019, 9, 1960. [Google Scholar] [CrossRef] [Green Version]
- Hong, T.; Koo, C.; Park, J.; Park, H.S. A GIS (geographic information system)-based optimization model for estimating the electricity generation of the rooftop PV (photovoltaic) system. Energy 2014, 65, 190–199. [Google Scholar] [CrossRef]
- Jamal, T.; Ongsakul, W.; Singh, J.G.; Salehin, S.; Ferdous, S.M. Potential rooftop distribution mapping using Geographic Information Systems (GIS) for Solar PV Installation: A case study for Dhaka, Bangladesh. In Proceedings of the 2014 3rd International Conference on the Developments in Renewable Energy Technology (ICDRET), Dhaka, Bangladesh, 29–31 May 2014; pp. 1–6, ISBN 978−9843−3−7867−5. [Google Scholar]
- Margolis, R.; Gagnon, P.; Melius, J.; Phillips, C.; Elmore, R. Using GIS-based methods and lidar data to estimate rooftop solar technical potential in US cities. Environ. Res. Lett. 2017, 12, 74013. [Google Scholar] [CrossRef]
- Polo, J.; Bernardos, A.; Navarro, A.A.; Fernandez-Peruchena, C.M.; Ramírez, L.; Guisado, M.V.; Martínez, S. Solar resources and power potential mapping in Vietnam using satellite-derived and GIS-based information. Energy Convers. Manag. 2015, 98, 348–358. [Google Scholar] [CrossRef]
- Calcabrini, A.; Ziar, H.; Isabella, O.; Zeman, M. A simplified skyline-based method for estimating the annual solar energy potential in urban environments. Nat. Energy 2019, 4, 206–215. [Google Scholar] [CrossRef] [Green Version]
- Desthieux, G.; Carneiro, C.; Camponovo, R.; Ineichen, P.; Morello, E.; Boulmier, A.; Abdennadher, N.; Dervey, S.; Ellert, C. Solar Energy Potential Assessment on Rooftops and Facades in Large Built Environments Based on LiDAR Data, Image Processing, and Cloud Computing. Methodological Background, Application, and Validation in Geneva (Solar Cadaster). Front. Built Environ. 2018, 4, 2811. [Google Scholar] [CrossRef]
- Redweik, P.; Catita, C.; Brito, M. Solar energy potential on roofs and facades in an urban landscape. Sol. Energy 2013, 97, 332–341. [Google Scholar] [CrossRef]
- Nguyen, H.T.; Pearce, J.M. Automated quantification of solar photovoltaic potential in cities. Int. Rev. Spat. Plan. Sustain. Dev. 2013, 1, 49–60. [Google Scholar] [CrossRef] [Green Version]
- Kodysh, J.B.; Omitaomu, O.A.; Bhaduri, B.L.; Neish, B.S. Methodology for estimating solar potential on multiple building rooftops for photovoltaic systems. Sustain. Cities Soc. 2013, 8, 31–41. [Google Scholar] [CrossRef]
- Lukač, N.; Seme, S.; Žlaus, D.; Štumberger, G.; Žalik, B. Buildings roofs photovoltaic potential assessment based on LiDAR (Light Detection And Ranging) data. Energy 2014, 66, 598–609. [Google Scholar] [CrossRef]
- Castellanos, S.; Sunter, D.A.; Kammen, D.M. Rooftop solar photovoltaic potential in cities: How scalable are assessment approaches? Environ. Res. Lett. 2017, 12, 125005. [Google Scholar] [CrossRef]
- Mainzer, K.; Fath, K.; McKenna, R.; Stengel, J.; Fichtner, W.; Schultmann, F. A high-resolution determination of the technical potential for residential-roof-mounted photovoltaic systems in Germany. Sol. Energy 2014, 105, 715–731. [Google Scholar] [CrossRef]
- Byrne, J.; Taminiau, J.; Kurdgelashvili, L.; Kim, K.N. A review of the solar city concept and methods to assess rooftop solar electric potential, with an illustrative application to the city of Seoul. Renew. Sustain. Energy Rev. 2015, 41, 830–844. [Google Scholar] [CrossRef]
- Bódis, K.; Kougias, I.; Jäger-Waldau, A.; Taylor, N.; Szabó, S. A high-resolution geospatial assessment of the rooftop solar photovoltaic potential in the European Union. Renew. Sustain. Energy Rev. 2019, 114, 109309. [Google Scholar] [CrossRef]
- Defaix, P.R.; van Sark, W.G.J.H.M.; Worrell, E.; de Visser, E. Technical potential for photovoltaics on buildings in the EU-27. Sol. Energy 2012, 86, 2644–2653. [Google Scholar] [CrossRef] [Green Version]
- Kabir, M.H.; Endlicher, W.; Jägermeyr, J. Calculation of bright roof-tops for solar PV applications in Dhaka Megacity, Bangladesh. Renew. Energy 2010, 35, 1760–1764. [Google Scholar] [CrossRef]
- National Renewable Energy Laboratory. Rooftop Solar Photovoltaic Technical Potential in the United States: A Detailed Assessment. In U.S. Department of Energy; 2016. Available online: https://www.nrel.gov/docs/fy16osti/65298.pdf (accessed on 31 January 2020).
- Mainzer, K.; Killinger, S.; McKenna, R.; Fichtner, W. Assessment of rooftop photovoltaic potentials at the urban level using publicly available geodata and image recognition techniques. Sol. Energy 2017, 155, 561–573. [Google Scholar] [CrossRef] [Green Version]
- Nguyen, A.-T.; Tran, Q.-B.; Tran, D.-Q.; Reiter, S. An investigation on climate responsive design strategies of vernacular housing in Vietnam. Build. Environ. 2011, 46, 2088–2106. [Google Scholar] [CrossRef] [Green Version]
- Rosaclot, M.; Tina, G.M. Submerged and Floating Photovoltaic Systems. Modelling, Design and Case Studies; Academic Press: London, UK, 2018; ISBN 9780128121498. [Google Scholar]
- Duffie, J.A.; Beckman, W.A. Solar Engineering of Thermal Processes, 4th ed.; John Wiley: Hoboken, NJ, USA, 2013; ISBN 9780470873663. [Google Scholar]
- World Bank Group. Solar Resource Mapping in Vietnam. Implementation Plan. 2017. Available online: http://documents.worldbank.org/curated/en/134421495707128537/Solar-resource-mapping-in-Vietnam-implementation-plan-selection-1231900 (accessed on 31 January 2020).
- Ciulla, G.; Lo Brano, V.; Moreci, E. Forecasting the Cell Temperature of PV Modules with an Adaptive System. Int. J. Photoenergy 2013, 2013, 1–10. [Google Scholar] [CrossRef]
- Neises, T.W.; Klein, S.A.; Reindl, D.T. Development of a Thermal Model for Photovoltaic Modules and Analysis of NOCT Guidelines. J. Sol. Energy Eng. 2012, 134. [Google Scholar] [CrossRef]
- Reinders, A.; Verlinden, P.; van Sark, W.; Freundlich, A. Photovoltaic Solar Energy. From Fundamentals to Applications; Reinders, A., Verlinden, P., van Sark, W., Freundlich, A., Eds.; John Wiley & Sons Ltd.: Chichester, West Sussex, UK; Hoboken, NJ, USA, 2017; ISBN 1118927486. [Google Scholar]
- Singh, P.; Ravindra, N.M. Temperature dependence of solar cell performance—An analysis. Sol. Energy Mater. Sol. Cells 2012, 101, 36–45. [Google Scholar] [CrossRef]
- World Bank Climate Change Knowledge Portal. Available online: https://climateknowledgeportal.worldbank.org/download-data (accessed on 9 May 2020).
- Jordan, D.C.; Kurtz, S.R. Photovoltaic Degradation Rates-an Analytical Review. Prog. Photovolt. Res. Appl. 2013, 21, 12–29. [Google Scholar] [CrossRef] [Green Version]
- Konstantin, P. Praxisbuch Energiewirtschaft. Energieumwandlung, -Transport und -Beschaffung, Übertragungsnetzausbau und Kernenergieausstieg, 4th ed.; Springer: Berlin/Heidelberg, Germany, 2017; ISBN 9783662498224. [Google Scholar]
- Vietnam Electricity. EVN Annual Report 2018. 2019. Available online: https://www.evn.com.vn/userfile/User/tcdl/files/2019/8/EVNAnnualReport2018(1).pdf (accessed on 31 January 2020).
- Wiginton, L.K.; Nguyen, H.T.; Pearce, J.M. Quantifying rooftop solar photovoltaic potential for regional renewable energy policy. Comput. Env. Urban Syst. 2010, 34, 345–357. [Google Scholar] [CrossRef] [Green Version]
- Heckert Solar. Datenblatt NeMoM 60 2.0 Monokristallines PV-Modul dunkelblau. Available online: https://www.rw-energy.com/fileadmin/rwenergy/bilder/Downloads/Module/Heckert/NeMo_2.0_60_M_270-290_Watt.pdf (accessed on 22 April 2020).
- Heckert Solar NeMo 60P, 260W polykristallines Solarmodul. Available online: https://www.oeko-energie.de/shop1/de/Heckert-Solar-NeMo-60P--260W-polykristallines-Solarmodul-1429.html (accessed on 22 April 2020).
- General Statistics Office of Vietnam. General Statistics Office of Vietnam. Available online: https://www.gso.gov.vn/default_en.aspx?tabid=773 (accessed on 31 January 2020).
- Solar, V.P. [Bảng Giá 2019] So Sánh Tấm Pin Năng Lượng Mặt Trời Cao Cấp ở Việt Nam. Available online: https://vuphong.vn/danh-muc/tam-pin-nang-luong-mat-troi/ (accessed on 31 January 2020).
- Polo Martinez, J. Maps of Solar Resource and Potential in Vietnam; Ministry of Industry and Trade of Vietnam (MoiT): Hanoi, Vietnam, 2015.
- EVNHCMC. 3.923 Khách Hàng Lắp Điện Mặt Trời Trên Mái Nhà. Available online: http://www.tietkiemnangluong.vn/d6/news/EVNHCMC-3923-khach-hang-lap-dien-mat-troi-tren-mai-nha-111-135-12512.aspx (accessed on 9 March 2020).
- Vietnam Electricity. Regulations. Available online: https://en.evn.com.vn/c3/gioi-thieu-l/Regulations-2-10.aspx (accessed on 31 January 2020).
- Effigis Geo-Solutions. Assessment of Rooftop Photovoltaic Solar Energy Potential in Vietnam. 2018. Available online: https://effigis.com/en/case-studies/assessment-rooftop-photovoltaic-solar-energy-potential-vietnam/ (accessed on 9 March 2020).
- He, K.; Tang, R.; Jin, M. Pareto fronts of machining parameters for trade-off among energy consumption, cutting force and processing time. Int. J. Prod. Econ. 2017, 185, 113–127. [Google Scholar] [CrossRef]
- Kramp, K.H.; van Det, M.J.; Veeger, N.J.G.M.; Pierie, J.-P.E.N. The Pareto Analysis for Establishing Content Criteria in Surgical Training. J. Surg. Educ. 2016, 73, 892–901. [Google Scholar] [CrossRef] [PubMed]
- Spencer, T.; Mathur, A. Thomas Spencer and Ajay Mathur. Energy Transition in Emerging and Developing Countries: Promoting the New Paradigm. In Proceedings of the G20 2019 Japan, Osaka Summit, Osaka, Japan, 28–29 June 2019. [Google Scholar]
- Ministry of Industry and Trade of Vietnam. Legal Documents. Available online: https://moit.gov.vn/van-ban-phap-luat (accessed on 14 March 2020).
- Khuong, P. (Ed.) Boosting Residential Rooftop Solar by Using Financial Incentives—A Comparison Analysis. A Case Study in Vietnam. In Proceedings of the 4th AIEE Symposium on Current and Future Challenges to Energy Security, Rome, Italy, 10–12 December 2019. [Google Scholar]
- Nguyen, T.C.; Chuc, A.T.; Dang, L.N. Green Finance in Vietnam: Barriers and Solutions. ADBI Working Paper Series. 2018. Available online: https://www.adb.org/sites/default/files/publication/466171/adbi-wp886.pdf (accessed on 31 January 2020).
- Garg, V.; Bridle, R.; Clarke, K. Energy Pricing, Energy Supply and FDI Competitiveness in Viet Nam. An Assessment of Foreign Investor Sentiment. 2015. Available online: https://www.iisd.org/gsi/sites/default/files/ffs_vietnam_fdi.pdf (accessed on 14 March 2020).
- Kost, C.; Shivenes, S.; Verena, J.; Huyen-Tran, N.; Thomas, S. Levelized Cost of Electricity—Renewable Energy Technologies. 2018. Available online: https://www.ise.fraunhofer.de/content/dam/ise/en/documents/publications/studies/EN2018_Fraunhofer-ISE_LCOE_Renewable_Energy_Technologies.pdf (accessed on 31 January 2020).
- The International Renewable Energy Agency. Renewable Power Generation Costs in 2018. Available online: https://www.irena.org/publications/2019/May/Renewable-power-generation-costs-in-2018 (accessed on 31 January 2020).
- Reid, J.S.; Hyer, E.J.; Johnson, R.S.; Holben, B.N.; Yokelson, R.J.; Zhang, J.; Campbell, J.R.; Christopher, S.A.; Di Girolamo, L.; Giglio, L.; et al. Observing and understanding the Southeast Asian aerosol system by remote sensing: An initial review and analysis for the Seven Southeast Asian Studies (7SEAS) program. Atmos. Res. 2013, 122, 403–468. [Google Scholar] [CrossRef] [Green Version]
- Brennan, M.P.; Abramase, A.L.; Andrews, R.W.; Pearce, J.M. Effects of spectral albedo on solar photovoltaic devices. Sol. Energy Mater. Sol. Cells 2014, 124, 111–116. [Google Scholar] [CrossRef] [Green Version]
- Andrews, R.W.; Pearce, J.M. The effect of spectral albedo on amorphous silicon and crystalline silicon solar photovoltaic device performance. Sol. Energy 2013, 91, 233–241. [Google Scholar] [CrossRef] [Green Version]
- Liao, W.; Heo, Y.; Xu, S. (Eds.) Evaluation of Temperature Dependent Models for PV Yield Prediction. In Proceedings of the 4th Building Simulation and Optimization Conference, Cambridge, UK, 11–12 September 2018. [Google Scholar]
- Louwen, A.; de Waal, A.C.; Schropp, R.E.I.; Faaij, A.P.C.; van Sark, W.G.J.H.M. Comprehensive characterisation and analysis of PV module performance under real operating conditions. Prog. Photovolt: Res. Appl. 2017, 25, 218–232. [Google Scholar] [CrossRef]
- Appelbaum, J.; Maor, T. Dependence of PV Module Temperature on Incident Time-Dependent Solar Spectrum. Appl. Sci. 2020, 10, 914. [Google Scholar] [CrossRef] [Green Version]
- Chakraborty, S.; Kumar, R. Comparative analysis of NOCT values for mono and multi C-Si PV modules in Indian climatic condition. World J. Eng. 2015, 12, 19–22. [Google Scholar] [CrossRef]
- European Commission. JRC Photovoltaic Geographical Information System (PVGIS). Available online: https://re.jrc.ec.europa.eu/pvg_tools/en/tools.html (accessed on 21 April 2020).
- IEA. World Energy Model. Available online: https://www.iea.org/reports/world-energy-model (accessed on 15 April 2020).
Figure 1.
Methodology flow chart of the proposed potential assessment model for rooftop PV. Pictures are own illustrations, based on sources for Figure 2, Figure 3, Figure 4 and Figure 5 and reference [32].

Figure 2.
Solar and PV module characteristic angles. Reproduced with permission from the authors of “Submerged and Floating Photovoltaic Systems”, Copyright Elsevier Science Publishing Co Inc., 2018 [33].
Figure 2.
Solar and PV module characteristic angles. Reproduced with permission from the authors of “Submerged and Floating Photovoltaic Systems”, Copyright Elsevier Science Publishing Co Inc., 2018 [33].

Figure 3.
Schematic of two simulated photovoltaic rows at solar noon. Reproduced with permission from the authors of “Submerged and Floating Photovoltaic Systems”, Copyright Elsevier Science Publishing Co Inc., 2018 [33].
Figure 3.
Schematic of two simulated photovoltaic rows at solar noon. Reproduced with permission from the authors of “Submerged and Floating Photovoltaic Systems”, Copyright Elsevier Science Publishing Co Inc., 2018 [33].

Figure 4.
Example of the Cartesian plot of the sun path chart for North Vietnam. Adapted with permission from the Solar Radiation Monitoring Laboratory, University of Oregon, 2015. http://solardat.uoregon.edu/SunChartProgram.html.
Figure 4.
Example of the Cartesian plot of the sun path chart for North Vietnam. Adapted with permission from the Solar Radiation Monitoring Laboratory, University of Oregon, 2015. http://solardat.uoregon.edu/SunChartProgram.html.

Figure 5.
Maps of distributed electricity potential (a) and average LCOE (b) of rooftop PV by regions. Please refer to the online version of the article for references to color in this figure. Detailed region and province can be found in Figure A2. Detailed maps are extracted from the library of The University of Texas at Austin. http://legacy.lib.utexas.edu/maps/topo/vietnam/. Latest access on 20.05.2019.

Figure 6.
The electricity production potential (TWh/a) and average LCOE (Euro/kWh) at the discount rate 8% in 63 regions in descending order.
Figure 6.
The electricity production potential (TWh/a) and average LCOE (Euro/kWh) at the discount rate 8% in 63 regions in descending order.

Figure 7.
The cost–potential curves for electricity generation from monocrystalline solar cells at different discount rates and the average FIT 2.0 of 0.088 Euro/kWh as a dashed line.
Figure 7.
The cost–potential curves for electricity generation from monocrystalline solar cells at different discount rates and the average FIT 2.0 of 0.088 Euro/kWh as a dashed line.

Figure 8.
Sensitivity analysis of input variation effect on technical potential output.

Figure 9.
Sensitivity analysis of input variation effect on LCOE output.

Figure 10.
Comparing the influence of the considered parameters on the technical potential (a) and LCOE (b). Columns in orange, positive value; columns in blue, negative value; red lines, Pareto lines.
Figure 10.
Comparing the influence of the considered parameters on the technical potential (a) and LCOE (b). Columns in orange, positive value; columns in blue, negative value; red lines, Pareto lines.

Figure 11.
Rooftop PV potential distribution corresponding to the level of urbanization (a) and income per capita (b) [46] in 63 provinces in Vietnam.
Figure 11.
Rooftop PV potential distribution corresponding to the level of urbanization (a) and income per capita (b) [46] in 63 provinces in Vietnam.

Figure 12.
The results of clustering provinces based on their potentials and characteristics.

Figure 13.
Analyzing the market attractiveness corresponding to the three different FITs.

Figure 14.
Competitive prices change in accordance with the projected grid tariff increases from (a) 7.2 to (b) 8.7 Euro cent/kWh.
Figure 14.
Competitive prices change in accordance with the projected grid tariff increases from (a) 7.2 to (b) 8.7 Euro cent/kWh.

Figure 15.
Expected business market (a) and expected self-consumption (b) surplus change in accordance with investment costs increase from 635 to 1038 Euros/kWp.
Figure 15.
Expected business market (a) and expected self-consumption (b) surplus change in accordance with investment costs increase from 635 to 1038 Euros/kWp.

Table 1.
Average of relative solar irradiation in accordance with different roof slopes in Vietnam.
| Region | Detached House Roof Slope— (degrees) | Average of Relative Solar Irradiation— |
|---|---|---|
| North Vietnam | 25 | 0.95 |
| 32 | 0.93 | |
| Central Vietnam | 25 | 0.95 |
| 26 | 0.95 | |
| South Vietnam | 34 | 0.90 |
| 24 | 0.93 |
Table 2.
Specifications of the PV modules.
| Module | Type | Watt Price—I (Euros/W) | Maximum Power—E (W) | Efficiency of Module—STC (%) | Performance Coefficient—CT (%K) | Length—Lmod (mm) | Width—Wmod (mm) |
|---|---|---|---|---|---|---|---|
| Monocrystalline [45] | NeMo | 0.59 | 275 | 16.4 | −0.4 | 1670 | 1006 |
| Polycrystalline [46] | NeMo | 0.53 | 260 | 16 | −0.42 | 1640 | 991 |
Table 3.
Employed values of the uncertain parameters and their considered variation range in this study.
Table 3.
Employed values of the uncertain parameters and their considered variation range in this study.
| Uncertain Parameter | Variable | Symbol | Used Value (unit) [ref] | Variation Range |
|---|---|---|---|---|
| Geographical input | Utilization factor for flat roof | Μ | 50 (%) [16] | ±40% |
| Utilization factor for slanted roof | Μ | 58 (%) [25] | ±33% | |
| The average number of apartments on one floor of the building | 10 (-) [47] | ±60% | ||
| Added area to the ground floor area | b | 10 (%) [47] | ±50% | |
| Technological input | The azimuth of the slanted roof | ϒ | 90 (degrees) [32] | ±100% |
| Performance ratio | PR | 85 (%) [25] | ±10% | |
| Economic input | O&M cost | 0.036 (Euro/kWh) [48] | ±50% | |
| Capital cost | 0.59 (Euro/W) [48] | ±50% | ||
| Discount rate | 8 (%) [47] | ±50% |
Table 4.
Comparison of the results of the suggested model and the field study in Ho Chi Minh (HCM) and Da Nang (DN).
Table 4.
Comparison of the results of the suggested model and the field study in Ho Chi Minh (HCM) and Da Nang (DN).
| Subject | This Paper | Field Study [52] |
|---|---|---|
| Coverage | Whole country | Only urban areas of HCM and DN |
| Method to identify technical potential | Geostatistical analysis, GIS, Monte Carlo Simulation | Deep learning, Photogrammetry, GIS, Image processing, Digital surface, and elevation models |
| Production potential for the specific cities (TWh/a) | HCM: 23.4 (100% of the city area) DN: 2.7 (100% of the city area) | HCM: 18 (80% of the city area) DN: 2.3 (80% of the city area) |
Table 5.
Priority groups and their specific characteristics.
| Priority | Cluster Name | Available Roof km2 | Average LCOE (euro cent/kWh) | Production Potential (TWh/a) | GDP per Capita (Euro) | Urban Rate | No. Province |
|---|---|---|---|---|---|---|---|
| 1 | 6 | 101.95 | 8.25 | 20.20 | 2260.53 | 65% | 2 |
| 2 | 2 | 17.11 | 8.06 | 3.51 | 1558.96 | 51% | 7 |
| 3 | 1 | 29.04 | 7.59 | 6.59 | 1431.55 | 29% | 9 |
| 4 | 3 | 26.12 | 8.92 | 4.42 | 1307.08 | 22% | 13 |
| 5 | 5 | 17.03 | 7.69 | 3.74 | 1143.27 | 26% | 18 |
| 6 | 4 | 12.57 | 8.96 | 2.07 | 794.10 | 19% | 14 |
Table 6.
Competitive prices and corresponding metering models in the rooftop PV market (“x”, beneficial; “-”, not beneficial).
Table 6.
Competitive prices and corresponding metering models in the rooftop PV market (“x”, beneficial; “-”, not beneficial).
| Competitive Price | Metering Model | ||
|---|---|---|---|
| Business | Self-Consumption | ||
| >0 | >0 | x | x |
| >0 | <0 | x | - |
| <0 | >0 | - | x |
| <0 | <0 | - | - |
© 2020 by the authors. Licensee MDPI, Basel, Switzerland. This article is an open access article distributed under the terms and conditions of the Creative Commons Attribution (CC BY) license (http://creativecommons.org/licenses/by/4.0/).
Share and Cite
MDPI and ACS Style
Minh Khuong, P.; McKenna, R.; Fichtner, W. A Cost-Effective and Transferable Methodology for Rooftop PV Potential Assessment in Developing Countries. Energies 2020, 13, 2501. https://0-doi-org.brum.beds.ac.uk/10.3390/en13102501
AMA Style
Minh Khuong P, McKenna R, Fichtner W. A Cost-Effective and Transferable Methodology for Rooftop PV Potential Assessment in Developing Countries. Energies. 2020; 13(10):2501. https://0-doi-org.brum.beds.ac.uk/10.3390/en13102501
Chicago/Turabian StyleMinh Khuong, Phuong, Russell McKenna, and Wolf Fichtner. 2020. "A Cost-Effective and Transferable Methodology for Rooftop PV Potential Assessment in Developing Countries" Energies 13, no. 10: 2501. https://0-doi-org.brum.beds.ac.uk/10.3390/en13102501
Note that from the first issue of 2016, this journal uses article numbers instead of page numbers. See further details here.