1. Introduction
In the past decades, methanol received global interests as a gasoline surrogate with a competitive price and cleaner exhaust emissions. The widespread use of three-way catalysts (TWC) in association with the normalization of oil prices in the 1990s offset these benefits and phased methanol out as a fuel option for vehicles. However, recently, methanol regained its essentiality due to its broad, sustainable, and low-cost feedstocks, such as share gas, lignin, and captured CO
2 [
1,
2,
3,
4].
Given the molecularly high O/C and H/C ratios, methanol combustion produces less CO
2 than gasoline [
5,
6,
7]. Besides, using methanol as a vehicle fuel has been shown to help reduce tailpipe particulate matter (PM) emissions [
7,
8]. Considered as a counter-pollution strategy, in China, tens of thousands of dedicated methanol vehicles have been servicing as taxis, buses, intercity coaches, and freight vehicles since 2010. In 2018, the Ministry of Industry and Information Technology of China (MIIT) announced a successive project on encouraging the application of methanol vehicles. A previous technical paper assessed the environmental benefits of using such methanol-fueled passenger cars and concluded 2/3 lower tailpipe PM emissions than gasoline counterparts [
9].
Several engine-level studies also demonstrated that methanol fueling benefitted emissions reduction and efficiency improvement. Optimized by 1-D simulation [
6], Vancoillie et al. retrofitted conventional engines into methanol-fueled and realized diesel-like high thermal efficiencies around 42% meanwhile maintaining very gasoline-like low NOx emissions with turbocharging and high compression ratio design [
5]. Balki et al. also observed lower CO, total hydrocarbons (THC), and NOx emissions from a methanol-fueled, single-cylinder engine compared to those with gasoline fueling. The authors concluded comparably lower emissions as a result of the oxygenated feature and the high latent heat of methanol [
10].
One of the main barriers that obscures the scale application of methanol as a viable vehicle fuel is the public concern over its toxic emissions, primarily formaldehyde and unburned methanol [
11]. Wang et al. measured the carbonyl and volatile organic compound (VOC) emissions from a new Euro-5 compliant, dedicated methanol passenger car. The results showed that for a properly operating methanol car, the emission rates and health risks of such unregulated pollutants were at the same level as gasoline counterparts [
2]. More recently, Gong et al. investigated the influences of engine operating parameters on the formaldehyde and unburned methanol emissions from a direct-injection, spark-ignition (DISI) engine in a series of publications. In summary, formaldehyde was found as a by-product within the thin quenching layers near the cylinder walls, where a small amount of methanol fuel remained unoxidized due to the low temperature in these local zones [
12,
13]. Previous studies also reported that an increase in combustion temperature could effectively remove unburned methanol emissions but tended to raise the concentrations of tailpipe formaldehyde [
11,
14,
15]. Moreover, retarding injection timing, advancing ignition timing, burning leaner mixtures, and cooling intake charge down were found to be useful methods for formaldehyde reduction, although such methods increased unburned methanol emissions [
16,
17,
18]. In other words, a trade-off correlation lies in between formaldehyde and unburned methanol emissions.
Tartakovsky et al. suggested using methanol as an energy carrier and consuming the hydrogen-rich methanol reformulates instead of directly feeding methanol to the engine [
19], and realized a higher thermal efficiency. Simultaneously, the weaknesses like poisonous exhausts and cold-start difficulty should be marginally addressed [
20,
21]. The team has designed a high-efficiency thermo-chemical recuperation system yielding methanol reformulates around 300 °C, and then fed the product to a throttle-less, lean-burn, direct-injection spark-ignition engine [
22]. High thermal efficiency and remarkable emission reductions have been verified at the engine level [
23,
24].
In addition to spark-ignition engines, methanol was fed to diesel engines to achieve cleaner and more efficient combustion. Yao et al. developed a diesel/methanol dual-fuel combustion system for heavy-duty engines to mediate the PM issue of diesel engines [
25,
26]. Via the systematic examinations on fuel injection strategy, from injection pressure [
27] to timing [
28] and the use of late and pilot injection strategies [
29,
30], together with diesel/methanol blending ratio [
30] and intake air temperature [
31] optimizations, such an engine managed to meet the heavy-duty China-IV and China-V standards without the use of selective catalytic reduction (SCR) or diesel particulate filters (DPF), substantially reducing the complexity and cost of the after-treatment systems of diesel engines.
As an alternative, methanol has been widely investigated on both spark- and compression-ignition engines, most of the prior studies focus on its emission characteristics without a catalytic converter. Apart from the several big projects from the 1980s, recent chassis-level research mainly focused on low-content methanol-gasoline because it requires fewer modifications at both hardware and software levels [
32]. Gasoline with 15 vol% methanol substitution (M15) was particularly popular in China because the central government used to recommend its use as a gasoline surrogate in Shanxi but halted this plan due to undesirable evaporative emissions [
33,
34]. Turner et al. suggested the adoption of gasoline-ethanol-methanol ternary fuel as it grants a national fuel supply system more flexibility and security [
35]. Knowledge about the regulated and unregulated emissions from in-use, dedicated methanol vehicles conforming to current regulations are scarce. Given this scarcity, in this paper, the CO, THC, NOx, formaldehyde, unburned methanol, and particle number (PN) emissions from a group of six China-4 certified, field-aged, dedicated methanol taxis were examined, following the certification test protocol of the New European Driving Cycle (NEDC), in order to quantify the in-service emissions of high-mileage, dedicated methanol vehicles, providing data for the evaluation of the environmental benefits and drawbacks of the possible adoption of methanol fuel as a future option.
2. Materials and Methods
Figure 1 depicts the chassis-level vehicle emissions measurement system of this study. As illustrated, the test system mainly comprises a 110 kW, electrical chassis dynamometer (ONO SOKKI PECD 9400, Yokohama, Japan), a constant volume sampling (CVS) system (HORIBA CVS-7400, Osaka, Japan) combined with a multi-component emission analyzer (HORIBA MEXA-7200H, Osaka, Japan) and a condensed particle counter (CPC, HORIBA MEXA-1000SPCS, Osaka, Japan) for the measurement of gaseous emissions and particle number. Gas chromatography combined with flame ionization detector (GC/FID, AGILENT 6890N, Santa Clara, USA) and high-performance liquid chromatography (HPLC, AGILENT 1200 series, Santa Clara, USA) quantified the unburned methanol and formaldehyde emissions in the exhaust.
Table 1 tabulated the main specifications of the test instruments.
The measurement of the gaseous emissions and PN was performed strictly adhering to the approval certification procedures for light-duty China-4 vehicles, equivalent to Euro-4. The type-I limit values for CO, THC, and NOx emissions are 1.0, 0.1, and 0.08 g/km, respectively. All the tests were conducted at a temperature of 23 ± 1 °C and relative humidity between 40% and 55% with engine cold-start. Noteworthily, although the world harmonized light-duty test cycle (WLTC) has replaced the NEDC in Euro-6 and China-6, the in-service emissions from these six dedicated methanol vehicles were still checked over the NEDC given that they were all type-approved in accordance to China-4.
Before each test, the test vehicle was placed in the test chamber for at least 12 h, where the temperature was 23 ± 1 °C, and relative humidity was 40%–55%. This soaking procedure is mandatory in the regulation to reduce data variations induced by the changes in the boundary conditions. The coasting resistance and inertia on the dyno rollers were preset according to the manufacturer’s recommendation, and the tire pressure of the test vehicles was adjusted to 250 kPa before testing.
In this study, formaldehyde and unburned methanol were also tested since they are the primary concerns in terms of adverse health effects. The samplings of these two unregulated emissions were done after the completion of bag reading procedures. The diluted exhaust was suctioned out from the sampling bags using two portable air samplers (SKC AirCheck 2000, Eighty Four, USA). Formaldehyde was sampled with pre-coated 2,4-DNPH cartridges (SUPELCO LpDNPH-S10, Bellefonte, USA) at a flow rate of 1.5 L/min and determined by HPLC, while unburned methanol was sampled with silicon sorbent tubes (SUPELCO Arbo 502, Bellefronte, USA) at a flow rate of 400 mL/min and quantified in the GC/FID. The sampling time for each substance was 10 min. In general, the sampling and analysis of formaldehyde and unburned methanol were handled subject to the standard EPA methods TO-11A and 308. A stepwise introduction of the analysis procedures, from cartridge pretreatment to species quantification, can be found in our previous publications [
32,
33,
34]. All the absorbents were sealed with aluminum foils and stored in a refrigerator right after sampling and analyzed within 48 h to minimize the impacts of sample loss.
The test vehicles were a group of six China-4 certified, field-aged, dedicated methanol taxis.
Table 2 specifies the technical details of the test vehicles.
All the test vehicles were registered in mid-2014 and tested in 2017. The six test vehicles, from Car#1 to Car#6, had run about 204,000 km, 177,000 km, 166,000 km, 225,000 km, 186,000 km, and 198,000 km when tested. All the emission measurements were performed as-received. The maintenance records showed that none of the test vehicles had suffered from serious engine faults nor underwent a catalyst change in their history. The fuel used in the tests was fuel-grade methanol (anhydrous, purity > 99%, 100 ppm anti-corrosive added).
Due to the very high latent heat of evaporation, and therefore cold-start difficulty with methanol, the test vehicles were designed to start with gasoline and then switch to neat methanol fueling once the coolant temperature reached 60 °C. Hence, the 10 L gasoline fuel tank on-board was refilled with market-available China-5 gasoline, the regulatory requirements of China-5 gasoline including but not confined to RON > 92, sulfur < 10 ppm, aromatics ≤ 40 vol%, olefins ≤ 24 vol%, benzene ≤ 1.0 vol% and anthropologic Fe- and Mn-additives prohibited.
For each vehicle, the emission tests were performed with three repeats. The standard deviations of the results were calculated following Equation (1) and illustrated in Figure 2 and Figures 4–8. In Figure 9, the error bars denote the standard deviations among the six test vehicles regarding each pollutant, which were also calculated according to Equation (1).
where
σ is the standard deviation of results,
N is the number of samples, and
μ represents the arithmetic average of the data.
2.1. Carbon Monoxide (CO) Emissions
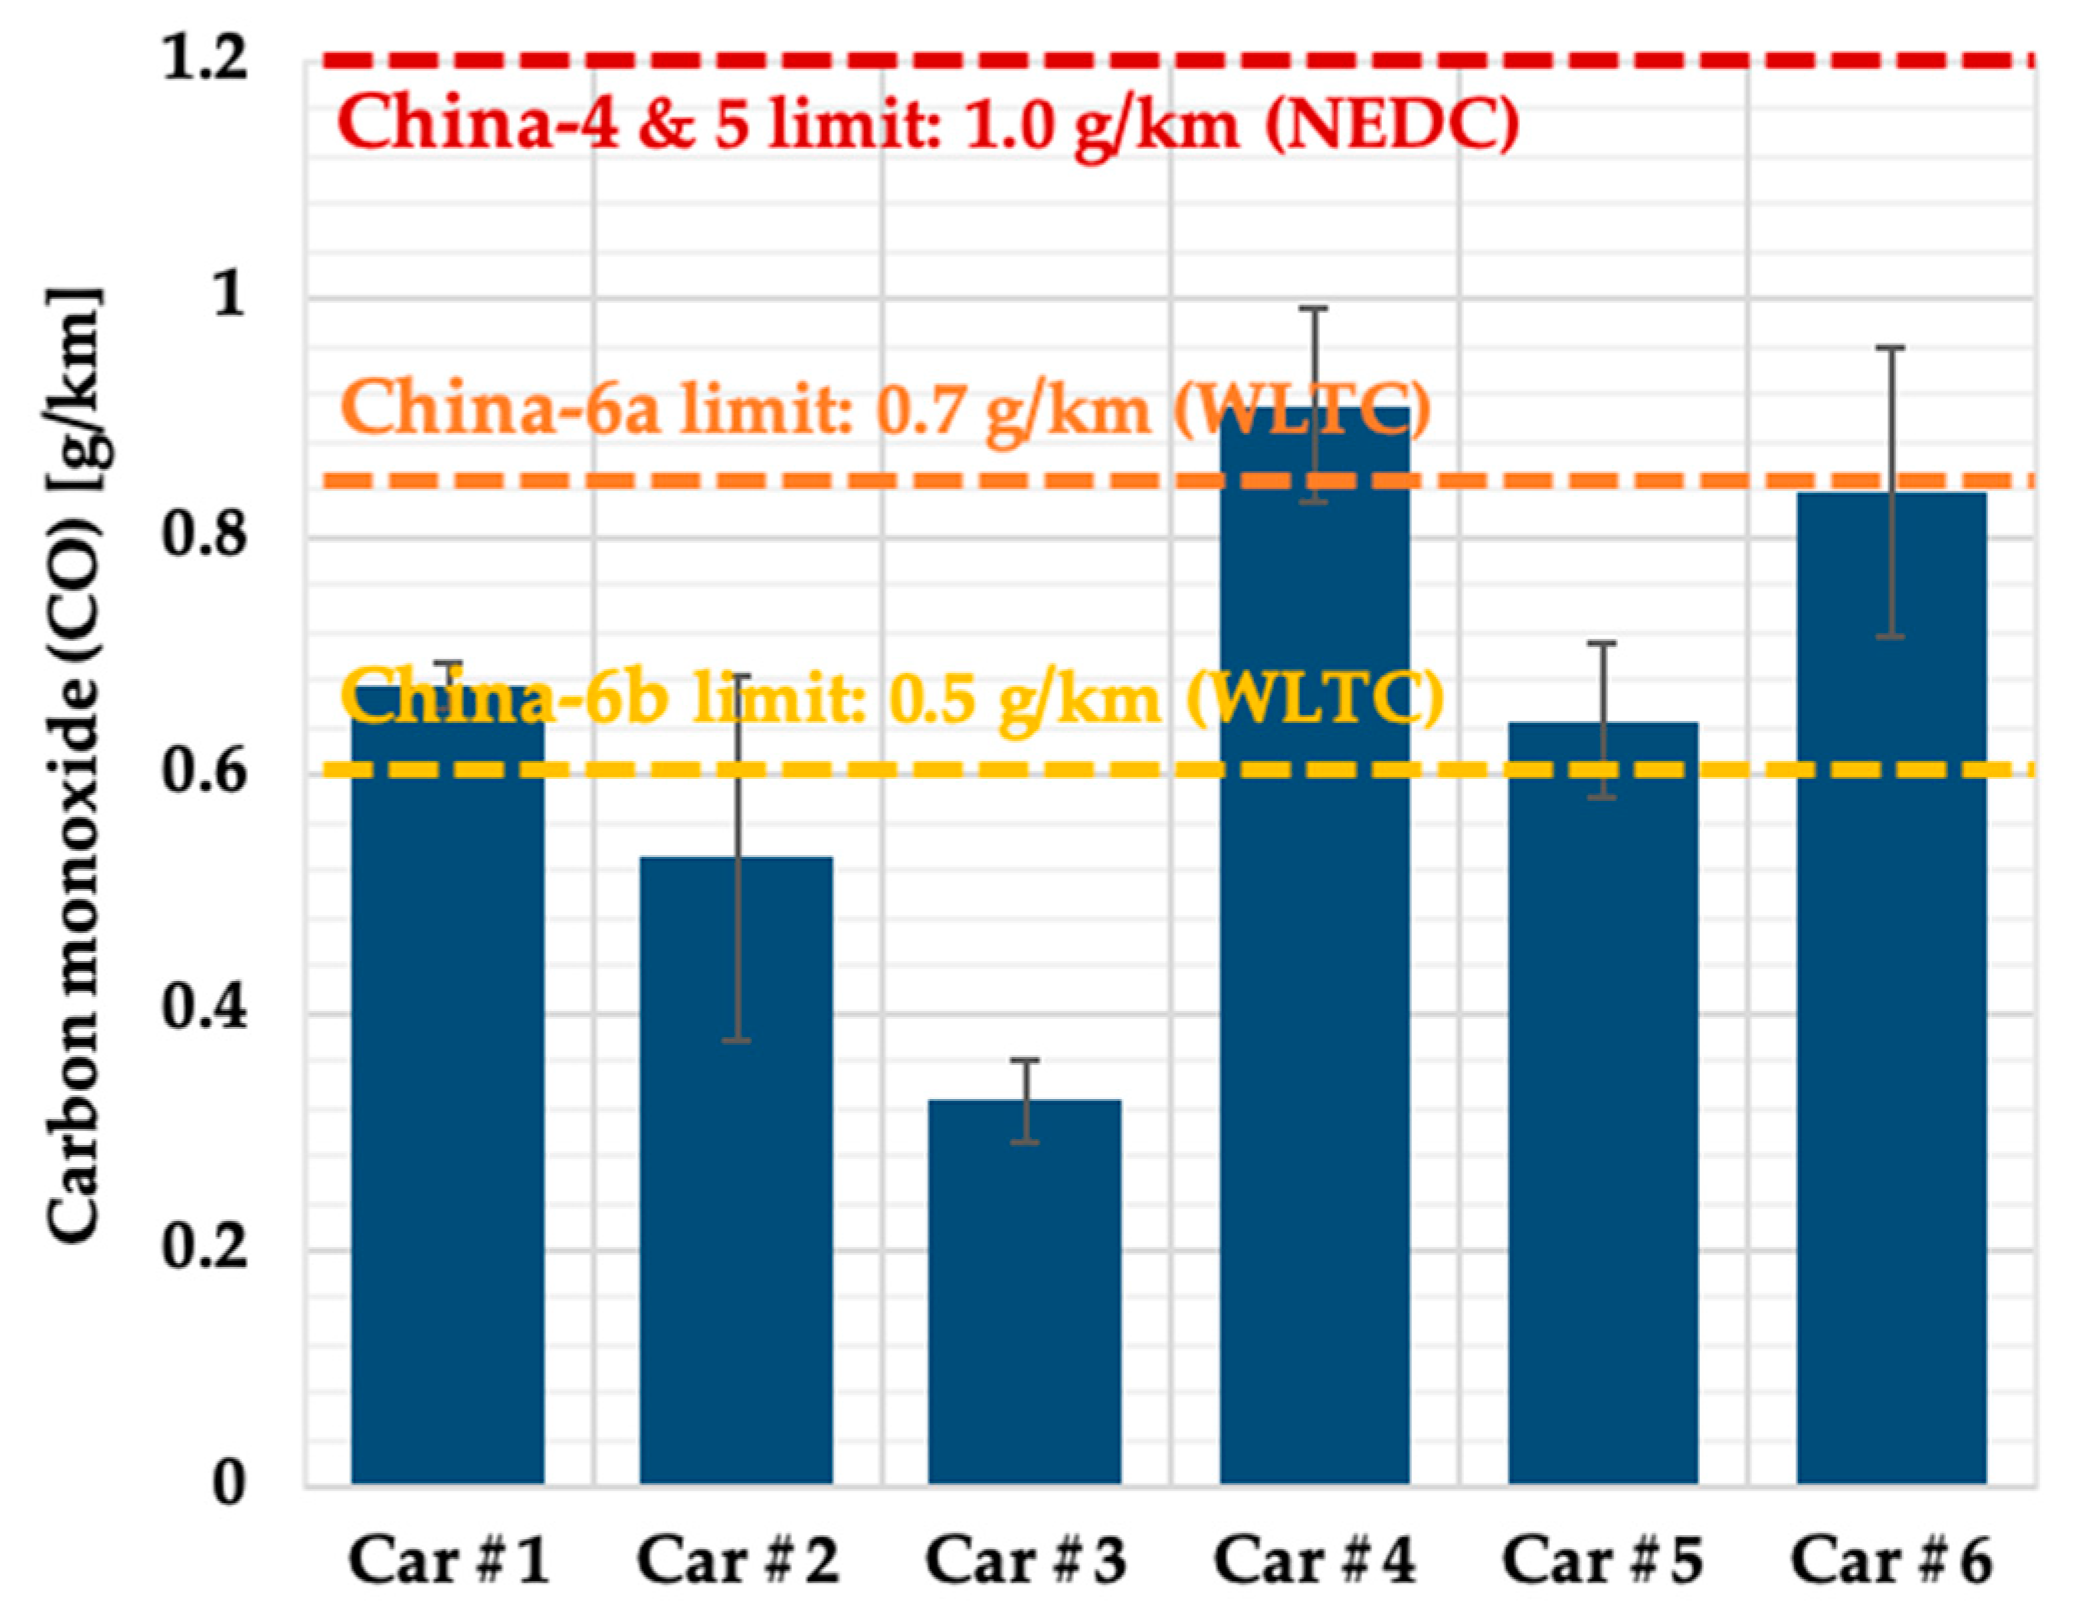
Figure 2 illustrates the CO emissions from the dedicated methanol taxis over the NEDC. Compared to the China-4 limit of 1 g/km, all the six test vehicles managed to meet this requirement after more than 160,000 km driving, which is twice the full useful life defined in the regulation. In general, the test vehicles with longer mileage in the fleet tended to have higher CO emissions. Car#4, the vehicle with the highest mileage, emitted the highest CO emission in the test, which was 0.911 g/km and almost approached the limit value, while the lowest CO emission of 0.326 g/km came from Car#3, the vehicle with the shortest mileage, creating a quite broad car-to-car variance in CO emissions in the fleet. On a crew average, the CO emission from these field-aged dedicated methanol taxis was 0.655 ± 0.211 g/km, which was more than 30% lower than the limit value of China-4, indicating good CO conformity of these methanol taxis.
The regulatory limits of China-6a and China-6b are also given in
Figure 2. Four of the six test vehicles could meet the requirement of China-6a, but only one vehicle managed to meet China-6b. Since China-6 is WLTC-based, which means a more aggressive driving style than the NEDC and, therefore, a stiffer challenge for CO compliance, substantial improvements in the combustion and after-treatment systems design are needed to meet future regulations.
In a cold-NEDC test, CO emission is primarily influenced by the conversion efficiency of the catalyst and the A/F ratio of the mixtures, and the former highly depends upon catalyst light-off, which is closely related to the aging of the catalyst. Meanwhile, the latter heavily relies on the starting strategy of engine design. For all the vehicles, CO emissions formed within the engine-start and early warm-up stage were gasoline-governed due to the cold-start difficulty with methanol. Within this period, both the temperature and conversion efficiency of the catalysts were quite low. Hence, a few CO spikes appeared in the modal data illustrated in
Figure 3. According to our previous research, on a new dedicated methanol vehicle, it cost approximately 160 s to light off the catalyst from cold-start [
9], but the time spent was remarkably lengthened to 250 to 400 s with the aging of catalyst as shown in
Figure 3, underlying the extra CO emissions from the high-emitters.
Apart from the cold-start and warm-up duration, the fuel transition from gasoline to methanol is another key CO contributor not only because it happens when the catalyst has not been fully activated (around 80–100 s after test start as shown in
Figure 3) but also due to the temporary out-of-control nature of the A/F ratio. In a port fuel injection (PFI) engine like the type that powered these methanol taxis, fuel is injected into the intake manifold and may partially impinge on the inner surfaces becoming a thin fuel film, mainly when the engine is cold. The fuel film will then evaporate and reenter the intake flow. The existence of such a “fuel film” effect renders the accurate gauge of fuel injection rates difficult, especially within the fuel-switch event, where a short overlap of gasoline and methanol could occur. Thus, to ensure a smooth transition, the mixtures were slightly enriched to warrant the engine’s operating stability. Therefore, more CO emissions were formed. Given that the vehicles with longer mileage could have more severe methanol erosion in injectors and the slower response of more aged oxygen sensors, they tended to produce more CO than the cars with less mileage.
As depicted in
Figure 3, CO spikes could also be noticed during the extra urban driving cycle (EUDC) section, notably when the test vehicle accelerated from 100 to 120 km/h. Since the engine load increased to a considerably high level in a short period, burning stoichiometric air-fuel mixtures could no longer fulfill this power demand. Hence, the ECU enriched the mixtures, yielding a markedly high CO spike.
2.2. Total Hydrocarbons (THC) Emissions
Figure 4 depicts the THC emissions from each test vehicle. The THC emissions from the six test vehicles were relatively close. The largest inter-car variation of 33.8% was between Car#4 and Car#6. Similar to CO, the highest THC emission, which was 0.0799 g/km, came from Car#4, the vehicle with the highest mileage in the test fleet. There was no clear tendency between the mileages and THC emissions among the rest of the test vehicles. According to
Figure 4, the THC emissions from all the six test vehicles were below the limit value of China-4 of 0.1 g/km, suggesting good in-service conformity. On average, the THC emissions from these dedicated methanol taxis were 0.066 ± 0.010 g/km, about one third lower than the limit of China-4. However, a comparison to the China-6b limit of 0.05 g/km THC highlights the challenge for the future application of methanol vehicles. It can be estimated that regardless of the difference in drive cycles, a minimum reduction of 40% in THC is mandatory for type-approval.
In
Figure 3, THC emissions detected over the NEDC are typically contributed by the incomplete oxidation of fuel within the engine-start event and warm-up period. Additionally, engine misfire could be another crucial source of extra THC [
2]. However, we have to be cautious about the artifact caused by the FID principle, which quantifies THC emissions by oxidizing hydrocarbons into carbon ions and counting them. Thus, an FID cannot identify the existence of oxygen in molecules, resulting in an underestimation of THC mass. This is particularly true for methanol vehicles because oxygenated hydrocarbons are much more abundant in the exhaust, underlying the discrepancy between THC and unburned methanol emissions. This issue will be carefully discussed in the section of unburned methanol emissions using Car#6 being an example.
It is observable from the CO emissions depicted in
Figure 2 that after more than 160,000 km driving, the performance of the TWCs of these test vehicles to various degrees worsened. The deterioration of catalyst performance manifests in (1) extended light-off time, and (2) reduced conversion efficiency at working temperature. This is particularly true for the hydrocarbons in the exhaust of a dedicated methanol car as it has been reported that both formaldehyde and unburned methanol required a quite high temperature to be fully oxidized [
36,
37].
2.3. Nitrogen Oxides (NOx) Emissions
Figure 5 illustrates the NOx emissions from all the six field-aged dedicated methanol taxis. Similar to the THC emissions, NOx emissions from the six test vehicles were relatively close. However, no correlation between the mileage of the test vehicles and NOx emissions was yielded in
Figure 5.
Overall, the NOx emissions from these field-aged methanol taxis ranged from 0.0226 to 0.0386 g/km and averaged at 0.0277 ± 0.0062 g/km, suggesting the superiority of methanol fueling in maintaining in-service conformity even after long-range driving and indirectly reducing the risks of ground-level ozone and secondary aerosols. Compared to the limit value for NOx in China-4, which is 0.08 g/km, even the highest NOx emission measured in the current fleet was more than 50% lower than the limit, demonstrating the strength of in-use NOx control of these dedicated methanol taxis. Even according to the current most stringent China-6 limit, only one of the six test vehicles failed, but it is noteworthy that the limit value of China-6 is WLTC-based while the tests performed in this paper were NEDC-based, which reduced the difficulty of compliance due to its less transient trait.
It can be seen in
Figure 3 that apart from the NOx spike noticed in the first 70 s after the start of testing, there are only a few small spikes afterward. In theory, the formation of NO is a function of the availability of oxygen, in-cylinder temperature, and residual time. Since the engines of the test vehicles ran in a stoichiometric manner, an essential reason for the well-controlled NOx emissions is the relatively low in-cylinder temperature, which is a consequence of methanol’s lower adiabatic flame temperature and higher latent heat of evaporation.
2.4. Particle Number (PN) Emissions
Figure 6 depicts the PN emissions from the six dedicated methanol taxis measured using a PMP-compliant, certification-level condensed particle counter (CPC), which only counted the solid particles with diameters ranging from 23 nm to 2.5 µm.
PN emissions from these methanol taxis ranged from 6.5 × 10¹⁰ to 2.71 × 10¹¹ #/km with considerable data variations in the test crew. The average PN emissions from these methanol taxis are 1.44 × 10¹¹ ± 7.3 × 10¹⁰ #/km, which is 24% of the China-6b limit of 6.0 × 10¹¹ #/km. Even the highest PN emissions among the test crew (Car#2) is 45.2% of the China-6 limit. The lowest PN emissions in the fleet, which was from the vehicle with the shortest mileage (Car#3), were only 10.8% of the China-6 limit value. Although China-6 limits are WLTC-based, such significant gaps between the NEDC-based PN results and the China-6 limit could still highlight the advantage of using methanol as a fuel in maintaining low PN emissions even after high-mileage driving, indicating the potential of methanol fueling as an economical technical route for future PN compliance.
An important reason for the very low PN emissions from these dedicated methanol vehicles is the simple chemical structure of methanol. Unlike the complex compounds in gasoline, there is only one carbon atom in the methanol molecule. Compared to gasoline and other liquid fossil fuels, methanol is less likely to form C = C bonds or ring structures during the combustion, largely prohibiting the formation of polycyclic aromatic hydrocarbons (PAHs), which are the critical precursor of sooty particles [
7]. Moreover, since methanol is the simplest alcohol, light-molecular-weight materials shall dominate the volatile organic compounds presented in the exhaust, which tend to remain in the gas phase once emitted and cooled down instead of becoming droplets via condensation, also greatly benefitting a reduction in the number of particulate emissions [
38]. In addition, from the measurement perspective, regulatory CPC measures exhaust-borne particles with a diameter above 23 nm. The volatile compounds of particles are eliminated in the preconditioning process using a thermal vaporization tube or catalytic stripper. The size distribution results of methanol combustion derived particles have shown a number concentration spikes of nanoparticles with a diameter down to around 10 nm [
7], which will not be counted in a regulatory test and could be a reason for the very low PN emissions from these high-mileage methanol taxis.
2.5. Formaldehyde (HCHO) Emissions
Figure 7 illustrates the formaldehyde emissions from the test vehicles, which are the primary concern of burning methanol as an engine fuel. The formaldehyde emissions from the six methanol taxis were from 1.055 to 2.325 mg/km, with the fleet average being 1.620 ± 0.469 mg/km. Compared to the provisional limit of 2.5 mg/km set by the MIIT in 2018, which is the same with the US Tier 3 requirement but based on the WLTC, the formaldehyde emissions from these field-aged methanol taxis were 7% to 58% lower.
Table 3 compares the formaldehyde emissions from the test vehicles to the results of previous studies. The formaldehyde emissions from these methanol taxis were comparable or lower than those from the pre-Euro-5 cars fueled with gasoline or methanol-gasoline, indicating the health risk associated with the formaldehyde emissions from properly maintained methanol vehicles is no higher than that of gasoline.
First of all, low tailpipe formaldehyde emissions from these field-aged, dedicated methanol taxis were secured by a well-designed combustion system, warranting complete methanol combustion, and therefore minimum raw formaldehyde emissions from the engine, reducing the reliance upon the performance of the catalytic converters. Hence, formaldehyde emissions became less sensitive to catalyst aging after long-period driving. Second, compared to retrofit methanol engines, the lambda control of this OEM methanol engine was more accurate and reliable, ensuring that the TWC could have high conversion efficiencies. Third, as manifested in
Figure 2,
Figure 3,
Figure 4 and
Figure 5, after very high mileage driving, the catalytic converters of these methanol taxies still functioned and removed a large portion of engine-out formaldehyde. As reported by Wei et al., a well-functioning hot catalyst was able to eliminate about 90% of the formaldehyde borne in the exhaust [
36].
2.6. Unburned Methanol (MeOH) Emissions
The unburned methanol emissions from the six field-aged, dedicated methanol taxis are plotted in
Figure 8. It can be seen that the unburned methanol emissions from Car#1 to Car#5, which ranged from 3.81 to 7.16 mg/km, were all below 10 mg/km but above 2.5 mg/km, which are the provisional limits for unburned methanol emission from light-duty methanol vehicles set by the MIIT of China in 2010 and 2018, respectively. However, the unburned methanol emission from Car#6 was 51.22 mg/km, more than six times greater than the rest. Nevertheless, it is interesting to notice that the least formaldehyde also came from Car#6, this tendency agreed well with the trade-off correlation between unburned methanol and formaldehyde emissions observed by Gong et al. [
11].
The significant differences among Car#6 and the other test vehicles also amplified the fleet-averaged unburned methanol emission and its standard deviation, which were 13.25 and 18.64 mg/km, respectively. By contrast, the average of unburned methanol emissions from the test fleet excluding Car#6 was only 5.65 ± 1.40 mg/km, which was 126% higher than the 2018 limit of 2.5 mg/km, suggesting that unburned methanol emission is currently the principle stress hindering the scale application of dedicated methanol vehicles. Although the concentrations for methanol exposure to cause acute and chronic symptoms are much higher than those for formaldehyde, in light of that unburned methanol is primarily produced during cold engine operation and could accumulate to a considerably high level in some confined spaces like underground car parks, highlighting the necessity of its control to secure public welfare.
According to one of our previous reports, unburned methanol emissions were primarily contributed by two factors: (1) incomplete fuel oxidation in the warm-up period due to cold cylinder wall quenching and fuel enrichment, and (2) engine misfire that can occur during cycle driving [
2]. Regarding the remarkably high unburned methanol, as in the case of Car#6, it is more likely to be induced by the occasional misfire. Injection system issues are considered the main reason for the engine misfire of methanol engines. Abnormal movement of injector springs induced by inadequate lubrication but high corrosion effects of methanol could result in inaccurate fuel injection rates, and therefore considerable cycle-to-cycle and cylinder-to-cylinder variation and unevenness, becoming a significant source of unburned methanol emissions. For high-mileage vehicles, misfire tends to happen more frequently during engine warm-up and aggressive acceleration. Limited by the off-line method for unburned methanol quantification and no access to the instantaneous misfire rate of each cylinder from OBD port (not mandatory in China-4) in this research, more evidence shall be complemented to verify this hypothesis by follow-up studies.
It is also interesting to see in
Figure 5 and
Figure 8 that the unburned methanol emission measured from Car#6 roughly equaled its THC emissions. As introduced in the THC section, this phenomenon was induced by the limitation of the FID method when quantifying oxygenated hydrocarbons. In theory, an FID detector converts all the exhaust-borne hydrocarbons to carbon atoms with a hydrogen flame, and then counts the number of carbon atoms and gives THC concentration readings in the unit of ppm expressed equivalent to carbon atoms (ppmC). For widely used fossil fuels, representative C/H/O ratios of their THC emissions have been worked out, based on which pollutant mass is calculated with known concentrations. However, in the case that the oxygenated hydrocarbons dominated the THC emissions, this method may significantly underestimate the THC mass when engine misfire occurred, such as with Car#6. This matter is particularly problematic with methanol since oxygen occupies 50% of the molecular weight of methanol. Hence, it is highly recommended to employ a GC/FID method for quantification if a high content of unburned methanol could be present.
2.7. A Comparison between Field-Aged and New Methanol Vehicles
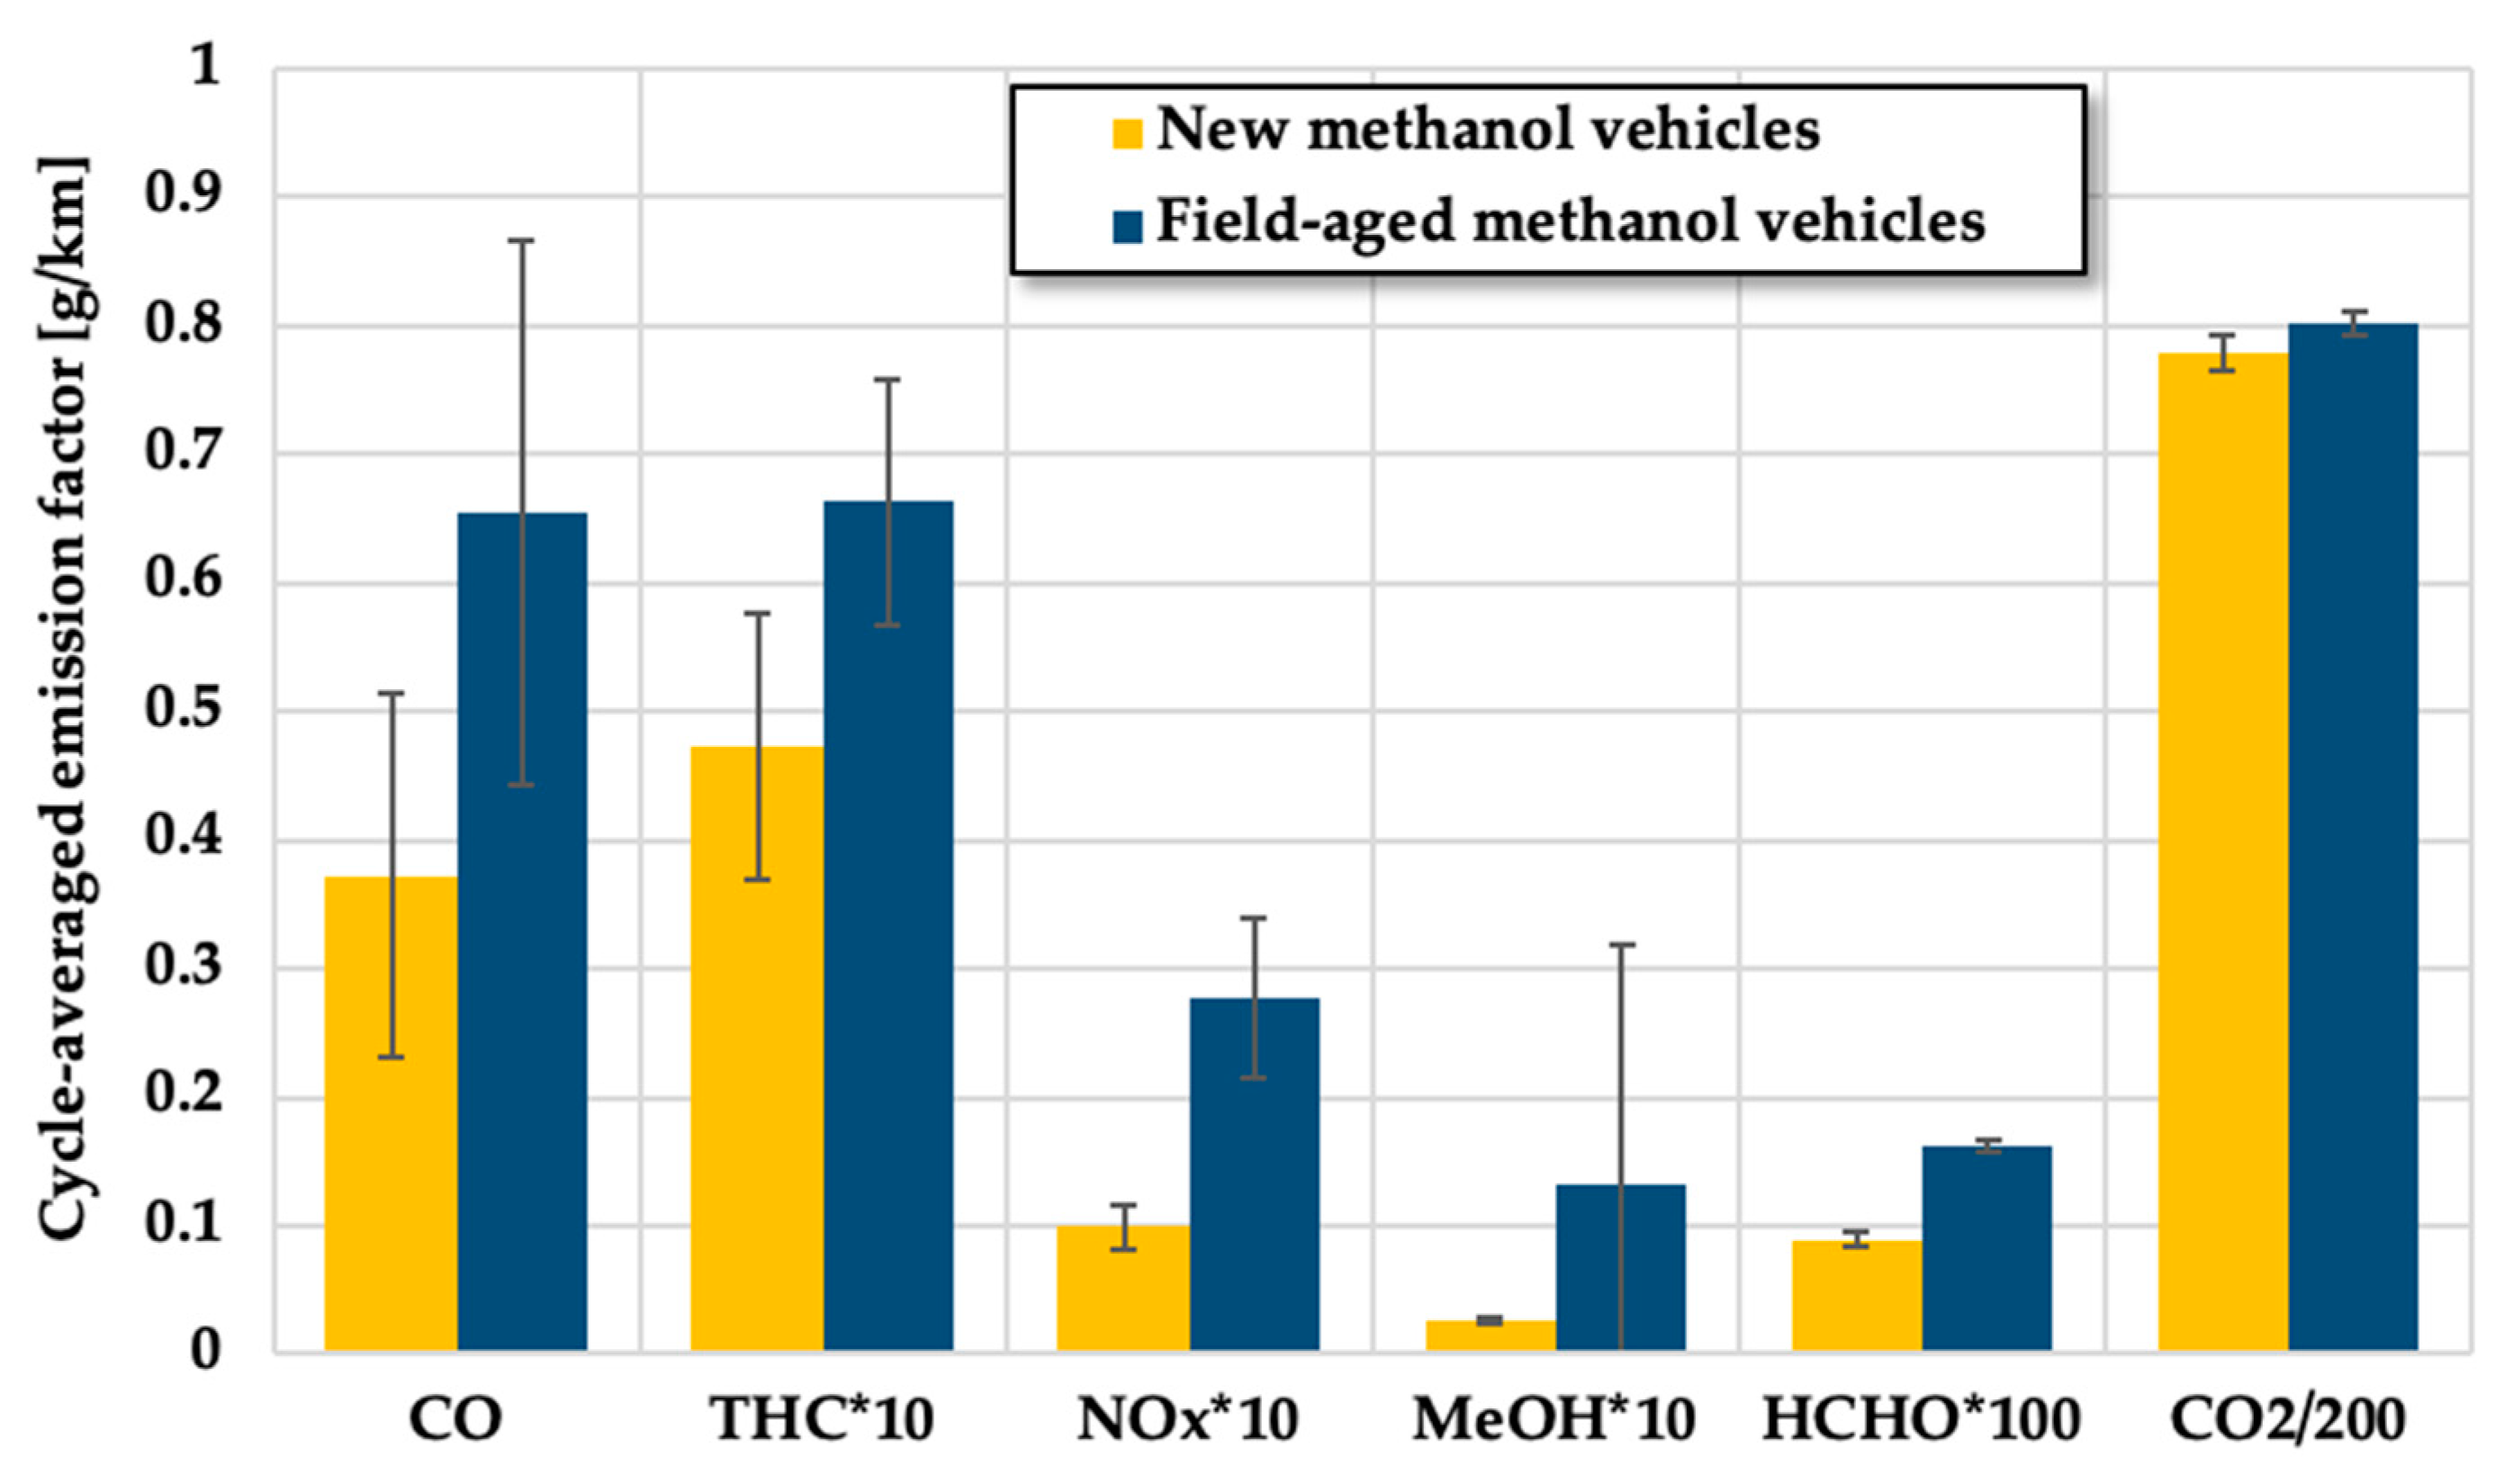
Figure 9 compares the regulated and unregulated emissions from the six dedicated methanol taxis to those from a fleet of three new methanol vehicles. The field-aged and new vehicles compared here are the same model type. The regulated and unregulated gaseous emissions were measured in the same laboratory using identical procedures. Part of the results for the new vehicles is available in our previous publications [
9].
It can be seen in
Figure 9 that relative to the new vehicles, on average, CO, THC, NOx, unburned methanol, and formaldehyde emissions from the six field-aged methanol taxis increased by 76.1%, 40.2%, 179.8%, 398.1%, and 82.0%, respectively. Among the regulated gaseous emissions, NOx emissions show the highest sensitivity to catalyst aging, which agrees well with previous studies. Even so, all the regulated emissions managed to meet China-4 after long-term use, demonstrating good in-service conformity of the neat methanol fueling regime.
Underlined by the extraordinarily high concentration of Car#6, unburned methanol emissions from the six field-aged, dedicated methanol taxis surged nearly three times from the new vehicle baseline. Although the carcinogenicity and toxicity of methanol are much lower than formaldehyde, such a high surge highlights the necessity to monitor and regulate unburned methanol emission from dedicated methanol vehicles since hazardous exposure to methanol can induce several acute and chronic symptoms [
41,
42].
Formaldehyde emission deteriorated at a faster rate than CO and THC, probably because of its stronger dependence on the performance of catalytic converter and high exhaust temperatures. Since the PN emissions from the new vehicles were not measured, no comparison is made in
Figure 9.
Figure 9 also compares the CO
2 emissions from the test vehicles to new vehicles. Because of the wear along with the high-mileage operation, which could be more severe with methanol fueling due to its stronger corrosion effects upon metal and rubber parts like injectors, the fuel economy of these methanol taxis has deteriorated by 3.1% from the new vehicle baseline. The methanol consumption per 100 km of these high-mileage taxis tested over the NEDC was 13.93 L on a fleet average.
3. Conclusions
This paper reports the regulated, unregulated, and particle number emissions measured over the new European driving cycle from a crew of six field-aged, China-4 compliant, dedicated methanol taxis that have run from 166,000 to 225,000 km. The conclusions are below.
Regulated emissions: Despite observed catalyst performance deterioration, all the field-aged methanol taxis managed to meet the requirements of China-4 after they at least doubled the useful life defined in the regulation, which suggests good in-service conformity and satisfactory in-service nitrogen oxides compliance. In the test fleet, the test vehicles with longer mileage tended to emit higher carbon monoxide and total hydrocarbons emissions, but there was no such correlation in terms of nitrogen oxides.
Unregulated emissions: Relative to the regulated emissions, unregulated emissions worsened at faster rates with catalyst aging. However, after high-mileage use, formaldehyde emissions from the test vehicles were maintained at a low level comparable to or lower than the previously reported emission factors from pre-Euro-5 fleets burning gasoline and various methanol-gasoline blends. One test vehicle emitted extraordinarily high unburned methanol emission, which was roughly ten times the amount of other properly operating candidates, as a possible consequence of occasional engine misfire. At present, unburned methanol is the principal stress for future methanol applications. It is also noticed that a flame ionization detector may cause underestimation of the mass of total hydrocarbons, particularly when oxygenated compounds played a dominant role in the exhaust.
Particle number: Regardless of the broad car-to-car variations identified in the test fleet, particle number emissions from these field-aged, dedicated methanol taxis remained low after high-mileage driving, suggesting the potential of neat methanol fueling as an economical technical route for future particle number compliance.

 ,
, 


