Article

Total Solar Reflectance Optimization of the External Paint Coat in Residential Buildings Located in Mediterranean Climates

1
Corporação Industrial do Norte, S.A., avenida Dom Mendo, n. 831, Apartado 1008, 4471-909 Maia, Portugal
2
Laboratory for Process Engineering, Environment, Biotechnology and Energy, Faculty of Engineering, University of Porto, Rua Dr. Roberto Frias, 4200-465 Porto, Portugal
3
Department of Mechanical Engineering, Faculty of Engineering, University of Porto, Rua Dr. Roberto Frias, 4200-465 Porto, Portugal
*
Author to whom correspondence should be addressed.
Submission received: 17 April 2020 / Revised: 21 May 2020 / Accepted: 27 May 2020 / Published: 29 May 2020
(This article belongs to the Special Issue Buildings Energy Efficiency and Innovative Energy Systems)

Abstract

:
This work addresses the effect of the total solar reflectance (TSR) value of paints applied in residential buildings upon their thermal performance. A semi-detached residential building was modeled in the ESP-r software, and taken as the basis for parametric studies which assessed the effects of variations in (i) the TSR values; (ii) the thermal characteristics of the building envelope; (iii) the location/climate; and: (iv) the way how the indoor temperature is controlled. The parametric studies were used to find optimal TSR values for each combination of Location + Building envelope characteristics (mainly the existence of thermal insulation). It was concluded that paints having a carefully chosen TSR value lead to better indoor thermal temperatures if the buildings have no mechanical heating or cooling, or to energy savings of up to 32% if they do.

1. Introduction

Climate change refers to a statistically significant variation, persisting for an extended period, in either the mean state of the climate or in its variability [1]. Climate change can be caused by anthropogenic actions, particularly by the increase of greenhouse gases (GHG) emissions in the atmosphere. The climate change has serious and severe consequences, direct and/or indirectly related with human’s life, such as: extreme weather events [2], mass movements [3], temperature rises in mainland’s [4] and ocean’s surface [5], melting ice of the polar ice caps, rising sea level, among others [1].
According to the European Commission, the Mediterranean area “is becoming drier, making it even more vulnerable to drought and wildfires” [6]. Residential demand will be impacted by climate change due to the increase in average temperature, weather extremes, and the consequent change on space heating and cooling needs [7]. In 2017, in the EU-28, the residential sector accounted for 27.2% of the final end-use of energy [8]. The increase in GHG is mainly related to the increase in energy consumption. To decrease the amount of GHG realized to the atmosphere, the new and existing building stock needs the implementation of both renewable energy supply and energy efficiency measures.
The thermal insulation of buildings has been applied since the earliest civilizations, which used soil as an insulator. During the Industrial Revolution, mineral fibers were introduced as pipe insulation and later adapted for buildings as fiberboards [9]. In the 1910s, with the introduction of the first HVAC (heating, ventilation, and air-conditioning) systems in buildings [10], major concerns about the thermal insulation of buildings have emerged. Several approaches were considered, namely ETICS (external thermal insulation composite systems) with numerical [11], and experimental studies [12], which confirms its benefits in terms of thermal comfort and reduction of initial and operative costs in air conditioning [13]. Also, multilayer façades can be considered [14], such as a double-wall façade with and without thermal insulation [15], or a ventilated façade able to reverse the heat flux through the building envelope and reduce the indoor heating demand [16], among others. More recently, an innovative thermal comfort passive strategy became commercially available: the use of phase change materials (PCM). Contrary to the common thermal insulation (such as ETICS), PCM allows obtaining indoor thermal comfort with thinner building envelopes, because they do not require high volume, which is normally a limitation in the building sector [17].
Studies concerning thermal comfort are not limited to the vertical opaque envelope of buildings; the heat transfer through the building’s roof has also been assessed. A good example was reported by Pisello et al. [18], that studied the thermal and energy performance of a historic residential building with a green roof. The simulation results showed that green roofs could decrease the indoor temperature during the summer period up to 3 °C compared to a concrete roof (CR) and up to 6 °C compared to a bitumen roof (BR); in winter, green roofs allowed to increase the indoor temperature up to 2 °C compared to CR and ca. 3 °C compared to BR, due to the high thermal insulation produced by the vegetation layer. Assuming a comfort temperature range between 20 °C–26 °C, these researchers concluded that the green roof with green grass reduced the annual primary energy requirements of about 29.4% compared to CR and approximately 42.1% compared to BR.
Although glazed areas have an important role to obtain thermal comfort, opaque façades often occupy most of the building envelope, especially in old buildings, and could account for a great part of the total heat gain or loss. For instance, it is more likely for a high-absorptivity opaque wall to achieve 60–70 °C, under strong solar radiation, rather than a transparent window with high transmissivity [19].
Solar reflectance is the ratio of solar energy reflected by a surface [20]. The reflectance of a building’s coating is normally characterized by the percentage of total solar reflectance (TSR). Low values of TSR are associated with darker colors, while light colors typically have a high TSR [21]. High or low values of a surface’s solar reflectance may lead, respectively, to lower or higher heat gains [22] and surface temperatures [23]. Consequently, the buildings’ coating color choice is often considered a solar radiation control strategy [24]. Paints may be designed to retain the solar heat (hot paints) or to reflect most of the solar radiation (cool paints) to prevent the treated surface from heating [25].
Cool paints are high solar-reflective coatings, and a passive thermal comfort strategy easy to apply, with a short period of investment cost recovery, which can be applied to any type of building (either residential or office or industrial, either with old or new construction, either single-story or high-rise) [26]. Their application is especially useful in hot climates: with no heating needs, and without considerable winter drawbacks; and in warm climates: when no cooling system has been installed, and cool paints account for the reduction of cooling needs [27].
The Lawrence Berkeley National Laboratory (LBNL) had been conducting an extensive researcher concerning the development and the use of cool paints. Researchers of this laboratory identified and characterized cool pigments with high reflective properties and created a free access pigment database [28]. Cool pigments, similarly to hot pigments, are pigments that display a much different reflectance in the infrared IR spectrum compared with the visible one [29]. In the case of the cool pigments, they display a very high reflectance in the IR spectrum while displaying a lower reflectance in the visible spectrum.
Following, LBNL developed experimental and simulation works to study the impact of coating with cool paints residential [30] or non-residential roofs [31,32] in terms of thermal comfort and energy saving [33], and improvement of air quality in urban areas [34]. Weathering tests and studies including paint coating soiling and cleaning effects were also performed [35,36]. In one of these studies [32,37], researchers of LBNL performed an experimental test, on six California commercial buildings located in Sacramento, San Marcos, and Reedley. The energy performance and the environment parameters of each building were recorded considering a cool roof application (TSR value of about 70%). These authors observed reductions between 15.6 °C and 23.9 °C on the maximum roof surface temperature. The experimental values allowed them to calibrate a simulation model used to estimate the energy savings of similar buildings located in all sixteen California climate zones. These authors concluded that energy savings up to 6.6 W∙m−2 could be achieved on the average peak demand.
Despite the beneficial effect of using cool paints, some studies depict that these paints may also harm the thermal comfort of a building. Namely, Dias et al. [26] simulated the impact of altering the value of TSR from 50% to 92% both on the external walls and roof of a residential building located in three different cities of Portugal. They observed a summer maximum indoor temperature drop of ca. 4 °C, and cooling energy savings up to 1.9 MWh·y−1. Nonetheless, these authors also observed a noteworthy increase in the heating demand of up to 2.9 MWh·y−1 (a penalty of about 25.9%); the overall effect was then a significant upsurge in energy consumption for reaching indoor thermal comfort.
To compensate for the heating penalty of using cool materials, thermochromic materials have been investigated for their great potential in reducing, simultaneously, the cooling and heating demand in buildings. Thermochromic paints can change the absorption of solar radiation dynamically according to external temperature [38]. Granadeiro et al. [21] performed thermal and energy simulations with thermochromic paints applied in the residential building façade located in Porto, Madrid, and Abu Dhabi. For all the climates, the application of the optimized thermochromic paint always leads to annual energy savings, up to 51% when compared with black paint and 48% when compared with white paint. However, the cost of thermochromic materials are still very expensive [39,40], and further developments on the chemical formulation of such paints to ensure longevity and cost-reductions should be encouraged. Another advanced option for adaptive façade response to the weather is the use of dynamic facades, capable of rotation and folding motion according to the external conditions. Xuepeng et al. [41] depicted energy consumption reductions by 14 21% with dynamic façades implemented, nonetheless, they also emphasized the high initial investment and maintenance cost that dynamic façades require compared to pristine façades.
As seen from the review, cool paints are cost-effective and easy to apply, while thermochromic paints and dynamic façades are costly and emergent techniques, even though their great potential. Nevertheless, cool paints typically improve performance related to summer but slightly worsen performance related to winter. There must, therefore, exist a trade-off that has an optimum for some TSR value. This work focuses precisely on the optimization of the TSR value of paints to obtain the maximum energy savings when applied both on the exterior façades and on the roof of a residential building. The study considers different cities of the Mediterranean European area: Bragança, Porto, Coimbra, Lisbon, Évora, Beja, Faro, Lajes and Funchal, in Portugal; Madrid, Barcelona, Seville, and Tenerife, in Spain; Paris and Nice, in France; Rome, in Italy; and Athens, in Greece.
Previous studies were focused on the optimization of solar reflectance to be applied to roof coatings or building exterior walls. For example, Yuan et al. [42] studied the combined optimum values of reflectivity and insulation thickness of building exterior walls for different regions of Japan, while Piselli et al. [43] reported optimum values of roof solar reflectance for six different Italian climatic zones. As far as the authors are aware, this work focuses, for the first time, on the optimization of the total solar reflectance value of paints, applied on both the external walls and the roof, to decrease the space heating and cooling needs. This article tackles the case of the European Mediterranean climate, which differs from most of the central and northern European climate zones, and shows appropriate solutions for this region, taking also into account the presence or absence of thermal insulation, as well as, the presence or absence of a thermal control system in residential buildings.

2. Case Study Description and Simulation Scenarios

2.1. Building Description

This study considers a single villa, with two floors and a not inhabited attic, with 90 m2 of floor area per story, as shown in Figure 1. Briefly, the ground floor has a living room, a dining room, a kitchen, a toilet, a hall, and stairs. The first floor has three bedrooms, a suite, a toilet, a bathroom, a corridor, and stairs. The attic is an open space, as mentioned before not inhabited.
The residential building has a total area of 26.3 m2 of windows with a single clear glass. It was considered the existence of venetian blinds on windows that cover 50% of each window. The zones considered to obtain the building indoor temperature were the living room, dining room, and the kitchen on the ground floor and the three bedrooms and the suite on the first floor. The internal gains of the zones previously mentioned were settled to 4 W·m−2. On the remaining zones, it was assumed 1 W·m−2 of internal gains (except for the uninhabited attic that was assumed to have no internal gains). A constant value of 0.6 air changes per hour was considered.
The dynamic thermal behavior and energy demand of this residential building were simulated using the open-source software ESP-r [44]. ESP-r is a building performance tool based on finite volume formulation, in which a problem specified in terms of geometry, construction, operation, leakage distribution, is converted into a set of discretized conservation equations—energy, mass, and momentum—which are then solved at successive time-steps in response to climate, occupant and control system influences—boundary conditions. ESP-r can model thermal, visual, and acoustic performance of buildings as well as estimate heat, moisture, and electrical power needs [44,45,46]. ESP-r has been extensively validated [47,48,49].
Two building construction types were considered: (i) a building with no thermal insulation, neither on the façades nor on the roof (named case BD1); and (ii) a building with thermal insulation both on external walls and on the roof slab (named case BD2).
The construction details of BD1 and BD2 are shown in Table 1 and Table 2. The specifications of each layer of the construction (e.g., conductivity, density, specific heat, emissivity, and absorption) follow the recommendations by the Portuguese national legislation [50].

2.2. Simulation Scenarios

The study considers different cities of the Mediterranean European area (except Paris): Bragança, Porto, Coimbra, Lisbon, Évora, Beja, Faro, Lajes, and Funchal, in Portugal; Madrid, Barcelona, Seville, and Tenerife, in Spain; Paris and Nice, in France; Rome, in Italy; and Athens, in Greece. To characterize the different climates, values of minimum and maximum outdoor air temperatures—during the coldest and hottest months, are shown in Figure 2, while values of sunshine hours—during the coldest and warmest months, and rainfall—during the wettest and driest months, are shown in Figure 3.
There are cities in which the outdoor air temperature variation between the average minimum and maximum values can differ approximately 30 °C, such as Seville, Madrid, and Bragança. Cities with lower temperature variation are mostly islands, such as Tenerife, Funchal, and Lajes, in which the average minimum outdoor temperature during the coldest months is above 10 °C. Most of the Mediterranean cities display ca. 10 h of sunshine during the warmest months and 5 h during the coldest ones. Paris, the only non-Mediterranean city, differs from the others by displaying lower values of sunshine hours and a smaller rainfall range. Coastal cities such as Porto, Lajes, and Nice display higher rainfall values during the wettest months than inland cities, such as Madrid, Évora, and Beja.

2.2.1. Case A (Conditioned Mode)

The energy demand needed to keep the indoor temperature within the recommended range of the Portuguese legislation at the time of the calculations (between 20 °C and 25 °C, [52]) was assessed by a full year simulation. The climatized room area is shown in Figure 1, totaling 105 m2. The cooling and heating thermal energy needs were converted into final electrical energy demand by considering as air conditioning system a reference heat pump with an average coefficient of performance (COP) of 4 for heating and 3 for cooling (also called EER instead of COP, in some literature). While practice the COP values do depend on the values of the outdoor temperature, this approach avoids having to choose a specific machine for the COP variation, which would introduce some level of arbitrariness. Given that the final heating and cooling energy demand (Edemand) are presented in the following chapter for both building simulation cases (BD1 and BD2).

2.2.2. Case B (Free-Floating Mode)

In this case, only a free-floating simulation (building having no mechanical cooling nor heating) was performed to evaluate the indoor temperature over the year. The weekly average daily maximum temperature (Tmax) and the weekly average daily minimum temperature (Tmin) were determined. Besides assessing the maximum and minimum temperatures, an indicator of time-integrated indoor temperature deviation from the comfort zone was also considered. The indicator fB was introduced, and defined as given by Equation (1):
f B = { 0 , T [ 20 , 25 ] i = 1 365 ( T M ¯ 25 ) 2 T M ¯ > 25 + i = 1 365 ( 20 T m ¯ ) 2 T m ¯ < 20
where T M ¯ is the average maximum temperature of each day of the year (in °C) and T m ¯ is the average minimum temperature of each day of the year (in °C).
To determine the optimized TSR value for each city and each type of building (BD1 and BD2), in cases A and B, several dynamic simulations were performed with an increment of 5% of the TSR value between simulations, from 5% to 90%. The optimized TSR value corresponds to the smallest value of annual energy consumption, in case A, and to the minimization of objective functions fB (described above), for case B. All the weather data used were obtained from the US Department of Energy/Energy Plus database [53]. Simulations were run with 10-min time-step, with results integrated over each hour.
The reference used for assessing the optimized external coating TSR was always the corresponding building coated with 50% TSR paint, both on the façades and the roof.

3. Results and Discussion

The TSR values that achieved higher energy savings (in case A) and higher fB reductions (in case B) are presented in Table 3 for several Mediterranean cities, and in Table 4 for Portuguese cities. The maximum and minimum indoor temperatures (Tmax and Tmin) are also compared between the reference case (50% TSR) and the optimized TSR value.
Additionally, Figure 4, Figure 5, Figure 6 and Figure 7 display examples of coating colors with the optimized TSR value for each location, for cases A and B and building constructions BD1 and BD2, according to the color catalog reported by Resines Company [54].
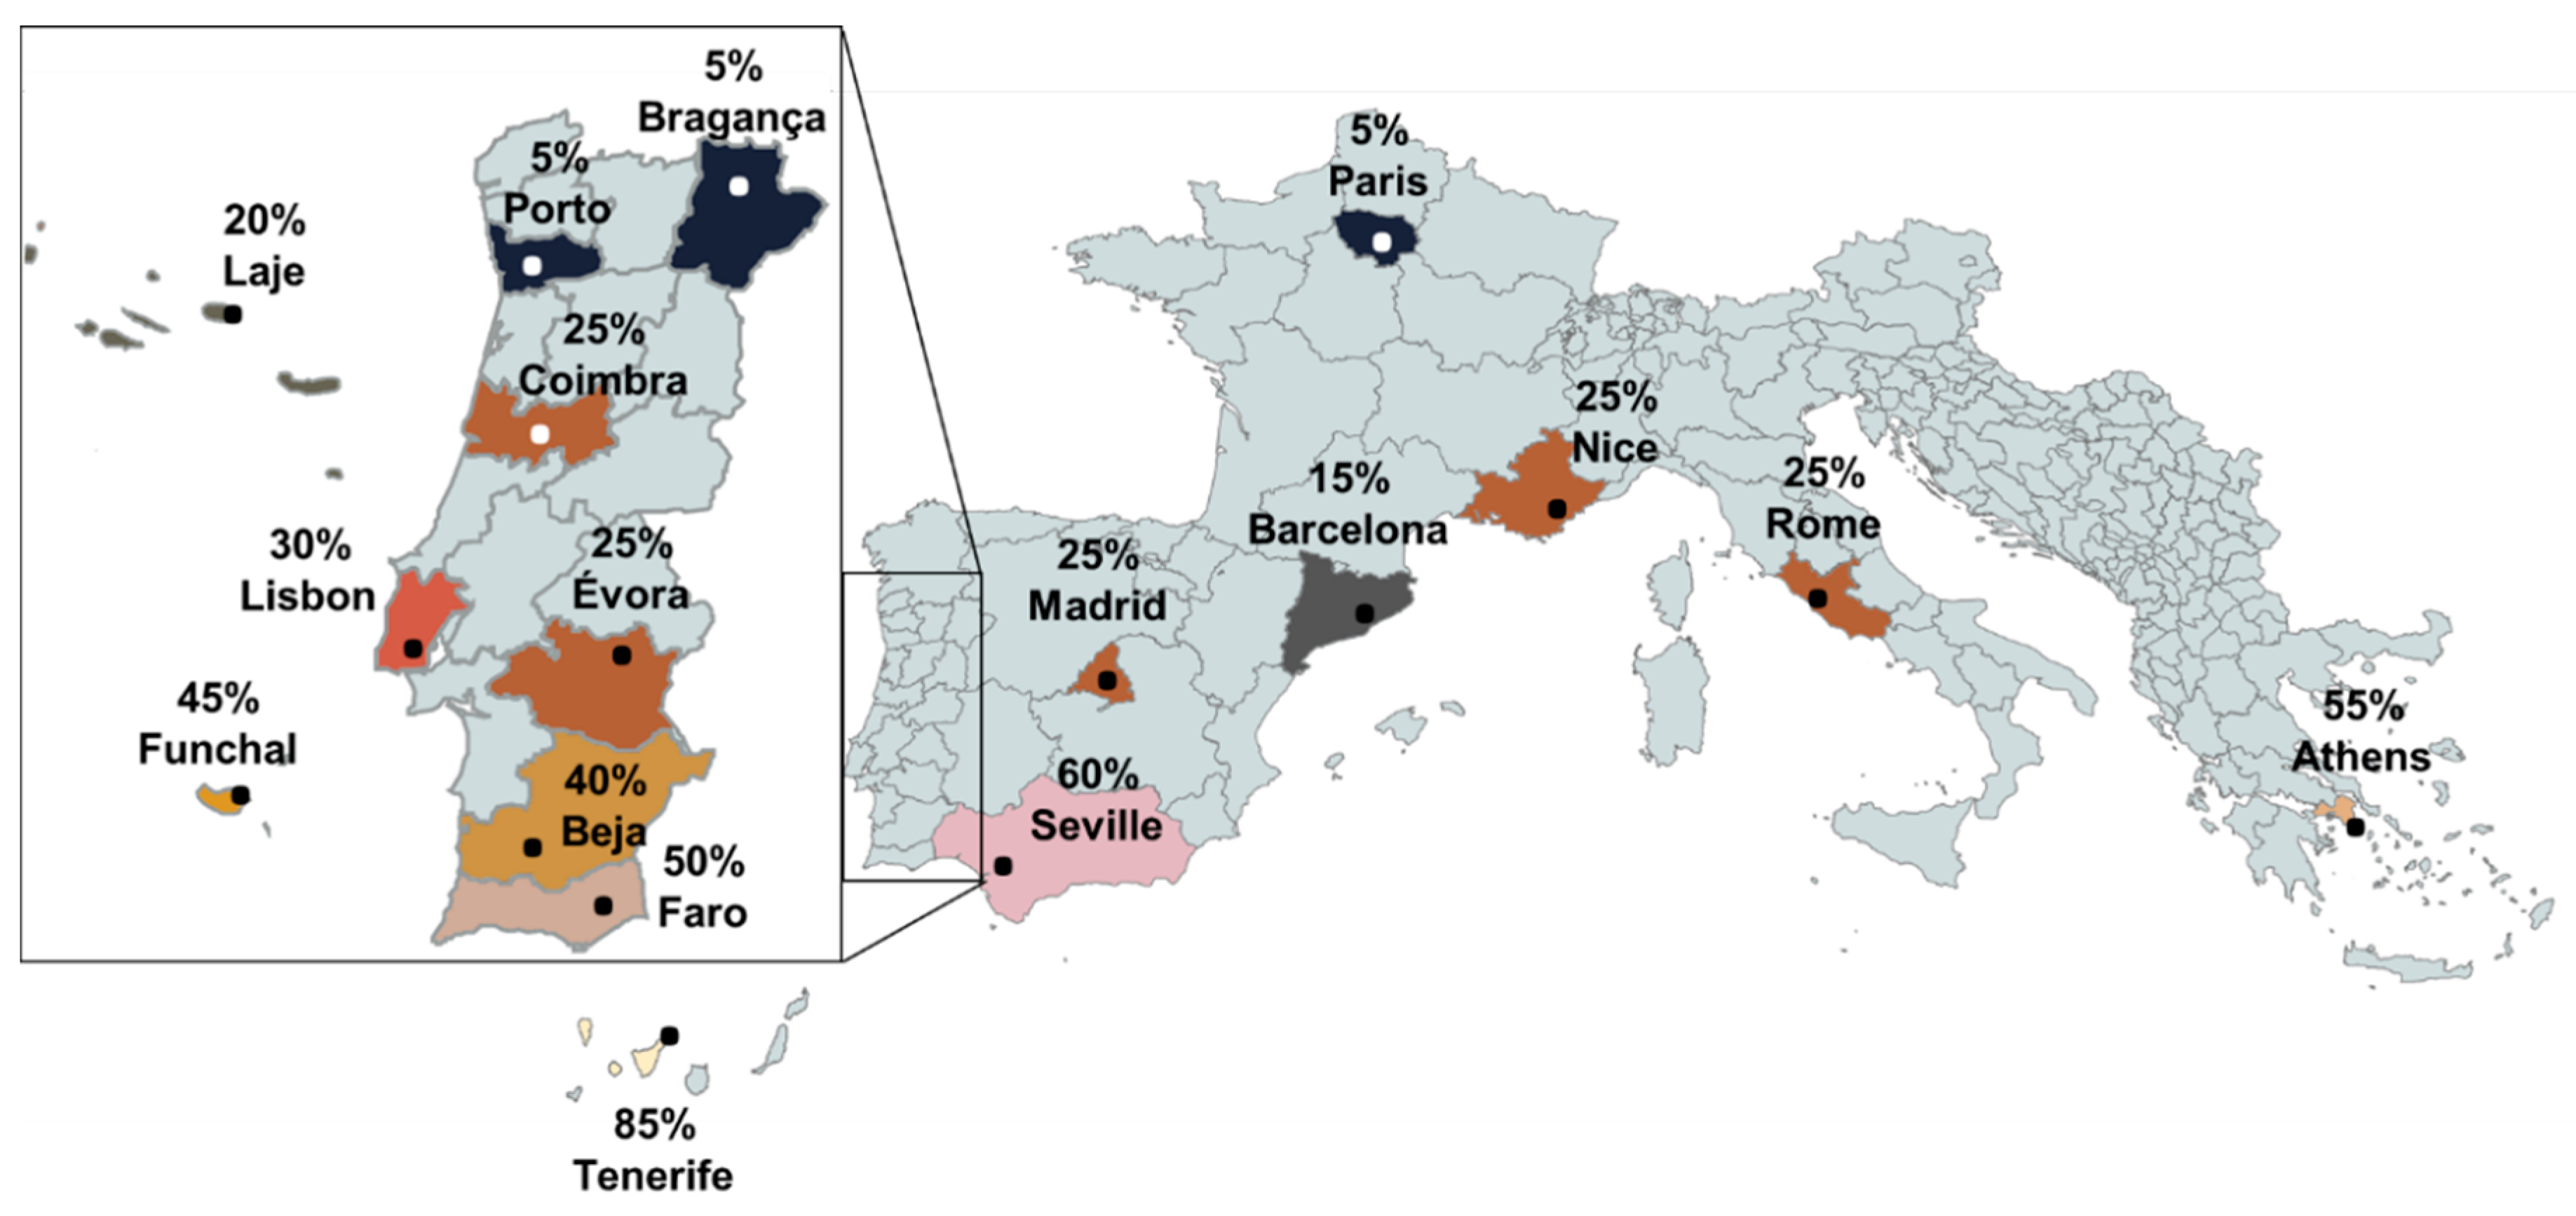
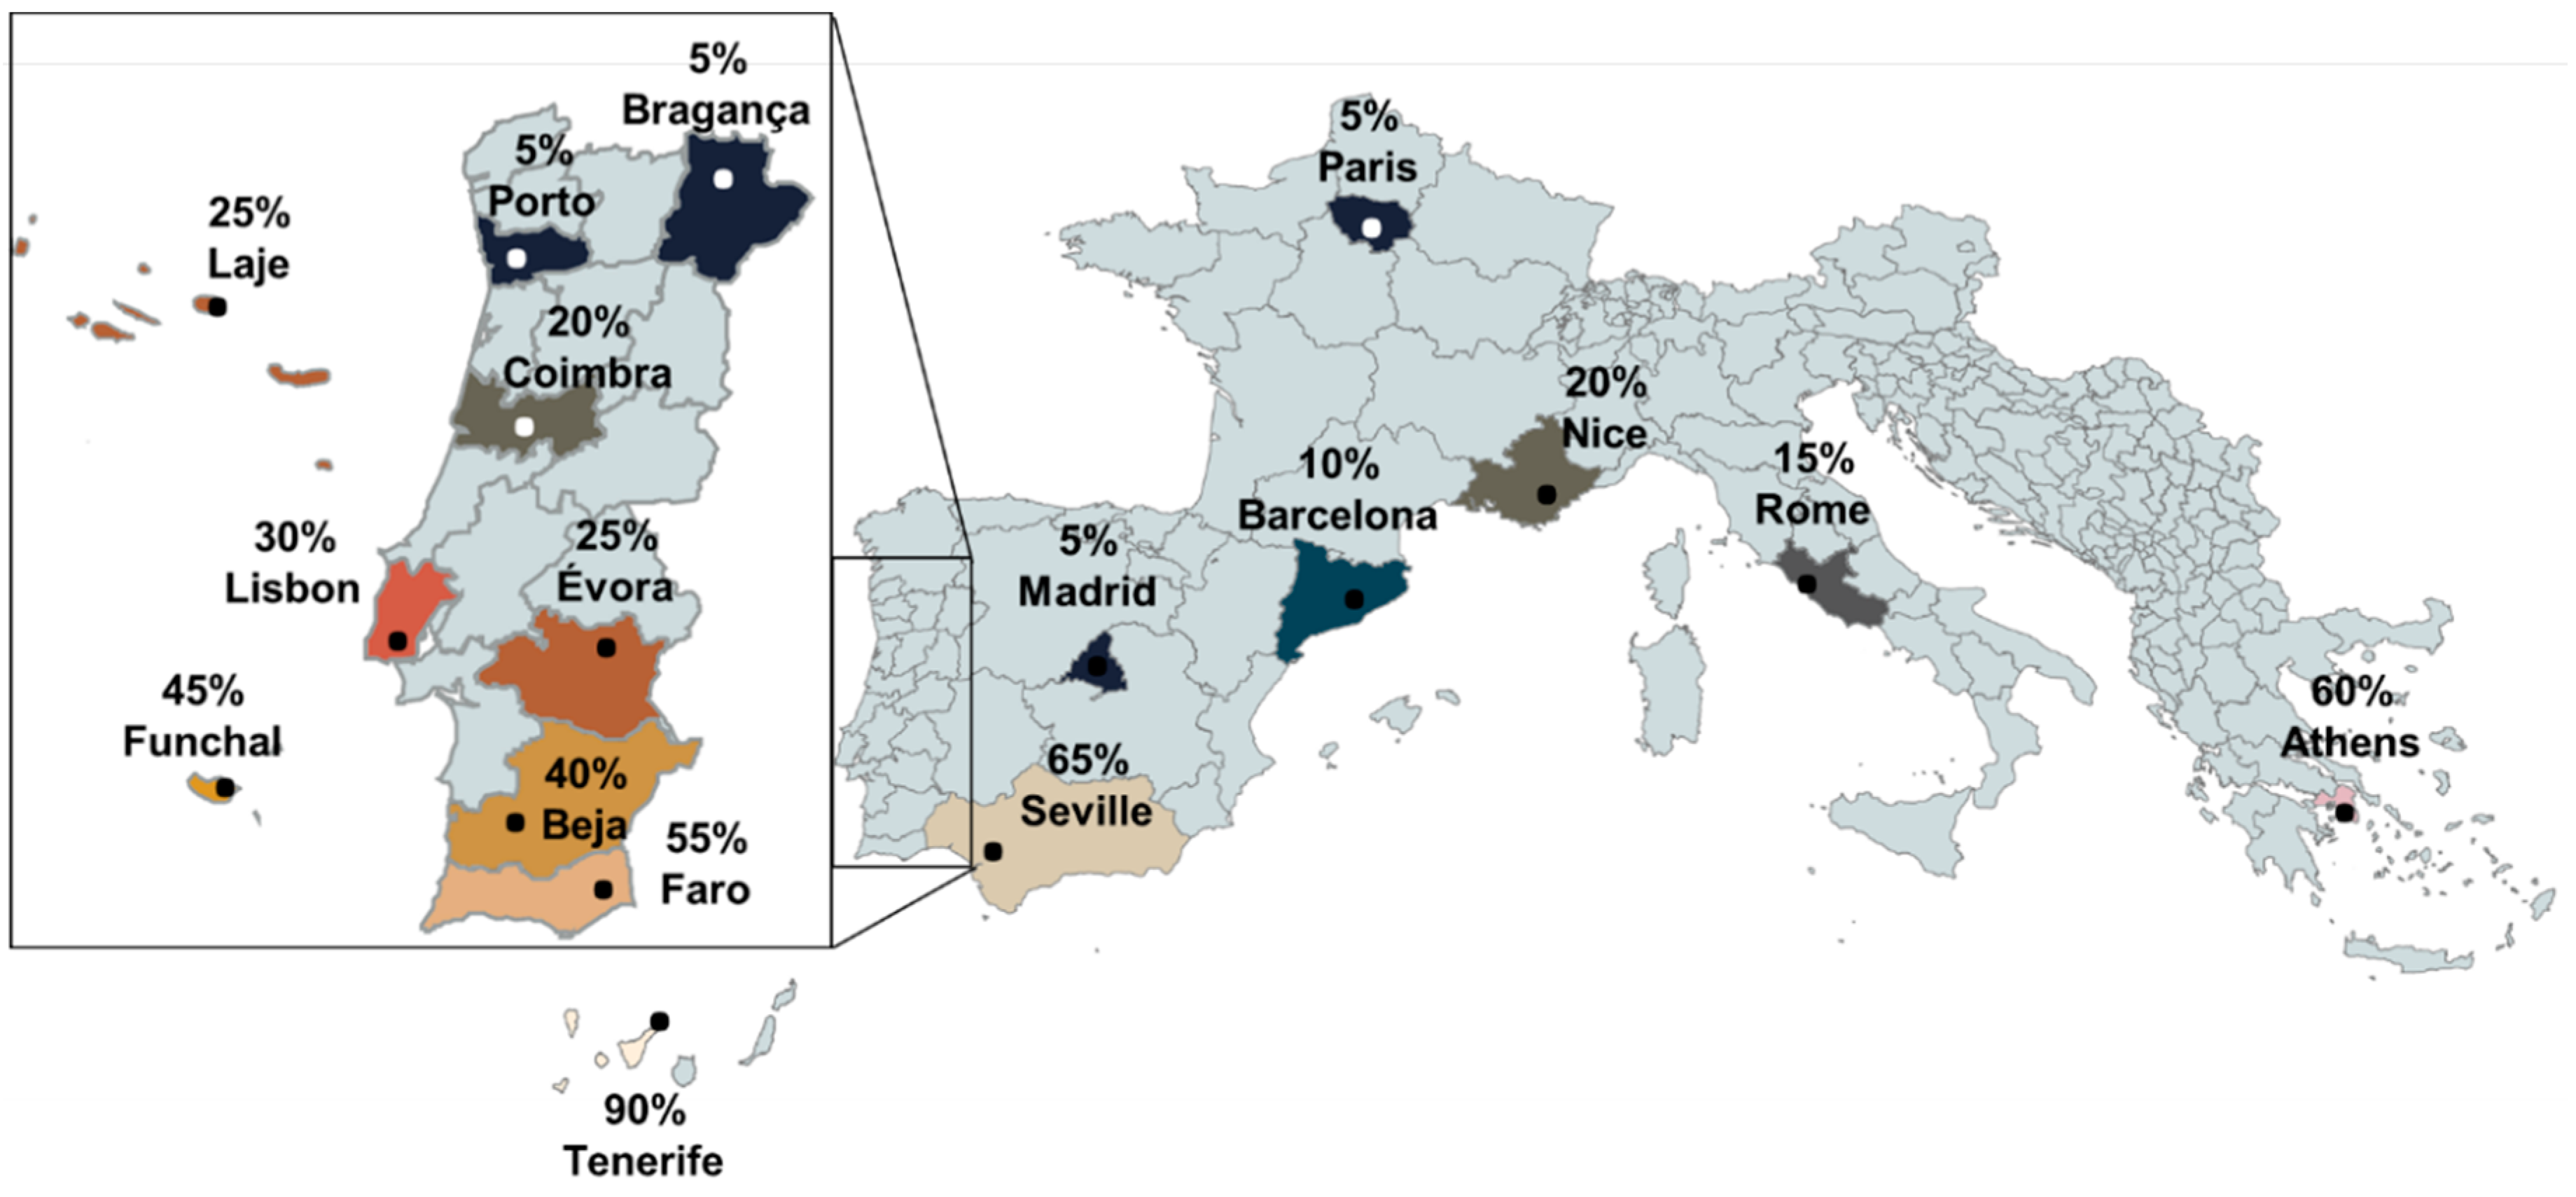
For Case A, energy savings of up to 32.2% (in BD2, in Tenerife) are observed when the TSR coating is optimized from 50% (reference) to 90%. Since Portugal is a country with heating needs higher than cooling, the optimized TSR values obtained are mostly low, for maximizing the sunlight absorption. The Portuguese city that would take the most advantage from this TSR optimization is Porto, with 11.6% energy savings when coated with 5% TSR paint; and 9.6% if coated with the minimum established value of 25% TSR. The optimized TSR value for BD1 is mostly equal or superior to that of BD2, exceptions are Tenerife, Athens, Seville, Faro, and Lajes—Figure 4 and Figure 5.
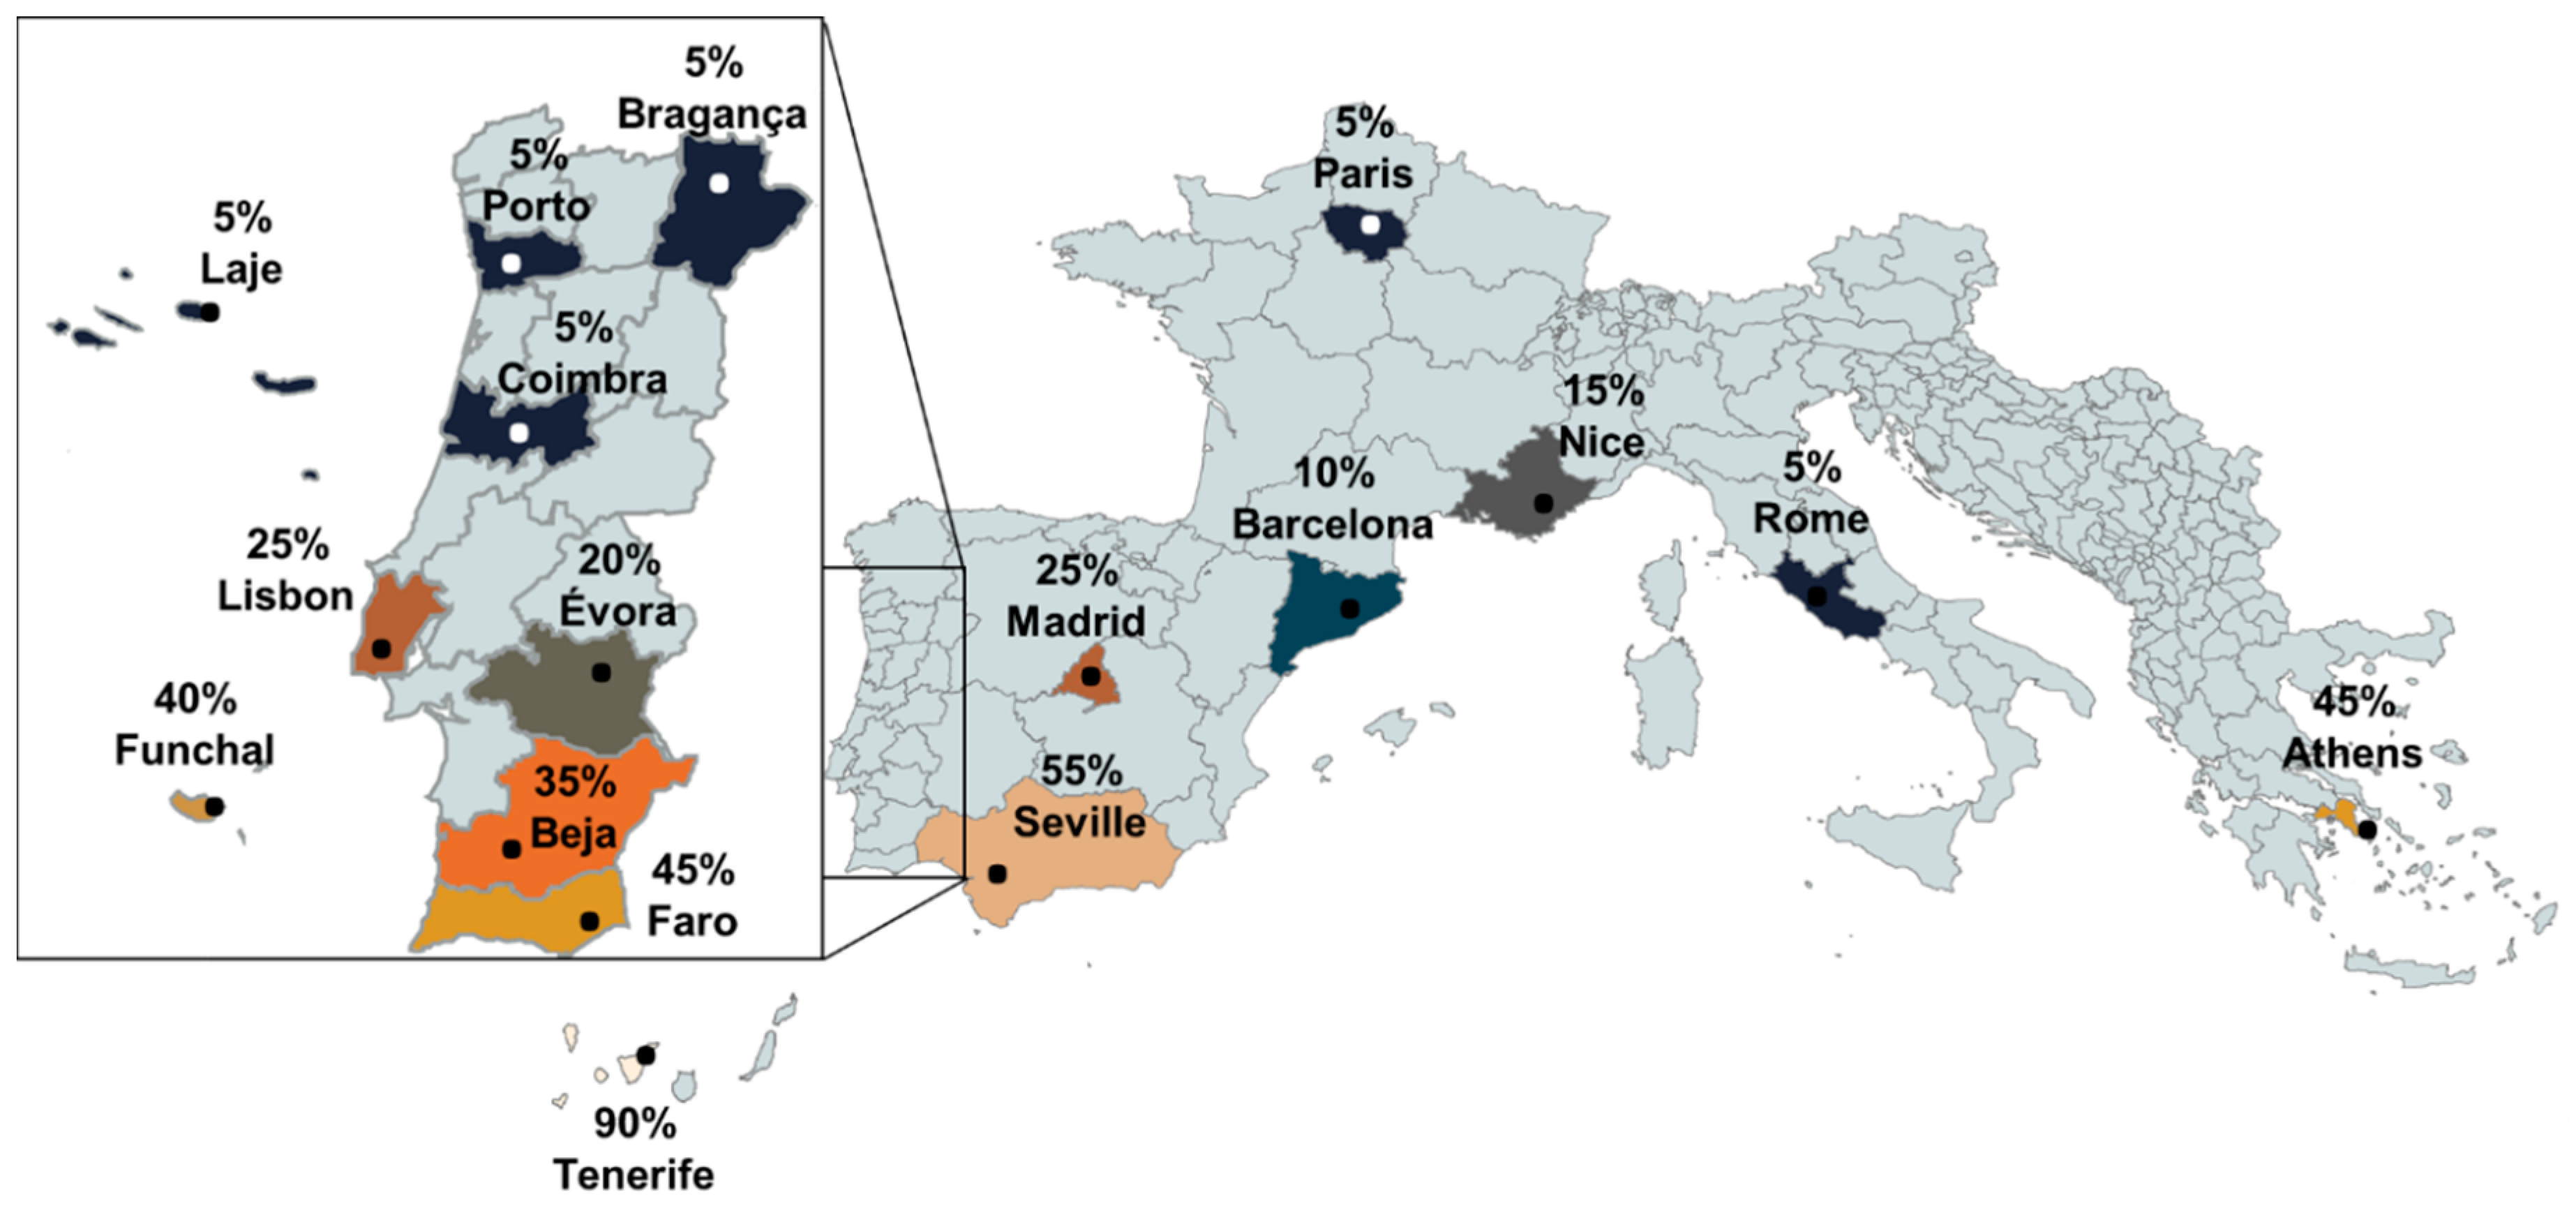
In Case B, the indicator fB decreases by up to 41.5% (in BD1, in Tenerife) when the optimized TSR coatings are used. Building configuration BD2, coated with an optimized TSR paint, always displays the best indoor temperatures, which corresponds to darker paint colors, compared to BD1. Figure 6 and Figure 7 show that generally the mainland region displays lighter colors as one moves from the inland to the coast region, as expected due to the decrease of heating needs.
Considering the studied cases, the optimized TSR values obtained in Case A are similar to those obtained in Case B. Results show that building BD2 coated with the optimized TSR paints, both on the external walls and the roof, always display the best indoor temperatures.
Table 5 condenses all the optimal values of TSR, and correspondent example of pseudo-colors according to the color catalog reported by Resines Company [54], for each simulation scenario.
Tenerife is the city with the highest optimal values of TSR (85–90%) which led to greater energy savings (32%). This fact confirms the known benefits of high reflective paints when applied in hot climates with cooling needs higher than heating needs, reported elsewhere [27]. However, among the seventeen cities studied, only five (Athens, Faro, Funchal, Seville, and Tenerife) achieved optimized TSR values superior to 50%, showing that the majority of the considered cities display better overall year-round thermal behavior if hot paints (low TSR) are used.
Dias et al. [26] performed similar simulations to study the performance of cool paints (92% TSR) on residential buildings. Their results for Porto showed an overall annual energy demand upsurge of 28%, when compared to a reference coating (50% TSR), due to the winter penalty on the building heating demand. On the other hand, the results reported here for Porto show that the annual energy demand for heating and cooling, instead of increasing, decreases c.a. 11% when optimized TSR paints are applied.
Hybrid solutions with differential winter-summer behavior thus seem necessary to grasp the most of TSR properties/properties of paints. Granadeiro et al. [21] showed the performance of thermochromic paints compared to common black (5% TSR) and common white (90% TSR) paints, using the same building for energy simulations in three different climates. By comparing their results with the energy demand reported here with optimal TSR paints for Porto (52.5 kWh·m−2·y−1) and Madrid (87.7 kWh·m−2·y−1), in non-insulated buildings (BD1), it is noticeable the lower energy demand when thermochromic paints are used: 52.4 kWh·m−2·y−1 for Porto and 42.1 kWh·m−2·y−1 for Madrid. Similar differences also occur if the building is thermally insulated, less 10 kWh·m−2·y−1 and 5 kWh·m−2·y−1 are required with thermochromics, respectively in Porto and Madrid.
For climates where cold is dominant over warmth, such as Paris (optimal 5% TSR), the impact of using thermochromic paints instead of an optimized TSR coating is not that large. Wang et al. [19] depicts ca. 7% of energy savings when a thermally responsive coating is applied in Paris, which is in line with the results of this paper that, for Paris show energy savings of 7.6% and 6.3% for cases BD1 and BD2, respectively. The use of thermochromic external paints in typically cold or hot climates would likely not justify the higher investment in such technology if an optimized TSR coating could produce almost the same benefits. Therefore, the reported TSR optimization can be considered a valuable contribution to match the best external paint coating characteristics with the building environment.
It must also be pointed out that buildings displaying an external coating with a TSR value lower than 25% become very dark and can, therefore, be considered by the public opinion not aesthetic. For the cases where the optimum value is lower than 25%, simulations results including the 25% TSR value, are shown in Appendix A, (Table A1 and Table A2). To make very low TSR values compatible with the aesthetic value, the use of hot pigments is suggested [29]. The relation between the optimum TSR and the correspondent pseudo-color is merely indicative: there are numerous different colors for the same TSR value [54], and the solar reflectance also depends upon the material chosen, the presence of impurities and the surface roughness [55]. Nevertheless, the matching between the TSR values and the pseudo-colors helps to visualize the effect of increasing/decreasing the TSR in terms of lightening/darkening the external color of buildings.
For the purpose of this study, some assumptions were made to avoid unnecessary arbitrariness, and keep an overall frame sufficiently focused on clear conclusions. However, these can be interpreted, in some perspectives, as study limitations, which must be acknowledged. For example, the thermal assessment was performed based on the building’s indoor temperature variations. Analyses of the operative and indoor surface temperatures could lead to a more accurate thermal comfort assessment; COP values while differing from summer to winter, were not changed when changing climates. Although we acknowledge that seasonal averaged COP values vary with the climate, presenting different COPs for each climate would require decisions such as which specific machine and variation to be considered (since some equipment has larger variations than others). Also, the thermal insulation impact is limited for the two different cases studied: the absence of thermal insulation (BD1) and 60 mm of insulation applied to the external wall and roof (BD2). Different insulation thicknesses could hypothetically lead to different optimal envelope reflectivity values, and such dependence is reported elsewhere [42]. Finally, for future developments, physical tests would be important to validate the simulation results and understand to what extent the simplifications mentioned affect the outcomes.

4. Conclusions

This article discusses the impact of using total solar reflectance (TSR) optimized paints on residential buildings, in terms of energy savings and indoor temperatures. Residential buildings with different thermal characteristics (BD1—non-insulated building and BD2—insulated building) were considered. Two different scenarios of active comfort systems were taken into account: case A—building with an HVAC system that keeps the indoor temperature between 20 °C and 25 °C; and case B—building with no HVAC system. The dynamic thermal behavior and energy demand were simulated using the ESP-r software. The cities under study were located in different Mediterranean countries: Bragança, Porto, Coimbra, Lisbon, Évora, Beja, Faro, Lajes and Funchal, in Portugal; Madrid, Barcelona, Seville, and Tenerife, in Spain; Paris and Nice, in France; Rome, in Italy; and Athens, in Greece.
The results enabled conclusions on two main aspects: The dependence of the optimal TSR values on the location/climate and the influence of the optimized paints upon the thermal performance of the buildings.
In what regards the dependence of the optimal TSR values on the location/climate, as expected, the results show that warmer climates favor higher TSR values/light colors, while cold climates require lower TSR values/dark colors. The range of optimal TSR values identified goes from 5% (e.g., Bragança and Paris) to 90% (Tenerife).
Climates with both cold winter and hot summer require intermediate values (e.g., around 30% for Madrid). The optimal TSR values are fairly similar whether or not thermal insulation is considered, as well as whether the building is considered as being in conditioned mode (case A) or full free-floating mode (case B).
In what concerns the energy savings in conditioned mode, the benefits seem to be clearer in climates that are either predominantly warm (e.g., Tenerife) or predominantly cold (e.g., Paris), with savings going up to just over 30% in the best case. For climates that have both a cold winter and a warm summer (e.g., Madrid and Rome) the savings due to TSR optimization are smaller, often lower than 5%. A similar trend was obtained when analyzing the results in terms of indoor temperature benefits in free-floating mode. Nevertheless, these outcomes require future confirmation by physical tests in a real scenario.
Overall, while these results confirm the benefits of tailored TSR optimization, they also point towards the convenience of developing paints that can perform well both in summer as in winter modes, e.g., thermochromic paints or other concepts with similar effects.

Author Contributions

Conceptualization, A.M., J.M.; methodology, V.L. and T.S.; software, T.S.; validation, M.A., V.L. and A.M.; formal analysis, T.S. and M.A.; investigation, M.A. and T.S.; data curation, T.S.; writing—original draft preparation, T.S.; writing—review and editing, M.A. and V.L.; visualization, M.A.; supervision, A.M and V.L.; funding acquisition, J.M. All authors have read and agreed to the published version of the manuscript.

Funding

This work was financially supported by: Base Funding—UIDB/00511/2020 of the Laboratory for Process Engineering, Environment, Biotechnology and Energy—LEPABE—funded by national funds through the FCT/MCTES (PIDDAC); and by SunStorage—Harvesting and storage of solar energy, with reference POCI-01-0145-FEDER-016387, funded by European Regional Development Fund (ERDF), through COMPETE 2020—Operational Programme for Competitiveness and Internationalisation (POCI), and by national funds, through FCT—Fundação para a Ciência e a Tecnologia I.P.

Acknowledgments

The authors would also like to acknowledge the contributions of Diana Dias and Vasco Granadeiro for their collaboration and also FCT and CIN S.A. for the support of Diana Dias’s Ph.D. grant (SFRH/BDE/33548/2009) and to ARCP (http://www.arcp.pt) for the technical support.

Conflicts of Interest

The authors declare no conflict of interest.

List of Acronyms

BD1Building without thermal insulation
BD2Insulated Building
BR Bitumen Roof
COPCoefficient of performance
EEREnergy efficiency ratio
ETICSExternal Thermal Insulation Composite Systems
GHGGreen House Gases
GRGreen Roof
HVACHeating, ventilation and air conditioning
IRInfrared
PCMPhase Chasing Materials
TSRTotal Solar Reflectance

Notation and Glossary

EdemandEnergy demand to keep the indoor temperature between 20 and 25 °C
fBIndoor temperature deviation indicator for case B
TIndoor temperature (°C)
TminWeek average daily minimum indoor temperature (°C)
TmaxWeek average daily maximum indoor temperature (°C)
T M ¯ Average maximum temperature of each day of the year (°C)
T m ¯ Average minimum temperature of each day of the year (°C)
UHeat transfer coefficient (W·m−2·K−1)

Appendix A

Table A1. Cases with optimal TSR value lower than 25%: Energy demand as function of TSR in conditioned mode (case A).
CityBuildingTSRTSR ValueEdemand/MWh·y−1Edemand Reduction
MadridBD2Reference50%4.82-
Optimal5%4.673.2%
Minimum25%4.682.9%
BarcelonaBD1Reference50%7.13-
Optimal15%6.814.5%
Minimum25%6.844.1%
BD2Reference50%3.54-
Optimal10%3.423.4%
Minimum25%3.433%
ParisBD1Reference50%12.98-
Optimal5%12.007.6%
Minimum25%12.325.1%
BD2Reference50%6.54-
Optimal5%6.136.3%
Minimum25%6.274.1%
NiceBD1Reference50%7.55-
Optimal20%7.342.8%
Minimum25%7.342.8%
BD2Reference50%3.70-
Optimal20%3.631.7%
Minimum25%3.631.7%
RomeBD1Reference50%7.58-
Optimal20%7.392.4%
Minimum25%7.402.4%
BD2Reference50%3.71-
Optimal15%3.632.1%
Minimum25%3.642%
BragançaBD1Reference50%10.29-
Optimal5%9.339.3%
Minimum25%9.577.0%
BD2Reference50%5.18-
Optimal5%4.748.6%
Minimum25%4.875.9%
PortoBD1Reference50%6.23-
Optimal5%5.5111.6%
Minimum25%5.639.6%
BD2Reference50%3.03-
Optimal5%2.7110.4%
Minimum25%2.788.1%
CoimbraBD2Reference50%2.77-
Optimal20%2.625.6%
Minimum25%2.625.5%
LajesBD1Reference50%3.29-
Optimal20%3.086.2%
Minimum25%3.086.2%
Table A2. Cases with optimal TSR value lower than 25%: Indoor temperature indicators as function of TSR values in free-floating mode (case B).
CityBuildingTSRTSR ValueTmin/°CTmax/°CfBfB Reduction
BarcelonaBD2Reference50%5.628.422561-
Optimal10%6.431.1206998.3%
Minimum25%6.130210106.9%
ParisBD1Reference50%−328.771881-
Optimal5%−2.533.3669826.8%
Minimum25%−2.731.1685664.6%
BD2Reference50%−0.727.364454-
Optimal5%−0.228.9599467.0%
Minimum25%−0.428.1617254.2%
NiceBD2Reference50%7.128.723933-
Optimal15%7.831.6224876%
Minimum25%7.630.7226215.5%
RomeBD2Reference50%6.328.724338-
Optimal5%731.4219879.7%
Minimum25%6.729.9225477.4%
BragançaBD1Reference50%−0.432.653 678-
Optimal20%0.336.649 8127.2%
Minimum25%0.235.849 9916.9%
BD2Reference50%1.829.946 619-
Optimal5%2.831.941 32711.4%
Minimum25%2.330.943 1577.4%
PortoBD2Reference50%7.628.320539-
Optimal5%8.829.91835410.6%
Minimum25%8.329.2189167.9%
CoimbraBD2Reference50%7.128.918195-
Optimal5%8.231.2166108.7%
Minimum25%7.730.1168697.3%
ÉvoraBD2Reference50%7.730.419565-
Optimal20%8.231.6185835%
Minimum25%8.231.4186204.8%
LajesBD2Reference50%12.227.37665-
Optimal5%12.628.7671212.4%
Minimum25%12.42869409.5%

References

  1. VijayaVenkataRaman, S.; Iniyan, S.; Goic, R. A review of climate change, mitigation and adaptation. Renew. Sustain. Energy Rev. 2012, 16, 878–897. [Google Scholar] [CrossRef]
  2. Luber, G.; McGeehin, M. Climate Change and Extreme Heat Events. Am. J. Prev. Med. 2008, 35, 429–435. [Google Scholar] [CrossRef] [PubMed]
  3. Stoffel, M.; Tiranti, D.; Huggel, C. Climate change impacts on mass movements—Case studies from the European Alps. Sci. Total Environ. 2014, 493, 1255–1266. [Google Scholar] [CrossRef] [PubMed]
  4. De Lima, M.I.P.; Santo, F.E.; Ramos, A.M.; de Lima, J.L.M.P. Recent changes in daily precipitation and surface air temperature extremes in mainland Portugal, in the period 1941–2007. Atmos. Res. 2013, 127, 195–209. [Google Scholar] [CrossRef]
  5. Ruiz-Medina, M.D.; Espejo, R.M. Integration of spatial functional interaction in the extrapolation of ocean surface temperature anomalies due to global warming. Int. J. Appl. Earth Obs. Geoinf. 2013, 22, 27–39. [Google Scholar] [CrossRef]
  6. Climate Action-Climate Change Consequences. Available online: http://ec.europa.eu/clima/change/consequences/index_en.htm (accessed on 15 December 2019).
  7. Figueiredo, R.; Nunes, P.; Panão, M.J.N.O.; Brito, M.C. Country residential building stock electricity demand in future climate–Portuguese case study. Energy Build. 2019, 209, 109694. [Google Scholar] [CrossRef]
  8. Energy Statistics-An Overview. Available online: https://ec.europa.eu/eurostat/statistics-explained/index.php?title=Energy_statistics_-_an_overview#Final_energy_consumption (accessed on 18 December 2019).
  9. Bynum, R.T. Insulation Handbook; Chapter 1-A Brief History of Thermal Insulation; McGraw-Hill: New York, NY, USA, 2001; p. 532. [Google Scholar]
  10. Constable, G.; Somerville, B. A Century of Innovation: Twenty Engineering Achievements that Transformed Our Lives; Chapter-Air Conditioning and Refrigeration; Joseph Henry Press: Washington, DC, USA, 2003; p. 248. [Google Scholar]
  11. Muhieldeen, M.W.; Adam, N.M.; Salman, B.H. Experimental and numerical studies of reducing cooling load of lecture hall. Energy Build. 2015, 89, 163–169. [Google Scholar] [CrossRef]
  12. Cabeza, L.F.; Castell, A.; Medrano, M.; Martorell, I.; Pérez, G.; Fernández, I. Experimental study on the performance of insulation materials in Mediterranean construction. Energy Build. 2010, 42, 630–636. [Google Scholar] [CrossRef]
  13. Aktacir, M.A.; Büyükalaca, O.; Yılmaz, T. A case study for influence of building thermal insulation on cooling load and air-conditioning system in the hot and humid regions. Appl. Energy 2010, 87, 599–607. [Google Scholar] [CrossRef]
  14. Guillén, I.; Gómez-Lozano, V.; Fran, J.M.; López-Jiménez, P.A. Thermal behavior analysis of different multilayer façade: Numerical model versus experimental prototype. Energy Build. 2014, 79, 184–190. [Google Scholar] [CrossRef]
  15. Kolaitis, D.I.; Malliotakis, E.; Kontogeorgos, D.A.; Mandilaras, I.; Katsourinis, D.I.; Founti, M.A. Comparative assessment of internal and external thermal insulation systems for energy efficient retrofitting of residential buildings. Energy Build. 2013, 64, 123–131. [Google Scholar] [CrossRef]
  16. Marinosci, C.; Strachan, P.A.; Semprini, G.; Morini, G.L. Empirical validation and modelling of a naturally ventilated rainscreen façade building. Energy Build. 2011, 43, 853–863. [Google Scholar] [CrossRef]
  17. De Gracia, A.; Cabeza, L.F. Phase change materials and thermal energy storage for buildings. Energy Build. 2015, 103, 414–419. [Google Scholar] [CrossRef] [Green Version]
  18. Pisello, A.L.; Piselli, C.; Cotana, F. Thermal-physics and energy performance of an innovative green roof system: The Cool-Green Roof. Sol. Energy 2015, 116, 337–356. [Google Scholar] [CrossRef]
  19. Wang, C.; Zhu, Y.; Guo, X. Thermally responsive coating on building heating and cooling energy efficiency and indoor comfort improvement. Appl. Energy 2019, 253, 113506. [Google Scholar] [CrossRef]
  20. Li, H. Chapter 2-Literature Review on Cool Pavement Research. In Pavement Materials for Heat Island Mitigation; Li, H., Ed.; Butterworth-Heinemann: Boston, MA, USA, 2016; pp. 15–42. [Google Scholar] [CrossRef]
  21. Granadeiro, V.; Almeida, M.; Souto, T.; Leal, V.; Machado, J.; Mendes, A. Thermochromic Paints on External Surfaces: Impact Assessment for a Residential Building through Thermal and Energy Simulation. Energies 2020, 13, 1912. [Google Scholar] [CrossRef] [Green Version]
  22. Wu, Y.; Krishnan, P.; Zhang, M.-H.; Yu, L.E. Using photocatalytic coating to maintain solar reflectance and lower cooling energy consumption of buildings. Energy Build. 2018, 164, 176–186. [Google Scholar] [CrossRef]
  23. Azarnejad, A.; Mahdavi, A. Building Façades’ Visual Reflectance and Surface Temperatures: A Field Study. Energy Procedia 2015, 78, 1720–1725. [Google Scholar] [CrossRef] [Green Version]
  24. Moghtadernejad, S.; Chouinard, L.E.; Mirza, M.S. Design strategies using multi-criteria decision-making tools to enhance the performance of building façades. J. Build. Eng. 2020, 30, 101274. [Google Scholar] [CrossRef]
  25. Upstone, S. Measurement of Total Solar Reflectance of Paint Panels using PerkinElmer UV/Vis/NIR Spectrophotometers and UV WinLab Software. PerkinelmerInc. 2019, 3, 1–2. [Google Scholar]
  26. Dias, D.; Machado, J.; Leal, V.; Mendes, A. Impact of using cool paints on energy demand and thermal comfort of a residential building. Appl. Therm. Eng. 2014, 65, 273–281. [Google Scholar] [CrossRef] [Green Version]
  27. Becherini, F.; Lucchi, E.; Gandini, A.; Barrasa, M.C.; Troi, A.; Roberti, F.; Sachini, M.; Di Tuccio, M.C.; Arrieta, L.G.; Pockelé, L.; et al. Characterization and thermal performance evaluation of infrared reflective coatings compatible with historic buildings. Build. Environ. 2018, 134, 35–46. [Google Scholar] [CrossRef]
  28. Pigment Database. Available online: http://coolcolors.lbl.gov/LBNL-Pigment-Database/database.html (accessed on 20 December 2019).
  29. Levinson, R.; Berdahl, P.; Akbari, H. Solar spectral optical properties of pigments—Part II: Survey of common colorants. Sol. Energy Mater. Sol. Cells 2005, 89, 351–389. [Google Scholar] [CrossRef]
  30. Levinson, R.; Berdahl, P.; Akbari, H.; Miller, W.; Joedicke, I.; Reilly, J.; Suzuki, Y.; Vondran, M. Methods of creating solar-reflective nonwhite surfaces and their application to residential roofing materials. Sol. Energy Mater. Sol. Cells 2007, 91, 304–314. [Google Scholar] [CrossRef]
  31. Akbari, H. Measured energy savings from the application of reflective roofs in two small non-residential buildings. Energy 2003, 28, 953–967. [Google Scholar] [CrossRef] [Green Version]
  32. Akbari, H.; Levinson, R.; Rainer, L. Monitoring the energy-use effects of cool roofs on California commercial buildings. Energy Build. 2005, 37, 1007–1016. [Google Scholar] [CrossRef] [Green Version]
  33. Levinson, R.; Akbari, H.; Reilly, J.C. Cooler tile-roofed buildings with near-infrared-reflective non-white coatings. Build. Environ. 2007, 42, 2591–2605. [Google Scholar] [CrossRef]
  34. Akbari, H.; Pomerantz, M.; Taha, H. Cool surfaces and shade trees to reduce energy use and improve air quality in urban areas. Sol. Energy 2001, 70, 295–310. [Google Scholar] [CrossRef]
  35. Berdahl, P.; Akbari, H.; Levinson, R.; Jacobs, J.; Klink, F.; Everman, R. Three-year weathering tests on asphalt shingles: Solar reflectance. Sol. Energy Mater. Sol. Cells 2012, 99, 277–281. [Google Scholar] [CrossRef]
  36. Levinson, R.; Berdahl, P.; Berhe, A.A.; Akbari, H. Effects of soiling and cleaning on the reflectance and solar heat gain of a light-colored roofing membrane. Atmos. Environ. 2005, 39, 7807–7824. [Google Scholar] [CrossRef]
  37. Monitoring the Energy-Use Effects of Cool Roofs on California Commercial Buildings. Available online: http://escholarship.org/uc/item/5j49q2kg#page-2 (accessed on 15 January 2019).
  38. Yuxuan, Z.; Yunyun, Z.; Jianrong, Y.; Xiaoqiang, Z. Energy saving performance of thermochromic coatings with different colors for buildings. Energy Build. 2020, 215, 109920. [Google Scholar] [CrossRef]
  39. Karlessi, T.; Santamouris, M.; Apostolakis, K.; Synnefa, A.; Livada, I. Development and testing of thermochromic coatings for buildings and urban structures. Sol. Energy 2009, 83, 538–551. [Google Scholar] [CrossRef]
  40. Santamouris, M.; Synnefa, A.; Karlessi, T. Using advanced cool materials in the urban built environment to mitigate heat islands and improve thermal comfort conditions. Sol. Energy 2011, 85, 3085–3102. [Google Scholar] [CrossRef]
  41. Shi, X.; Abel, T.; Wang, L. Influence of two motion types on solar transmittance and daylight performance of dynamic façades. Sol. Energy 2020, 201, 561–580. [Google Scholar] [CrossRef]
  42. Yuan, J.; Farnham, C.; Emura, K.; Alam, M.A. Proposal for optimum combination of reflectivity and insulation thickness of building exterior walls for annual thermal load in Japan. Build. Environ. 2016, 103, 228–237. [Google Scholar] [CrossRef]
  43. Piselli, C.; Saffari, M.; de Gracia, A.; Pisello, A.L.; Cotana, F.; Cabeza, L.F. Optimization of roof solar reflectance under different climate conditions, occupancy, building configuration and energy systems. Energy Build. 2017, 151, 81–97. [Google Scholar] [CrossRef]
  44. ESRU-Energy Systems Research Unit. Available online: http://www.esru.strath.ac.uk//Programs//ESP-r.htm (accessed on 8 January 2020).
  45. Clarke, J.A. Energy Simulation in Building Design, 2nd ed.; Clarke, J.A., Ed.; Butterworth-Heinemann: Oxford, UK, 2001; pp. 64–98. [Google Scholar] [CrossRef]
  46. Castell, A.; Solé, C. 11-Design of latent heat storage systems using phase change materials (PCMs). In Advances in Thermal Energy Storage Systems; Cabeza, L.F., Ed.; Woodhead Publishing: Cambridge, UK, 2015; pp. 285–305. [Google Scholar] [CrossRef]
  47. Strachan, P. ESP-r: Summary of validation studies. In Energy Systems Research Unit; University of Strathclyde: Scotland, UK, 2000. [Google Scholar]
  48. Leal, V.; Maldonado, E. The role of the PASLINK test cell in the modelling and integrated simulation of an innovative window. Build. Environ. 2008, 43, 217–227. [Google Scholar] [CrossRef]
  49. Strachan, P.A.; Kokogiannakis, G.; Macdonald, I.A. History and development of validation with the ESP-r simulation program. Build. Environ. 2008, 43, 601–609. [Google Scholar] [CrossRef] [Green Version]
  50. Santos, C.A.P.; Matias, L. Coeficiente de Transmissão Térmica de Elementos da Envolvente dos Edifícios-Verão Actualizada 2006; Laboratório Nacional de Engenharia Civil: Lisbon, Portugal, 2006. [Google Scholar]
  51. Weather Atlas. Available online: https://www.weather-atlas.com/ (accessed on 16 February 2020).
  52. Decree-Law No 80/2006 of April 4-Regulation on Thermal Insulation in Buildings (Regulamento das Características de Comportamento Térmico dos Edifícios). In Official Gazette (Diário da República-I Série-A); Ministry of Public Works Transport and Communications: Lisbon, Portugal, 2006.
  53. EnergyPlus Energy Simulation Software-Weather Data. Available online: http://apps1.eere.energy.gov/buildings/energyplus/cfm/weather_data3.cfm/region=6_europe_wmo_region_6/country=PRT/cname=Portugal (accessed on 10 December 2019).
  54. Light Reflectance Values. Available online: https://www.resene.co.nz/swatches/reflectance.htm (accessed on 18 February 2020).
  55. Berdahl, P.; Bretz, S.E. Preliminary survey of the solar reflectance of cool roofing materials. Energy Build. 1997, 25, 149–158. [Google Scholar] [CrossRef] [Green Version]
Figure 1. Plans of the residential building: (a) ground floor and (b) first floor, and (c) building sections.
Energies 13 02729 g001
Figure 2. Average minimum and maximum outdoor air temperature during the coldest and hottest months, for all the cities under study, according to [51].
Energies 13 02729 g002
Figure 3. Daily sunshine hours during the coldest and warmest months, and rainfall during the wettest and driest months, for all the cities under study, according to [51].
Energies 13 02729 g003
Figure 4. Optimized total solar reflectance (TSR) and pseudo-color, for regions of the Mediterranean cities under study, in case A (with heating, ventilation, and air-conditioning (HVAC) system) and type BD1 (without insulation).
Energies 13 02729 g004
Figure 5. Optimized TSR and pseudo-color, for regions of the Mediterranean cities under study, in case A (with HVAC system) and type BD2 (with insulation).
Energies 13 02729 g005
Figure 6. Optimized TSR and pseudo-color, for regions of the Mediterranean cities under study, in case B (without air conditioning) and type BD1 (without insulation).
Energies 13 02729 g006
Figure 7. Optimized TSR and pseudo-color, for regions of the Mediterranean cities under study, in case B (without air conditioning) and type BD2 (with insulation).
Energies 13 02729 g007
Table 1. Construction details of the building with a single wall façade (BD1).
ConstructionLayerThickness/mmU/W·m−2·K−1
External wallCoating0.21.3
Plaster30
Brick190
Plaster10
Internal wallPlaster102.1
Brick110
Plaster10
Ground floorCommon earth3000.7
Gravel300
Concrete300
Asphalt10
Concrete20
Wood floor20
WindowClear glass85.6
SlabPlaster102.0
Concrete240
Plaster10
Roof slabClay tile51.6
Air3
Plaster5
Brick110
Plaster5
Table 2. Construction details of BD2—in bold the differences from BD1.
ConstructionLayerThickness /mmU/W·m−2·K−1
External wallCoating0.20.5
Plaster30
Insulation60
Brick190
Plaster10
Roof slabClay tile50.5
Air3
Plaster5
Insulation60
Brick110
Plaster5
Table 3. Energy demand in case A (conditioned mode) and Indoor temperature indicators for case B (free-floating), as function of the Optimized TSR values for several Mediterranean cities.
Case ACase B
CityBuildingTSRTSR ValueEdemand/kWh·m−2·y−1Edemand ReductionTSR ValueTmin/°CTmax/°CfBfB Reduction
MadridBD1Reference50%90.783.3%50%1.237.148,4621.4%
Optimal25%87.7435%1.53947,783
BD2Reference50%45.903.2%50%2.632.139,7905.4%
Optimal5%44.4525%3.234.237,634
BarcelonaBD1Reference50%67.904.5%50%4.631.827,4472.8%
Optimal15%64.8530%533.726,668
BD2Reference50%33.683.4%50%5.628.422,5618.3%
Optimal10%32.5210%6.431.120,699
SevilleBD1Reference50%59.610.7%50%4.938.925,5996.7%
Optimal60%59.2270%4.536.423,883
BD2Reference50%29.131.0%50%7.133.715,7080.2%
Optimal65%28.8455%733.315,670
TenerifeBD1Reference50%18.0122.4%50%14.833.4873341.5%
Optimal85%13.9790%14.3315107
BD2Reference50%11.0932.2%50%15.429.9469728.5%
Optimal90%7.5190%14.928.53358
ParisBD1Reference50%123.667.6%50%−328.771,8816.8%
Optimal5%114.295%−2.533.366,982
BD2Reference50%62.306.3%50%−0.727.364,4547%
Optimal5%58.365%−0.228.959,946
NiceBD1Reference50%71.902.8%50%6.132.328,6631.7%
Optimal20%69.9035%6.533.928,189
BD2Reference50%35.191.7%50%7.128.723,9336.0%
Optimal20%34.5915%7.831.622,487
RomeBD1Reference50%72.142.4%50%4.732.130,3924.4%
Optimal20%70.4125%5.234.629,065
BD2Reference50%35.342.1%50%6.328.724,3389.7%
Optimal15%34.605%731.421,987
AthensBD1Reference50%69.040.1%50%6.436.827,2200.3%
Optimal55%68.9455%6.336.427,144
BD2Reference50%34.040.3%50%7.732.818,8900.4%
Optimal60%33.9245%7.83318,817
Table 4. Energy demand, in case A (conditioned mode), and indoor temperature indicators for case B (free-floating), as function of the Optimized TSR values for several Portuguese Cities.
Case ACase B
CityBuildingTSRTSR ValueEdemand/kWh·m−2·y−1Edemand ReductionTSR ValueTmin/°CTmax /°CfBfB Reduction
BragançaBD1Reference50%98.019.3%50%−0.432.653,6787.2%
Optimal5%88.8620%0.336.649,812
BD2Reference50%49.348.6%50%1.829.946,61911.4%
Optimal5%45.105%2.831.941,327
PortoBD1Reference50%59.3111.6%50%6.229.624,3046.4%
Optimal5%52.4525%7.032.522,743
BD2Reference50%28.8110.4%50%7.628.320,53910.6%
Optimal5%25.825%8.829.918,354
CoimbraBD1Reference50%54.075.3%50%5.932.422,2652.6%
Optimal25%51.2135%6.333.821,676
BD2Reference50%26.425.6%50%7.128.918,1958.7%
Optimal20%24.935%8.231.216,610
LisbonBD1Reference50%52.502.7%50%8.032.120,3371.4%
Optimal30%51.0740%8.232.620,051
BD2Reference50%24.941.8%50%8.830.716,4052.8%
Optimal30%24.4925%9.131.715,942
ÉvoraBD1Reference50%63.023.2%50%6.733.824,6761.1%
Optimal25%60.9940%6.934.624,401
BD2Reference50%30.081.9%50%7.730.419,5655.0%
Optimal25%29.5020%8.231.618,583
BejaBD1Reference50%63.400.6%50%7.836.326,2820.1%
Optimal40%63.0545%7.936.826,262
BD2Reference50%30.820.2%50%8.532.320,2511.0%
Optimal40%30.7435%8.833.120,042
FaroBD1Reference50%47.30
47.30
-50%9.234.418,5080.2%
Optimal50%55%9.23418,477
BD2Reference50%22.500.2%50%10.23113,670≈0%
Optimal40%22.4645%10.331.213,668
LajesBD1Reference50%31.316.2%50%10.828.998825.3%
Optimal20%29.3630%11.130.39361
BD2Reference50%14.943.4%50%12.227.3766512.4%
Optimal25%14.445%12.628.76712
FunchalBD1Reference50%29.570.5%50%11.331.511,1860.5%
Optimal45%29.4255%11.230.811,129
BD2Reference50%13.730.1%50%12.430.287921.1%
Optimal45%13.7140%12.630.78695
Table 5. Summary of Optimal TSR values achieved for each scenario studied, colored with an example of suitable paint color.
City/ClimateBD1BD2
Without Thermal InsulationWith Thermal Insulation
Case ACase BCase ACase B
Madrid25%35%5%25%
Barcelona15%30%10%10%
Seville60%70%65%55%
Tenerife85%90%90%90%
Paris5%5%5%5%
Nice20%35%20%15%
Rome20%25%15%5%
Athens55%55%60%45%
Bragança5%20%5%5%
Porto5%25%5%5%
Coimbra25%35%20%5%
Lisbon30%40%30%25%
Évora25%40%25%20%
Beja40%45%40%35%
Faro50%55%55%45%
Lajes20%30%25%5%
Funchal45%55%45%40%

