Improvement of Extracted Power of Pole Mounted Solar Panels by Effective Cooling Using Aluminum Heat Sink under Hot Weather and Variable Wind Speed Conditions

 , and
, and
Abstract
:
1. Introduction
2. An Overview on Solar Panels
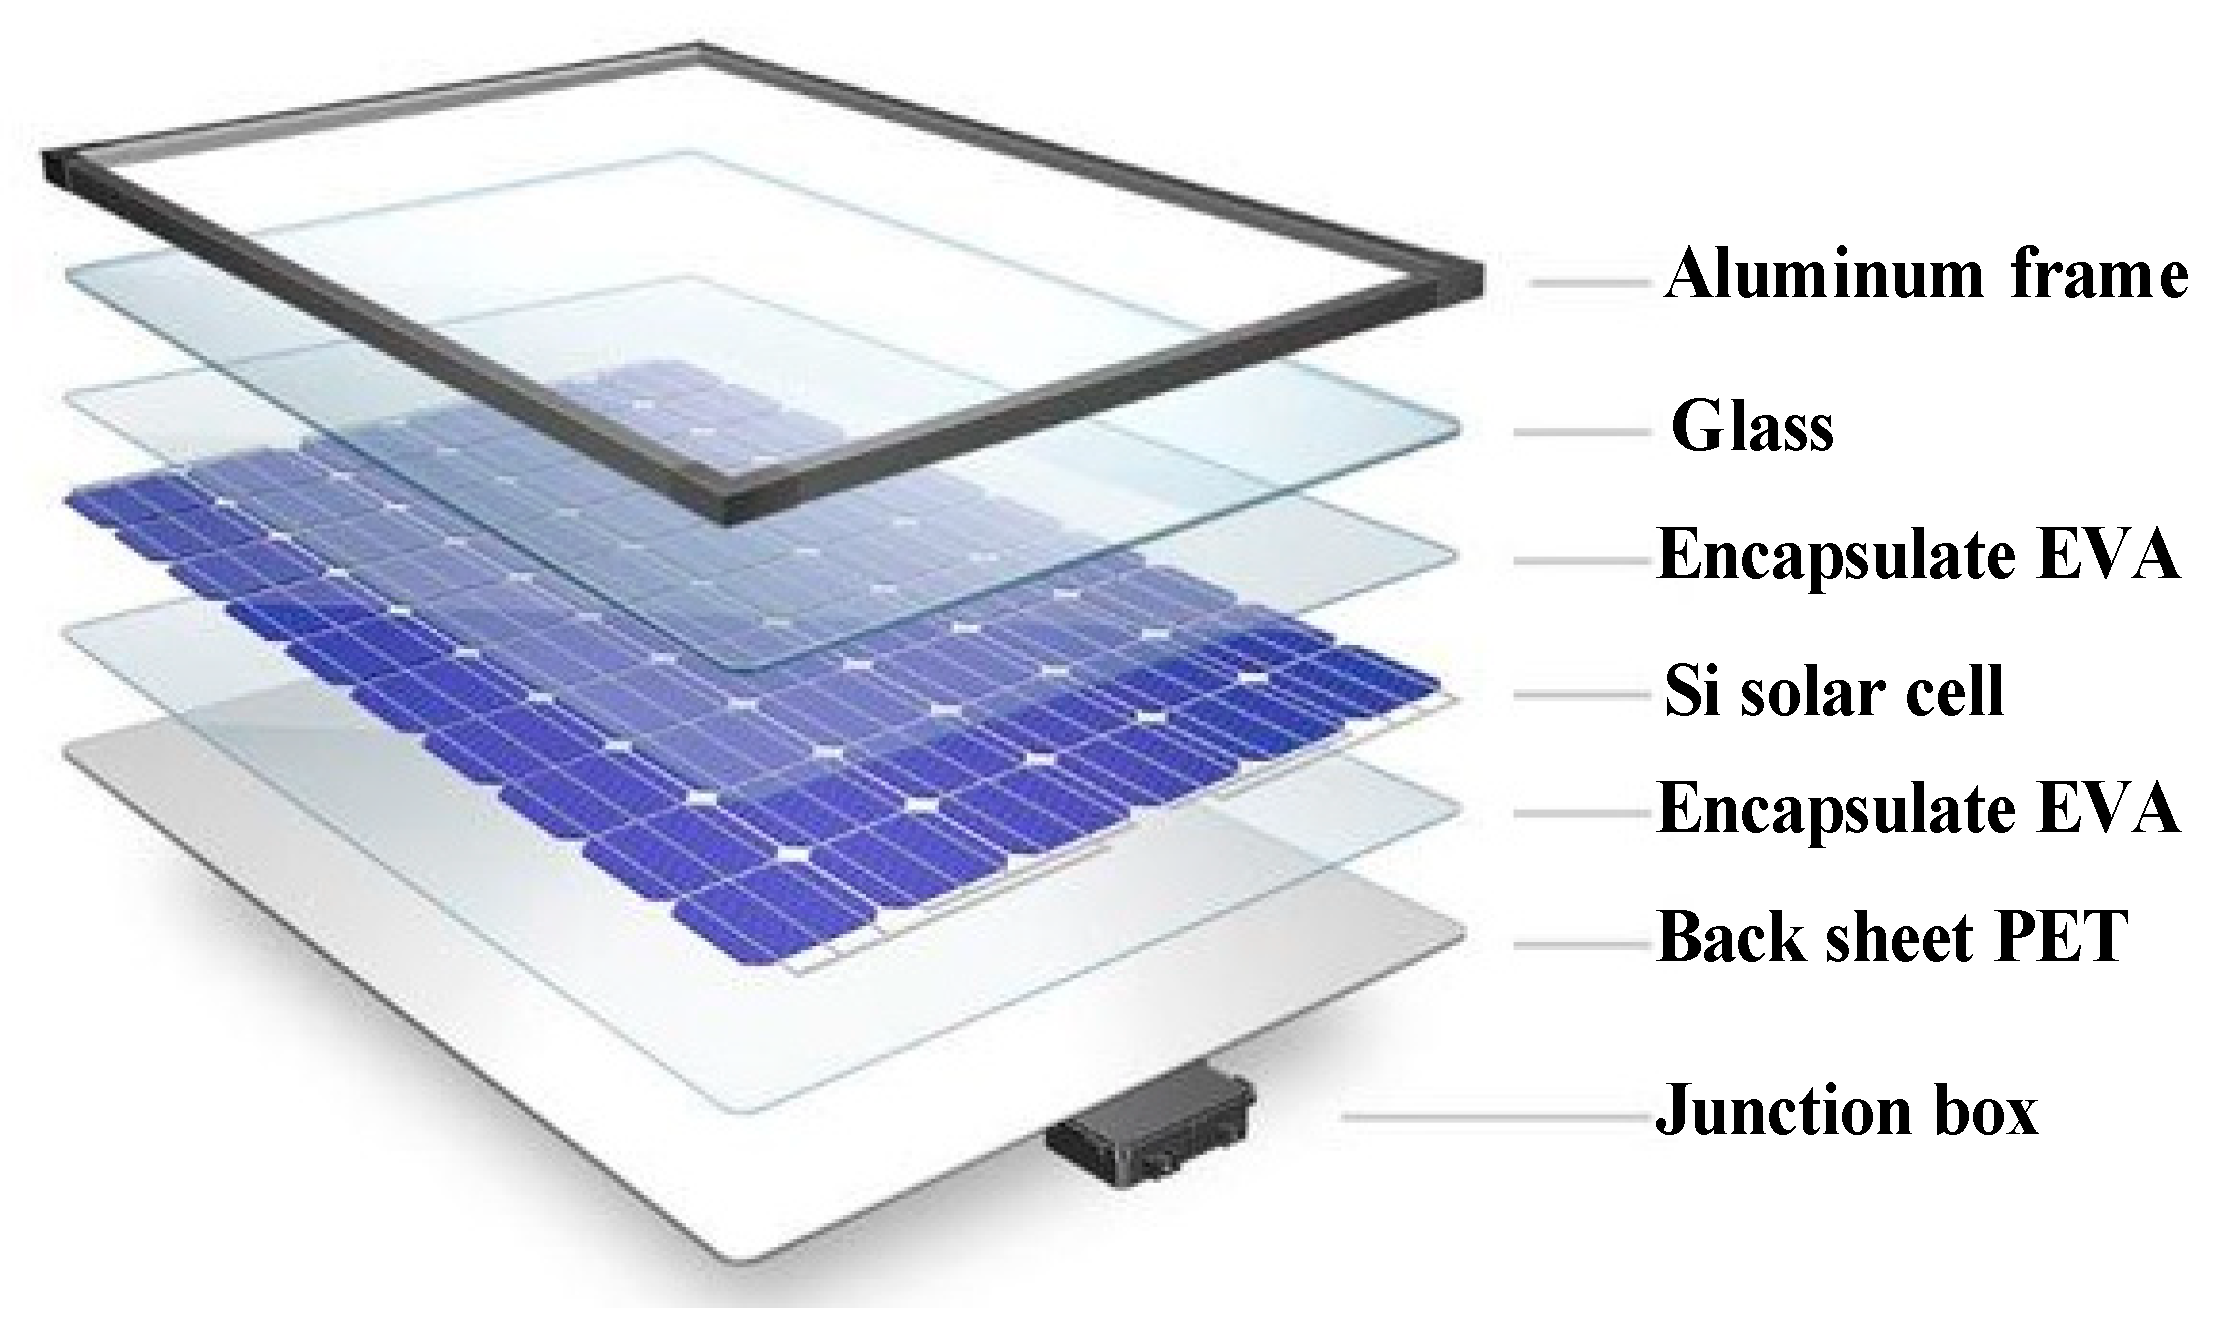
2.1. Solar Panel Structure
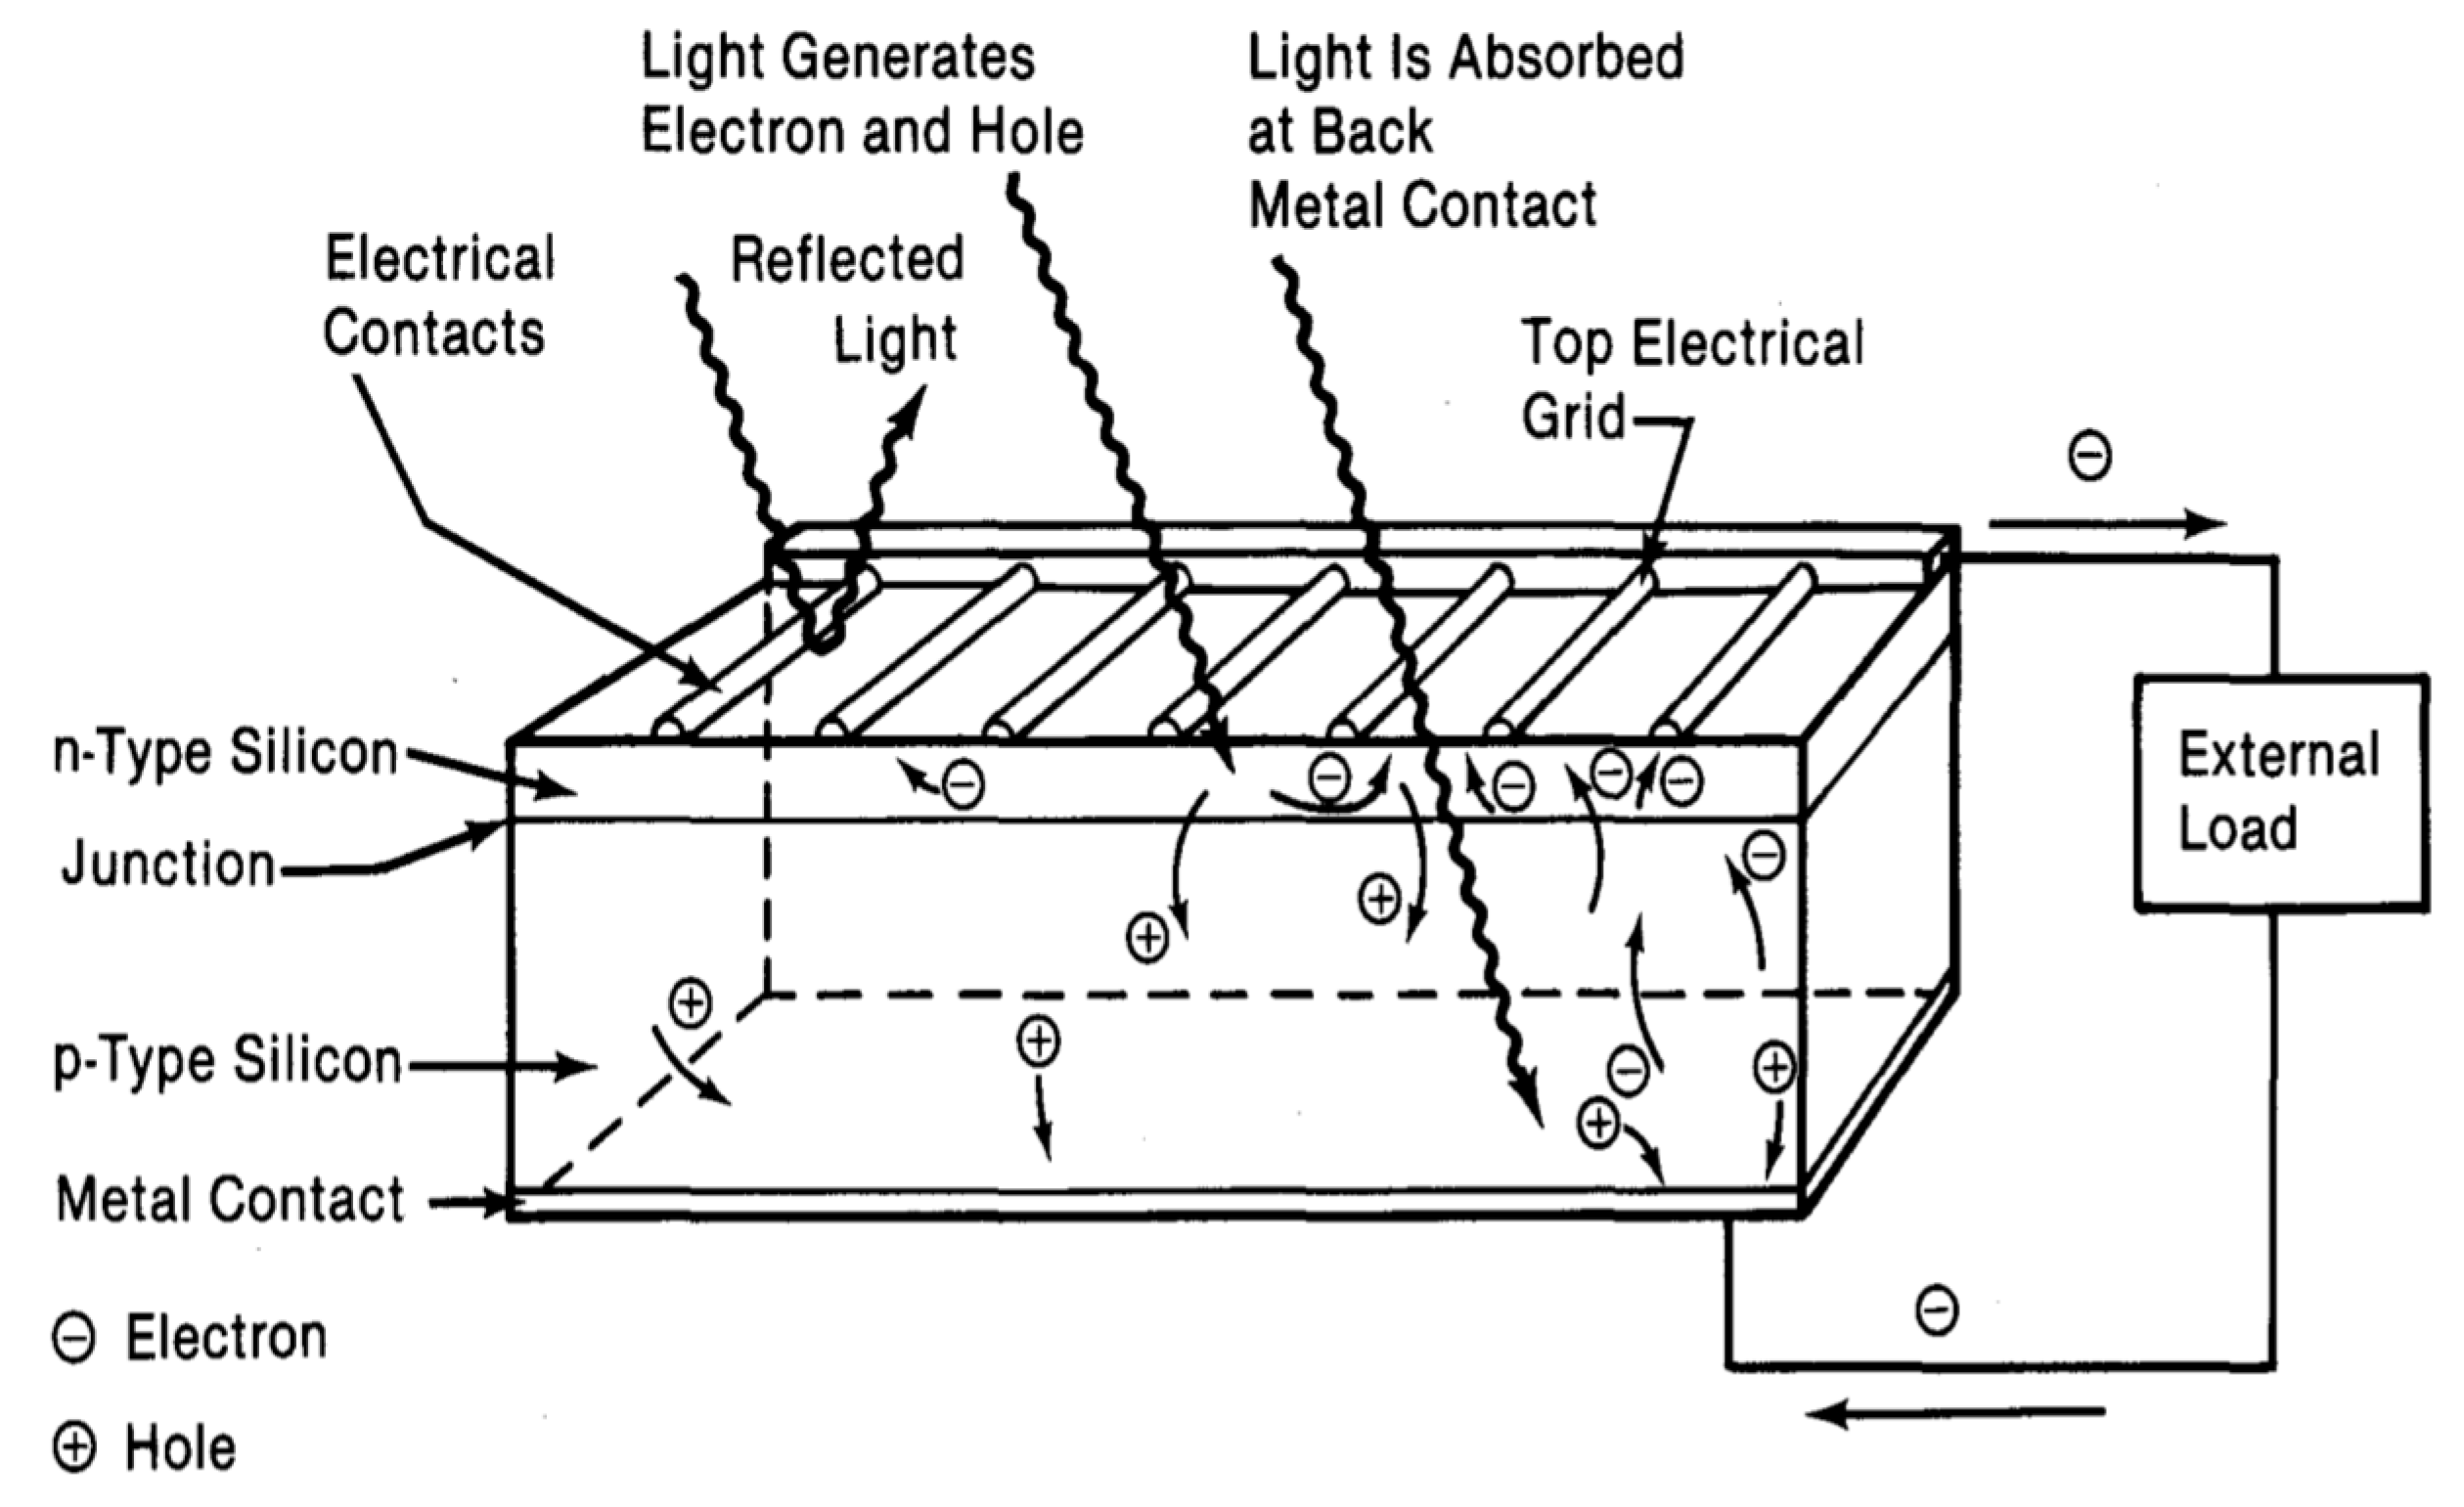
2.2. Solar Cell Principle of Operation
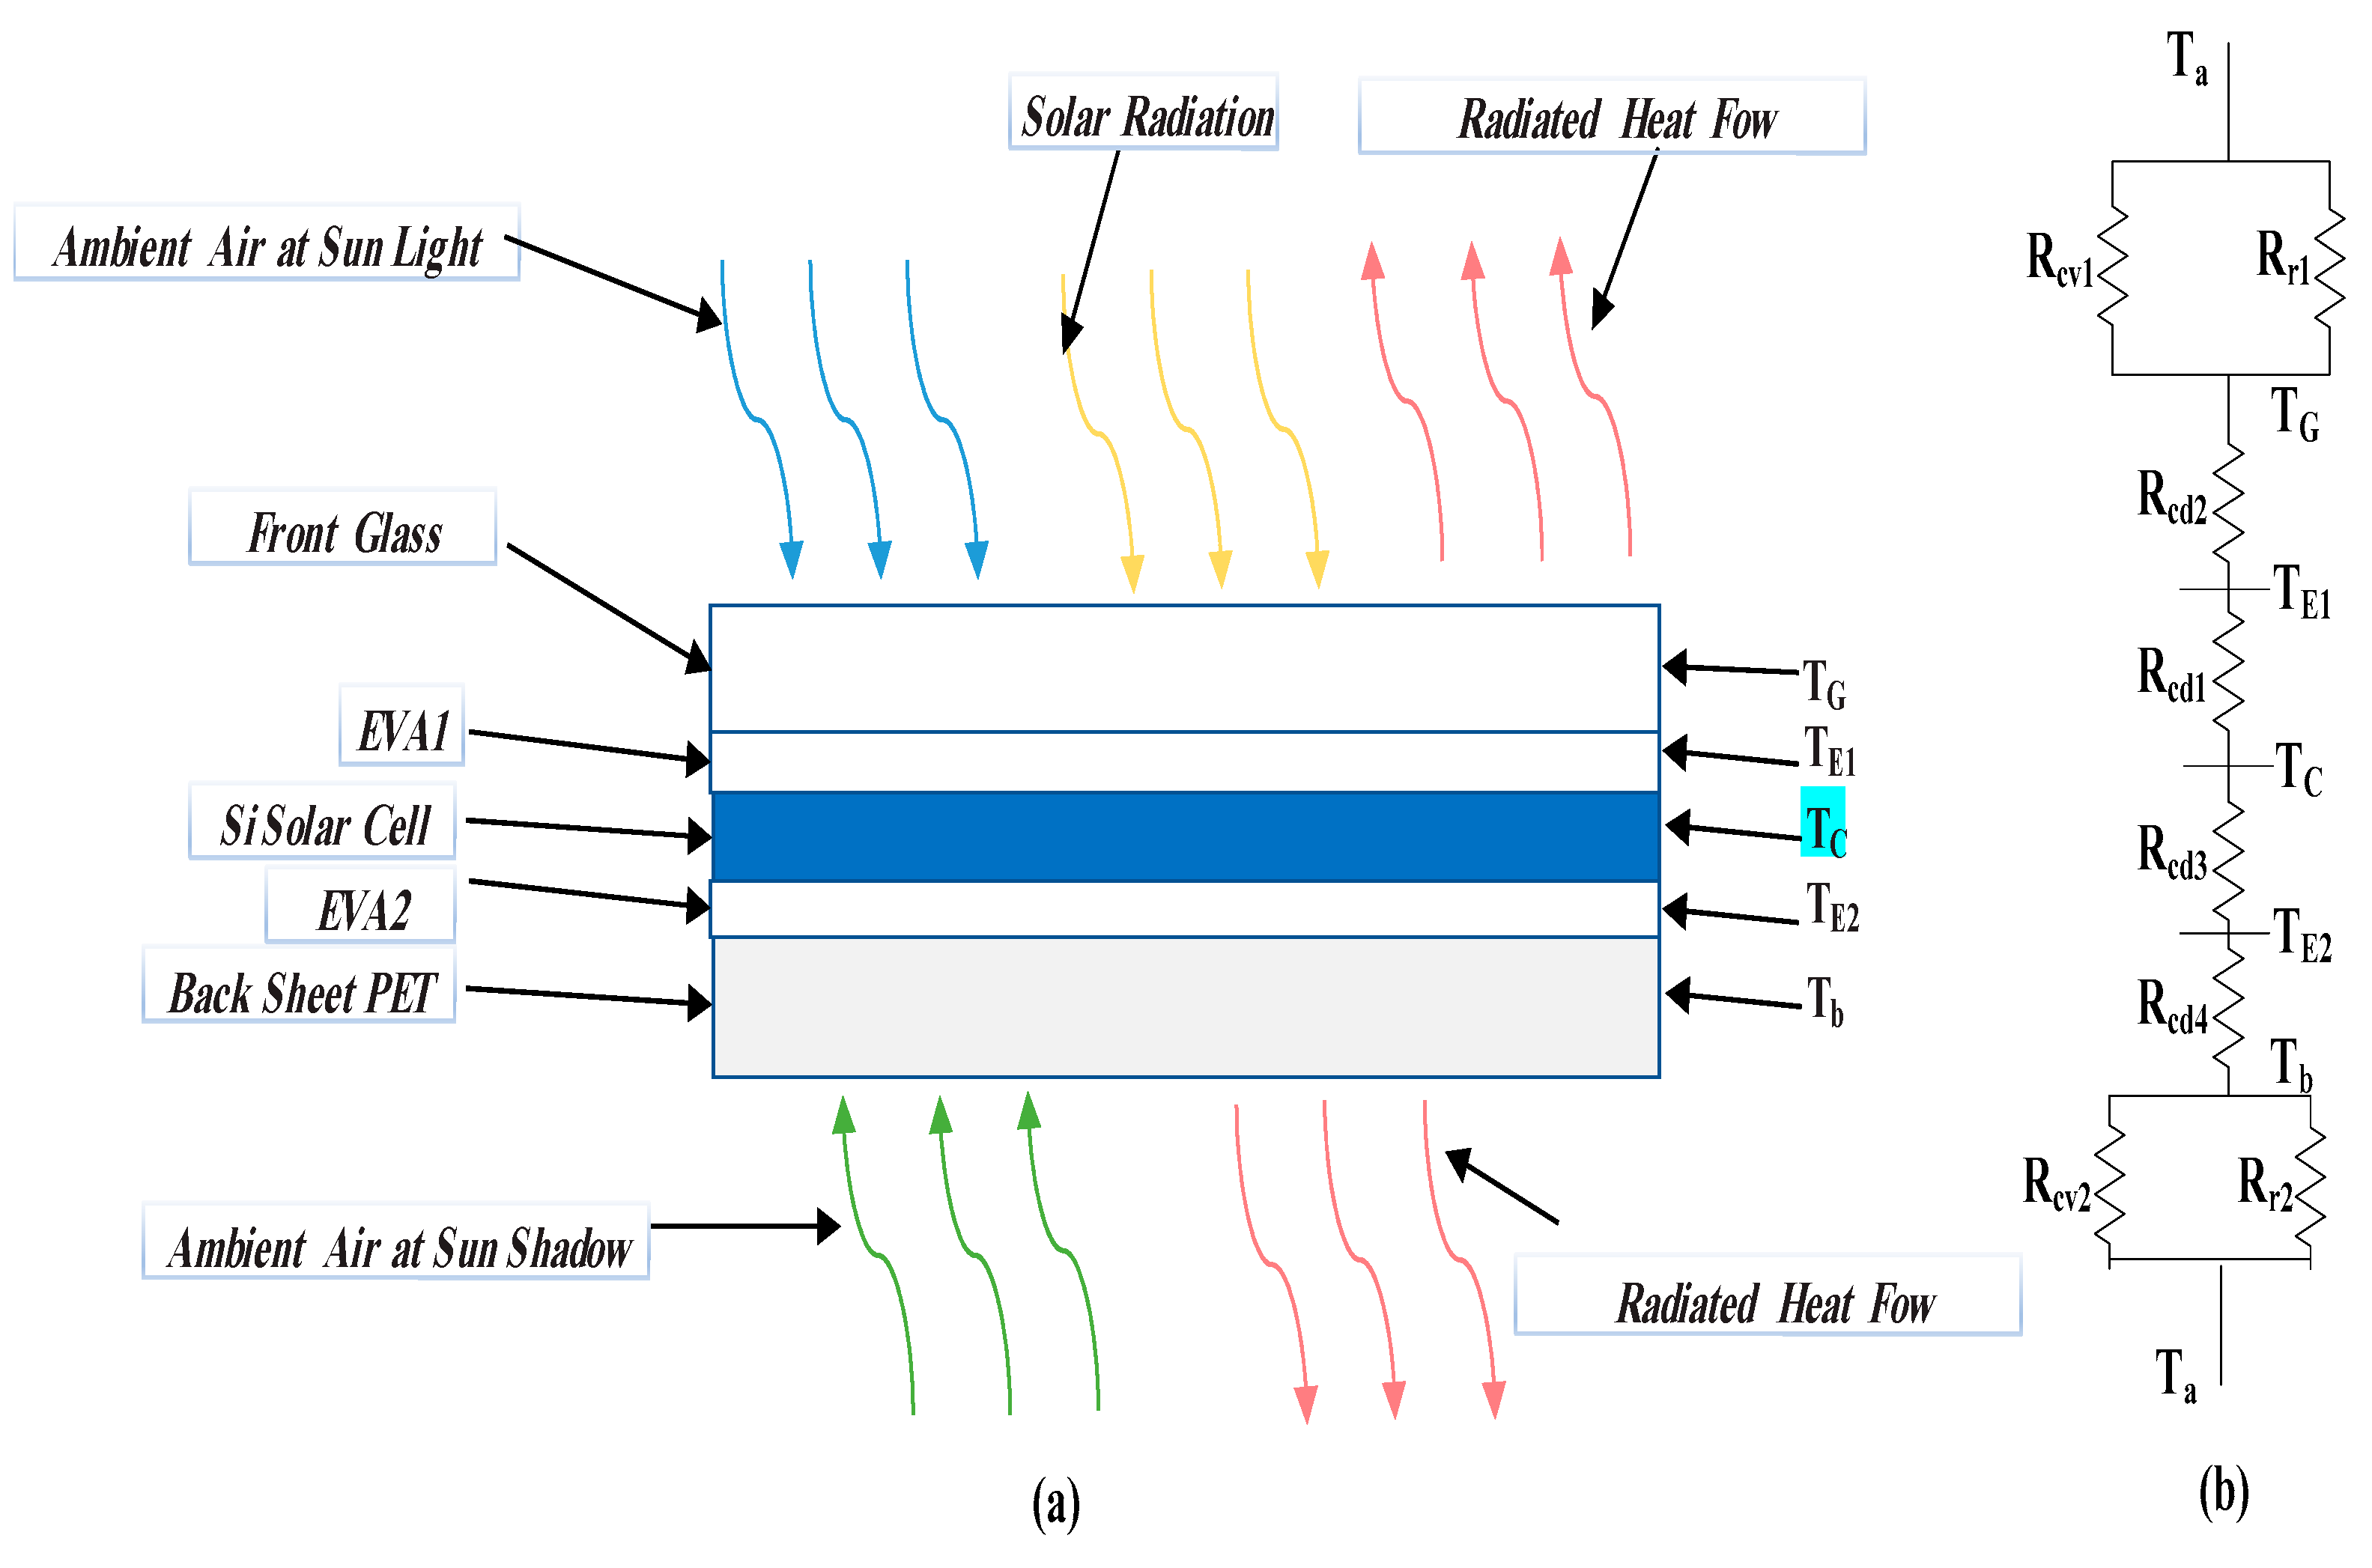
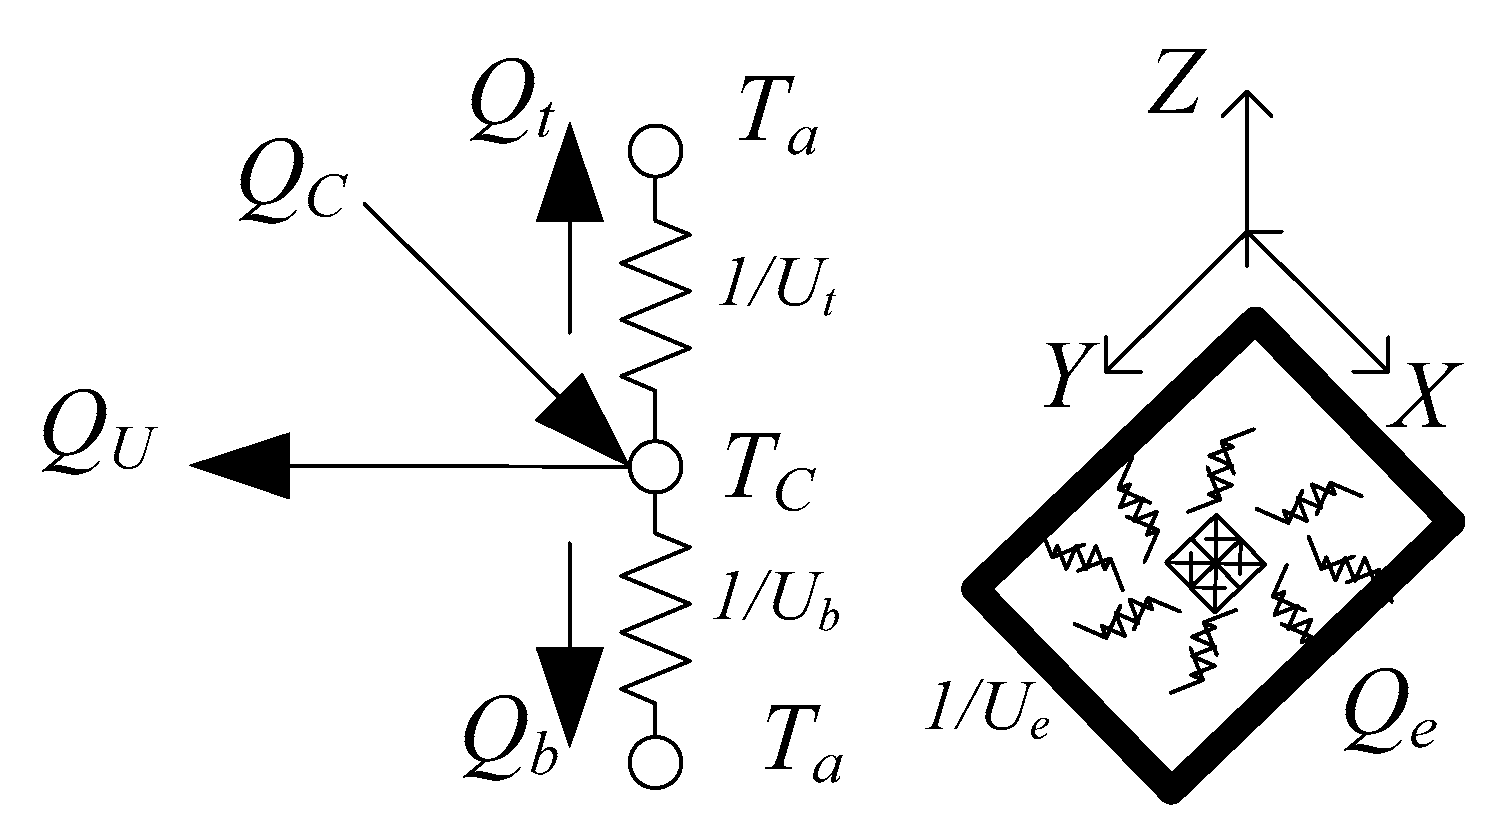
3. Solar Cell Energy Transmitted Mathematical Model
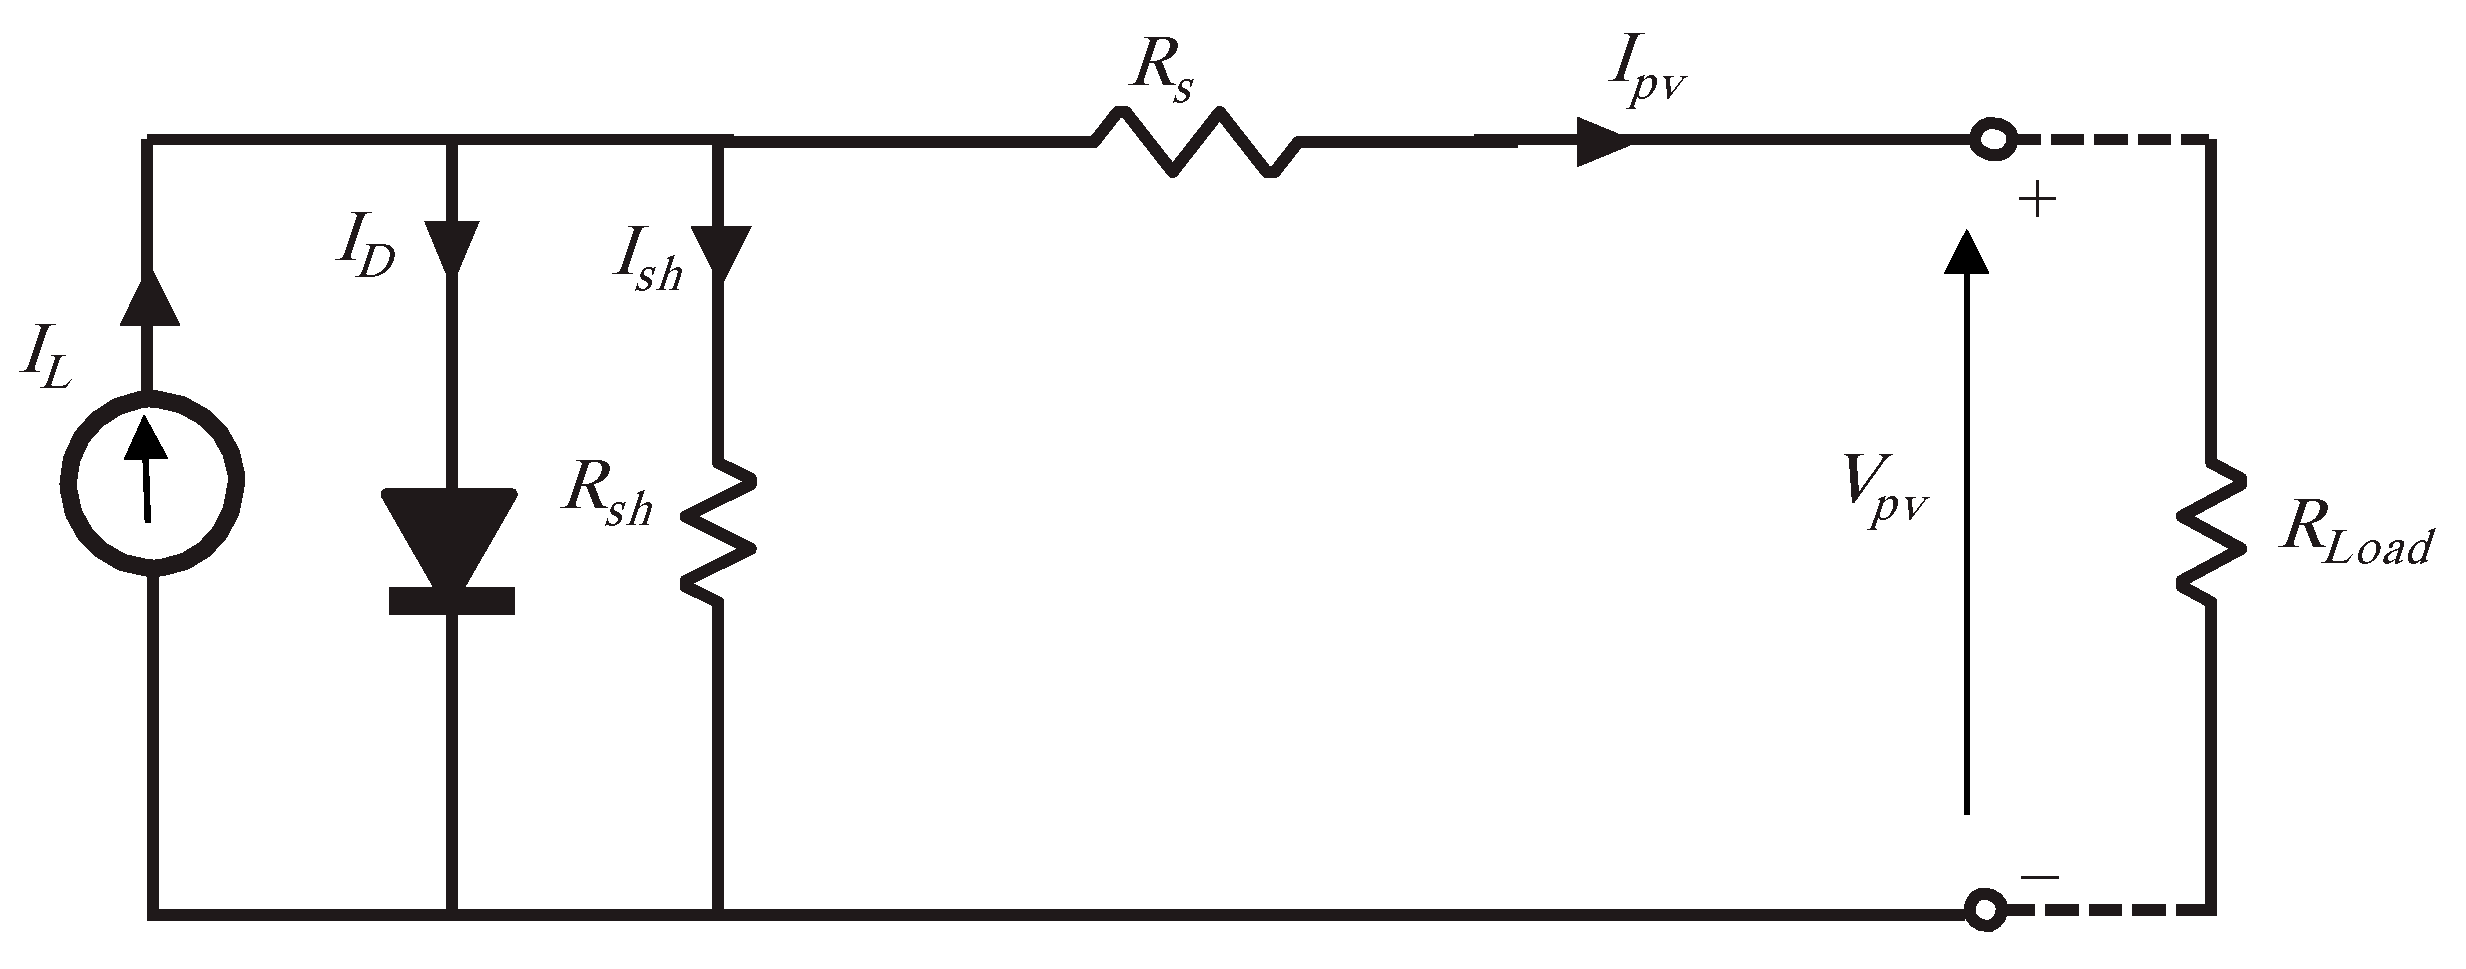
4. Solar Energy Electrical Model
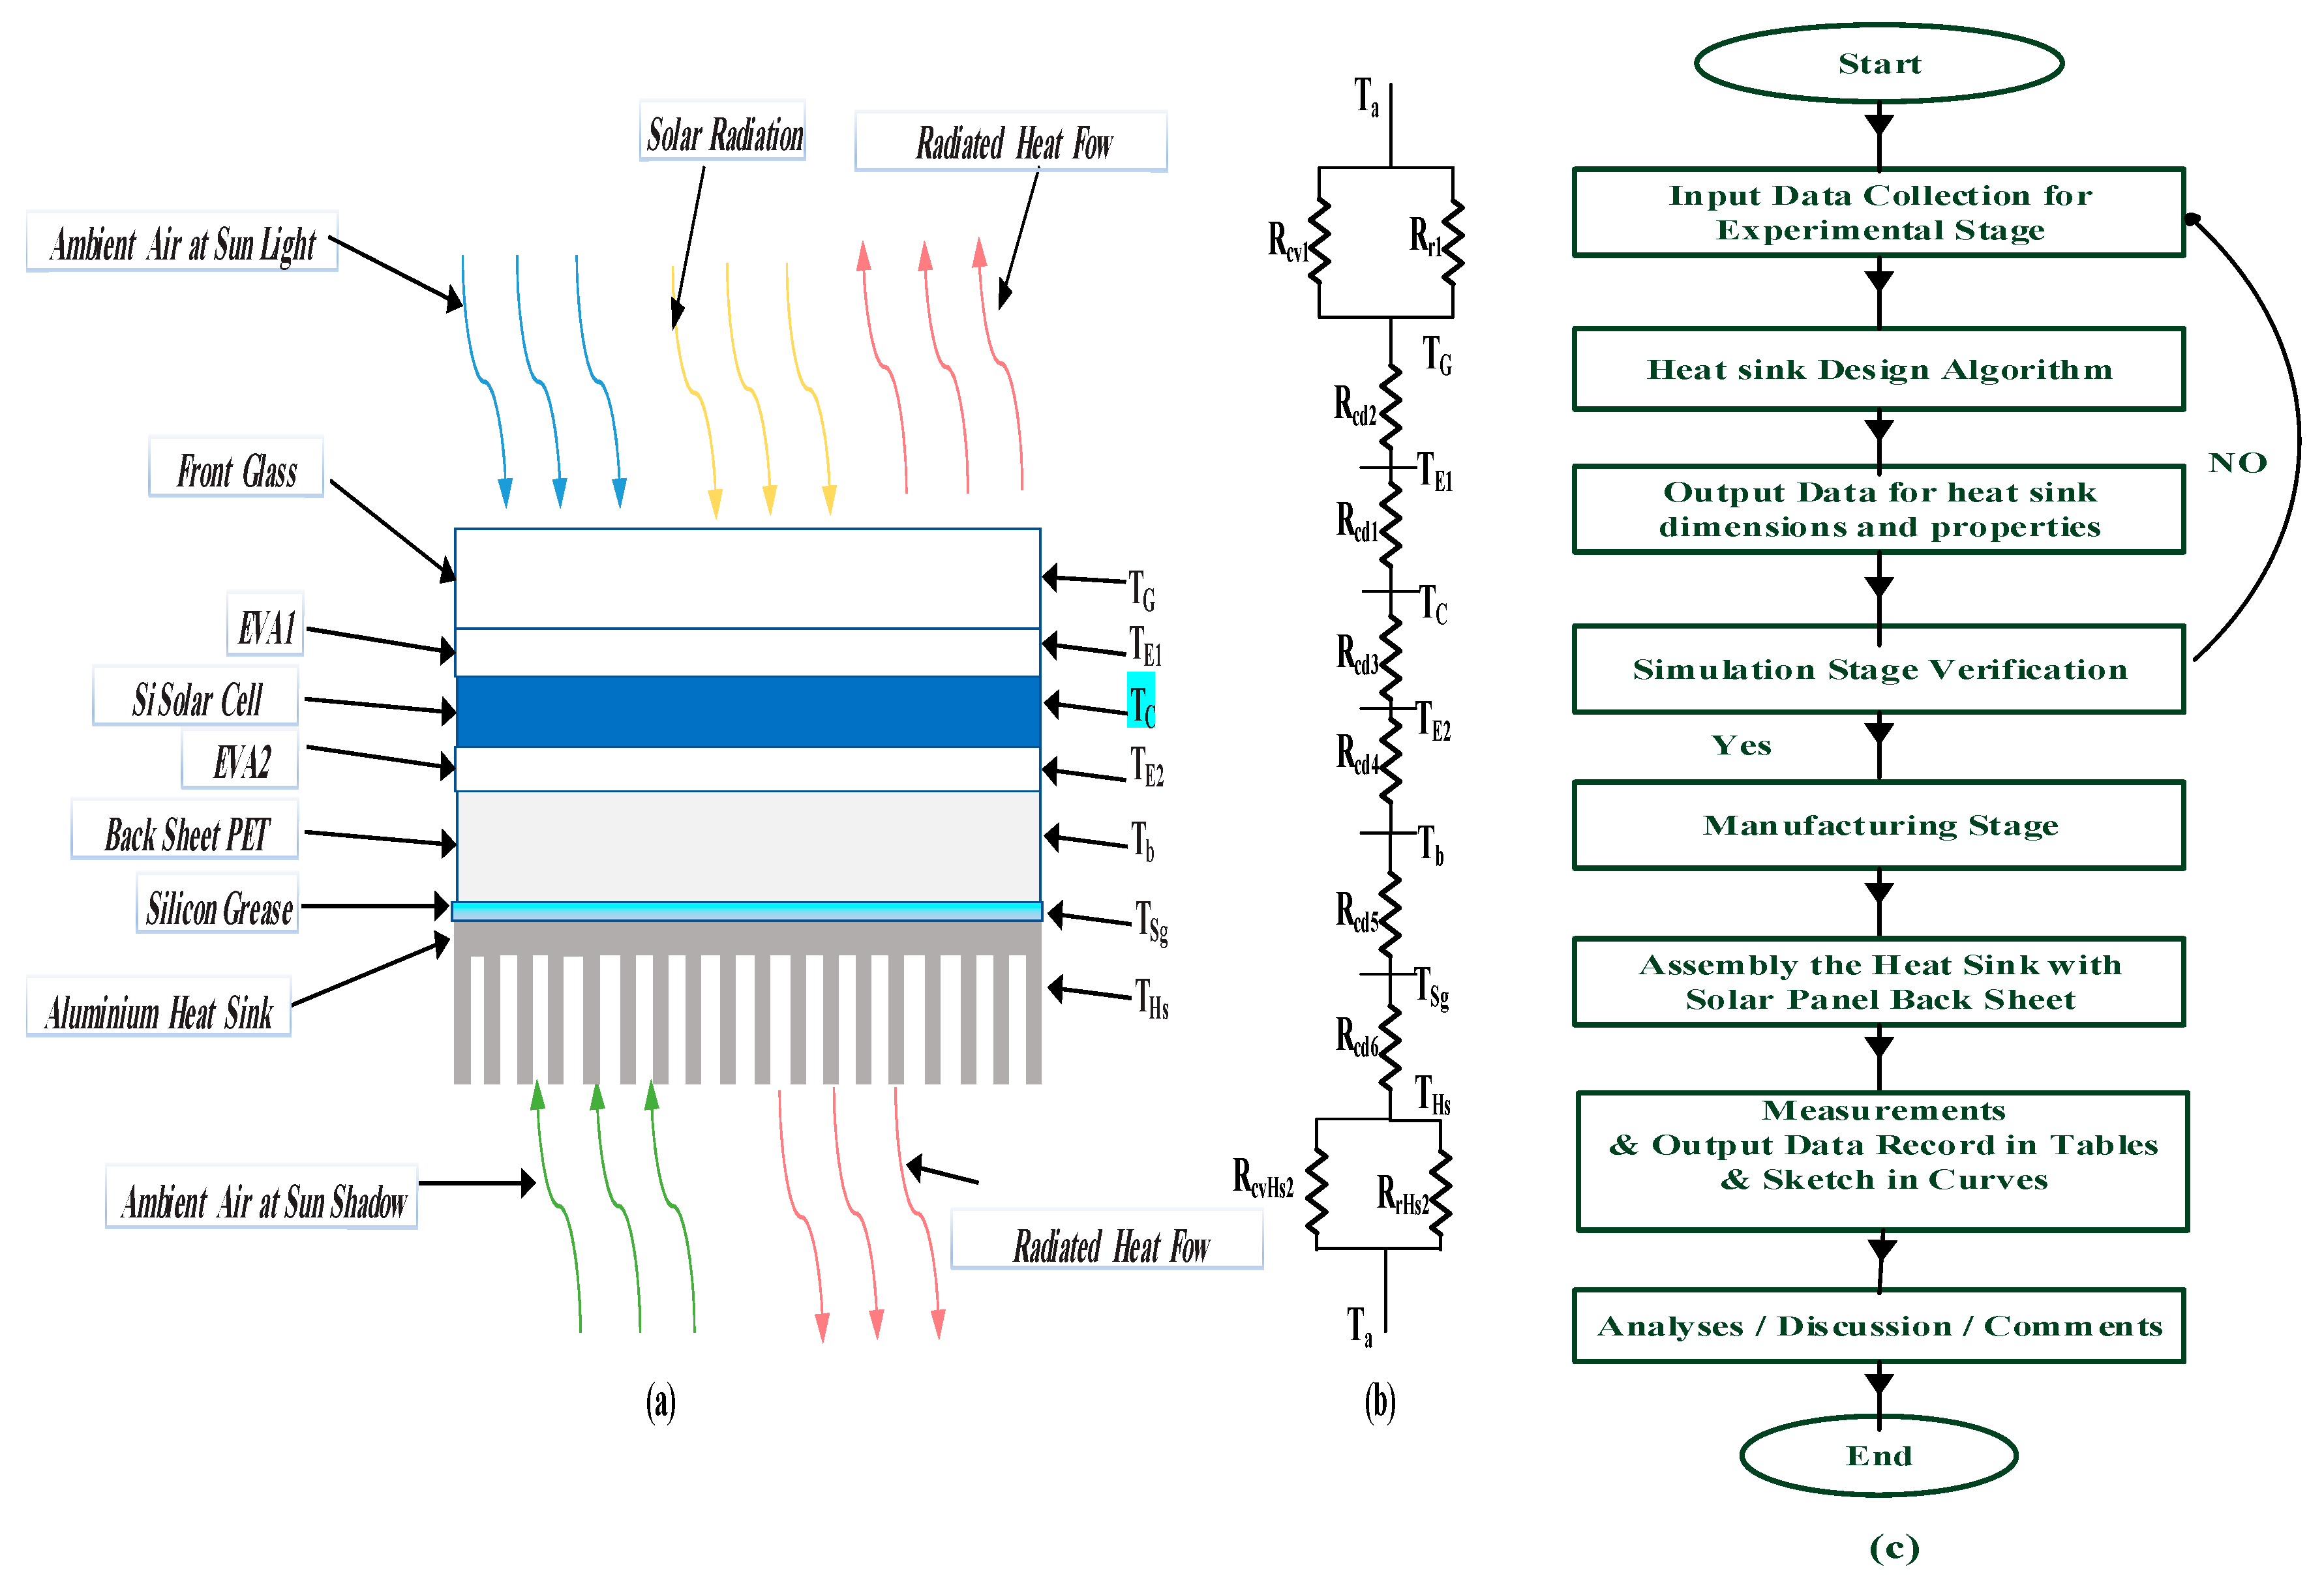
5. The Methodology of Temperature Mitigation
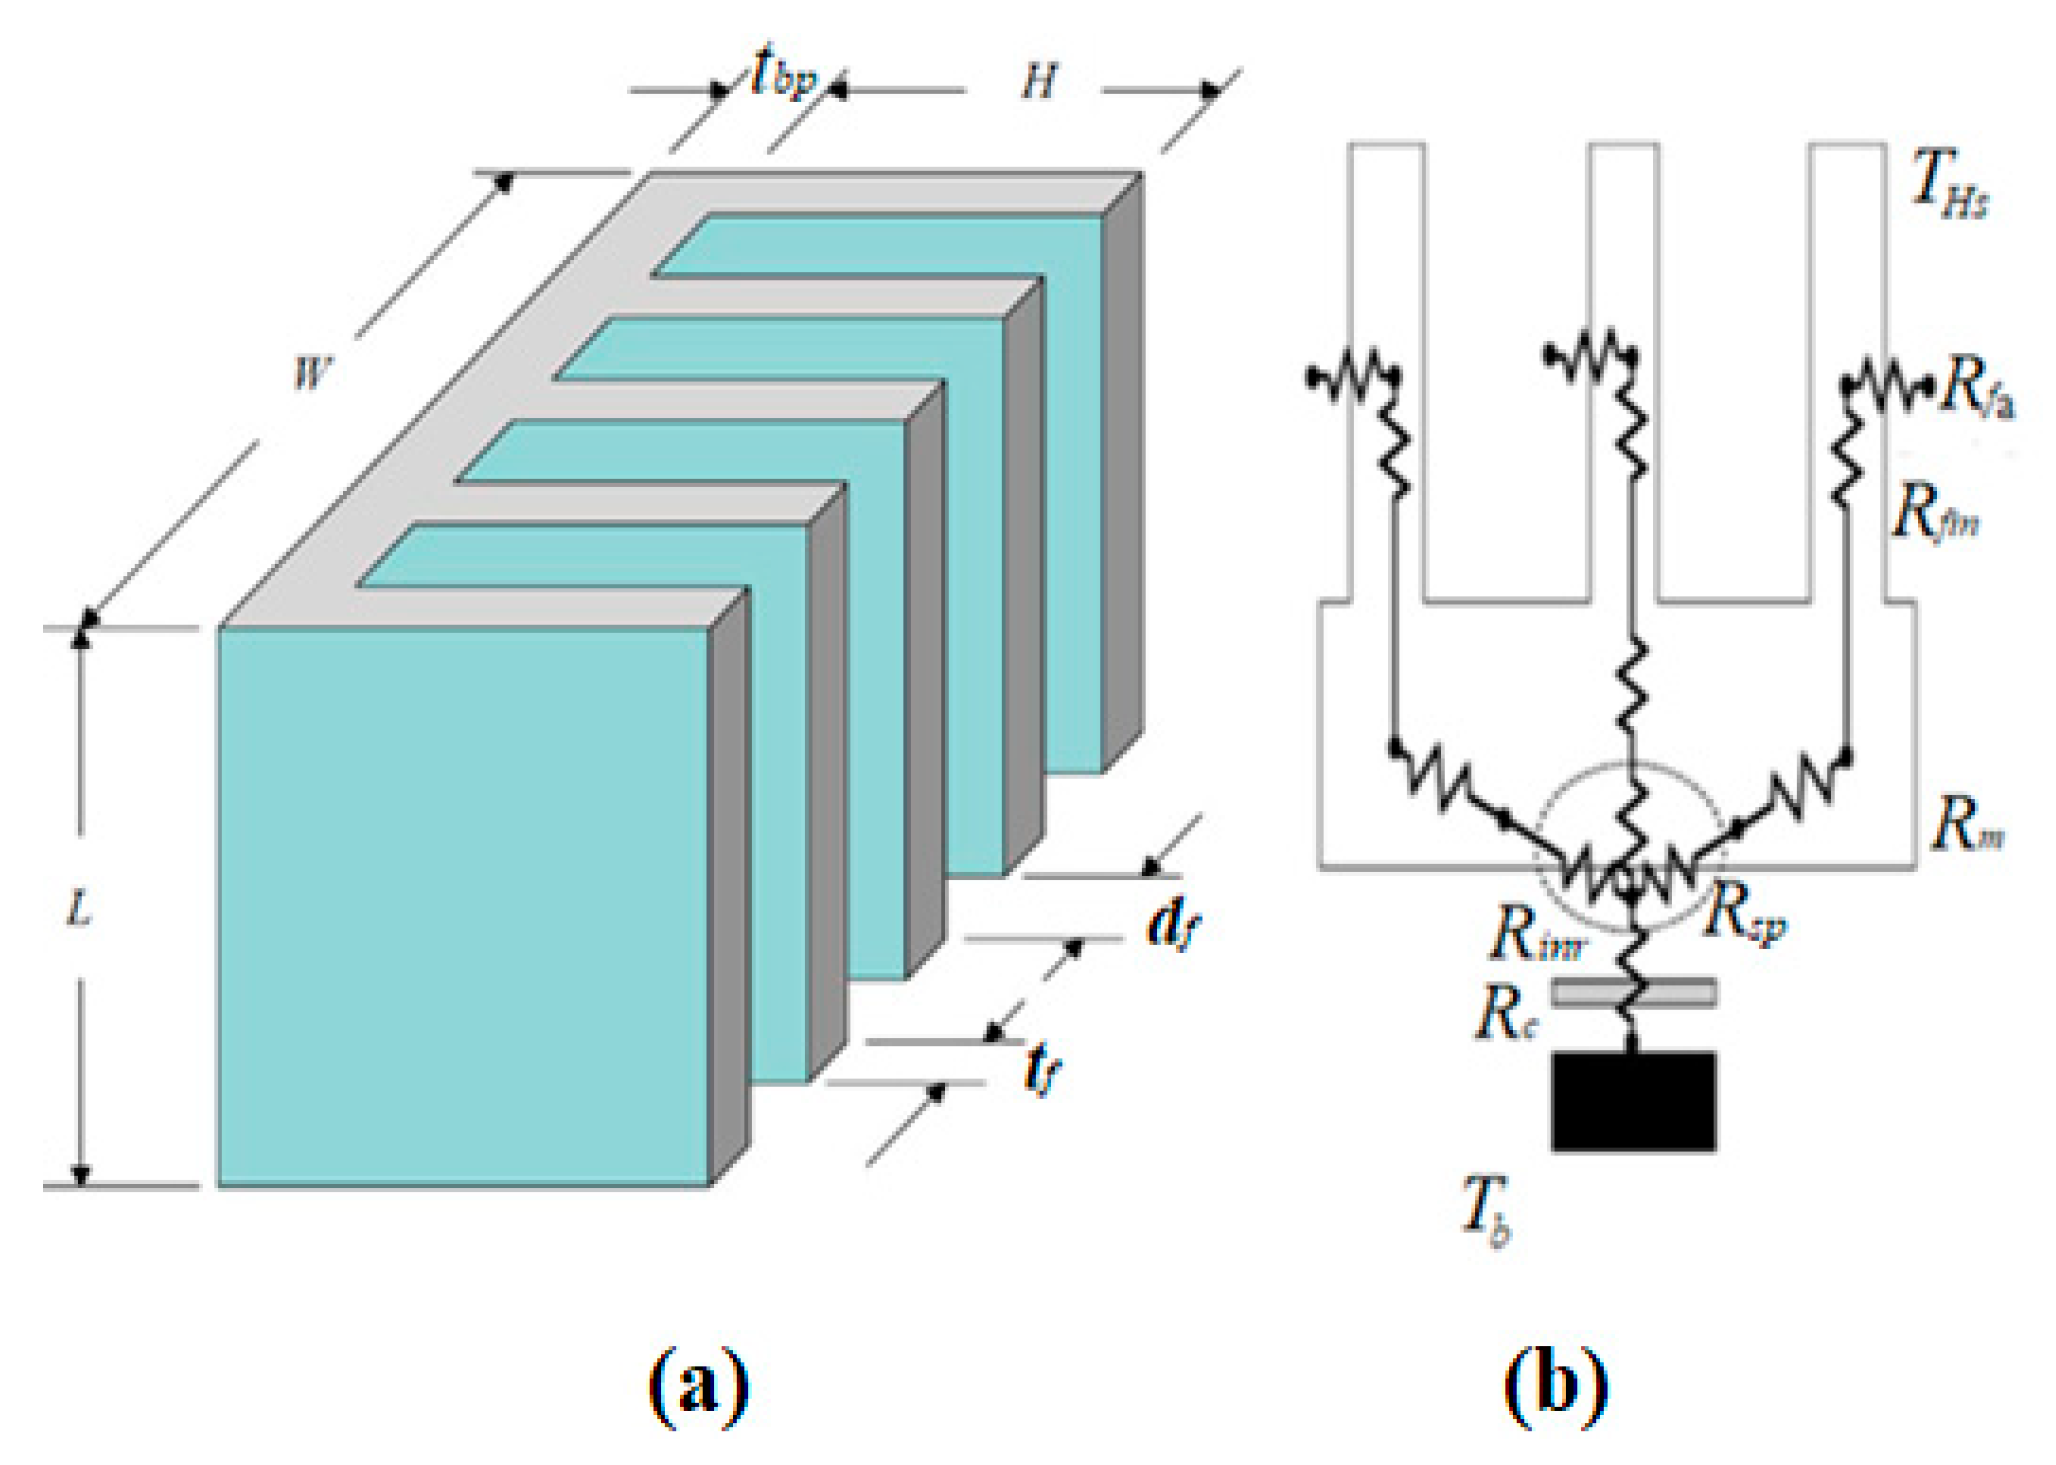
5.1. Design and Selection of Aluminum Heat Sink
5.2. Assembly the Aluminum Heat Sink to the Solar Panel Back Sheet
6. Simulation Model
6.1. Simulation of Solar Panel without a Heat Sink
6.2. Simulation of Solar Panel with an Aluminum Heat Sink
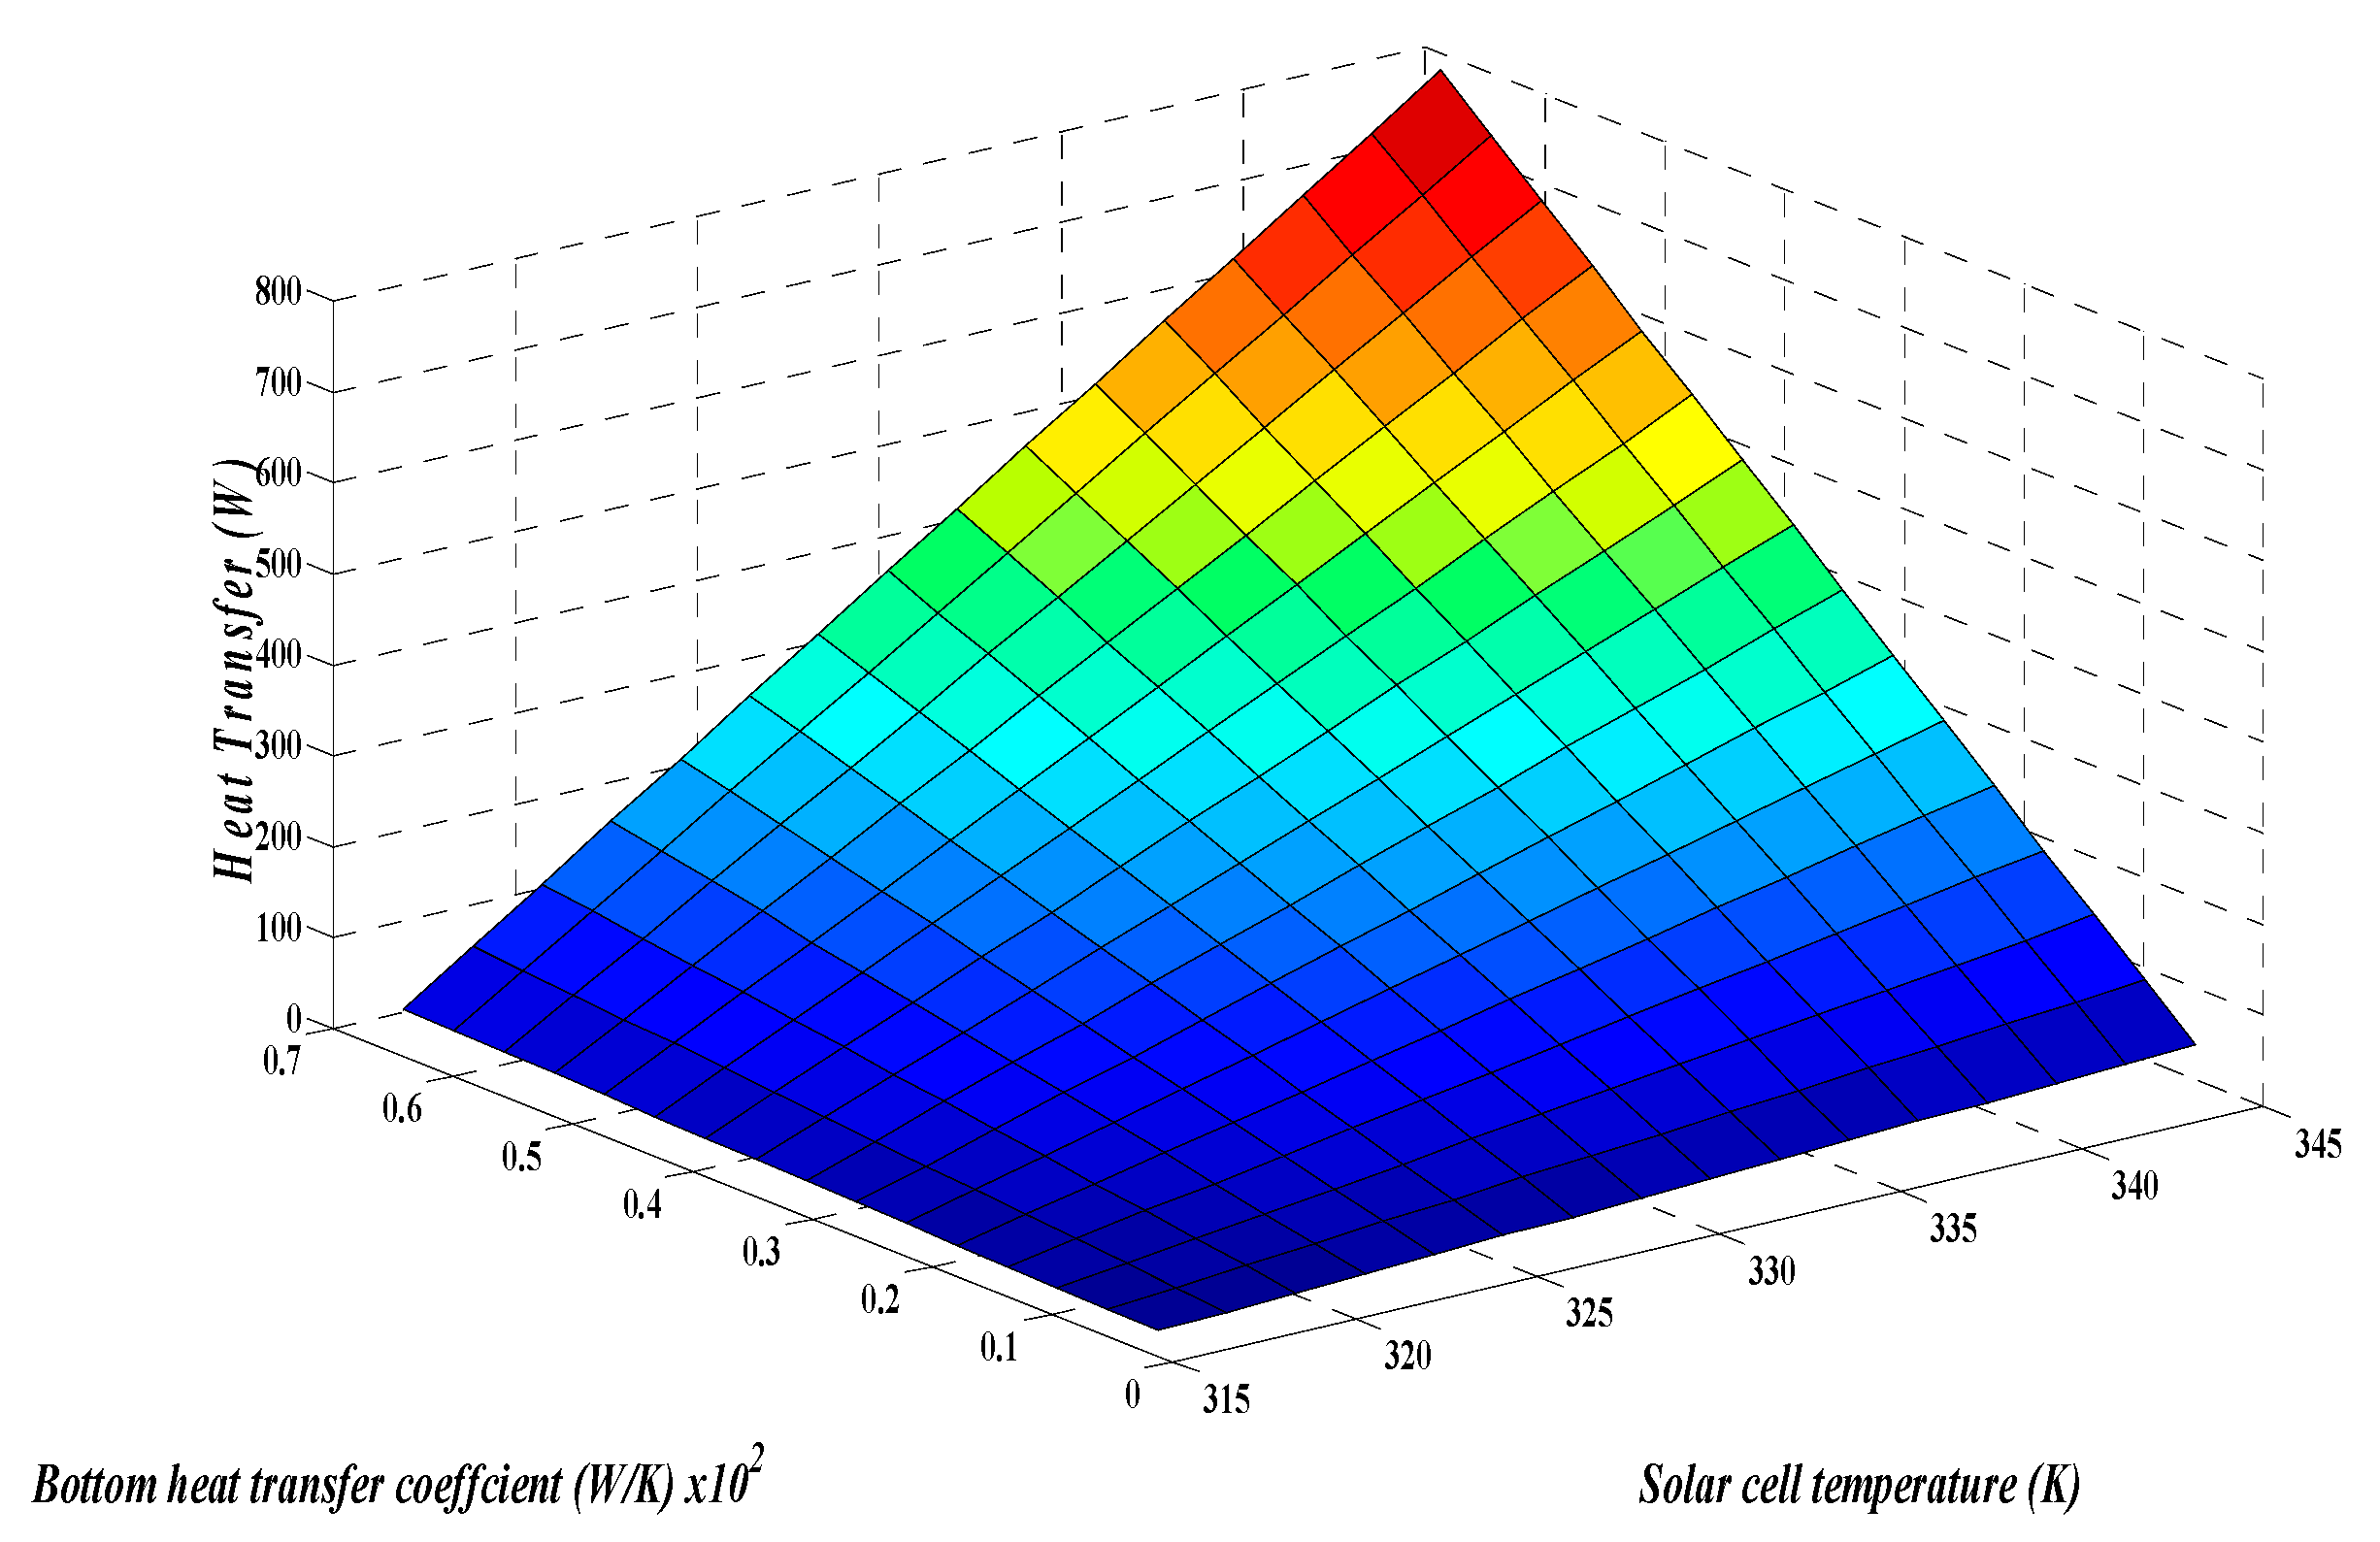
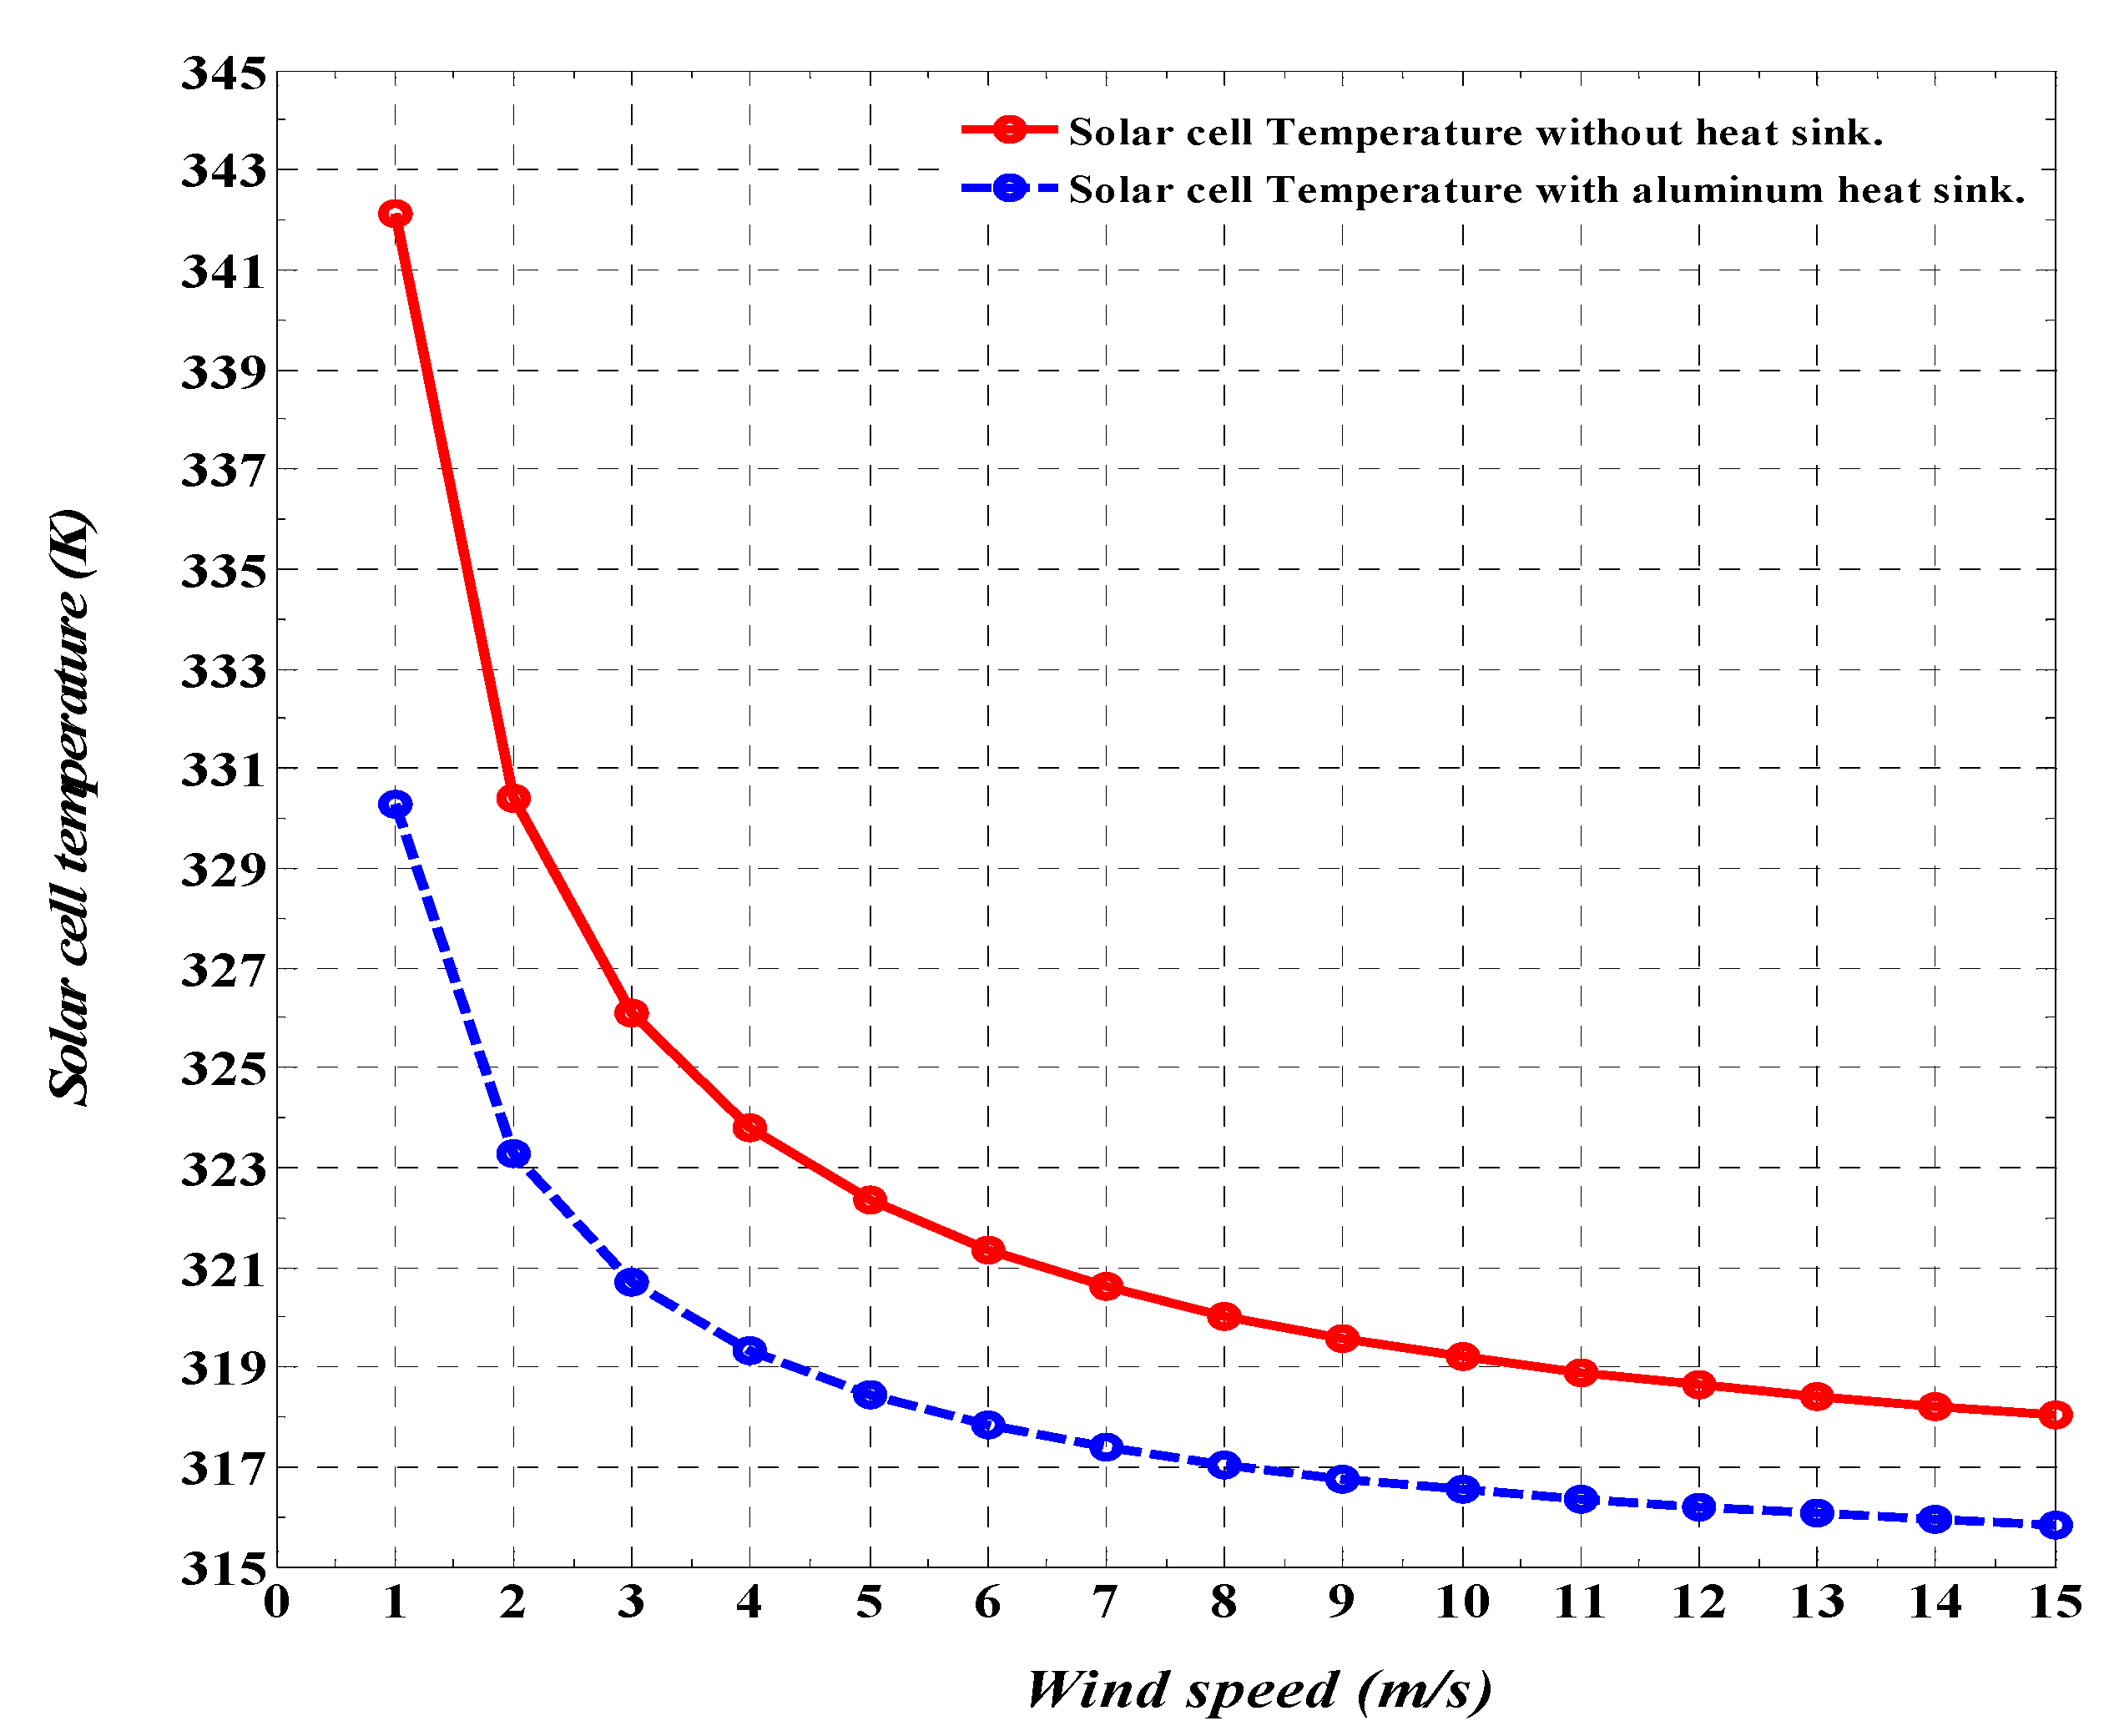
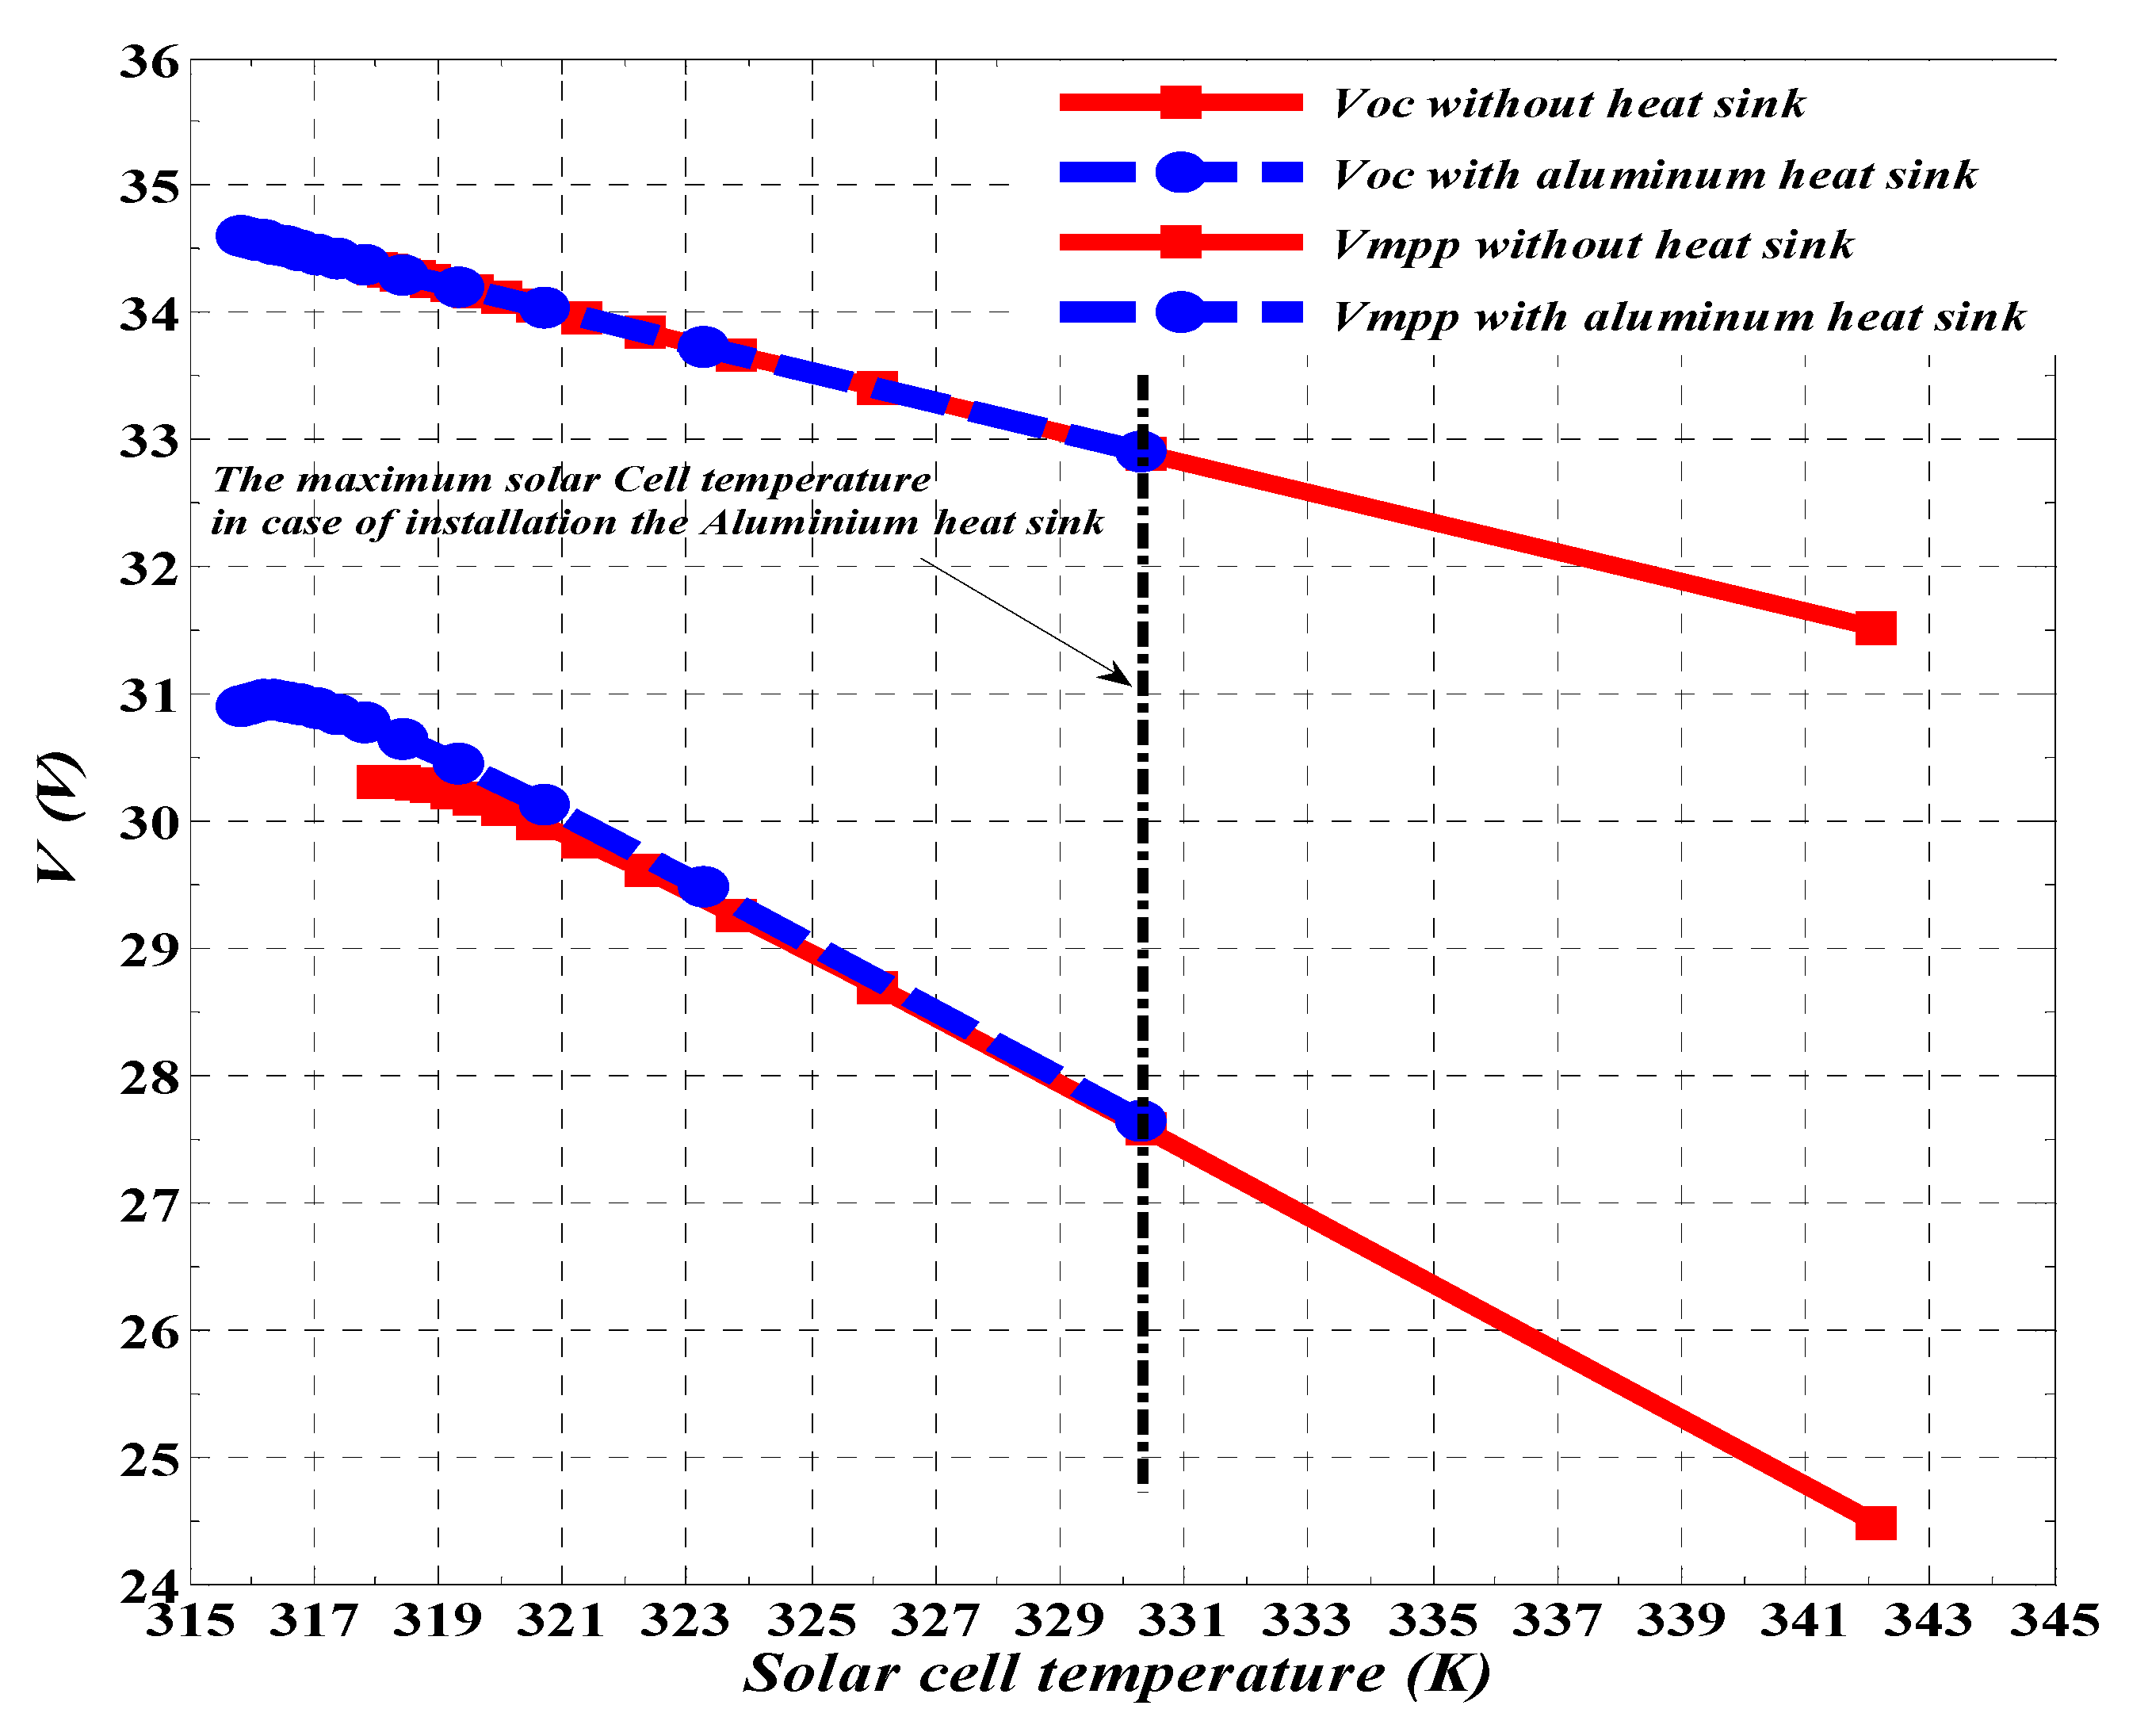
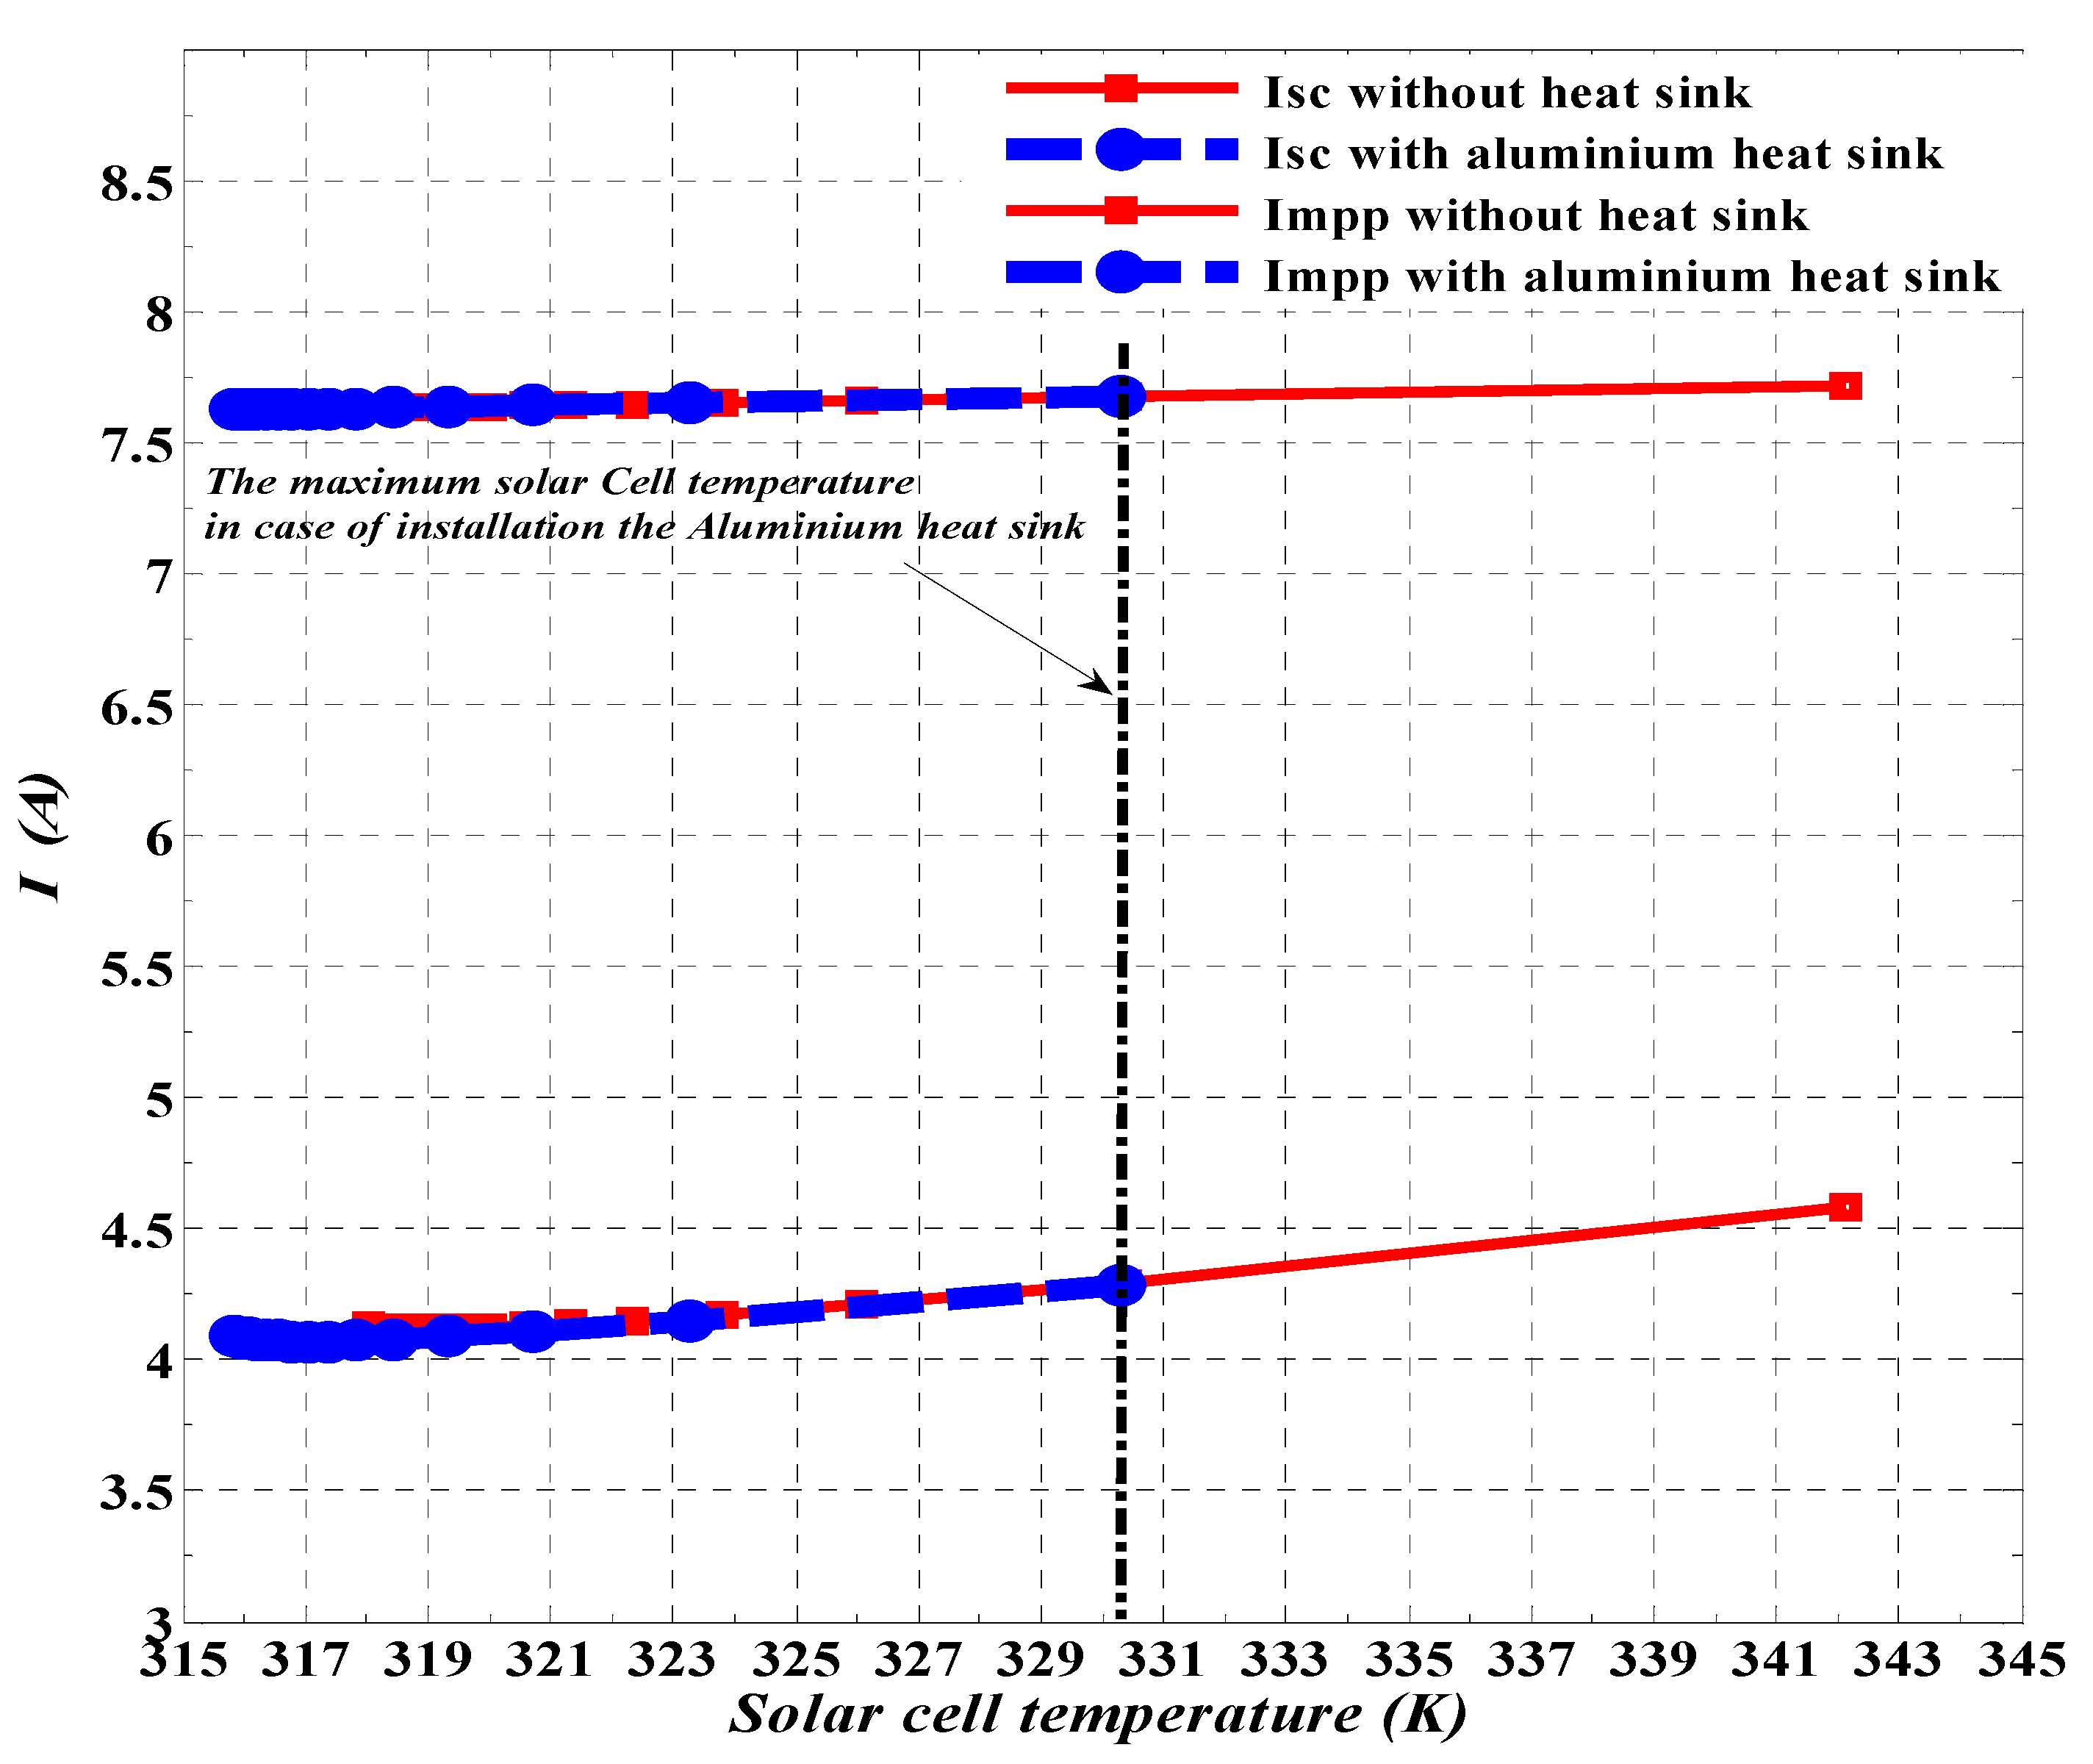
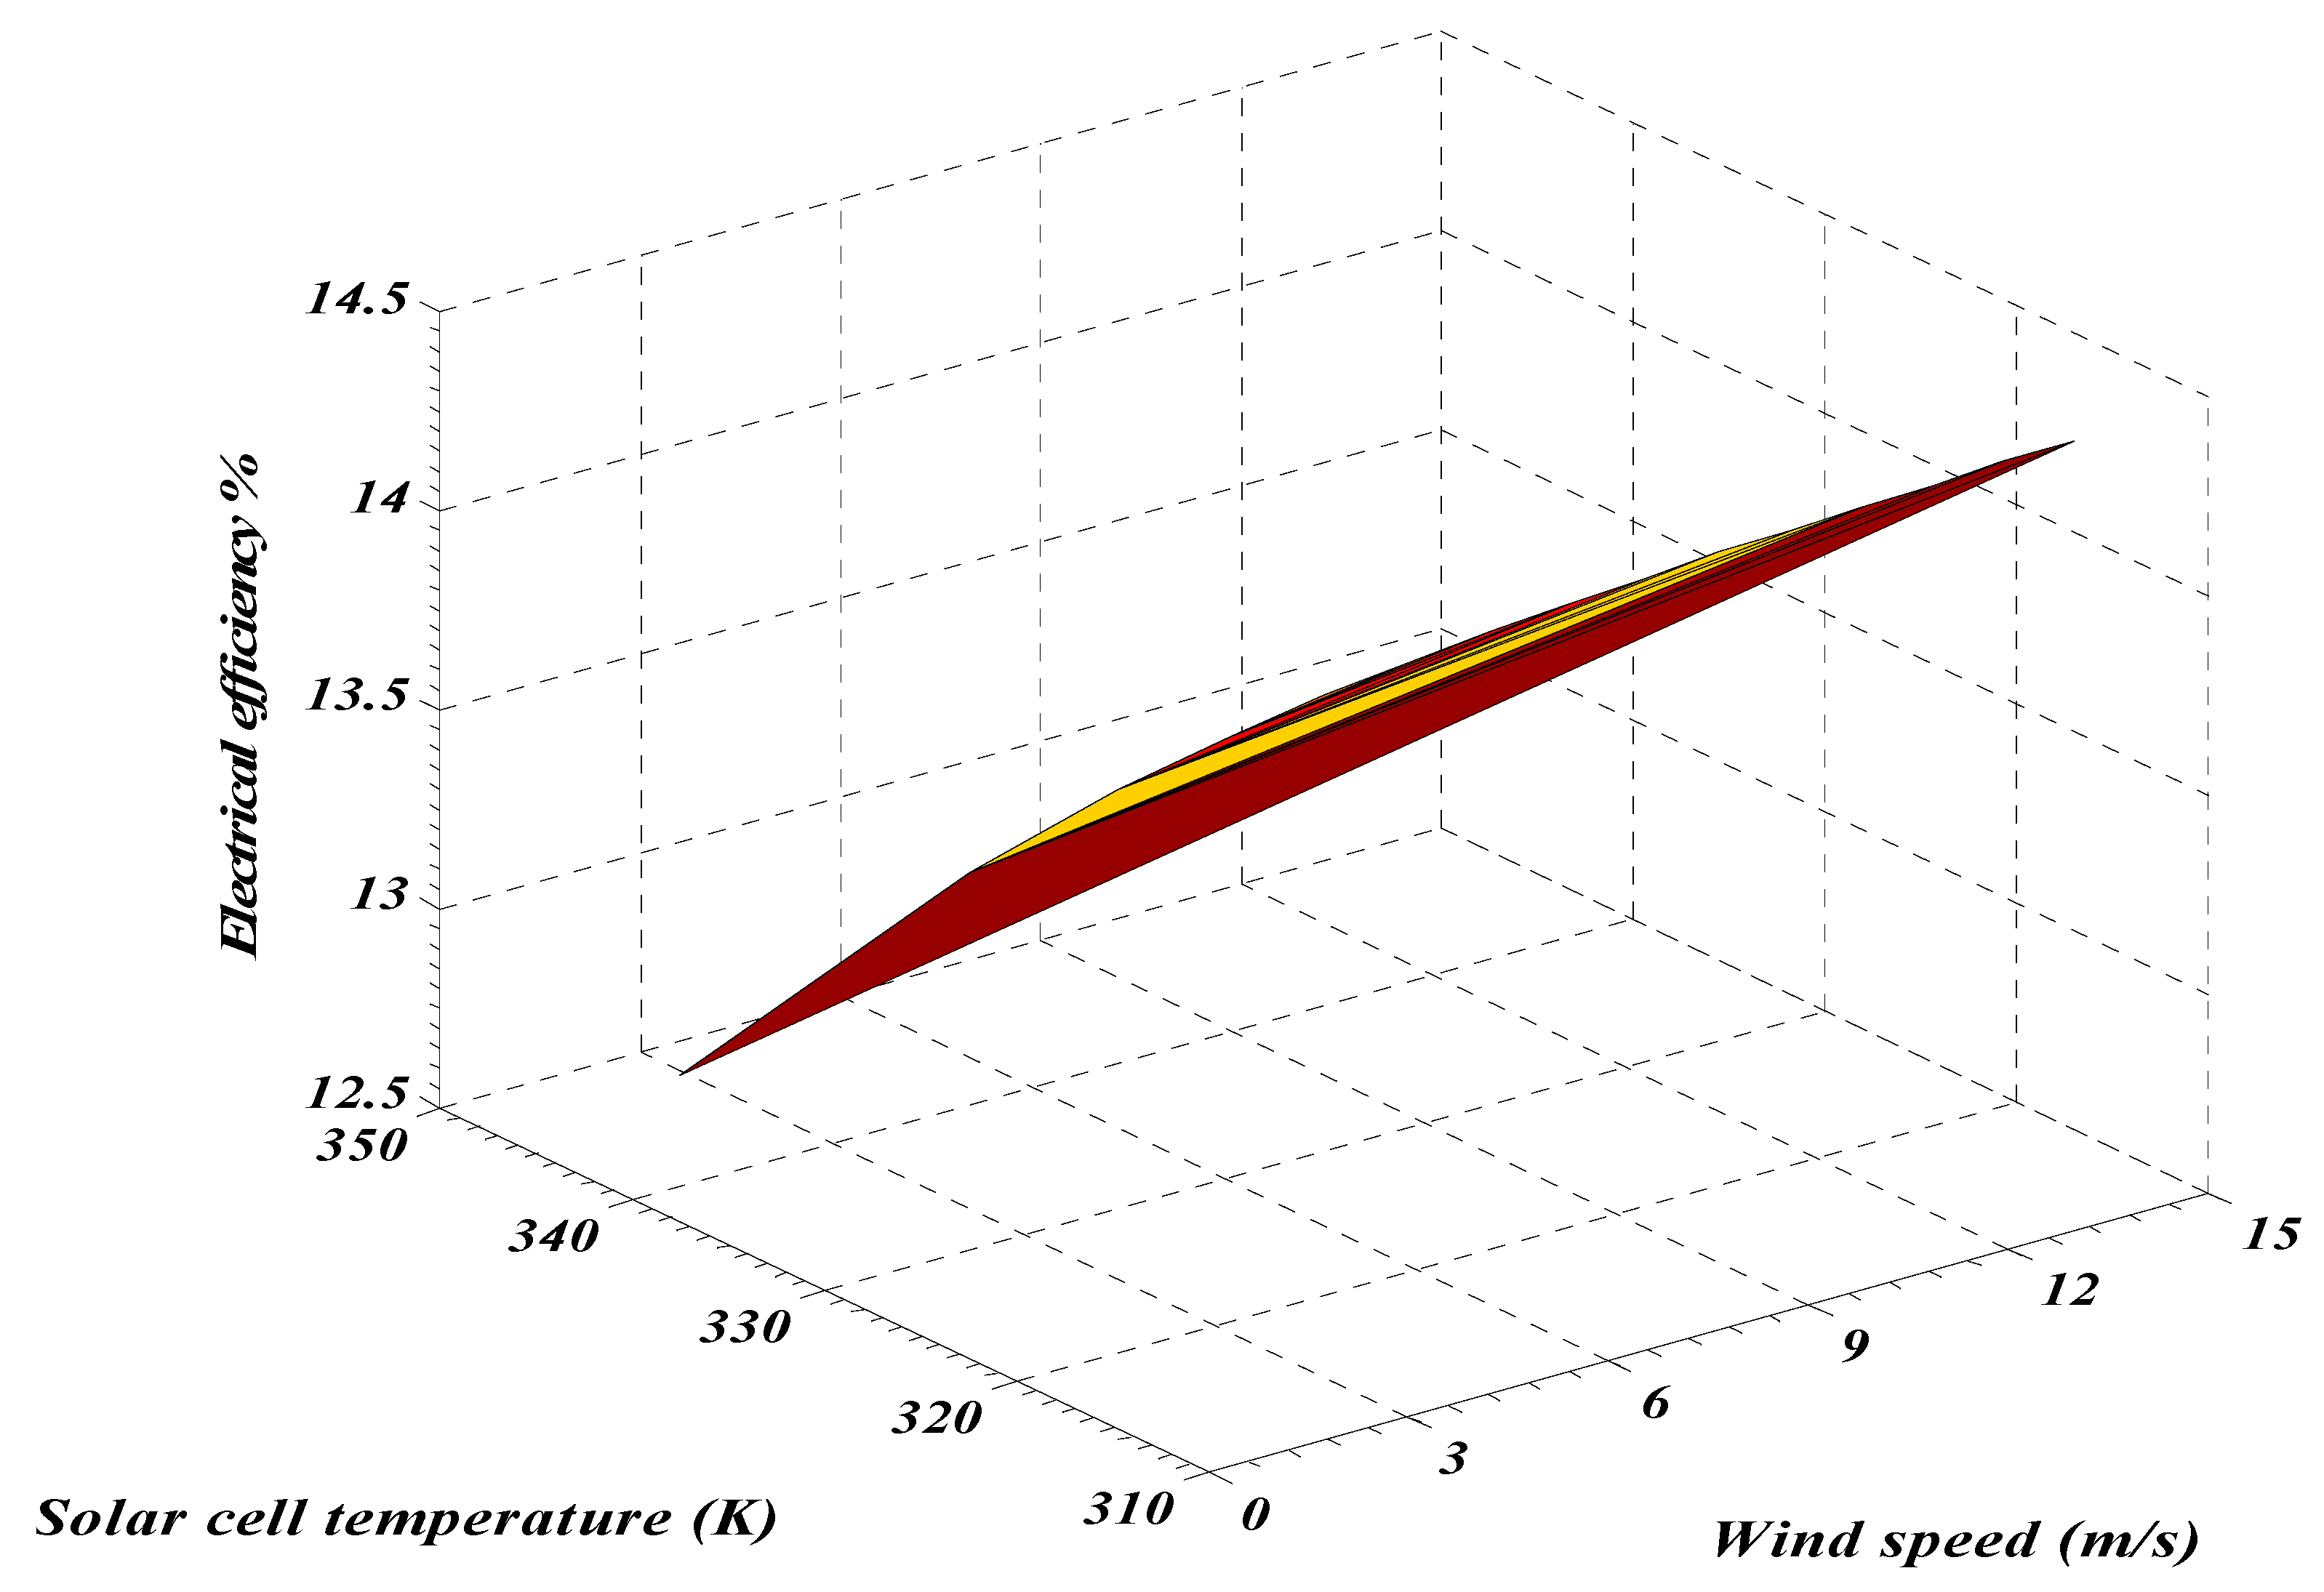
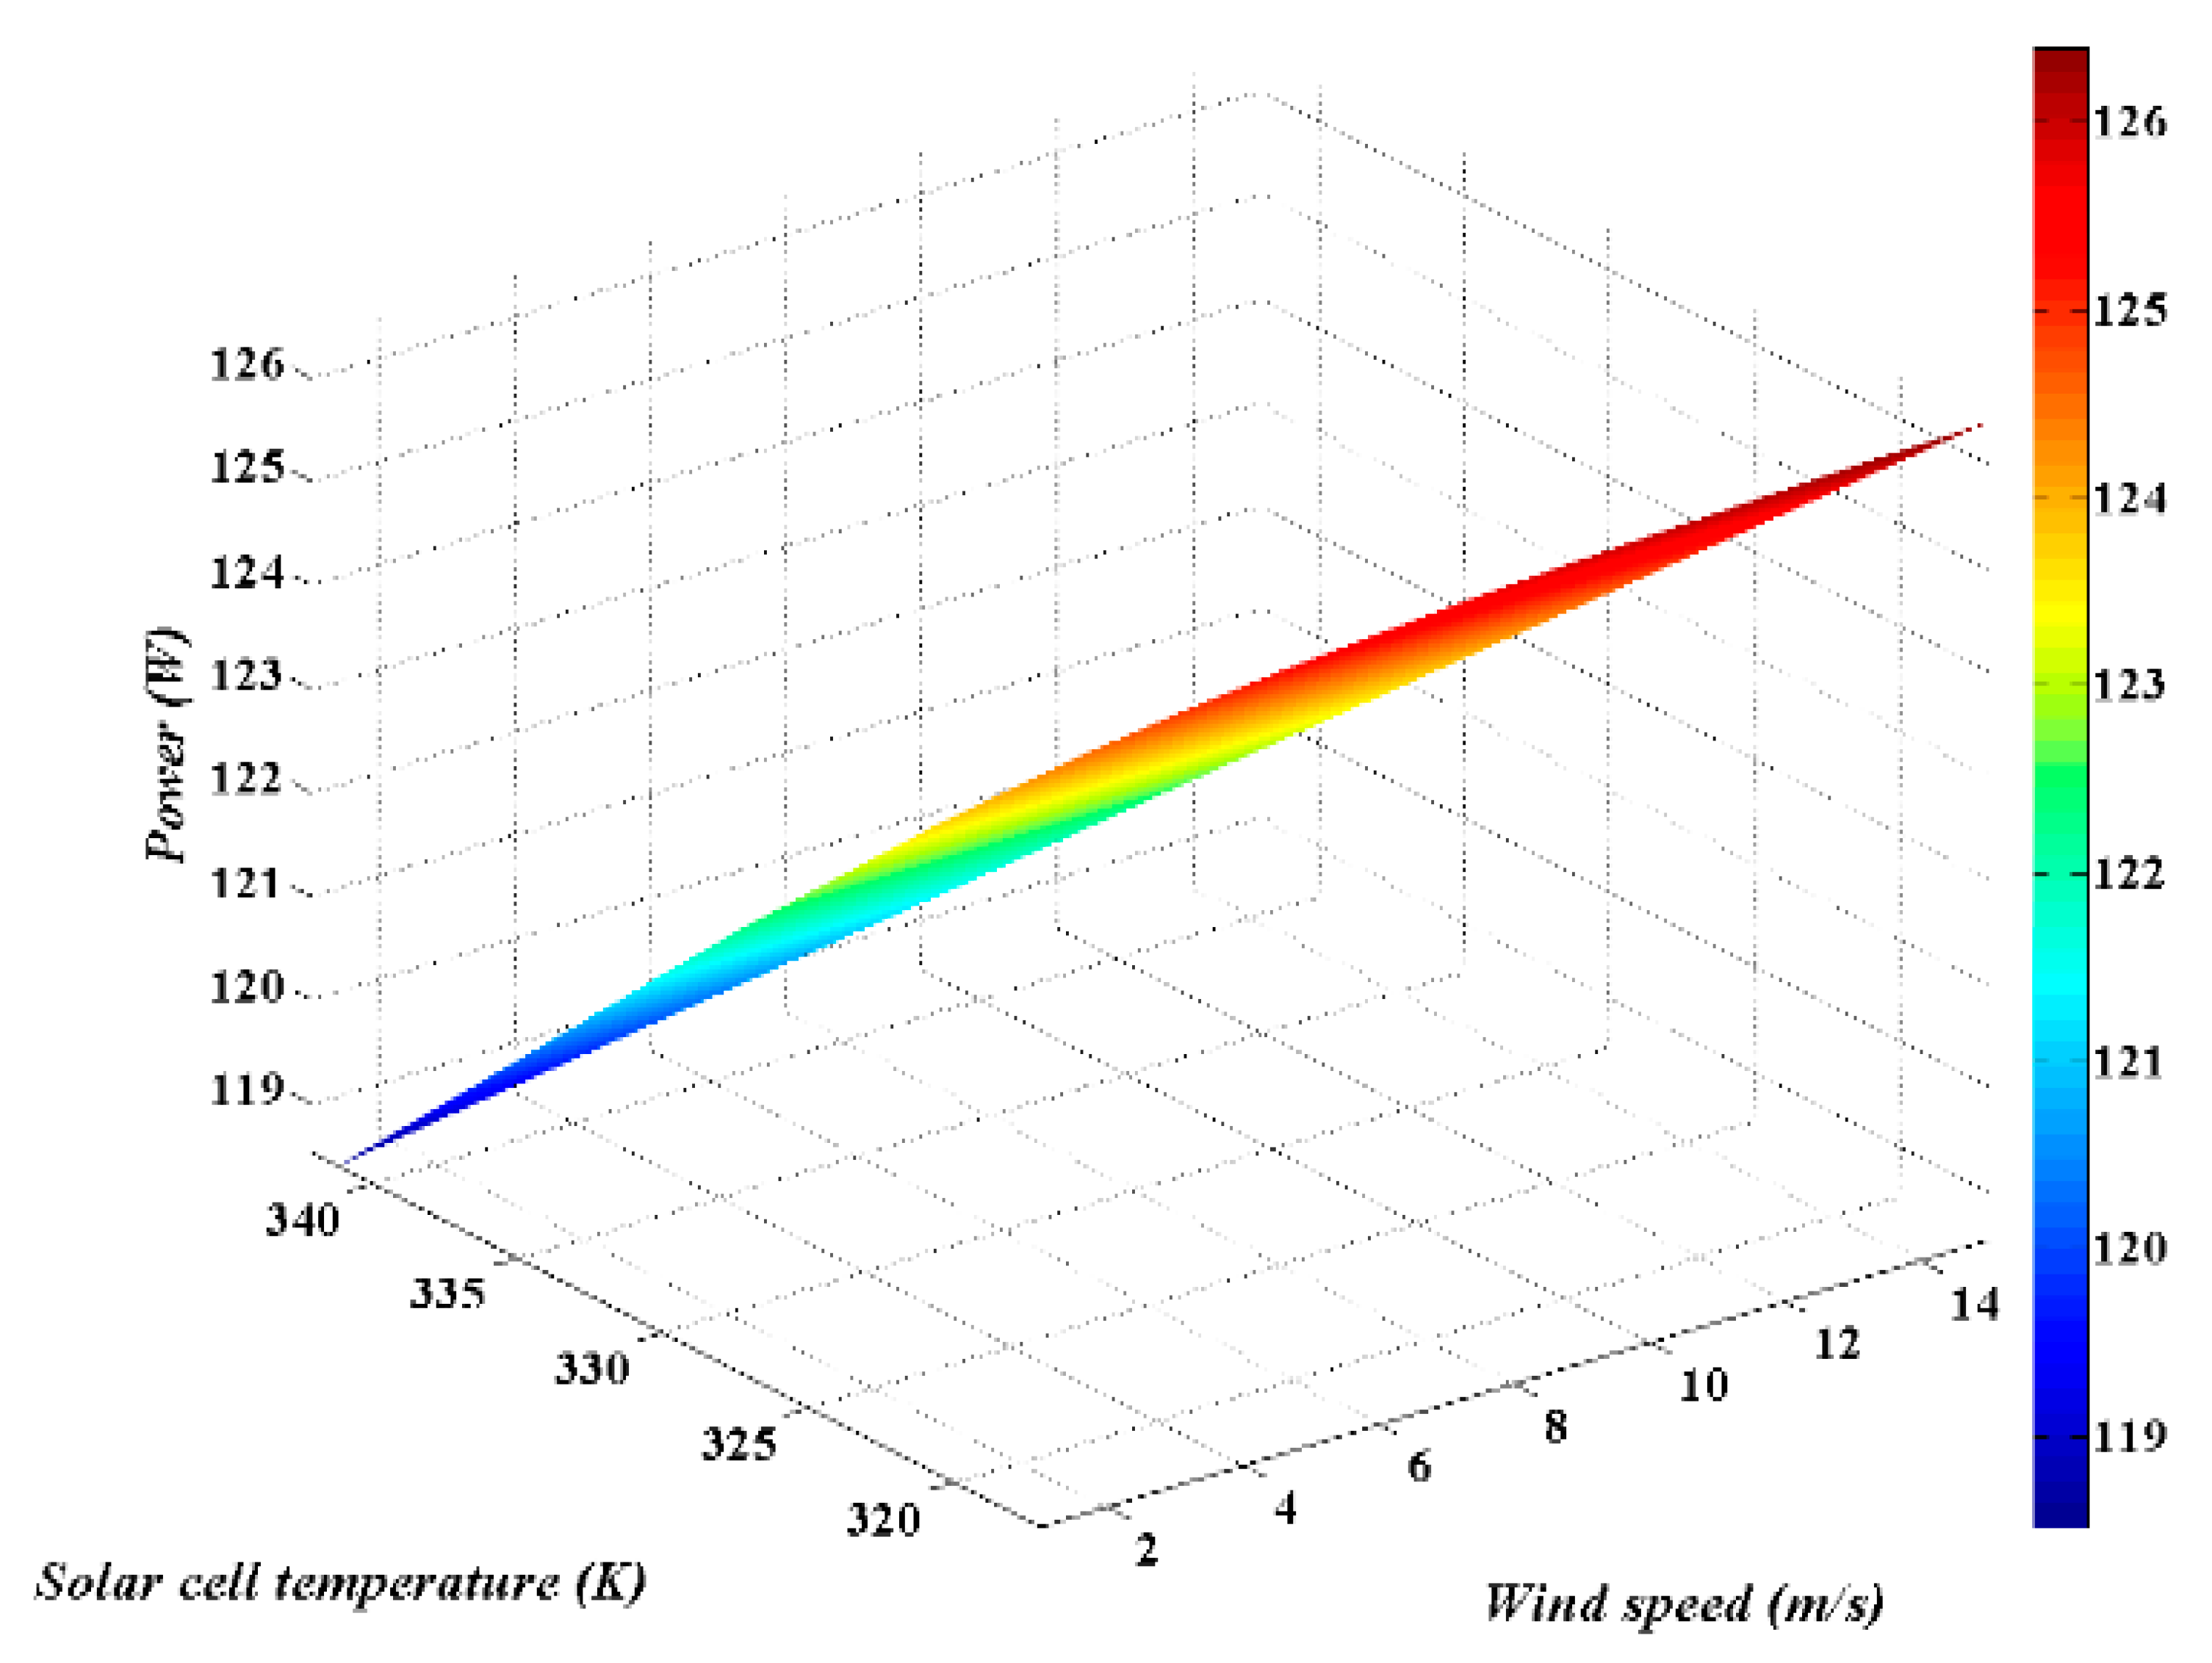
6.3. Comparison of Results of the Two Simulation Models
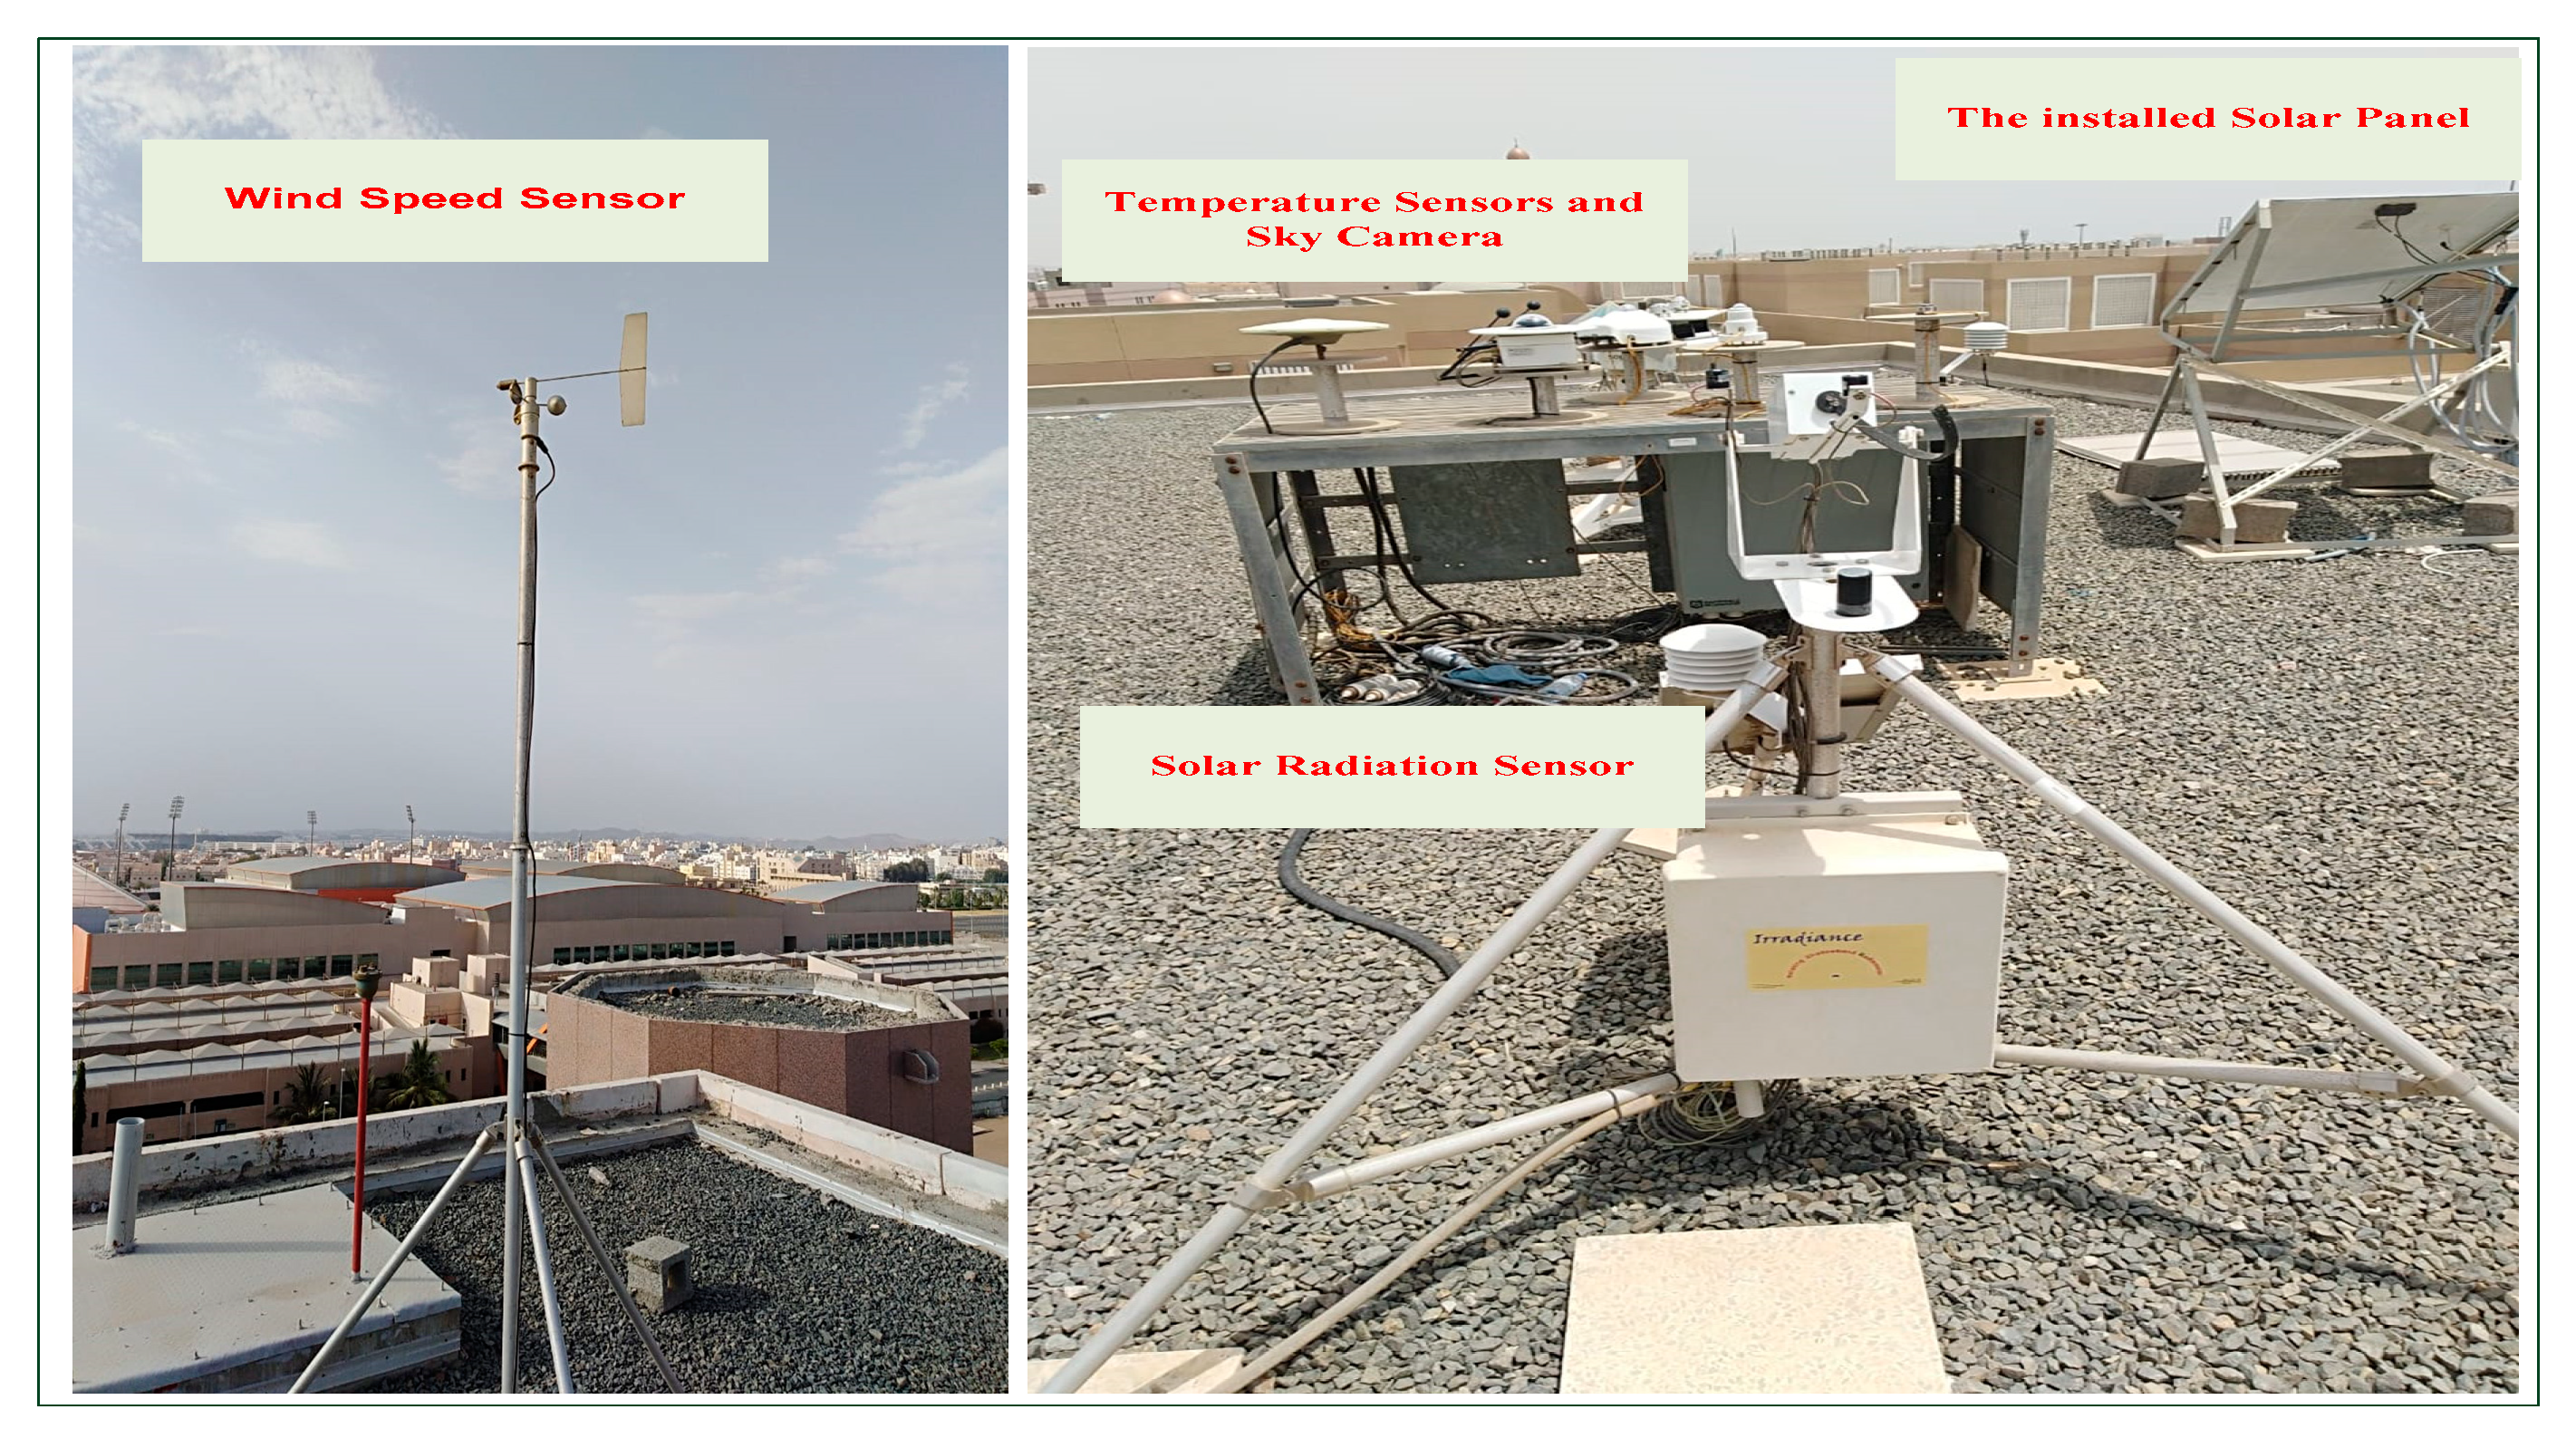
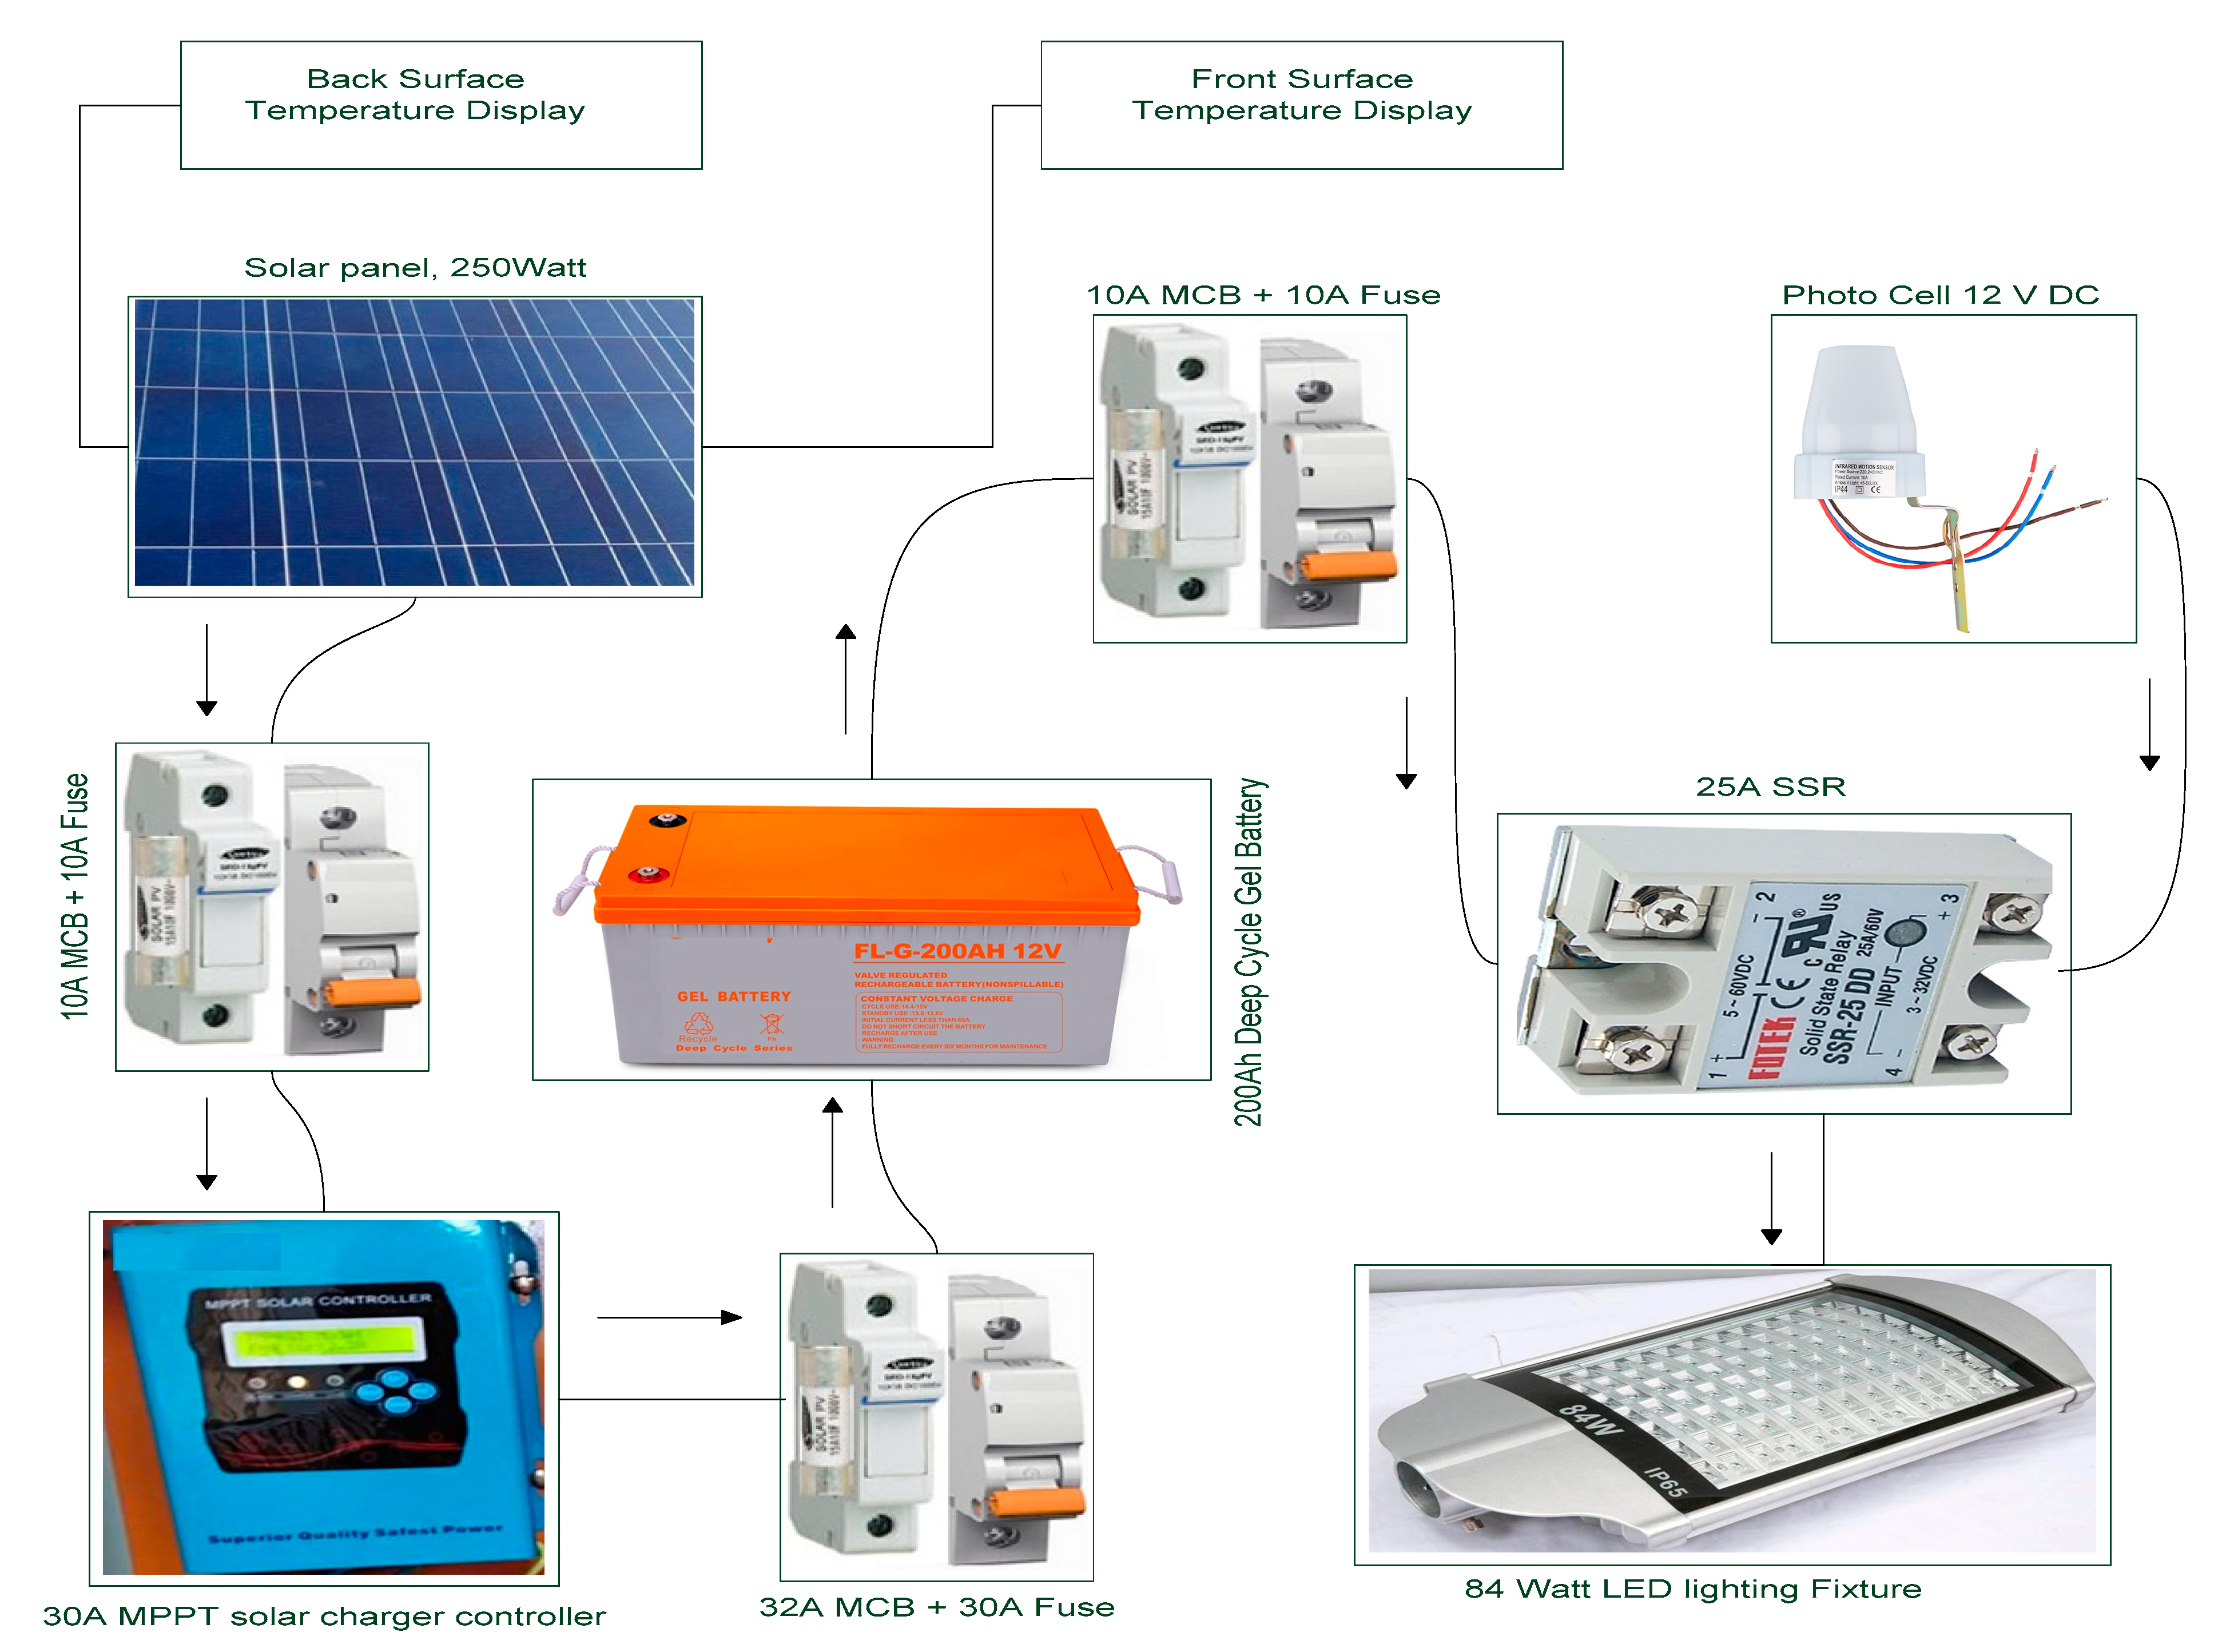
7. The Experimental Setup Models
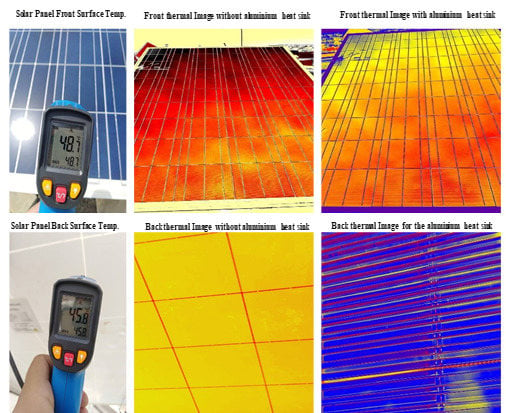
7.1. The Experimental Setup Model without Heat Sink
7.2. The Experimental Setup Model with an Aluminum Heat Sink
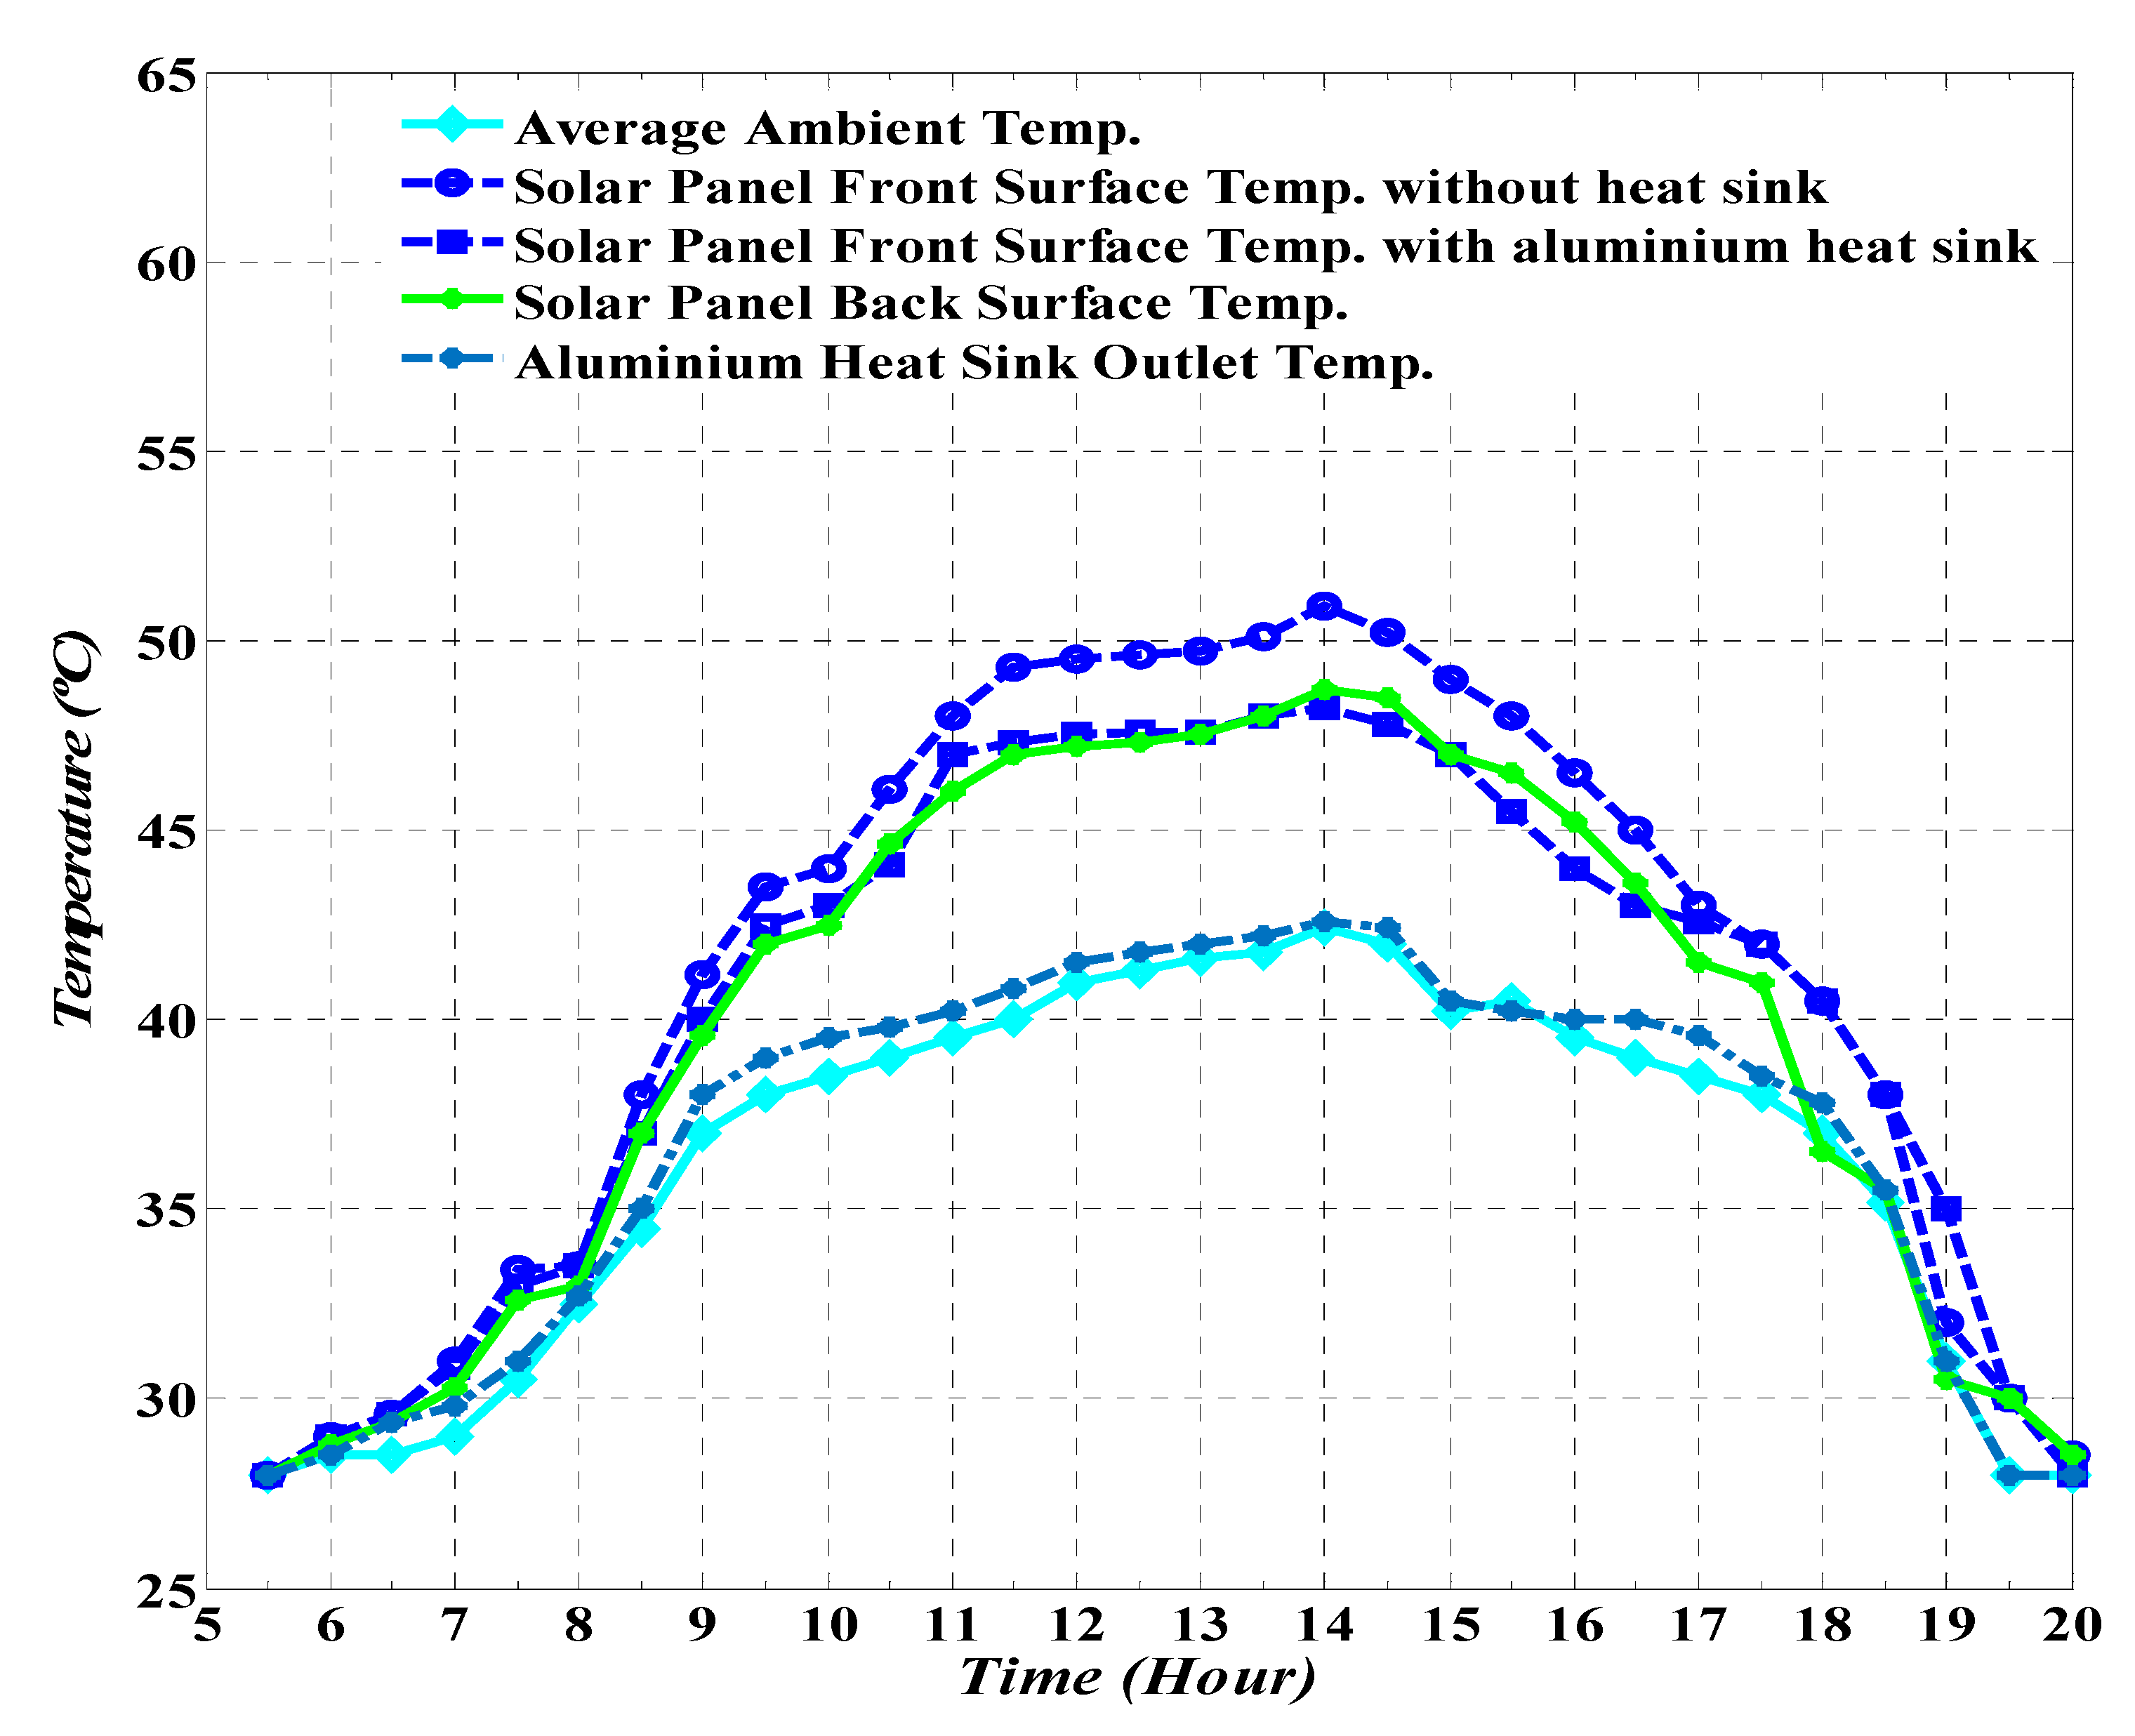
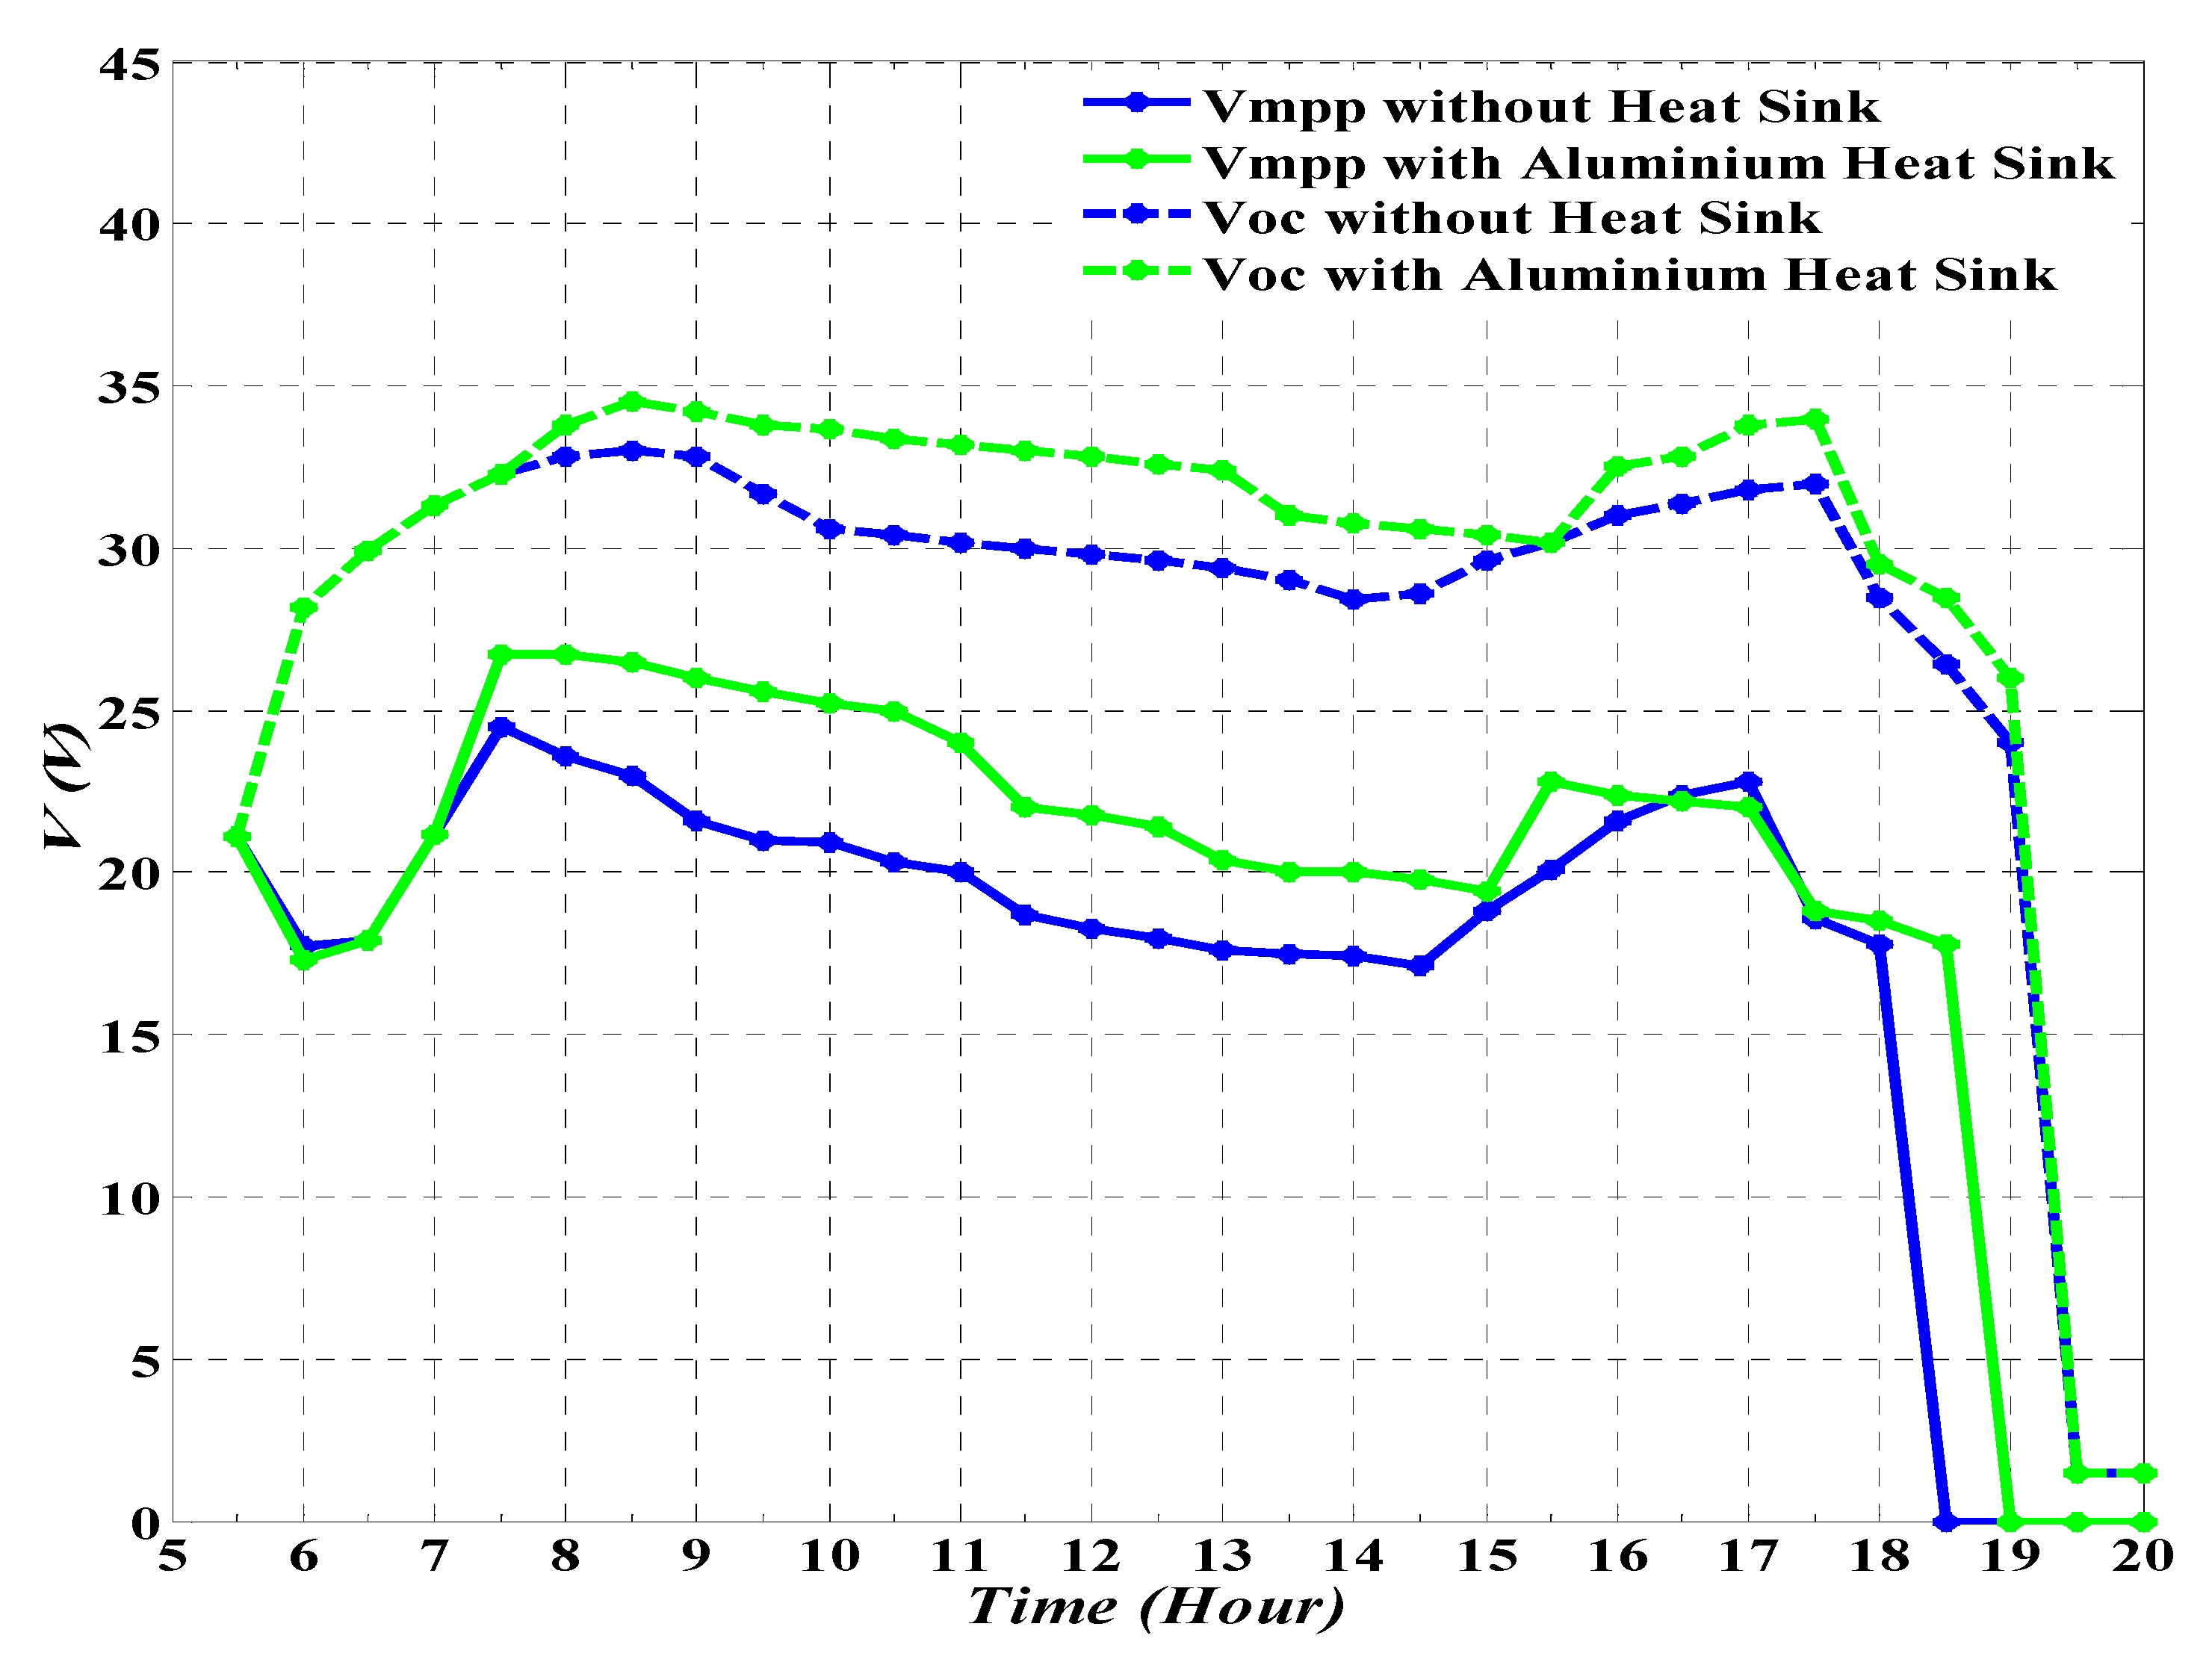
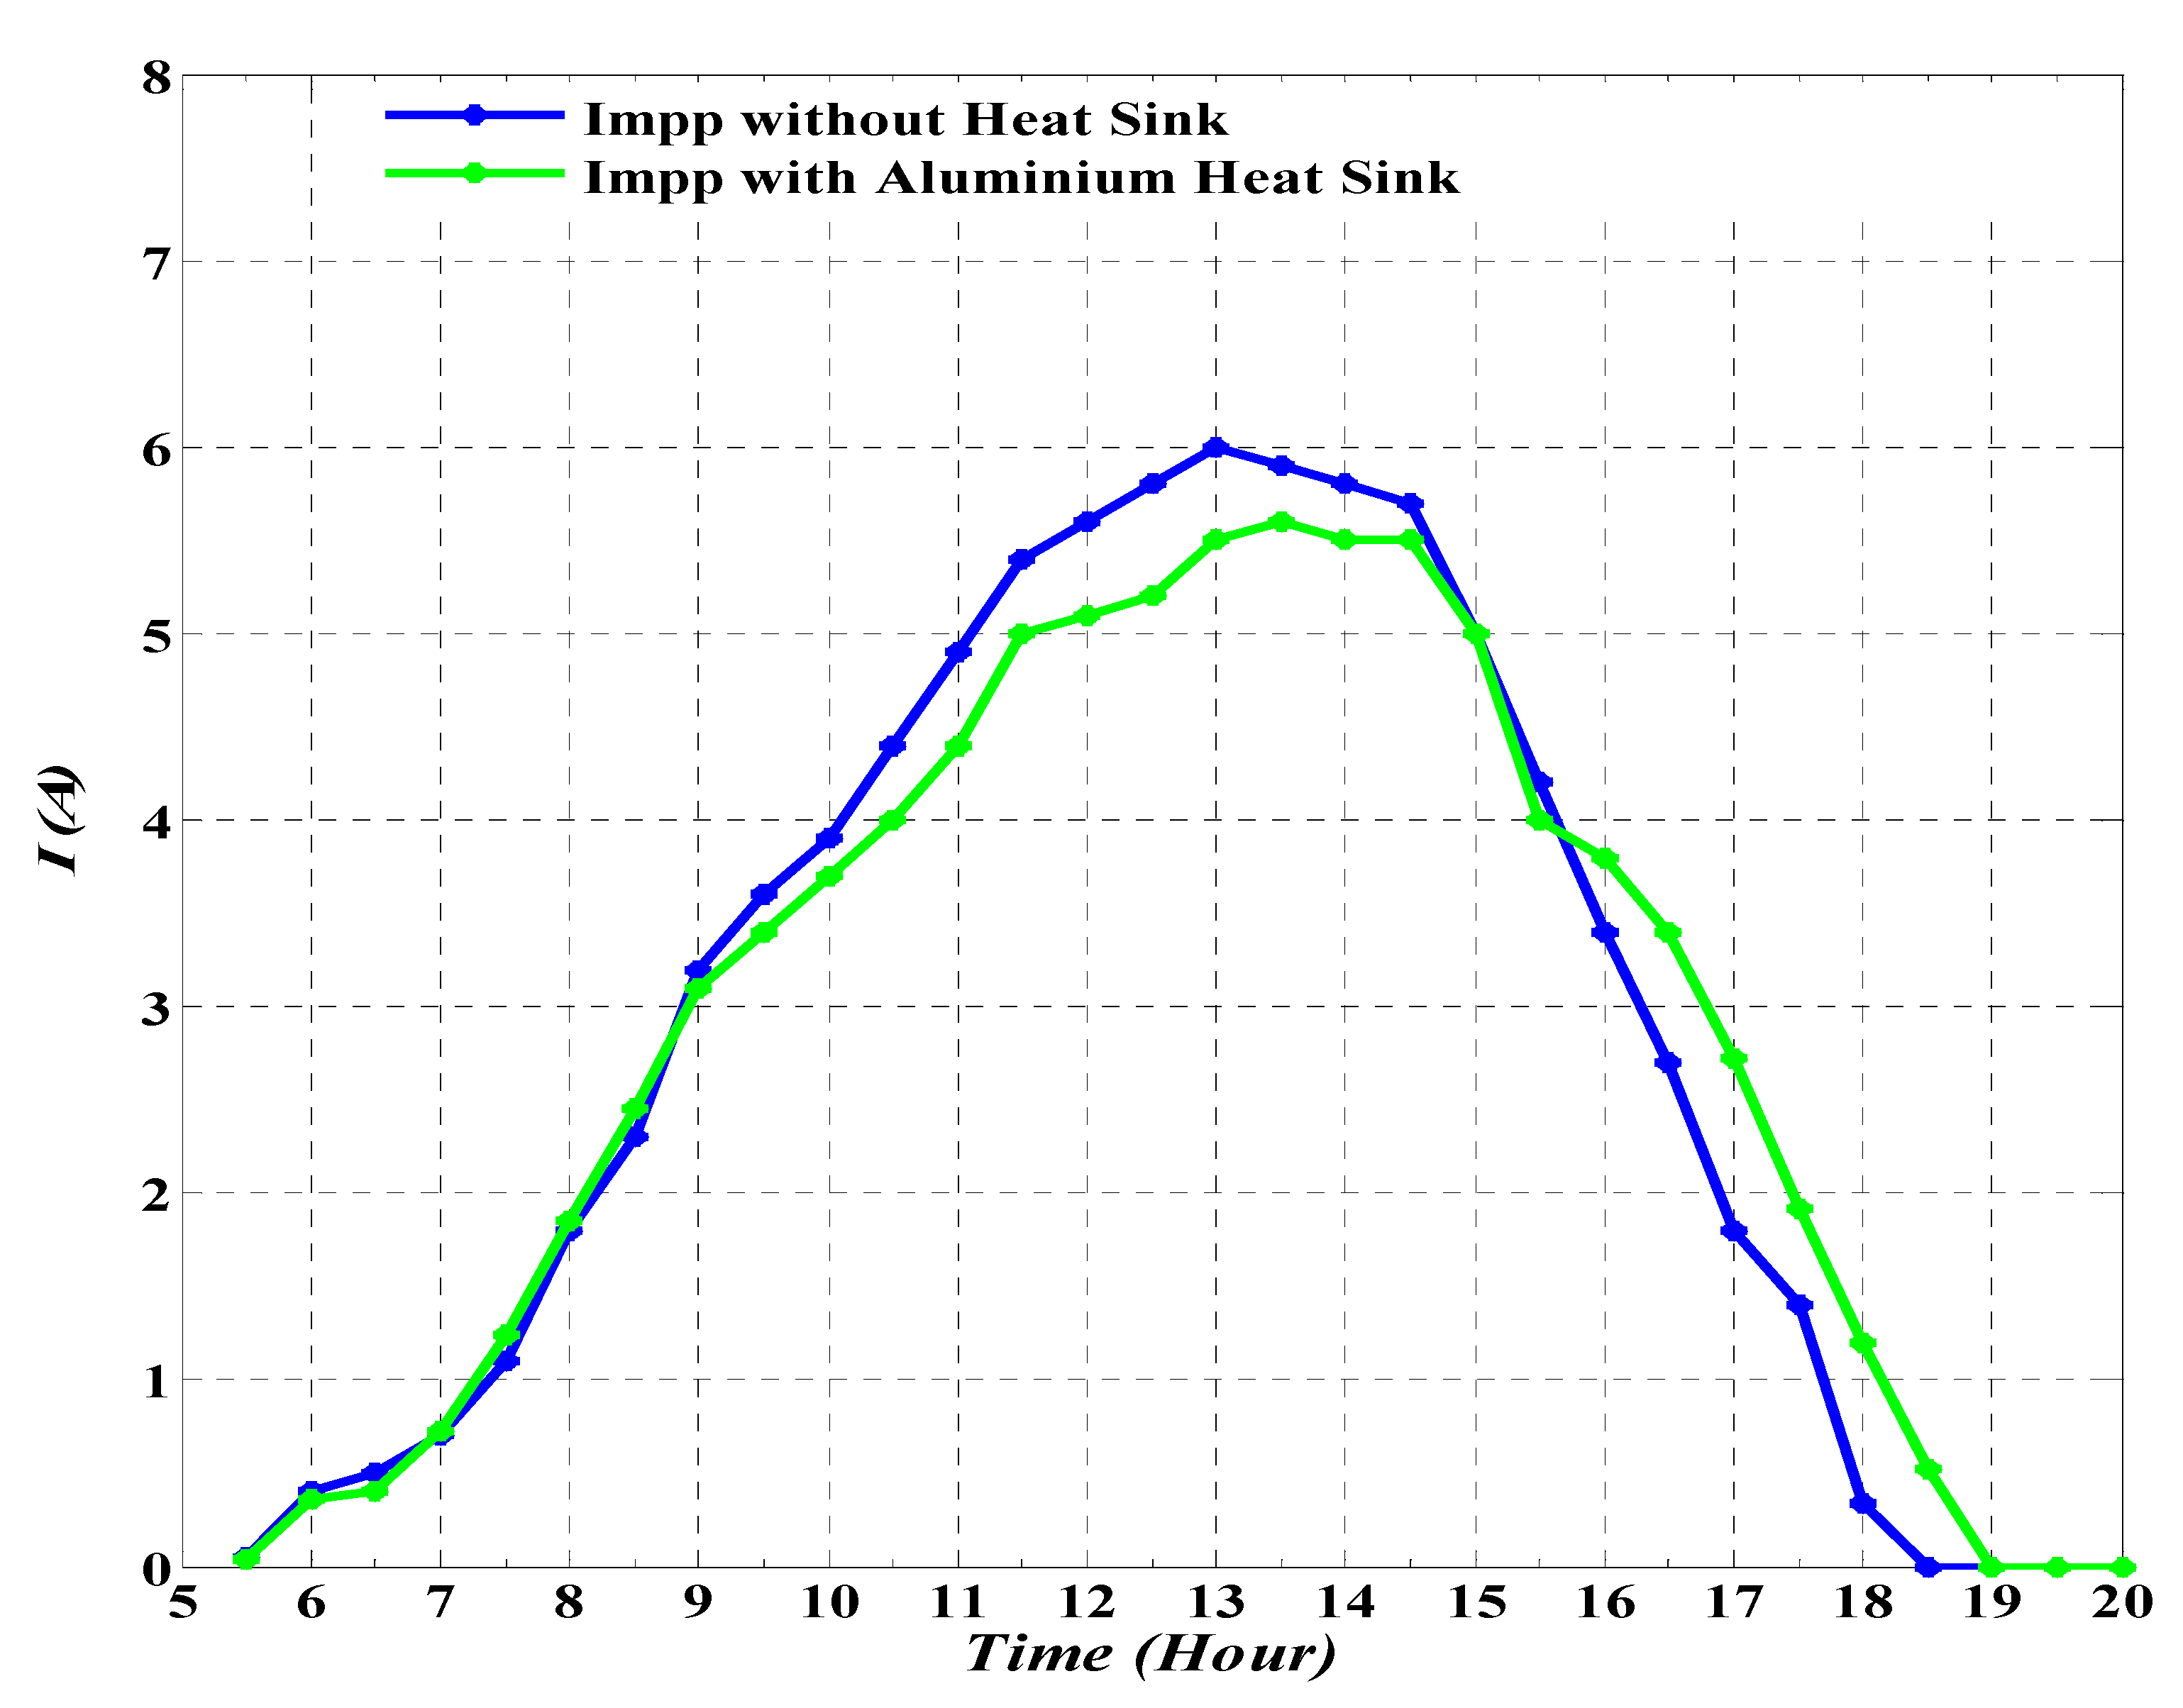
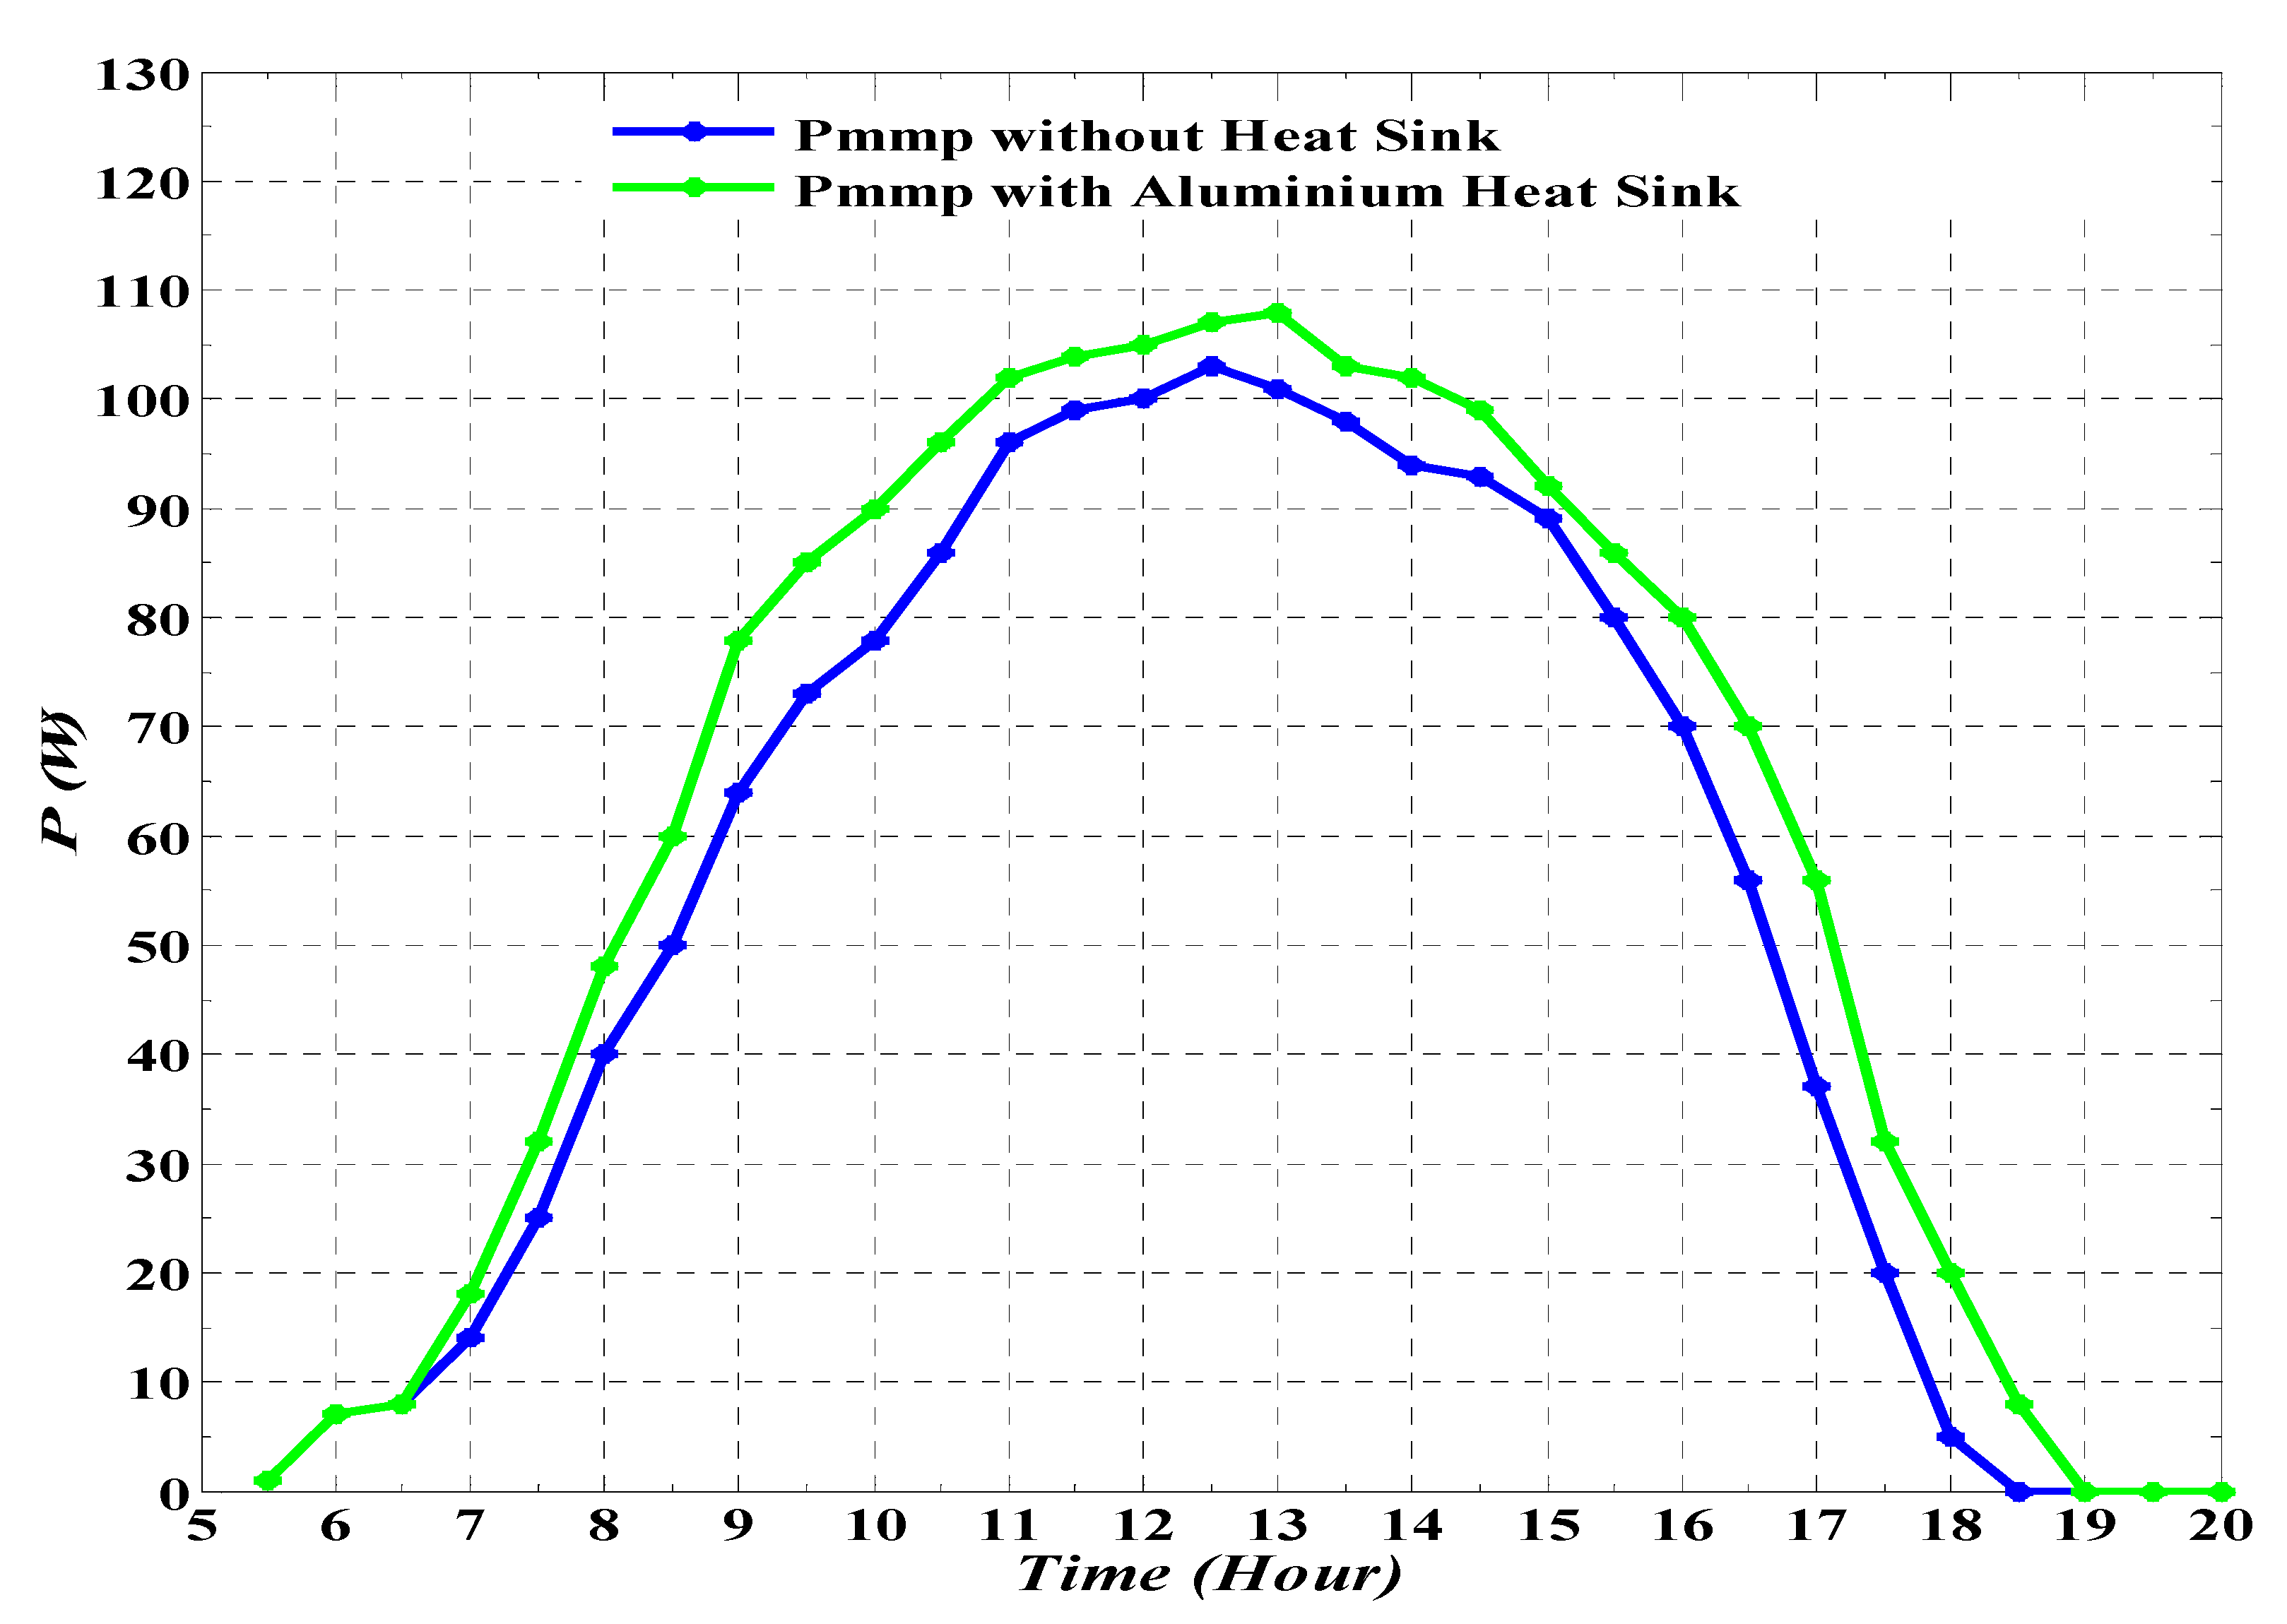
7.3. Comparison and Comments
8. Conclusions
Author Contributions
Funding
Acknowledgments
Conflicts of Interest
Nomenclature
| QC | Amount of energy inherited through the glass surface (Joule or W.h). | Rc | Contact thermal resistance (°C/W). |
| Qel | Useful energy is converted to electrical energy (Joule or W.h). | RHs | Lumped heat sink thermal resistance (°C/W). |
| Qth | Thermal energy losses (Joule or W.h). | Rfin | Fins thermal resistance (°C/W). |
| QfT | Total heat transfer rate from the heat sink surface (Joule or W.h). | Rfins | Lumped thermal resistance of total number of fins (°C/W). |
| Qfins | Heat transfer rate from the heat sink fins surface (Joule or W.h). | Rfa | Thermal resistance of the ambient air through the film (°C/W). |
| Qunfins | Heat transfer rate from the heat sink unfins surface (Joule or W.h). | Rbpb | Thermal resistance of the back heat sink base plate (°C/W). |
| Qr | Thermal energy rating that results from the air touching surfaces (Joule or W.h). | Rinr | Interface thermal denoted (°C/W). |
| αC | Cell absorptivity. | Rsp | Heat sink spread thermal resistance (°C/W). |
| λ | Thermal diffusivity (= 2.84 × 10⁻⁵ m2/s). | Rcd | Conduction thermal network resistance (°C/W). |
| τg | Glass transmissivity. | Rcv | Convection thermal network resistances (°C/W). |
| q | Electron charge (= 1.602 × 10⁻¹⁹ C). | Rr | Radiation thermal network resistance (°C/W). |
| ψav | Dimensionless spreading resistance | Rs | Series resistance of single diode solar cell (Ω). |
| Sr | Solar radiation (W/m2). | Rsh | Shunt resistance of single diode solar cell (Ω). |
| fp | Packing factor that refers to the area filled with solar cells from the total surface area. | ke | Thermal conductivity of the edge insulation [W/(m.K)]. |
| FF | Fill factor. | k | Thermal conductivity [W/(m.K)]. |
| g | Gravitational constant (= 9.81 m/s2). | ka | Thermal conductivity of the air (= 0.0291 [W/(m.K)]). |
| A | Surface area (m2). | Kr | Interface thermal conductivity [W/(m.K)]. |
| Ae | Edge area (m2). | KBZ | Boltzmann constant (= 1.3807 × 10⁻²³ J/K). |
| Af | Fin cross-sectional area (m2). | UL | Overall heat transfer coefficient. |
| Afv | Vehicle front area (m2). | Ut | Heat transfer coefficients of top. |
| Afins | Fins area of the heat sink (m2). | Ub | Heat transfer coefficients of the bottom. |
| Aunfins | Total unfins area of the heat sink (m2). | Ue | Heat transfer coefficients of the edges. |
| H | Heat sink height (m). | t | Thickness of any solar panel layer (mm). |
| W | Heat sink width (m). | tbp | Thickness of heat sink base plate (mm). |
| df | Spacing between two consequential fins (m). | tf | Thickness of heat sink fin (mm). |
| ηel | Eelectrical efficiency. | te | Edge insulation thickness (mm). |
| ηo | Nominal electrical efficiency | hr | Everall heat transfer coefficient. |
| ηth | Thermal efficiency. | hr | Radiation heat transfer coefficient. |
| ηfins | Efficiency of heat sink fins. | hcv | Convection heat transfer coefficient. |
| β | Temperature coefficient that relies on the material type (K−1). | hc | Surrounding air heat transfer coefficient due to convection |
| To | Solar cell temperature at the () Standard Test Conditions (°C or K). | hw | Convective heat transfer coefficient due to wind speed. |
| Ta | Average ambient temperature (°C or K). | CA | Air specific heat |
| TC | Solar cell temperature at the operating conditions (°C or K). | CD | Coefficient of aerodynamic drag which depends on vehicle brand and is in the range of 0.297. |
| TG | Glass temperature (°C or K). | Cg | Constant = 2.677 × 10⁴ for silicon. |
| Tb | Back sheet temperature (°C or K). | ce | Empirical constant in the range of 0.593. |
| Tc* | Cell temperature when the efficiency Approaching to zero (°C or K). | Eg | Bandgap energy that relies on the material type, Ego = 1.12 eV or 1.794 × 10⁻¹⁹ J. |
| Ts | Sky temperature (°C or K). | ɛr | Material emissivity of heat sink. |
| THs | Temperature of heat sink surface (°C or K). | ɛ | Emissivity coefficient of any solar panel layer. |
| Tm | Mean absorbed cell temperature (°C or K). | µ | Kinematic viscosity of the air (= 1.96 × 10⁻⁵ m2/s). |
| δ | Volumetric coefficient of expansion (K−1) | σ | Porosity hole area to solar panel area (= 5.67 × 10⁻⁸ J/K) |
| a | Diode ideality factor (1 ≤ a ≤ 2). | p | Perimeter of solar panel (m). |
| ρ | Density of the air (= 1.225 kg/m3). | pf | Fin perimeter (m). |
| Pmpp | Output power (W) that is tracked at the Maximum Power Point (MPP). | ωr | Resultant wind speed due to natural air and turbulence air (m/s). |
| Vmpp | Voltage of the PV source at the MPP (V). | ωs | Wind speed of natural air (m/s). |
| VOC | Voltage of the PV source at open circuit (V). | ωt | Wind speed of turbulence air (m/s). |
| Vpv | PV output voltage (V). | ωv | Vehicle average speed (m/s). |
| VT | Thermal voltage (V). | Lv | The scaled turbulence motion length (m). |
| Vd | Diode voltage (V). | Lch | Surface characteristic length of solar panel (m). |
| Impp | Current of the PV source at the MPP (A). | nv | Vehicles number per unit length. |
| ISC | Current of the PV source at short circuit (A). | Nf | Total number of fins. |
| Ipv | PV output current (A). | Nu | Nusselt number. |
| Id | Diode current (A). | Re | Reynold number. |
| IL | Light current (A). | Pr | Prandtl number. |
| Io | Reverse saturation current (A). | Ra | Rayleigh number. |
| mA | Air mass flow rate. | Gr | Grashoff number. |
| ζ | Reflection coefficient of the glass = 0.1. |
Appendix A
References
- Salam, M.A.; Khan, S. Transition towards sustainable energy production—A review of the progress for solar energy in Saudi Arabia. Energy Explor. Exploit. 2017, 36, 3–27. [Google Scholar] [CrossRef]
- El-Sebaii, A.A.; Al-Agel, F. Estimation of horizontal diffuse solar radiation from common meteorological parameters: A case study for Jeddah, Saudi Arabia. Int. J. Ambient. Energy 2013, 34, 92–99. [Google Scholar] [CrossRef]
- Ahmad, N.I.; Kadir, M.Z.A.; Izadi, M.N.H.; Zaini, M.A.; Radzi, M.; Azis, N. Effect of temperature on a poly-crystalline solar panel in large scale solar plants in Malaysia. In Proceedings of the IEEE Conference on Energy Conversion (CENCON), Johor Bahru, Malaysia, 19–20 October 2015; pp. 244–248. [Google Scholar] [CrossRef]
- Sabri, L.; Benzirar, M. Effect of Ambient Conditions on Thermal Properties of Photovoltaic Cells: Crystalline and Amorphous Silicon. Int. J. Innov. Res. Sci. Eng. Technol. 2014, 3, 17815–17821. [Google Scholar] [CrossRef]
- Sahri, A.; Toumi, S.; Ramenah, H.; Tanougast, C. Temperature effects on the power production based photovoltaic cells. In Proceedings of the 25th International Conference on Microelectronics (ICM), Beirut, Lebanon, 15–18 December 2013; pp. 1–4. [Google Scholar] [CrossRef]
- Elnozahy, A.; Rahman, A.K.A.; Ali, A.H.H.; Abdel-Salam, M.; Ookawara, S. Performance of a PV module integrated with standalone building in hot arid areas as enhanced by surface cooling and cleaning. Energy Build. 2015, 88, 100–109. [Google Scholar] [CrossRef]
- Elnozahy, A.; Rahman, A.K.A.; Ali, A.H.H.; Abdel-Salam, M.; Ookawara, S. Thermal/Electrical Modeling of a PV Module as Enhanced by Surface Cooling. J. Clean Energy Technol. 2015, 4, 1–7. [Google Scholar] [CrossRef] [Green Version]
- Røyne, A.; Dey, C.; Mills, D. Cooling of photovoltaic cells under concentrated illumination: A critical review. Sol. Energy Mater. Sol. Cells 2005, 86, 451–483. [Google Scholar] [CrossRef]
- Bahaidarah, H.M.S. Experimental performance investigation of uniform and non-uniform cooling techniques for photovoltaic systems. In Proceedings of the IEEE 42nd Photovoltaic Specialist Conference (PVSC), New Orleans, LA, USA, 14–19 June 2015; pp. 1–4. [Google Scholar] [CrossRef]
- Cazzaniga, R.; Rosa-Clot, M.; Rosa-Clot, P.; Tina, G.M. Floating tracking cooling concentrating (FTCC) systems. In Proceedings of the 38th IEEE Photovoltaic Specialists Conference, Austin, TX, USA, 3–8 June 2012; pp. 514–519. [Google Scholar] [CrossRef]
- Colţ, G. Performance evaluation of a PV panel by rear surface water active cooling. In Proceedings of the International Conference on Applied and Theoretical Electricity (ICATE), Craiova, Romania, 16–17 December 2016; pp. 1–5. [Google Scholar] [CrossRef]
- Sreejith, C.S.; Rajesh, P.; Unni, M.R. Experimental study on efficiency enhancement of PV systems with combined effect of cooling and maximum power point tracking. In Proceedings of the International Conference on Inventive Computation Technologies (ICICT), Coimbatore, India, 26–27 August 2016; pp. 1–5. [Google Scholar] [CrossRef]
- Adhya, D.; Bhattacharjee, S.; Acharya, S. Back surface cooling of photovoltaic panel—An experimental investigation. In Proceedings of the IEEE 6th International Conference on Power Systems (ICPS), New Delhi, India, 4–5 March 2016; pp. 1–6. [Google Scholar] [CrossRef]
- Sun, X.; Dubey, R.; Chattopadhyay, S.; Khan, M.R.; Chavali, R.V.; Silverman, T.J.; Kottantharayil, A.; Vasi, J.; Alam, M.A. A novel approach to thermal design of solar modules: Selective-spectral and radiative cooling. In Proceedings of the IEEE 43rd Photovoltaic Specialists Conference (PVSC), Portland, OR, USA, 5–10 June 2016; pp. 3584–3586. [Google Scholar] [CrossRef]
- Raina, G.; Thakur, N.S. Mathematical approach for optimizing heat sink for cooling of solar PV module. Int. J. Sci. Eng. Res. 2019 (IJSER) 2019, 7, 62–66. [Google Scholar]
- Soliman, A.M.; Hassan, H.; Ookawara, S. An experimental study of the performance of the solar cell with heat sink cooling system. Energy Procedia 2019, 162, 127–135. [Google Scholar] [CrossRef]
- Cuce, E.; Bali, T.; Sekucoglu, S.A. Effects of passive cooling on performance of silicon photovoltaic cells. Int. J. Low-Carbon Technol. 2011, 6, 299–308. [Google Scholar] [CrossRef] [Green Version]
- Popovici, C.G.; Hudișteanu, S.-V.; Mateescu, T.D.; Chereches, N.-C. Efficiency Improvement of Photovoltaic Panels by Using Air Cooled Heat Sinks. Energy Procedia 2016, 85, 425–432. [Google Scholar] [CrossRef] [Green Version]
- Hassan, I.A. Enhancement the Performance of PV Panel by Using Fins as Heat Sink. Eng. Technol. J. 2018, 36, 798–805. [Google Scholar]
- Arifin, Z.; Tjahjana, D.P.; Hadi, S.; Rachmanto, R.A.; Setyohandoko, G.; Sutanto, B. Numerical and Experimental Investigation of Air Cooling for Photovoltaic Panels Using Aluminum Heat Sinks. Int. J. Photoenergy 2020, 2020, 1–9. [Google Scholar] [CrossRef]
- Hassan, Y.; Orabi, M.; Ismeil, M.; Alshreef, A.; Al-Rabghi, O.M. Steady State Analysis of Solar Energy Transmitted to Solar Panel in Hot Weather Environment and Various Wind Speed. In Proceedings of the 2019 IEEE International Conference on Sustainable Energy Technologies and Systems (ICSETS), Bhubaneswar, India, 26 February–1 March 2019; pp. 36–44. [Google Scholar] [CrossRef]
- Seethamraju, S.; Ramamurthy, P.C.; Madras, G. Encapsulation for Improving the Efficiencies of Solar Cells; Materials and Processes for Solar Fuel Production 2014, Nanostructure Science and Technology Book Series; Springer: New York, NY, USA, 2014; Volume 174. [Google Scholar] [CrossRef]
- Hammami, M.; Torretti, S.; Grimaccia, F.; Grandi, G. Thermal and Performance Analysis of a Photovoltaic Module with an Integrated Energy Storage System. Appl. Sci. 2017, 7, 1107. [Google Scholar] [CrossRef] [Green Version]
- Hersel, P.; Zweibel, K. Basic Photovoltaic Principles and Methods; Solar Energy Research Institute: Golden, CO, USA, 1982.
- Ramsurn, H.; Gupta, R.B. Nanotechnology in Solar and Biofuels. ACS Sustain. Chem. Eng. 2013, 1, 779–797. [Google Scholar] [CrossRef]
- Dubey, S.; Sarvaiya, J.N.; Seshadri, B. Temperature Dependent Photovoltaic (PV) Efficiency and Its Effect on PV Production in the World—A Review. Energy Procedia 2013, 33, 311–321. [Google Scholar] [CrossRef] [Green Version]
- Anurag, A.; Zhang, J.; Gwamuri, J.; Pearce, J.M. General Design Procedures for Airport-Based Solar Photovoltaic Systems. Energies 2017, 10, 1194. [Google Scholar] [CrossRef] [Green Version]
- Bai, Y.; Chow, T.T.; Ménézo, C.; Dupeyrat, P.; Mé Né Zo, C. Analysis of a Hybrid PV/Thermal Solar-Assisted Heat Pump System for Sports Center Water Heating Application. Int. J. Photoenergy 2012, 2012, 1–13. [Google Scholar] [CrossRef] [Green Version]
- Teo, H.; Lee, P.-S.; Hawlader, M. An active cooling system for photovoltaic modules. Appl. Energy 2012, 90, 309–315. [Google Scholar] [CrossRef]
- Elsafi, A.M.; Gandhidasan, P. Comparative study of double-pass flat and compound parabolic concentrated photovoltaic–thermal systems with and without fins. Energy Convers. Manag. 2015, 98, 59–68. [Google Scholar] [CrossRef]
- Duffie, J.A.; Beckman, W.A. Solar Engineering of Thermal Processes, 2nd ed.; John Wiley & Sons: New York, NY, USA, 1991. [Google Scholar]
- Cengel, Y.A. Introduction to Thermodynamics and Heat Transfer, 2nd ed.; McGraw-Hill: New York, NY, USA, 2008. [Google Scholar]
- Alieva, Z.; Nosirov, M.; Mukhtarov, E. The thermal conductivity of solar-cell wafers molded from a powdered stock. Appl. Sol. Energy 2014, 50, 110–112. [Google Scholar] [CrossRef]
- Ngo, I.-L.; Jeon, S.; Byon, C. Thermal conductivity of transparent and flexible polymers containing fillers: A literature review. Int. J. Heat Mass Transf. 2016, 98, 219–226. [Google Scholar] [CrossRef]
- Chen, Y.; Zhuo, F.; Liu, X.; Xiong, L. Thermal modelling and performance assessment of PV modules based on climatic parameters. In Proceedings of the 2015 IEEE Energy Conversion Congress and Exposition (ECCE), Montreal, QC, Canada, 20–24 September 2015; pp. 3282–3286. [Google Scholar] [CrossRef]
- Kumar, S.; Mullick, S. Wind heat transfer coefficient in solar collectors in outdoor conditions. Sol. Energy 2010, 84, 956–963. [Google Scholar] [CrossRef]
- Kumar, A.M.; Balasubramanian, M. VAWT which makes use of the turbulent winds generated by the highway traffic. In Proceedings of the IACSIT International Journal of Engineering and Technology, Beijing, China, 16–17 June 2012; Volume 4. [Google Scholar]
- Devi, R.; Singh, J. Design and development of prototype highway lighting with road side wind energy harvester. Int. J. Sci. Res. 2014, 3, 1681–1683. [Google Scholar]
- Passmore, M.A. The Measurement and Analysis of Road Vehicle Drag Forces. Ph.D. Thesis, (Aeronautical and Automotive Engineering). Loughborough University, London, UK, 1990. Available online: https://dspace.lboro.ac.uk/2134/7038 (accessed on 1 January 1990).
- Abdulkareem, S.H.; Al-Obaidi, M.; Sun, L.C. Calculation and optimization of the aerodynamic drag of an open-wheel race car. In Proceedings of the 1st Engineering Undergraduate Research Catalyst Conference, Kuala Lumpur, Malaysia, 1–15 Auguest 2014. [Google Scholar]
- Tiwari, G.N.; Sahota, L. Advanced solar-distillation systems basic principles, thermal modeling and its application. In Green Energy and Technology; Springer Nature Singapore Pte Ltd.: New Delhi, India, 2017. [Google Scholar]
- Migan, G.A. Study the Operating Temperature of a PV Module; Project Report; MVK160 Heat and Mass Transfer: Lund, Sweden, 2013. [Google Scholar]
- Wenham, S.R.; Green, M.A.; Watt, M.E.; Corkish, R. Applied Photovoltaics, 2nd ed.; Earthscan: London, UK, 2006; pp. 33–83. [Google Scholar]
- Schwingshackl, C.; Petitta, M.; Wagner, J.E.; Belluardo, G.; Moser, D.; Castelli, M.; Zebisch, M.; Tetzlaff, A. Wind effect on PV module temperature: Analysis of different techniques for an accurate estimation. Energy Proc. 2013, 40, 77–86. [Google Scholar] [CrossRef] [Green Version]
- Skoplaki, E.; Boudouvis, A.G.; Palyvos, J.A. A simple correlation for the operating temperature of photovoltaic modules of arbitrary mounting. Sol. Energy Mater. Sol. C 2008, 92, 1393–1402. [Google Scholar] [CrossRef]
- Ciulla, G.; Brano, V.L.; Moreci, E. Forecasting the cell temperature of PV modules with an adaptive system. Int. J. Photoenergy 2013, 2013, 192854. [Google Scholar] [CrossRef]
- Azzouzi, M.; Popescu, D.; Bouchahdane, M. Modeling of electrical characteristics of photovoltaic cell considering single-diode model. J. Clean Energy Technol. 2016, 4, 414–420. [Google Scholar] [CrossRef]
- Rodrigues, E.M.; Melicio, R.; Mendes, V.M.; Catalao, J.P. Simulation of a solar cell considering single-diode equivalent circuit model. In Proceedings of the International Conference on Renewable Energies and Power Quality, Las Palmas de Gran Canaria, Spain, 13–15 April 2011. [Google Scholar]
- Masters, G.M. Renewable and Efficient Electric Power Systems; Wiley: Hoboken, NJ, USA, 2004. [Google Scholar]
- Sethi, V.P.; Sumathy, K.; Yuvarajan, S.; Pal, D.S. Mathematical model for computing maximum power output of a PV solar module and experimental validation. J. Fund. Renew. Energy Appl. 2012, 2, 1–5. [Google Scholar] [CrossRef]
- Culham, J.R.; Khan, W.; Yovanovich, M.; Muzychka, Y.S. The influence of material properties and spreading resistance in the thermal design of plate fin heat sinks. J. Electron. Packag. 2007, 129, 76–81. [Google Scholar] [CrossRef]
- Cucumo, M.; Ferraro, V.; Kaliakatsos, D. Theoretical and experimental analysis of the performances of a heat sink with vertical orientation in natural convection. Int. J. Energy Environ. Eng. 2017, 8, 247. [Google Scholar] [CrossRef] [Green Version]
- Guitart Corominas, J. Heat Sink Analytical Modelling; UPC, Universitat Politècnica de Catalunya BarcelonaTech: Barcelona, Spain, 2011. [Google Scholar]
- Song, S.; Lee, S.; Au, V. Closed-Form Equation for Thermal Constriction/Spreading Resistances with Variable Resistance Boundary Conditions. In Proceedings of the IEPS Conference, Atlanta, GA, USA, 11–15 July 1995; pp. 111–121. [Google Scholar]
- Werdowatz, A.R. Developing an Empirical Correlation for the Thermal Spreading Resistance of a Heat Sink. Master’s Thesis, San Jose State University, San Jose, CA, USA, 2016. Available online: http://scholarworks.sjsu.edu/etd_theses/4711 (accessed on 1 May 2016).
- Yovanovich, M.M.; Marotta, E.E. Thermal Spreading and Contact Resistances; Book Chapter, Heat Transfer Handbook; John Wiley: Hoboken, NJ, USA, 2003. [Google Scholar]
- Kraus, A.D.; Bar-Cohen, A. Design and Analysis of Heat Sinks; Wiley: New York, NY, USA, 1995. [Google Scholar]
- Aweda, J.O.; Adeyemi, M.B. Experimental determination of heat transfer coefficients during squeeze casting of aluminum. J. Mater. Process Technol. 2009, 209, 1477–1483. [Google Scholar] [CrossRef] [Green Version]
- Zell, E.; Gasim, S.; Wilcox, S.; Katamoura, S.; Stoffel, T.; Shibli, H.; Engel-Cox, J.; Al Subie, M. Assessment of solar radiation resources in Saudi Arabia. Sol. Energy 2015, 119, 422–438. [Google Scholar] [CrossRef] [Green Version]
- Almazroui, M.; Tayeb, O.; Mashat, A.S.; Yousef, A.; Al-Turki, Y.A.; Abid, M.A.; Bafail, A.O.; Ehsan, M.A.; Zahed, A.; Rahman, M.A.; et al. Saudi-KAU coupled global climate model: Description and performance. Earth Syst. Environ. 2017. [Google Scholar] [CrossRef] [Green Version]
- Rehman, S.; Alam, M.; Meyer, J.; Al-Hadhrami, L. Long-Term Wind Speed Trends over Saudi Arabia; King Fahd University of Petroleum and Minerals: Dhahran, Saudi Arabia, 2012. [Google Scholar] [CrossRef]
- The General Authority of Meteorology and Environment Protection, Saudi Arabia. Available online: https://www.pme.gov.sa/en/meteorology/pages/climatereport.aspx (accessed on 1 June 2018).


| Layer Material | t (mm) | k (W/(m.K)) | Τ | α | ɛ |
|---|---|---|---|---|---|
| Glass | 4 | 0.78 | 0.90 | 0.02 | 0.91 |
| Ethyl vinyl acetate (EVA) | 0.4 | 0.34 | 0.97 | 0.03 | 0.85 |
| Monocrystalline silicon | 0.4 | 158.726 | - | 1 | 0.67 |
| Polyethylene terephthalate (PET) | 0.5 | 0.15 | - | 1 | 0.85 |
| Silicon grease | 0.5 | 2.2 | - | - | - |
| Aluminum | 0.5 | 239 | - | - | 0.90 |
| Parameters of Solar Module | Values & Units |
|---|---|
| Brand/Cell type | BLT/Monocrystalline |
| Maximum Power | 250 W |
| Power tolerance range | ±3% |
| Module efficiency | 23.6% |
| Voltage at open circuit Vo.c | 36.7 V |
| Current at short circuit Is.c | 9 A |
| Maximum power voltage Vmp | 30.6 V |
| Maximum power current Imp | 8.17 A |
| Normal operating cell temperature (NOCT) | 45 ± 2 °C |
| Temperature Coefficient of Vo.c | −0.32%/°C |
| Geometric (Length × Width × Hight) | 1646 × 990 × 45 mm |
| nC (number of solar cells in series) | 60 |
| αC | 0.9 |
| τg | 0.95 |
| fp | 0.9 |
| Weather Parameters | Values & Units |
|---|---|
| Latitude | 21.49604° |
| Longitude | 39.24492° |
| Elevation | 75 m |
| Sr | 672 W/m2 |
| ωs | 4–7 m/s |
| ωt | 0–11 m/s |
| ωr | 4–18 m/s |
| Ta | 315 K |
| Parameters of the Heat Sink | Values & Units |
|---|---|
| L | 1646 mm |
| W | 990 mm |
| H | 40 mm |
| tbp | 0.5 mm |
| tf | 1.5 mm |
| df | 25 mm |
| N | 36 |
| Material | Aluminum 6101-T6 |
| Aluminum composition in Alloy | 97% |
| Density | 2.70 g/cc |
| Specific Heat Capacity | 0.895 J/g-°C |
| Thermal Conductivity | 239 W/m-K |
| Thermal resistance at natural convection | 0.56 °C/W |
| Thermal resistance at forced convection | 0.088 °C/W |
| Shear Strength | 138 MPa |
| Ultimate Tensile Strength | 221 MPa |
| ωr (m/s) | TG (K) | TEVAg (K) | TC (K) | TEVAb (K) | Tb (K) |
|---|---|---|---|---|---|
| 1 | 338.88 | 340.69 | 341.11 | 340.69 | 339.50 |
| 2 | 327.76 | 329.09 | 329.39 | 329.07 | 328.15 |
| 3 | 323.68 | 324.82 | 325.08 | 324.79 | 323.96 |
| 4 | 321.51 | 322.54 | 322.78 | 322.51 | 321.73 |
| 5 | 320.16 | 321.12 | 321.33 | 321.07 | 320.32 |
| 6 | 319.23 | 320.13 | 320.33 | 320.08 | 319.35 |
| 7 | 318.55 | 319.40 | 319.59 | 319.34 | 318.63 |
| 8 | 318.04 | 318.84 | 319.02 | 318.78 | 318.07 |
| 9 | 317.63 | 318.39 | 318.57 | 318.32 | 317.63 |
| 10 | 317.29 | 318.03 | 318.20 | 317.96 | 317.26 |
| 11 | 317.02 | 317.73 | 317.89 | 317.65 | 316.96 |
| 12 | 316.79 | 317.47 | 317.63 | 317.39 | 316.70 |
| 13 | 316.60 | 317.25 | 317.40 | 317.16 | 316.48 |
| 14 | 316.43 | 317.06 | 317.21 | 316.97 | 316.29 |
| 15 | 316.28 | 316.89 | 317.03 | 316.79 | 316.12 |
| ωr (m/s) | hw (W/m2.K) | hrg (W/m2.K) | hrb (W/m2.K) | Ut (W/K) | Ub (W/m2.K) | Ue (W/m2.K) | ηel% |
|---|---|---|---|---|---|---|---|
| 1 | 5.50 | 9.27 | 7.98 | 13.51 | 12.71 | 0.08 | 12.74 |
| 2 | 9.58 | 10.68 | 8.58 | 17.97 | 16.79 | 0.08 | 13.47 |
| 3 | 13.25 | 12.35 | 9.30 | 22.05 | 20.47 | 0.08 | 13.73 |
| 4 | 16.68 | 14.15 | 10.02 | 25.82 | 23.83 | 0.08 | 13.87 |
| 5 | 19.94 | 16.07 | 10.72 | 29.35 | 26.94 | 0.08 | 13.96 |
| 6 | 23.07 | 18.12 | 11.40 | 32.70 | 29.84 | 0.08 | 14.02 |
| 7 | 26.10 | 20.31 | 12.06 | 35.90 | 32.56 | 0.07 | 14.07 |
| 8 | 29.05 | 22.64 | 12.70 | 38.98 | 35.13 | 0.07 | 14.10 |
| 9 | 31.92 | 25.14 | 13.33 | 41.96 | 37.57 | 0.07 | 14.13 |
| 10 | 34.72 | 27.81 | 13.94 | 44.85 | 39.90 | 0.07 | 14.16 |
| 11 | 37.47 | 30.68 | 14.53 | 47.67 | 42.12 | 0.07 | 14.17 |
| 12 | 40.17 | 33.77 | 15.11 | 50.43 | 44.25 | 0.07 | 14.19 |
| 13 | 42.83 | 37.09 | 15.69 | 53.14 | 46.30 | 0.07 | 14.20 |
| 14 | 45.45 | 40.68 | 16.25 | 55.82 | 48.26 | 0.07 | 14.22 |
| 15 | 48.03 | 44.55 | 16.80 | 58.46 | 50.16 | 0.07 | 14.23 |
| ωr (m/s) | Qel (W) | Qt (W) | Qb (W) | Qe (W) | Q (W) |
|---|---|---|---|---|---|
| 1 | 112.63 | 430.87 | 436.25 | 2.20 | 981.95 |
| 2 | 119.01 | 417.49 | 444.22 | 1.23 | 981.95 |
| 3 | 121.36 | 406.89 | 452.84 | 0.87 | 981.95 |
| 4 | 122.61 | 397.43 | 461.24 | 0.68 | 981.95 |
| 5 | 123.40 | 388.65 | 469.35 | 0.56 | 981.95 |
| 6 | 123.94 | 380.35 | 477.19 | 0.48 | 981.95 |
| 7 | 124.34 | 372.42 | 484.78 | 0.42 | 981.95 |
| 8 | 124.65 | 364.78 | 492.15 | 0.37 | 981.95 |
| 9 | 124.90 | 357.39 | 499.33 | 0.33 | 981.95 |
| 10 | 125.10 | 350.21 | 506.34 | 0.30 | 981.95 |
| 11 | 125.27 | 343.22 | 513.19 | 0.28 | 981.95 |
| 12 | 125.41 | 336.39 | 519.89 | 0.26 | 981.95 |
| 13 | 125.54 | 329.71 | 526.46 | 0.24 | 981.95 |
| 14 | 125.64 | 323.17 | 532.91 | 0.22 | 981.95 |
| 15 | 125.74 | 316.76 | 539.25 | 0.21 | 981.95 |
| ωr (m/s) | Voc (V) | Vmpp (V) | Isc (A) | Impp (A) | Pmpp (W) | FF | ηel% |
|---|---|---|---|---|---|---|---|
| 1 | 31.52 | 24.47 | 7.72 | 4.58 | 112.07 | 0.46 | 12.68 |
| 2 | 32.89 | 27.57 | 7.68 | 4.30 | 118.46 | 0.47 | 13.40 |
| 3 | 33.40 | 28.69 | 7.66 | 4.21 | 120.81 | 0.47 | 13.67 |
| 4 | 33.67 | 29.26 | 7.65 | 4.17 | 122.06 | 0.47 | 13.81 |
| 5 | 33.84 | 29.61 | 7.65 | 4.15 | 122.85 | 0.47 | 13.90 |
| 6 | 33.96 | 29.83 | 7.64 | 4.14 | 123.39 | 0.48 | 13.96 |
| 7 | 34.05 | 29.99 | 7.64 | 4.13 | 123.80 | 0.48 | 14.01 |
| 8 | 34.11 | 30.10 | 7.64 | 4.12 | 124.11 | 0.48 | 14.04 |
| 9 | 34.17 | 30.18 | 7.64 | 4.12 | 124.35 | 0.48 | 14.07 |
| 10 | 34.21 | 30.23 | 7.64 | 4.12 | 124.56 | 0.48 | 14.09 |
| 11 | 34.25 | 30.27 | 7.63 | 4.12 | 124.72 | 0.48 | 14.11 |
| 12 | 34.28 | 30.29 | 7.63 | 4.12 | 124.87 | 0.48 | 14.13 |
| 13 | 34.30 | 30.31 | 7.63 | 4.12 | 124.99 | 0.48 | 14.14 |
| 14 | 34.33 | 30.31 | 7.63 | 4.13 | 125.10 | 0.48 | 14.16 |
| 15 | 34.35 | 30.31 | 7.63 | 4.13 | 125.19 | 0.48 | 14.17 |
| Parameters of the Thermal Grease | Values & Units |
|---|---|
| Brand | GD380 Thermal Paste |
| Colour | Gray |
| Specific gravity | 2.5 G/Cc |
| Thermal conductivity | 2.2 W/m.K |
| Operating temperature | −50~200 °C |
| ωr (m/s) | TG (K) | TEVAg (K) | TC (K) | TEVAb (K) | Tb (K) | THs (K) |
|---|---|---|---|---|---|---|
| 1 | 328.61 | 329.97 | 330.29 | 330.09 | 329.55 | 329.55 |
| 2 | 321.99 | 323.05 | 323.29 | 323.10 | 322.57 | 322.57 |
| 3 | 319.57 | 320.49 | 320.70 | 320.51 | 319.98 | 319.98 |
| 4 | 318.30 | 319.12 | 319.31 | 319.13 | 318.60 | 318.60 |
| 5 | 317.51 | 318.27 | 318.44 | 318.25 | 317.72 | 317.72 |
| 6 | 316.97 | 317.68 | 317.84 | 317.65 | 317.12 | 317.12 |
| 7 | 316.59 | 317.24 | 317.39 | 317.20 | 316.67 | 316.67 |
| 8 | 316.29 | 316.91 | 317.05 | 316.86 | 316.32 | 316.32 |
| 9 | 316.07 | 316.64 | 316.77 | 316.58 | 316.04 | 316.04 |
| 10 | 315.88 | 316.42 | 316.55 | 316.36 | 315.82 | 315.82 |
| 11 | 315.73 | 316.24 | 316.36 | 316.17 | 315.63 | 315.63 |
| 12 | 315.61 | 316.09 | 316.20 | 316.01 | 315.47 | 315.47 |
| 13 | 315.51 | 315.96 | 316.06 | 315.87 | 315.33 | 315.33 |
| 14 | 315.42 | 315.85 | 315.94 | 315.75 | 315.20 | 315.20 |
| 15 | 315.35 | 315.75 | 315.84 | 315.65 | 315.10 | 315.10 |
| ωr (m/s) | hw (W/m2.K) | hrg (W/m2.K) | hrHs (W/m2.K) | Ut (W/K) | UHs (W/m2.K) | Ue (W/m2.K) | ηel% |
|---|---|---|---|---|---|---|---|
| 1 | 9.06 | 10.47 | 0.89 | 17.39 | 9.48 | 0.08 | 13.41 |
| 2 | 15.78 | 13.66 | 1.03 | 24.82 | 15.51 | 0.08 | 13.84 |
| 3 | 21.82 | 17.28 | 1.16 | 31.37 | 20.62 | 0.08 | 14.00 |
| 4 | 27.47 | 21.36 | 1.28 | 37.34 | 25.15 | 0.07 | 14.09 |
| 5 | 32.84 | 25.99 | 1.40 | 42.91 | 29.24 | 0.07 | 14.14 |
| 6 | 37.99 | 31.25 | 1.50 | 48.20 | 33.00 | 0.07 | 14.18 |
| 7 | 42.98 | 37.28 | 1.61 | 53.29 | 36.48 | 0.07 | 14.21 |
| 8 | 47.82 | 44.24 | 1.71 | 58.25 | 39.73 | 0.07 | 14.23 |
| 9 | 52.55 | 52.31 | 1.81 | 63.13 | 42.77 | 0.07 | 14.24 |
| 10 | 57.17 | 61.76 | 1.90 | 67.97 | 45.64 | 0.07 | 14.26 |
| 11 | 61.70 | 72.94 | 1.99 | 72.82 | 48.35 | 0.07 | 14.27 |
| 12 | 66.15 | 86.32 | 2.08 | 77.74 | 50.92 | 0.07 | 14.28 |
| 13 | 70.52 | 102.56 | 2.17 | 82.77 | 53.36 | 0.07 | 14.29 |
| 14 | 74.83 | 122.62 | 2.25 | 87.96 | 55.69 | 0.07 | 14.29 |
| 15 | 79.08 | 147.93 | 2.33 | 93.37 | 57.92 | 0.07 | 14.30 |
| ωr (m/s) | Qel (W) | Qt (W) | QHs (W) | Qe (W) | Q (W) |
|---|---|---|---|---|---|
| 1 | 118.52 | 252.90 | 609.22 | 1.31 | 981.95 |
| 2 | 122.33 | 213.30 | 645.60 | 0.73 | 981.95 |
| 3 | 123.74 | 192.10 | 665.61 | 0.51 | 981.95 |
| 4 | 124.50 | 176.92 | 680.14 | 0.40 | 981.95 |
| 5 | 124.97 | 164.72 | 691.94 | 0.33 | 981.95 |
| 6 | 125.30 | 154.33 | 702.05 | 0.28 | 981.95 |
| 7 | 125.54 | 145.17 | 711.00 | 0.24 | 981.95 |
| 8 | 125.73 | 136.92 | 719.09 | 0.21 | 981.95 |
| 9 | 125.88 | 129.38 | 726.50 | 0.19 | 981.95 |
| 10 | 126.00 | 122.41 | 733.37 | 0.18 | 981.95 |
| 11 | 126.10 | 115.91 | 739.77 | 0.16 | 981.95 |
| 12 | 126.19 | 109.83 | 745.79 | 0.15 | 981.95 |
| 13 | 126.27 | 104.09 | 751.45 | 0.14 | 981.95 |
| 14 | 126.33 | 98.67 | 756.82 | 0.13 | 981.95 |
| 15 | 126.39 | 93.52 | 761.92 | 0.12 | 981.95 |
| ωr (m/s) | Voc (V) | Vmpp (V) | Isc (A) | Impp (A) | Pmpp (W) | FF | ηel% |
|---|---|---|---|---|---|---|---|
| 1 | 32.91 | 27.65 | 7.67 | 4.29 | 118.52 | 0.47 | 13.41 |
| 2 | 33.73 | 29.48 | 7.65 | 4.15 | 122.33 | 0.47 | 13.84 |
| 3 | 34.03 | 30.13 | 7.64 | 4.11 | 123.74 | 0.48 | 14.00 |
| 4 | 34.20 | 30.46 | 7.64 | 4.09 | 124.50 | 0.48 | 14.09 |
| 5 | 34.30 | 30.65 | 7.63 | 4.08 | 124.97 | 0.48 | 14.14 |
| 6 | 34.37 | 30.77 | 7.63 | 4.07 | 125.30 | 0.48 | 14.18 |
| 7 | 34.42 | 30.85 | 7.63 | 4.07 | 125.54 | 0.48 | 14.21 |
| 8 | 34.46 | 30.90 | 7.63 | 4.07 | 125.73 | 0.48 | 14.23 |
| 9 | 34.50 | 30.93 | 7.63 | 4.07 | 125.88 | 0.48 | 14.24 |
| 10 | 34.52 | 30.94 | 7.63 | 4.07 | 126.00 | 0.48 | 14.26 |
| 11 | 34.54 | 30.95 | 7.63 | 4.07 | 126.10 | 0.48 | 14.27 |
| 12 | 34.56 | 30.95 | 7.62 | 4.08 | 126.19 | 0.48 | 14.28 |
| 13 | 34.58 | 30.94 | 7.62 | 4.08 | 126.27 | 0.48 | 14.29 |
| 14 | 34.59 | 30.92 | 7.62 | 4.09 | 126.33 | 0.48 | 14.29 |
| 15 | 34.60 | 30.90 | 7.62 | 4.09 | 126.39 | 0.48 | 14.30 |
| Time (h) | Ta (°C) | TSFS (°C) | TSBS (°C) | Voc (V) | Vmpp (V) | Impp (A) | Pmpp (W) |
|---|---|---|---|---|---|---|---|
| 05:30 a.m. | 28 | 28 | 28 | 21.1 | 21.1 | 0.05 | 1 |
| 06:00 a.m. | 28.5 | 29 | 28.8 | 28.2 | 17.7 | 0.4 | 7 |
| 06:30 a.m. | 28.5 | 29.6 | 29.4 | 29.9 | 17.9 | 0.5 | 8 |
| 07:00 a.m. | 29 | 31 | 30.3 | 31.3 | 21.2 | 0.7 | 14 |
| 07:30 a.m. | 30.5 | 33.4 | 32.6 | 32.3 | 24.5 | 1.1 | 25 |
| 08:00 a.m. | 32.5 | 33.5 | 33 | 32.8 | 23.6 | 1.8 | 40 |
| 08:30 a.m. | 34.5 | 38 | 37 | 33 | 23 | 2.3 | 50 |
| 09:00 a.m. | 37 | 41.2 | 39.6 | 32.8 | 21.6 | 3.2 | 64 |
| 09:30 a.m. | 38 | 43.5 | 42 | 31.7 | 21 | 3.6 | 73 |
| 10:00 a.m. | 38.5 | 44 | 42.5 | 30.6 | 20.9 | 3.9 | 78 |
| 10:30 a.m. | 39 | 46.1 | 44.6 | 30.4 | 20.3 | 4.4 | 86 |
| 11:00 a.m. | 39.5 | 48 | 46 | 30.2 | 20 | 4.9 | 96 |
| 11:30 a.m. | 40 | 49.3 | 47 | 30 | 18.7 | 5.4 | 99 |
| 12:00 p.m. | 41 | 49.5 | 47.2 | 29.8 | 18.3 | 5.6 | 100 |
| 12:30 p.m. | 41.3 | 49.6 | 47.3 | 29.6 | 18 | 5.8 | 103 |
| 01:00 p.m. | 41.6 | 49.7 | 47.5 | 29.4 | 17.6 | 6 | 101 |
| 01:30 p.m. | 41.8 | 50.1 | 48 | 29 | 17.5 | 5.9 | 98 |
| 02:00 p.m. | 42.4 | 50.9 | 48.7 | 28.4 | 17.4 | 5.8 | 94 |
| 02:30 p.m. | 42 | 50.2 | 48.5 | 28.6 | 17.1 | 5.7 | 93 |
| 03:00 p.m. | 40.2 | 49 | 47 | 29.6 | 18.8 | 5 | 89 |
| 03:30 p.m. | 40.5 | 48 | 46.5 | 30.2 | 20.1 | 4.2 | 80 |
| 04:00 p.m. | 39.5 | 46.5 | 45.2 | 31 | 21.6 | 3.4 | 70 |
| 04:30 p.m. | 39 | 45 | 43.6 | 31.4 | 22.4 | 2.7 | 56 |
| 05:00 p.m. | 38.5 | 43 | 41.5 | 31.8 | 22.8 | 1.8 | 37 |
| 05:30 p.m. | 38 | 42 | 41 | 32 | 18.6 | 1.4 | 20 |
| 06:00 p.m. | 37 | 40.5 | 36.5 | 28.5 | 17.8 | 0.34 | 5 |
| 06:30 p.m. | 35.2 | 38 | 35.5 | 26.4 | 0 | 0 | 0 |
| 07:00 p.m. | 31 | 32 | 30.5 | 24 | 0 | 0 | 0 |
| 07:30 p.m. | 28 | 30 | 30 | 1.5 | 0 | 0 | 0 |
| 08:00 p.m. | 28 | 28.5 | 28.5 | 1.5 | 0 | 0 | 0 |
| Time (hr.) | Ta (°C) | TSFS (°C) | THSS (°C) | Voc (V) | Vmpp (V) | Impp (A) | Pmpp (W) |
|---|---|---|---|---|---|---|---|
| 05:30 a.m. | 28 | 28 | 28 | 21.1 | 21.1 | 0.04 | 1 |
| 06:00 a.m. | 28.5 | 29 | 28.5 | 28.2 | 17.3 | 0.36 | 7 |
| 06:30 a.m. | 28.5 | 29.6 | 29.4 | 29.9 | 17.9 | 0.4 | 8 |
| 07:00 a.m. | 29 | 30.8 | 29.8 | 31.3 | 21.2 | 0.72 | 18 |
| 07:30 a.m. | 30.5 | 33 | 31 | 32.3 | 26.7 | 1.24 | 32 |
| 08:00 a.m. | 32.5 | 33.5 | 32.7 | 33.8 | 26.7 | 1.85 | 48 |
| 08:30 a.m. | 34.5 | 37 | 35 | 34.5 | 26.5 | 2.45 | 60 |
| 09:00 a.m. | 37 | 40 | 38 | 34.2 | 26 | 3.1 | 78 |
| 09:30 a.m. | 38 | 42.5 | 39 | 33.8 | 25.6 | 3.4 | 85 |
| 10:00 a.m. | 38.5 | 43 | 39.5 | 33.7 | 25.2 | 3.7 | 90 |
| 10:30 a.m. | 39 | 44.1 | 39.8 | 33.4 | 25 | 4 | 96 |
| 11:00 a.m. | 39.5 | 47 | 40.2 | 33.2 | 24 | 4.4 | 102 |
| 11:30 a.m. | 40 | 47.3 | 40.8 | 33 | 22 | 5 | 104 |
| 12:00 p.m. | 41 | 47.5 | 41.5 | 32.8 | 21.8 | 5.1 | 105 |
| 12:30 p.m. | 41.3 | 47.6 | 41.8 | 32.6 | 21.4 | 5.2 | 107 |
| 01:00 p.m. | 41.6 | 47.6 | 42 | 32.4 | 20.4 | 5.5 | 108 |
| 01:30 p.m. | 41.8 | 48 | 42.2 | 31 | 20 | 5.6 | 103 |
| 02:00 p.m. | 42.4 | 48.2 | 42.6 | 30.8 | 20 | 5.5 | 102 |
| 02:30 p.m. | 42 | 47.8 | 42.4 | 30.6 | 19.8 | 5.5 | 99 |
| 03:00 p.m. | 40.2 | 47 | 40.5 | 30.4 | 19.4 | 5 | 92 |
| 03:30 p.m. | 40.5 | 45.5 | 40.2 | 30.2 | 22.8 | 4 | 86 |
| 04:00 p.m. | 39.5 | 44 | 40 | 32.5 | 22.4 | 3.8 | 80 |
| 04:30 p.m. | 39 | 43 | 40 | 32.8 | 22.2 | 3.4 | 70 |
| 05:00 p.m. | 38.5 | 42.6 | 39.6 | 33.8 | 22 | 2.72 | 56 |
| 05:30 p.m. | 38 | 42 | 38.5 | 34 | 18.8 | 1.92 | 32 |
| 06:00 p.m. | 37 | 40.5 | 37.8 | 29.5 | 18.5 | 1.2 | 20 |
| 06:30 p.m. | 35.2 | 38 | 35.5 | 28.5 | 17.8 | 0.52 | 8 |
| 07:00 p.m. | 31 | 35 | 31 | 26 | 0 | 0 | 0 |
| 07:30 p.m. | 28 | 30 | 28 | 1.5 | 0 | 0 | 0 |
| 08:00 p.m. | 28 | 28 | 28 | 1.5 | 0 | 0 | 0 |
© 2020 by the authors. Licensee MDPI, Basel, Switzerland. This article is an open access article distributed under the terms and conditions of the Creative Commons Attribution (CC BY) license (http://creativecommons.org/licenses/by/4.0/).
Share and Cite
Hassan, Y.; Orabi, M.; Alshreef, A.; M. Al-Rabghi, O.; Habeebullah, B.A.; El Aroudi, A.; A. Ismeil, M. Improvement of Extracted Power of Pole Mounted Solar Panels by Effective Cooling Using Aluminum Heat Sink under Hot Weather and Variable Wind Speed Conditions. Energies 2020, 13, 3159. https://0-doi-org.brum.beds.ac.uk/10.3390/en13123159
Hassan Y, Orabi M, Alshreef A, M. Al-Rabghi O, Habeebullah BA, El Aroudi A, A. Ismeil M. Improvement of Extracted Power of Pole Mounted Solar Panels by Effective Cooling Using Aluminum Heat Sink under Hot Weather and Variable Wind Speed Conditions. Energies. 2020; 13(12):3159. https://0-doi-org.brum.beds.ac.uk/10.3390/en13123159
Chicago/Turabian StyleHassan, Youssef, Mohamed Orabi, Abdulaziz Alshreef, Omar M. Al-Rabghi, Badr A. Habeebullah, Abdelali El Aroudi, and Mohamed A. Ismeil. 2020. "Improvement of Extracted Power of Pole Mounted Solar Panels by Effective Cooling Using Aluminum Heat Sink under Hot Weather and Variable Wind Speed Conditions" Energies 13, no. 12: 3159. https://0-doi-org.brum.beds.ac.uk/10.3390/en13123159