1. Introduction
The building sector plays a pivotal role in contributing to the sustainability of cities [
1,
2]. To deal with this challenging task, focused actions should be designed to enhance the energy efficiency of urban areas as well as to diminish the dependency on fossil sources [
3]. Under this background, distributed renewable energy generation technologies, especially those integrated in buildings and exploiting renewable energy sources, are recognized as a promising pathway toward sustainability of urban areas [
4,
5,
6].
Prior to the integration of distributed energy production systems, consumers were merely identified as passive entities with a certain energy demand to be satisfied. Now, in their modern role of prosumers, they do not only consume energy, they also produce and store it. According to actual regulations of most countries, prosumers use the autonomously produced energy to satisfy their own energy demands and, subsequently, they release the remaining part to the national grid. Despite the central role of the grid in managing the energy produced by prosumers, this configuration is gradually changing in favor of a more independent distribution pattern for which the production is directly exchanged among the prosumers themselves, thus bypassing the grid. These features pave the way for the definition of energy distribution networks, for which the importance of the interactions among neighboring buildings has been widely acknowledged in the literature [
7,
8,
9]. The topic of energy distribution networks is attracting considerable research, ranging from either the optimal choice and insertion of the distributed generation technologies within the urban context [
10,
11,
12,
13] or the optimal design and operation [
14,
15,
16,
17,
18] to management and control issues [
19,
20,
21,
22]. Some of these studies also consider the rising impact of the role of prosumers on the traditional grid management [
13,
15,
23,
24,
25,
26,
27].
The diffusion of renewable energy production systems, however, encounters the main barrier of the intermittent nature of production [
28]. As a consequence, the satisfaction of the energy demands of end-users and the distribution of energy within the network may not be completely ensured. To provide a cost-effective solution to this variability, many studies tackle the integration of Energy Storage Systems (EES) to renewable sources [
29,
30,
31,
32]. As a matter of fact, storages allow energy distribution during peak hours or, generally, when the production from renewables does not cover the energy needs of the network. Moreover, beyond a higher energy reliability, storages also guarantee the enhancement of energy self-sufficiency of end-users [
7,
33,
34,
35]. Widespread topics addressed by researchers when dealing with EES integrated to renewable energy production systems range from demand response [
36,
37,
38] to both peak shaving [
33,
39,
40], as well as to the deepening of technical aspects related to voltage or network load stability problems [
41,
42,
43]. Other authors studied the optimal sizing or location of storages [
34,
44,
45,
46], as well as the management of storages for micro-grids [
47,
48], or they tackled the optimal planning and operation of EES within the network either from a single-use perspective [
49,
50,
51] or from a community energy sharing perspective [
52,
53,
54].
The literature review conducted so far highlights how the modelling of energy networks is a widely addressed topic, aligned with the need for increasing awareness on the smart grid infrastructure paradigm, including renewables [
55]. Most of the cited papers have deepened the aspect of the energy distribution from several perspectives (either for the case in which EES are integrated with renewable sources or not) and generally implementing optimization methodologies with objectives ranging from technological to operational and management issues. Generally, optimization models are formulated in relation to specific objectives, but they lack in evidencing interactions among system components [
56]. To address this issue, several studies acknowledge agent-based models (ABM) as powerful tools, especially for their capacity to deal with large datasets [
56,
57,
58]. Moreover, ABMs have the substantial advantage of being able to highlight interactions among a significant number of agents and between each agent and the environment, thus orientating any decision-making process at the urban scale [
59,
60]. Therefore, they are particularly suitable for community sharing implementation, as also highlighted by Gomes et al. [
61]. In studies implementing ABM, however, the chance for end-users to distribute the autonomous produced energy is either not included or, at least, it is tackled at a small-scale, i.e., for single residential building’ stocks [
12,
15,
22,
34,
54,
61] or involving numerical case studies [
52,
53].
So, the shift from the centralized to the decentralized energy supply pattern requires ad hoc developed tools to properly address the issue of prosumer-focused distribution configuration. In this new configuration, achieving awareness on distribution issues is fundamental, especially for energy action plans promoting the diffusion of renewable energy production systems and enhancing the active role of final users. Taking inspiration from the complex network theory, urban areas can be modelled as energy distribution networks in which nodes represent the prosumers and links the energy distribution lines [
62]. In this perspective, each node is characterized by a certain energy demand and an eventual energy production resulting from the installation of renewable energy production systems. In addition, the node also has the chance to integrate energy storage systems.
This paper addresses these issues by proposing an agent-based model aiming at simulating the energy exchanges occurring among prosumers in urban areas. In particular, the model highlights to what extent the energy independence of final users practically contributes toward both the reduction in production from traditional fossil power plants and the increased exploitation of energy from renewable sources. The model is innovative with respect to the current state-of-art since it deals with a large dataset of physical characteristics of buildings, detailed energy demand profiles as well as specific technological features of the implemented production and storage systems implemented from a GIS-based tool, previously developed by the authors [
8]. Besides, the model includes spatial considerations affecting the topology of the distribution network. Simulations take into account several operating conditions, such as the geographical distance between two prosumers, installed capacity of photovoltaics (PV) panels as well as the effective usage of the network’s links. The performances of the energy distribution network with and without the integration of EES for a real urban territory in Southern Italy are then compared and discussed on the grounds of proper defined indexes.
Therefore, the so-developed model has several advantages: to evaluate the effectiveness of a network of energy exchanges among prosumers that have installed renewable energy-based production systems, to assess to what extent the dependence on the traditional power plants diminishes and to study how the integration of ESS would affect the distribution network. The model is of general applicability and can be easily transferred to other case studies by changing the input parameters of the model to fit the area under investigation. Along with these features, this study aims at putting emphasis on the need for urban planners to entail the distributive nature of decentralized production within their action plans. With this scope in mind, this model can help to effectively put regional, national and European regulations in force.
The remainder of this paper is structured as follows. In
Section 2, the agent-based model is presented; in
Section 3, the urban territory elected as a case study, and the different operating scenarios for the urban energy distribution network, are introduced. In
Section 4, the main results of the simulations are discussed and, finally, in
Section 5, the main conclusions are drawn.
2. Methodology
With the aim of investigating the energy distribution among prosumers and taking inspiration from the complex network theory, this paper proposes a methodology framed within agent-based modelling. These models have the main characteristic of being able to represent how systems evolve in relation to interactions among single entities called “agents”. Agents take autonomous decisions with respect to predefined rules and, as a consequence, they contribute in shaping the environment in which they operate [
20,
21].
Before introducing the model, it is worth noting that the terms “node” and “agent” are here used as synonyms, given that to each node is associated an agent and vice versa. Thus, to avoid overlapping nomenclature, the term agent is used throughout the rest of this paper.
The model operates on single time steps and distinguishes two breeds of agents: prosumer-agents and one central-agent. At time , each agent of the first breed is characterized by an energy demand and eventually by an energy production and an energy stored ; the last breed (which counts one single agent) is characterized by an energy output, , representing the energy supplied by the traditional power plant to the demanding agents of the network. The urban energy distribution network is described by agents.
Agents take decisions on the grounds of a spatial criterion and an energetic parameter. With respect to the spatial criterion, agents are allowed to exchange energy if their geographical distance is below a given threshold called
. Therefore, at time
, an initial topology of the links of the energy distribution network is established and counts the links determined in accordance with the value of the
plus the
links connecting each agent to the central-agent. At this point, agents are aware of the physical position of the links along which they are allowed to exchange energy. However, they still do not have information regarding the energetic conditions. Thus, to characterize the energy status of each agent
at time
a parameter called
is introduced and defined as:
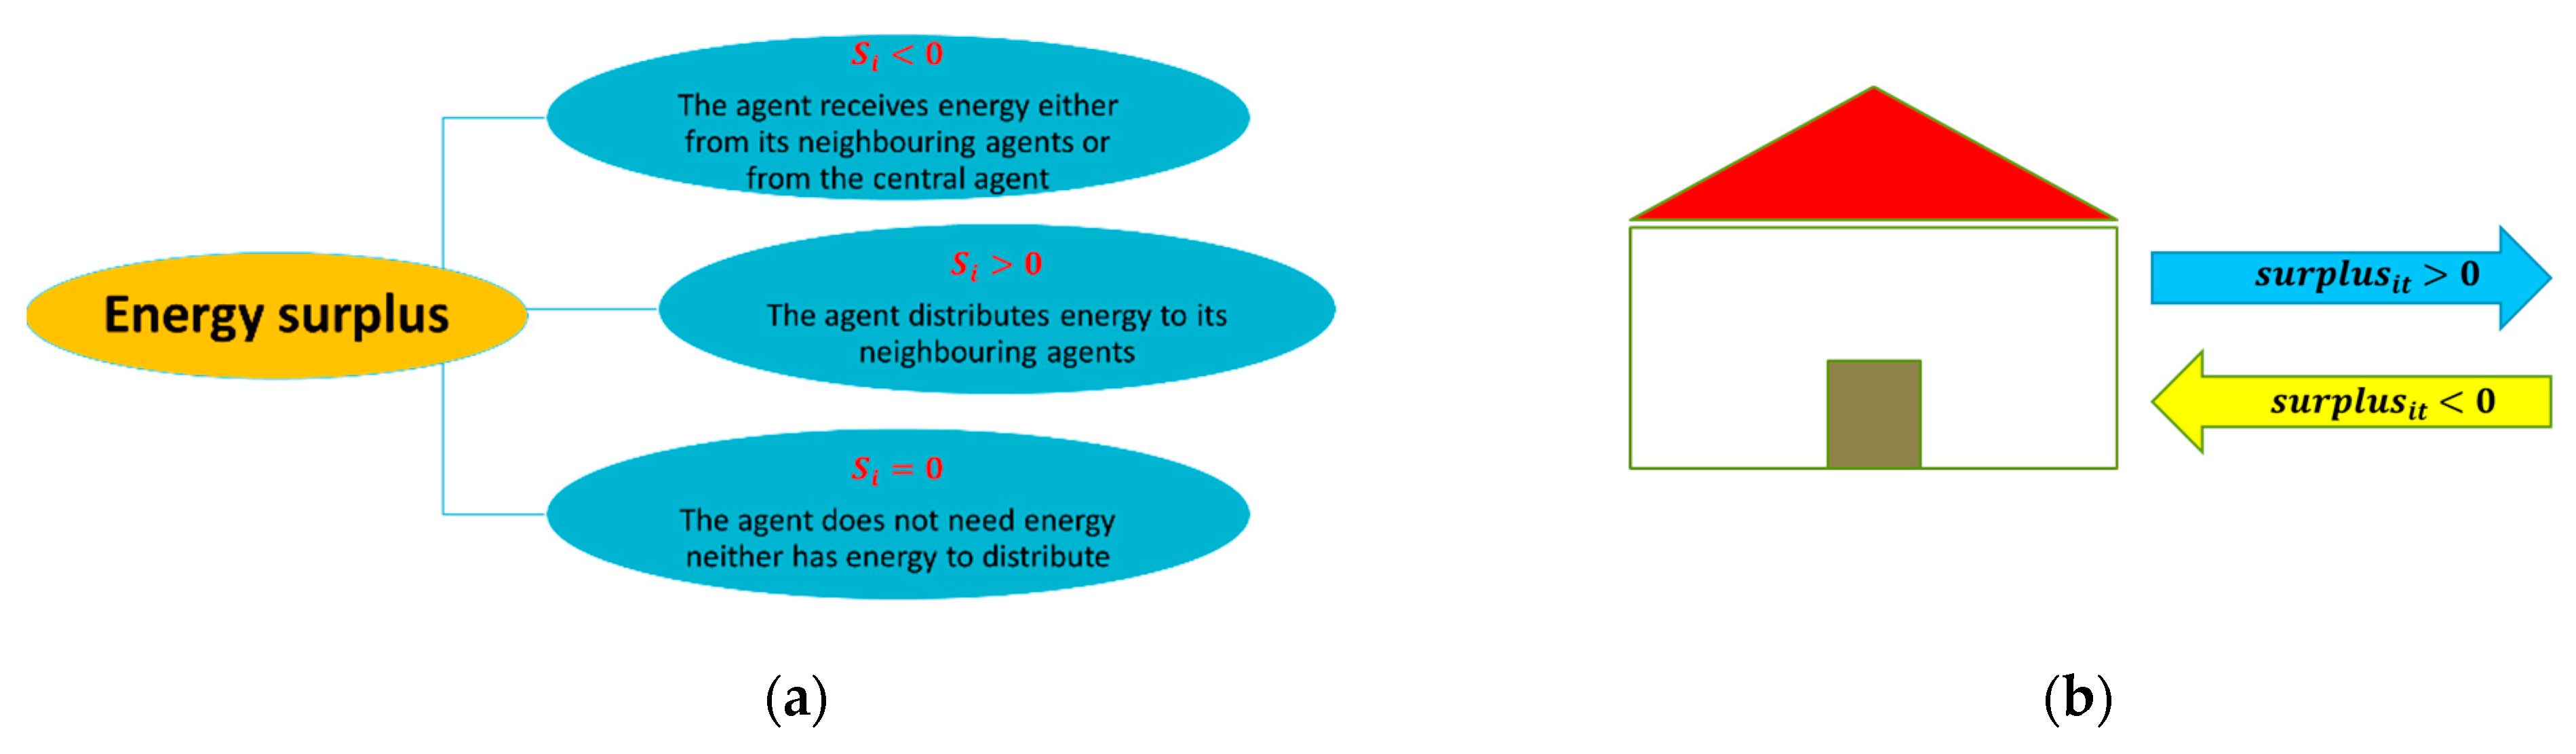
The
is the difference between the energy produced
and the energy demanded
by each agent
at time
. This parameter assumes positive values if the agent
has residual energy to share within the network, i.e., when the production exceeds the demand; conversely, it is negative when the own production has not covered (or, at least, has not been sufficient to cover) the demand of the agent itself. In practice, the value of the surplus represents, respectively, either the distributable energy or the residual demand; the sign of the surplus, instead, establishes the direction of the exchange: exiting from the agent (in case of positive surplus) or entering (in case of negative surplus). Obviously, if the surplus is null, the energy production has equaled the energy demand and the agent neither receives nor distributes energy. Within the distribution framework, each agent with positive surplus obeys the rule according to which energy should be firstly distributed to those agents with the smaller demand still not satisfied. A brief graphical explanation of the
is shown in
Figure 1.
Once the network of energy exchanges among prosumers has been constituted, it is important to evaluate which topological and energetic configurations characterize the distribution. To this scope, three purpose-built indexes are formulated as follows.
The first index measures the rate of links effectively crossed by an energy flow at any time
with respect to the initial topological configuration attained by posing the links established by the spatial criterion. This index is called
and is expressed as:
The varies within the interval ; obviously, the higher its value, the more links (among all the feasible) are used for the exchange. The extreme values of the interval indicate, respectively, that agents do not use any of the established links () or that they use all the initial established links (). The analysis of the permits to gain awareness of the distribution from a topological perspective and, thus, to assess the effectiveness of such a network of energy exchanges. However, this index does not provide information about how many times during the entire simulation interval links are crossed by energy. As expressed in Equation (2), the counts the links crossed by an energy flow at least one time during the entire 24 h time interval. To account for the frequency in the usage of the links, a is introduced in the model. It sets a minimum threshold beyond which links are not counted as “used”. In other words, setting up means that links crossed less than 5% of the total time interval are not counted in the numerator of the in Equation (2). The definition of this index has practical implications for the correct dimensioning of the distribution network among prosumers: in fact, it determines which links should be effectively planned, thus avoiding oversizing effects from the infrastructural viewpoint.
The second index allows the evaluation of the produced energy neither self-consumed nor delivered to any of the agents of the distribution network; in this sense, it can be seen as an energy “excess”, i.e., there is more energy than the amount that can be physically distributed within the network. Generally, there is an energy excess when the agents with positive surplus do not identify any other requiring agents within their neighborhood (apart from the agents that they have already supplied). This occurrence strictly derives from the topological configuration of the links; thus, there can be agents with exceeding energy and agents with requiring energy that can, however, not exchange energy due to the fact that they are not connected through a link. The mathematical formulation of this index is:
where
represents the fraction of the positive surplus of energy that agent
distribute at each time
to other agents with negative surplus. The
varies within the interval [0, 1] and it is preferable to have low values of this index. As said, the
gives insights on the energy produced in loco but not consumed and not shared. In this sense, the proper evaluation of this index can increase awareness on the preferable allocation of energy production systems or can stimulate planners towards the definition of solutions pointing to reduce the waste of produced energy (storages or charge columns for electric vehicles can be recognized as examples of alternative use of this excess energy).
The third index is called
and measures the energy that agents still request from the central-agent. It is expressed as:
Similarly to the previous introduced indexes, the index assumes values within the interval [0, 1]. The condition represents the ideal configuration in which the central-agent does not supply any other agent of the network, i.e., the entire energy demand of the agents has been met by the energy from renewable sources, i.e., following a totally decentralized distribution pattern. On the contrary, characterizes the situation in which the central-agent is the sole supplier of energy, i.e., as in the traditional centralized configuration. Therefore, this index allows the estimation of the impact that the decentralized distribution among prosumers has on the centralized production systems, permitting the definition of operating scenarios between small scale and large scale production and distribution.
Besides the installation of renewable energy production systems, agents may also have the chance to integrate energy storage systems (EES). In this case, if further energy is still available after the distribution within the network, it is stored in EES rather than being counted as an excess. The energy stored in the EES is calculated as:
In this model, it is assumed that EES are not allowed to store energy deriving from the central agent, thus the balance in Equation (5) considers only the energy produced by the agents themselves.
However, energy may not be stored indefinitely in the EES and, thus, upper and lower limits are identified to indicate the maximum and minimum storage levels. Both these limits depend on physical and technological constraints of the chosen ESS. Calling
and
the lower and upper limits of the EES, it is posed that
From the distribution aspect, when EES are integrated to renewable energy production systems and beyond the surplus that is in any case distributed to the neighbors at each time , agents may also distribute the energy stored at time .
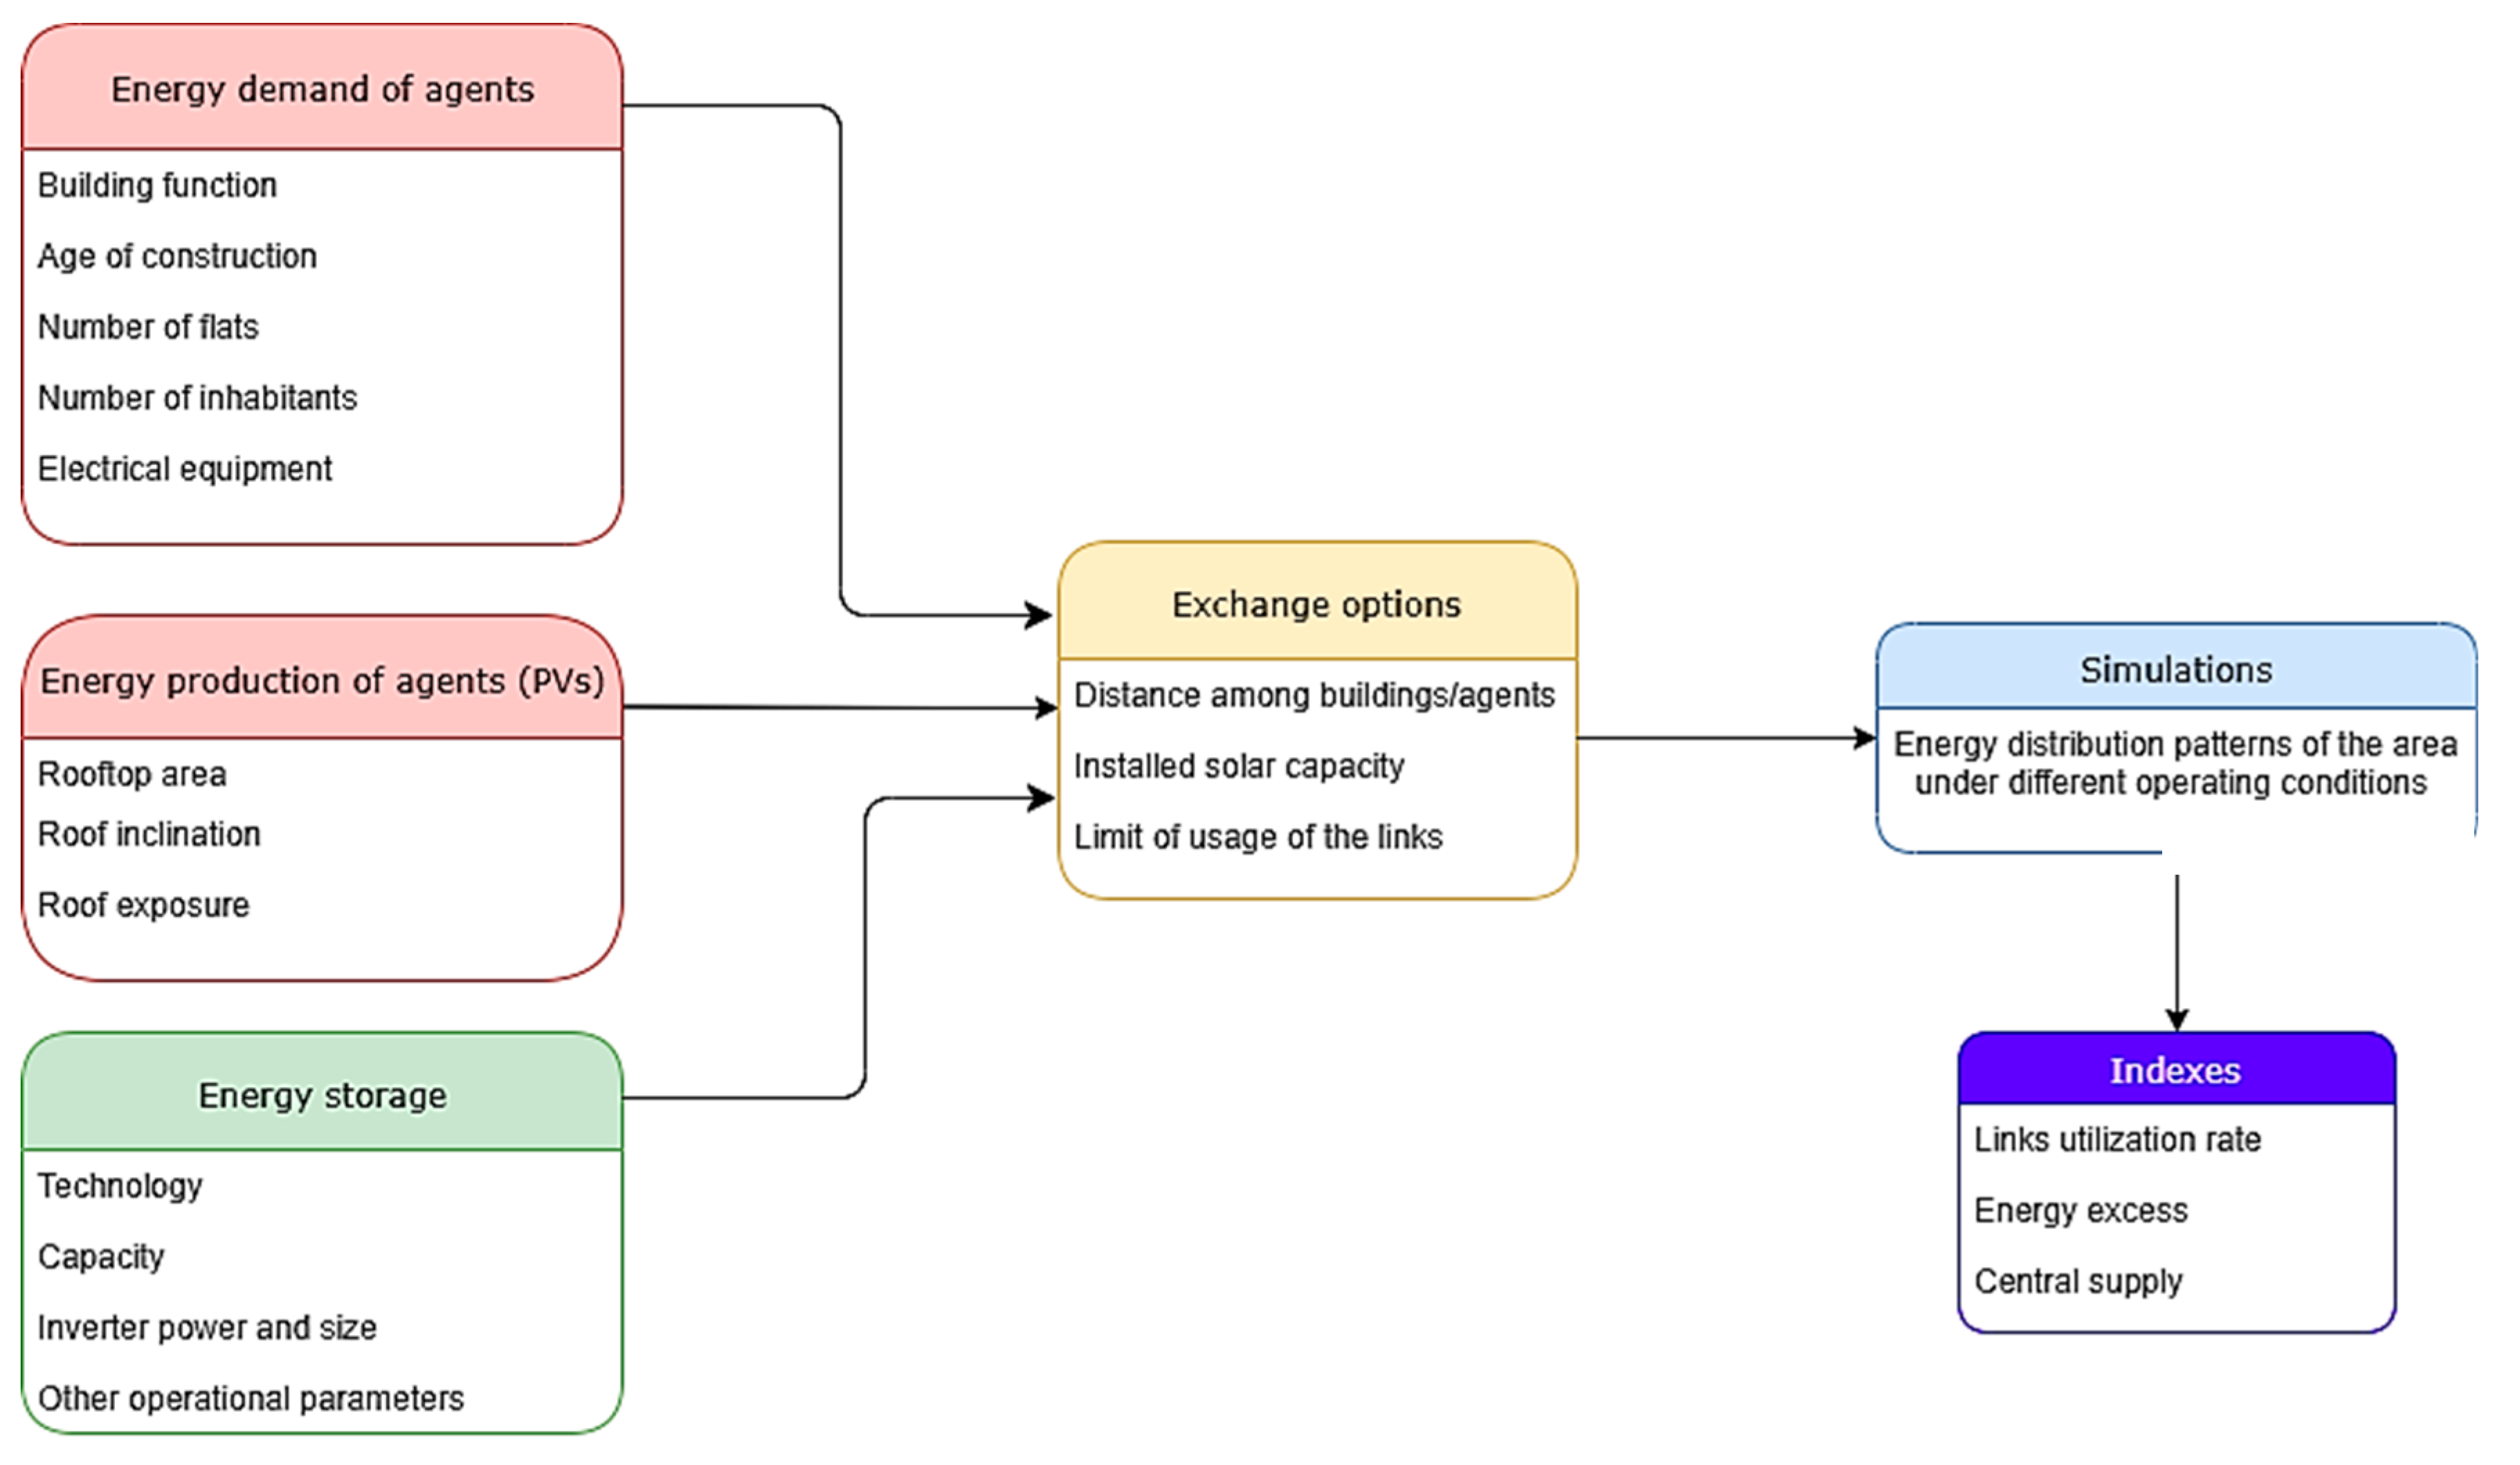
It is worth noting that this model is of general applicability and can be easily transferred to different areas by changing the input parameters (energy demand, energy production, distance and geographical location of the agents, technological features). An overview of the developed methodology considering the hypotheses of photovoltaics panels as production systems and electrical energy exchanges is offered in the flowchart of
Figure 2.
3. Case Study and Scenarios
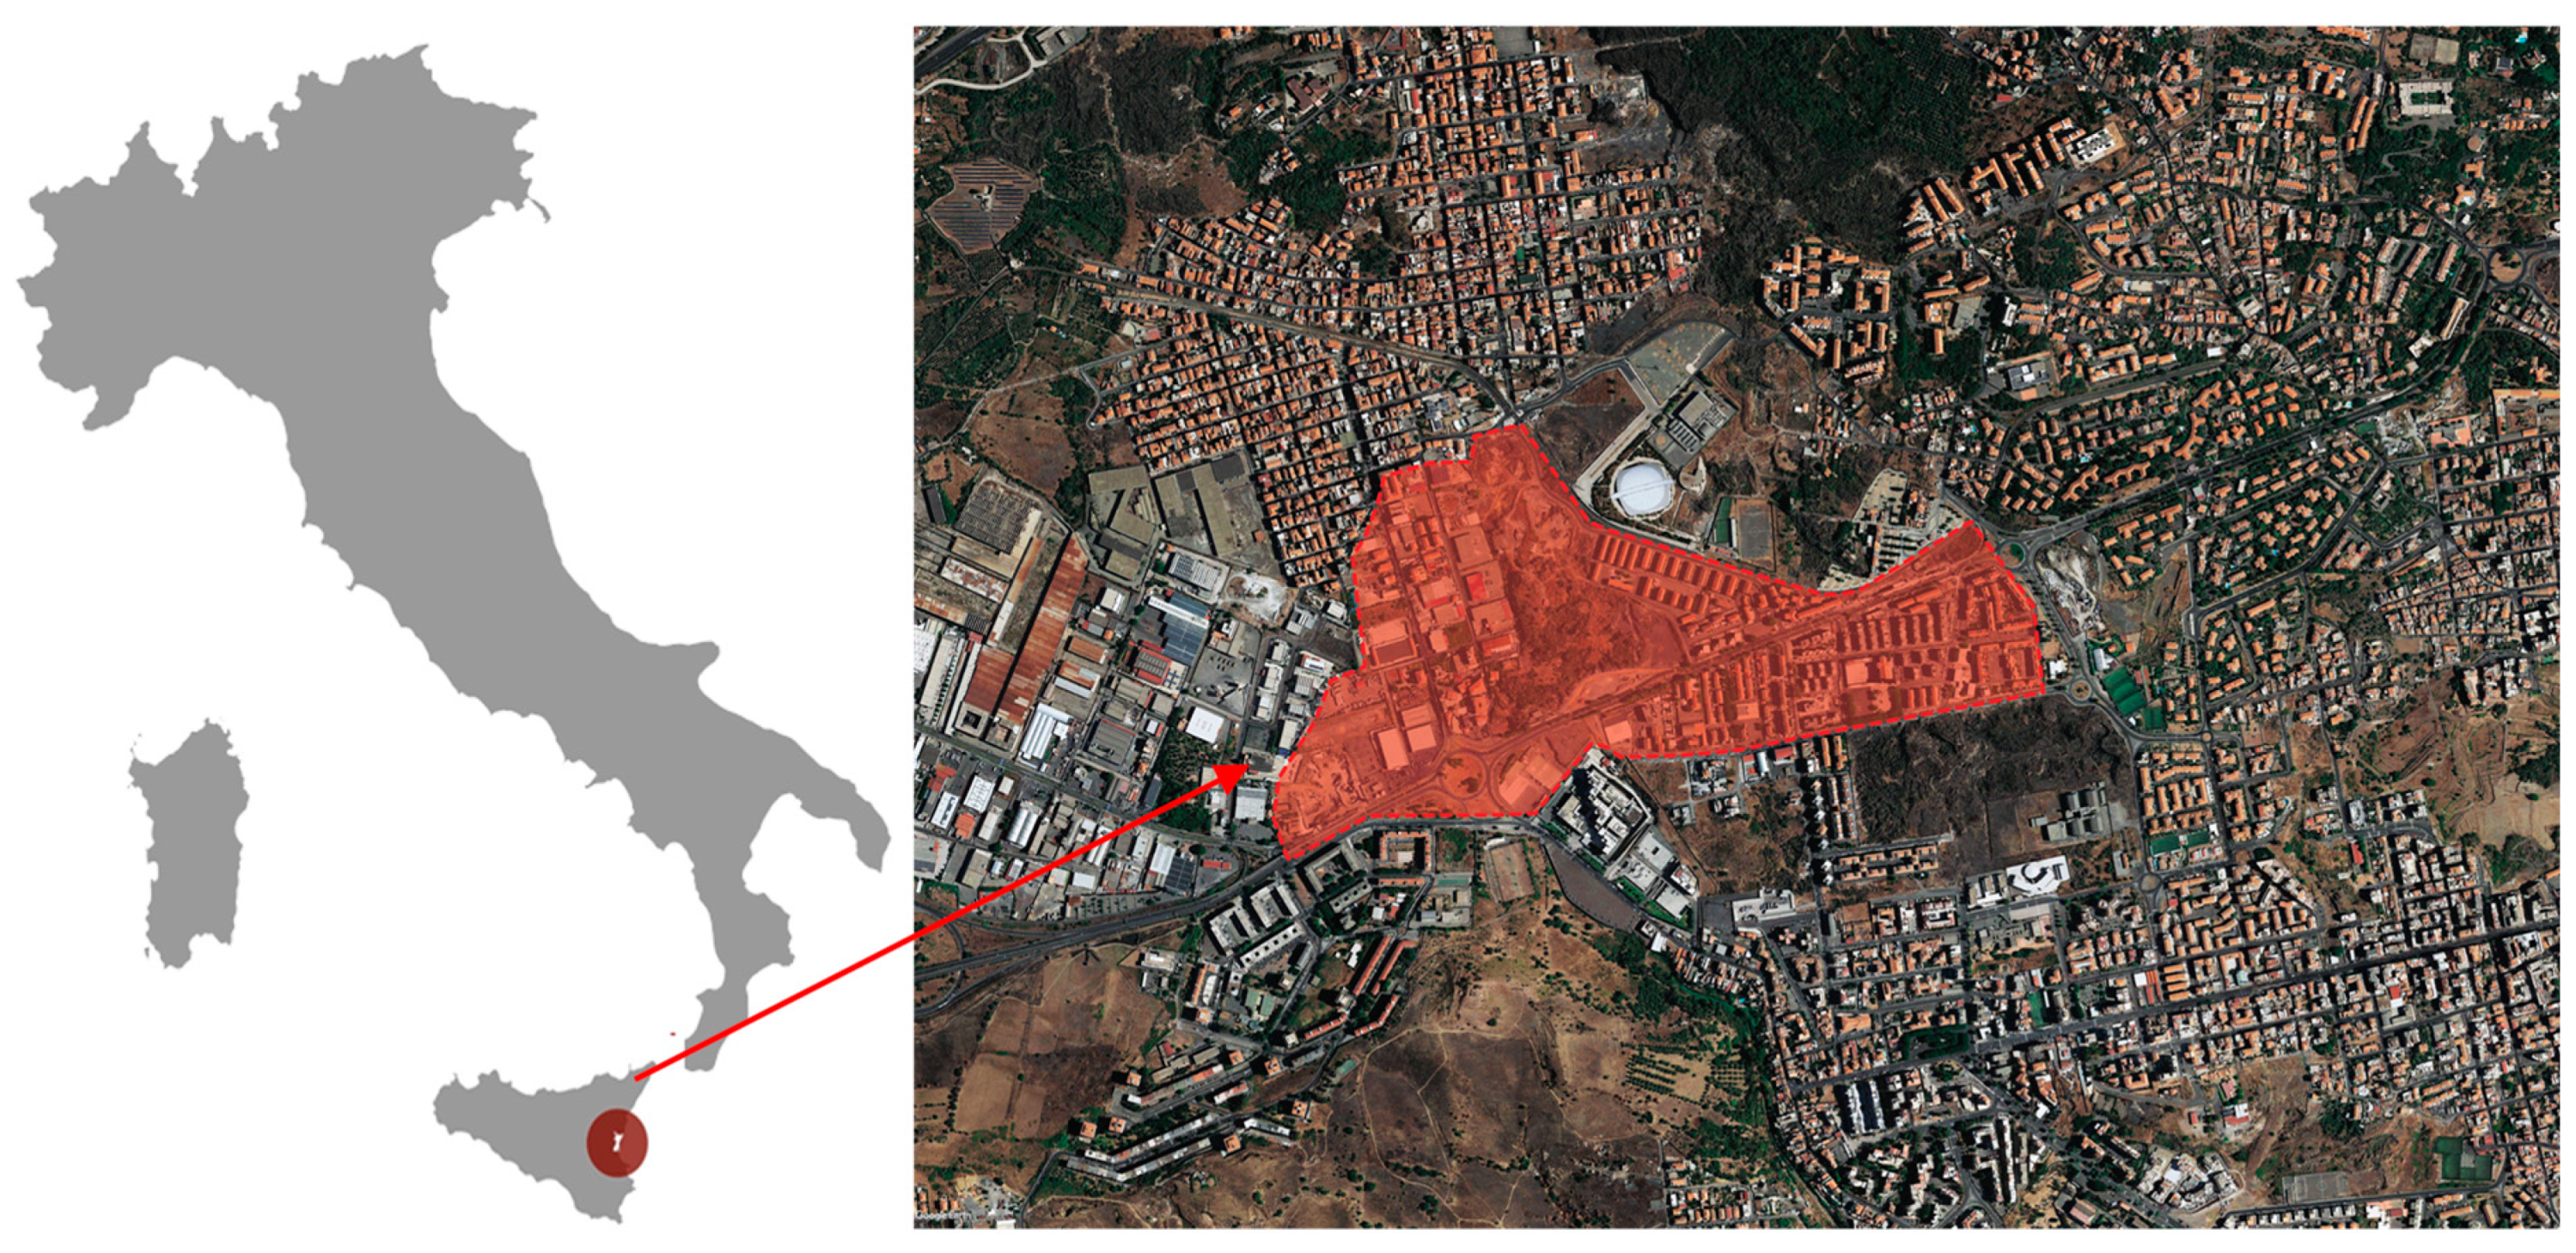
The proposed agent-based model has been applied to the neighborhood of circa
in the city of Catania, Southern Italy. The territory designated as a case study counts 370 buildings and is shown in
Figure 3.
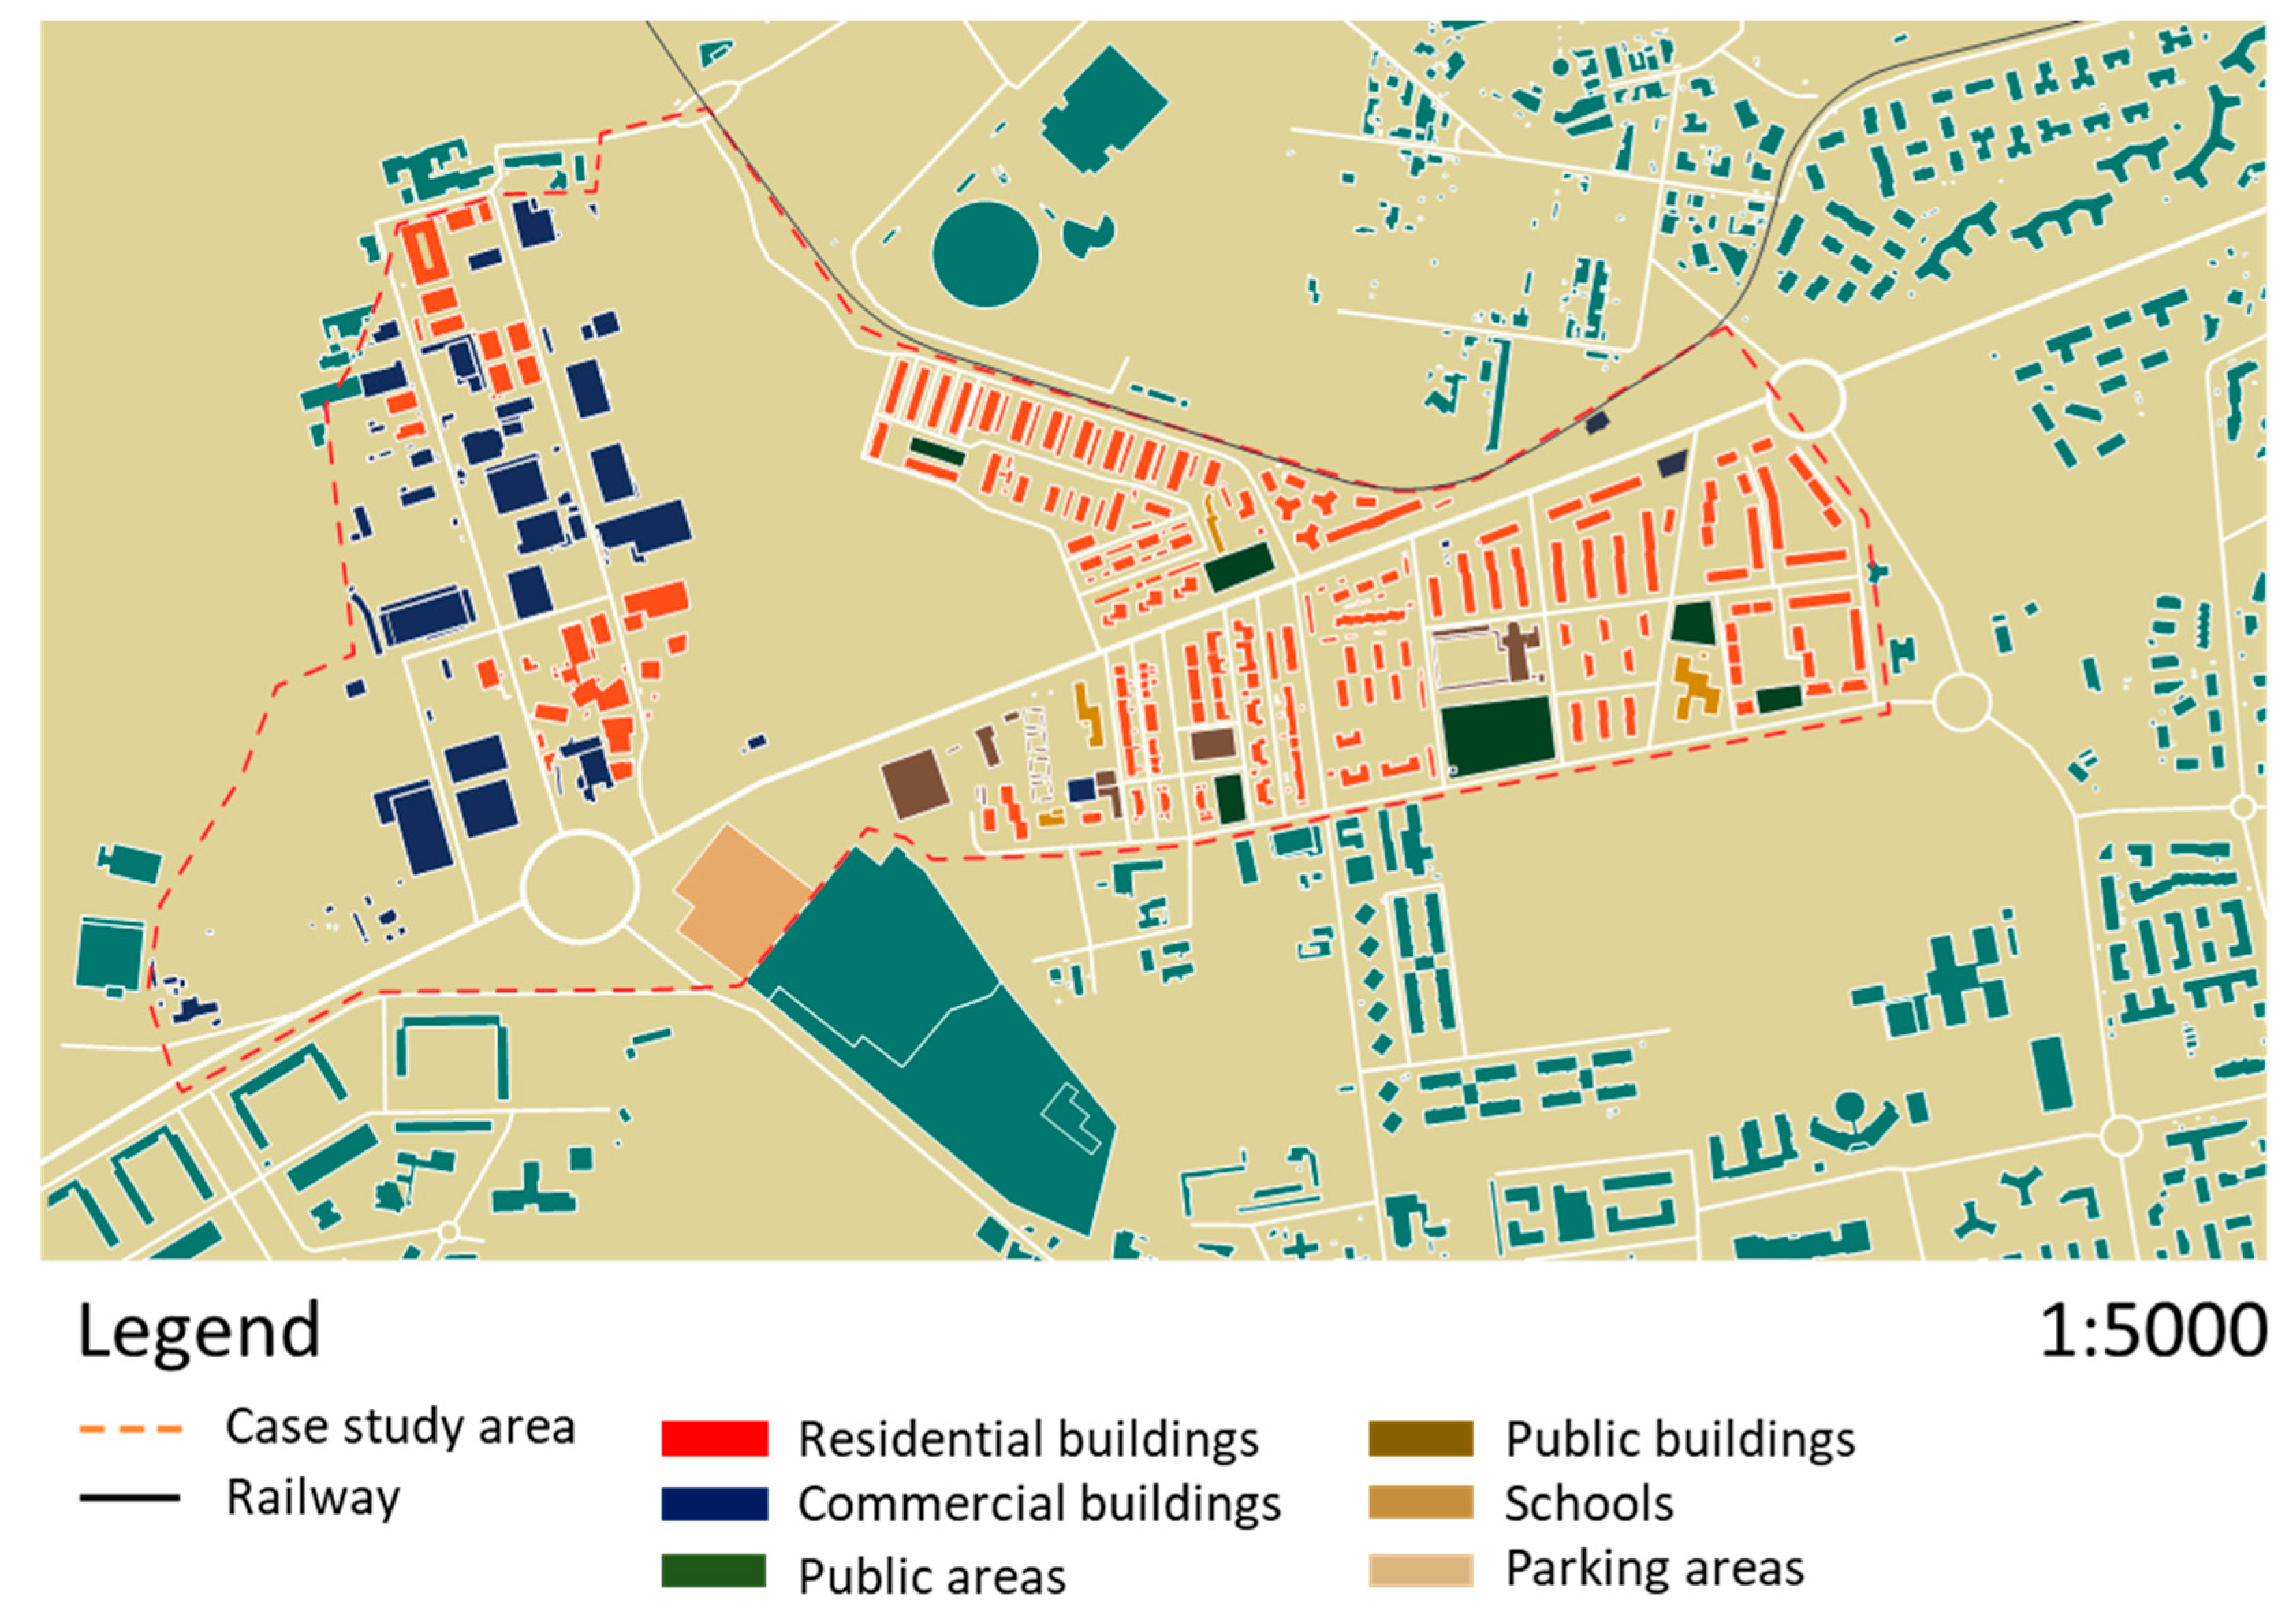
This area represents a typical Mediterranean urban form from both the spatial configuration of the buildings and the energetic profiles of consumers. The buildings of the area are heterogeneous in terms of use and include social houses, single-family houses, blocks, as well as supermarkets, warehouses and a church, as detailed in
Figure 4. This heterogeneity in terms of land use and energy consumption makes the area eligible for general discussion and prevents biased results in the distribution pattern. On the contrary, this choice can serve as benchmark for typical Mediterranean neighborhoods or for comparison with other peculiar areas belonging to colder climates.
As a remark, it is chosen to establish an agent for each building of the area and each connection between two agents is modelled as a link; agents and links constitute the energy distribution network. NetLogo [
63] is adopted as simulation environment. Data deriving from the constituted house stock database (including the spatial coordinates of the area) previously developed through a GIS-tool [
8] are imported and processed; here, each building is identified as an agent.
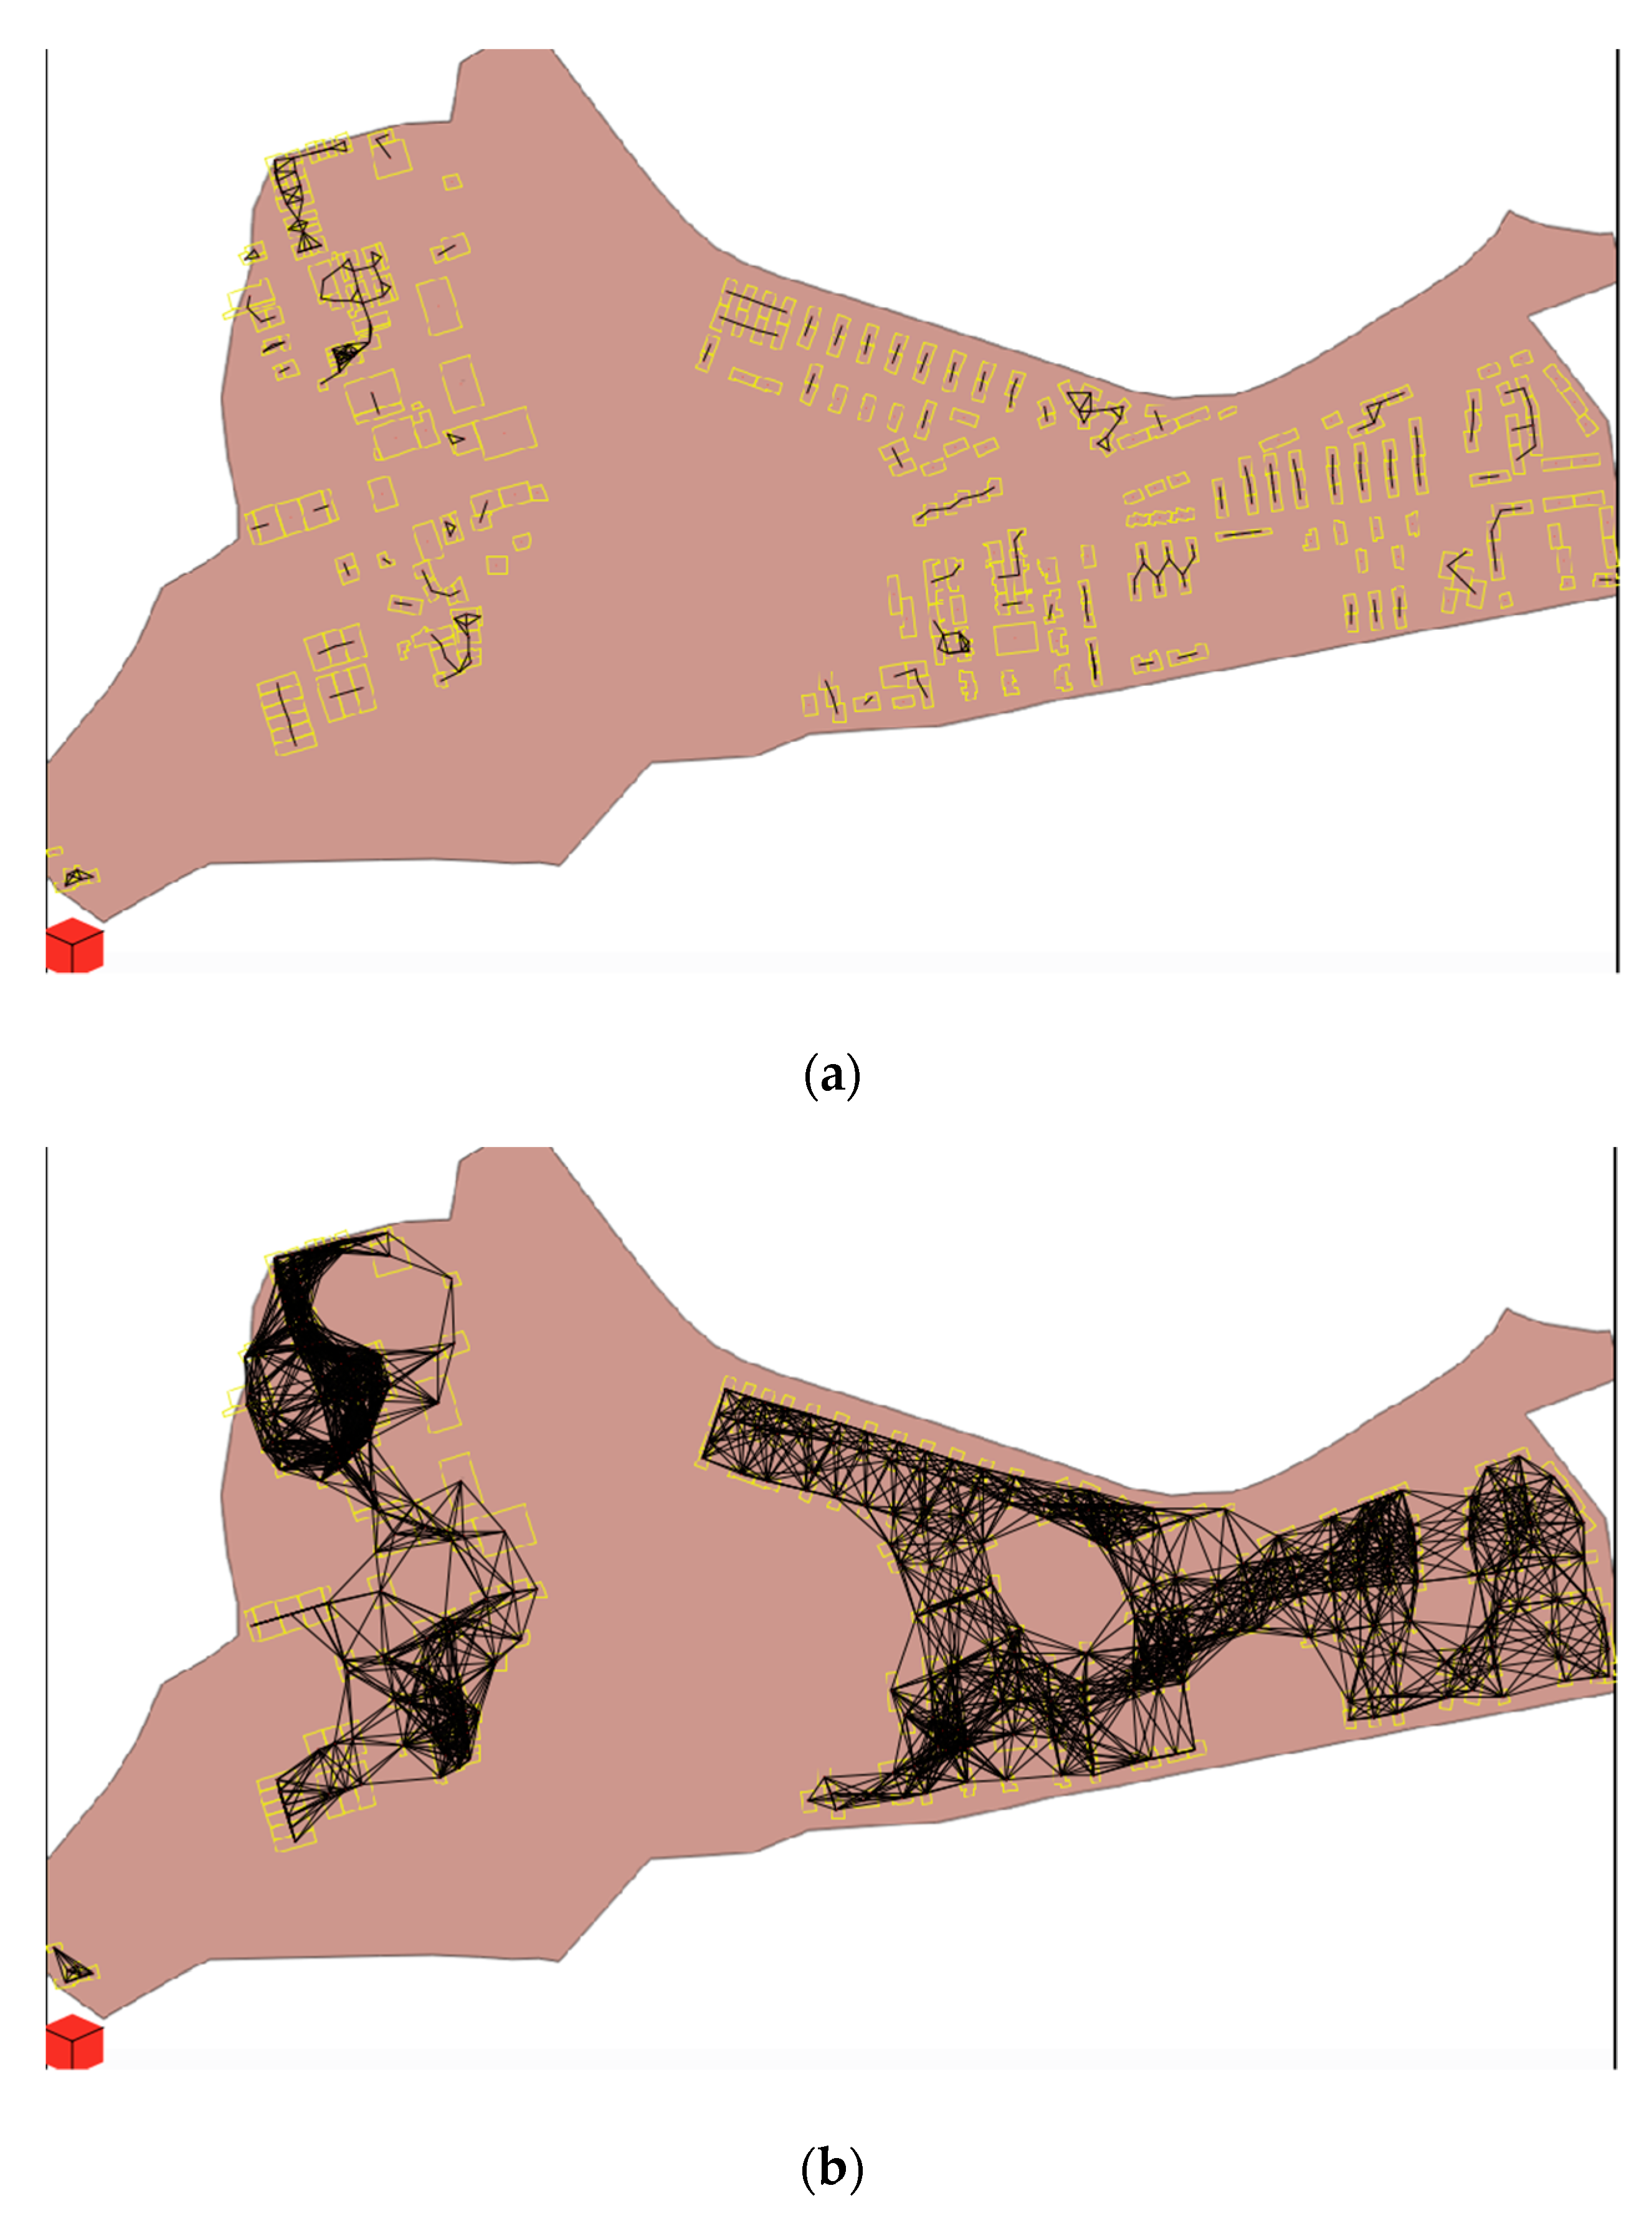
In order to gain an order of magnitude of how distances may affect the simulations,
Figure 5 depicts the urban area at increasing values of the
. Besides the links, each figure shows the position of each building (represented with a yellow square) within the simulation environment. To the scope, the
is set, respectively, to
and
in
Figure 5a,b. As can be noted, the number of links varies when increasing the
due to the fact that higher distances permit reaching more agents and, thus, establishing more potential connections. Consequently, when increasing the
of connection, the chance for agents to exchange energy increases as well.
As a reminder, the notation used hitherto to indicate the consumption and production of agents has referred to “energy” consumption and “energy” production: this notation has been maintained due to the general applicability of the model. In this particular case study, however, the model is applied to design the network of electricity exchanges among prosumers; thus, data about the consumption and production of agents are hereinafter referred to as electricity consumption and electricity production.
Going into detail, the yearly electricity consumption of the area has been estimated distinguishing among residential, non-residential and public buildings. Beyond the characterization of the building stock in terms of the building function, data on the age of construction, number of floors, rooftop area and rooftop typology of buildings, along with the number of inhabitants, have been made available from the Geographic Information System (GIS). Agents install photovoltaics panels on the rooftop of buildings in order to produce the electricity needed to firstly supply themselves and, subsequently, to distribute the eventual excess production to the other agents in the network. The potential electricity production from PV panels has been established in relation to the known geometrical characteristics of the roofs (i.e., orientation, rooftop areas and span/flat rooftops) as well as with respect to physical constraints of the buildings. In particular, the installation of photovoltaic systems takes into account possible shading from surrounding buildings, extra rooftop areas for cables and maintenance, and the location of the cell with respect to the sun. The average value of the electricity production of the city of Catania is estimated to be
per
of available south-oriented surface [
8]. For clarification, the typical seasonal and hourly fluctuations of the photovoltaic production are not taken into account. This study, in fact, is intended to design an electricity distribution network with the main scope of determining which operational conditions permit on one side to enhance the network or energy exchanges among prosumers and, on the other side, to evaluate to what extent the supply from traditional fossil power plants can be effectively resized. In this sense, such a level of detail on photovoltaic production is not necessary to pursue the goal of the study and mean values can fit for the purpose. However, it is worth noting (although not here illustrated) that any day of the year can be modelled merely by changing the input data on the agent’s production and/or demand per minute of simulation, thus making it possible to take these variations into account if desired.
The performances of the distribution network are also assessed in relation to the insertion of EES within the area. Batteries are installed with the main intention of decoupling the agent demand from the traditional grid either in the time period in which there is no production from the PV panels or when the autonomous production is not sufficient to satisfy the demand, i.e., typically during the night. In this study, Lithium-Ion batteries are selected for the current simulations since they represent the most advantageous option if integrated with PV panels [
40,
50,
64,
65]. In addition, the cost of these batteries is declining, thus making their installation more affordable for residential use [
66]. The operating characteristics of each battery as well as details on the inverter/charger have been chosen in relation to available commercial data and with reference to other studies in the literature [
35,
40]. A brief summary follows in
Table 1.
The storage capacity measures the electricity that can be stored in each battery. The inverter is characterized by bidirectional flows; ingoing when the battery is charged and outgoing when the battery is discharged to meet the demand of the agent itself or, generally, of the other agents of the network. In this model, batteries are not allowed to store energy withdrawn directly from the central-agent. From the operational viewpoint, batteries are characterized by two main specifications: the State of Charge
and the Depth of Discharge
. The
identifies to which level the battery is charged, whilst the
is the limit below which batteries should never be discharged. These limits are inserted within the NetLogo platform and can be specified case-by-case if different batteries are supposed to be installed. Typically, Li-Ion batteries have an estimated lifetime of 10–20 years; the duration depends on both physical factors (chemistry, temperature) and operational factors (state of charge, number of cycles) [
41,
64]. For the sake of simplicity, the model does not tackle chemical reactions or operating voltage inside the storage systems.
Under these premises, the model is applied in relation to two different operating scenarios. In the first scenario, the distribution network is modelled without considering the chance to integrate batteries to PV panels. In this scenario, specifically, agents equipped with PV panels use the produced electricity firstly to meet their own demands and, afterwards, they share the remainder with neighboring agents. In this case, the electricity neither consumed nor exchanged accounts for “excess”, in the figurative meaning specified in
Section 2, and is counted as in Equation (3). The second scenario provides for the installation of Li-Ion batteries. As in the previous scenario, the electricity production is used for the satisfaction of the demand of both the agent itself and the other agents of the network. However, in this case, if the agent at time
still has residual production after the consumption and distribution, this energy is stored in the battery for the further eventual utilization and/or distribution at time
, thus not directly counted as excess.
Along with these different peculiarities, the common features of both scenarios are listed in the following:
- -
simulations run on a cycle, with a temporal time-step of 60 s;
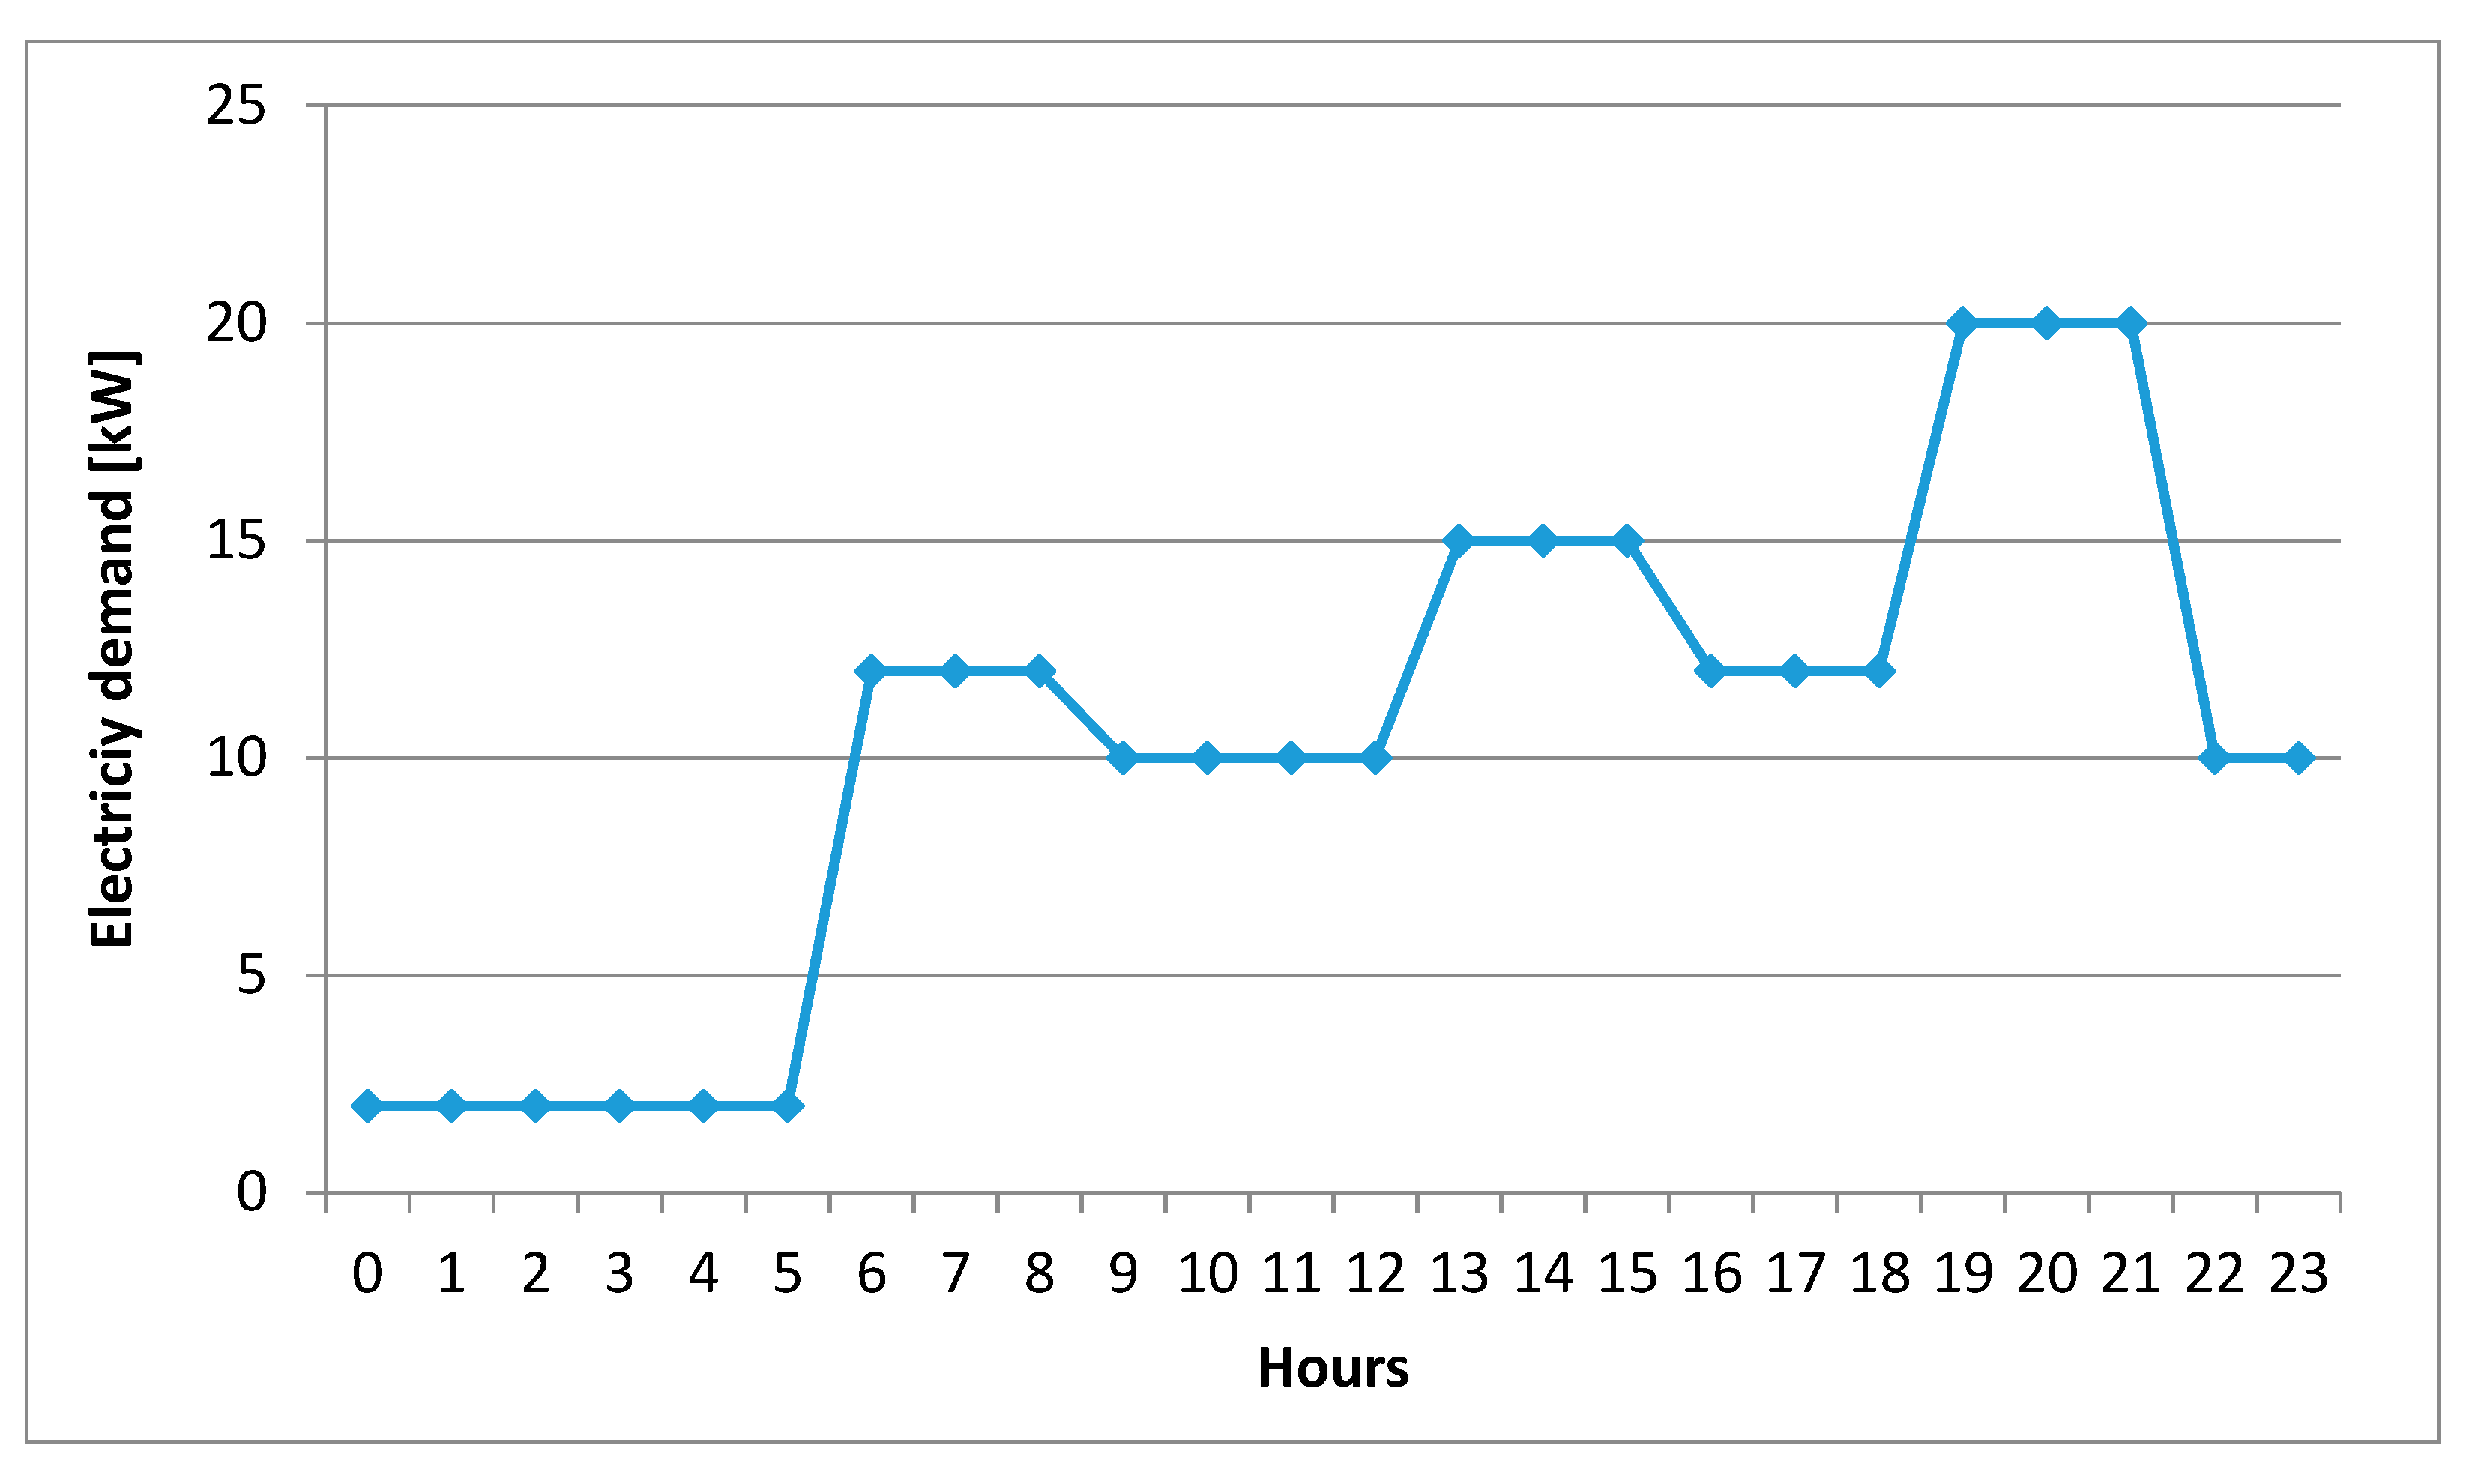
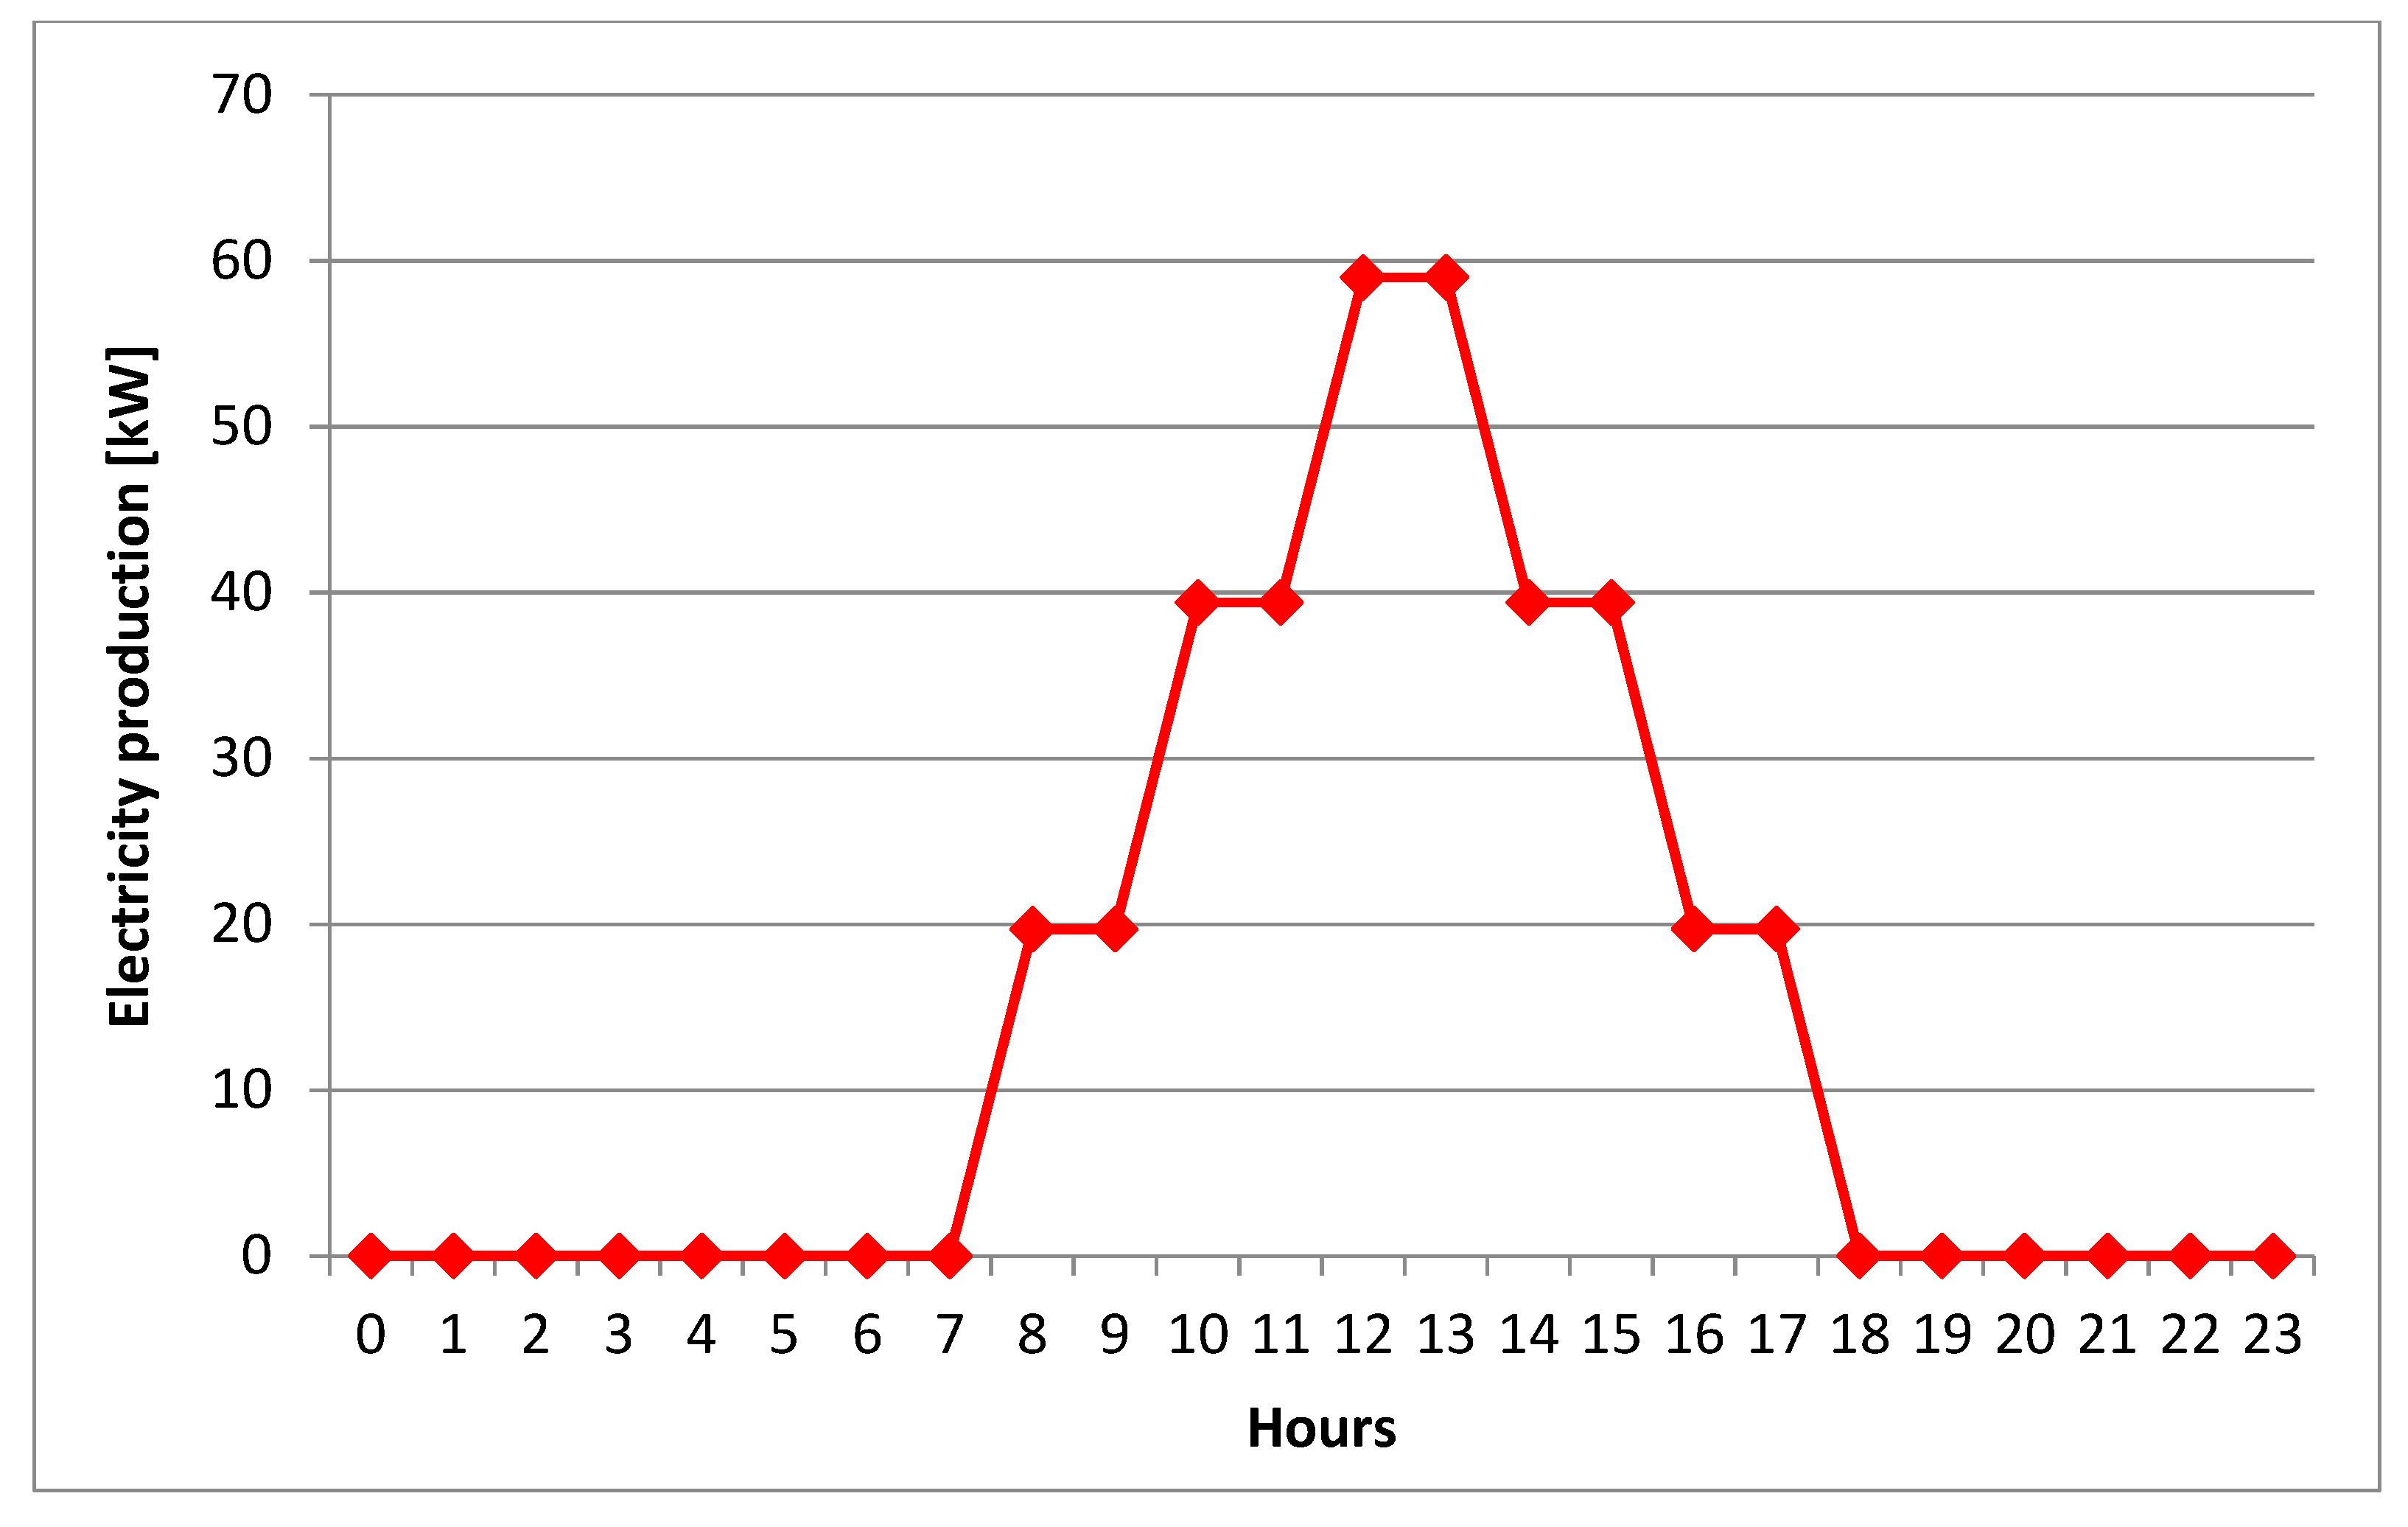
- -
typical electricity production and demand profiles are showed in
Figure 6 and
Figure 7;
- -
the electricity exchanges are permitted on the grounds of two different values of the , i.e., and and when varying the installed solar capacity within the territory. In this case, and with respect to the territory and buildings’ characteristics, the maximum installed capacity of PV of the entire area has been estimated to be around , opportunely divided to consider specific days of simulation. Simulations have been conducted by varying the installed capacity at fixed steps; it is worth noting that the increased installed capacity within the territory also corresponds to the increase in the number of buildings that become producers due to the installation of PV panels. As said, the increase in PV panels satisfies the operating conditions previously commented on and related to shading, available area for cables and maintenance, and location of the cells relative to the sun;
- -
the constraint on the usage of links for the exchange, i.e., the , is posed at 0%, 5% and 10%. According to these values, links are counted if along them electricity is exchanged at least one time in the time interval (case 0%), or for 5% or 10% of the total simulation time (24 h), respectively.
4. Results and Discussion
The performances of the distribution network are discussed on the grounds of the three indexes introduced in
Section 2, i.e., the
, the
and the
. As a brief reminder, the
measures the number of links effectively used for the exchange on the total possible number of links established by the
. The
calculates the electricity produced but neither consumed nor distributed (nor stored, as in scenario 2) and the
measures the amount of electricity still requested to the traditional power plant despite the distribution among agents. All results are plotted by varying the installed solar capacity within the territory and comparing the two scenarios for the chosen values of the
.
The
for both scenarios is plotted in
Figure 8. Going into details,
Figure 8a illustrates the trends of the index when
, i.e., when no restrictions in the counting of the exploited links are introduced. As an immediate evidence, a significant scenario-based diversification can be observed. In fact, for an installed capacity higher than
and for any allowed distance of connection, scenario 2 (PV + EES) exhibits a higher number of links crossed by electricity alongside those available in the initial configuration. It can be therefore inferred that batteries allows for a more connected network with exchanges among agents also enabled during night hours or, generally, when the demands have not been yet covered. In this sense, the insertion of batteries enhances the distribution. As a common feature of both scenarios, the usage of links decreases
of installed capacity and is more marked for scenario 1 (PV). With respect to the role that the distance of connection plays for the exchanges among agents,
ensures higher utilization rates, especially for scenario 2 (PV + EES), and for
, the utilization rate decreases almost proportionally for both scenarios. Therefore, a more connected and exploited network can be established when agents exchange electricity within a limited spatial neighborhood, typically considering adjacent buildings or neighboring cadastral zones.
Different considerations apply to the
plotted in
Figure 8b in the case of
, i.e., considering those links that are used for at least 5% of the total simulation time. Here, the differentiation between the two scenarios is less marked and the dependence from the
is more evident. This is confirmed and most noticeable for
, in
Figure 8c.
As a general comment, hence, the introduction of a limit in the usage of the links underlines how the distance of connection among agents affects the utilization rate more than the technological equipment. Peculiarly, the insertion of the limits in the counting of the links confirms that lower distances are preferred from the distribution viewpoint and that higher rates of links’ usage are achieved around an installed capacity of . The values decrease more rapidly with higher values of the , being almost nil for an installed capacity of . It is worth noting, however, that an installed capacity of circa corresponds to almost the totality of available roofs of the area covered by PV panels. Thus, in this technological configuration, agents become able to autonomously meet their own demands (totally or, in any case, to a large extent) and do not need to exchange electricity within the network. Finally, as a general concluding observation, in scenario 2 (PV + EES), a higher number of links are used for the exchange with respect to the initial configured topology. In fact, the stored electricity, otherwise released to the grid, permits the distribution at a later time.
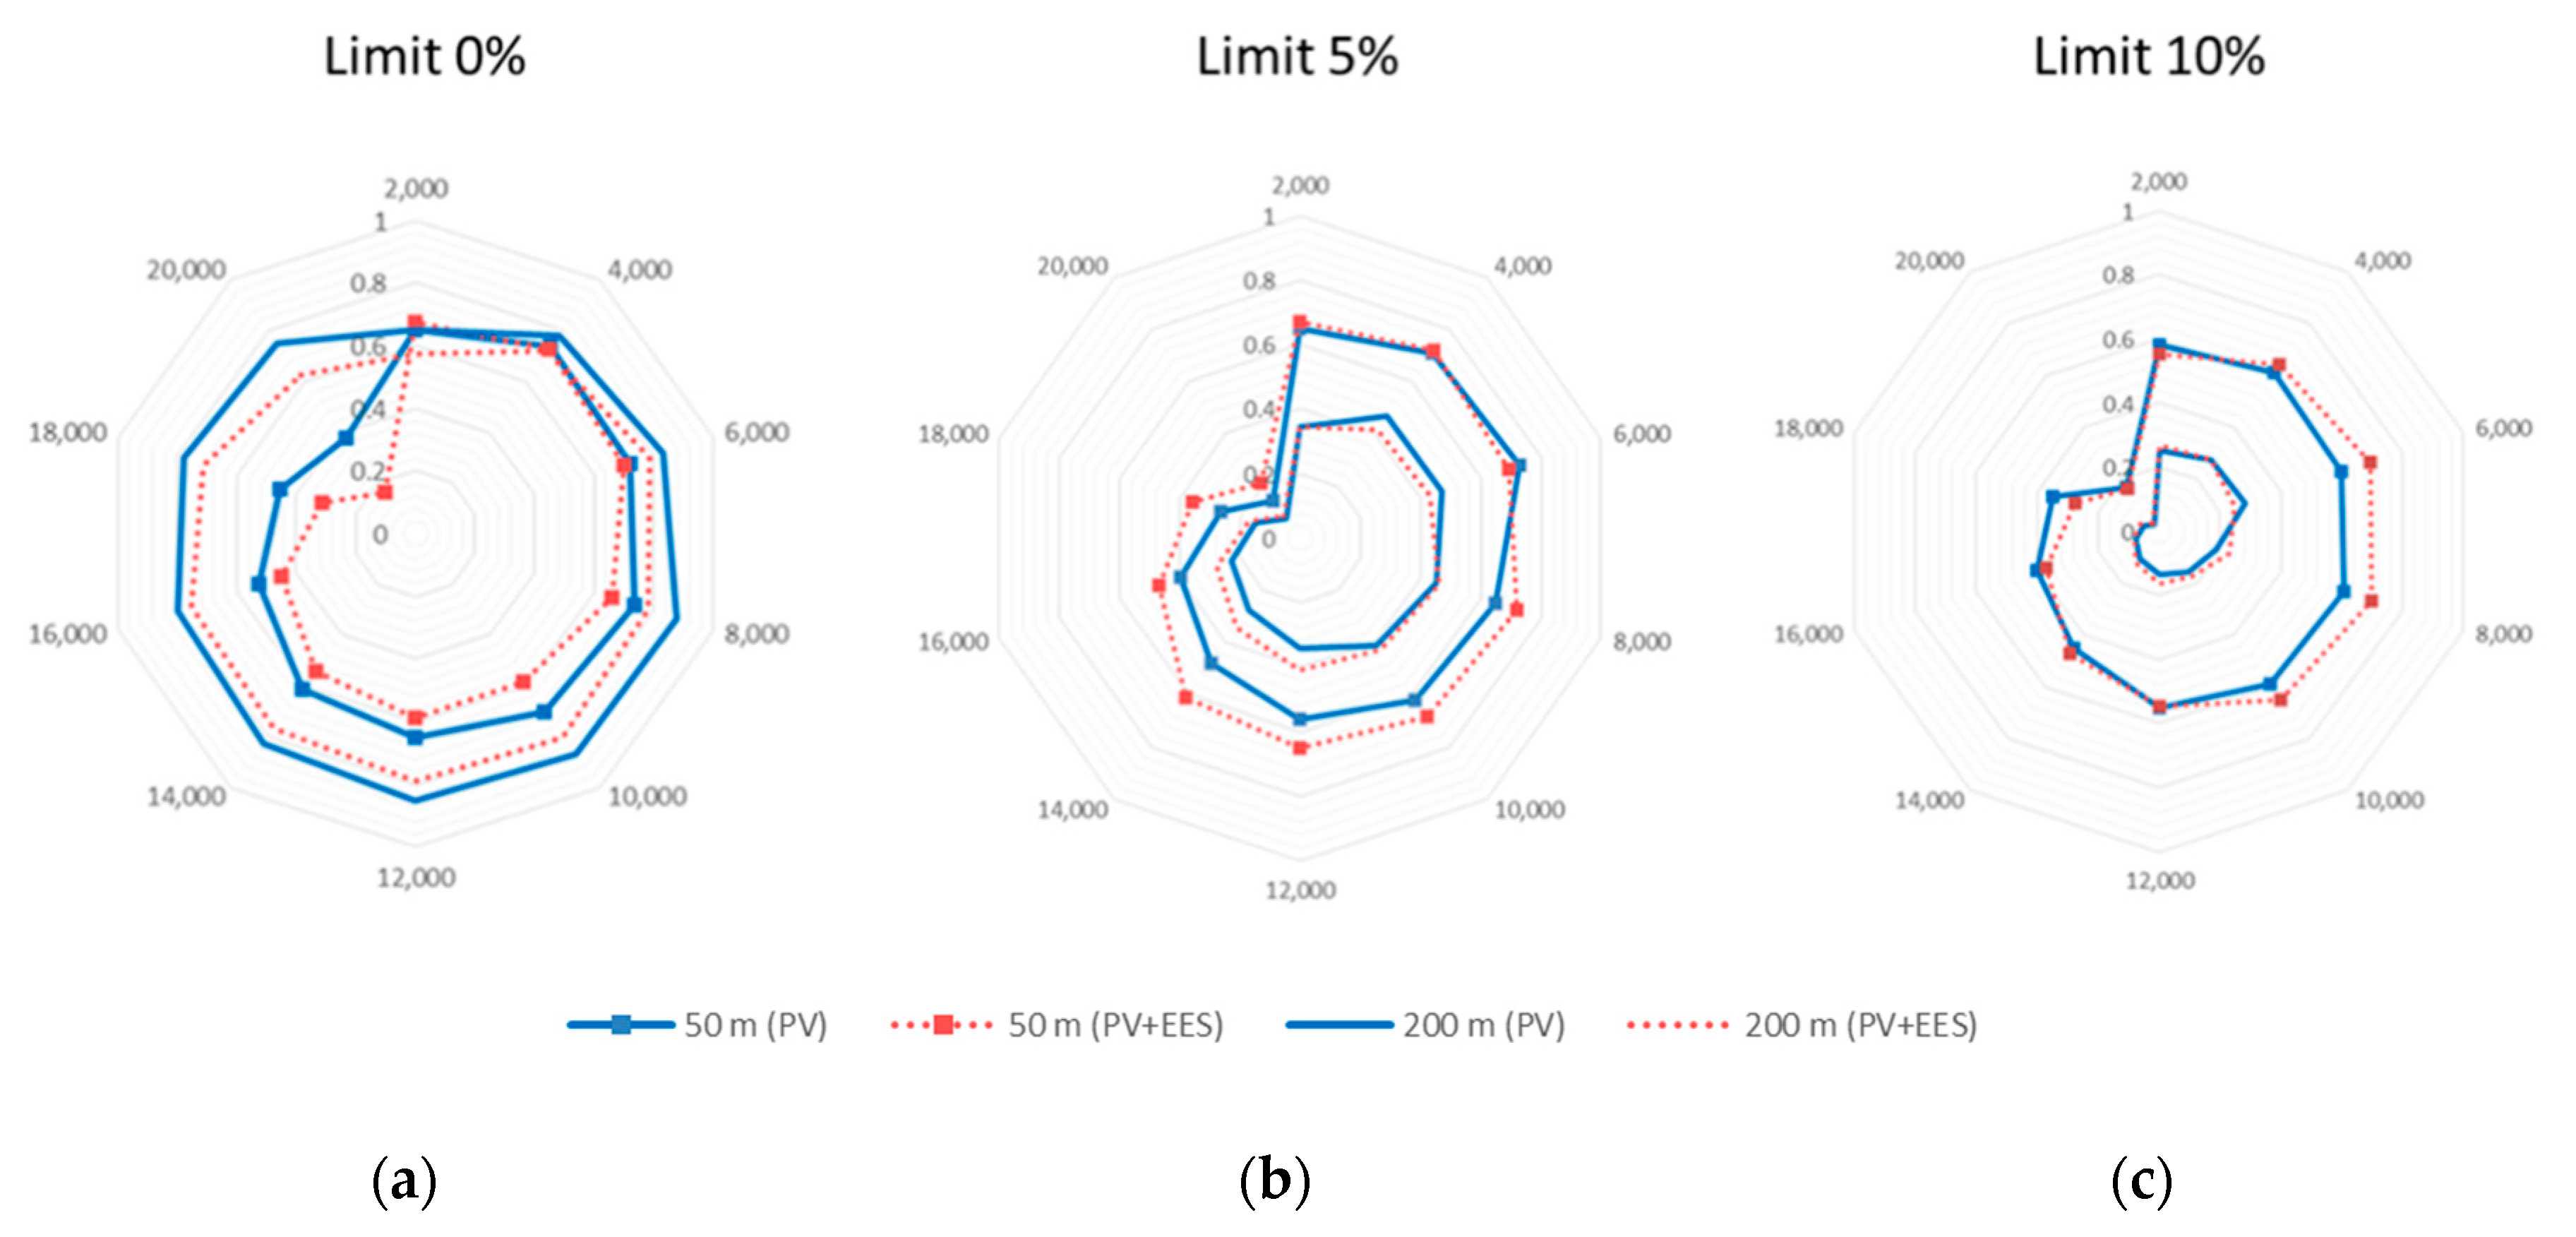
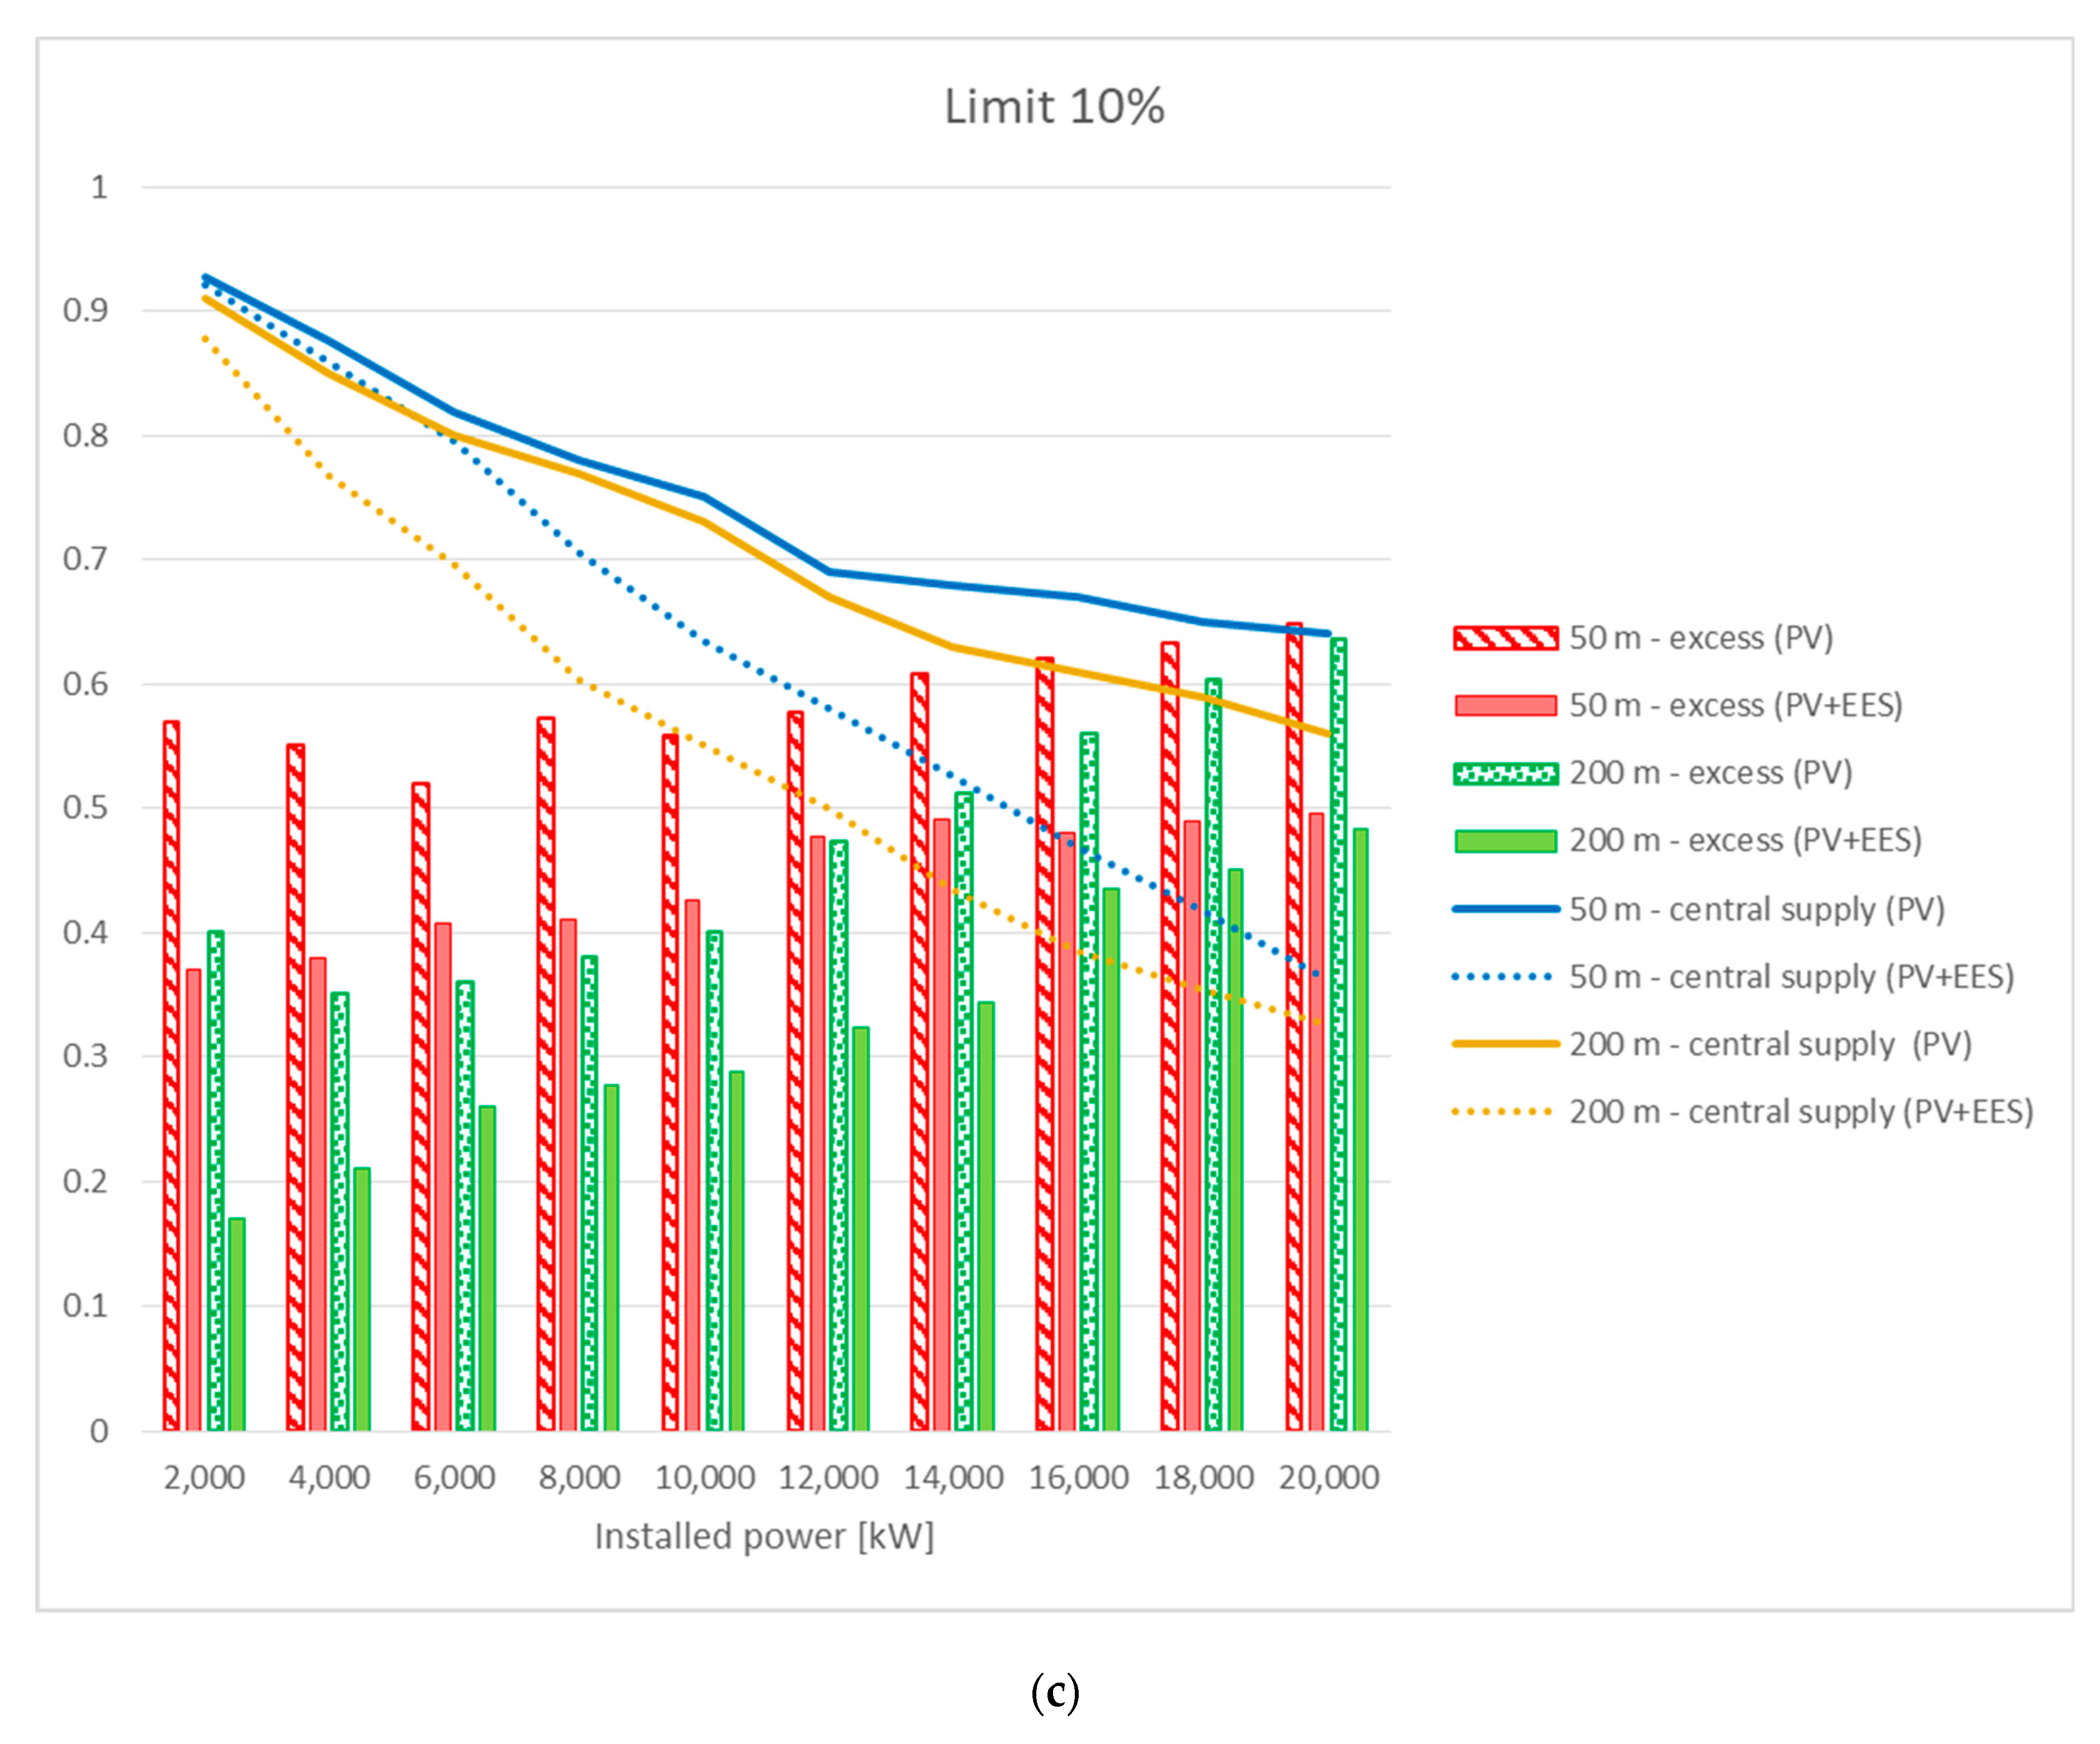
Moving forward, the performances of the distribution network are now discussed on the grounds of the and the . Differently from the , it is useful to evaluate the distribution network from the topological viewpoint; these two indexes quantify the electricity produced but not exploited from the distribution perspective and the electricity still requested to the centralized grid despite the insertion of PV panels and batteries.
In detail, the
measures the amount of electricity neither consumed nor distributed (scenario 1, PV), nor stored (scenario 2, PV-EES). The
evaluates the rate of electricity supplied by the traditional grid despite the constitution of the distribution network among agents equipped with PV panels (scenario 1, PV) and with batteries (scenario 2, PV+EES). The results, distinguished for the three assumed values of the
, are reported in
Figure 9.
Figure 9a reports both trends of the indexes for
, i.e., without considering restrictions on the counting of the links. The curves of the
show an increasing trend when increasing the installed capacity of the territory, this increase being more significant for distances of
. This behaviour can be explained considering that higher penetration of PV systems guarantees higher production; however, the electricity needs of the area remaining unchanged, the correspondent amount of production not exploited by agents increases as well. Overall, the lowest values of the
for any installed capacity result from scenario 2 (PV + EES) and
. Addressing the impact of the
, distances of
are preferred to yield lower values of the
for both scenarios. It is worth pointing out, however, that this result should not be considered as contrasting with the discussion made for the
and for which, on the contrary, lower distances are preferred for the exchange. As a remark, in fact, the two indexes measure the distribution aspect from different perspectives; the
counting the links used for the exchange in comparison to those constituting the initial topology of the network (and, therefore, not evaluating how much electricity effectively flows along these links), the
evaluating the electricity not exploited within the network. As a general observation, the curves show a decreasing trend in increasing the installed capacity of the territory. This is not surprising, in fact, as increasing the production agents gains the twofold advantages of both satisfying their demands and distributing electricity, thus reducing the amount of electricity that would have been otherwise requested from the traditional grid. The decrease is more evident in the case of scenario 2 (PV + EES), highlighting the beneficial impact that batteries have on the reduction in supply from the traditional power plants. Regarding the
, the distance of
is unfavourable for both scenarios, the supply from the central agent being, in this case, higher than in the other cases. This result is reasonable since higher distances allow for a more connected neighborhood and, the more electricity is distributed among the agents, the higher the reduction from the centralized grid. The decrease is significant for scenario 2 (PV + EES) and installed capacities higher than
; here, in fact, the electricity from the power plant reduces until circa 30% of the initial supply needed to cover the whole electricity demand of the area. The decrease also remains significant for scenario 1 (PV), the traditional supply almost being halved in this case.
Quite similar considerations apply when
and
, reported in
Figure 9b and in
Figure 9c, respectively. For
in scenario 1 (PV), an overall decrease in the
can be noticed, especially for installed capacities below
. Finally, in
Figure 9c, it is clearly shown how the insertion of the limit in the counting of the links affects the distribution network, not only from the qualitative aspect, but also from the quantitative one. In fact, in this case, the amount of electricity not distributed within the network of prosumers is significantly higher.
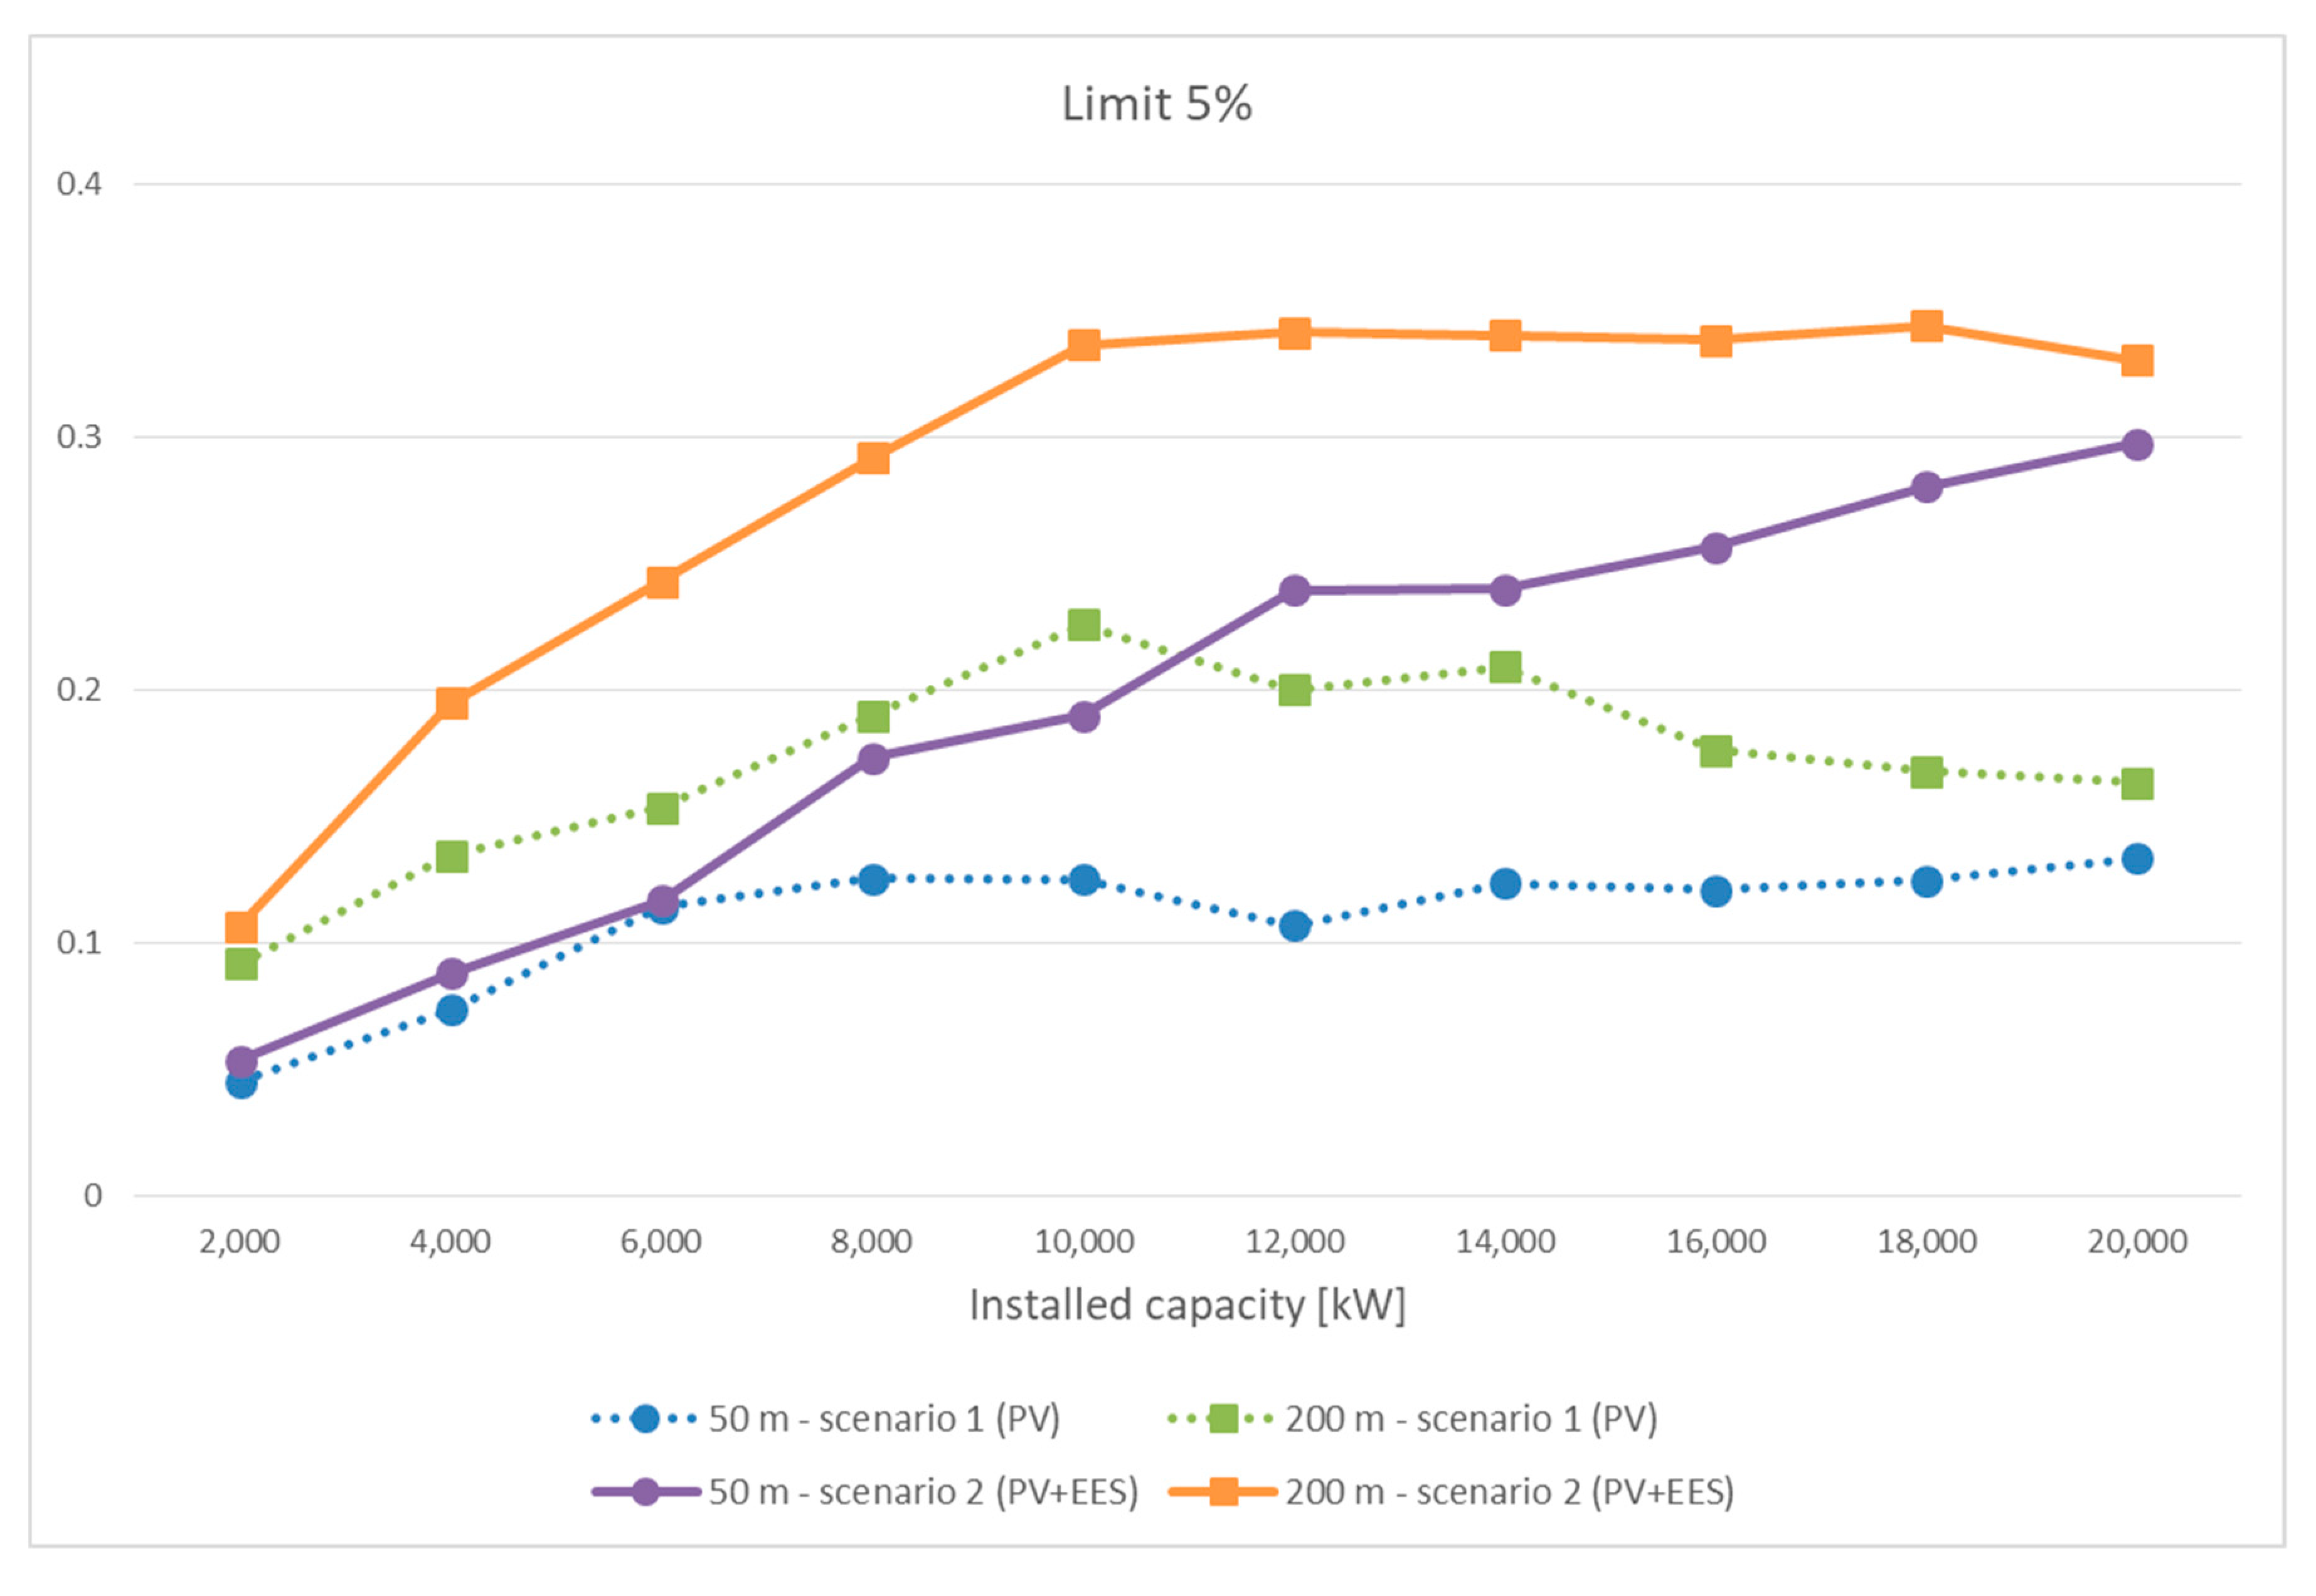
As a further remark, the trends of the two indexes
and
have been merged into a unique graph, reported in
Figure 10, in order to evaluate their combined effect on the distribution pattern. To this scope, it has been chosen to comment the median value of
without losing validity for the other operating configurations. Considering scenario 1 (PV), the curves have an initial increase until the installed capacity of
. Subsequently, when increasing the installed capacity within the territory beyond this value, the combined effect of the two indexes decreases. The installed capacity of
corresponds to circa 50% of buildings covered by PV panels, this percentage being in accordance with the results obtained for the
(higher values were attained in correspondence to
, representing 40% of buildings of the area, in almost all configurations). Therefore, it can be stated that, to some extent, the energetic aspects of the distribution match with the topological issues. This discussion also applies to scenario 2 (PV + EES) when the distance is set to
. When the distance of connection among agents is set to
, instead, the curves show an increasing trend when increasing the installed capacity within the area, thus not allowing preferential combination of the indexes.
5. Conclusions
The study of urban energy distribution networks of prosumers equipped with renewable energy-based production systems and energy storages has been addressed in this paper, developing an agent-based model. The aim of the model was to investigate the impact of different operational conditions on the performances of the distribution network, in terms of both the rate of links used for the exchange and the energy requested to traditional fossil power plants. To demonstrate the potentiality of the model, the distribution network has been simulated in a real urban area in Catania with respect to two different scenarios, the first evaluating the distribution of energy produced by PV panels, the second integrating Li-Ion batteries to PV panels. Simulations run under several operating conditions, i.e., evaluating the penetration of PV panels in the area (expressed as installed capacity), the permitted distance of connection among agents and the rate of links’ usage.
As a general comment, the constitution of a network of energy exchanges among prosumers can be considered beneficial for both the energy self-sufficiency of installers and the distributive aspects. In fact, the distribution among prosumers permits an increase in the effective exploitation of renewable sources within urban areas and a significant decrease in the supply from traditional power plants. More specifically, the results from the simulated case study open the discussion on the distribution among prosumers from two different viewpoints. The first considers the topological arrangements of the links, the second the evaluation of the energetic performances of the distribution. With regard to the links’ infrastructure, higher utilization rates can be achieved by distances of around and total installed capacity of , which corresponds to a coverage of circa 40% of the roofs’ availability of the area. By comparing the two scenarios, it can be seen how the insertion of batteries enhances the utilization rate of links, with electricity also being exchanged during nightly hours (when PV panels do not produce). A critical parameter for the evaluation of the distribution among prosumers is the distance of connection; this is true even when introducing the limits in the counting of the links used for the electricity exchange. When considering the trends of the two indexes and , i.e., the produced electricity neither distributed nor stored and the electricity supplied by the traditional grid, it can be observed that the results are to some extent affected by the initial topology of the links of the distribution network. Indeed, the opposite conditions of excess electricity and supply from the grid can be explained considering that electricity is considered as excessive due to the fact that there are no agents to whom this electricity can be distributed and/or that the upper levels of the batteries do not permit further storage. In other words, this condition does not necessarily mean that the agents have been totally satisfied from neighboring agents.
Policy and Managerial Implications
To the present day, there is evidence that urban areas consume around the 67% of the global energy demand and are responsible for over the 75% of global carbon emissions [
1]. Besides, it is equally known that proper actions should be put in force to invert this dramatic increasing trend. To this scope, the European Union has enacted the Directive 2019/944 for the diffusion of renewable-based production systems to reach the twofold objectives of reducing both the exploitation of fossil sources and carbon emissions [
67]. In particular, the European Commission recognizes the crucial importance for consumers “to consume, to store and to sell self-generated electricity […]” as well as the need to favoring “new technologies and consumption patterns, including smart distribution grids […]. Community energy can also advance energy efficiency at household level” [
67]. Moreover, as recommended by the Directive 2019/944 [
67], proper “citizen energy communities” should be recognized and regulated to allow active participation in decentralized grids without losing access to national markets. Under this framework, the definition of proper tools simulating these new energy scenarios is of utmost importance to orient governments and planners in the evaluation of the distribution potentiality of specific areas. In this direction, the agent-based model proposed in this paper can fit for this scope and contributes to raising the urban planners’ awareness of those operating conditions that effectively contribute to shaping the distribution among prosumers. Therefore, this model can be seen as an attempt to implement the European Directive at the urban scale. In this sense, it can help the understanding of managerial and operating conditions of the energy distribution, such as the distance between households, the effectiveness of building a link connecting two consumers and the impact of storage systems as a lever to increase the distribution potential of urban areas.


