Article

Effects of Tip Clearance Size on Energy Performance and Pressure Fluctuation of a Tidal Propeller Turbine

1
Division of Marine Engineering, Mokpo National Maritime University, 91 Haeyangdaehak-ro, Mokpo 58628, Korea
2
Division of Marine Mechatronics, Mokpo National Maritime University, 91 Haeyangdaehak-ro, Mokpo 58628, Korea
3
Coastal Development and Ocean Energy Research Center, Korea Institute of Ocean Science and Technology, 385 Haeyang-ro, Busan 49111, Korea
*
Author to whom correspondence should be addressed.
Submission received: 2 July 2020 / Revised: 28 July 2020 / Accepted: 3 August 2020 / Published: 5 August 2020
(This article belongs to the Special Issue Next Generation of Hydraulic Machines)

Abstract

:
Unavoidable tip clearance between blade tip and casing shroud plays an important role in the performance and characteristics of a tidal propeller turbine. In this work, the tip-leakage vortex (TLV) induced in the end-wall region was numerically illustrated by using the shear-stress transport (SST) k–ω turbulence model at various flow conditions and different tip-clearance sizes (TCSs). The swirling strength criterion was employed to visualize the tip-leakage vortex trajectory and investigate vortex evolution according to clearance size change. Although TLV occurs in both design and off-design conditions, vortex intensity develops strongly under excess flow rate with increased tip gap. The extreme influence of TCS on the turbine’s generated power and efficiency was predicted in steady simulations for four TCS cases, namely, δ = 0%, 0.25%, 0.5%, and 0.75%. With the extension of the tip gap, turbine performance was drastically reduced because of vigorous turbulent leakage flow combined with considerable volumetric loss. The effect of TCS on pressure fluctuation intensity were also explored on the basis of the transient simulation statistic. Maximal pressure variation amplitude and dominant frequency were presented in spectrum analysis utilizing fast Fourier transform.

Graphical Abstract

1. Introduction

Among the several types of renewable energy, hydropower is one of the most commonly used sources with a vast amount of power scale and applications since it is emission free, clean, and friendly to the environment. Hydro-turbines converting flow kinetic energy to electricity have been developed and are widely employed in both civil and industrial fields. An important factor affecting flow characteristics and turbine efficiency is the blade tip clearance. Due to the relative movement between turbine rotor and casing, the blade tip and shroud inner wall cannot contact each other at operating conditions, resulting in an unavoidable gap at the tip-end region. The flow through the tip clearance is called tip-leakage flow generated by the difference in pressure between two sides (pressure side and suction side) of the turbine blade [1]. Tip-leakage vortex (TLV) detrimentally impacts machine performance, such as via blockage of the main flow in the passages [2], reduction of energy extraction ability and efficiency [3], and excessive noise [4] due to the existence of separation flow, volumetric loss, and cavitation.
Tip clearance in several types of turbomachinery has been extensively investigated in a great number of studies employing both experimental and numerical methods. In terms of research applying the experimental approach, Wernet et al. made use of particle image velocimetry (PIV) measurement to identify tip-leakage flow behavior in an axial compressor and concluded that an excess flow rate gives rise to a larger TLV and worsens passage blockage [5]. Wu et al. [6,7], and Miorini et al. [8] also applied PIV to measure tip-leakage vortex structure and turbulence flow at the end-wall region in an axial water-jet pump. Instantaneous data and statistic of vortex strength revealed that leakage flow emerges as a wall jet with a shear layer containing a train of vortex filaments extending from the tip of the blade. The laser Doppler velocimeter (LDV) technique was utilized to figure out the vortex formation in a propeller fan, proposing three components of the vortex, namely, tip vortex, tip-leakage vortex, and leading edge separation vortex [9].
Due to the tiny size of the tip clearance, it is a tough mission to precisely adjust tip-clearance size (TCS) when experimenting with different TCS values. Therefore, along with the experimental approach, computational fluid dynamics (CFD) with advanced algorithms and high-performance computers have been usefully reliable tools for capturing the TLV trajectory and predicting its influence on turbomachinery operations. Zhang et al. combined experiment and simulation in a study on TLV trajectory in an axial flow pump [10]. The computational simulation illustrated the TLV course by using the swirling strength method, while high-speed cameras were used to observe TLV on the basis of cavitation tracing bubbles. The impact of tip-clearance size in a mixed-flow pump was numerically investigated [11,12]. The former applied fast Fourier transform (FFT) to analyze the frequency characteristics of tip-region pressure fluctuations, while the latter exposed the pressure fluctuation amplitude at different cavitation conditions using the Zwart–Gerber–Belamri cavitation model. In the case of the axial flow pump, Zhang [10] employed λ-criterion to investigate the development of TLV at three flow rate conditions while in the mixed-flow pump, Q-criterion was used to illustrate the vortex evolution with four TCS values, and pressure fluctuations on the blade were characterized through the spectrum analysis. Applying the entropy production method, Ji et al. analyzed the energy loss in a mixed-flow pump. The results showed that in the impeller, the head loss coefficient increased 1.62 times and the total entropy production rose by 142% when tip clearance augmented from 0.2 to 1.1 mm [13]. TLV was investigated in a pump-jet propulsor with numerical simulations [14]. Results not only visualized TLV structure and characteristics but also pointed out that propulsor efficiency sharply dropped with the expansion of clearance size. Meng et al. implemented a computational study on the influence of different tip-clearance sizes (unshrouded and shrouded blades) using the Reynolds averaged Navier–Stokes (RANS) equation for viscous turbulence flow [15]. The concerning issue involved in vortex structure in the flow field and the turbine’s heat-transfer characteristics when the turbine operated with four TCS cases. The study concluded that the negative incident angle at the downstream inlet increased according to the increase of TLV. Qiu et al. executed a numerical study of hydrodynamic and cavitation performance of a pump-jet propulsor with different TCSs and different oblique flow angles and found an interesting point that the efficiency with cavitation was higher than with non-cavitation conditions in oblique flow [16]. By analyzing the tip vortex of a duct axial fan on the basis of a highly resolved large-eddy simulation, Moghadam et al. found that there were a series of consequences relating to vortices at the tip-gap region when extending the clearance dimension, such as strong leakage flow, flow separation, and induced vortex that strengthens the main vortex intensity [17].
Nevertheless, the aforementioned literature mainly focused on the research objects of axial pumps, mixed-flow pumps, and gas turbines, while tip clearance in hydro-turbines had not been considered. In this study, numerical simulations applying the shear-stress transport (SST) k–ω turbulence model were conducted to demonstrate TLV formation under design and off-design conditions, and evaluate the influence of different tip-clearance sizes on the energy performance and stability of a propeller turbine. Computational results were compared and validated by experimental data provided in the references to ensure the precision of the numerical method. The distribution of velocity vectors and pressure coefficient contour at the tip-gap were also illustrated. Lastly, the amplitude and frequency property of pressure fluctuations on the turbine blade for four clearance cases were analyzed in transient simulations.

2. Turbine Model

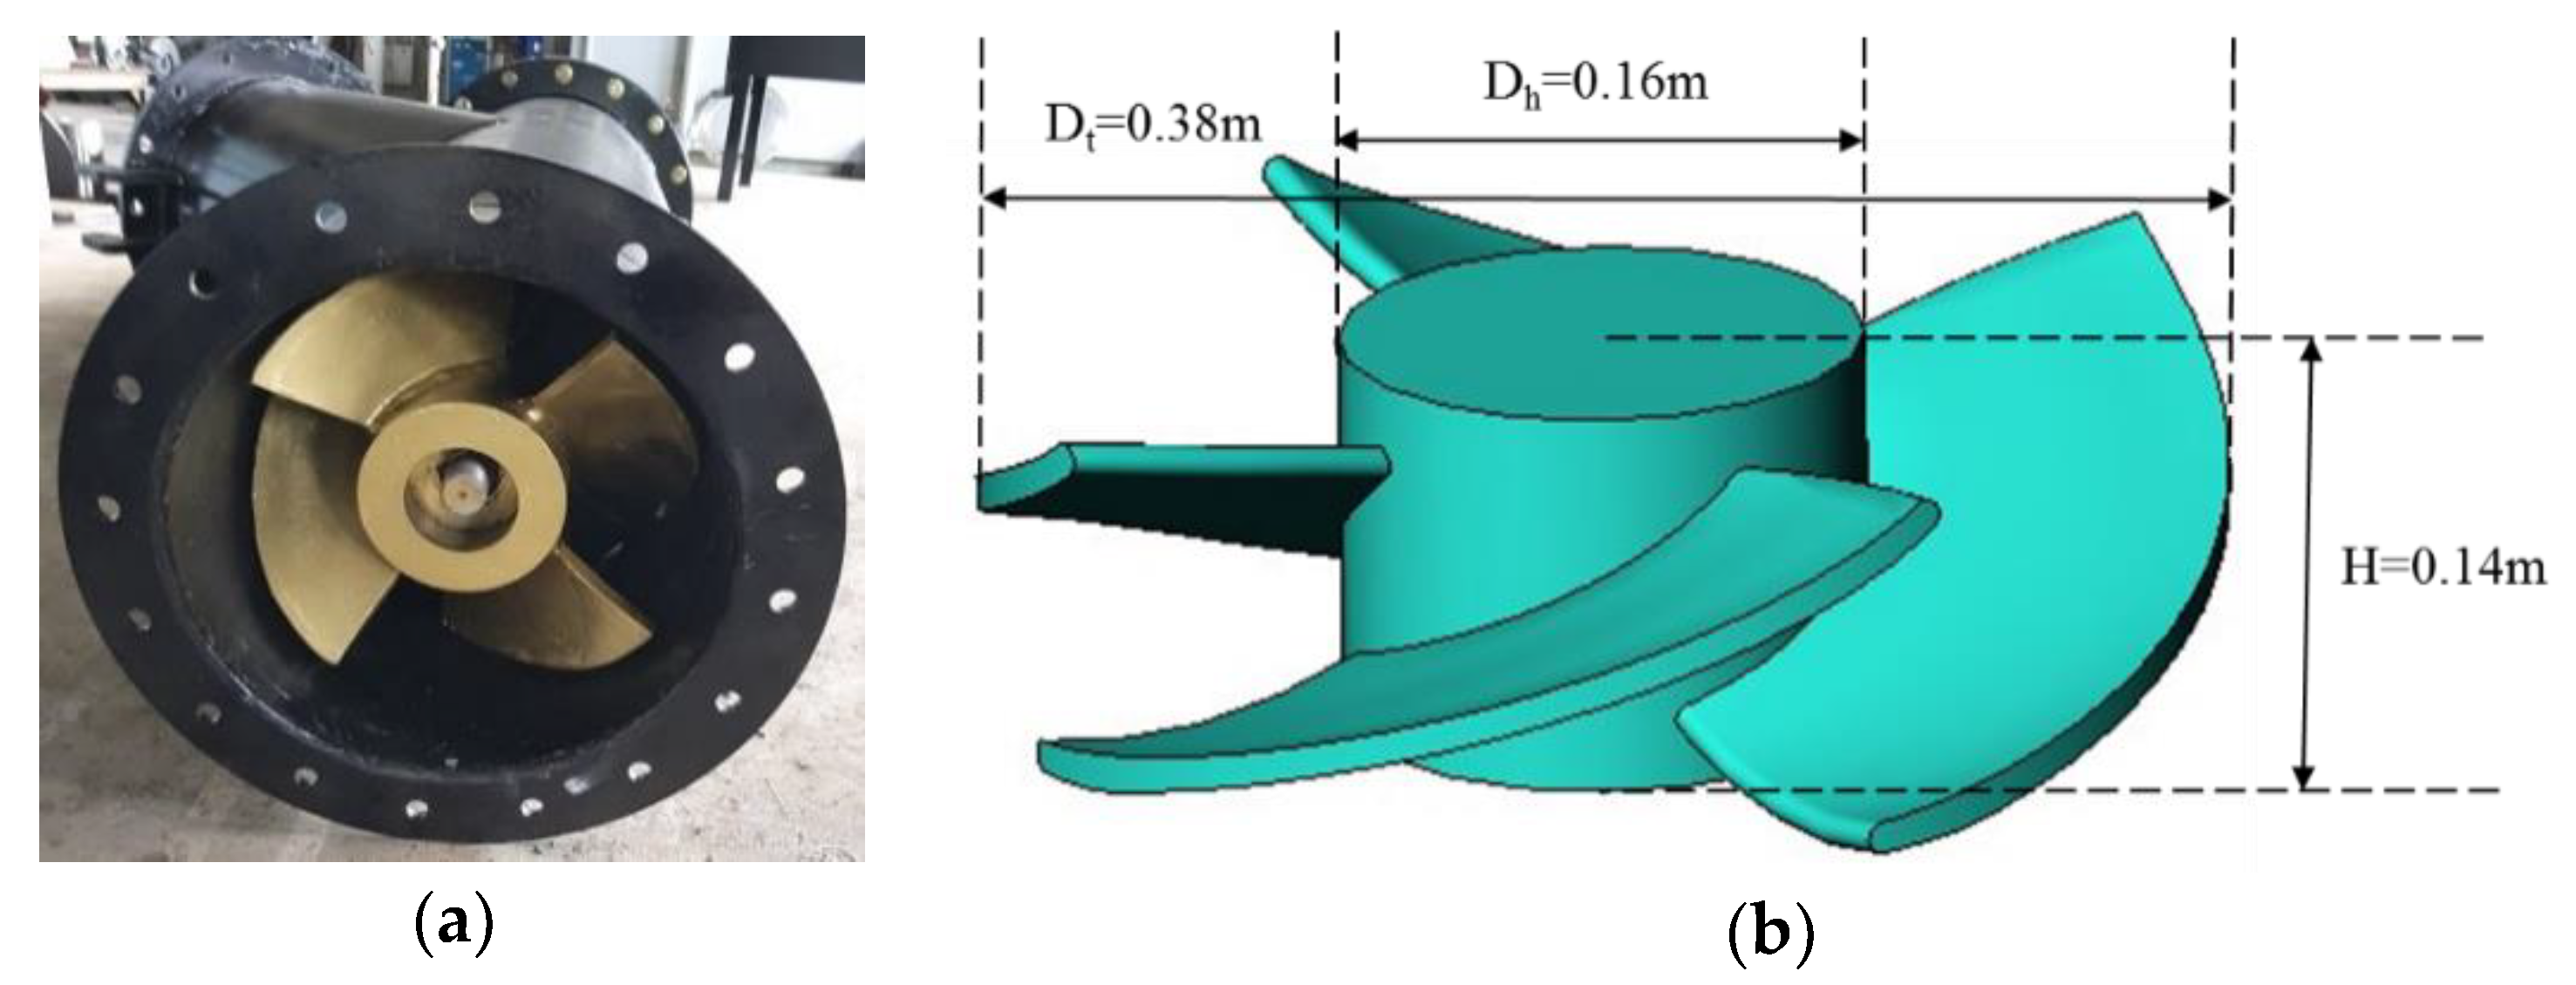
2.1. Physical Model of Propeller Turbine

The turbine runner was designed on the basis of free-vortex theory combined with Euler’s head equation; the design process of the turbine runner was presented in detail in previous research performed by Tran et al. [18]. The well-known free-vortex theory originally comes from the law of conservation of angular momentum that was applied in designing several types of compressible and incompressible flow machinery [19,20]. The current surveyed turbine was developed to operate with a gross head of 2 m, a rated flow of 0.25 m3/s, and a rotational speed of 450 rpm. The turbine runner consisted of four constant-thickness blades formed by sections with the pitch-to-chord ratio in the range of 0.7–0.9 (from hub to tip). Relying on the calculated parameters of the chord length, blade inlet angles, and blade outlet angles for all blade sections (refer to [18]), the 3D geometry of the blade runner was created with BladeGen—a packet in ANSYS Workbench. The manufactured rotor of the propeller turbine was made of Nickel Aluminium Bronze Alloy (ASTM B 505 C95800), which contained 9% aluminium, as well as additions of iron and nickel for strength. The 3D design geometry and manufactured model of the turbine runner blade are displayed in Figure 1, and the main turbine design parameters are presented in Table 1.

2.2. Tip-Clearance Configurations and Monitoring Points

Tip-clearance size in this study is referred to as a non-dimensional value and can be determined by Equation (1). The blade chord fraction defining the monitoring point’s position along the blade chord from leading edge to trailing edge is specified in Equation (2).
δ = T C S D m a x .   100 %
λ = S C
where TCS, tip-clearance size; Dmax, maximal diameter of the turbine blade; λ , blade chord fraction; S, point position from the leading edge; and C, blade chord length.
The pressure coefficient is a dimensionless number describing the relative pressure throughout a flow field, and is defined as
C P = P l o c a l 0.5 ρ U t i p 2
where Plocal, local static pressure; and Utip, blade tip velocity in the design condition.
Hydraulic power, output power, and hydraulic efficiency are calculated using the following equations:
P h = ρ g Q H
P m e c = T ω
η h = P m e c P h
where Ph, hydraulic power; Pmec, mechanical power generated in turbine shaft; ρ, water density; ηh, hydraulic efficiency; Q, flow rate; H, effective head; T, torque on runner blade; and ω, rotational speed.
In this study, four values of tip-clearance size, namely, δ = 0%, 0.25%, 0.5%, and 0.75% (corresponding to actual sizes of 0.0, 0.95, 1.9, and 2.85 mm, respectively) were considered to analyze the tip-clearance effects. For each TCS case, a series of monitoring points were set along the blade tip, as shown in Figure 2. The points, PS1–PS11, were located on the pressure side of the tip region, from the leading to the trailing edge of the runner blade. In the same way, there were corresponding points named SS1–SS11 at the blade-tip suction side. Similar monitoring points were also placed at blade spans 0.8 and 0.6 (80% and 60% of blade height) to collect pressure statistic at these positions to examine pressure fluctuations.

3. Numerical Method

3.1. Turbulence Model and Boundary Conditions

In the current study, CFD simulations were performed with commercial code ANSYS-CFX 17.0 to predict the formation of the tip-leakage vortex and evaluate the detrimental effects of the vortex on the energy absorption capability of the hydro-turbine. This multi-purpose code solves three-dimensional RANS equations for steady and turbulent fluid flow, especially in the field of turbomachinery simulations and analyses.
The shear-stress transport k–ω turbulence model was developed by Menter to solve the complex flows by combining the advantages of the k–ε model in the far-field and of the k–ω model in viscous sub-layer at near-wall regions [21]. It was chosen as the turbulence model for simulations because of its good capability in estimating vortex appearance and flow separation with adverse pressure gradients near the complex geometry surfaces. The validation of the SST turbulence model can be found in research performed by Zhang et al. [10], Bardina et al. [22], and Chen et al. [23]. Moreover, a number of studies involving the flow in pump-jet propulsors, mixed-flow pumps, and propeller turbines have confirmed the reliability of the SST k-ω turbulence model with favorable results [13,14,16]. In this turbulence model, the eddy viscosity is defined as the function of the turbulence kinetic energy-k and turbulence frequency-ω:
μ t = ρ α 1 k m a x ( S F 2 , α 1 ω )
F 2 = t a n h [ { m a x ( 2 k β ω y ; 500 μ ρ y 2 ω ) } 2 ]
where α1 and β, model constants: α1 = 5/9, β’ = 0.09 [24]; F2, blending function in boundary layer flow; and S, an invariant measure of the strain rate.
Figure 3 shows three components of the computational domains in simulations, namely, the suction, runner, and discharge domains. Since the four runner blades were the same as each other in all aspects, one-fourth of the simulation domain (90° periodicity) was utilized instead of the full-size domain in order to reduce calculation time and computational resources. At the inlet of the suction domain, total pressure corresponding to the designed gross head was applied with a turbulence intensity of 5%. Meanwhile, the flow rate was specified at the outlet of the discharge domain. At all wall boundaries, smooth and no-slip wall conditions were enabled. The rotational periodicity interface option was put into service for the couples of the side surfaces in each domain. As for the interfaces between stationary and rotating domains, the multi-reference frame approach was applied to steady-state calculations and the sliding mesh method was adopted in transient calculations to exchange the flow field information between domains. At first, the steady-state simulations were carried out to assess the impact of tip-clearance size on turbine performance; then, results were taken as initial suggestions for the transient simulations to monitor pressure fluctuations at the tip-gap region of the turbine. The time step for transient simulations was 1.1 × 10⁻³ s corresponding to 3o when the turbine rotates at the design speed. The convergence criterion was set as 10–5 for the root-mean-square residual value.

3.2. Mesh Strategy and Grid Independent Analysis

The reliability of the numerical calculations is related to the quality of the computational gird. In the current study, all domains were computationally discretized on the basis of structured hexahedral elements using the TurboGrid package in ANSYS Workbench, as shown in Figure 4. The refined mesh was implemented at the blade’s hub and shroud to achieve higher mesh density. Meanwhile, all wall surfaces (including blades and pipes) adopted 10-layer inflation to ensure accurate predictions of the flow field at near-wall regions. The local grid at the tip-gap region was also generated with 30 layers due to the complicated flow pattern in this area, giving rise to better observation of the vortex structure. The Y+ value for the wall grid of the turbine blade was around 1, satisfying the demand of SST k–ω turbulence model to precisely predict flow behavior in the viscous sub-layer [21].
Theoretically, the finer the mesh is, the fewer grid-related errors occur [25]. Therefore, gird sensitivity analysis was conducted to confirm the independence of simulation results with respect to grid size and to determine the reasonable element number considering the balance between accuracy and calculating-time consumption. Four sets of mesh with the number of elements ranging from 607,672 to 1,806,675 were created and exerted in steady simulations to verify grid size independence. Table 2 presents details of grid information in each case, and the resulting extracted power and turbine efficiency. Relying on the alteration of two key factors, and considering calculation cost and precision, grid size M3 with 1.2 million elements (for one-fourth of the domain) was employed in the present research.

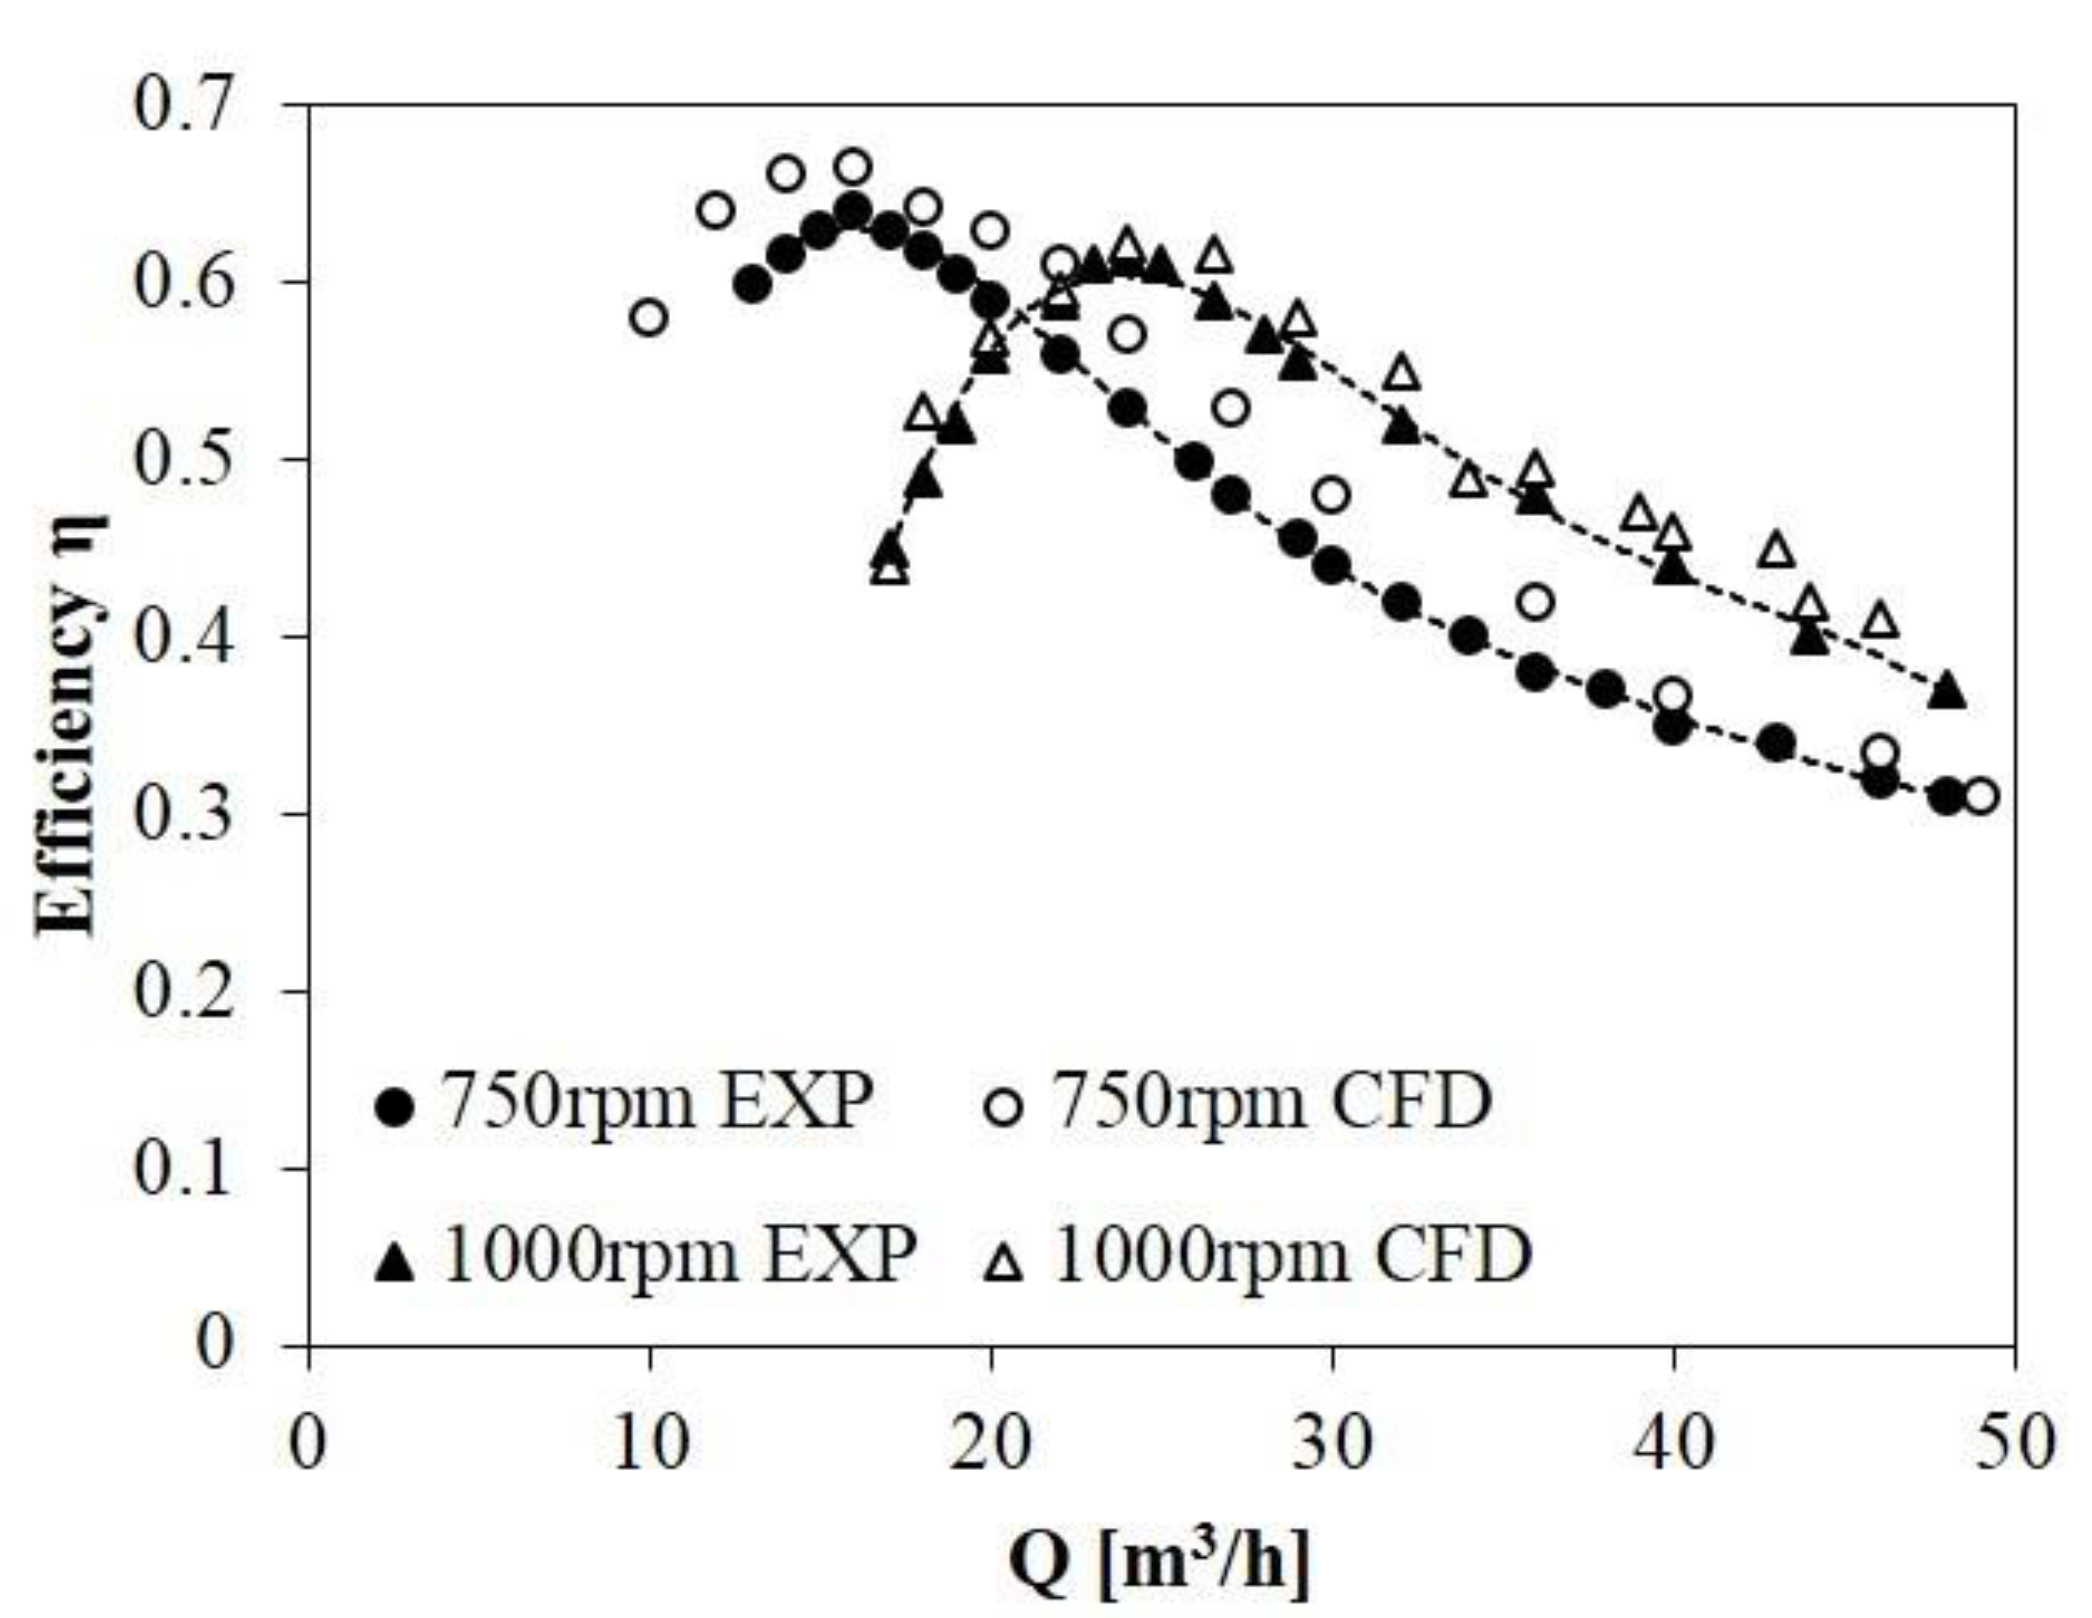
3.3. Numerical Results Verification

Experimental data of a five-blade propeller turbine reported by I. Samora et al. were used to validate our numerical method [26]. This propeller turbine was designed on the basis of free-vortex theory and a constant-thickness-blade prototype was made to perform the experiment at different rotational speeds and flow conditions to characterize its performance curves. The main parameters of the turbine were blade thickness of 1.7 mm, tip diameter of 84.8 mm, hub-to-tip ratio of 0.5, and chord length at tip and hub of 52 and 27 mm, respectively. Figure 5 displays the manufactured prototype and the 3D geometry built with BladeGen of the five-blade propeller turbine.
Turbine characteristics observed by experiment and simulation were compared at 2 rotational speeds, 750 and 1000 rpm, and at a wide range of flow rate conditions (shown in Figure 6). Despite small disparities, efficiency curves revealed good agreement between experimental data and simulation results, verifying the accuracy of the numerical approach applied in the current study.

4. Results and Discussion

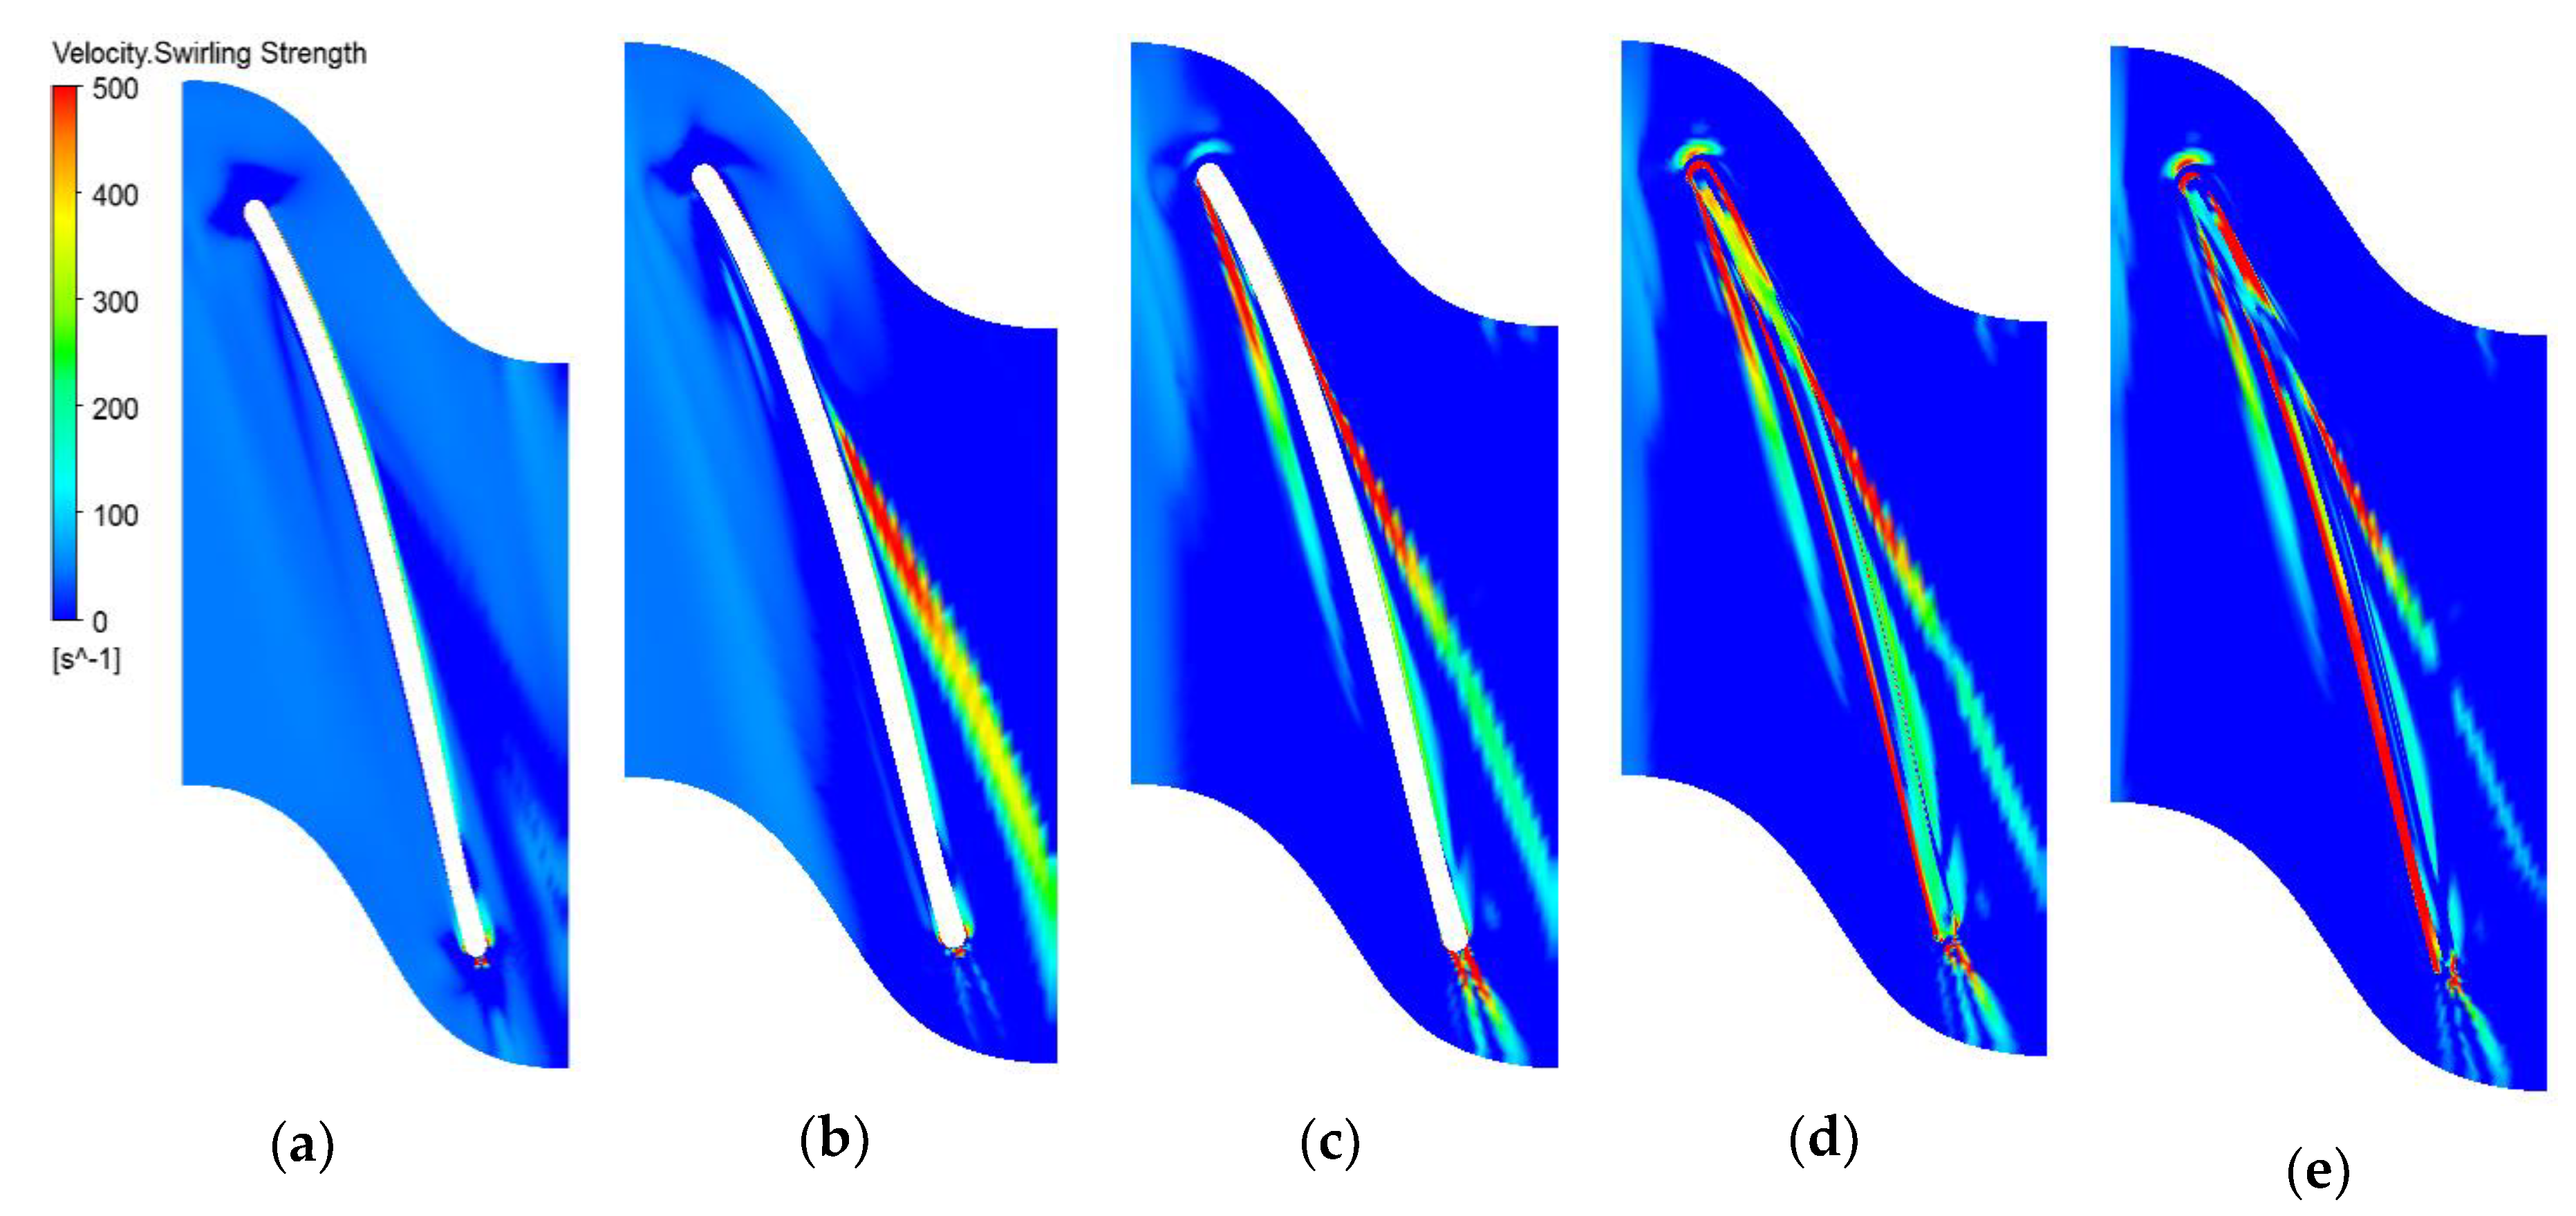
4.1. Trajectories of Tip-Leakage Vortex at Different Tip-Clearance Sizes and Various Flow Conditions

In the three-dimensional flow field, the characteristics equation for velocity gradient tensor D ¯ is given by
λ 3 + P λ 2 + Q λ + R = 0
where P, Q, and R are three invariants of velocity gradient tensor D ¯ . P = −tr( D ¯ ), Q = 1 2 [ t r ( D ¯ ) 2 t r (   D ¯ 2 ) ] , and R = −det ( D ¯ ) .
For incompressible flow, P = 0, so the discriminant of Equation (7) can be defined as
= ( Q 3 ) 3 + ( R 2 ) 2
In the case of discriminant ∆ > 0, the velocity gradient tensor ( D ¯ ) has one real eigenvalue, λr, and a pair of complex eigenvalues, λcr ± i.λci. The strength of the swirling motion can be qualified by λci, the so-called swirling strength of the vortex. The swirling strength criterion visualizes the vortex by taking the imaginary part of the complex eigenvalue into consideration [27] and this criterion was employed to recognize the TLV trajectory at the tip-gap region in this study. Figure 7 illustrates the TLV trajectory for three tip-gap values, δ = 0.25%, 0.5%, and 0.75%, at three flow-rate conditions, 0.92, 1.0, and 1.12 Qd. The leakage vortex appeared under any flow rate for both design and off-design conditions, while vortex strength and inception location varied according to flow discharge and clearance size. TLV occurrence can be observed in two main types: vortex at the pressure side (PS vortex) and vortex at the suction side (SS vortex). The PS vortex developed by the flow through the tip corner of the blade leading edge, extended along the blade chord length, and likely appeared at low flow rate. The SS vortex, on the other hand, which was caused by pressure disparity between the two sides of the blade, initially formed at around one-third of the blade length (λ = 0.3) with its magnitude surpassing that of the PS vortex. Under partial flow rate, the leakage vortex appeared on both sides of the blade, despite slight dominance of the SS vortex. At the starting point, the PS vortex had a strong intensity, and then the swirling strength was reduced at the vortex tail when it interacted with the main flow within the passage. With increased flow rate, due to the influence of the mainstream, the PS vortex was pushed closer to the blade with a remarkable decrease in swirling. Under excess flow conditions, the PS vortex seemed to be terminated, while the TLV on the blade suction side strongly developed and became the most powerful, indicated by the high density of red vortex streamlines at the vortex core. Another feature is that the relative angle of the SS vortex trajectory to the blade significantly changed as flow rate rose. Higher flow rate not only caused vigorous swirling but also broadened the vortex-blade angle. For instance, in Figure 7c, the rising point of the SS vortex ships toward the blade leading edge, and the relative angle of the vortex core increases from 10° at a flow rate of 0.92 Qd to 20° at 1.12 Qd. A similar relation of the vortex pattern and flow discharge was also described by Zhang, who captured the tip-leakage vortex trajectory on the basis of cavity bubbles with high-speed digital cameras [10]. Due to the change of the blade loading according to flow rate, the pressure difference between the two sides of the blade varied. The SS vortex directly depends on pressure difference; hence, flow rate imposed a significant impact on the trajectory of the SS vortex. Concerning the clearance size effect, the TLV at both PS and SS forms earlier and more obviously as the tip gap extends, at the same flow conditions. At low discharge rate, the PS vortex in the case of δ = 0.25% was negligible with smoothly straight streamlines, while it evidently took place for larger clearance sizes (δ = 0.5% and δ = 0.75%). Under the design and the higher flow rate, the dominant SS vortex experienced a similar trend of development when becoming stronger at moderated TCS, and the most extreme for the biggest TCS. In these circumstances, the intensive growth of the SS vortex disturbed normal flow within the passage, leading the turbine dynamics behavior to deteriorate.
The distributions of pressure coefficient and velocity vectors at the tip region, blade chord fraction λ = 0.5, under the design flow rate are shown in Figure 8 to emphasize the correlation between TCS and tip flow structure. For all TCS cases, after being sucked into the clearance between the blade tip and shroud, a separation flow happened at the top PS corner (Label A). The separation corner vortex induced by the sharp blade geometry gave rise to a drastic reduction in pressure coefficient Cp and a secondary vortex, which was mentioned in a handful of the literature [10,11]. The larger the TCS was, the more seriously the separated flow was observed. This phenomenon is a principal cause for cavitation occurring in the tip-gap region. To eliminate the detrimental impact of the corner vortex, the employment of turbine blades with round edges at PS is recommended. At the tip clearance near SS, due to the accelerated velocity within the narrow tip channel, the laminal wall jet flow appeared with evenly distributed velocity vectors (Label B). Straight jet flow (B) seemed to not be affected by the space of the tip clearance compared with flow in the other regions.
Reverse flow existing at the blade SS (Label C) was closely related to the SS vortex mentioned in Figure 7. With the growth of the tip gap, the reverse-flow area greatly expanded, indicating a fierce formation of the SS vortex in this position, especially at δ = 0.75%. As discussed above, vortices, as well as inverse direction vectors, can be identified by low-Cp regions. A considerable change in SS vortex intensity can clearly be seen in Figure 8a,c, where reverse flows were inappreciable and significant, respectively. In an experimental study conducted by Wu et al. using the PIV method, the existence of adverse flow near the suction side of a water-jet pump was proved by plotting the circumferential vorticity distribution at the tip-gap region [6]. Nonetheless, the authors only stated the employment of vorticity visualization for examining the flow structure at tip clearance with a single clearance value instead of showing the relationship between TCS and vortex strength, as in the present study.
To comprehensively understand vortex trajectory, the swirling intensity on five circumferential sections corresponding to 0.9, 0.95, 0.98, 0.985, and 0.99 of blade height are visualized in Figure 9. The figure provides another view of the vortex path concerning distribution in the radial direction. In general, the higher the blade span is, the more evidently TLV is captured. Both PS and SS vortex could be prominently observed, with maximal swirling strength appearing on the 0.99 blade span. On the 0.95 span, the existence of the PS vortex seemed negligible, and the two vortex types were fully suppressed on the 0.90 span due to mergence into the main passage flow. Observation of the tail vortex at the blade trailing edge raised an interesting point about another vortex’s component, which is not visible in Figure 7. Therefore, Figure 9 sufficiently demonstrates the vortex structure with three TLV components, namely, the pressure side, suction side, and trailing vortices. Between them, the SS vortex dominated, accounting for the largest proportion of the TLV that caused remarkable deterioration in turbine performance by the dint of reverse flow and volumetric loss.

4.2. Effects of Tip-Leakage Flow on Turbine Performance

Figure 10 presents the relationship between the turbine’s generated power, efficiency, and volumetric loss, and the rotational speed for different values of tip-clearance size. The power performance curve in Figure 10a shows that the extracted power gradually decreased with greater rotational speed. With the widening of TCS, a step-drop in turbine power was perceived. The power reductions were significant as TCS changed from δ = 0% to 0.25% and 0.5%, accounting for a fall at the design point by 10% and 24%, respectively. Nevertheless, this value was slightly lower in the case of δ = 0.75% compared to previous TCS. Generally, the tip clearance implemented the adverse impact on the power capture ability of the tidal turbine, and this influence was decided by two key factors, gap size and turbine speed.
Turning to the volumetric loss in Figure 10b, there was no doubt that wider tip-shroud distance resulted in larger quantity of leakage flow over the gap (defined by ΔV), showing the high volumetric loss indicated by dotted lines in the figure. For a fixed flow rate, the volumetric loss was eliminated when the turbine rotor rotates faster, reducing it from 1.7% to 0.55% in the case of δ = 0.75%, and from 1.1% to 0.4% for δ = 0.5%. This was due to the blocking effect of water flow at the end-wall region at high rotational speed in turbomachines. Moreover, there was a similar trend of efficiency degradation according to TCS rise. The increased TCS was also reported to cause the efficiency decline in a pump-jet propulsor and a mixed-flow pump in studies executed by Lu [13] and Liu [11], respectively. The seriousness of the downgraded performance was remarkably affected by the type of machinery and machine working conditions. Nevertheless, narrow tip clearance was not always beneficial, and the maximal efficiency could be achieved at certain TCS. Jung et al. figured out the above result in a study of the tip-leakage flow in an axial-flow fan equipped with winglets [28]. Characteristic curves in Figure 10b show that, at high rotational speed, especially speeds higher than the design point, the decrease in turbine efficiency tended to be worse than that at low speed. Because of the impact of leakage vortices and volumetric loss, under the design speed, turbine efficiency dropped by 3.8%, 6.4%, and 7.8% corresponding to TCS δ = 0.25%, 0.5%, and 0.75%, respectively. Loss even doubled to 7.9% (for δ = 0.25%) and 20% (for δ = 0.75%) at the highest rotational speed. In other words, the turbine operating under excess speed and large tip clearance was unable to effectively exploit energy from water.
The correlation of generated power and turbine efficiency to various tip-clearance sizes is illustrated in Figure 11 to provide an overall view. When tip clearance was extended, the power and efficiency of the propeller turbine declined in accordance with a virtual liner rule. On the basis of turbine performance in the designed working conditions for different TCS values, the relationships between extracted power and TCS, and between turbine efficiency and TCS, are expressed in two first-order functions:
{   P = 1005 δ + 2808 η = 10.14 δ + 75.39 .
Relying on these functions, power and efficiency can be quickly predicted for other tip-clearance sizes with fairly accurate results that could save much time and effort in maintenance and supervision processes.

4.3. Analysis of the Pressure Fluctuations on Turbine Blade

The results of the steady-state simulations were considered as initial suggestions to carry out transient calculations to figure out the relation of tip-clearance size, and the rise and fall of the pressure over time. Transient simulations for turbine operation in 15 revolutions of the turbine runner were taken place, and collected data within the last 10 cycles were employed for pressure fluctuation analysis. To evaluate the influence of tip-leakage vortex on pressure alteration, the pressure fluctuation intensity was defined as follows:
p ¯ = 1 N i = 1 N p i
p ¯ = 1 N i = 1 N ( p i p ¯ ) 2
I p f = p ¯ 1 2 ρ U t i p 2
where N, number of samples; pi, pressure at each time step; p ¯ , average pressure; p ¯ , pressure fluctuation intensity; Ipf, dimensionless pressure fluctuation intensity; and Utip, blade-tip velocity in design conditions.
Figure 12 demonstrates the alteration of pressure fluctuation intensity for a series of monitoring points along the turbine blade from the leading to the trailing edge under the design flow rate. The strength of pressure variation of 66 points located at three spans, namely, tip span, 0.8 span (80% of blade height Hb), and 0.6 span (60% Hb) in the case of δ = 0.5% is displayed in Figure 12a. The most salient feature is that pressure fluctuation intensity in SS overwhelmed that in PS at all spans. This phenomenon was appropriate to the results shown in Figure 7, where the SS vortex developed stronger than the PS vortex. Results showed that pressure instability was most obvious at the blade tip, especially in the suction side, with the highest value peaking at λ = 0.3, where the SS vortex initially formed. Due to the evolution of the SS vortex along the blade length, the pressure at blade tip SS drastically varied. Whereas, pressure fluctuation intensity at the tip span of the blade PS was considerably lower except for a noticeable point at the tip leading edge. At this position, Ipf achieved the maximal value of 0.01, revealing that the PS vortex incepted there, and it induced vigorous turbulent flow at the tip corner of the blade PS. The characteristics of the pressure fluctuation curves at 80% and 60% Hb were similar. At the SS, Ipf witnessed no significant change in magnitude along the blade chord. Nonetheless, Ipf at PS was opposite, which was relatively low in the first half and stably increasing in the second half of the blade length. This can be explained by the interaction of the SS vortex from the adjacent blade since it developed along the blade chord, went through the middle channel, and impinged on the PS of another blade.
Figure 12b expresses the pressure fluctuation at the tip span for three cases of tip-clearance size, namely, δ = 0.25%, 0.5%, and 0.75%. It is worth noting that the Ipf for δ = 0.75% was in the first position, followed by δ = 0.5%, and δ = 0.25% was last. In general, the intensity of pressure variation in SS was much higher than that in PS for all tip-shroud distances. The discrepancy in pressure fluctuation for three curves in PS was small, but the disparity for SS was remarkable. Maximal Ipf in δ = 0.75% was double that for δ = 0.25%, accounting for 0.02 and 0.01, respectively. While Ipf for PS achieved strong magnitude at the leading edge and trailing edge, Ipf for SS experienced a different trend, peaking at the chord fraction from 0.3 to 0.4. This proved the significant influence of SS vortex formation on pressure fluctuation in the above region. A high degree of pressure changes leads to low stability of tidal turbine performance, resulting in poor behavior in electric generation. All in all, the wider the clearance at the blade tip is, the more turbulent the tip-leakage flow becomes, and the more seriously is the turbine performance degraded.
Fast Fourier transform (FFT) was performed with the pressure data of 22 monitoring points along the blade tip chord (11 points in each side, namely, PS1–11 and SS1–11) for four cases of tip clearance. FFT results on frequency property are displayed in Figure 13. Pressure oscillations in SS, represented by red lines, were much higher than those in PS (blue lines) at most positions along the blade tip. The high intensity of pressure alteration occurred not only at leading edge and trailing edge (in the case of δ = 0%) but also at some other locations, particularly at λ = 0.3 and 0.4, corresponding to points SS4 and SS5 in turn, proving that the existence of a tip vortex at these positions contributed to pressure instability on the blade. The level of pressure fluctuation also increased according to the extension of tip clearance. The maximal pressure fluctuation amplitude for δ = 0%, δ = 0.25%, δ = 0.5%, and δ = 0.75% was 286, 398, 600, and 842 Pa, respectively. For a tip gap of 0.75%, the intensity of dominant frequency was considerably augmented, being 3 times higher than the data in the case of zero clearance. Although blade loading depends on the main flow discharge rate, it is also affected by leakage flow over the tip gap. When tip-clearance size was enlarged to δ = 0.5% and δ = 0.75%, leakage flow was strengthened with extreme vortices, harmfully impacting blade pressure stability. Liu et al. found the same phenomenon in a mixed-flow pump and concluded that, when TCS increased from 0 to 1 mm, the maximal amplitude of pressure fluctuation dramatically rose within the impeller, especially on the blade tip [11]. In the turbine here investigated, the detailed figures of the maximal amplitude of Ipf and dominant frequency for different TCSs can be found in Table 3. For four TCS values, tip pressure fluctuated the most at similar dominant frequencies, ranging from 16 to 18 Hz, which is approximately 2.4 times the rotating frequency of the turbine blade. Therefore, TCS exerted negligible influence on the dominant frequency of pressure variation in the surveyed propeller turbine. In a study of a pump-jet propulsor, Yu et al. also claimed that the tip-clearance effects did not change the frequency of thrust and torque variations, but it significantly influenced the fluctuation amplitude [29]. When the tip-gap expanded from 0 to 1 mm, the dominant frequency was almost constant as 75 Hz, while the maximal pressure fluctuation amplitude grew up from 400 to 1000 Pa. This similar observation raised a point that the dominant frequency of pressure alterations might only depend on machines type and working conditions. In contrast, the pressure stability on the rotor blade was deeply affected by TCS.

5. Conclusions

In the present study, we investigated the formation and trajectory of tip-leakage vortices in various working conditions with different tip-clearance sizes, and the influence of blade tip clearance on propeller turbine performance. On the basis of a thorough analysis of steady and transient numerical results, some key points were drawn, as follows.
In terms of tip vortex formation, three components of tip-leakage vortex were observed, namely, PS vortex, SS vortex, and trailing vortex, among them the magnitude of the SS vortex dominated the others, causing highly turbulent tip-leakage flow. A TLV could occur under any flow conditions, and swirling strength depended on flow rate and was proportion to clearance size. TCS had a significant impact on TLV evolution. Results showed that a larger TCS led to the enhancement of separation flow at the PS tip corner and the expansion of the reverse-flow area near the blade suction side. Tip-leakage flow with intensive swirling was observed in the turbine operating with a large tip-gap condition.
The existence of tip clearance gave rise to deterioration in the propeller turbine performance. With the increased TCS, the power generated and hydraulic efficiency of the turbine were drastically degraded. At the design point, extracting power experienced a reduction of 10% and 24% for TCS δ = 0.25% and δ = 0.5%, respectively. Meanwhile, in the case of the largest TCS, efficiency dropped by 7.8%, and loss became even more substantial at higher rotational speeds. The relationships between extracted power and TCS and that between turbine efficiency and TCS were expressed in two first-order functions.
Concerning pressure fluctuations, pressure at the suction side tip span varied at the highest rate at chord fractions of λ = 0.3 and λ = 0.4, corresponding to inception positions of the SS vortex, whereas that statistic peaked at the leading edge and trailing edge for PS. The dominant frequencies of pressure fluctuation for the four TCS cases were almost identical, from 16 to 18 Hz. Nonetheless, the maximal pressure alteration amplitude was remarkably increased with the extension of the tip gap. Maximal Ipf for δ = 0.75% was 842 Pa, three times higher than that feature in the case of zero clearance.

Author Contributions

Investigation and writing the paper, B.N.T.; formal analysis, B.N.T. and H.J.; funding acquisition, J.-S.P.; supervision, C.Y. and J.-H.K. All authors have read and agreed to the published version of the manuscript.

Funding

This research was funded by the Ministry of Trade, Industry, and Energy (project titled “Development of small hydropower generator using draft tube with guide vane”, project no. R0006292), and the Ministry of Oceans and Fisheries (project titled “Establishment of sea test-bed for tidal current energy converters”, project No. 20170333).

Conflicts of Interest

The authors declare no conflict of interest.

Nomenclature

PPower outputHEffective head
ηEfficiencyTTorque
QdDesign flow ratepiPressure at each time step
NRotational speedIpfDimensionless of pressure fluctuation intensity
DtTip diameterμtTurbulence viscosity
DhHub diameterkTurbulence kinetic energy
ZNumber of bladesωTurbulence frequency
δDimensionless of tip clearanceF2Blending function
λBlade chord fractionα1Model constant
CBlade chord lengthβModel constant
SMonitoring point position ∆VLeakage volume
CPPressure coefficientTCSTip-clearance size
PlocalLocal static pressureTLVTip-leakage vortex
UtipVelocity of the blade tipSSTShear-stress transport
ρFluid densityPSPressure side
PhHydraulic powerSSSuction side
PmecMechanical power

References

  1. Rains, D.A. Tip Clearance Flows in Axial Compressors and Pumps. Ph.D. Thesis, California Institute of Technology, Pasadena, CA, USA, 1954. [Google Scholar]
  2. Khalid, S.A.; Khalsa, A.S.; Waitz, I.A.; Tan, C.S.; Greitzer, E.M.; Cumpsty, N.A. Endwall blockage in axial compressors. J. Turbomach. 1999, 121, 499–509. [Google Scholar] [CrossRef]
  3. Denton, J.D. The 1993 IGTI scholar lecture: Loss mechanisms in turbomachines. J. Turbomach. 1993, 115, 621–656. [Google Scholar] [CrossRef]
  4. Hsiao, C.T.; Chahine, G.L. Scaling of tip vortex cavitation inception noise with a bubble dynamics model accounting for nuclei size distribution. J. Fluids Eng. 2005, 127, 55–65. [Google Scholar] [CrossRef]
  5. Wernet, M.P.; Zante, D.V.; Strazisar, T.J.; John, W.T.; Prahst, P.S. Characterization of the tip clearance flow in an axial compressor using 3D digital PIV. Exp. Fluids 2005, 39, 743–753. [Google Scholar] [CrossRef]
  6. Wu, H.; Miorini, R.L.; Katz, J. Measurements of the tip leakage vortex structures and turbulence in the meridional plane of an axial water-jet pump. Exp. Fluids 2011, 50, 989–1003. [Google Scholar] [CrossRef]
  7. Wu, H.; Miorini, R.L.; Tan, D.; Katz, J. Turbulence within the tip-leakage vortex of an axial waterjet pump. AIAA J. 2012, 50, 2574–2587. [Google Scholar] [CrossRef]
  8. Miorini, R.L.; Wu, H.; Katz, J. The internal structure of the tip leakage vortex within the rotor of an axial waterjet pump. J. Turbomach. 2012, 134, 031018. [Google Scholar] [CrossRef]
  9. Jang, C.M. Analysis of vortical flow field in a propeller fan by LDV measurements and LES-Part I: Three-dimensional vortical flow structures. J. Fluids Eng. 2001, 123, 748–754. [Google Scholar] [CrossRef]
  10. Zhang, D.S.; Shi, W.; Esch, B.P.M.B.; Shi, L.; Dubuisson, M. Numerical and experimental investigation of tip leakage vortex trajectory and dynamics in an axial flow pump. Comput. Fluids 2015, 112, 61–71. [Google Scholar] [CrossRef]
  11. Liu, Y.; Tan, L.; Hao, Y.; Xu, Y. Energy performance and flow patterns of a mixed flow pump with different tip clearance sizes. Energies 2017, 10, 191. [Google Scholar] [CrossRef]
  12. Xu, Y.; Tan, L.; Liu, Y.; Cao, S. Pressure fluctuation and flow pattern of a mixed-flow pump with different blade tip clearances under cavitation condition. Adv. Mech. Eng. 2017, 9, 1–12. [Google Scholar] [CrossRef]
  13. Ji, L.; Li, W.; Shi, W.; Chang, H.; Yang, Z. Energy characteristics of mixed-flow pump under different tip clearances based on entropy production analysis. Energy 2020, 199, 117447. [Google Scholar] [CrossRef]
  14. Lu, L.; Pan, G.; Wei, J.; Pan, Y. Numerical simulation of tip clearance impact on a pumpjet propulsor. Int. J. Nav. Arch. Ocean Eng. 2016, 8, 219–227. [Google Scholar] [CrossRef] [Green Version]
  15. Meng, F.; Zheng, Q.; Gao, J.; Fu, W. Effect of tip clearance on flow field and heat transfer characteristics in a large meridional expansion turbine. Energies 2019, 12, 162. [Google Scholar] [CrossRef] [Green Version]
  16. Qiu, C.; Huang, Q.; Pan, G.; Shi, Y.; Dong, X. Numerical simulation of hydrodynamic and cavitation performance of pumpjet propulsor with different tip clearances in oblique flow. Ocean Eng. 2020, 209, 107285. [Google Scholar] [CrossRef]
  17. Moghadam, S.M.A.; Meinke, M.; Schröder, W. Analysis of tip-leakage flow in an axial fan at varying tip-gap sizes and operating conditions. Comput. Fluids 2019, 183, 107–129. [Google Scholar] [CrossRef]
  18. Tran, B.N.; Kim, J.H. Design and analysis of a pico propeller hydro turbine applied in fish farms using CFD and experimental method. J. Korean Soc. Mar. Environ. Saf. 2019, 25, 373–380. [Google Scholar] [CrossRef]
  19. Singh, P.; Nestmann, F. Experimental optimization of a free vortex propeller runner for micro hydro application. Exp. Therm. Fluid Sci. 2009, 33, 991–1002. [Google Scholar] [CrossRef]
  20. Muis, A.; Sutikno, P. Design and simulation of very low head axial hydraulic turbine with variation of swirl velocity criterion. Int. J. Fluid Mach. Syst. 2014, 7, 68–79. [Google Scholar] [CrossRef] [Green Version]
  21. Menter, F.R. Review of the shear-stress transport turbulence model experience from an industrial perspective. Int. J. Comput. Fluid. Dyn. 2009, 23, 305–316. [Google Scholar] [CrossRef]
  22. Bardina, J.E.; Huang, P.G.; Coakley, T.J. Turbulence Modeling Validation, Testing, and Development; NASA Technical Memorandum 110446; Ames Research Center: Moffett Field, CA, USA, 1997; pp. 15–25.
  23. Chen, Z.; Kim, J.C.; Im, M.H.; Choi, Y.D. Analysis on the performance and internal flow of a tubular type hydro turbine for vessel cooling system. J. Korean Soc. Mar. Eng. 2014, 38, 1244–1250. [Google Scholar] [CrossRef]
  24. ANSYS, Inc. ANSYS CFX-Solver Theory Guide, Release 15.0; SAS IP, Inc.: Pittsburgh, PA, USA, 2013; pp. 89–90. [Google Scholar]
  25. Blazek, J. Computational Fluid Dynamics: Principles and Applications; Elsevier: London, UK, 2001; pp. 353–392. [Google Scholar]
  26. Samora, I.; Hasmatuchi, V.; Münch-Allign, C.; Franca, M.J.; Schleiss, A.J.; Ramos, H.M. Experimental characterization of a five blade tubular propeller turbine for pipe inline installation. Renew. Energy 2016, 95, 356–366. [Google Scholar] [CrossRef]
  27. Zhou, J.; Adrian, R.J.; Balachandar, S.; Kendall, T.M. Mechanisms for generation coherent packets of hairpin vortices in channel flow. J. Fluid Mech. 1999, 387, 353–396. [Google Scholar] [CrossRef]
  28. Jung, J.H.; Joo, W.G. Effect of tip clearance, winglets, and shroud height on the tip leakage in axial flow fans. Int. J. Refrig. 2018, 93, 195–204. [Google Scholar] [CrossRef]
  29. Yu, H.; Zhang, Z.; Hua, H. Numerical investigation of tip clearance effects on propulsion performance and pressure fluctuation of a pump-jet propulsor. Ocean Eng. 2019, 192, 106500. [Google Scholar] [CrossRef]
Figure 1. Runner blade. (a) Manufactured prototype; (b) 3D geometry of the turbine.
Energies 13 04055 g001
Figure 2. Monitoring points at blade tip.
Energies 13 04055 g002
Figure 3. Computational domains.
Energies 13 04055 g003
Figure 4. Mesh formation. (a) Fine mesh at tip clearance; (b) structured grid for calculation domains.
Energies 13 04055 g004
Figure 5. Five-blade propeller turbine. (a) Prototype [26]; (b) obtained 3D geometry for validation.
Energies 13 04055 g005
Figure 6. Comparison of five-blade turbine efficiency for computational fluid dynamics (CFD) and experimental results [26].
Energies 13 04055 g006
Figure 7. Tip-leakage vortex trajectory at different tip-clearance sizes and flow rates. (a) δ = 0.25%; (b) δ = 0.5%; (c) δ = 0.75%; (left) 0.92 Qd; (center) 1.0 Qd; (right) 1.12 Qd.
Energies 13 04055 g007
Figure 8. Pressure coefficient and velocity vector distribution at λ = 0.5 (designed Q). (a) δ = 0.25%; (b) δ = 0.5%; (c) δ = 0.75%.
Energies 13 04055 g008
Figure 9. Swirling intensity on different circumferential sections (δ = 0.5%, designed Q). Span (a) 0.9, (b) 0.95, (c) 0.98, (d) 0.985, and (e) 0.99.
Energies 13 04055 g009
Figure 10. Variation of turbine-characteristic curves for different tip-clearance sizes. (a) Power vs. speed; (b) leakage volume and efficiency vs. speed.
Energies 13 04055 g010
Figure 11. Relationship between power, efficiency, and tip-clearance size in design conditions.
Energies 13 04055 g011
Figure 12. Pressure fluctuation intensity on blade. (a) Ipf for three spans (δ = 0.5%); (b) Ipf at tip edge for three tip-clearance size (TCS) cases.
Energies 13 04055 g012
Figure 13. Frequency diagram for different TCSs. (a) δ = 0%; (b) δ = 0.25%; (c) δ = 0.5%; (d) δ = 0.75%.
Energies 13 04055 g013
Table 1. Turbine specifications.
ParametersSymbolUnitValue
Power outputPkW3
Gross headHm2
Designed flow rateQdm3/s0.25
Rotational speedNRPM450
Tip diameterDtm0.38
Hub diameterDhm0.16
Hub-to-tip ratioDh/Dt-0.4
Number of bladesZ-4
Table 2. Grid size in relation to turbine power (P) and efficiency (η).
DomainsM1M2M3M4M5
Suction67,600114,920188,82525,220318,825
Runner391,560512,040624,990730,410820,770
Discharge148,512277,440395,080527,680667,080
Mesh size607,672904,4001,208,8951,510,2901,806,675
p/P111.0024141.0035351.003681.004445
η/η110.9998020.9997460.9996040.999472
Table 3. Maximal pressure fluctuation magnitude and dominant frequency for various TCSs.
Monitor PointsMaximal Amplitude of Pressure Fluctuation [Pa]Dominant Frequency [Hz]
δ = 0%δ = 0.25%δ = 0.5%δ = 0.75%δ = 0%δ = 0.25%δ = 0.5%δ = 0.75%
PSSSPSSSPSSSPSSS
P14528616139839015016516718181617
P22018016482751367012018181617
P325190345276562505158818181617
P430185462501255602515918181617
P54817860365632544684218181617
P651175721739036610037018181617
P7751669818026229513040618181617
P8901571252021393007938118181617
P912014017024614830216137518181617
P101604221831422031822337018181617
P1121523027537033560031546518181617

