Infectious Diseases, Market Uncertainty and Oil Market Volatility


1
USEK Business School, Holy Spirit University of Kaslik, Jounieh BP446, Lebanon
2
Department of Economics & Finance, Southern Illinois University Edwardsville, Edwardsville, IL 62026-1102, USA
3
Department of Economics, University of Pretoria, Pretoria 0002, South Africa
4
Department of Economics, Helmut Schmidt University, Holstenhofweg 85, 22008 Hamburg, Germany
*
Author to whom correspondence should be addressed.
Energies 2020, 13(16), 4090; https://0-doi-org.brum.beds.ac.uk/10.3390/en13164090
Submission received: 13 July 2020
/
Revised: 2 August 2020
/
Accepted: 4 August 2020
/
Published: 7 August 2020
(This article belongs to the Special Issue Coronavirus Crisis, Energy Markets and Policies and Their Macro-Financial Implications)
Abstract
:We examine the predictive power of a daily newspaper-based index of uncertainty associated with infectious diseases (EMVID) for oil-market volatility. Using the heterogeneous autoregressive realized volatility (HAR-RV) model, we document a positive effect of the EMVID index on the realized volatility of crude oil prices at the highest level of statistical significance, within-sample. Importantly, we show that incorporating EMVID into a forecasting setting significantly improves the forecast accuracy of oil realized volatility at short-, medium-, and long-run horizons. Our findings comprise important implications for investors and risk managers during the unprecedented episode of high uncertainty resulting from the COVID-19 pandemic.
1. Introduction
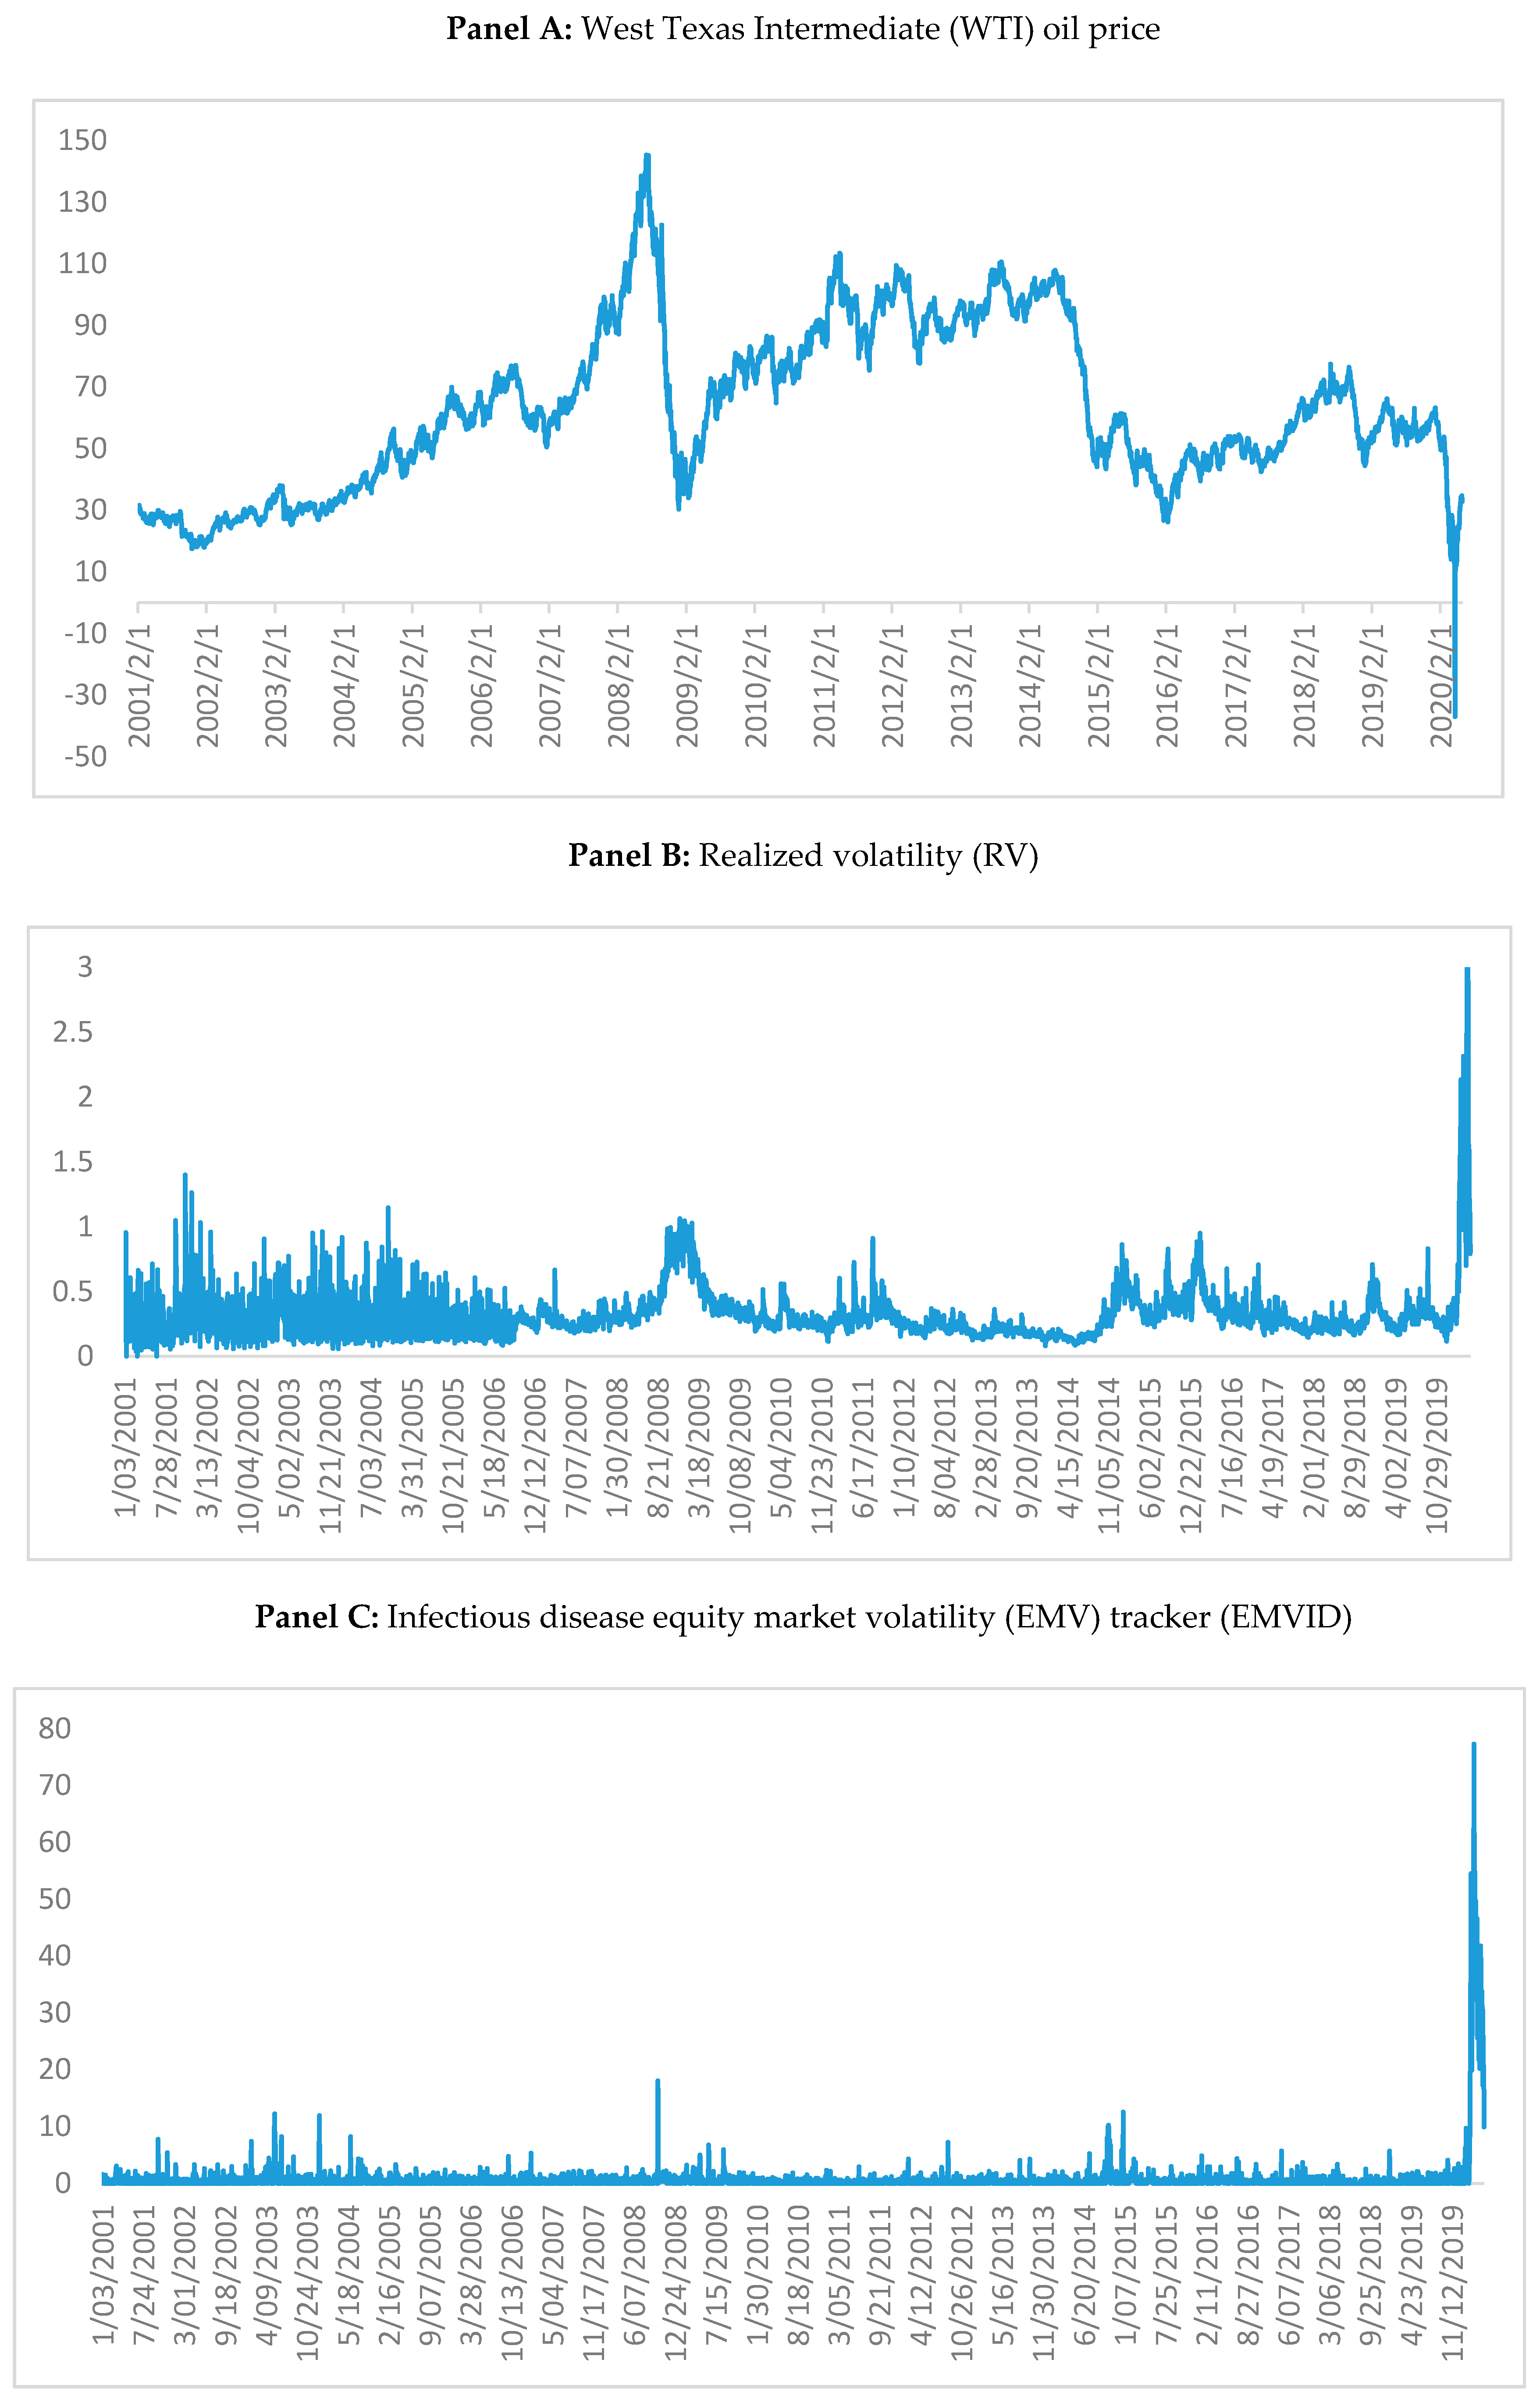
The COVID-19 outbreak and the lockdown instituted to contain the spread of the virus have triggered the worst economic downturn since the Great Depression. In parallel, financial markets, including the oil market, have experienced a substantial and unprecedented spike in the level of uncertainty, which ultimately engenders major challenges to policy makers, corporations, as well as oil traders, regarding accurate volatility forecasting that is crucial for pricing, hedging, and planning purposes. Extending a steady sharp downturn from early 2020, due to declining global demand in the wake of the COVID-19 outbreak, the crude oil market experienced massive price fluctuations in March and April 2020 due to the price war between Russia and Saudi Arabia, which was mainly triggered by the drop in the demand for oil, due to the COVID-19 outbreak (see Figure 1). Given the role of the pandemic as a catalyst for economic slowdown and uncertainty, not only in financial markets but also the oil market, the objective of this paper is to assess, for the first time, the predictive power of historical uncertainty related to infectious diseases of various types (such as the COVID-19, MERS, SARS, Ebola, H5N1, and H1N1) for oil return volatility.
Clearly, oil price fluctuations can be driven by multiple factors, including cashflow and non-cashflow related risks. From an economic perspective, there is ample evidence suggesting that oil and stock markets are driven by a common factor that reflects concerns about economic growth [1] as fluctuations in global oil demand capture information, regarding future expectations for both oil prices and stock market performance [2]. The interlinkages between commodity and financial markets have been further strengthened by the greater level of participation of financial investors in the commodity, particularly energy, markets, thus opening a new channel in which investor sentiment spills over across these markets. Indeed, [3] showed that financial risk shocks capture significant predictive information over oil market volatility, even after controlling for supply and demand related shocks in the oil market. This suggests the presence of a distinct channel of risk transmission between financial and commodity markets, driven possibly by non-cashflow related factors, reflecting the effect of changes in investor sentiment via the risk premia embedded in required returns. In the case of the COVID-19 epidemic, one can argue that the spillover effects of financial risk shocks, driven by cashflow related uncertainties, have been channeled to the energy market via the time variation in risk appetite, which in turn affects the hedging demand for the volatile commodities. In other words, financial market related shocks that are driven by the uncertainty in real economic activity, due to the pandemic, could be transmitted to the oil market via, (i) the common fundamental determinants the oil and financial markets share, and (ii) changes in investors’ risk appetite that drive the hedging demand and/or speculative activities in the oil market.
Regardless of the transmission mechanism between oil and financial market related shocks, accurate estimates of oil-price volatility are not only important for the pricing of related derivative assets, but also used to compute optimal hedge positions, to minimize oil price related risks in cash flow streams. Motivated by the increasing involvement of financial investors in commodities, particularly oil, and the rise in co-movements across these two markets, particularly in the wake of market uncertainty (e.g., [4]), a large number of recent studies have provided evidence on the spillover of risks from financial markets to oil, and the predictive power of financial risk shocks over oil market volatility (e.g., [3]). Consequently, a growing strand of the literature has examined the role of various measures of uncertainties, in forecasting (both within and out-of-sample) the volatility of oil returns (see for example, [5,6,7,8,9]). However, despite the emergence, and severity, of the COVID-19 pandemic, the academic literature lacks evidence on the ability of uncertainty, related to various infectious diseases and pandemics, in forecasting oil price volatility. Considering that the pandemic has led to such an unexpectedly devastating effect on the world economy, examining the role of infectious disease related market uncertainty, as a predictor of oil market volatility, can provide valuable insights for market analysts to improve their forecasting models, particularly in the wake of the unprecedented uncertainty.
In this study, we employ the recently developed newspaper-based index of [10], which tracks daily equity market volatility (EMV), in particular the movements in the Chicago Board Options Exchange (CBOE)’s Volatility Index (VIX), due to infectious diseases. Furthermore, realizing that the information contained in intraday data leads to more precise estimates and forecasts for daily return volatility [11], we contribute to earlier research on oil market volatility, by forecasting the realized volatility (RV) of oil returns, computed from five-minute-interval intraday data, via a modified version of the popular Heterogeneous Autoregressive (HAR) model introduced by [12] (See [13,14] for detailed reviews of this literature).
2. Data and Methodology
2.1. Data
The data for the realized volatility (RV) of oil returns were obtained from Risk Lab as maintained by Professor Dacheng Xiu at Booth School of Business, University of Chicago (data are downloadable from: https://dachxiu.chicagobooth.edu/#risklab). Risk Lab collects trades at their highest frequencies available and then cleans them using the prevalent national best bid and offer (NBBO) that are available, up to every second. The estimation procedure for realized volatility follows [15], and is based on the quasi-maximum likelihood estimates (QMLE) of volatility built on moving-average models (MA(q)), using non-zero returns of transaction prices sampled up to their highest frequency available, for days with at least 12 observations. In this paper, we used the realized volatility estimates based on 5-minute subsampled returns of the NYMEX light crude oil futures, which is the only publicly available source of robust estimates for realized volatility associated with the oil market.
The infectious disease EMV tracker was recently constructed by [10] as a newspaper-based index available at daily frequency from January 1985. The index is available at: http://policyuncertainty.com/infectious_EMV.html. This index is based on textual analysis of four sets of terms, namely E: economic, economy, financial; M: “stock market”, equity, equities, “Standard and Poors”; V: volatility, volatile, uncertain, uncertainty, risk, risky; ID: epidemic, pandemic, virus, flu, disease, coronavirus, MERS, SARS, ebola, H5N1, H1N1, and then obtaining daily counts of newspaper articles that contain at least one term in each of E, M, V, and ID across approximately 3000 US newspapers. The raw index of uncertainty associated with infectious diseases (EMVID) count was scaled by the number of all articles in the same day, next, [10] multiplicatively rescaled the resulting series to match the level of the VIX, by using the overall EMV index, and then scaling the EMVID index to reflect the ratio of the EMVID articles to total EMV articles. Based on data availability of the two series under study, our sample period was 3 January 2001–14 May 2020. Figure 1 presents the plots for the daily time series, and their summary statistics are given in Table 1. As seen in Figure 1, the unprecedented crash in oil price into negative territory, observed in Panel A, is accompanied by a notable spike in daily realized oil return volatility as well as the EMVID tracker index series, in Panels B and C.
At this stage, as pointed out to us by an anonymous referee, it must be emphasized that the EMVID index, being a news-based index, suffers from the possible limitation that it fails to account for the fact that viruses vary in seriousness and in geographical reach, by treating all pandemics equally. Having said this, it is also true that the newspaper coverage of a virus that is more serious and global in nature is likely to be relatively greater, and hence might accommodate for the concern associated with the equal weighing. Furthermore, the EMVID index is based on U.S. newspapers only, and captures stock market volatility, hence the index does not necessarily account for the multi-dimensional impact of pandemics, although financial market volatility, due to pandemics, is indeed known to negatively impact the overall macroeconomy, as shown by [10]. In other words, we do acknowledge that this index is not necessarily free of limitations, but to the best of our knowledge, this is the only available high-frequency index that captures financial risks due to infections, which in turn we associate with oil market volatility.
2.2. Methodology: Heterogeneous Autoregressive Realized Volatility (HAR-RV) Model
For the in- and out-of-sample predictability analyses, we used a variant of the widely-studied HAR-RV model of [12]. While the HAR-RV model apparently has a simple structure, it is able to capture important properties of the realized volatility of oil prices, such as long memory and multi-scaling behavior [16,17]. The benchmark HAR-RV model is given by:
where the index denotes -days-ahead realized volatility, with 1, 5, and 22 in our context. In addition, is the average from day to day while denotes the average from day to day . Augmenting the benchmark HAR-RV model with EMVID as a predictor yields the following extended HAR-RV model:
3. Empirical Results
Given that the ultimate test of any predictive model (in terms of the econometric methodologies and predictors employed) is based on its out-of-sample performance [18], we conducted an out-of-sample forecasting exercise as the focus of our analysis. However, for the sake of completeness, we provide in Table 2 the full-sample estimation results for Equation (2) for h = 1, 5, and 22. We observed statistically significant and positive estimates, suggesting that EMVID increases RV in a statistically significant manner (at the highest level of significance), consistently across the three forecasting horizons. This is in line with the notion that financial risks spill over to the oil market, confirming the volatility connectedness of stock and oil markets. Given that daily oil price data stretches back to 1977 (from the Global Financial Database) and the EMVID index is available from 1985, we repeated our analysis using the conditional oil return volatility estimates, derived from an exponential generalized autoregressive conditional heteroskedasticity (EGARCH) model, which had the best-fit among alternative GARCH models, and found infectious diseases related uncertainty to increased oil market volatility significantly, at a 1% level over the period of 3 January 1985 to 14 May 2020. Similarly, repeating the same analysis using oil VIX (available from the FRED database of the Federal Reserve Bank of St. Louis) between 10 May 2007 and 14 May 2020, and relating it to EMVID, we again obtained a positive relationship at the highest level of significance. Overall, these results confirmed that just like the realized volatility of oil that we used in our tests, both conditional and implied volatilities are also positively impacted by EMVID. Complete details of these results are available upon request from the authors.
Next, we turned our attention to the primary objective of our research, i.e., the role of EMVID in forecasting the RV of oil prices. To study out-of-sample predictability of RV, we considered a recursive estimation approach, over the out-of-sample period, which covers the period of 15 August 2006 to 14 May 2020. Note that in order to determine the out-of-sample period, we first conducted the multiple structural break tests of [19] on the HAR-RV model, and detected the following breaks at 15 August 2006, 19 August 2006, and 17 August 2006 for h = 1, h = 5, and h = 22, respectively. The break dates for Equation (2) under h = 1, and h =5 were exactly the same as under Equation (1), but for h = 22, the break point was at 15 August 2006, i.e., the same date as under h = 1 in Equation (1). The break dates in August of 2006 were basically associated with the sharp increase in oil prices for the next two years, until their collapse in June 2008, at the peak of the global financial crisis. Given that the earliest break occurred at 15 August 2006, we started our recursive estimation from this point onwards to compute the Mean Squared Forecast Errors (MSFEs) from the benchmark HAR-RV model and its extension, based on EMVID under h = 1, 5, and 22. We then used the (Mean Square Error) MSE-F test of [20] to compare the forecast accuracy of the augmented version of the HAR-RV model with the nested benchmark, i.e., the basic HAR-RV model in Equation (1), which does not include the EMVID index.
Given that our focus was on the forecast of errors, our basis of comparison was based on a lower value of the MSFE, implying a better performing forecasting model. In Table 3, we report the out-of-sample forecasting gains, from using an extended version of the HAR-RV model (MSFE1), relative to the benchmark model (MSFE0). Forecasting gains (FG) were computed as:
where MSFE0 and MSFE1 are the MSFEs of the benchmark HAR-RV model and its extended version, respectively, given the general forecasting model presented in Equation (2). Given the formulation in Equation (3), the gain (loss), in percentages, is indicated by a positive (negative) entry in the table. As can be seen from Table 3, the FGs for all the three forecasting horizons are positive, with the highest gain of 28% observed at h = 22, followed by 23%, and 20% at h = 1 and 5, respectively. More importantly, the forecasting gains from the augmented HAR-RV model, i.e., the model including EMVID, statistically outperformed the benchmark model. Based on the suggestion of an anonymous referee, we re-conducted our analysis using a standard autoregressive (AR) model with 22 lags, augmented with the lagged information of the EMVID index. While our main results continued to hold with the EMVID, producing significant FGs relative to the benchmark AR(22) model (at the 1% level of the MSE-F statistic), the FGs were smaller than those obtained from the HAR-RV model. Thus, this result highlighted the issue of over-parametrization involved with standard AR models relative to the HAR-RV framework. Complete details of the forecasting results from the standard AR model are available upon request from the authors. The MSE-F statistic was significant at the 1% level. The critical values at 10%, 5%, and 1% were 0.6160, 1.5180, and 3.9510, respectively, as derived from Table 4 of [20]. These results indicate clear evidence that uncertainty due to infectious diseases contains valuable information for forecasting the future path of the volatility of the oil market. It is possible that EMVID contains information regarding future economic expectations, and thus, its forecasting power is driven by the market sentiment regarding future economic fundamentals, which contains information regarding oil market demand and supply dynamics. Keeping in mind the effect of the recent Russia–Saudi Arabia price-war on oil market variability, and also the evidence provided by a number of studies (see for example, [21,22,23]) on the predictability of oil market volatility due to news associated with production decisions of the Organization of the Petroleum Exporting Countries (OPEC), we first included a dummy variable corresponding to (60) OPEC meeting dates (derived from: http://www.opec.org) in the augmented HAR-RV model. However, the performance of the model deteriorated. Similar results were obtained when, instead of the dummy for the meeting dates, we used dummies associated with cut (13), maintain (40), and increase (7) of production decisions. In addition to these robustness tests, we also considered an extended version of Equation (2), where we included part of the daily newspapers-based equity market uncertainty of [24] (available at: http://policyuncertainty.com/equity_uncert.html) that was not explained by EMVID, by basically regressing the latter on the former and then recovering the residuals in a recursive manner over the out-of-sample forecasting horizon (to avoid any look-ahead bias). Again, the performance of the HAR-RV model with EMVID worsened. Complete details of these results are available upon request from the authors. Nevertheless, the results suggest that significant predictive gains can be obtained by incorporating measures of market volatility due to infectious diseases in forecasts of strategic commodities like crude oil. Based on the suggestion of an anonymous referee, we repeated our analysis by dropping the period of 2 January 2020 to 14 May 2020, i.e., the observations corresponding to the COVID-19 episode in our sample. Our results indicated statistically significant FGs at 1% and 10% levels of significance for h = 5 and 22, respectively, indicated by the corresponding values of the FGs at h = 1, 5, and 22, equal to −0.0139, 0.1313, and 0.0448, respectively. These results indicated a loss at h =1, and gains at h = 5 and 22, and not surprisingly, the values are relatively smaller when compared to the sample that includes the period of 2 January 2020 to 14 May 2020, associated with the COVID-19 episode. The comparison of the findings from the subsamples, with and without the COVD-19 period, thus indicates that while other pandemics do play a role in forecasting oil market volatility, the predictive power of EMVID indeed weakens when we ignore the period associated with the Coronavirus pandemic.
4. Conclusions
The spillover of financial risks onto the crude oil market, particularly following the recent financialization episode, is well-established in academia. Given the recent surge in uncertainty in financial markets due to the COVID-19 outbreak, this paper extends the existing literature on oil-price volatility forecasting in a novel direction, by exploring the predictive power of a daily newspaper-based metric of uncertainty associated with infectious diseases (EMVID). While we observed a positive association between EMVID and realized oil volatility in the in-sample exercise, in line with the positive spillover effects across the oil and stock markets, we also showed that the inclusion of the EMVID index in a HAR-RV model significantly improves the forecasting performance of the benchmark model that does not include this index. Thus, we conclude that the market uncertainty associated with infectious diseases contains valuable information for forecasting the future level of oil market volatility.
Given the importance of accurate oil volatility forecasts in the computation of optimal hedge and investment positions, our findings suggest that incorporating uncertainty associated with infectious diseases in forecasting models can help to improve the design of portfolios (and risk management strategies) that include crude oil. At the same time, it is well-accepted that oil market volatility (uncertainty) tends to negatively impact the macroeconomy [25] for a detailed review in this regard). Naturally, high-frequency forecasts of oil volatility can be incorporated into mixed data sampling (MIDAS) models by policymakers to predict the future path of low frequency real activity and nominal variables, and who can then accordingly undertake monetary and fiscal policy decisions to counteract the possible recessionary impact on the economy. As a possible extension, future studies can consider extending our study to other energy and non-energy commodities.
Author Contributions
Formal analysis, R.G.; writing–original draft, E.B., R.D., R.G. and C.P. All authors have read and agreed to the published version of the manuscript.
Funding
This research received no external funding.
Conflicts of Interest
The authors declare no conflict of interest.
References
- Bernanke, B. The Relationship between Stocks and Oil Prices. Available online: https://www.brookings.edu/blog/ben-bernanke/2016/02/19/the-relationship-between-stocks-and-oil-prices/ (accessed on 15 February 2019).
- Hamilton, J. Oil Prices as an Indicator of Global Economic Conditions. Available online: http://econbrowser.com/archives/2014/12/oil-prices-as-an-indicator-of-global-economic-conditions (accessed on 5 March 2020).
- Demirer, R.; Gupta, R.; Pierdzioch, C.; Shahzad, S.J.H. The Predictive Power of Oil Price Shocks on Realized Volatility of Oil: A Note; Working Paper 202044; University of Pretoria: Pretoria, South Africa, 2020. [Google Scholar]
- Badshah, I.; Demirer, R.; Suleman, M.T. The effect of economic policy uncertainty on stock-commodity correlations and its implications on optimal hedging. Energy Econ. 2019, 84, 104553. [Google Scholar] [CrossRef]
- Balcilar, M.; Bekiros, S.; Gupta, R. The role of news-based uncertainty indices in predicting oil markets: A hybrid nonparametric quantile causality method. Empir. Econ. 2017, 53, 879–889. [Google Scholar] [CrossRef] [Green Version]
- Degiannakis, S.; Filis, G. Forecasting oil price realized volatility using information channels from other asset classes. J. Int. Money Financ. 2017, 76, 28–49. [Google Scholar] [CrossRef] [Green Version]
- Bahloul, W.; Balcilar, M.; Cunado, J.; Gupta, R. The role of economic and financial uncertainties in predicting commodity futures returns and volatility: Evidence from a nonparametric causality-in-quantiles test. J. Multinatl. Financ. Manag. 2018, 45, 52–71. [Google Scholar] [CrossRef]
- Bonaccolto, M.; Caporin, M.; Gupta, R. The dynamic impact of uncertainty in causing and forecasting the distribution of oil returns and risk? Phys. A 2018, 507, 446–469. [Google Scholar] [CrossRef] [Green Version]
- Gkillas, K.; Gupta, R.; Pierdzioch, C. Forecasting realized oil-price volatility: The Role of financial stress and asymmetric loss. J. Int. Money Financ. 2020, 104, 102137. [Google Scholar] [CrossRef]
- Baker, S.R.; Bloom, N.A.; Davis, S.J.; Terry, S.J. Covid-Induced Economic Uncertainty; Working Paper No. 26983; NBER: Cambridge, MA, USA, 2020. [Google Scholar]
- McAleer, M.; Medeiros, M.C. Realized volatility: A review. Econom. Rev. 2008, 27, 10–45. [Google Scholar] [CrossRef]
- Corsi, F. A simple approximate long-memory model of realized volatility. J. Financ. Econ. 2009, 7, 174–196. [Google Scholar] [CrossRef]
- Lux, T.; Segnon, M.; Gupta, R. Forecasting crude oil price volatility and value-at-risk: Evidence from historical and recent data. Energy Econ. 2016, 56, 117–133. [Google Scholar] [CrossRef] [Green Version]
- Bonato, M.; Gkillas, K.; Gupta, R.; Pierdzioch, C. Investor Happiness and Predictability of the Realized Volatility of Oil Price. Sustainability 2020, 12, 4309. [Google Scholar] [CrossRef]
- Xiu, D. Quasi-Maximum Likelihood Estimation of Volatility with High Frequency Data. J. Econom. 2010, 159, 235–250. [Google Scholar] [CrossRef]
- Asai, M.; Gupta, R.; McAleer, M. Forecasting Volatility and co-volatility of crude oil and gold futures: Effects of leverage, jumps, spillovers, and geopolitical risks. Int. J. Forecast. 2020, 36, 933–948. [Google Scholar] [CrossRef] [Green Version]
- Asai, M.; Gupta, R.; McAleer, M. The Impact of Jumps and Leverage in Forecasting the Co-Volatility of Oil and Gold Futures. Energies 2019, 12, 3379. [Google Scholar] [CrossRef] [Green Version]
- Campbell, J.Y. Viewpoint: Estimating the equity premium. Can. J. Econ. 2008, 41, 1–21. [Google Scholar] [CrossRef] [Green Version]
- Bai, J.; Perron, P. Computation and analysis of multiple structural change models. J. Appl. Econom. 2003, 18, 1–22. [Google Scholar] [CrossRef] [Green Version]
- McCracken, M.W. Asymptotics for out of sample tests of Granger causality. J. Econom. 2007, 140, 719–752. [Google Scholar] [CrossRef]
- Mensi, W.; Hammoudeh, S.; Yoon, S.-M. How do OPEC news and structural breaks impact returns and volatility in crude oil markets? Further evidence from a long memory process. Energy Econ. 2014, 42, 343–354. [Google Scholar] [CrossRef]
- Gupta, R.; Yoon, S.-M. OPEC news and predictability of oil futures returns and volatility: Evidence from a nonparametric causality-in-quantiles approach. North Am. J. Econ. Financ. 2018, 45, 206–214. [Google Scholar] [CrossRef]
- Plante, M.D. OPEC in the News. Energy Econ. 2019, 80, 163–172. [Google Scholar] [CrossRef]
- Baker, S.R.; Bloom, N.A.; Davis, S.J. Measuring economic policy uncertainty. Q. J. Econ. 2016, 131, 1593–1636. [Google Scholar] [CrossRef]
- van Eyden, R.; Difeto, M.; Gupta, R.; Wohar, M.E. Oil price volatility and economic growth: Evidence from advanced OECD countries using over one century of data. Appl. Energy 2019, 233–234, 612–621. [Google Scholar] [CrossRef] [Green Version]
Figure 1.
Data plots.


Table 1.
Summary statistics.
| RV | EMVID | |
|---|---|---|
| Mean | 0.3155 | 0.8036 |
| Median | 0.2731 | 0.0000 |
| Maximum | 3.0000 | 77.3500 |
| Minimum | 0.0014 | 0.0000 |
| Std. Dev. | 0.2009 | 3.8074 |
| Skewness | 4.4032 | 11.0178 |
| Kurtosis | 40.3062 | 143.1851 |
| Jarque-Bera | 285,596.7000 | 3,914,214.0000 |
| p-value | 0.0000 | 0.0000 |
| Observations | 4665 | |
RV is the daily realized volatility for oil and EMVID is the newspaper-based uncertainty index due to infectious diseases. Std. Dev. stands for standard deviation; p-value corresponds to the null hypothesis of normality associated with the Jarque-Bera test.
Table 2.
In-sample predictability results.
| Horizon | θ | ||||
|---|---|---|---|---|---|
| h = 1 | 0.0262 * | 0.2624 * | 0.3238 * | 0.3175 * | 0.0067 * |
| h = 5 | 0.0342 * | 0.5919 * | 4.1655 * | 0.1184 * | 0.0073 * |
| h = 22 | 0.0041 | 0.2121 * | 0.8090 * | 20.9508 * | 0.0102 * |
The table presents the estimates for: for various forecast horizons (h); * indicates significance at the 1 percent level.
Table 3.
Out-of-Sample Forecasting Gains.
| Horizon | MSFE0 | MSFE1 | FG |
|---|---|---|---|
| h = 1 | 0.0148 | 0.0120 | 23.3122 * |
| h = 5 | 0.0218 | 0.0181 | 20.2231 * |
| h = 22 | 0.0204 | 0.0159 | 28.3408 * |
Entries correspond to forecasting gains, i.e., FG = , where MSFE0 and MSFE1 are mean squared forecast errors (MSFEs) of the benchmark HAR-RV model (Model 0): , and its extended version (Model 1): , respectively; RV is the daily realized volatility for oil and EMVID is the newspapers-based uncertainty index due to infectious diseases, and * indicates significance of the MSE-F test statistic at the 1 percent level.
© 2020 by the authors. Licensee MDPI, Basel, Switzerland. This article is an open access article distributed under the terms and conditions of the Creative Commons Attribution (CC BY) license (http://creativecommons.org/licenses/by/4.0/).
Share and Cite
MDPI and ACS Style
Bouri, E.; Demirer, R.; Gupta, R.; Pierdzioch, C. Infectious Diseases, Market Uncertainty and Oil Market Volatility. Energies 2020, 13, 4090. https://0-doi-org.brum.beds.ac.uk/10.3390/en13164090
AMA Style
Bouri E, Demirer R, Gupta R, Pierdzioch C. Infectious Diseases, Market Uncertainty and Oil Market Volatility. Energies. 2020; 13(16):4090. https://0-doi-org.brum.beds.ac.uk/10.3390/en13164090
Chicago/Turabian StyleBouri, Elie, Riza Demirer, Rangan Gupta, and Christian Pierdzioch. 2020. "Infectious Diseases, Market Uncertainty and Oil Market Volatility" Energies 13, no. 16: 4090. https://0-doi-org.brum.beds.ac.uk/10.3390/en13164090
Note that from the first issue of 2016, this journal uses article numbers instead of page numbers. See further details here.