Investigation and Control Technology on Excessive Ammonia-Slipping in Coal-Fired Plants

1
Key Laboratory for Thermal Science and Power Engineering of Ministry of Education, State Key Laboratory of Power Systems, Department of Energy and Power Engineering, Tsinghua University, Beijing 100084, China
2
Beijing Guodian Longyuan Environmental Engineering CO.LTD, Haidian District, Beijing 100039, China
*
Author to whom correspondence should be addressed.
Energies 2020, 13(16), 4249; https://0-doi-org.brum.beds.ac.uk/10.3390/en13164249
Submission received: 30 June 2020
/
Revised: 6 August 2020
/
Accepted: 13 August 2020
/
Published: 17 August 2020
(This article belongs to the Special Issue Coal Conversion Processes)
Abstract
:After the implementation of the ultra-low emissions regulation on the coal-fired power plants in China, the problem of the excessive ammonia-slipping from selective catalytic reduction (SCR) seems to be more severe. This paper analyzes the operating statistics of the coal-fired plants including 300 MW/600 MW/1000-MW units. Statistics data show that the phenomenon of the excessive ammonia-slipping is widespread. The average excessive rate is over 110%, while in the small units the value is even higher. A field test data of nine power plants showed that excessive ammonia-slipping at the outlet of SCR decreased following the flue-gas process. After most ammonia reduced by the dust collector and the wet flue-gas desulfurization (FGD), the ammonia emission at the stack was extremely low. At same time, a method based on probability distribution is proposed in this paper to describe the relationship between the NH3/NOX distribution deviation and the De–NOX efficiency/ammonia-slipping. This paper also did some original work to solve the ammonia-slipping problem. A real-time self-feedback ammonia injection technology using neural network algorithm to predict and moderate the ammonia distribution is proposed to decrease the NH3/NOX deviation and excessive ammonia-slipping. The technology is demonstrated in a 600-MW unit and works successfully. The excessive ammonia-slipping problem is well controlled after the implementation of the technology.
1. Introduction
NOX is an atmospheric trace gas with a short lifetime. It can participate the formation of tropospheric ozone and secondary aerosols in the air, which may harm human health and affect the climate [1,2].
Fossil fuel consumption is one of the most important sources of NOX emission. The relationship between the NOX emission and GDP (gross national product), analyzed by Maria Hnatyshyn, represents the EKC (environmental Kuznets curve) relationship. Primary energy consumption growth increases the NOX emission, for the power plants are the most important source of its emission into the atmosphere [3]. With the rapid development in China, more fossil fuels are consumed in recent decades. The NOX emission increases rapidly with the economic development. According to the previous research, the NOX emission all over the country increases by 52% from 2005 to 2011. At the same time, the coal-fired powerplant capacity increases from 384 to 765 GW [4,5,6,7,8].
Chinese government published regulation GB-13,223 in 2011. According to the regulation, all the power plant should install De–NOX equipment to control the NOX content in the flue gas under 100 mg/Nm3. Under this policy, the NOX emission decreased by 21% from 2011 to 2015 in China, while the coal-fired powerplant capacity increase from 765 GW to 990 GW [9,10]. Since 2015, the government published a new regulation called “ultra-low emission regulation for coal-fired powerplants”, which requires all coal-fired boiler units to meet the new standards (particulates < 10 mg/NM3, SO2 < 35 mg/Nm3, NOX < 50 mg/Nm3) by 2020. This standard is much stricter than that in Europe, US and other countries [11,12,13]. At the end of 2019, the online CEMS (continuous emission monitor system) shows that over 90% of the coal-fired boiler units have realized the new standards [14,15].
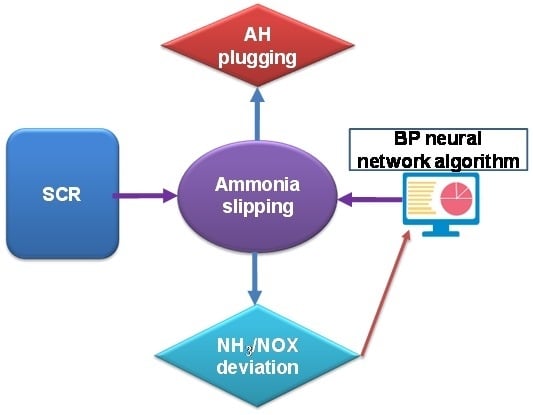
The NOX emission control is much more complex than that of SOX and particulates. In large pulverized coal-fired power plants, SCR is the only choice to meet the Ultra-low Emission Standards. However, with the increasing of the De–NOX efficiency of SCR, the ammonia slip problem seems to be another challenge [16,17,18].
In a typical SCR process, ammonia is used as reducing agent to react with the NOX in the flue gas with the help of catalyst [19]. As the SCR reaction is a gas–gas reaction, its reaction rate and uniformity are much weaker than that of the gas–liquid reaction such as wet FGD. Ammonia-slipping is the un-reacted ammonia existing in the flue gas. The designed ammonia-slipping value is normally 2.5–3 ppm. This value is very difficult to reach, because the high NOX removal efficiency over 95% will cause the ammonia-slipping increasing rapidly [20,21,22,23].
The operating condition of the boiler unit also has significant impact on the SCR performance. The NOX distribution and flow field of the boiler will be changed by the fluctuation of boiler load and the burner operation mode. This would cause the poor performance of SCR. Therefore, the load-peaking units have serious excessive ammonia-slipping problem. The NH3 released to the air can also cause the climate problem [2].
The ammonia slip in the flue gas will cause the plugging problem of the air preheater (AH) and electrostatic precipitator (ESP). Former studies propose the radian number to represent the AH plugging trend. The number shows that the high ammonia-slipping will cause serious AH plugging problem, for the excess ammonia-slipping will react with the SO3 in the flue gas to produce ABS (ammonia bisulfite) [24,25,26,27]. According to the experience from Germany Fisher Babcock company, the boiler maintenance cycle will be shortened by 10–20 weeks with each increase of 1-ppm ammonia-slipping. In some boiler plants, the ammonia released by open-air fly ash ground causes the serious damage on the growth of natural plants [28,29,30].
According to the internal statistics data of some plants, the operation term period of the boiler seems to be short for the plugging of AH [31]. For a long period since GB-13223 published, there is no systematic survey data of the ammonia-slipping in the coal-fired plants. In this paper, we investigated the operating data of more than 200 domestic coal-fired plants to verify the excessive ammonia in the SCR process. The data includes the statistics of ammonia consumption and the AH resistance. In addition, the entire process of ammonia concentration in the flue gas was measured in nine plants. All these works can reveal the actual situation of ammonia-slipping problem in the coal-fired plants.
In addition, this paper also did some original work to solve the ammonia-slipping problem. A theoretical calculation method was proposed to describe the relationship between NH3/NOX distribution deviation and the ammonia-slipping. Based on the calculation result, a real-time self-feedback ammonia injection technology was used to control the excess ammonia-slipping. The real-time technology used neural network algorithm model to reduce the NH3/NOX deviation instantly and realized a good demonstration in a 600-MW unit.
2. Statistics Data of Ammonia Slip in Coal-Fired Plants
The electricity supply in China is mainly provided by 300 MW~1000-MW boiler units. To obtain the actual situation of ammonia-slipping, 292 coal-fired boiler units were investigated. The 300-MW units accounts for 56% (164 sets); the 600-MW units accounts for 36% (104 sets) and 1000-MW units accounts for 8% (24 sets).
As the ammonia measuring instruments have large deviation due to the bad working condition, this paper used the excessive ratio of ammonia consumption as the analysis indicator. The actual ammonia consumption data are based on the ammonia purchase records in the plants, while the theoretical consumption is calculated by the NOX concentration and the flue-gas flow rate from CEMS. The statistic period was extended to 12 months to minimize the statistical error. The average ammonia excess ratio of all the units are shown in Figure 1.
As shown in Figure 1, all units have the ammonia excess phenomena, especially in the 300-MW units. The data of 600 MW and 1000-MW units are much better. Although the statistics data have certain error due to the CEMS, it can also be used to indicate the trend of ammonia excess problem. The 300-MW units play the main role in load peaking of the power grid in China, and its ammonia excess problem is much more serious than those in 600 MW and 1000-MW units.
To better describe the problem, the resistance of AH in the plants was also analyzed. The ammonia-slipping and SO3 in the flue gas can generate the ammonium bisulfate, which has strong viscidity at low temperatures. If the ammonium bisulfate being attached to the AH exchange surface, the resistance of AH would increase over time. For rotary AH, the normal resistance of flue-gas side is 0.8–1.2 kPa. High resistance means the plugging of the AH is very serious. The AH resistance increase rate is much higher, the plugging problem is getting worse. Figure 2 shows the statistics data of the AH resistance in the different boiler units.
As shown in Figure 2, only a small number of units can control the AH resistance less than 1.2 kPa. Over 20% units have large AH resistance over 2.0 kPa, which means serious AH plugging problems. The trend is same with Figure 1. In the small units with load peaking function, the plugging problem is worse.
3. Field Test of Ammonia Variation in the Flue Gas
To further analyze the ammonia-slipping characteristic, nine boiler units were chosen to test the entire process of ammonia emission along the flue-gas flow. All the nine boiler units have reached ultra-low emission standard (NOX < 50 mg/Nm3). The sample test points include the outlet of SCR, the inlet of FGD, the outlet of FGD and the outlet of the stack. The detail information of the nine units is shown in Table 1.
As shown in Figure 3, six plants have the ammonia-slipping value at the SCR outlet higher than the design limits (3 ppm). In some plants, such as Plant A and Plant B, the ammonia-slipping values even reach 10 ppm. The phenomenon is consistent with the statistics data in Figure 1 and Figure 2. According to Figure 3, the ammonia-slipping decreases rapidly after the flue gas passes out of the ESP or the bag filter. This is because part of the ammonia slipped from SCR reacts with SO3 to produce ammonium bisulfate—and most ammonia is adsorbed by the fly ash. The gas-phase ammonia dissolves in the acidic slurry of FGD with better removal efficiency over 50%.
After passing through the dust precipitator and the wet FGD, the ammonia in the flue gas reaches the extremely low level. This means although the SCR have serious excessive ammonia-slipping problem, the final emission of ammonia to the air can reach emission regulation standard.
Figure 4 and Figure 5 show the removal efficiency of ammonia by the dust precipitator and the wet FGD. In Figure 4, the bag filter has a higher removal efficiency due to the dust layer attached to the filter. Fly ash can adsorb ammonia in the flue gas. However, the ammonia in fly ash can release into the air slowly. This can cause the critical secondary pollution to the local environment.
Figure 5 shows the ammonia removal efficiency triggered by the wet FGD. With the pH value about 4–6, the slurry has a good absorption effect on ammonia. This will lead to the high concentration ammonia nitrogen in the FGD waste water.
In the coal-fired boiler plants with ultra-low emissions, the excessive ammonia-slipping is very serious, especially at SCR outlet. The ammonia in the flue gas is very low at the stack due to the synergistic removal effect of ESP\bag filter\FGD. However, the excessive ammonia in the flue gas has negative effect on the normal operation of AH\ESP\FGD. It is necessary to find a proper solution to decrease the ammonia-slipping from the beginning during SCR design and operation.
4. Analysis of NH3/NOX Deviation and Ammonia-Slipping
There are two key factors on the performance of SCR. One is the catalyst volume and activity, and another is the flow field uniformity. In the project already in service, it is difficult to change the catalyst volume and activity. Therefore, the most effective method to improve the SCR performance is to optimize the flow field uniformity. According to the requirement of the catalyst, the uniformity of flow field normally is consisted of these factors: the velocity distribution at catalyst inlet should be less than ±15%; the velocity incidence angle should be less than ±10°; the temperature distribution deviation should be less than ±10 °C; the deviation of NH3/NO molar ratio distribution should be less than ±5% [32,33,34,35].
In the four factors, the most important one is NH3/NO molar ratio distribution. In the SCR project, the ammonia is injected into the flue-gas duct to mix with NOX through ammonia injection grid. During the commission stage, the manual valve of each injection grid is set a fixed opening degree. Once the unit load or combustion change or fluctuate, the ammonia mixing effect cannot be changed instantaneously. Therefore, the actual NH3/NO molar ratio distribution is much worse than design condition, especially at lower load, which causes a serious ammonia-slipping problem [36,37].
Discussion above is only principle analysis. There is no mathematic model to quantitatively describe the De–NOX removal efficiency/ammonia-slipping and NH3/NO molar ratio distribution deviation in literatures. This paper proposed a simple method based on the probability estimated theory.
The definition of key parameters shows below:
, NOX concentration at SCR inlet, ppm;
, NOX concentration at SCR outlet, ppm;
, Ammonia-slipping at SCR outlet, ppm;
, NOX removal efficiency,%;
NSR, the NH3/NOX molar ratio;
μ, average value of the NH3/NOX molar ratio;
σ, standard deviation of the NH3/NOX molar ratio distribution;
Cv, deviation coefficient of the NH3/NOX molar ratio distribution (σ/μ).
Under the design condition, and is the design value of ammonia-slipping.
As the SCR reactor cross-section is large, the distribution of NH3/NOX molar ratio depends on the inlet distribution and the physical structure. However, the distribution can be characterized by the probability estimated theory. The NH3/NOX molar ratio of one section of catalyst is defined as x, which can be described with normal distribution function:
Under the condition that the catalyst has enough activity:
(1) When x ≥ μ, the local ammonia is excessive and exceeds the capacity of catalyst; excessive ammonia-slipping occurs;
(2) When x < μ, the local ammonia is insufficient and outlet NOX is higher than the design value of catalyst.
Therefore, the average escaped ammonia of the total cross-section can be expressed as s:
If the SCR performance is good, the average ammonia-slipping will be less than the design value. This means:
This inequality can be used to describe the relationship between NH3/NOX molar ratio and SCR performance quantitatively, such as De–NOX removal efficiency and ammonia-slipping. The calculation results and experiment data are shown in Figure 6. The formula fits relatively well with the on-site testing data [38,39], which verifies the correctness of the theory analysis. Based on above analysis, the quantitative relationship of the De–NOX removal efficiency/ammonia-slipping at certain Cv (deviation coefficient of NH3/NOX molar ratio distribution) is show in Figure 7.
As shown in Figure 7, with the increasing De–NOX efficiency, the deviation coefficient should be less than a certain value. The high De–NOX efficiency requires much stricter deviation coefficient. In a given SCR device neglected catalyst activity condition, if the target De–NOX efficiency is required to reach 85%, the recommended deviation coefficient of NH3/NOX should be less than 5% to maintain the ammonia-slipping less than 3 ppm. If the target De–NOX efficiency is 95%, the deviation coefficient of NH3/NOX should be less than 2% for the given ammonia-slipping (3 ppm). This result is consistent with the operating experience. As the deviation coefficient is nearly impossible to reach 2% in cross-section of large plant, the SCR efficiency cannot reach 95% normally. Even more catalyst is used, the excessive ammonia-slipping is still very high under this condition [40,41].
5. Solutions to Alleviate the Excess Ammonia-Slipping
According to the above analysis, by improving the distribution uniformity of ammonia and NOX, it is possible to reduce the ammonia-slipping of SCR and ensure the high De–NOX efficiency. In the real power plant, the load fluctuation and the combustion adjustment can cause the gas flow field changing in SCR. As a result, especially for the NOX distribution at the inlet of SCR, it should change correspondingly with adjustment of combustion [42,43,44,45].
Figure 8 shows the original distributions of the NOX concentration in a 600-MW pulverized coal boiler at loads of 100 and 60%, respectively. The NOX distribution at SCR inlet at low load is distinct from that at the full load. During the SCR commission stage, the manual valves of the ammonia injection grid are set with fixed opening and no longer change with load fluctuation. When the NOX distribution at SCR inlet changes, the match degree of ammonia and NOX will decreases inevitably. The ammonia-slipping in the flue gas increases rapidly with the deviation coefficient of NH3/NOX.
The real-time self-feedback ammonia injection technology is proposed to solve this problem. Figure 9 shows the concept of the real-time self-feedback ammonia injection technology.
(1) Multi zone CEMS: multiple probes are set at the outlet of the SCR. Each probe could detect the NOX concentration in one zone. A PLC (programmable logic controller) is used to patrol each zone to measure the NOX concentration of the whole cross-section. In this way, the real-time NOX concentration map at the SCR outlet can be obtained. As the ammonia is extremely lower than the NOX concentration, it is much easier and more reliable to use the NOX concentration to represent the uniformity of the cross-section.
(2) Real-time ammonia-injection system: For each ammonia injection grid pipe, an automatic control valve is used to replace the traditional manual valve. The control valve can adjust the flow rate in the pipe and change the ammonia distribution instantaneously. Therefore, the NH3/NOX distribution deviation can be alleviated instantaneously with the fluctuation of the load or other factors [46].
(3) Artificial Intelligence unit: BP (back propagation) neural network algorithm is used to calculate the coupling relationship of the NOX concentration map at outlet and multi injection grid control valves opening, which is the core part of this technology.
As shown in Figure 9, the NOX concentration map measured by CEMS is the input layer and the openings of ammonia injection grids control valves are output layer. The numbers of CEMS probe and ammonia injection grid are the same, which is marked as N. For the input layer, the monitor data of the NOX concentration is set to be M1~MN. The ammonia grid valves opening is P1~PN. The hidden layer could describe the relationship between the input layer and output layer. W1~Wn, X1~Xn are the weight factors of the functions between input layer and output layer [47].
After ammonia injected into the flue gas, there is intensive diffusion and turbulence during the mixing process in the flue gas duct. The relationship of outlet NOX concentration and grid valves openings are not linear. It is a typical nonlinear N multiplication N relationship. The neural network algorithm model is the most suitable model to describe such nonlinear function. In this model, a group numbers of data involving the NOX concentration and the grid valves openings are used to train the weight factors. The weight factors can be continuously updated with the training process to ensure the accuracy of the model. With the operation of the system, the data could be constantly updated over time. Under this situation, the technology can realize the self-feedback adjustment of the ammonia injection and optimize the NH3/NO deviation [48,49].
The technology is applied in the 600-MW pulverized coal boiler unit mentioned in Figure 8. For the 600 MW project in the paper, the neural network is very simple. The Multi zone CEMS have 12 probes and get 12 concentration numbers of different place in 5 min by one patrol cycle. The output layer is the opening of 12 ammonia injection grids. There is only one hidden layer in the model. We used one plug-in computer to do the calculation and communicate with DCS (distribution control system) to adjust the valves. The computer receives the signal of 12 NOX concentration numbers with a certain frequency and then run the model to calculate grid valves openings. The group data of valve openings is sent to the DCS to operate the ammonia injection grid valves. The software is a self-programmed package by C++, the plug-in software limited authority to communicate with the DCS for the safety reason of the plant.
During the commission of the model, we set these control valves at certain openings based on the operator’s experience first. Then the cross-section NOX concentration map of the SCR outlet is recorded. This is a set of data. After change the valves several times, several groups data of valves opening and outlet NOX concentration map can be gotten. Then these data are used to train the weight factors of the hidden layer. As these is only one hidden layer, the training process is very simple to reach convergence point.
In the 600 MW project, the ammonia-slipping decreases from 10 ppm to 2 ppm. The NOX concentration distribution at the SCR outlet is shown in Figure 10. Although the NOX distributions at SCR inlet have major difference at different loads shown in Figure 8, the outlet NOX concentration is nearly the same. The upper and lower deviation of the whole cross-section is less than 5 ppm.
At the same time, the ammonia consumption of the unit decreases after the implementation of the technology substantially. As shown in Figure 11, the ammonia consumption of at different loads in this 600-MW unit decreases by 10% averagely. The ammonia-slipping and AH plugging problem are alleviated effectively.
6. Conclusions
In this study, we investigate the operating condition and ammonia-slipping in hundreds of 300–1000-MW units. Statistics data shows that the excess ammonia-slipping phenomena with average value over 110% is common, which is more serious in small units with load peaking. On-site test data of nine typical coal-fired power plants represent similar results. The ammonia concentration is very high at the outlet of SCR and decreases along flue-gas flow. The dust collector and wet FGD have a certain removal efficiency of ammonia, which ensure the ammonia at final discharge extremely low. A quantitative model is proposed to describe the relationship among the ammonia-slipping, the De–NOX efficiency and the NH3/NOX distribution deviation. For high De–NOX efficiency, the NH3/NO deviation should be stricter to maintain a low ammonia-slipping.
The reason of the excessive ammonia-slipping problem especially at load peaking process is also discussed in this study. Although the ammonia-slipping at the stack reaches the estimated design value (normally three parts per million), the excessive ammonia slip has serious negative effect on the long-term and the economy of plant operation. The problem should be solved especially in the plant with the high target De–NOX efficiency. Therefore, the extremely high De–NOX efficiency standard of the regulation seems not to be the best choice. In some special boilers such as the u-shaped vertical pulverized-coal flame boiler, the primary NOX concentration is far above 800–1000 mg/Nm3. This will cause more cost to reach the high De–NOX target efficiency (NOX < 50 mg/Nm3, China GB 13223). Compared with the excessive ammonia wasted in the De–NOX process, it seems that the stricter NOX-regulation standard should be more scientific and reasonable.
The real-time self-feedback ammonia injection technology proposed in the study can be used to alleviate the excess ammonia-slipping problem. It shows that the neural network algorithm model and other advance algorithm can be applied in the plant to solve complex problem. The new technology can improve the traditional SCR technology in some extent. After the implementation of the new technology, the excessive ammonia slip problem can be optimized.
However, from the perspective of the environment and whole industry, it seems that these exist a balance point between the NOX-concentration standard and the ammonia slip for the regulation. The boiler original concentration, carrying capacity of environment and the technical progress should be taken as a consideration of the balance point. In the other countries, similar regulation should be more dialectical to balance the NOX-concentration standard and the ammonia slip.
Author Contributions
Conceptualization, X.Y.; Data curation, X.Y. and H.K.; Formal analysis, H.K.; Investigation, X.Y., M.Z. and H.K.; Project administration, H.Y.; Resources, M.Z., J.L. and H.Y.; Supervision, J.L. and H.Y.; Visualization, X.Y.; Writing—original draft, X.Y.; Writing—review & editing, H.Y. All authors have read and agreed to the published version of the manuscript.
Funding
This research received no external funding.
Acknowledgments
This research was supported by the National Key Research Plan (2019YFE0102100) and Huaneng Group science and technology research project (HNKJ20-H50) KTHT-U20GJJS06.
Conflicts of Interest
The authors declare no conflict of interests.
References
- Steinfeld, J.I. Atmospheric Chemistry and Physics: From Air Pollution to Climate Change; Taylor & Francis Group: Abingdon, UK, 1988. [Google Scholar]
- Behera, S.N.; Sharma, M.; Aneja, V.P.; Balasubramanian, R. Ammonia in the atmosphere: A review on emission sources, atmospheric chemistry and deposition on terrestrial bodies. Environ. Sci. Pollut. Res. 2013, 20, 8092–8131. [Google Scholar] [CrossRef]
- Hnatyshyn, M. Decomposition analysis of the impact of economic growth on ammonia and nitrogen oxides emissions in the European Union. J. Int. Stud. 2018, 11, 201–209. [Google Scholar] [CrossRef] [Green Version]
- IEA. World Energy Statistics and Balances, 2012nd ed.; IEA: Paris, France, 2012. [Google Scholar]
- Liu, F.; Beirle, S.; Zhang, Q.; Zheng, B.; Tong, D.; He, K. NOX emission trends over Chinese cities estimated from OMI observations during 2005 to 2015. Atmos. Chem. Phys. 2017, 17, 9261–9275. [Google Scholar] [CrossRef] [Green Version]
- Zhang, H.; Lu, J.F.; Xu, X.Q.; Zeng, R.L.; Yue, G.X. NOx emission and its control in utility coal-fired boilers in China. Chin. J. Power Eng. 2005, 25, 125–130. [Google Scholar]
- Jiang Chunlai, X.Y.; Yang, J. 12th-five total NOX reduce emissions midterm assessment and countermeasures discussion. Environ. Prot. 2013, 41, 19–22. [Google Scholar]
- De Foy, B.; Lu, Z.; Streets, D.G.; Lamsal, L.N.; Duncan, B.N. Estimates of power plant NOx emissions and lifetimes from OMI NO2 satellite retrievals. Atmos. Environ. 2015, 116, 1–11. [Google Scholar] [CrossRef]
- Hong, C.; Zhang, Q.; He, K.; Guan, D.; Li, M.; Liu, F.; Zheng, B. Variations of China’s emission estimates: Response to uncertainties in energy statistics. Atmos. Chem. Phys. 2017, 17, 1227–1239. [Google Scholar] [CrossRef] [Green Version]
- Duncan, B.N.; Lamsal, L.N.; Thompson, A.M.; Yoshida, Y.; Lu, Z.; Streets, D.G.; Hurwitz, M.M.; Pickering, K.E. A space-based, high-resolution view of notable changes in urban NOX pollution around the world (2005–2014). J. Geophys. Res. Atmos. 2016, 121, 976–996. [Google Scholar] [CrossRef] [Green Version]
- Zheng, Y.; Xue, T.; Zhang, Q.; Geng, G.; Tong, D.; Li, X.; He, K. Air quality improvements and health benefits from China’s clean air action since 2013. Environ. Res. Lett. 2017, 12, 114020. [Google Scholar] [CrossRef]
- EU. On the limitation of emissions of certain pollutants into the air from large combustion plants. In Directive 2001/80/EC of the European Parliament and of the Council; EU: Brussels, Belgium, 2001. [Google Scholar]
- EPA. Standards of Performance for Electric Utility Steam Generating Units; EPA: Washington, DC, USA, 2006. [Google Scholar]
- Cho, J.M.; Choi, J.W.; Hong, S.H.; Kim, K.C.; Na, J.H.; Lee, J.Y. The methodology to improve the performance of a selective catalytic reduction system installed in HRSG using computational fluid dynamics analysis. Environ. Eng. Sci. 2006, 23, 863–873. [Google Scholar]
- Mustafić, H.; Jabre, P.; Caussin, C.; Murad, M.H.; Escolano, S.; Tafflet, M.; Périer, M.-C.; Marijon, E.; Vernerey, D.; Empana, J.-P.; et al. Main air pollutants and myocardial infarction: A systematic review and meta-analysis. JAMA J. Am. Med. Assoc. 2012, 307, 713–721. [Google Scholar] [CrossRef] [PubMed]
- Schaub, G.; Unruh, D.; Wang, J.; Turek, T. Kinetic analysis of selective catalytic NOx reduction (SCR) in a catalytic filter. Chem. Eng. Process. 2003, 42, 365–371. [Google Scholar]
- Saracco, G.; Specchia, V. Simultaneous removal of nitrogen oxides and fly-ash from coal-based power plant flue gases. Appl. Therm. Eng. 1998, 18, 1025–1035. [Google Scholar] [CrossRef]
- Ness, S.R.; Dunham, G.E.; Weber, G.F.; Ludlow, D.K. SCR catalyst-coated fabric filters for simultaneous NOx and high temperature particulate control. Environ. Prog. 1995, 14, 69–73. [Google Scholar] [CrossRef]
- Sultana, A.; Sasaki, M.; Suzuki, K.; Hamada, H. Tuning the NOx conversion of Cu- Fe/ZSM-5 catalyst in NH3-SCR. Catal. Commun. 2013, 41, 21–25. [Google Scholar] [CrossRef]
- Strege, J.R.; Zygarlicke, C.J.; Folkedahl, B.C.; McCollor, D.P. SCR deactivation in a full-scale cofired utility boiler. Fuel 2008, 87, 1314–1347. [Google Scholar] [CrossRef]
- Skalska, K.; Miller, J.S.; Ledakowicz, S. Trends in NOX abatement: A review. Sci. Total Environ. 2010, 408, 3976–3989. [Google Scholar] [CrossRef]
- Tan, L.; Feng, P.; Yang, S.; Guo, Y.; Liu, S.; Li, Z. CFD studies on effects of SCR mixers on the performance of urea conversion and mixing of the reducing agent. Chem. Eng. Process. Process Intensif. 2018, 123, 82–88. [Google Scholar] [CrossRef]
- Xu, Y.; Zhang, Y.; Liu, F.; Shi, W.; Yuan, J. CFD analysis on the catalyst layer breakage failure of an SCR-DeNOX system for a 350MW coal-fired power plant. Comput. Chem. Eng. 2014, 69, 119–127. [Google Scholar] [CrossRef]
- Wilburn, R.T.; Wright, T.L. SCR ammonia slip distribution in coal plant effluents and dependence upon SO3. Powerpl. Chem. 2004, 6, 295–395. [Google Scholar]
- Burke, J.M.; Johnson, K.L. Ammonium Sulfate and Bisulfate Formation in Air Preheaters; Radian Corporation: Nashville, TN, USA, 1982. [Google Scholar]
- Matsuda, S.; Kamo, T.; Kato, A.; Nakajima, F.; Kumura, T.; Kuroda, H. Deposition of ammonium bisulfate in the selective catalytic reduction of nitrogen oxides with ammonia. Ind. Eng. Chem. Prod. Res. Dev. 1982, 21, 48–52. [Google Scholar] [CrossRef]
- Menasha, J.; Dunn-Rankin, D.; Muzio, L.; Stallings, J. Ammonium bisulfate formation temperature in a bench-scale single-channel air preheater. Fuel 2011, 90, 2445–2453. [Google Scholar] [CrossRef]
- Cheng, X.; Bi, X.T. A review of recent advances in selective catalytic NOX reduction reactor technologies. Particuology 2014, 16, 1–18. [Google Scholar] [CrossRef]
- Liu, Z.; Li, J.; Woo, S.I. Recent advances in the selective catalytic reduction of NOX by hydrogen in the presence of oxygen. Energy Environ. Sci. 2012, 5, 8799–8814. [Google Scholar] [CrossRef]
- Lei, Z.; Wen, C.; Chen, B. Optimization of internals for selective catalytic reduction (SCR) for NO removal. Environ. Sci. Technol. 2011, 45, 3437–3444. [Google Scholar] [CrossRef] [PubMed]
- Wei, J.Y.; Muzio, L.J.; Dunn-Rankin, D. Formation temperature of ammonium bisulfate at simulated air preheater conditions. In Proceedings of the 5th US combustion meeting, San Diego, CA, USA, 25–28 March 2007. [Google Scholar]
- Chen, L.; Zhou, S.; Wang, W. Simulation Optimization on Flow Field of SCR Denitrification Reactors. J. Chin. Soc. Power Eng. 2010, 30, 224–229. [Google Scholar]
- Rogers, K.J.; Nolan, P.S. SCR Reactor Performance Profiling and Results Analysis. In Proceedings of the U.S. EPA/DOE/EPRI Combined Power Plant Air Pollutant Control Symposium, Chicago, IL, USA, 20–23 August 2001. [Google Scholar]
- Paramadayalan, T.; Pant, A. Selective catalytic reduction converter disign: The effect of ammonia nonuniformity at inlet. Korean J. Chem. Eng. 2013, 30, 2170–2177. [Google Scholar] [CrossRef]
- Dong, J.X.; Li, C.F.; Wang, S.L.; Chen, H.W. Simulation of effect of non-uniformity of reagent distribution of SCR DeNOx performance. Power Syst. Eng. 2007, 23, 20–24. [Google Scholar]
- Liu, H.; Guo, T.; Yang, Y.; Lu, G. Optimization and Numerical Simulation of the Flow Characteristics in SCR System. Energy Procedia 2012, 17, 801–812. [Google Scholar] [CrossRef] [Green Version]
- Dan, S.; Zhaoping, Z.; Xiaoling, G. Numerical simulation of different guide plates in selective catalytic reduction denitrification reactor of 600MW power plant. Electr. Power Environ. Prot. 2007, 23, 42–45. [Google Scholar]
- Rogers, K.J.; Thompson, C.; Pollutant, E.P.P.A. Development and Performance Data for Ammonia Injection and Gas Mixing Processes on SCR Applications. In U.S.EPA/DOE/EPRI Combined Power Plant and Air Pollutant Control Symposium; The USA EPRI: Washington, DC, USA, 2004; Volume 2, pp. 645–667. [Google Scholar]
- Zhaojun, F.; Meiling, Y.U.; Changqing, G. Research on Optimization of Denitrification and Ammonia Spray for Power Plant SCR System. Ind. Saf. Environ. Prot. (Chin.) 2014, 40, 25–28. [Google Scholar]
- Muncy, J.; Shore, D.; Martz, T. Interlayer mixing for improved SCR performance. In Proceedings of the 2006 Environmental Controls Conference, Pittsburgh, PA, USA, 16–18 May 2006. [Google Scholar]
- Ruggeri, M.P.; Grossale, A.; Nova, I.; Tronconi, E.; Jirglova, H.; Sobalik, Z. FTIR in situ mechanistic study of the NH3-NO/NO2 “Fast SCR” reaction over a commercial Fe-ZSM-5 catalyst. Catal. Today 2012, 184, 107–114. [Google Scholar] [CrossRef]
- Choi, H.S.; Kim, S.J.; Kim, K.T. Enhancement of turbulent scalar mixing and its application by a multihole nozzle in selective catalytic reduction of NOX. J. Mater. Cycles Waste Manag. 2008, 10, 1–6. [Google Scholar] [CrossRef]
- Mao, J.H.; Song, H.; Wu, W.H.; Zhong, Y.; Gao, X.; Luo, Z.Y.; Cen, K.F. Design and optimization of splitters in SCR system for coal fired boilers. J. Zhejiang Univ. 2011, 45, 1124–1129. [Google Scholar]
- Xu, Y.; Zhang, Y.; Wang, J.; Yuan, J. Application of CFD in the optimal design of a SCR-DENOX system for a 300MW coal-fired power plant. Comput. Chem. Eng. 2013, 49, 50–60. [Google Scholar] [CrossRef]
- Luo, Z.; Niu, G.; Wang, X.; Chang, L.; Pan, D.; Xu, X.; Dong, C. Engineering Application of dynamic ammonia injection technology based on partition mixing. Therm. Power Gener. (Chin.) 2018, 47, 125–132. [Google Scholar]
- Opitz, B.; Bendrich, M.; Drochner, A.; Vogel, H.; Hayes, R.E.; Forbes, J.F.; Votsmeier, M. Simulation study of SCR catalysts with individually adjusted ammonia dosing strategies. Chem. Eng. J. 2015, 264, 936–944. [Google Scholar] [CrossRef]
- Faghihi, E.M.; Shamekhi, A.H. Development of a neural network model for selective catalytic reduction (SCR) catalytic converter and ammonia dosing optimization using multi objective genetic algorithm. Chem. Eng. J. 2010, 165, 508–516. [Google Scholar] [CrossRef]
- Schreifels, J.J.; Wang, S.; Hao, J. Design and operational considerations for selective catalytic reduction technologies at coal-fired boilers. Front. Energy 2012, 6, 98–105. [Google Scholar] [CrossRef]
- Yu, Y.; Chen, Y.; Li, F. Design and numerical simulation for selective catalytic reduction system in power plant. Model Electr. Power 2007, 3, 59–61. [Google Scholar]
Figure 1.
Statistics data of the average ammonia excessive ratio of selective catalytic reduction (SCR).
Figure 1.
Statistics data of the average ammonia excessive ratio of selective catalytic reduction (SCR).

Figure 2.
Statistics data of the average air preheater (AH)-resistance in coal-fired plants.

Figure 3.
Site test result of the ammonia emission of Plant A—I.

Figure 4.
Ammonia removal efficiency of electrostatic precipitator (ESP) and bag house.

Figure 5.
Ammonia removal efficiency of wet flue-gas desulfurization (FGD).

Figure 6.
Theoretical and on-site testing comparison of deviation coefficient of the NH3/NOX molar ratio distribution (σ/μ) (Cv) and NOX removal efficiency (under given ammonia slip).
Figure 6.
Theoretical and on-site testing comparison of deviation coefficient of the NH3/NOX molar ratio distribution (σ/μ) (Cv) and NOX removal efficiency (under given ammonia slip).

Figure 7.
Quantitative relationship of the ammonia slip/De–NOX efficiency and Cv.

Figure 8.
NOX distributions at SCR inlet of the 600 MW unit at different loads.

Figure 9.
Concept of the real-time self-feedback ammonia injection technology.

Figure 10.
NOX distribution at SCR outlet in a 600-MW unit at different loads.

Figure 11.
Comparison of the ammonia consumption before and after implementing the technology in a 600-MW unit.
Figure 11.
Comparison of the ammonia consumption before and after implementing the technology in a 600-MW unit.


Table 1.
Detail information of the nine units tested.
| NO. | Unit Capacity | Dust Precipitator | Desulfurization Device | Terminal Dust Precipitator |
|---|---|---|---|---|
| Plant A | 330 MW | Bag filter | Gypsum/limestone FGD | Wet ESP |
| Plant B | 350 MW | Bag filter | Gypsum/limestone FGD | Wet ESP |
| Plant C | 330 MW | ESP | Gypsum/limestone FGD | Wet ESP |
| Plant D | 220 MW | ESP | Gypsum/limestone FGD | Wet ESP |
| Plant E | 330 MW | ESP | Gypsum/limestone FGD | Wet ESP |
| Plant F | 330 MW | ESP | Gypsum/limestone FGD | Wet ESP |
| Plant G | 600 MW | ESP | Gypsum/limestone FGD | None |
| Plant H | 330 MW | ESP | Gypsum/limestone FGD | Wet ESP |
| Plant I | 630 MW | ESP | Gypsum/limestone FGD | Wet ESP |
© 2020 by the authors. Licensee MDPI, Basel, Switzerland. This article is an open access article distributed under the terms and conditions of the Creative Commons Attribution (CC BY) license (http://creativecommons.org/licenses/by/4.0/).
Share and Cite
MDPI and ACS Style
Yao, X.; Zhang, M.; Kong, H.; Lyu, J.; Yang, H. Investigation and Control Technology on Excessive Ammonia-Slipping in Coal-Fired Plants. Energies 2020, 13, 4249. https://0-doi-org.brum.beds.ac.uk/10.3390/en13164249
AMA Style
Yao X, Zhang M, Kong H, Lyu J, Yang H. Investigation and Control Technology on Excessive Ammonia-Slipping in Coal-Fired Plants. Energies. 2020; 13(16):4249. https://0-doi-org.brum.beds.ac.uk/10.3390/en13164249
Chicago/Turabian StyleYao, Xuan, Man Zhang, Hao Kong, Junfu Lyu, and Hairui Yang. 2020. "Investigation and Control Technology on Excessive Ammonia-Slipping in Coal-Fired Plants" Energies 13, no. 16: 4249. https://0-doi-org.brum.beds.ac.uk/10.3390/en13164249
Note that from the first issue of 2016, this journal uses article numbers instead of page numbers. See further details here.