Multidisciplinary Characterization of Unconventional Reservoirs Based on Correlation of Well and Seismic Data


Oil and Gas Institute—National Research Institute, 25A Lubicz Str., 31-503 Kraków, Poland
*
Author to whom correspondence should be addressed.
Energies 2020, 13(17), 4413; https://0-doi-org.brum.beds.ac.uk/10.3390/en13174413
Submission received: 21 July 2020
/
Revised: 19 August 2020
/
Accepted: 21 August 2020
/
Published: 26 August 2020
(This article belongs to the Special Issue Development of Unconventional Reservoirs 2020)
Abstract
:Combinatorial analysis of key petrophysical parameters can provide valuable information about subsurface hydrocarbon reservoirs. This is particularly important for reservoirs with unconventional rock formations that, due to the low permeability, need to be stimulated by fracturing treatment to provide fluid flow to the exploitation wellbore. In this article, based on data from unconventional shale formations (N Poland), we outline how independent sets of elastic and petrophysical parameters and other reservoir features can be co-analyzed to estimate the fracture susceptibility of shale intervals, which are characterized by a high total organic carbon (TOC) content and high porosity. These features were determined by analysis of each horizon’s elastic and mineralogical brittleness index (BI). These two variants were calculated first in 1D; integrated with the seismic data and finally compared with other parameters such as acoustic impedance, ratio of compressional and shear wave velocities, porosity, and density; and then presented and analyzed using cross plots that highlighted the key relationships between them. The overall BI trends were similar in both horizontal and vertical directions. The highest BI values were observed in the southeast of the analyzed area (Source I) and in the southeast and northwest of the area (Source II). These results can form the basis for predictive modeling of reservoir properties aiding effective reservoir exploration.
1. Introduction
Comprehensive reservoir characterization requires the use of a wide range of geophysical and petrophysical data; however, it is often unclear which sets of parameters provide the most important information about a reservoir rock. Elastic properties represent the most fundamental reservoir parameters that can be measured; as such, when combined with petrophysical parameters and other reservoir features, they allow complete characterization of a reservoir rock. A thorough characterization is particularly essential for unconventional reservoir rock, which requires specific and adjusted to the reservoir recovery operations outside the conventional operating practices. Consequently, in the case of unconventional reservoirs, the results of parameter integration are especially useful for lithostratigraphic classification, identification of sweet spots, determination of susceptibility to hydraulic fracturing, and characterization of stress fields in an unconventional reservoir.
By contrast with compressional (P) wave velocity (Vp), shear (S) wave velocity (Vs) is rarely measured during geophysical surveying, although it represents an important tool for reservoir characterization. Compressional and shear waves are elastic waves that pass through a medium and cause particle motion in a direction parallel in case of P—wave and perpendicular in case of S—wave to that of wave propagation (Figure 1). In contrast to compressional waves, shear waves are not transmitted through fluids [1]. The velocity of a compressional and shear wave depends on the elasticity and density of the medium through which it propagates and can be expressed as follows [1]:
where µ is the shear modulus, k is the bulk modulus, and ρ is the density of the medium in question. Both Vp and Vs were used in this study to estimate a wide range of dynamic elastic parameters for reservoir rocks by using data collected from four wells and associated regional-scale seismic surveys. These analyses were used to quantify the hydraulic fracturing potential of two source intervals located within Silurian and Ordovician strata (Figure 1).
Previous research and recent studies covering the parametrical characterization of the research area have been well investigated by numerous authors [2,3,4,5,6,7,8,9,10]. These studies can be divided into three general topics:
In this article, we propose the following workflow: (1) characterizing the reservoir in a 1D profile in terms of analyzing issue using different approaches, (2) generating 3D pseudo parameters, (3) calculating 3D properties of analyzing variants, (4) if the correlation coefficient between the variants is high enough—combining the results, (5) analyzing the results with other reservoir parameters on cross plots, and (6) implementing appropriate observations within a 3D property. As an example of this approach, we present possibilities of coherent multiparametric reservoir characterization, where all analyzed parameters related to the potential of hydraulic fracturing are correlated. We show the characteristic of the brittleness index in two variants (elastic and mineralogical) which in face of high correlation coefficient with the seismic data was used for spatial characteristic of the brittleness index. According to rock physics, a coherent reservoir model must include interrelations (e.g., brittleness index (BI) versus effective porosity (PHIE) versus bulk density (RHOB)) and dependencies defined on cross plots for more reliable results and reduce it uncertainty [1,11,12,13].
Geological Setting
The research area is located in northern Poland, in the western fragment of the Baltic Syneclise, part of the Baltic Basin [7,14,15]. Shales enriched with organic matter were deposited in the Baltic Basin similarly as in other basin-like sedimentary structures, both developed in early Paleozoic in the western slope of the East European Craton (EEC). As a result of subsequent tectonic processes and erosion, these basins were divided into the Baltic Basin (Perybaltic Syneclise) and the Podlasie and Lublin Depression [16]. The greatest hydrocarbons potential has mainly graptolite shales of Upper Ordovician and Lower Silurian age but also, to a much lesser extent, the Llodlovian, and locally Upper Cambrian and Tremadocian shales [17,18].
In this paper, the authors focused on the Jantar Mudstone Formation of Lower Silurian age (Source I) and the Sasino Mudstone Formation of Upper Ordovician age (Source II). These shale formations constitute an unconventional reservoir being an organic matter rich source rock and a nanoporous and low permeable reservoir for hydrocarbons at the same time [19].
- Source I consists of the Jantar mudstones, the formation that starts the sedimentological profile of the Llandoverian age. In the Baltic Basin, the Jantar mudstones formation is developed as black bituminous mudstones with present graptolite fauna [8,17]. The Jantar mudstones were deposited in a transgressive–regressive sedimentary cycle, with a maximum thickness of 25 m. The shales of Jantar formation are enriched in organic matter, with an average total organic carbon (TOC) of 1–2.5 wt. % [8].
- Source II is the Sasino Mudstone Formation consisting of shales of Upper Llanvirnian and Caradocian age and is widely distributed in all three depressions on the EEC in Poland [8]. The deposits of Sasino formation are represented by black or dark grey to green-grey mudstones, often with graptolite and with subordinate benthic fauna. The thickness of the Sasino mudstones varies and in onshore succession is as high as 35 m and becomes thicker in the offshore succession, reaching approximately 70 m. The Sasino Mudstone Formation is rich in organic matter with TOC ranging from 1.5 wt. % to >3.5 wt. % [8].
The analyzed Source I and Source II intervals are the most promising formations from the hydrocarbon potential point of view (high TOC content together with high PHIe value), within the analyzed borehole profiles. Based on geochemical data, the degree of organic matter maturity from both Source I and Source II define the main oil window that indicates oil accumulation within the source rocks [9].
2. Materials and Methods
2.1. Relevant Data Acquisition
The distribution of stress in a stimulated rock formation controls many elements of reservoir characterization and exploitation, including the proper selection of a drilling location, the optimal trajectory of the horizontal section of a borehole within the zone where the rock fracturing is planned, and the anticipated geometry of hydraulic fractures. In addition, the effectiveness of a stimulation treatment depends to a minor degree on the parameters of the treatment, but mostly on the geomechanical properties of the rock formation. These may be expressed in terms of elastic parameters, compressive and tensile strength, friction angle, and other petrophysical factors [5].
The data used for the multidisciplinary characteristics of the unconventional reservoir presented in the article included:
Well logs from four wellbores (O-1, O-2, O-3, O-4):
- ▪
- compressional wave velocity logs; interpreted based on full wave sonic measurements,
- ▪
- shear wave velocity logs; interpreted based on full wave sonic measurements,
- ▪
- density logs; measured in the borehole,
- ▪
- porosity, TOC and mineral composition interpretation logs–evaluated based on set of logs in petrophysical software and calibrated with the laboratory data.
Seismic:
- ▪
- amplitude cube available in both time and depth domain. The area of the three-dimensional seismic survey covers approximately 117 km2.
Based on this data, the brittleness index in two variants was calculated as described below.
2.2. Brittleness Index
Due to recent growing interest in the hydrocarbon potential of unconventional rock formations, a parameter called the brittleness index (BI) has been developed [20,21,22,23,24,25]. BI has proven to be extremely useful for identifying subsurface strata with a potentially high susceptibility to hydraulic fracturing. Since then, many definitions of BI have been proposed in the literature, with some based on elastic parameters (Young’s modulus and Poisson’s ratio) and others based on variation in the mineral composition of a rock. It has been observed that an increase in quartz content in shale members of the Barnett Formation makes them more brittle, making these rocks more susceptible to brittle damage [20]. Some studies have also observed a positive correlation between quartz content and fracture density in Woodford shale [26,27]. As such, high concentrations of clay minerals and enrichment in organic matter cause a rock’s BI to decrease [3,21]. The very first definition of the BI based on the mineralogical content of the rock proposed by Jarvie et al. (2007) [22], which we show below:
where Q = quartz, Carb = carbonates, and Cly = clay in weight fractions, considering the quartz content in the numerator and the sum of the main minerals in the denominator. This relationship has since been modified [23] to expand the group of brittle minerals to include dolomite and to consider the TOC content of the rock composition. Nonetheless, since the denominator in this relationship for most shale rocks gets the value close to one, and the proportion of dolomite in shales is typically negligible, the value of the BI primarily depends on the quartz content of the rock instead.
Another definition of brittleness has been proposed based on the elastic properties of the Barnett shale formation [24], which is expressed in terms of the Young’s modulus (E) and Poisson’s ratio (ν). Here, in terms of the elasticity of a rock formation, an existing fracture will grow when the tensile stress (σT) acting at the tip of a crack exceeds the sum of the minimum effective horizontal stress (σh’) and the tensile strength (T), as shown below:
The value for effective horizontal stress value can be calculated as follows:
where σv’ represents the vertical effective stress. Equation (4) shows that a low value of v produces a low value for the minimum horizontal stress, making it easier to meet the above-mentioned condition of opening a pre-existing fracture in a rock when subjected to stimulation treatment [25].
2.3. Estimation of Brittleness Index
In this study, the BI was calculated in the following two forms: (1) BIelast which considers the elastic parameters of a rock, and (2) BImin, which considers its mineralogical content. Determination of BI using these two independent methods allowed direct comparison of results produced based on independent (but related) datasets.
BIelast represents the BI based on elasticity and was estimated using well log data as follows:
The values of the static elasticity modulus are commonly determined using uniaxial or triaxial compression tests carried out on rock samples. However, the dynamic elasticity modulus (dynamic Poisson ratio—vdyn, Edyn—dynamic Young modulus) can alternatively be calculated based on measured Vp vs. and ρ values, as follows [13,28,29]:
and
BImin, which represents the BI based on mineralogical data, was estimated as follows [23]:
where: VQ = volume of quartz, Vdol = volume of dolomite, Vcal = volume of calcite, Vclay = volume of clay, and VTOC = volume of TOC.
2.4. Spatial Distribution of Estimated Parameters
Three-dimensional parametric models allow us to obtain more complete, quantitative characteristics of the reservoir compared to the analyzes carried out only in the boreholes profiles. Determining the prospectiveness of shale formations in a quantitative form (e.g., for the area of a seismic survey or a concession), as well as indicating the optimal zones of the analyzed area for the fracturing treatment, require the development of maps or spatial models of the distribution of specific parameters. The spatial form of imaging the features of geological formations enables the analysis of both horizontal and vertical variability. Based on the interpretation of the spatial distribution of formation features, it is possible to design the borehole trajectories in the most favorable interval of the reservoir. Properly integrated well data with seismic data make it possible to predict the values of the analyzed parameters in inter-well and outside well zones. Optimization of the seismic data use consists in searching for the most effective methods of integrating well data in the form of a consistent interpretation of the analyzed parameter with the seismic data extracted in the profiles of these wells. The finding of a sufficiently high correlation between these groups of data makes it possible to track the spatial variability of selected seismic parameters and to use it in the process of calculating the distribution of reservoir parameters, where the seismic data is treated as secondary data, controlling the distribution of the modeled physical feature of the rock medium.
2.5. Parameters Relation Analysis
Rock physics creates a link between geophysical measurements and geological parameters. It also quantifies the relationship between the physical and elastic properties of a rock [11,13]. The use of seismic data allows rock physical properties to be examined spatially. This step is an important part of the reservoir characterization process, as it describes a rock solely by the physical characteristics that affect how seismic waves are transmitted, avoiding biased interpretations based on other criteria. Several landmark studies have been recently published that provide an extensive introduction to models of rock physics and their application to seismic interpretation [30,31,32], alongside a comprehensive set of theoretical and empirical relations [4].
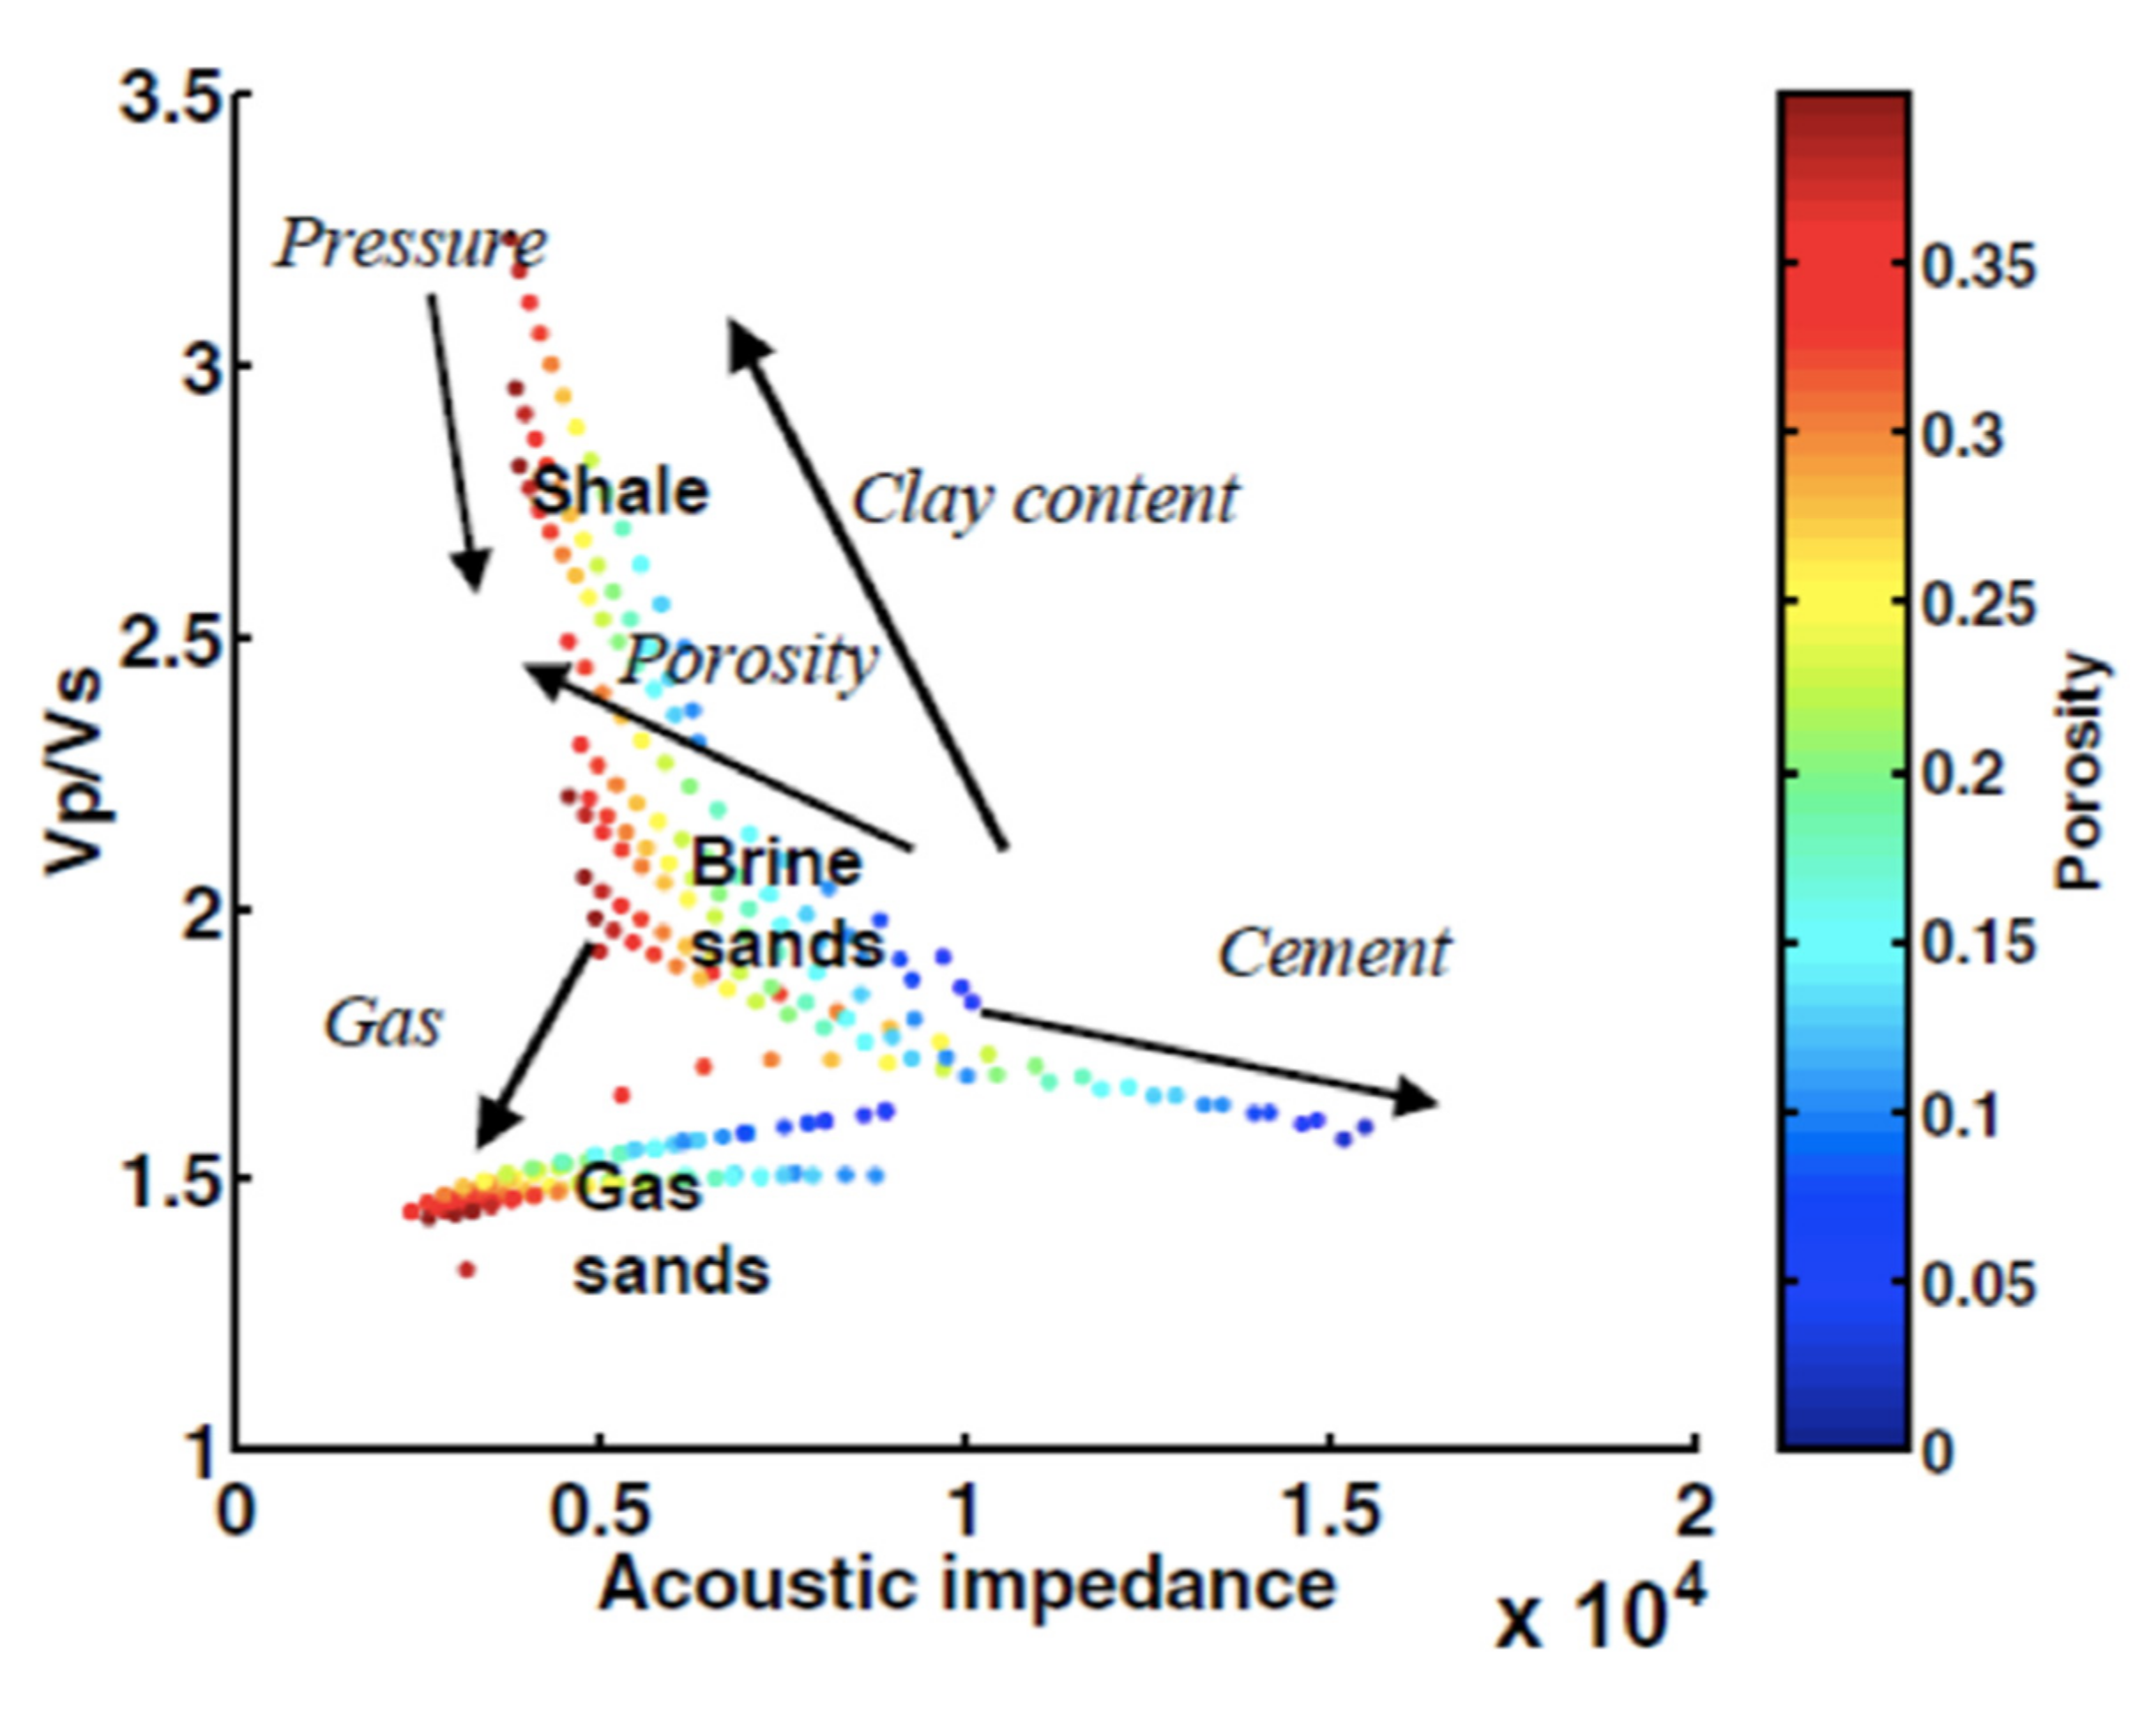
The availability of Vp, Vs, and density log data in reservoir studies allows the following elastic properties to be estimated: acoustic impedance (AI), shear impedance (Is), Vp/Vs ratio, Poisson’s ratio (v), Young’s modulus (E), Lamé constants (λ, μ), shear modulus (k), lambda-rho (λρ), and mu-rho (μρ). These parameters may be used in combination with reservoir properties derived from laboratory testing, such as porosity, density, water content, gas content, oil saturation, clay volume, and mineral composition, alongside the interpretation of well log data and the results of seismic inversion. This integrated technique allows for wide-ranging analyses that can fully characterize the petrophysical properties of a reservoir [11,12,13,33,34,35]. Furthermore, the recently developed rock physics template (RPT) technique [36] can estimate the fluid and mineralogical content of a reservoir rock on a cross plot of Vp/Vs ratio against the AI of a P wave (Figure 2). This method has been described in numerous publications [2,11,13,32,33,34,35,36,37,38,39,40], including focused studies of elastic parameter recognition and RPT analysis of Polish shales [3,4,10,21,41,42,43].
The process of successfully integrating data at different scales represents the biggest challenge in generating detailed 3D models of reservoirs. In response to this problem, some studies have applied the RPT technique to multi-scale laboratory data, well log data, and seismic data [37,38,39,43], though further research is required to determine best practices for this technique. Here, we report the results of multidisciplinary characterization of an unconventional reservoir based on relationships between various reservoir parameters in 1D, 2D, and 3D. Our analysis is focused on the spatial distribution of the brittleness index, which provides important information about fracture susceptibility in unconventional reservoirs.
3. Results and Discussion
We start multidisciplinary characteristic of study area based on results of above described brittleness index calculations. In Figure 3 we show the calculated values of BIelast and BImin, together with the relevant data from one representative well, out of four analyzed boreholes, drilled within the area of the study, through the same strata.
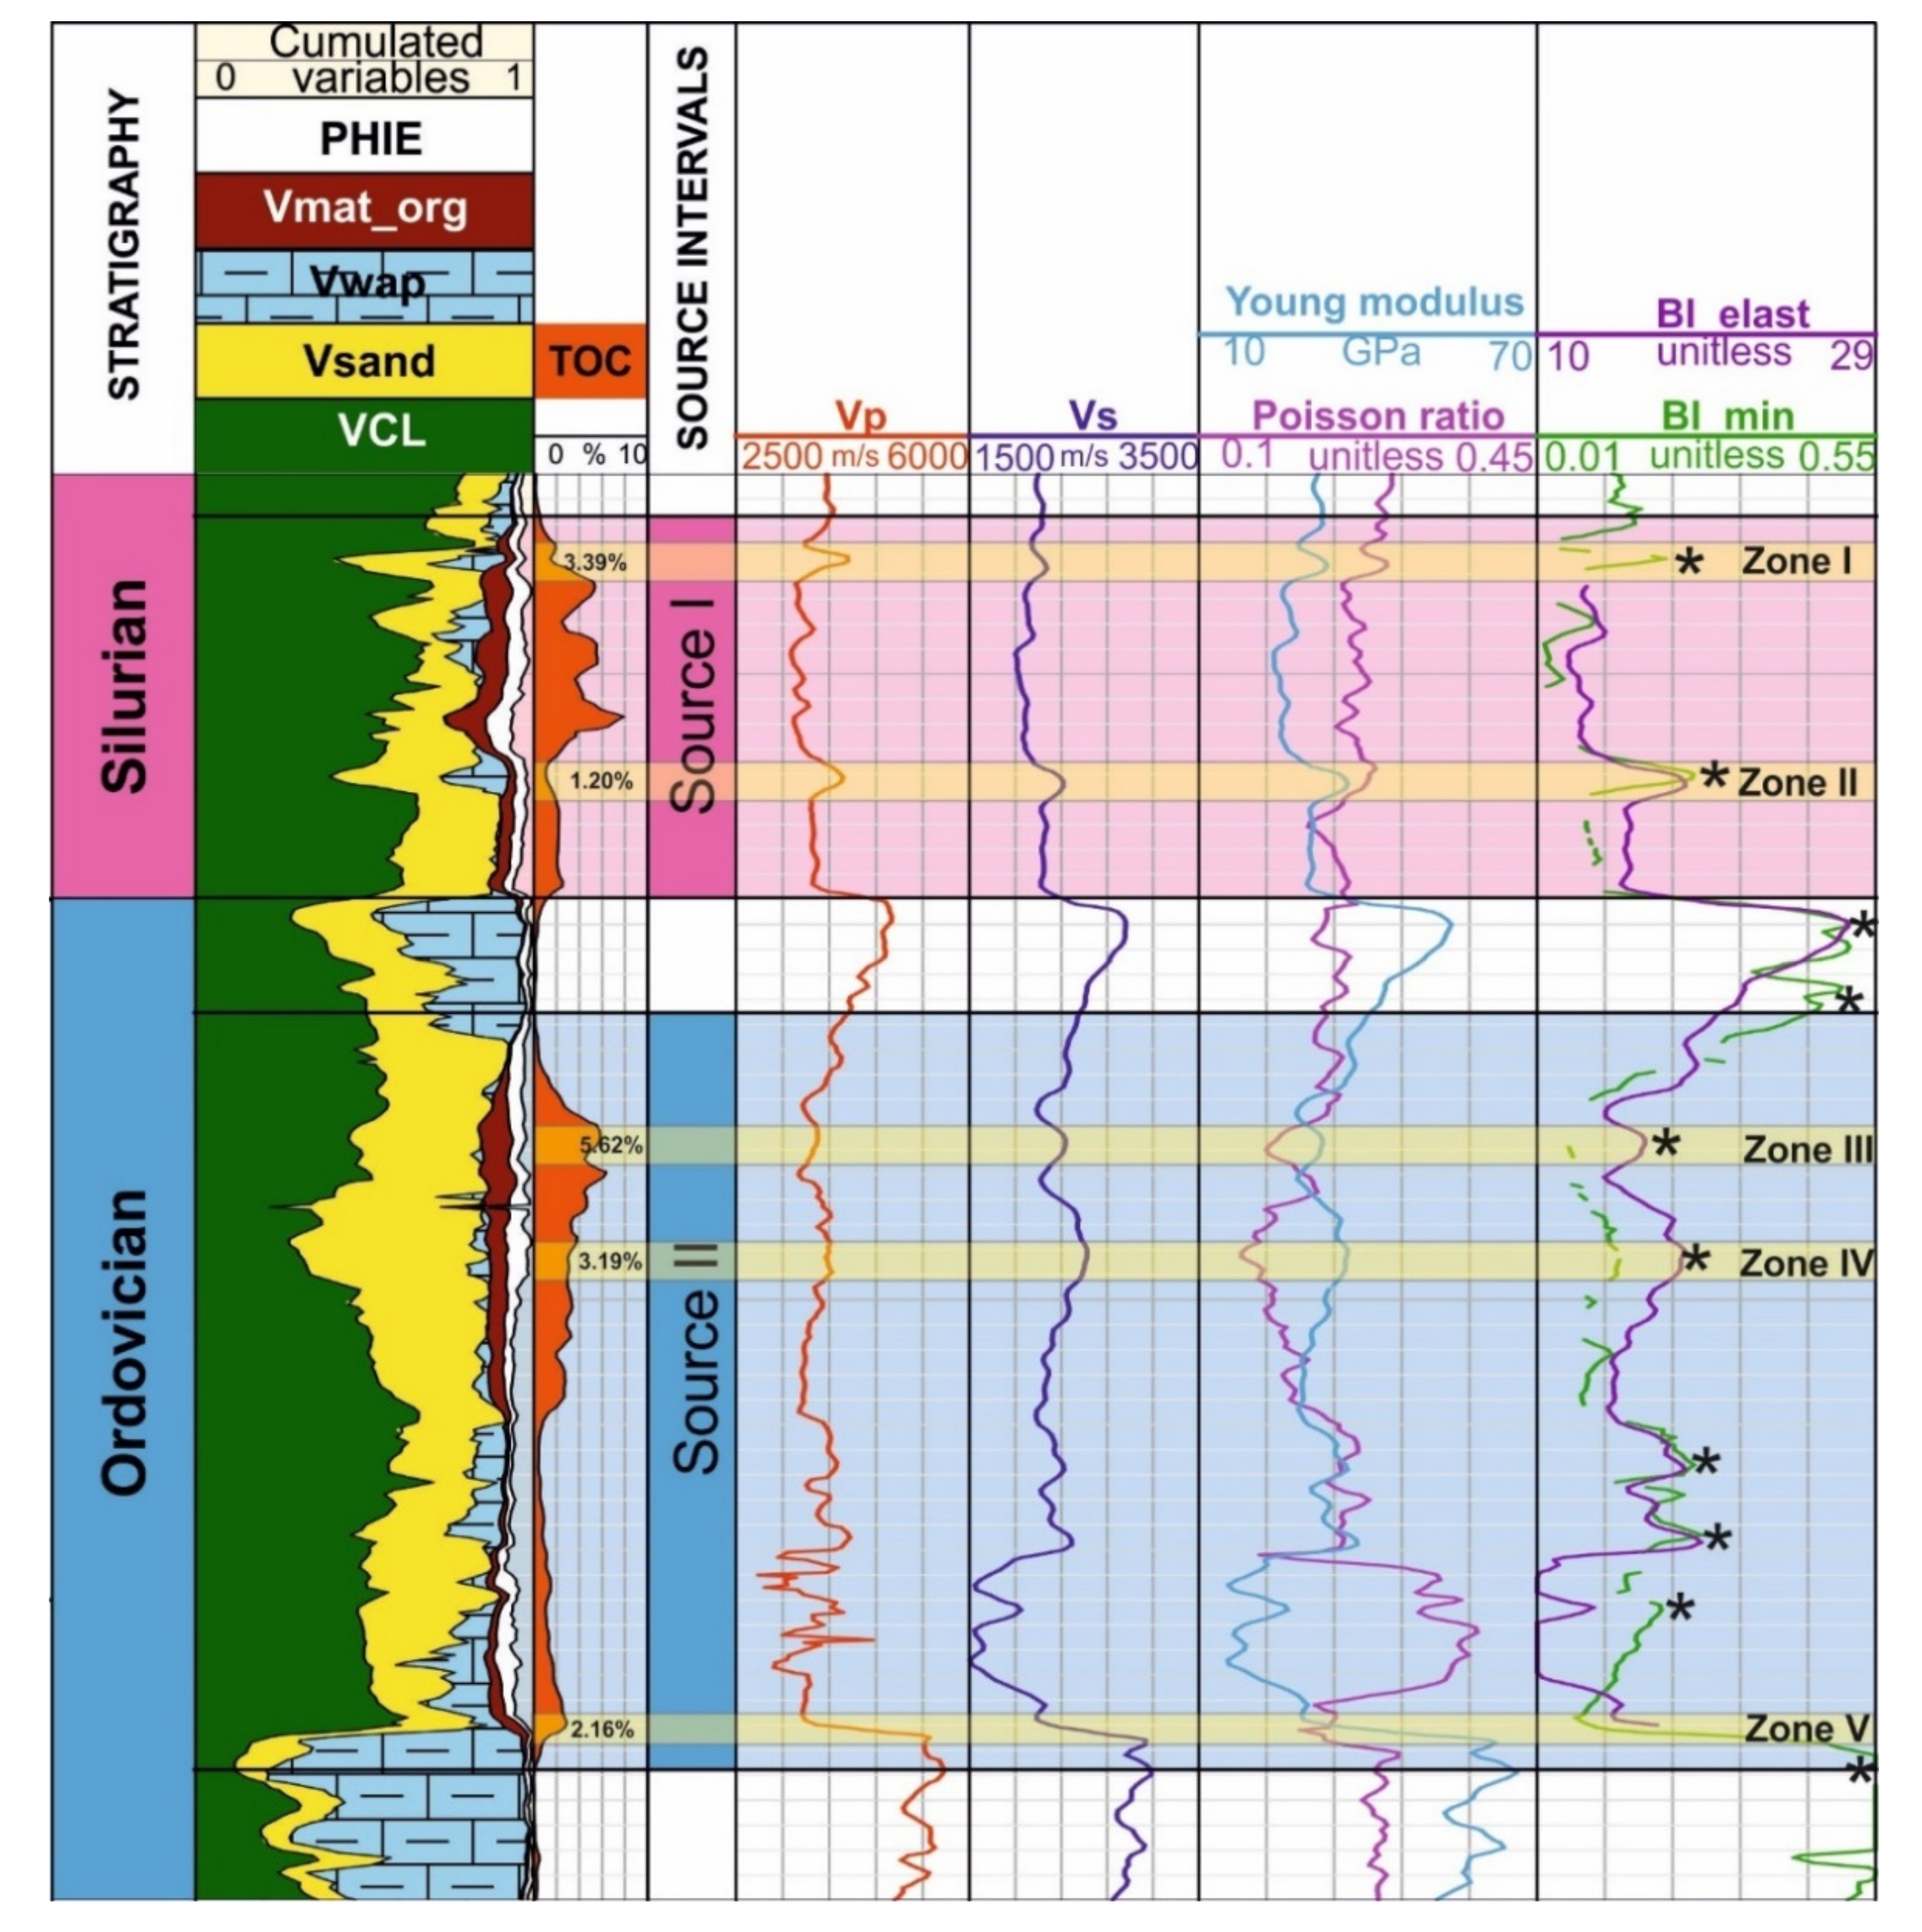
Both BI variants had high values in the strata with a high proportion of brittle minerals (quartz and carbonates), whereas both were low in zones enriched in organic matter and clay minerals. The greatest fluctuations (marked as * in Figure 3) in both BI variants occurred in zones with an increased content of quartz, carbonates and organic matter, although both variants showed a similar trend. In general, BIelast was less sensitive to changing quartz, carbonates, clay mineral, and TOC contents than BImin. Specifically, increased BImin values were correlated with high quartz and carbonate minerals contents and decreased values were correlated with zones enriched in clay minerals and organic matter. In Figure 3, five zones (I–V) with greater susceptibility to fracturing and enrichment in organic matter at the same time are marked. In the Table 1 we present the average values of the main mineral components and TOC. Two zones highly susceptible to fracturing occurred in the Source I interval. The first, Zone I, located near the top of the Silurian shale formation, contained 24 vol. % quartz, 21 vol. % carbonate minerals, and up to 3.39 wt. % TOC. The second, Zone II, located toward the base of Source I, contained 30.12 vol. % quartz, 11.8 vol. % carbonate minerals, and 1.2 wt. % TOC. Both zones are characterized by an increase in BI.
Like the Silurian interval, zones with increased fracture susceptibility were selected in the Ordovician shale formation (Source II) based on calculated elastic parameters and mineral contents. Three zones with increased susceptibility to fracturing were found in this domain. Zone III, in the upper part of the Ordovician shale profile, owed its high susceptibility to a relatively high quartz content (38.14 vol. %) and was particularly interesting due to its high TOC content (5.62 wt. %). Zone IV exhibited an increased fracture susceptibility and had the highest quartz content in the entire shale profile examined: up to 53 vol. % of the rock volume. Carbonate minerals in this zone comprised just 2.5–3 vol. % of the analyzed rock volumes. Nonetheless, Zone IV showed increased susceptibility to fracturing and was rich in organic matter (up to 3.19 wt. %). Zone V within the Ordovician shale formation exhibited a high fracture susceptibility due to relatively high quartz (25 vol. %) and carbonate mineral (>30 vol. %) contents. The TOC content of this zone was 2.16 wt. %. Among mineral components occurring in the analyzed strata, we found that BI index is particularly sensitive to the presence of carbonate minerals in the profile. This dependence is visible, especially in the transition zone between Source I and Source II, between zone IV and V, and in the strata below Source II. In these zones, we observe enrichment in carbonates and moderate or small content of quartz.
3.1. Spatial Comparison of BI Variants
The elastic properties presented in this study—and thus also BIelast—are dynamic parameters that can be used for qualitative assessment of a shale formation during reservoir characterization. Therefore, maps of the spatial variation of BI were produced for both BIelast and BImin variants, which highlight domains within the analyzed area that may have better prospects for assessing fracture susceptibility. A critical step preceding map construction was the transformation of the 3D seismic volume into a form that could spatially show BI variation, which was achieved using neural network techniques and a genetic inversion procedure. The neural network technique was used to identify and combine a set of seismic attributes in the so-called meta-attribute [44], with the highest correlation with the brittleness index calculated from the well log data (both BIelast and BImin). This way, an achieved meta-attribute (3D cube of pseudo brittleness index shown on a Figure 4) has been transformed into a brittleness index cubes with the use of BI well logs and genetic inversion procedure. The validity of well logs and seismic data integration is confirmed by a good correlation coefficient values for both BI variants (Figure 4A,B). Correlation coefficient between BI meta-attribute versus BIelast = 0.73 and versus BImin = 0.67.
Based on calculated models set of maps showing distribution of BI average values within Source I and Source II for both BIelast and BImin were performed (Figure 5). Importantly, despite the use of different approaches to calculate each BI variant, all maps of average BI showed similar trends and highlighted the same locations with similar predictions of fracture susceptibility, especially in Source II (Figure 5).
Furthermore, as a result, a map of the average BI values was developed using a combination of both BI variants (Figure 6), which allowed the identification of zones with the highest (>0.7) and lowest (<0.2) occurrences of normalized (0–1) BI values. In Source I, the highest BI values occurred in the southeast; however, while locally similar in Source II, large areas with elevated BI values also occurred in the northwest. The lowest BI values in Source I occurred around the L-1, O-2, and O-3 boreholes, while in Source II these occurred in a belt extending from the southwest to the northeast, passing through the O-4 borehole. A 3D spatial distribution of the most brittle spots within the analyzed area is presented in Figure 7.
3.2. Correlations between Parameters
It is noteworthy that enrichment in organic matter decreases the calculated BI of a rock, thus making it less susceptible to fracturing. Therefore, when determining prime locations for performing stimulation treatments, a compromise should be found at least between these two important reservoir parameters, which can be difficult. To manage this, the relationships between all parameters were examined on cross plots, as inspired by the RPT approach, allowing us to determine the most significant parameters that will affect a final model. Both the BI and associated elastic parameters of a rock correlate closely with other fundamental reservoir properties. This allows for more comprehensive characterization of a reservoir and its lithological components, which is crucial when examining unconventional rock formations that may be hydrocarbon-bearing.
In the next part of the study we quantified the relationships between petrophysical parameters, elastic parameters, BI, and TOC in terms of more detailed reservoir characteristic. First, we investigated the relationship between the Vp/Vs ratio and acoustic impedance (AI) as a function of organic matter content (Figure 8).
Rocks with high TOC values have low Vp/Vs ratios and AI values, while the opposite is true for rocks with low TOC contents. This inverse correlation is affected by a reduction in seismic wave velocity caused by the presence of a reservoir fluid. A similar relationship occurs when comparing TOC with AI. In this case, the effect of reducing seismic wave velocity in zones rich in TOC is promoted by the relatively low density of organic matter compared to inorganic minerals.
In addition to these effects, another widely described phenomenon when discussing fracture susceptibility is an inverse correlation between a rock’s Poisson’s ratio and Young’s modulus, which can be observed in the cross plot shown in Figure 9.
Rocks with higher values for Young’s modulus typically exhibit lower values for Poisson’s ratio, with this inverse correlation attributed to the presence of fractures in water-saturated rocks [45]. This relationship is clearly present in Source II, although is not so apparent in Source I. This discrepancy may be due to a lower degree of fracturing within the latter [46]. Clear correlations between porosity and Poisson’s ratio (positive) and porosity and Young’s modulus (negative) are also evident in this model.
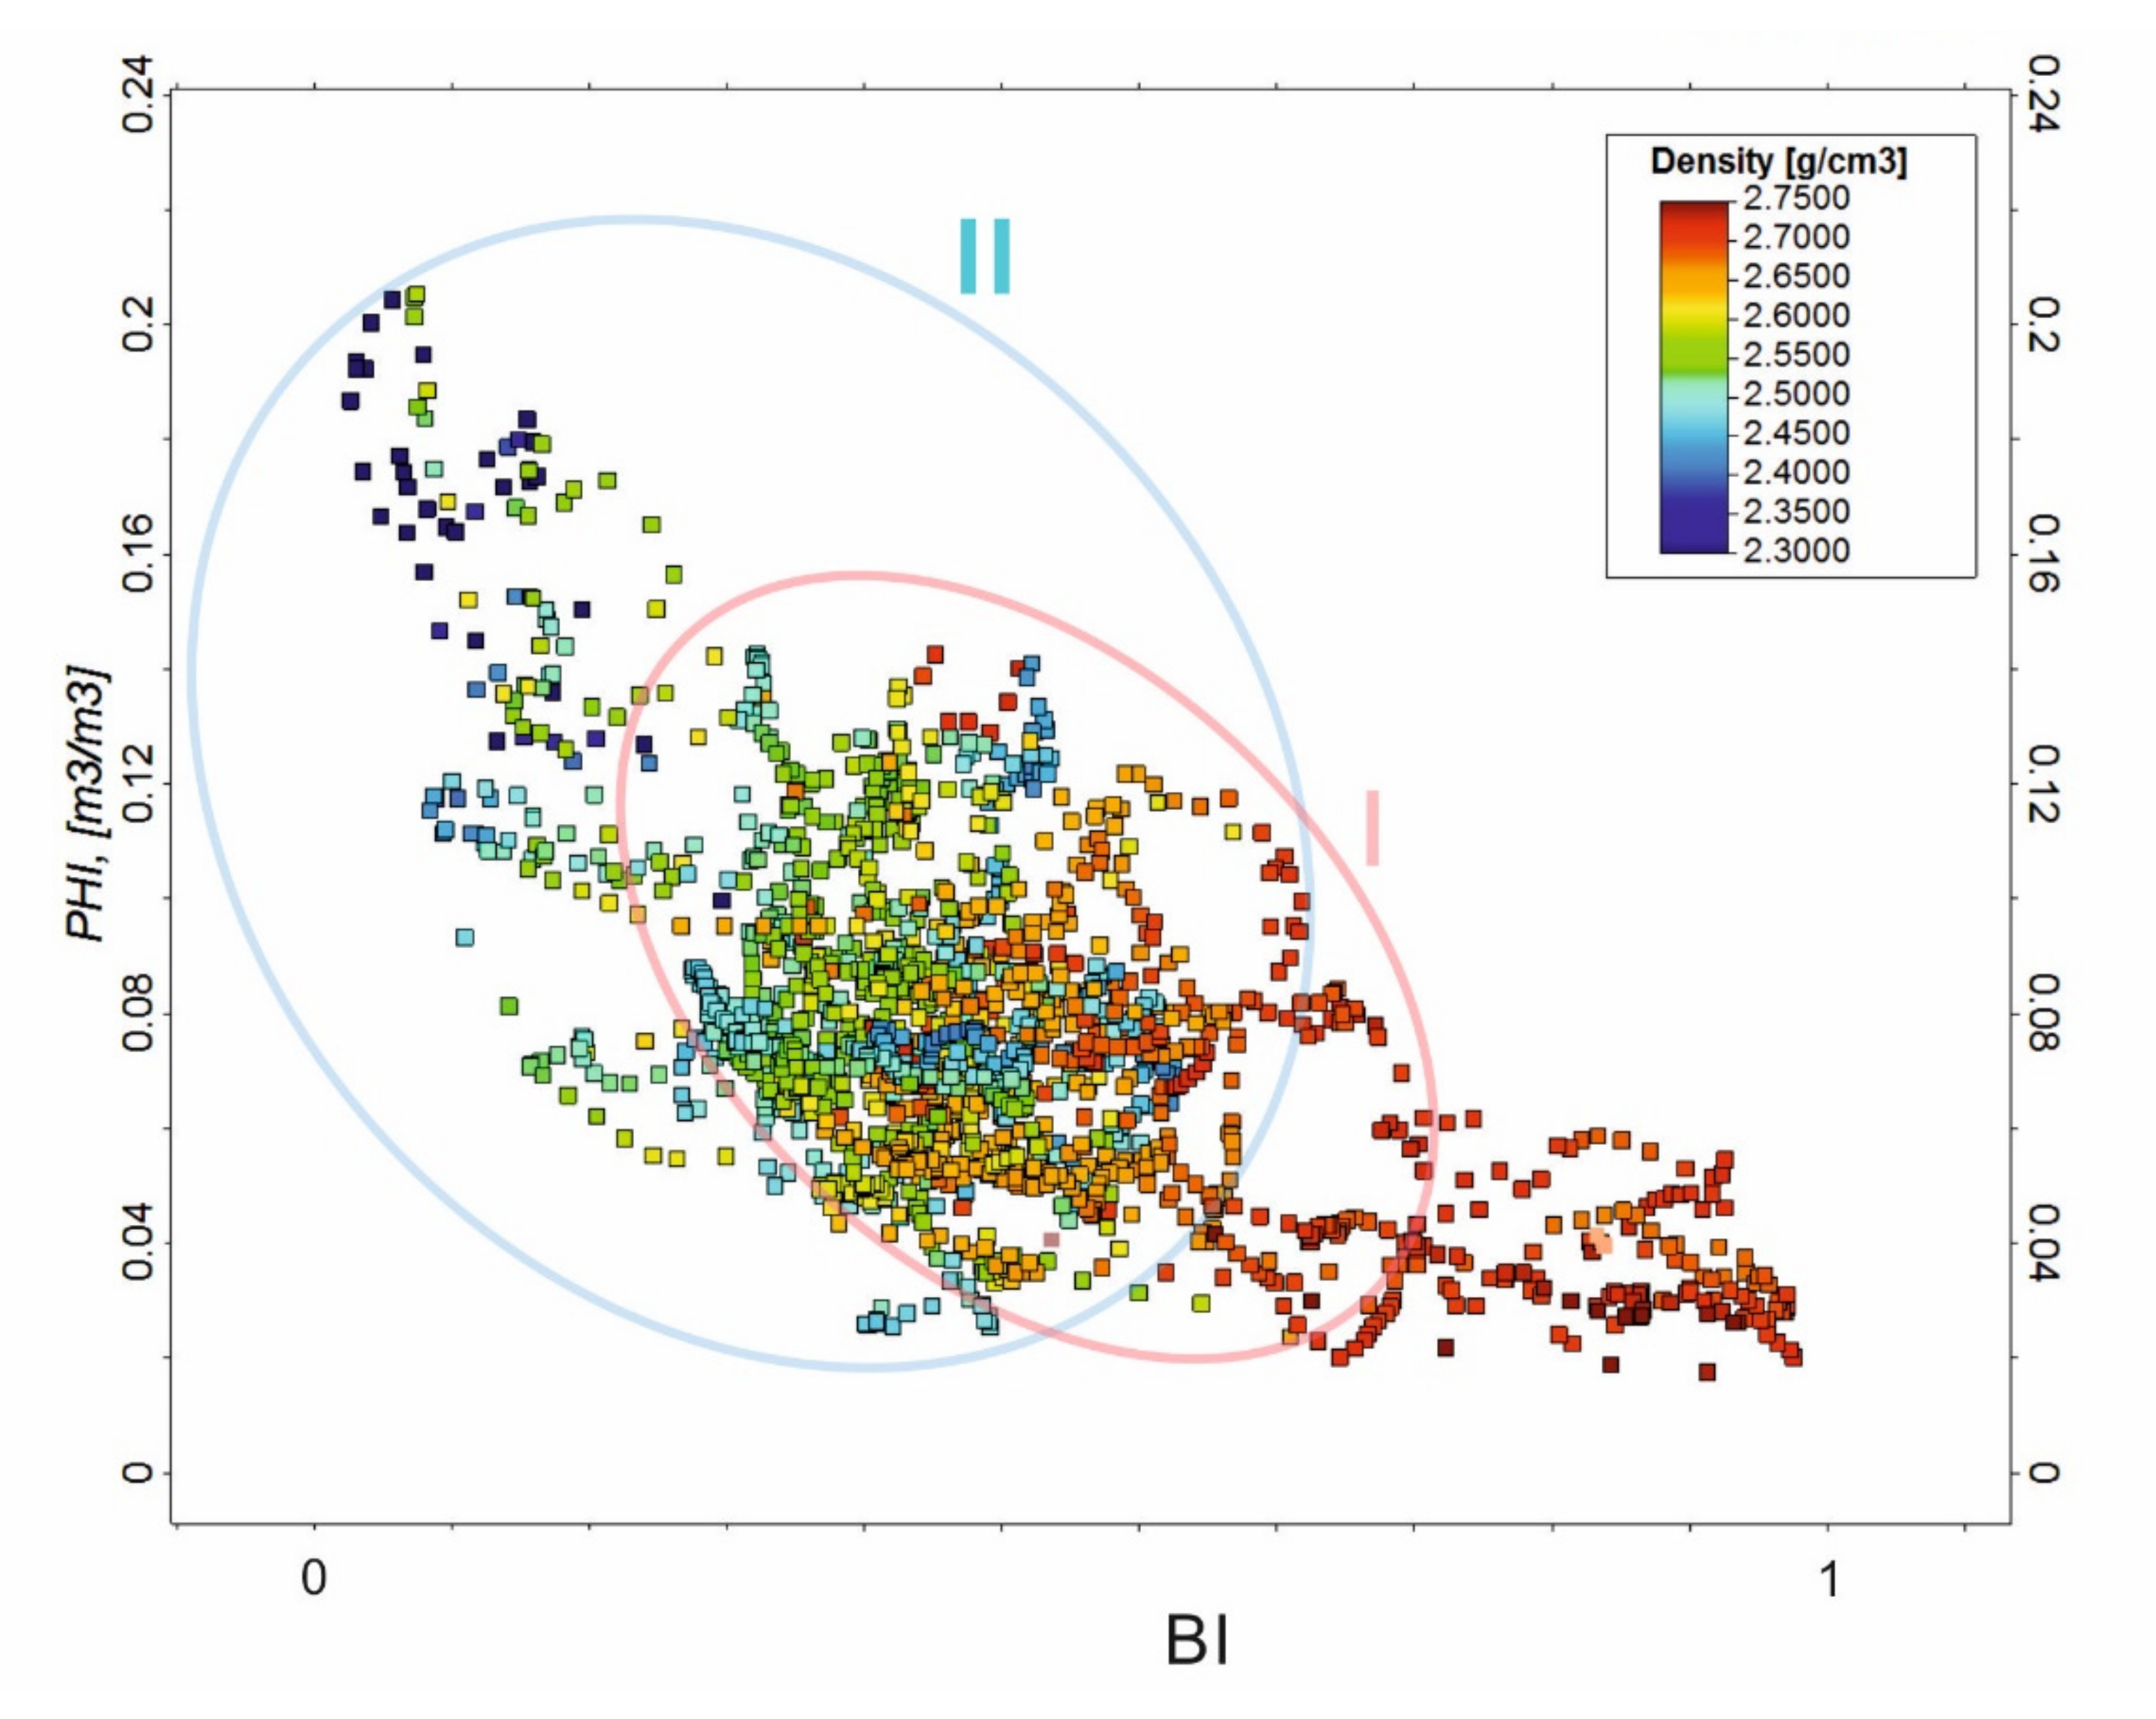
Figure 10 shows an inverse relationship between porosity and BI in both analyzed source zones, whereby BI increases as porosity decreases. Due to a negative correlation existing between porosity and density, the same relationship is observed when analyzing density and BI. Lithologies with the lowest porosity and highest density, located in the bottom right corner of the diagram, represent rocks that contain abundant high-density carbonate minerals and occur in the transition zone between source intervals I and II. Concomitantly, these are zones that have a low organic matter content.
Cross-correlation of values for Young’s modulus, porosity, and BI (Figure 11) reveals an inverse correlation between Young’s modulus and porosity, and a positive correlation between Young’s modulus and BI. We interpret this as showing that less porous rocks are more rigid and more susceptible to brittle failure, which is expressed by a higher BI. The above relationships are clear for both source zones: Source I had a smaller total porosity and BI range than Source II. Therefore, as Source II contained rocks with a broader range of porosity and brittleness values, and more extreme BI values, they were likely more susceptible to hydraulic fracturing.
When comparing both source rock formations, characterized with parameters as shown in Table 2, it can be observed that shales from Source II interval exhibit higher brittleness, both based on elastic parameters and mineralogical composition, with on average higher Young modulus and lower Poisson’s ratio. This can be explained with a more significant contribution of brittle minerals e.g., quartz and carbonates in Sasino mudstone formation (Source II). The average TOC is approximately 1 wt. % lower than in Jantar mudstone formation (Source I). These characteristics also support the suggestion that the investigated Source I is less fractured than Source II (Young’s modulus vs. Poisson’s ratio cross—plot).
The relations between parameters observed on cross plots can be applied in spatial models using tools available in modeling software (filters, cut-offs) for quick display of parameter values range. For example, using the relationships observed from the cross plot in Figure 10 and filtering the model blocks of the brittle spots model (shown in Figure 7), which normalized values are above 0.7, we can define a range of porosity values (less than 6%) and the density values (more than 2.7 g/cm3) assigned to this model blocks without the necessity of modeling the spatial distribution of these parameters (Figure 12).
4. Conclusions
Coherent, multiparametric reservoir characterization is a complex, multistage task where the main objectives need to be clearly defined, and complete analysis should be focused around these objectives to reach a consistent, multidimensional response.
The primary purpose of this paper was feature the methodology which needs to be carried out to characterize potential of hydraulic fracturing effectiveness the reservoir with the use of brittleness index. The BI is an important, multiparameter-based index that allows identification of rock strata with a high susceptibility to hydraulic fracturing, and thus is an extremely important factor required to characterize unconventional reservoir formations (e.g., shale formations or coalbed methane). The presence of organic matter plays an important role in shale formation and significantly reduces rock brittleness. In addition, a rock’s BI is strongly affected by its quartz, clay mineral, and carbonate mineral content. In this study, we demonstrated that both quartz and carbonate minerals have the greatest effect of all constituents. In our study area, the analyzed source zones showed differences in BI trends and values due to variation in the mineralogical composition of the shale rocks.
In the process of combining well data (BIelast and BImin within the borehole profiles) and seismic data (BI meta-attribute) we received satisfactory correlation coefficient that allowed us to procced 3D properties calculation. Spatial analysis of the BI calculated using different approaches showed analogous trends, highlighting the same locations with similar ranges of BI values that have similar susceptibilities to fracturing. Maps of average values of BI were produced by combining values of individual elastic and mineralogical variants and allowed for the selection of zones with high (>0.7) and low (<0.2) mean BI values. Rocks in Source I with the highest BI values were located in the southeast of the analyzed area. For Source II, the southeastern domain also contained high-BI lithologies, although other large areas of high-BI rocks were located in the northwest. Rocks with the lowest BI values in Source I were located close to the L-1, O-2, and O-3 boreholes, while those in Source II occurred in a belt trending from southwest to northeast and passing through the O-4 borehole. Despite the use of different input data, the general trend of BI values obtained using elasticity and mineral composition constraints were very similar, both in the vertical and horizontal directions. However, minor differences in brittleness observed in both source zones indicated that different approaches should be taken towards fracture stimulation treatment in both regions. The creation of 3D models of the most brittle spots in the study area could help to indicate areas that require further investigation—for example, via more detailed analytical tools such as cross plot analysis of significant parameters.
Therefore, based on the applied methodology, a wide range of consistent conclusions concerning the study area can be described. Using this approach, we are able to carry multidisciplinary characterization of the reservoir based on related parameters and features (lithology, petrophysical parameters, geomechanical parameters, BI, elastic parameters, etc.) providing coherent and reliable results and reducing the uncertainty of the obtained results. This directly benefits the economy, as it has been proved in the example of the Eagle Ford reservoir that production can be increased by 40% with 11% reduced completion costs with integrated, multidisciplinary approach of reservoir characterization and completion design [47].
Integrated analyses covering such a wide spectrum of issues related to the multi-parameter, interdisciplinary 1D interpretations, the application of rock physics, and the integration of borehole data with seismic data provide a novelty in the spatial characteristics of the organic matter rich shale formation of lower Paleozoic age and deposited in the Baltic Basin (northern Poland).
It is also noteworthy to mention that both well log and seismic data used in this study are dynamic and allow calculation of elastic parameters and different variants of BI for reservoir rocks; however, more detailed quantitative analysis requires determination of static equivalents of the calculated parameters.
Finally, the results of this study revealed important directions for future research. Currently, the impact of parameters that characterize rock fractures on Vp, Vs, and elastic parameters is unknown and should be quantified via continued empirical and experimental investigation. This will provide a better method to assess the importance of parameters used to describe fractures (e.g., fracture network geometry, geometry of individual cracks, their aperture and the type of fracture filling) and quantify which has the greatest impact on wave propagation and the medium that ultimately fills the fracture (i.e., mineralization with carbonate minerals, quartz, or reservoir fluids).
Author Contributions
Conceptualization, W.K. and M.S.-V.; Data curation, W.K.; Formal analysis, W.K.; Investigation, W.K. and M.S.-V.; Methodology, W.K. and M.S.-V.; Project administration, W.K. and M.S.-V.; Resources, W.K. and M.S.-V.; Software, W.K. and M.S.-V.; Supervision, W.K.; Validation, W.K. and M.S.-V.; Visualization, W.K. and M.S.-V.; Writing—original draft, W.K.; Writing—review and editing, W.K. and M.S.-V. All authors have read and agreed to the published version of the manuscript.
Funding
This research was funded by the Ministry of Science and Higher Education; order no.: 0038/SG/17, archive no.: DK-4100-/14/16.
Acknowledgments
The authors would like to thank the Polish Oil and Gas Company (PGNiG S.A.) for providing the data.
Conflicts of Interest
The authors declare no conflict of interest.
Abbreviations
| AI | acoustic impedance, |
| BI | brittleness index, |
| BIelast | BI based on elastic parameters, |
| BImin | BI based on mineral composition, |
| E | Young’s modulus, |
| E dyn | dynamic Young’s modulus, |
| Is | shear impedance, |
| PHI (φ) | total porosity, |
| PHIE | effective porosity, |
| RHOB (ρ) | bulk density, |
| T | tensile strength, |
| TOC | total organic carbon, |
| Vcal | volume of calcite, |
| Vclay | volume of clay, |
| Vdol | volume of dolomite, |
| Vp | compressional (P) wave velocity, |
| VQ | volume of quartz, |
| Vs | shear (S) wave velocity, |
| VTOC | volume of total organuic carbon, |
| λ | Lamé constant lambda, |
| λρ | lambda-rho rock physisc parameter, |
| μ | Lamé constant mu, |
| μ | shear modulus, |
| μρ | mu-rho rock physisc parameter, |
| ν | Poisson’s ratio, |
| ν dyn | dynamic Poisson’s ratio, |
| σh’ | horizontal effective stress, |
| σT | tensile stress, |
| σv’ | vertical effective stress |
References
- Simm, R.; Bacon, M. Seismic Amplitude. An Interpreter’s Handbook; Cambridge University Press: Cambridge, UK, 2014. [Google Scholar]
- Wawrzyniak-Guz, K. Rock physics modelling for determination of effective elastic properties of the lower Paleozoic shale formation, North Poland. Acta Geophys. 2019, 67, 1967–1989. [Google Scholar] [CrossRef] [Green Version]
- Bała, M. Characteristics of elastic parameters determined on the basis of well logging measurements and theoretical modeling, in selected formations in boreholes in the Baltic Basin and the Baltic offshore (in Polish with English summary). Naft. Gaz 2017, 8, 558–570. [Google Scholar] [CrossRef]
- Bała, M. Modelowanie własności sprężystych skał łupkowych z gazem z użyciem programu Estymacja. In Adaptacja do Warunków Polskich Metodologii Wyznaczania Sweet Spotów na Podstawie Korelacji Pomiarów Geofizycznych z Rdzeniami Wiertniczymi; Jarzyna, J., Wawrzyniak-Guz, K., Eds.; Kraków, Drukarnia Goldruk: Nowy Sacz, Poland, 2017; pp. 73–75. [Google Scholar]
- Podhalańska, T.; Feldman-Olszewska, A.; Roszkowska-Remin, J.; Janas, M.; Pachytel, R.; Głuszyński, A.; Roman, M. Propsective zones of unconventional hydrocarbon reservoirs in the Cambrian, Ordovician nd Silurian shale formations of the East European Craton marginal zone in Poland. Geol. Q. 2020, 64, 342–376. [Google Scholar] [CrossRef]
- Cichostępski, K.; Kwietniak, A.; Dec, J.; Kasperska, M.; Pietsch, K. Integrated geophysical data for sweet spot identification in Baltic basin, Poland. Ann. Soc. Geol. Pol. 2019, 89, 215–231. [Google Scholar] [CrossRef] [Green Version]
- Cyz, M.; Azevedo, L.; Malinowski, M. Application of geostatistical seismic AVA inversion for shale reservoir characterization and brittleness prediction with machine learning. In Proceedings of the 81st EAGE Conference and Exhibition 2019, London, UK, 3–6 June 2019. [Google Scholar] [CrossRef]
- Jędrzejowska-Tyczkowska, H.; Słota-Valim, M. Mechaniczny model Ziemi jako nowy i konieczny warunek sukcesu w poszukiwaniach i eksploatacji niekonwencjonalnych złóż węglowodorów. Naft. Gaz 2012, 68, 329–340. [Google Scholar]
- Sowidżał, K.; Słoczyński, T.; Stadtmuller, M. 3D petroleum systems modeling in selected areas of the Baltic Basin (Poland, Onshore and Offshore) for exploration of unconventional shale formations. In Proceedings of the AAPG Hydrocarbon Exploration in Lithuania and the Baltic Region 2016, Vilnius, Lithuania, 24–25 October 2016. [Google Scholar]
- Sowiżdżal, K.; Słoczyński, T.; Kaczmarczyk, W. Estimation of the oil-in-place resources in the liquid-rich shale formations exploiting geochemical and petrophysical data in a 3D high-resolution geological model domain: Baltic Basin case study. Geofluids 2020, 2, 1–14. [Google Scholar] [CrossRef]
- Avseth, P.; Mavko, G.; Dvorkin, J.; Mukerji, T. Rock physics and seismic properties of sands and shales as a function of burial depth. In SEG Technical Program Expanded Abstracts 2001; Society of Exploration Geophysics: Tulsa, OK, USA, 2001; pp. 1780–1783. [Google Scholar] [CrossRef]
- Mavko, G.; Mukerji, T.; Dvorkin, J. Tools for seismic analysis of porous media. In The Rock Physics Handbook, 2nd ed.; Cambridge University Press: New York, NY, USA, 2009. [Google Scholar]
- Sayers, C.; Bachrach, R. Rock physics integrating petrophysical, geomechanical and seismic measurements. In Proceedings of the 10th Biennial International Conference & Exposition, Le Meridien, Kochi, India, 23 November 2013. [Google Scholar]
- Poprawa, P.; Šliaupa, S.; Stephenson, R.; Lazauskiene, J. Late vendian—Early paleozoic tectonic evolution of the Baltic Basin: Regional tectonic implications from subsidence analysis. Tectonophysics 1999, 314, 219–239. [Google Scholar] [CrossRef]
- Karnkowski, P. Modeling of hydrocarbon generating conditions within Lower Palaeozoic strata in the western part of the Baltic Basin (in Polish with English Summary). Przegląd Geol. 2003, 51, 756–763. [Google Scholar]
- Poprawa, P. Shale gas hydrocarbon system-North American experience and European potential. Przegląd Geol. 2010, 58, 216–225. [Google Scholar]
- Modliński, Z.; Szymański, B.; Teller, L. Litostratygrafia syluru polskiej części obniżenia perybałtyckiego—Część lądowa i morska (N Polska). Prz. Geol. 2006, 54, 787–796. [Google Scholar]
- Modliński, Z.; Szymański, B. Litostratygrafia ordowiku w obniżeniu podlaskim i w podłożu niecki płocko-warszawskiej (wschodnia Polska). Biul. Państw. Inst. Geol. 2008, 430, 79–112. [Google Scholar]
- Such, P.; Cicha-Szot, R.; Dudek, L. Fluid flow through nanopore space: Discussion and proposition of a model for Polish shales. Naft. Gaz 2016, 72. [Google Scholar] [CrossRef]
- Guo, Z.; Chapman, M.; Li, X. Exploring the effect of fractures and microstructure on brittleness index in the Barnett Shale. In Proceedings of the SEG Annual Meeting 2012, Las Vegas, NV, USA, 4–9 November 2012. [Google Scholar]
- Cyz, M.; Mulińska, M.; Pachytel, R.; Malinowski, M. Brittleness prediction for the Lower Paleozoic shales in northern Poland. Interpretation 2018, 8, 1–11. [Google Scholar] [CrossRef]
- Jarvie, D.M.; Hill, R.J.; Ruble, T.E.; Pollastro, R.M. Unconventional shale-gas systems: The Mississippian Barnett Shale of North-Central Texas as one model for thermogenic shale-gas assessment. AAPG Bull. 2007, 91, 475–499. [Google Scholar] [CrossRef]
- Wang, F.P.; Gale, J.F.W. Screening criteria for shale-gas systems. Gulf Coast Assoc. Geol. Soc. Trans. 2009, 59, 779–793. [Google Scholar]
- Rickman, R.; Mullen, M.; Petre, E.; Grieser, B.; Kundert, D. A practical use of shale petrophysics for stimulation design optimization: All shale plays are not clones of the Barnett Shale. In Proceedings of the SPE Annual Technical Conference and Exhibition, ATCE 2008, Denver, CO, USA, 21–24 September 2008. [Google Scholar]
- Tran, M.H.; Chen, S.; Sierra, P.R.; Abousleiman, Y.N.; Slatt, R.M. A geomechanics approach to evaluate Gas Shale frackability: A case study with the Woodford Shale. In Proceedings of the AAPG Annual Convention and Exhibition 2012, Long Beach, CA, USA, 22–25 April 2012. [Google Scholar]
- Portas, R.M.; Slatt, R. Characterization and origin of fracture patterns in a Woodford Shale quarry in southeastern Oklahoma for application to exploration and development. In Proceedings of the AAPG Annual Convention and Exhibition 2010, New Orleans, LA, USA, 11–14 April 2010. [Google Scholar]
- Varacchi, B.; Jaiswal, P.; Puckette, J.; Dvorkin, J. Elastic Properties of Silica-Rich Mudrocks: Woodford Shale, Andarko Basin. In Proceedings of the SEG Annual Meeting 2012, Las Vegas, NV, USA, 4–9 November 2012. [Google Scholar]
- Herwanger, J.; Koutsabeloulis, N. Building reservoir geomechanical models. In Seismic Geomechanics: How to Build and Calibrate Geomechanical Models Using 3D and 4D Seismic Data; EAGE Publications: Houten, The Netherlands, 2011; pp. 17–37. [Google Scholar]
- Słota-Valim, M. Static and dynamic elastic properties, the cause of the difference and conversion methods—Case study. Naft. Gaz 2015, 71, 816–826. [Google Scholar] [CrossRef]
- Avseth, P.; Mukerji, T.; Mavko, G. Quantitative Seismic Interpretation: Applying Rock Physics Tools to Reduce Interpretation Risk; Cambridge University Press: New York, NY, USA, 2010. [Google Scholar]
- Vernik, L. Seismic petrophysics in quantitative interpretation. In Proceedings of the SEG Annual Meeting, Tulsa, OK, USA, 16–21 October 2016. [Google Scholar]
- Mur, A.; Vernik, L. Testing popular rock-physics models. Lead. Edge 2019, 38, 350–357. [Google Scholar] [CrossRef]
- Gegenhuber, N.; Pupos, J. Rock physics template from laboratory data for carbonates. J. Appl. Geophys. 2015, 114, 12–18. [Google Scholar] [CrossRef]
- Goodway, B. AVO and lamé constants for rock parametrization and fluid detection. Cseg Rec. 2001, 26, 1–19. [Google Scholar]
- Prasad, M.; Pal-Bathija, A.; Johnston, M.; Rydzy, M.; Batzle, M. Rock physics of the unconventional. Lead. Edge 2009, 28, 34–38. [Google Scholar] [CrossRef]
- Ødegaard, E.; Avseth, P. Well log and seismic data analysis using rock physics templates. First Break 2004, 22, 37–43. [Google Scholar] [CrossRef]
- Ba, J.; Cao, H.; Carcione, J.; Tang, G.; Yan, X.-F.; Sun, W.-T.; Nie, J.-X. Multiscale rock physics templates for gas detection in carbonate reservoir. J. Appl. Geophys. 2013, 93, 77–82. [Google Scholar] [CrossRef]
- Adeoti, L.; Allo, O.J.; Ayolabi, E.A.; Akinmosin, A.; Oladele, S.; Oyeniran, T.; Ayuk, M.A. Reservoir fluid determination from angle stacked seismic volumes in ‘Jay’ field, Niger Delta, Nigeria. J. Appl. Sci. Environ. Manag. 2018, 22, 453–458. [Google Scholar] [CrossRef] [Green Version]
- Hagayudha, T.; Awali, P.; Yulinar, F. Characteristic of shale gas reservoir using LMR (Lambda-Mu-Rho) inversion: Case study Barnett Shale, Fort Worth Basin Texas, USA. Bull. Mar. Geol. 2013, 28, 43–50. [Google Scholar] [CrossRef]
- Castagna, J.P.; Batzle, M.; Eastwood, R.L. Relationships between compressional-wave and shear-wave velocities in clastic silicate rocks. Geophysics 1985, 50, 571–581. [Google Scholar] [CrossRef]
- Bała, M. Effects of shale content, porosity and water- and gas-saturation in pores on elastic parameters of reservoir rocks based. Przegląd Geol. 2007, 55, 46–53. [Google Scholar]
- Bała, M.; Cichy, A.; Wasilewska-Błaszczyk, M. Attempts to calculate the pseudo-anisotropy of elastic parameters of shale gas formations based on well logging data and their geostatistical analysis. Geol. Geophys. Environ. 2019, 45, 5–20. [Google Scholar] [CrossRef] [Green Version]
- Kwietniak, A.; Cichostępski, K.; Pietsch, K. Resolution enhancement with relative amplitude preservation for unconventional targets. Interpretation 2018, 6, SH59–SH71. [Google Scholar] [CrossRef]
- Sowiżdżał, K. Geological 3D modeling of hydrocarbon reservoirs—Methodological aspects and case studies. Prace Naukowe INIG - PIB 2013, 101–111. [Google Scholar]
- Zhang, J.J.; Bentley, L.R. Factors determining Poisson’s ratio. Crewes Res. Rep. 2005, 17, 1–15. [Google Scholar]
- Bai, M. Why are brittleness and frackability not equivalent in designing hydraulic fracturing in tight shale gas reservoirs. Petroleum 2016, 59, 1–41. [Google Scholar] [CrossRef] [Green Version]
- Schlumberger, Kinetix Shale Stimulation-to-Production Software Increases Production by 40% in Eagle Ford Shale. Available online: https://www.slb.com/~/media/Files/stimulation/case_studies/kinetix-shale-eagle-ford-cs.pdf (accessed on 20 June 2020).
Figure 1.
Area of interest with 3D seismic survey marked with red line (A) with the behavior of compressional (P) and shear (S) waves (B) in the analyzed source intervals (reservoirs) within the Silurian (Source I) and Ordovician (Source II) shown on representative borehole O-4.
Figure 1.
Area of interest with 3D seismic survey marked with red line (A) with the behavior of compressional (P) and shear (S) waves (B) in the analyzed source intervals (reservoirs) within the Silurian (Source I) and Ordovician (Source II) shown on representative borehole O-4.


Figure 3.
Estimated variation of BI according to the following model parameters: (1) stratigraphy, (2) rock model, (3) total organic carbon (TOC) content (wt. %), (4) source intervals, (5) compressional wave velocity (Vp), (6) shear wave velocity (Vs), (7) calculated elastic parameters (Young’s modulus and Poisson’s ratio), and (8) calculated brittleness index (BI) variants (BIelast and BImin). Symbol * indicate zones (I–V) with the potentially high susceptibility for fracturing with the high TOC content at the same time.

Figure 4.
Meta-attribute of pseudo brittleness index shown on a seismic profiles in the background and grid property together with the calculated in the boreholes well logs of BI, as well as correlation between BI meta-attribute and (A)—BIelast and (B)—BImin.
Figure 4.
Meta-attribute of pseudo brittleness index shown on a seismic profiles in the background and grid property together with the calculated in the boreholes well logs of BI, as well as correlation between BI meta-attribute and (A)—BIelast and (B)—BImin.

Figure 5.
Maps of average values for BIelast (a) in Source I and (b) in Source II, and for BImin (c) in Source I and (d) in Source II. Red indicates the maximum value and purple indicates the minimum value.
Figure 5.
Maps of average values for BIelast (a) in Source I and (b) in Source II, and for BImin (c) in Source I and (d) in Source II. Red indicates the maximum value and purple indicates the minimum value.

Figure 6.
Map of average values of normalized BI of both variants within (a) Source I and (b) Source II. Maximum (>0.7) and minimum (<0.2) values of BI are marked with red and black polygons, respectively.
Figure 6.
Map of average values of normalized BI of both variants within (a) Source I and (b) Source II. Maximum (>0.7) and minimum (<0.2) values of BI are marked with red and black polygons, respectively.

Figure 7.
Spatial distribution of the most brittle spots within the analyzed area.

Figure 8.
Acoustic impedance (AI) vs. Vp/Vs ratio as a function of TOC content within Source I (red circle) and Source II (blue circle).
Figure 8.
Acoustic impedance (AI) vs. Vp/Vs ratio as a function of TOC content within Source I (red circle) and Source II (blue circle).

Figure 9.
Young’s modulus vs. Poisson’s ratio as a function of porosity within Source I (red circle) and Source II (blue circle).
Figure 9.
Young’s modulus vs. Poisson’s ratio as a function of porosity within Source I (red circle) and Source II (blue circle).

Figure 10.
BIelast vs. porosity (PHI; φ) as a function of density within Source I (red circle) and Source II (blue circle).
Figure 10.
BIelast vs. porosity (PHI; φ) as a function of density within Source I (red circle) and Source II (blue circle).

Figure 11.
Young’s modulus vs. porosity (PHI; φ) as a function of BI within Source I (red circle) and Source II (blue circle).
Figure 11.
Young’s modulus vs. porosity (PHI; φ) as a function of BI within Source I (red circle) and Source II (blue circle).

Figure 12.
An example of application of observation from cross plot presenting brittle spots characterized by porosity values below 6% and density above 2.7 g/cm3.
Figure 12.
An example of application of observation from cross plot presenting brittle spots characterized by porosity values below 6% and density above 2.7 g/cm3.


Table 1.
Mineralogical characterization of distinguished zones of interest within Source I and Source II shale formations.
Table 1.
Mineralogical characterization of distinguished zones of interest within Source I and Source II shale formations.
| Parameter | TOC [wt. %] | Quartz [vol %] | Carbonates [%] | Clay [%] | |
|---|---|---|---|---|---|
| Zone | |||||
| Zone I | 3.39 | 24.00 | 21.00 | 45.31 | |
| Zone II | 1.20 | 30.12 | 11.80 | 40.75 | |
| Zone III | 5.62 | 38.14 | 0.17 | 45.98 | |
| Zone IV | 3.19 | 53.00 | 2.50 | 30.14 | |
| Zone V | 2.16 | 25.00 | >30.00 | 21.57 | |
Table 2.
Average values of parameters analyzed in the study.
| Parameter | Vp [m/s] | Vs [m/s] | [g/cm3] | Φeff [%] | TOC [wt.%] | BIelas [–] | BImin [–] | Young Modulus [GPa] | Poisson Ratio [–] | |
|---|---|---|---|---|---|---|---|---|---|---|
| Source | ||||||||||
| Source I | 3626.53 | 2072.48 | 2.60 | 4.32 | 3.11 | 14.03 | 0.1006 | 28.21 | 0.26 | |
| Source II | 3798.56 | 2202.54 | 2.58 | 3.40 | 2.13 | 15.11 | 0.1869 | 31.62 | 0.24 | |
© 2020 by the authors. Licensee MDPI, Basel, Switzerland. This article is an open access article distributed under the terms and conditions of the Creative Commons Attribution (CC BY) license (http://creativecommons.org/licenses/by/4.0/).
Share and Cite
MDPI and ACS Style
Kaczmarczyk, W.; Słota-Valim, M. Multidisciplinary Characterization of Unconventional Reservoirs Based on Correlation of Well and Seismic Data. Energies 2020, 13, 4413. https://0-doi-org.brum.beds.ac.uk/10.3390/en13174413
AMA Style
Kaczmarczyk W, Słota-Valim M. Multidisciplinary Characterization of Unconventional Reservoirs Based on Correlation of Well and Seismic Data. Energies. 2020; 13(17):4413. https://0-doi-org.brum.beds.ac.uk/10.3390/en13174413
Chicago/Turabian StyleKaczmarczyk, Weronika, and Małgorzata Słota-Valim. 2020. "Multidisciplinary Characterization of Unconventional Reservoirs Based on Correlation of Well and Seismic Data" Energies 13, no. 17: 4413. https://0-doi-org.brum.beds.ac.uk/10.3390/en13174413
Note that from the first issue of 2016, this journal uses article numbers instead of page numbers. See further details here.