Dynamic Characteristics of Crude Oil Price Fluctuation—From the Perspective of Crude Oil Price Influence Mechanism


1
School of Economics, Hunan Agricultural University, Changsha 410128, China
2
Guangzhou International Institute of Finance and Guangzhou University, Guangzhou 510006, China
3
Economics and Finance Subject Group, Portsmouth Business School, University of Portsmouth, Portsmouth PO1 3AH, UK
*
Author to whom correspondence should be addressed.
Energies 2020, 13(17), 4465; https://0-doi-org.brum.beds.ac.uk/10.3390/en13174465
Submission received: 14 July 2020
/
Revised: 26 August 2020
/
Accepted: 27 August 2020
/
Published: 29 August 2020
(This article belongs to the Special Issue Global Market for Crude Oil)
Abstract
:The uncertainty in the evolution of crude oil price fluctuation has a significant impact on economic stability. Based on the decomposition of crude oil price fluctuation by the state-space model, this paper studies the fluctuation trend of crude oil prices and its causes. The nonlinearity autoregressive distribute lag approach (NARDL) model is used to capture the influence mechanism characteristics of crude oil prices at different positions and different fluctuation trends. An event study model with dummy variables is constructed to compare the effects of different types of events on crude oil price fluctuations. The empirical results indicate that the fluctuation of crude oil prices tends to strengthen on the whole, and there is a remarkable correlation between this trend and the influencing mechanism of crude oil price, namely, the fluctuation source structure. The influence mechanism of crude oil price fluctuation is asymmetric when the crude oil price is at different positions and under different trends. There is a strong correlation between event shocks and event types in the evolution of crude oil price fluctuation.
1. Introduction
Crude oil is not only the most traded commodity in the world, but also the most important energy resource in economic activities. The long-term trend of oil prices is determined by supply and demand, which is accompanied by frequent oil-related events [1,2,3,4] and increasing speculation in crude oil financialized products [5,6]. At the same time, fluctuations in oil prices have been amplified, and instability in the oil market has increased. Since 2004, the frequency and amplitude of international oil price fluctuations have increased [7,8]. The uncertainty caused by oil price fluctuations will affect economic development through increasing production costs or investment behavior [9], causing a negative impact on economic activities [10,11,12].
There are various factors affecting the fluctuation of crude oil prices. According to previous studies, the long-term trend of oil prices is ultimately determined by oil supply and demand, while the short-term fluctuation of crude oil is influenced by economic and financial factors such as business cycle and financial market speculation, which increase the instability of oil markets [13,14]. On the one hand, the fluctuation of crude oil prices is affected by the relationship between supply and demand. In terms of margin, the stability of the oil market depends largely on the supply of oil-producing countries [15,16,17], especially the Organization of the Petroleum Exporting Countries and its allies’ (OPEC+) decision to increase and reduce production in recent times [15,18,19]. The use of OPEC+ oil supply led by Saudi Arabia and Russia, and the temporary use of OPEC spare capacity, are possible sources for bridging the expected global supply gap [18]. However, the results of empirical studies on whether crude oil price fluctuations were significantly triggered during the OPEC meeting are still unclear, and a large and growing body of empirical literature focuses more on the significant impact of the demand side on oil price fluctuations [20,21]. Meanwhile, demand from emerging economies is more than twice as important as that in developed countries in causing fluctuations in real oil prices and oil production. On the other hand, speculation and financialization in the oil market have promoted oil price fluctuations. The fluctuations of real business cycle or price level will affect the speculation in the oil market, thus causing the rise or fall of oil prices [22,23]. With the enhancement of crude oil financialization, the fluctuation of crude oil prices is increasingly impacted by the fluctuation of the financial market, such as the exchange rate of the US dollar, the stock market, gold, and the oil futures market [24,25,26,27,28,29]. In addition, the price of crude oil has experienced several sharp fluctuations over the past few decades due to the impact of a number of contingencies, including war and political instability, economic and financial slowdown, terrorist attacks, and natural disasters [30,31,32], which further amplify the fluctuation of oil prices. In a word, the fluctuation of crude oil prices is affected by different factors and presents more complex dynamic characteristics.
This paper holds that the fluctuation of crude oil prices bears two remarkable characteristics. First, the increasing trend of crude oil price fluctuation is related to the dynamic change of the crude oil price formation mechanism. Crude oil is traded in the commodity market as an energy fuel, and the long-term trend in crude oil prices is determined by supply and demand. For example, the rise in crude oil prices in 2006–2007 can be partly explained by the aggregate demand shocks triggered by strong growth in China and developing countries during this period [33,34]. After the 2008 financial crisis, the oil market price formation mechanism was disrupted by external macro uncertainties. Juvenal and Petrella [35] attributed the peak crude oil price in 2008 partly to the precautionary demand shock caused by excess liquidity in the financial market after the subprime mortgage crisis. With the increase in the number of financial transactions that generate income through changes in crude oil prices, the degree of financialization of the crude oil market also increases. As a kind of financial asset, crude oil plays an indispensable role in influencing the fluctuation of oil prices [36]. From the perspective of the price formation mechanism, the financial market promotes the fluctuation of crude oil prices through crude oil futures [37,38], speculation [39,40,41], and investor behavior [42,43,44,45].
Second, crude oil price fluctuation shows complex variation characteristics in the evolution process, such as at different price positions, fluctuation trends or event types, over which the fluctuation degree and its influencing factors are different. The price of crude oil has changed significantly over the past decade. Most striking among them is the sharp drop in oil price in 2008 and the resumption of the rally after the financial crisis. Since the middle of 2014, oil prices have shown significant changes due to the oversupply of energy commodities and the decline in global demand [46]. After the 2008 financial crisis, the most important stock index in the United States triggered a new round of an upward trend in the price of crude oil [17]. This process was not interrupted until the middle of 2015, when stock indexes became more volatile, and crude oil prices responded with a sharp drop. In addition, many literature studies have shown that the sharp fluctuation of oil prices is related to oil-related external events, which increase the short-term price fluctuation of crude oil by affecting the balance of oil supply and demand [3,47,48,49]. It can be seen that the differential characteristics of the factors that cause the fluctuation of crude oil prices make the evolution process more complicated and uncertain.
The main contributions of this paper are as follows. Firstly, the dynamic characteristics of crude oil price fluctuation are studied, whose formation reasons are identified from the perspective of fluctuation source structure. In this paper, the state-space model is used to decompose the information of crude oil price fluctuation and identify two core fluctuation sources: commodity factors and financial factors. Based on the dynamic investigation of the source information structure of crude oil price fluctuation, it is found that there is a significant correlation between the increasing trend of crude oil price fluctuation and the structure of fluctuation sources. The second is to examine the asymmetry of crude oil price and its fluctuation under different positions and trends. In this paper, the nonlinearity autoregressive distribute lag approach (NARDL) model is used to capture the influence mechanism characteristics of crude oil prices at different positions and different fluctuation trends, and it is found that the fluctuation source structures of different positions and different volatility trends are asymmetric. The third is to study the difference of the impact of different types of events on the trend of crude oil price fluctuations. Using the event shock model with dummy variables, it is found that during the evolution of crude oil price fluctuation, the impact of event shocks on crude oil price fluctuation is strongly correlated with the event type.
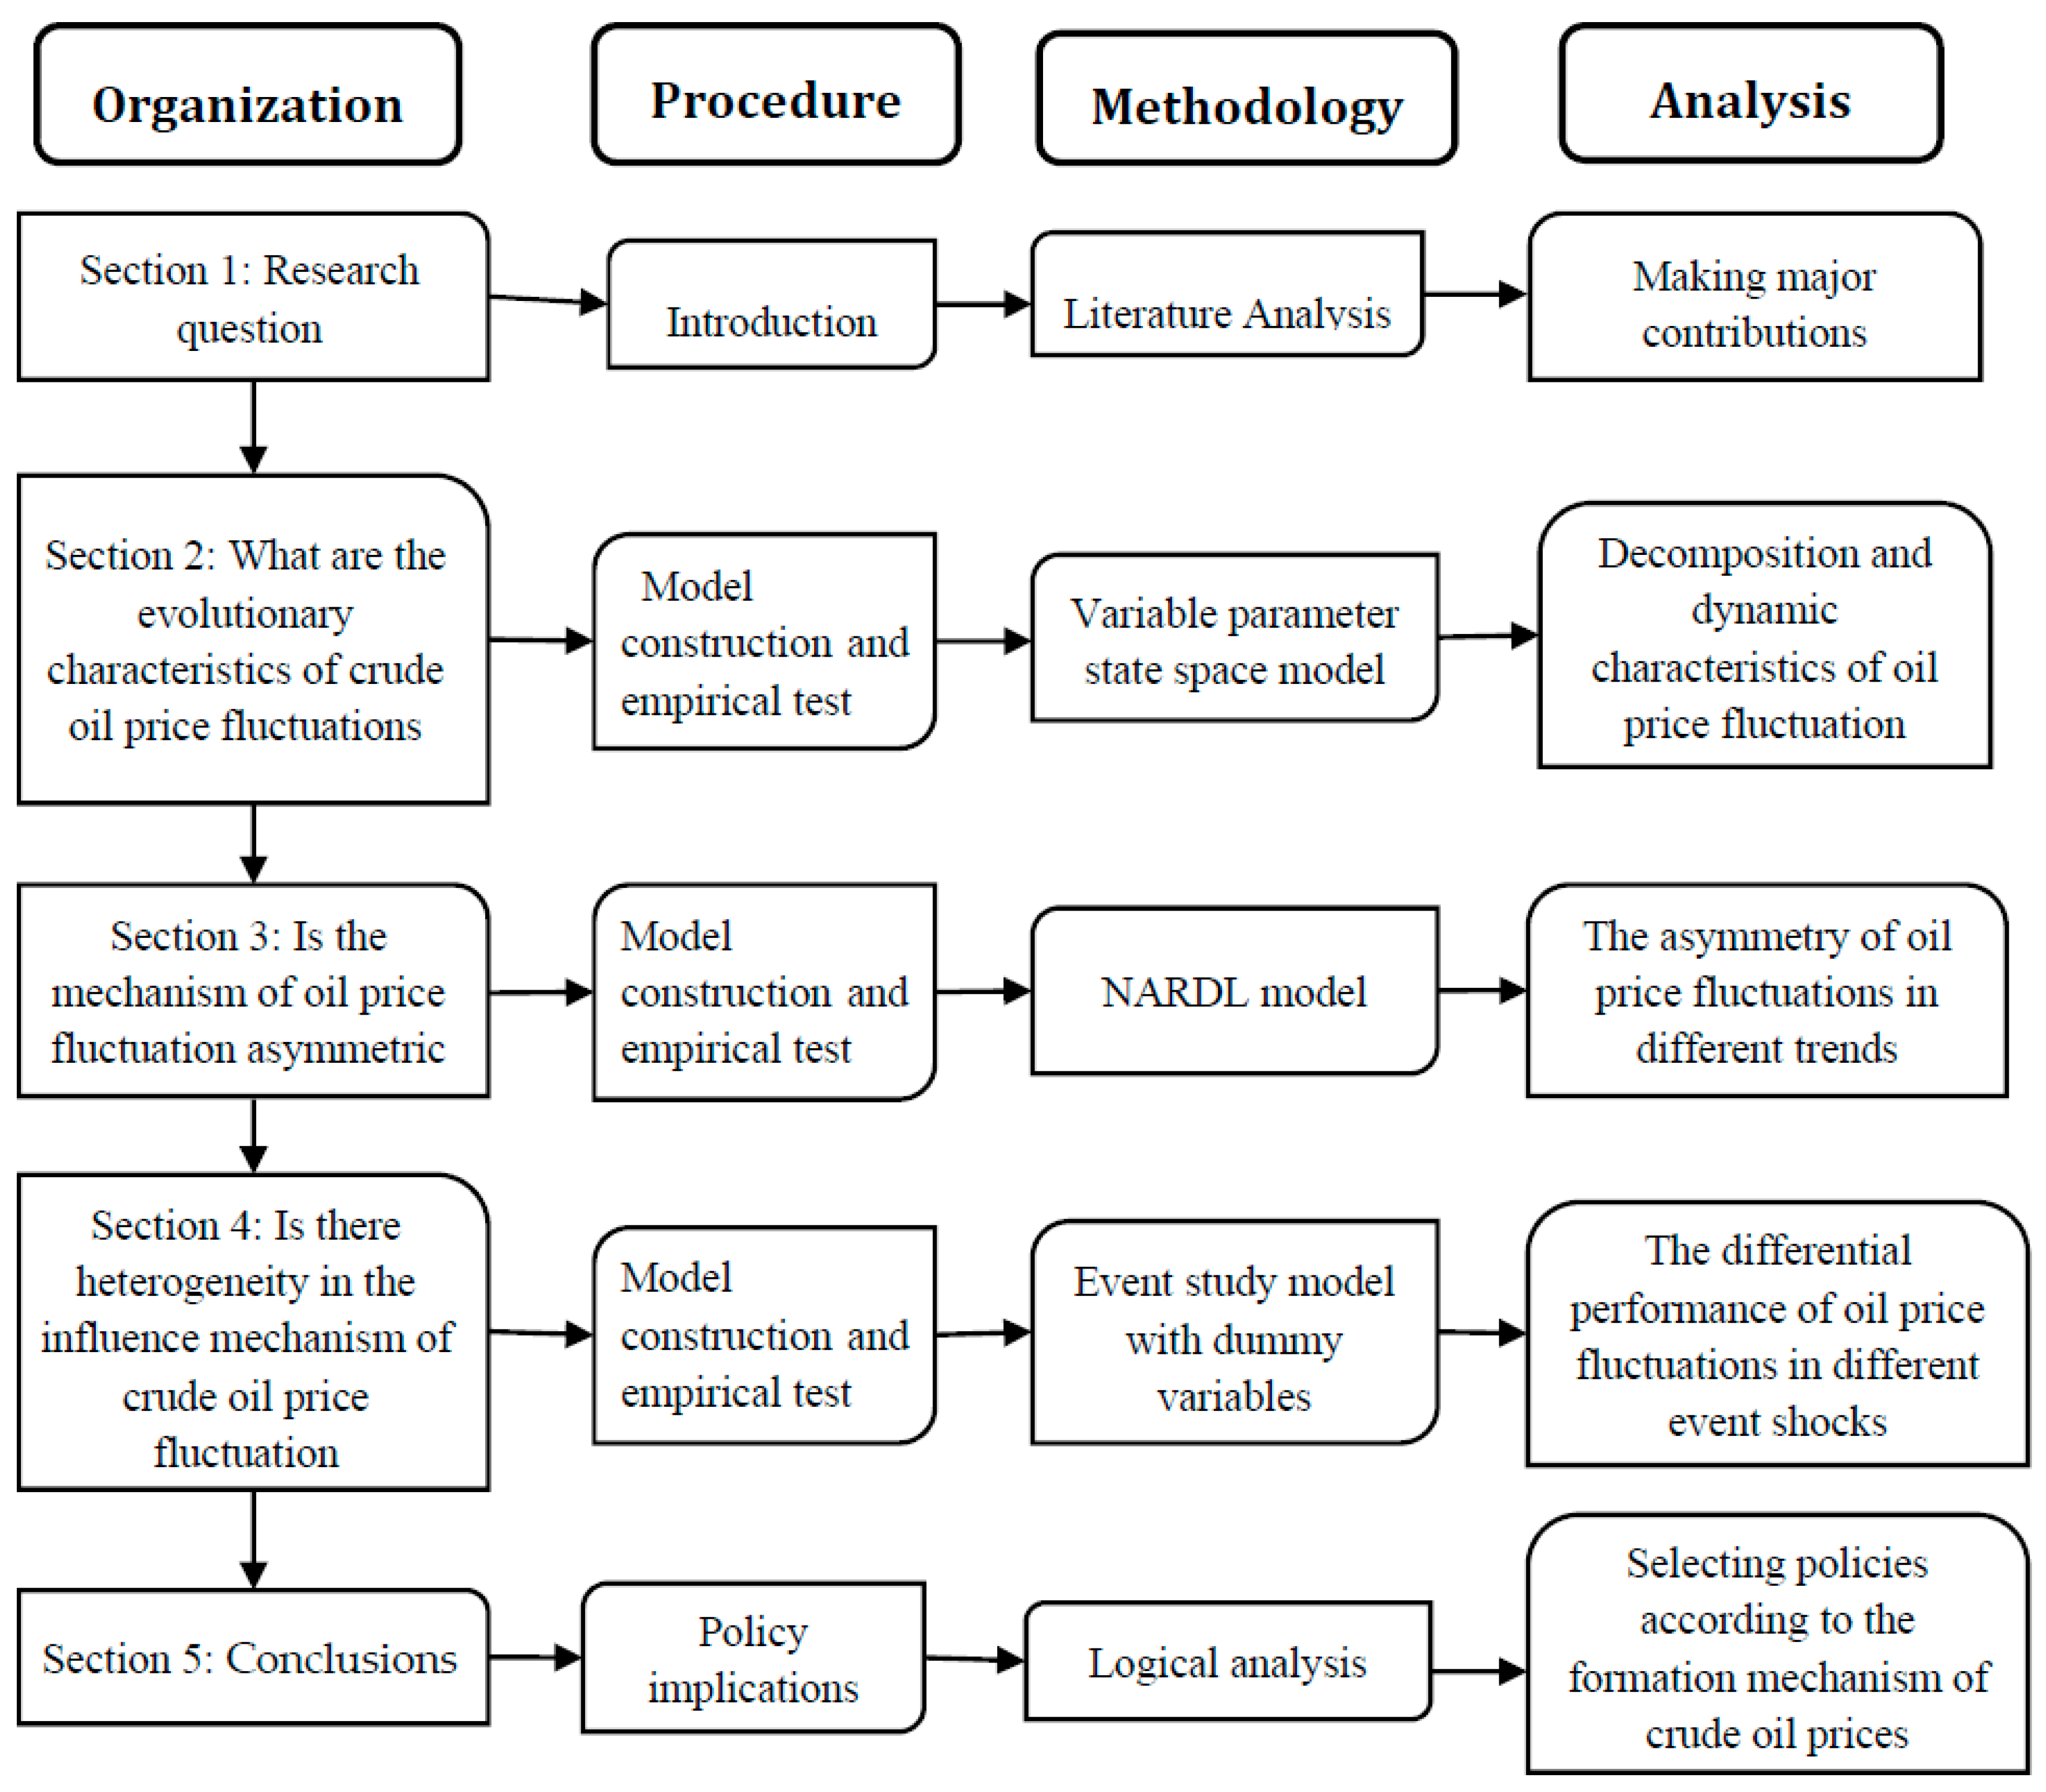
The structure of this paper is shown in Figure 1. Section 2 uses the state-space model to identify the source structure of crude oil price fluctuation and decompose the commodity attribute and financial attribute of crude oil price fluctuation, so as to investigate the dynamic evolution characteristics of crude oil price fluctuation. In Section 3, NARDL is employed to capture the influence mechanism of the fluctuation source in the trend of crude oil price rising and falling, examining the asymmetry of the dynamic evolution of oil prices under different price and fluctuation directions. The fourth part uses the event shock model with dummy variables to measure the impact of different types of events (financial risks, geopolitical changes, COVID-19 public health events) on the fluctuation trend of crude oil prices, comparing and analyzing the differential impact of different types of events on crude oil price fluctuation. The last section draws the conclusions of this paper.
2. Identification of Crude Oil Price Fluctuation Factors and the Evolution of Their Dynamic Characteristics
2.1. Identification Model of Crude Oil Price Fluctuation Factors
With the continuous development of the crude oil commodity market and its derivatives market, the formation mechanism of crude oil price has also undergone profound changes. Therefore, the fluctuation of crude oil prices is no longer caused by the simple change of supply and demand structure, but it is the result of the influence of various factors, which can be roughly summarized as the commodity attribute of crude oil and the financial attribute of crude oil, which have become the core source of modern crude oil price fluctuation. The commodity attribute of crude oil includes factors that cause fluctuations in oil prices mainly due to changes in crude oil supply and demand, as well as those that lead to changes in the crude oil supply and demand structure, such as OPEC’s oil production decisions, oil demand in emerging markets, the development of shale oil in the United States, and energy policy formulation to control global carbon emissions [20,50,51,52]. Meanwhile, the financial attribute of crude oil is reflected in the fluctuation of oil price caused by the fluctuation of the oil-related financial market, such as the crude oil futures market, stock market, exchange rate market, and other derivatives markets [53,54]. In addition, there are some other factors that cause oil price fluctuations through the two channels of crude commodity attributes and financial attributes, such as geopolitical risks [55], major emergencies [49], policy uncertainty [56], and so on.
Due to the influence mechanism of fluctuation sources, the oil price fluctuation presents a dynamic evolution process, which intensifies the volatility of the crude oil market with the strengthening of crude oil financialization [57]. For example, due to the commodity boom around 2004, the international oil price continued to rise until 2008. Then, the financial crisis broke out and crude oil price fluctuated violently, falling below $33 in the next few months, down 70% from the peak. In 2011, the war in Libya led to a collapse in oil production of about 90% and a cumulative 20% rise in the price of Brent crude oil price. The U.S. shale oil production in 2014 led to a nearly 50% drop in Brent crude oil price, making it the biggest Black Swan event in international capital markets. Since 2018, geopolitics and OPEC production cuts have helped push global oil prices up to 71%. The impact of the pandemic in 2020 caused a drop in global demand for crude oil, which contributed to the plunge in oil prices in March. It can be seen that the determinants that affect oil price change with time [58], and the static identification model of crude oil price fluctuation factors is difficult to meet the demand of dynamic changes of the influencing factors.
In order to effectively identify the time-varying process of the impact on crude oil price fluctuation, we refer to the research of Safari and Davallou [59] and construct a state-space model based on the decomposition of crude oil price fluctuation. The state-space model is an effective modeling tool for estimating unobservable time variables and can effectively identify the unobservable sources of fluctuation (influence factors) in crude oil prices. This paper assumes that the price of crude oil has the crude oil commodity component, the crude oil financial component, and the component of uncertainty, which are independent of each other; that is, the price of crude oil is decomposable. In addition, the unobservable crude oil price fluctuation source is constrained as the state equation. On the one hand, the commodity (financial) attribute of crude oil has its own smooth effect, which is expressed by the first-order lag term; on the other hand, the commodity (financial) attribute of crude oil is affected by commodity market factors and financial market factors, thus distinguishing different sources of crude oil price fluctuations. Finally, the basic form of the crude oil price fluctuation factor identification model based on the state-space model is designed as follows:
The measurement equation of crude oil price fluctuations is:
The state equation of the commodity attribute of crude oil is:
The state equation of the financial attribute of crude oil is:
where represents observable crude oil price fluctuations, . represents unobservable crude oil price fluctuations with the commodity attribute. represents unobservable crude oil price fluctuations with the financial attribute. are variables that affect the commodity attribute of crude oil, while are variables that affect the financial attribute of crude oil. That , and are independent of each other is assumed. This paper uses the maximum likelihood estimation method [60] and the Kalman Filter [61] to estimate Equations (1)–(3), and unobservable variables of the commodity attribute and the financial attribute of crude oil can be extracted.
2.2. Parameter Estimation of the Model for Influencing Factors of Crude Oil Price Fluctuation
2.2.1. Variables and Data
In this paper, we adopt the weekly data from January 2, 2004 to April 10, 2020, mainly under the following consideration: first, before 2004, the crude oil market WTI oil price fluctuated within the range of $11–39.88 a barrel, and the fluctuation range is relatively small, with the maximum drop of $6.2 a barrel, showing no significant dynamic characteristics of crude oil price fluctuation. Second, crude oil before 2004 is mainly reflected in its commodity attribute. Since the development of the oil-related financial market is not rich enough, financial factors have a weak influence on the fluctuation of oil price, so it is difficult to capture the fluctuation source of the financial attribute of crude oil prices.
Since the commodity attribute of crude oil is mainly determined by supply and demand in the spot market, the difference between supply and demand can be expressed by the inventory [33]. When the inventory of crude oil is sufficient, the supply in the crude oil spot market is higher than the demand, and the oil price will fall; when the inventory of crude oil is insufficient, the demand in the spot market is higher than the supply, and the oil price will rise. Therefore, we choose the US ending stocks of crude oil to reflect the commodity attribute of crude oil, and the data can be extracted from the U.S. Energy Information Administration (EIA) official website https://www.eia.gov/.
Besides, there is a strong correlation between crude oil markets and stock markets [62,63]. The higher the correlation between crude oil markets and financial markets, the higher the level of financialization of the crude oil markets. Therefore, we choose the SP 500 stock market index to reflect the financial attribute of crude oil. The data can be obtained from Yahoo’s official website.
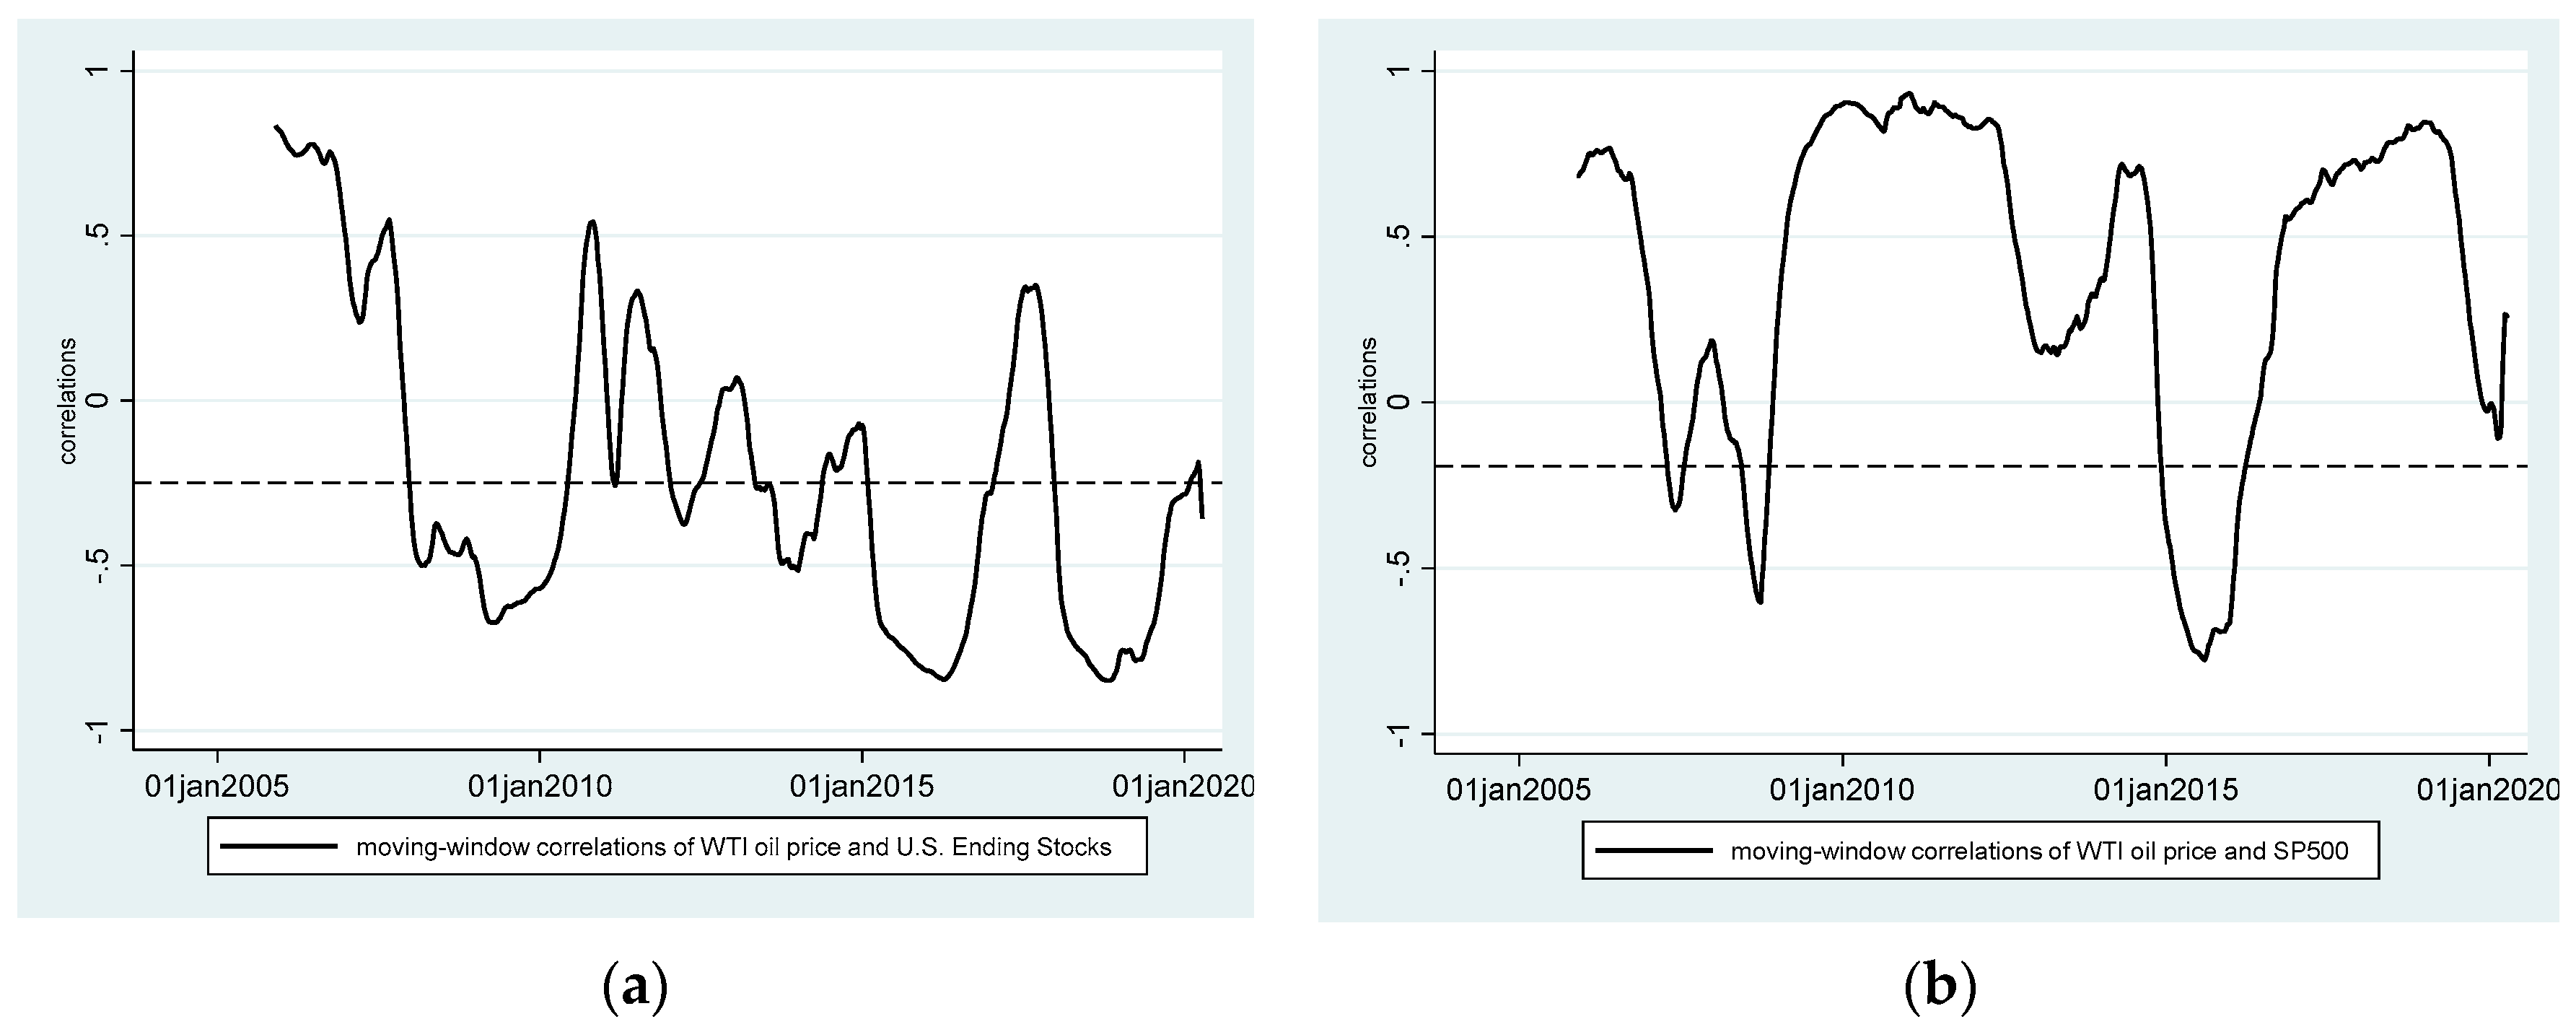
Table 1 provides the descriptive statistics of West Texas Intermediate (WTI) crude oil price, U.S. crude oil terminal inventory, and SP 500 stock market index, as well as the descriptive statistics of variables in different sample intervals. It can be seen that the average price of crude oil in the sample period is $69.66/barrel, and the fluctuation range is between $19.44 and $142.52/barrel, showing a drastic fluctuation of oil price. Meanwhile, the fluctuation of crude oil prices is also distinct in different sample intervals. In the price trend, it shows dynamic evolution characteristics of first rising and then falling; although the standard deviation of oil price fluctuation is decreasing and the fluctuation range is gradually narrowing, the fluctuation trend of crude oil price is increasing. In addition, crude oil inventory and stock price volatility also show diverse characteristics in different sample intervals. In order to better describe the dynamic relationship between WTI crude oil price, inventory, and stock price, we refer to the method of Jacobs and Karagozoglu [64] to calculate the dynamic correlation coefficient between variables, as shown in Figure 2.
It can be seen from Figure 2 that the relationships among the WTI crude oil price, inventory, and stock price are evolving over time, which also indicates that the impacts based on the crude oil commodity attribute and financial attribute on oil price fluctuation are also dynamically changing, as shown in Figure 2a. The US crude oil inventory is a fluctuation source of oil price with commodity attributes, which has a negative relationship with crude oil price most of the time. Before 2008, it showed a large positive relationship, indicating that the fluctuation source of commodity attributes is also an important driving force for oil prices to rise sharply. However, it is more often manifested in the decline of oil price caused by the increase of inventory, such as the situation in 2009 and around 2015. As the fluctuation source of oil price with financial attributes, the stock market has a significant positive relationship with oil price fluctuation most of the time, as shown in Figure 2b. In the period before and after the financial crisis in 2008 and the overall decline of the stock market in 2015, financial factors have become the main cause of oil price fluctuations. However, the static correlation coefficient between crude oil price and SP500 is negative. Obviously, it is insufficient to evaluate the effectiveness of crude oil price fluctuation by using a static model with fixed parameters. It is necessary to use a state-space model based on a time-varying structure framework to decompose oil price fluctuation.
2.2.2. Parameter Estimation Results
Based on the weekly data of WTI crude oil prices, U.S. crude oil inventories, and the SP 500 stock market index from January 2004 to April 2020, we take the first-order difference of the natural logarithm of these three variables to remove the common trend effects of the original data, thus obtaining the stationary data which can be used to estimate the state-space model. Then, the maximum likelihood method and the Kalman filter are adopted for parameter estimation. The estimation results of the state equation are reported in Table 2.
It can be seen from Table 2 that the influence mechanism of crude oil price fluctuation source on oil price is different. The fluctuation of the commodity attribute of crude oil is negatively correlated with the inventory fluctuation, while the fluctuation of the financial attribute of crude oil is positively correlated with the stock price volatility. In order words, the trend of crude oil price is inverse to the trend of crude oil inventory, but it is in the same direction as the stock price movement, which is consistent with the information from Figure 2. In addition, the financial attribute of crude oil relies more on its own smoothing process than the commodity attribute of crude oil, which helps investors use crude oil as an investment target to make portfolio investments with other assets. Overall, there are specific characteristics in crude oil to promote the financialization of crude oil markets, while the fluctuation of the commodity attribute of crude oil is mainly determined by supply and demand. Therefore, crude oil price is formatted by the interaction of the commodity attribute and the financial attribute of crude oil.
2.3. Dynamic Characteristics of Crude Oil Price Fluctuation
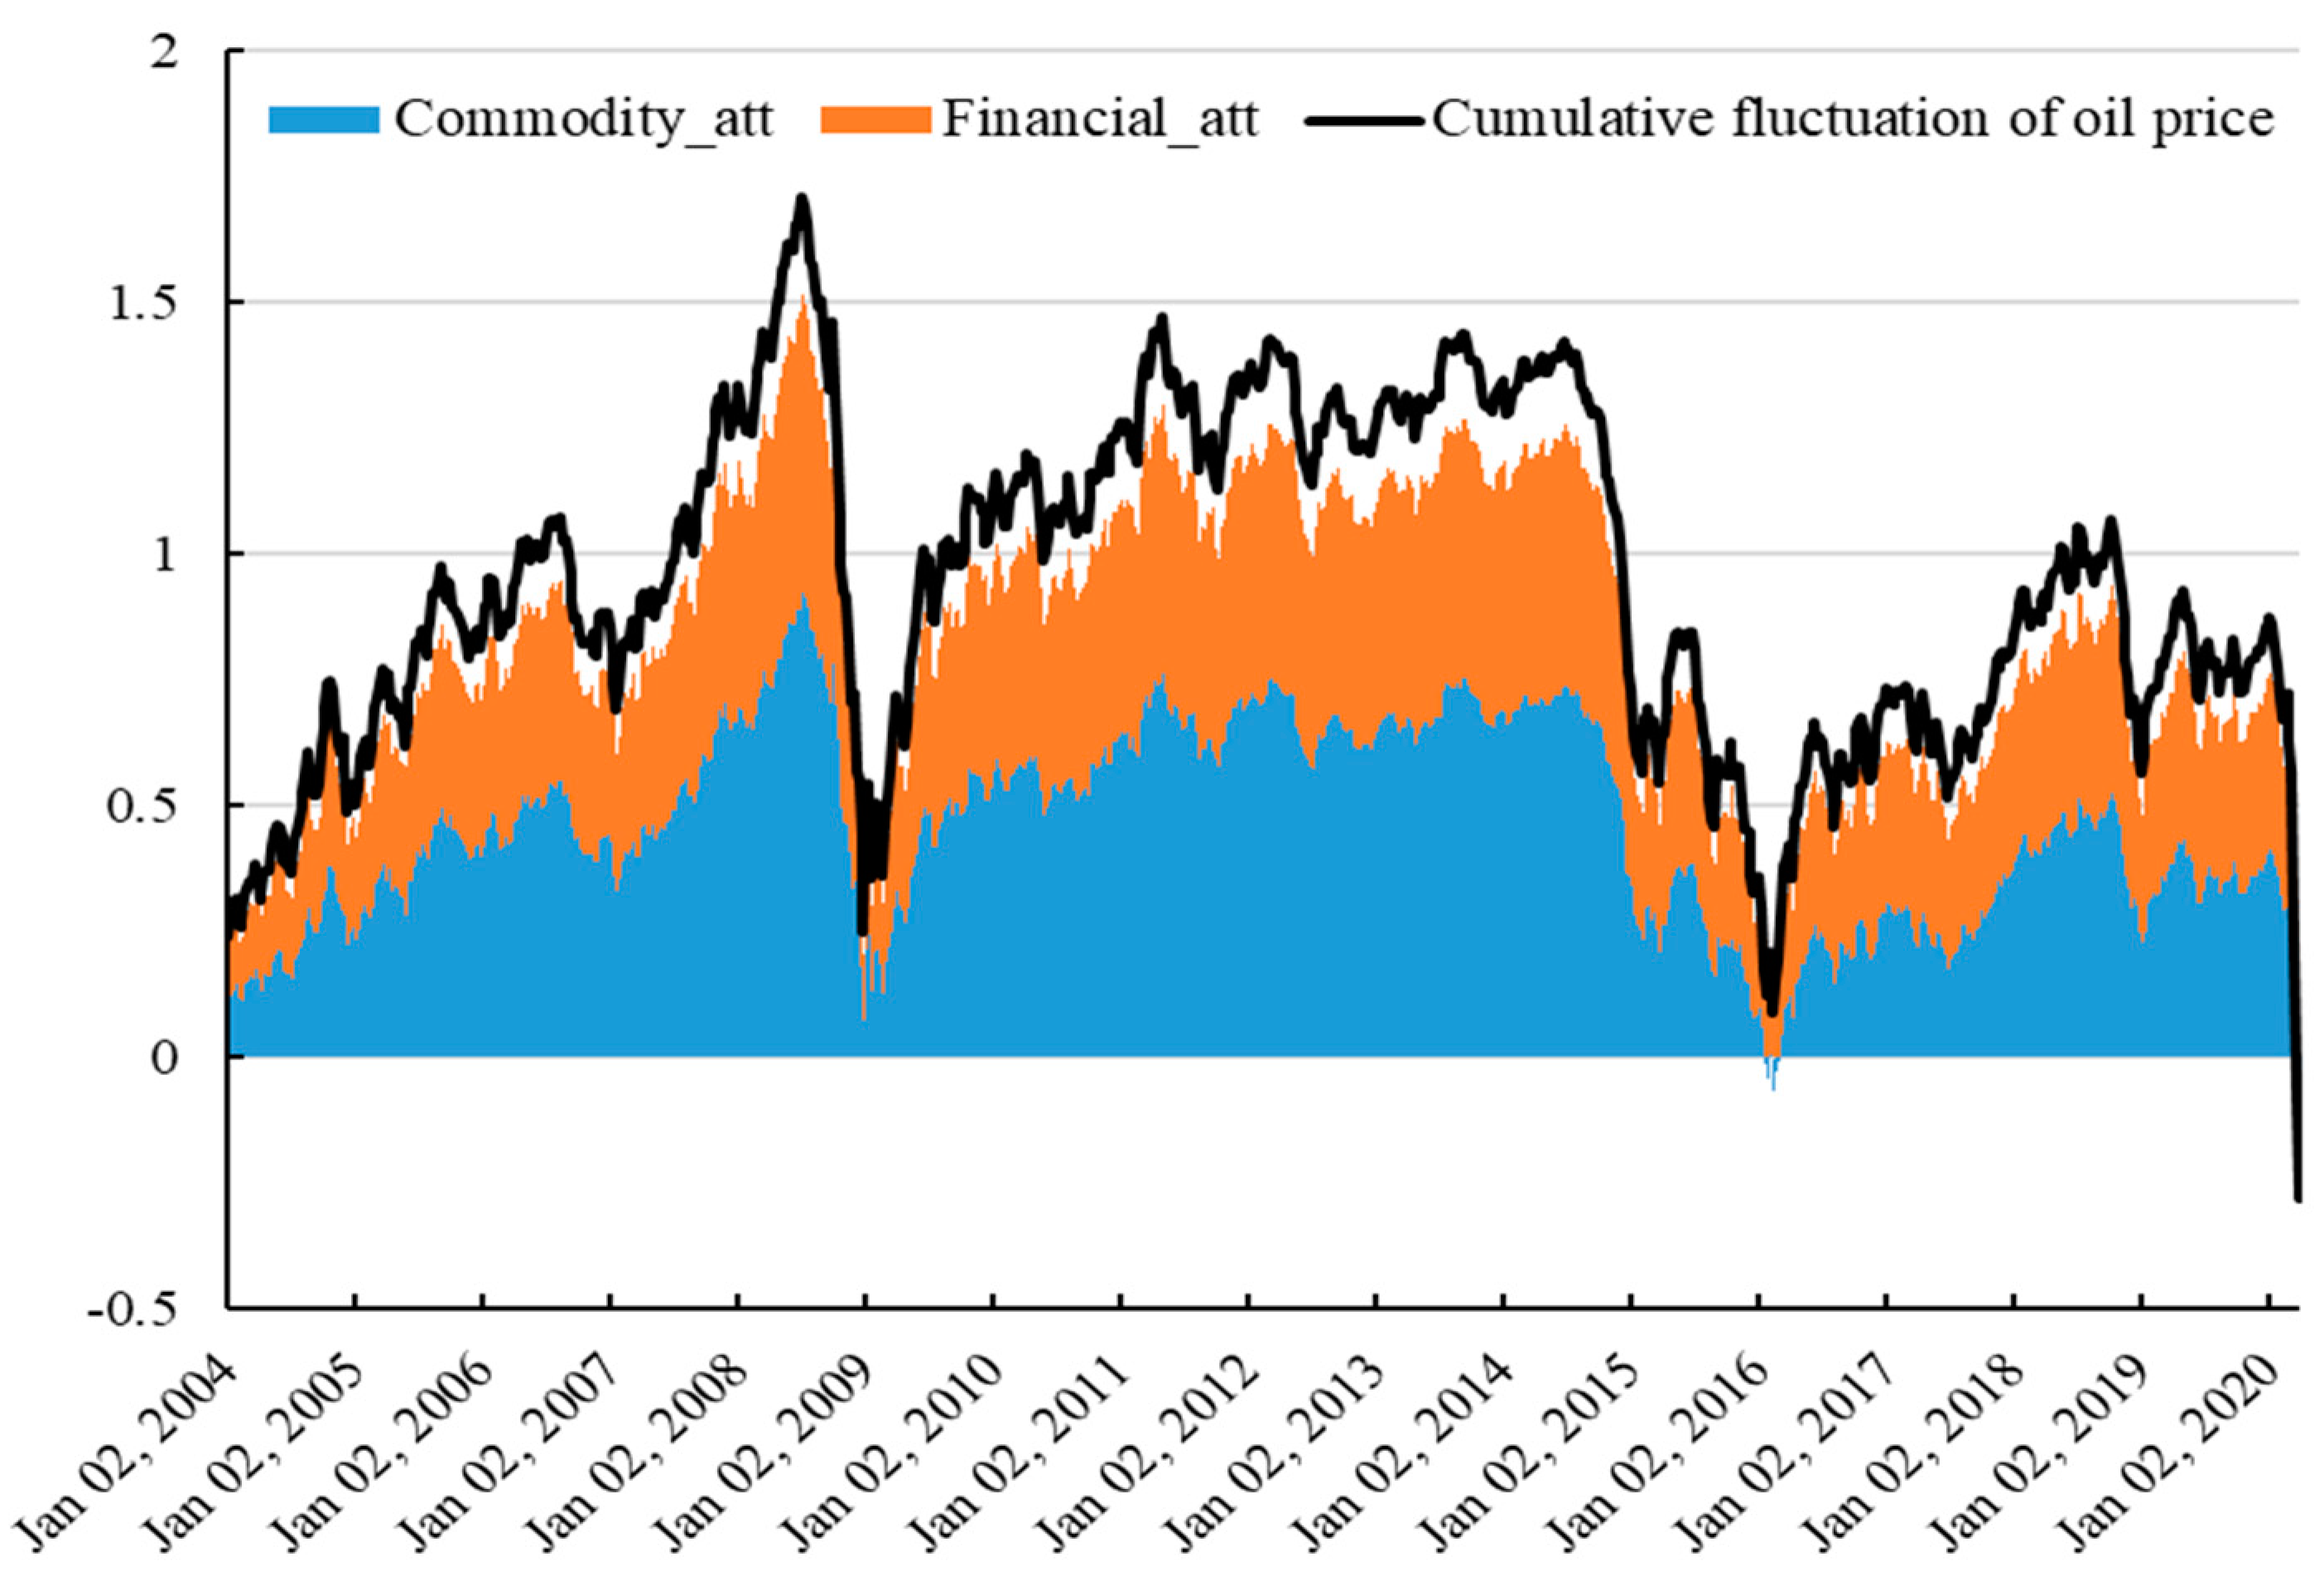
In order to better display the proportion of fluctuation sources of crude oil commodity and financial attributes in the formation of crude oil price fluctuation, and to explain the formation mechanism of dynamic characteristics of crude oil price fluctuation, the Kaman filter method is used to generate non-observed variables (crude oil commodity attribute) and (crude oil financial attribute) affected by different fluctuation sources. In order to better show the comparison between the two fluctuation sources in the variation trend of crude oil price, we take the crude oil price in the initial period of the sample as the base period and calculate the cumulative fluctuation of crude oil price, crude oil price with commodity attributes, and crude oil price with financial attributes, as shown in Figure 3.
It can be seen from Figure 3 that the crude oil price presents dynamic evolution characteristics, which are significantly correlated with different fluctuation sources. The sample period can be divided into three stages according to the impact of commodity factors and financial factors on crude oil price fluctuation. The first stage is before the 2008 financial crisis. Although the financial attribute of crude oil was weaker than that of commodity, both promoted the rapid rise of crude oil prices, especially the financial attribute. The second stage is from 2008 to 2014, when the crude oil price dropped for a short time and then rebounded rapidly. It can be seen that the fluctuation of financial crisis and crude oil price are highly detailed. At this stage, the commodity attribute of crude oil gives way to the financial attribute. The third stage is since 2014. With the fall of crude oil price, the commodity attribute of crude oil has also been strengthened, and the competition between the two attributes is in a sticky state. The fluctuation of crude oil prices in this stage is the result of the joint action of its commodity attribute and financial attribute.
The effects of commodity and financial factors on the fluctuation of crude oil prices are different at different levels of price. It can also be seen from Table 2 that when crude oil prices are high, the financial attribute of crude oil is stronger than the commodity attribute. The reason may be that the financialization of crude oil is a booster for the rise of crude oil prices, indicating that the crude oil price does not reflect the real price of crude oil under this situation, and crude oil is often bought and sold in the market as a financialized product of the investment target. Especially during 2008–2014, crude oil shows more financial attributes. When crude oil prices are low, the commodity attribute of crude oil often dominates the trend of crude oil price, reflecting the real price of commodities. Low-price crude oil has less volatility, making it difficult to be the target of asset allocation for investors in financial markets. The commodity attribute of crude oil performed more prominently before 2004. Since 2015, when the price of crude oil fluctuated around USD 50/barrel, the commodity attribute and the financial attribute of crude oil have been in a state of balance, indicating that the part of crude oil price determined by the supply–demand relationship is about USD 26/barrel, and the higher part of the price is mainly due to the reaction of its financialized products trading in the financial market. On the one hand, it shows that crude oil price does not deviate from the property of a commodity; on the other hand, crude oil has become the investment target in the financial market for hedging, stabilizing the fluctuation of oil price.
In addition, the commodity attribute and the financial attribute of crude oil play different roles in the sharp rise and fall of crude oil prices. Judging from the two sharp rises in crude oil prices between 2004–2008 and 2008–2010, the enhanced financial attribute of crude oil is the hand behind the scenes. The enhancement of the financial attribute of crude oil also makes crude oil price deviate from its pure commodity attribute, indicating that the rise of crude oil prices is not determined solely by supply and demand. With the increase in the influence of the financial attribute of crude oil, the price of crude oil has further increased. However, the fluctuation of crude oil prices has also increased, and financial market risks have also been transferred to the crude oil market, which has led to sharp drops in crude oil prices after the financial crisis in 2008 and the financial crisis in 2012. The sharp decline in crude oil prices even penetrated the supporting plane of the commodity attribute of crude oil, leading to further declines in crude oil prices. Thus, the commodity attribute of crude oil is the fundamental support plane of the surge and fall of oil prices, while the financial attribute of crude oil is the main driver of the surge and fall of oil prices.
3. Asymmetry in the Evolution of Crude Oil Price Fluctuations
3.1. Model Construction
The structural components of crude oil price fluctuation affected by different sources of fluctuation are decomposed by the state-space model. Empirical experience shows that the influencing mechanism of different sources of fluctuation in different trends of oil price and in the process of fluctuation has asymmetry, which also makes the dynamic evolution characteristics of crude oil price fluctuation more complicated. In terms of the commodity (supply) fluctuation source of the affecting crude oil price, the change of the supply–demand relationship causes the fluctuation of oil price. In fact, the increase in oil prices caused by supply disruption has little impact, but the drop in oil prices caused by supply expansion has a significant impact on the global economy [23]. From the perspective of the financial fluctuation source of crude oil prices, the rise of financial asset price shows that the whole economic environment is in the recovery stage, and the demand for crude oil and its derivatives will also increase, which will lead to the rise of oil prices. However, the downward risk of the financial asset price is more likely to induce economic and financial crisis and trigger the sharp fall of oil prices [65].
In order to analyze the asymmetric influence of different fluctuation sources on the dynamic evolution of crude oil price fluctuation, based on the research of Pesaran et al. [66] and Shin at al. [67], a nonlinearity autoregressive distribute lag approach (NARDL) is adopted. The model can solve the problem in which it is difficult to describe the nonlinear relationship between variables in a real economy in a linear autoregressive distribute lag approach (ADRL) [68]; meanwhile, the asymmetry between the long-term effect and short-term effect can be discussed by decomposing the independent variable into two parts: the accumulation of positive changes and the accumulation of negative changes.
The results of the NARDL model provide a more detailed understanding of the extent to which different fluctuation sources respond to the change of oil price from small to large. In particular, represents the accumulation of price fluctuation with the commodity attribute , while represents the accumulation of price fluctuation with the financial attribute , and can be decomposed as follows.
where = , = , = , = . The equation for the long-term asymmetric relationship between variables is expressed as follows:
where reflects the long-run transmission effect of the commodity attribute of crude oil on crude oil prices rising, while reflects the long-run transmission effect of the commodity attribute of crude oil on crude oil prices falling; reflects the long-run transmission effect of financial attribute of crude oil on crude oil prices rising, while reflects the long-run transmission effect of financial attribute of crude oil on crude oil prices falling. If , there is an asymmetry in the long-run transmission effect of the commodity (or financial) attribute of crude oil on crude oil prices. With the decomposed variables as new variables, an NARDL model can be constructed.
where represents the short-run transmission effect of the commodity attribute of crude oil on crude oil prices rising, while represents the short-run transmission effect of the commodity attribute of crude oil on crude oil prices falling; represents the short-run transmission effect of the financial attribute of crude oil on crude oil prices rising, while represents the short-run transmission effect of the financial attribute of crude oil on crude oil prices falling. If the sum of short-term effects when oil prices are rising is not equal to the sum of short-term effects when they are falling, i.e., () or (), there is an asymmetry in the short-run transmission effect of the commodity (or financial) attribute of crude oil on crude oil prices. Besides, the long-run asymmetry can be regarded as asymmetry in magnitude, while the short-run asymmetry can be treated as asymmetry in speed.
3.2. Empirical Analysis of Asymmetry in the Evolution of Crude Oil Price Fluctuation
Before performing the NARDL model estimation, it is necessary to test the normal distribution of the variables involved in the model and to test the cointegration relationship between the variables. The test results of variables in different sample intervals are shown in Table 3. Based on the skewness and kurtosis of variables, almost all variables are not subject to the normal distribution, and even the same variable in different sample intervals shows different characteristics of deviating from the normal distribution. We further use the Jarque–Bera (JB) test method to verify the test results that the variables are not subject to the normal distribution. In addition, the max-lambda statistic and the trace statistic of the Johansen–Juselius (JJ) test are used to test the cointegration relationship between variables in different sample intervals. Both test statistics exceed their own critical values, indicating that there is a long-term cointegration relationship among oil price, commodity attribute, and financial attribute, which is suitable for empirical analysis using the NARDL model.
Based on methods proposed by Shin at al. [67] and Fousekis et al. [69], we use the least square method to estimate parameters of the NARDL model to identify the asymmetric impacts of crude oil attributes on oil prices. Considering that the difference between the impact of oil price fluctuations caused by commodity factors and by financial factors is shown in three stages, the sample period is divided into three subsamples for regression analysis to avoid the impact of structural breakpoints of crude oil price on its rise or fall. At the same time, since the data used in our study are weekly data, the maximum lag periods and of the NARDL model are set to 2 and 4, respectively. The estimated results are shown in Table 4.
Table 4 shows that there is asymmetry in the long-term and short-term between the commodity (supply) and financial fluctuation sources of crude oil price, and there are differences in different stages. During the period of 2004–2008, when the oil price rose, the influence of crude oil financial fluctuation source on oil price was far greater than that of the supply fluctuation source, indicating that the crude oil price rise at this stage was mainly caused by the enhancement of its financial factors, and the influence of crude oil supply was weaker than that of financial factors. From 2009 to 2014, when the oil price was at a high level, the negative impact of the decline of crude oil financial fluctuation source on oil price was also greater than that of the supply fluctuation source. This shows that the oil price decline at this stage is also due to the enhancement of the influence mechanism of financial factors, and the information of capital price decline is transmitted to the crude oil market, resulting in the decline of oil price. During this period, the financial fluctuation source of crude oil price fluctuation strengthened and gradually occupied the dominant position. Although the impact of supply fluctuation source on oil price was also strengthened, it could not lead the crude oil price to fluctuate at a high level. To visualize the asymmetric change of the two as they rise or fall, we give the cumulative effect in Figure 4. It is shown in the figure that the impact of oil price supply fluctuation source on the rise and fall of oil prices is negative in the same direction, while the impact of insufficient supply is greater than that of excess supply; the impact of the financial fluctuation source of oil prices on the rise and fall of oil prices is in the opposite direction, and the impact of financial market downside risk is greater than that of the upward period; that is to say, the fall of financial fluctuation source is more likely to cause the collapse of oil price. Since 2015, the price of crude oil has declined a little. It may be that the financial fluctuation source of crude oil has squeezed the investment bubbles at a high price, and it is gradually becoming more balanced with the source of supply fluctuation. Its short-term and long-term trends show asymmetric impacts. However, the large shocks of the crude oil price at that stage, such as those in mid-2015 and early 2020, may be due to external non-economic and financial factors. At this stage, the long-term pass-through effect of crude oil supply factors and financial factors is significant during the rise of oil price, which indicates that the rise of crude oil price is the result of the joint influence of the two fluctuation sources. Next, we focus on the impact of major events on the contest between crude oil attributes.
4. The Difference of the Impact of Events on Crude Oil Price Fluctuation
4.1. Construction of Event Impact Model
With the increase of the influence of crude oil financial fluctuation source, the fluctuation of oil price is no longer determined by the supply fluctuation source of the commodity market only, and the formation mechanism of crude oil price fluctuation has changed. At the same time, the change of external environment that causes the fluctuation of the commodity market and financial market will also be transmitted to the crude oil market through the fluctuation spillover effect between markets and the fluctuation source, causing the fluctuation of crude oil price. The outbreak of the financial crisis will cause investors to reduce the attention of high-risk products such as crude oil, thus causing the oil price to plunge [70,71]. The geopolitical relationship affecting commodity supply is also an important factor of oil price fluctuation [72], and even major public health events, COVID-19 for example, can cause price fluctuations [49]. As the correlation between the crude oil market, commodity market, and financial market gradually increases [73,74], there will be uncertainty in the demand of the world crude oil market in the future under extreme risk exposures, such as the COVID-19 pandemic. The future demand of crude oil would add a huge uncertainty or “recession premium” to the prices [75]. At the same time, the sudden outbreak of the COVID-19 pandemic worldwide has reduced crude oil-related production activities, leading to an oversupply of crude oil and causing uncertain fluctuations in oil prices. In the face of these major catastrophic events, whether the transmission of risk information affects the crude oil price through the channel of the supply fluctuation source or the financial fluctuation source of crude oil is a problem worthy of attention, and it is also an important dimension to analyze the impact mechanism of fluctuation sources.
In this section, we focus on analyzing how the supply fluctuation source and the financial fluctuation source change the crude oil price fluctuation formation mechanism before and after four catastrophic events, namely, the subprime crisis in 2008, the financial crisis in 2012, the geopolitical tension in the Middle East in 2015, and the COVID-19 pandemic in 2020. Then, we compare and analyze the influencing mechanism of oil price fluctuation under the impacts of different types of events. However, as an external environmental variable of crude oil price fluctuations, event shock is not a continuous variable, and events have abruptness and decay with time. For this reason, this paper refers to the event analysis method of Karafiath [76], and it takes the pre- and post-event periods as dummy variables to construct the regression equation as follows:
where indicates that it is after the event, and otherwise, . Since the event occurs over a certain period, it is difficult to accurately match the time point with the weekly data. Baker et al. [77,78] constructed a newspaper-based Infectious Disease Equity Market Volatility Tracker (EMV index), which can be used to provide information for finding the time point when the event attracted the most public attention. During the occurrences of four events, we choose the day with the largest EMV index as the time when the event occurred.
In this paper, 12 samples (weeks) before and after the events are selected as the sample size of the model estimation, corresponding to those four events, and the least squares estimation of Model (8) is carried out. The results are shown in Table 5. It can be seen that there are differences in the contest of crude oil attributes under the impact of different catastrophic events.
4.2. Impact Analysis of Different Types of Events
4.2.1. The Overall Trend of the Impact of Different Types of Events
Under the impact of different types of events, the uncertainty of crude oil price fluctuation is intensified. The financial fluctuation sources of crude oil perform the same under the impact of two financial catastrophic events in 2008 and 2012, showing that with the enhancement of the degree of crude oil financialization, the financial fluctuation source of crude oil occupies a dominant position in oil price fluctuation after the financial crisis, thus causing severe fluctuations in the crude oil price. Crude oil prices fluctuated sharply due to the geopolitical tension in the Middle East in 2015. Before the event, the financial factor of crude oil was the main driving force for the rise of oil price. As the geopolitical relationship in the Middle East was relaxed and sufficient crude oil supply could be provided, the oil price was reduced due to excess supply. After the event, crude oil supply was affected, and the crude oil price was promoted from the source of supply fluctuation. Before the COVID-19 pandemic, crude oil production was sufficient. Compared with the hedging effect of the financial markets, the commodity attribute of crude oil dominated the trends of oil prices, and oil prices had fallen. After the outbreak of the COVID-19 pandemic, the huge impact of the pandemic on crude oil transportation has further squeezed inventories, which has rapidly lowered oil prices from the source of supply. At the same time, the pandemic also has an impact on the financial markets. Uncertain risks are transmitted to the crude oil market through financial markets, making it difficult for financial products to function well, and WTI crude oil futures prices plunged by about 300% on April 20, 2020, closing at −37.63 USD per barrel, increasing the uncertainty of oil price fluctuation.
4.2.2. The Difference of Events Impacts
There are differences in the impact mechanism of different types of events on the crude oil price fluctuation. The impact of financial crisis events often leads to drastic fluctuations of crude oil prices through financial fluctuation source channels. The impact of the two financial crisis events in 2008 and 2012, through the transmission of crude oil financial fluctuation sources, made the crude oil price fall. Before the financial crisis, the impact of crude oil supply and financial factors on oil price was relatively balanced. After the financial crisis, due to the fall of the financial market price, the crude oil price fell through the channel of financial fluctuation source. The geopolitical tension causes crude oil price fluctuation through the source of supply fluctuation, especially the geopolitical risk of oil supply regions. From the perspective of financial fluctuation sources, crude oil hedges against the price fluctuation of the spot market in the financial market. Even if political uncertainty occurs, the reverse effect of commodity and financial fluctuation sources of crude oil helps stabilize oil prices. The COVID-19 outbreak has exerted a strong impact on oil price through the simultaneous superposition effect of crude oil supply fluctuation source and financial fluctuation source. Under the impact of a joint catastrophic event, the simultaneous influence of the sources of crude oil supply fluctuation and financial fluctuation will have a superimposed effect on the oil price and intensify the fluctuation of crude oil price.
5. Conclusions
Through the decomposition of WTI crude oil price fluctuation, this paper extracts the oil price fluctuation structure caused by supply fluctuation sources and financial fluctuation sources, compares and analyzes the influence effect of different fluctuation sources from dynamic characteristics, asymmetries, and event impacts, and explains the dynamic evolution characteristics of oil price fluctuation from the perspective of the crude oil price influence mechanism. The conclusions are as follows.
Firstly, the fluctuation of crude oil prices tends to increase on the whole, and this strengthening trend has a significant correlation with the influence mechanism of crude oil price, that is, the structure of fluctuation sources. During the sample period, the fluctuation of crude oil prices is evolving dynamically, which is mainly the result of the joint action of supply fluctuation source and financial fluctuation source. Along with the gradual increase of financial factors affecting oil price fluctuations since 2004, which are reflected in the increase of the financialization of crude oil [36], the oil price fluctuations tend to be more dynamic. Before the 2008 financial crisis, the rapid development of financial products related to crude oil and the prosperity of the commodity market made the formation mechanism of crude oil prices not limited to the supply–demand relationship of crude oil. More factors influencing the financial market were included in the scope of the mechanism of oil price fluctuation. Due to the change of the fluctuation source of oil prices, the oil prices fluctuated at a high level from 2008 to 2014, and the two financial crises also caused the oil prices to plummet. Since 2015, the source structure of oil price fluctuation tends to be balanced, which makes the overall oil price drop, but the oil price fluctuates more frequently, and the influence mechanism of crude oil price is significantly related to the source structure of fluctuation.
Secondly, the influence mechanism of crude oil price fluctuation is asymmetric when the oil price is in different positions and price fluctuations are under different trends. The influence mechanism of oil price fluctuation sources on crude oil price fluctuation in different positions and trends shows significant differences. When the oil price is in a low position, the main factor affecting the oil price fluctuation is the variable of a supply relationship. When the oil price is at a high level, the main factor affecting the oil price fluctuation mainly comes from the influence of the financial market. In the stages showing a sharp rise or fall in oil price, the financial fluctuation source is an important driving force of oil price fluctuation, while the supply fluctuation source plays a stabilizing role to a certain extent; when the oil price rises or falls, it is mainly caused by changes in the supply–demand relationship of the crude oil market, and the financial market plays a role of resource allocation and value maintenance [79] to stabilize oil prices. In addition, there is asymmetry in the long-term impact and short-term impact between the supply and financial sources on crude oil price fluctuations, and there are differences at different stages.
Thirdly, there is a strong correlation between event shocks and event types in the evolution of crude oil price fluctuations. External event shocks exacerbate the uncertainty of the dynamic evolution of crude oil price. Different types of event shocks cause the rise or fall of oil price by changing the impact transmission mechanism of the oil price fluctuation source. Financial factors are an important source of fluctuations in oil price. Similarly, financial market risks will enlarge the fluctuation range of the oil price. The financial crisis shocks in 2008 and 2012 have confirmed that they will trigger a sharp drop in oil price. Similarly, Joo et al. [80] pointed out that the 2008 financial crisis had a negative impact on the crude oil market. Regional political risks will affect the oil price fluctuation by changing the global crude oil supply relationship, and it is also an important external environment variable [81], but crude oil financial products will avoid the impact of political risks on oil price fluctuation to a certain extent. Global public events, such as COVID-19, will increase the fluctuation of crude oil prices through the joint influence of supply and financial fluctuation sources.
Author Contributions
Methodology, J.P. and Z.L.; Software, Z.L.; Validation, J.P.; Formal analysis, J.P., Z.L. and B.M.D.; Writing—original draft preparation, J.P. and B.M.D.; Writing—review and editing, J.P. and Z.L. All authors have read and agreed to the published version of the manuscript.
Funding
This work was supported by Guangdong Natural Science Foundation (No. 2018A030313115).
Acknowledgments
The authors are grateful to reviewers and editors for helpful comments and suggestions.
Conflicts of Interest
The authors declare no conflict of interest.
References
- Blair, B.F.; Rezek, J.P. The effects of hurricane Katrina on price pass-through for gulf coast gasoline. Econ. Lett. 2008, 98, 229–234. [Google Scholar] [CrossRef]
- Hayat, A.; Narayan, P.K. The oil stock fluctuations in the United States. Appl. Energy 2010, 87, 178–184. [Google Scholar] [CrossRef]
- Ji, Q.; Guo, J.F. Oil price volatility and oil-related events: An Internet concern study perspective. Appl. Energy 2015, 137, 256–264. [Google Scholar] [CrossRef]
- Zavadska, M.; Morales, L.; Coughlan, J. Brent Crude Oil Prices Volatility during Major Crises. Financ. Res. Lett. 2020, 32, 101078. [Google Scholar] [CrossRef]
- Fattouh, B.; Kilian, L.; Mahadeva, L. The role of speculation in oil markets: What have we learned so far? Energy J. 2013, 34, 7–33. [Google Scholar] [CrossRef] [Green Version]
- Büyükşahin, B.; Robe, M. Speculators, commodities and cross-market linkages. J. Int. Money Financ. 2014, 42, 38–70. [Google Scholar] [CrossRef]
- Guo, J.F.; Ji, Q. How does market concern derived from the internet affect oil prices? Appl. Energy 2013, 112, 1536–1543. [Google Scholar] [CrossRef] [Green Version]
- Ji, Q.; Fan, Y. How does oil price volatility affect non-energy commodity markets? Appl. Energy 2012, 89, 273–280. [Google Scholar] [CrossRef]
- Bernanke, B. Irreversibility, uncertainty, and cyclical investment. Q. J. Econ. 1983, 98, 85–106. [Google Scholar] [CrossRef]
- Elder, J.; Serletis, A. Oil price uncertainty. J. Money Credit Bank. 2010, 42, 1137–1159. [Google Scholar] [CrossRef]
- Aye, G.C.; Dadam, V.; Gupta, R.; Mamba, B. Oil price uncertainty and manufacturing production. Energy Econ. 2014, 43, 41–47. [Google Scholar] [CrossRef] [Green Version]
- Van Eyden, R.; Difeto, M.; Gupta, R.; Wohar, M.E. Oil price volatility and economic growth: Evidence from advanced economies using more than a century’s data. Appl. Energy 2019, 233–234, 612–621. [Google Scholar] [CrossRef] [Green Version]
- Hamilton, J. The Changing Face of World Oil Markets; No. 20355; National Bureau of Economic Research: Cambridge, MA, USA, July 2014. [Google Scholar]
- Robe, M.A.; Wallen, J. Fundamentals, Derivatives Market Information and Oil Price Volatility. J. Futures Mark. 2016, 36, 317–344. [Google Scholar] [CrossRef]
- Smith, J.L. Inscrutable OPEC? Behavioral tests of the cartel hypothesis. Energy J. 2005, 26, 51–82. [Google Scholar] [CrossRef] [Green Version]
- Fattouh, B. The dynamics of crude oil differentials. Energy Econ. 2010, 32, 334–342. [Google Scholar] [CrossRef]
- Schmidbauer, H.; Rosch, A. OPEC news announcements: Effects on oil price expectation and volatility. Energy Econ. 2012, 34, 1656–1663. [Google Scholar] [CrossRef]
- Al-Fattah, S.M. Non-OPEC conventional oil: Production decline, supply outlook and key implications. J. Pet. Sci. Eng. 2020, 189, 107049. [Google Scholar] [CrossRef]
- Liu, K.; Luo, C.Q.; Li, Z. Investigating the risk spillover from crude oil market to BRICS stock markets based on Copula-POT-CoVaR models. Quant. Financ. Econ. 2019, 3, 754–771. [Google Scholar] [CrossRef]
- Kilian, L.; Hicks, B. Did unexpectedly strong economic growth cause the oil price shock of 2003–2008? Int. J. 2013, 32, 385–394. [Google Scholar] [CrossRef] [Green Version]
- Kilian, L.; Lee, T. Quantifying the speculative component in the real price of oil: The role of global oil inventories. J. Int. Money Financ. 2014, 42, 71–87. [Google Scholar] [CrossRef]
- Chang, C.L.; McAleer, M.; Tansuchat, R. Crude oil hedging strategies using dynamic multivariate garch. Energy Econ. 2011, 33, 912–923. [Google Scholar] [CrossRef] [Green Version]
- Jarrett, U.; Mohaddes, K.; Mohtadi, H. Oil Price Volatility, Financial Institutions and Economic Growth. Energy Policy 2019, 126, 131–144. [Google Scholar] [CrossRef] [Green Version]
- Irwin, S.; Sanders, D. Financialization and structural change in commodity futures markets. J. Agric. Appl. Econ. 2012, 3, 371–396. [Google Scholar] [CrossRef] [Green Version]
- Balcilar, M.; Hammoudeh, S.; Asaba, N.A.F. A regime-dependent assessment of the information transmission dynamics between oil prices, precious metal prices and exchange rates. Int. Rev. Econ. Financ. 2015, 40, 72–79. [Google Scholar] [CrossRef]
- Kanjilal, K.; Ghosh, S. Dynamics of crude oil and gold price post 2008 global financial crisis—New evidence from threshold vector error-correction model. Resour. Policy 2017, 52, 358–365. [Google Scholar] [CrossRef]
- Nusair, S.A.; Olson, D. The effects of oil price shocks on Asian exchange rates: Evidence from quantile regression analysis. Energy Econ. 2019, 78, 44–63. [Google Scholar] [CrossRef]
- Nguyen, C.; Bhatti, M.I.; Komorníková, M.; Komorník, J. Gold price and stock markets nexus under mixed-copulas. Econ. Model. 2016, 58, 283–292. [Google Scholar] [CrossRef]
- Al Rahahleh, N.; Bhatti, M.I. Co-movement measure of information transmission on international equity markets. Phys. Stat. Mech. Appl. 2017, 470, 119–131. [Google Scholar]
- Sadorsky, P. Modeling and forecasting petroleum futures volatility. Energy Econ. 2006, 28, 467–488. [Google Scholar] [CrossRef]
- Morales, L.; Andreosso-O’Callaghan, B. Volatility analysis of precious metals returns and oil returns: An ICSS approach. J. Econ. Financ. 2014, 38, 492–517. [Google Scholar] [CrossRef]
- Evgenidis, A. Do all oil price shocks have the same impact? Evidence from the Euro Area. Financ. Res. Lett. 2018, 26, 150–155. [Google Scholar] [CrossRef] [Green Version]
- Kilian, L. Not all oil price shocks are alike: Disentangling demand and supply shocks in the crude oil market. Am. Econ. Rev. 2009, 99, 1053–1069. [Google Scholar] [CrossRef] [Green Version]
- Kilian, L.; Murphy, D.P. The role of inventories and speculative trading in the global market for crude oil. J. Appl. Econ. 2014, 29, 454–478. [Google Scholar] [CrossRef]
- Juvenal, L.; Petrella, I. Speculation in the Oil Market. J. Appl. Econ. 2015, 30, 621–649. [Google Scholar] [CrossRef] [Green Version]
- Razek, N.H.; Michieka, N.M. OPEC and non-OPEC production, global demand, and the financialization of oil. Res. Int. Bus. Financ. 2019, 50, 201–225. [Google Scholar] [CrossRef]
- Bulte, E.; Pennings, J.M.E.; Heijman, W. Futures markets, price stabilization and efficient exploitation of exhaustible resources. Environ. Resour. Econ. 1996, 8, 351–366. [Google Scholar]
- Cheng, I.; Xiong, W. Financialization of commodity markets. Annu. Rev. Financ. Econ. 2014, 6, 419–441. [Google Scholar] [CrossRef] [Green Version]
- Tang, K.; Xiong, W. Index investment and financialization of commodities. Financ. Anal. J. 2012, 68, 54–74. [Google Scholar] [CrossRef]
- Lammerding, M.; Stephan, P.; Trede, M.; Wilfling, B. Speculative bubbles in recent oil price dynamics: Evidence from a Bayesian Markov-switching state-space approach. Energy Econ. 2013, 36, 491–502. [Google Scholar] [CrossRef] [Green Version]
- Kolodziej, M.; Kaufmann, R.; Kulatilaka, N.; Bicchetti, D.; Maystre, N. Crude oil: Commodity or financial asset? Energy Econ. 2014, 46, 216–223. [Google Scholar] [CrossRef]
- Singleton, K.J. Investor flows and the 2008 boom/bust in oil prices. Manag. Sci. 2014, 60, 300–318. [Google Scholar] [CrossRef] [Green Version]
- Dowling, M.; Cummins, M.; Lucey, B.M. Psychological barriers in oil futures markets. Energy Econ. 2016, 53, 293–304. [Google Scholar] [CrossRef]
- Bildirici, M.E.; Badur, M.M. The effects of oil prices on confidence and stock return in China, India and Russia. Quant. Financ. Econ. 2018, 2, 884–903. [Google Scholar] [CrossRef]
- Jin, X. The role of market expectations in commodity price dynamics: Evidence from oil data. J. Int. Money Financ. 2019, 90, 1–18. [Google Scholar] [CrossRef]
- Baumeister, C.; Kilian, L. Forecasting the real price of oil in a changing world: A forecast combination approach. J. Bus. Econ. Stat. 2015, 33, 338–351. [Google Scholar] [CrossRef] [Green Version]
- Demirer, R.; Kutan, A.M. The behavior of crude oil spot and futures prices around OPEC and SPR announcements: An event study perspective. Energy Econ. 2010, 32, 1467–1476. [Google Scholar] [CrossRef]
- Bouoiyour, J.; Selmi, R.; Hammoudeh, S.; Wohar, M.E. What are the categories of geopolitical risks that could drive oil prices higher? Acts or threats? Energy Econ. 2019, 84, 104523. [Google Scholar] [CrossRef]
- Sharif, A.; Aloui, C.; Yarovaya, L. COVID-19 pandemic, oil prices, stock market, geopolitical risk and policy uncertainty nexus in the US economy: Fresh evidence from the wavelet-based approach. Int. Rev. Financ. Anal. 2020, 70, 101496. [Google Scholar] [CrossRef]
- Caporin, M.; Chang, C.L.; Mcaleer, M. Are the S&P 500 index and crude oil, natural gas and ethanol futures related for intra-day data? Int. Rev. Econ. Financ. 2019, 59, 50–70. [Google Scholar]
- Zou, G.; Chau, K.W. Effects of International Crude Oil Prices on Energy Consumption in China. Energies 2020, 13, 3891. [Google Scholar] [CrossRef]
- Parker, S.; Bhatti, M.I. Dynamics and drivers of per capita CO2 emissions in Asia. Energy Econ. 2020, 89, 104798. [Google Scholar] [CrossRef]
- Cevik, N.K.; Cevik, E.I.; Dibooglu, S. Oil prices, stock market returns and volatility spillovers: Evidence from Turkey. J. Policy Model. 2020, 42, 597–614. [Google Scholar] [CrossRef]
- Beckmann, J.; Czudaj, R.L.; Arora, V. The relationship between oil prices and exchange rates: Revisiting theory and evidence. Energy Econ. 2020, 88, 104772. [Google Scholar] [CrossRef]
- Mei, D.; Ma, F.; Liao, Y.; Wang, L. Geopolitical risk uncertainty and oil future volatility: Evidence from MIDAS models. Energy Econ. 2020, 86, 104624. [Google Scholar] [CrossRef]
- Li, Z.; Zhong, J. Impact of economic policy uncertainty shocks on China’s financial conditions. Finance Res. Lett. 2020, 35, 101303. [Google Scholar] [CrossRef]
- Wen, F.H.; Xiao, J.H.; Xia, X.H.; Chen, B.; Xiao, Z.Y.; Li, J.Y. Oil prices and Chinese stock market: Nonlinear causality and volatility persistence. Emerg. Mark. Financ. Trade 2019, 55, 1247–1263. [Google Scholar] [CrossRef]
- Drachal, K. Forecasting spot oil price in a dynamic model averaging framework—Have the determinants changed over time? Energy Econ. 2016, 60, 35–46. [Google Scholar] [CrossRef]
- Safari, A.; Davallou, M. Oil price forecasting using a hybrid model. Energy 2018, 148, 49–58. [Google Scholar] [CrossRef]
- Metaxoglou, K.; Smith, A. Maximum Likelihood Estimation of VARMA Models Using a State-Space EM Algorithm. J. Time Ser. Anal. 2007, 28, 666–685. [Google Scholar] [CrossRef]
- De Jong, P. The diffuse Kalman filter. Ann. Stat. 1991, 19, 1073–1083. [Google Scholar] [CrossRef]
- Coppola, A. Forecasting oil price movements: Exploiting the information in the futures market. J. Futures Mark. 2008, 28, 34–56. [Google Scholar] [CrossRef]
- Arouri, M.E.H.; Jouini, J.; Nguyen, D.K. Volatility spillovers between oil prices and stock sector returns: Implications for portfolio management. J. Int. Money Financ. 2011, 30, 1387–1405. [Google Scholar] [CrossRef]
- Jacobs, M.; Karagozoglu, A.K. On the characteristics of dynamic correlations between asset pairs. Res. Int. Bus. Financ. 2014, 32, 60–82. [Google Scholar] [CrossRef]
- Kocaarslan, B.; Soytas, U. Asymmetric pass-through between oil prices and the stock prices of clean energy firms: New evidence from a nonlinear analysis. Energy Rep. 2019, 5, 117–125. [Google Scholar] [CrossRef]
- Pesaran, M.H.; Shin, Y.; Smith, R.J. Bounds testing approaches to the analysis of level relationships. J. Appl. Econ. 2001, 16, 289–326. [Google Scholar] [CrossRef]
- Shin, Y.; Yu, B.; Greenwood-Nimmo, M. Modelling Asymmetric Cointegration and Dynamic Multipliers in a Nonlinear ARDL Framework. In Festschrift in Honor of Peter Schmidt; Sickles, R., Horrace, W., Eds.; Springer: New York, NY, USA, 2014; pp. 281–314. [Google Scholar]
- Bahmani-Oskooee, M.; Saha, S. On the effects of policy uncertainty on stock prices. Quant. Financ. Econ. 2019, 3, 412–424. [Google Scholar] [CrossRef]
- Fousekis, P.; Katrakilidis, C.; Trachanas, E. Vertical price transmission in the US beef sector: Evidence from the nonlinear ARDL model. Econ. Model. 2016, 52, 499–506. [Google Scholar] [CrossRef]
- Arouri, M.E.H.; Jouini, J.; Nguyen, D.K. On the impacts of oil price fluctuations on European equity markets: Volatility spillover and hedging effectiveness. Energy Econ. 2012, 34, 611–617. [Google Scholar] [CrossRef]
- Phan, D.H.B.; Sharma, S.S.; Narayan, P.K. Intraday volatility interaction between the crude oil and equity markets. J. Int. Financ. Mark. Inst. Money 2016, 40, 1–13. [Google Scholar] [CrossRef]
- Abdel-Latif, H.; El-Gamal, M. Antecedents of war: The geopolitics of low oil prices and decelerating financial liquidity. Appl. Econ. Lett. 2019, 26, 765–769. [Google Scholar] [CrossRef]
- Uddin, G.S.; Hernandez, J.A.; Shahzad, S.J.H.; Kang, S.H. Characteristics of spillovers between the US stock market and precious metals and oil. Resour. Policy 2020, 66, 101601. [Google Scholar] [CrossRef]
- Bekiros, S.; Hernandez, J.A.; Uddin, G.S.; Muzaffar, A.T. On the predictability of crude oil market: A hybrid multiscale wavelet approach. J. Forecast 2020, 39, 599–614. [Google Scholar] [CrossRef]
- Dutta, A.; Bouri, E.; Uddin, G.S.; Yahya, M. Impact of COVID-19 on Global Energy Markets. IAEE Energy Forum Covid-19 Issue 2020, 2020, 26–29. [Google Scholar]
- Karafiath, I. Using dummy variables in the event methodology. Financ. Rev. 1988, 23, 351–357. [Google Scholar] [CrossRef]
- Baker, S.R.; Bloom, N.; Davis, S.J.; Kost, K.J. Policy News and Stock Market Volatility; No. w25720; National Bureau of Economic Research: Cambridge, MA, USA, March 2019. [Google Scholar]
- Baker, S.R.; Bloom, N.; Davis, S.J.; Kost, K.J.; Sammon, M.C.; Viratyosin, T. The Unprecedented Stock Market Impact of COVID-19; No. 26945; National Bureau of Economic Research: Cambridge, MA, USA, June 2020. [Google Scholar]
- Basher, S.A.; Sadorsky, P. Hedging emerging market stock prices with oil, gold, VIX, and bonds: A comparison between DCC, ADCC and GO-GARCH. Energy Econ. 2016, 54, 235–247. [Google Scholar] [CrossRef] [Green Version]
- Joo, K.; Suh, J.H.; Lee, D.; Ahn, K. Impact of the global financial crisis on the crude oil market. Energy Strategy Rev. 2020, 30, 100516. [Google Scholar] [CrossRef]
- Abdel-Latif, H.M.; El-Gamal, M.M. Financial Liquidity, Geopolitics, and Oil Prices. Energy Econ. 2020, 87, 104482. [Google Scholar] [CrossRef]
Figure 1.
The logical framework of this paper.

Figure 2.
Moving-window correlation coefficient. Note: Figure 2 (a) shows the moving-window correlation coefficient between WTI crude oil price and U.S. ending stocks, while Figure 2 (b) shows the moving-window correlation coefficient between WTI crude oil price and SP500. In this paper, the moving width is designed as 100, which can avoid the uncertainty of increasing the correlation coefficient due to a too-short time window, and it can also reduce the time window that is too long to cover up too much information. The dotted line in the figure shows the static correlation coefficient. The correlation coefficient between WTI crude oil price and the ending inventory in the United States is −0.2490. The correlation coefficient between WTI crude oil price and the S&P500 index is −0.1290.

Figure 3.
The cumulative fluctuation of crude oil prices and different attributes of crude oil price. Notes: The black line in the figure is the cumulative change of crude oil price fluctuations. The blue area reflects the commodity attribute of crude oil price, and the orange area reflects the financial attribute of crude oil price. Besides, the area enclosed by the black line and the abscissa axis minus the sum of the blue area and the orange area is the white area. The white area reflects residuals when estimating Equation (1), which indicates the uncertainty in the formation of crude oil prices.

Figure 4.
The asymmetric effects of crude oil attributes in 2008–2014. Notes: The number of bootstrap replications for asymmetry plot is 100, confidence level (CI) for asymmetry is in 95%.
Figure 4.
The asymmetric effects of crude oil attributes in 2008–2014. Notes: The number of bootstrap replications for asymmetry plot is 100, confidence level (CI) for asymmetry is in 95%.


Table 1.
Descriptive statistics of variables in different sample intervals.
| Intervals | Parameter | Obs | Mean | Std.Dev. | Min | Max |
|---|---|---|---|---|---|---|
| All the samples | WTI | 850 | 69.66 | 22.66 | 19.44 | 142.52 |
| Stock | 850 | 1,052,670 | 66,700.95 | 886,904 | 1,227,680 | |
| SP500 | 850 | 1707.59 | 623.72 | 683.38 | 3380.16 | |
| 2004–2008 | WTI | 261 | 67.18 | 24.32 | 32.68 | 142.52 |
| Stock | 261 | 983,883 | 30,421.40 | 886,904 | 1,027,194 | |
| SP500 | 261 | 1268.42 | 151.79 | 800.03 | 1561.80 | |
| 2009–2014 | WTI | 313 | 86.88 | 15.88 | 36.73 | 112.3 |
| Stock | 313 | 1,043,781 | 17,777.98 | 997,074 | 1,078,071 | |
| SP500 | 313 | 1387.90 | 336.02 | 683.38 | 2088.77 | |
| 2015–2020 | WTI | 276 | 52.43 | 9.97 | 19.44 | 75.13 |
| Stock | 276 | 1,127,798 | 47,500.17 | 1,039,770 | 1,227,680 | |
| SP500 | 276 | 2485.45 | 380.12 | 1864.78 | 3380.16 |
Table 2.
The estimation results of the state equation.
| Parameter | ||||
|---|---|---|---|---|
| Estimate | 0.1213 *** (0.0317) | −0.5605 ** (0.2238) | 0.8617 *** (0.0389) | 0.1284 *** (0.0304) |
| Log-likelihood | 3063.65 | |||
| Wald | 695.19 | |||
Notes: 1. Standard errors are reported in the parenthesis. 2. ** and *** represent statistical significance at the 5% level and at the 1% level, respectively. 3. When , there is no heteroscedasticity in this model.
Table 3.
Tests of variables in different sample intervals.
| Skewness | Kurtosis | JB Test | JJ Test Max-Lambda | JJ Test Trace | ||
|---|---|---|---|---|---|---|
| Stage 1 2004–2008 | oil | 1.10 | 3.80 | 59.58 (0.00) | 22.93 [20.97] | 41.60 [29.68] |
| com | −1.24 | 3.95 | 76.62 (0.00) | |||
| fin | −0.32 | 3.13 | 4.66 (0.09) | |||
| Stage 2 2008–2014 | oil | −1.07 | 3.93 | 71.28 (0.00) | 23.48 [20.97] | 33.60 [29.68] |
| com | −0.38 | 2.49 | 11.01 (0.00) | |||
| fin | 0.35 | 2.23 | 13.97 (0.00) | |||
| Stage 3 2015–2020.3 | oil | −0.28 | 3.47 | 6.25 (0.04) | 26.57 [20.97] | 31.51 [29.68] |
| com | 0.37 | 1.96 | 18.59 (0.00) | |||
| fin | 0.25 | 1.92 | 16.12 (0.00) |
Note: 1. The chi-square values of the Jarque–Bera normality test (JB test) are reported in the parentheses. 2. The critical values of Johansen–Juselius cointegration rank test (JJ test) are reported in the square brackets.
Table 4.
The estimation results of the nonlinearity autoregressive distribute lag approach (NARDL) model.
Table 4.
The estimation results of the nonlinearity autoregressive distribute lag approach (NARDL) model.
| Crude Oil Prices | Stage 1 | Stage 2 | Stage 3 |
|---|---|---|---|
| 2004–2008 | 2008–2014 | 2015–2020.3 | |
| −0.0328 [0.0153] ** | −0.0229 [0.0119] *** | −0.0358 [0.0186] ** | |
| 0.0384 [0.1149] | −0.0747 [0.0059] *** | 0.0227 [0.0051] *** | |
| 0.2332 [0.1314] * | −0.0613 [0.0045] *** | −0.0124 [0.0051] *** | |
| 0.0943 [0.0293] *** | −0.0339 [0.0241] | 0.1554 [0.0601] ** | |
| 0.1199 [0.2996] *** | −0.0421 [0.0032] | 0.1945 [0.0762] ** | |
| 0.1799 [0.0677] *** | 0.2753 [0.0545] ** | 0.4222 [0.0618] *** | |
| −1.2798 [0.0006] *** | 0.0710 [0.0010] *** | 0.0545 [0.0013] *** | |
| −1.5279 [0.0337] ** | −1.5477 [0.0415] *** | 1.5360 [0.0796] *** | |
| −0.8640 [0.0006] *** | −0.8943 [0.0010] *** | 0.0774 [0.0013] *** | |
| −2.3674 [0.0006] *** | −1.6032 [0.0010] *** | 0.5227 [0.0013] *** | |
| 0.7201 [0.0006] *** | 0.0657 [0.0011] *** | −0.2762 [0.0014] *** | |
| 0.3279 [0.0338] ** | 0.8629 [0.0415] ** | −3.0583 [0.0799] *** | |
| −2.9314 [0.0006] *** | −0.9886 [0.0011] ** | 0.3988 [0.0014] *** | |
| 3.765 [0.0006] *** | 1.9412 [0.0011] *** | 0.0291 [0.0014] *** | |
| −0.1203 [0.0231] *** | −0.0645 [0.0010] *** | 0.2030 [0.0018] *** | |
| −0.1526 [0.2285] | 0.4887 [0.1454] *** | −0.0608 [0.2539] | |
| −0.2615 [0.2302] | −0.1449 [0.1465] | 0.5607 [0.2735] ** | |
| 0.3140 [0.2170] | 0.0268 [0.1384] | 0.4073 [0.2579] | |
| 0.0517 [0.0159] *** | −0.1168 [0.0010] *** | 0.5126 [0.1715] *** | |
| 0.0201 [0.1681] | 0.4732 [0.1548] *** | 0.9010 [0.1771] *** | |
| 0.0984 [0.1714] | −0.4287 [0.1578] *** | 0.5826 [0.1932] *** | |
| −0.0697 [0.1763] | −0.2749 [0.1604] ** | 0.0023 [0.0019] | |
| LRE com [+] | −1.170 (0.000) *** | −3.256 (0.000) *** | −0.636(0.000) *** |
| LRE fin [+] | 13.079 (0.000) *** | 2.498 (0.000) *** | 1.962 (0.000) *** |
| LRE com [-] | 1.003 (0.000) *** | 0.982 (0.000) *** | 1.001 (0.000) |
| LRE fin [-] | 16.635 (0.000) | 1.337 (0.000) *** | 2.456 (0.000) *** |
| LRS com | 9.943 (0.002) *** | 3.304 (0.080) ** | 0.1436 (0.378) |
| LRS fin | 0.311(0.571) | 0.610 (0.526) | 8.082 (0.079) *** |
| SRS com | 3.928 (0.048) ** | 3.492 (0.034) ** | 2.197(0.620) *** |
| SRS fin | 2.498(0.061) * | 3.957 (0.047) ** | 2.610 (0.010) ** |
Notes: 1. Standard deviations are reported in the square brackets, while p-values are reported in the parentheses. 2. *, **, and *** represent statistical significance at the 10% level, at the 5% level, and at the 1% level, respectively. 3. LRE represents long-run effect; LRS and SRS represent long-run symmetry and short-run symmetry, respectively.
Table 5.
Contests of two attributes of crude oil under the impacts of different events.
| Subprime Crisis (2008) | Financial Crisis (2012) | Geopolitical Tension in the Middle East (2015) | COVID-19 Pandemic (2020) | |
|---|---|---|---|---|
| 0.0214 * [0.0109] | –0.0094 ** [0.0047] | –1.9053 [1.3089] | –5.3283 ** [2.2721] | |
| 1.0078 *** [0.0107] | 1.0051 *** [0.054] | 2.6612 *** [0.6823] | –5.9633 *** [0.4645] | |
| 0.0397 * [0.0199] | 0.0190 ** [0.0086] | 5.52112 ** [2.2131] | 1.7133 ** [0.6941] | |
| 1.3205 *** [0.0196] | 1.3236 *** [0.0101] | –2.4683 *** [0.6401] | 2.4037 *** [0.1872] | |
| –0.0049 *** [0.0007] | –0.0037 *** [0.0007] | –0.3935 [0.2953] | 0.7565 *** [0.1962] |
Notes: 1. Standard deviations are reported in the square brackets. 2. *, **, and *** represent statistical significance at the 10% level, at the 5% level, and at the 1% level, respectively.
© 2020 by the authors. Licensee MDPI, Basel, Switzerland. This article is an open access article distributed under the terms and conditions of the Creative Commons Attribution (CC BY) license (http://creativecommons.org/licenses/by/4.0/).
Share and Cite
MDPI and ACS Style
Peng, J.; Li, Z.; Drakeford, B.M. Dynamic Characteristics of Crude Oil Price Fluctuation—From the Perspective of Crude Oil Price Influence Mechanism. Energies 2020, 13, 4465. https://0-doi-org.brum.beds.ac.uk/10.3390/en13174465
AMA Style
Peng J, Li Z, Drakeford BM. Dynamic Characteristics of Crude Oil Price Fluctuation—From the Perspective of Crude Oil Price Influence Mechanism. Energies. 2020; 13(17):4465. https://0-doi-org.brum.beds.ac.uk/10.3390/en13174465
Chicago/Turabian StylePeng, Jiaying, Zhenghui Li, and Benjamin M. Drakeford. 2020. "Dynamic Characteristics of Crude Oil Price Fluctuation—From the Perspective of Crude Oil Price Influence Mechanism" Energies 13, no. 17: 4465. https://0-doi-org.brum.beds.ac.uk/10.3390/en13174465
Note that from the first issue of 2016, this journal uses article numbers instead of page numbers. See further details here.