Experimental and Numerical Study on Energy Piles with Phase Change Materials


Department of Mechanical and Industrial Engineering, Ryerson University, 350 Victoria St, Toronto, ON M5B 2K3, Canada
*
Author to whom correspondence should be addressed.
Energies 2020, 13(18), 4699; https://0-doi-org.brum.beds.ac.uk/10.3390/en13184699
Submission received: 28 July 2020
/
Revised: 5 September 2020
/
Accepted: 8 September 2020
/
Published: 9 September 2020
(This article belongs to the Special Issue Phase Change Materials (PCMs) for Heat Storage in Building Applications)
Abstract
:Phase change materials (PCM) utilization in energy storage systems represents a point of interest and attraction for the researchers to reduce greenhouse gas emissions. PCM have been used widely on the interior or exterior walls of the building application to optimize the energy consumption during heating and cooling periods. Meanwhile, ground source heat pump (GSHP) gained its popularity because of the high coefficient of performance (COP) and low running cost of the system. However, GSHP system requires a stand-by heat pump during peak loads. This study will present a new concept of energy piles that used PCM in the form of enclosed tube containers. A lab-scaled foundation pile was developed to examine the performance of the present energy pile, where three layers of insulation replaced the underground soil to focus on the effect of PCM. The investigation was conducted experimentally and numerically on two identical piles with and without PCM. Moreover, a flow rate parametric study was conducted to study the effect of the working fluid flow rate on the amount of energy stored and released at each model. Finally, a comprehensive Computational fluid dynamic (CFD) model was developed and compared with the experimental results. There was a good agreement between the experimental measurements and the numerical predictions. The results revealed that the presence of PCM inside the piles increased not only the charging and discharging capacity but also the storage efficiency of the piles. It was found that PCM enhances the thermal response of the concrete during cooling and heating processes. Although increasing the flow rate increased charging and discharging capacity, the percentage of energy stored/released was insignificant compared to the flow rate increasing percentage.
1. Introduction
Ground source heat pump (GSHP) represents a green sustainable technique for heating and cooling the building compared to conventional heat pumps. GSHP utilizes the underground soil as a heat source/sink which has a less variable temperature than that of the atmospheric air used as a heat source/sink for the conventional heat pumps. The larger the temperature difference between the heat pump’s working fluid and the heat source/sink, the higher the overall COP, resulting in less energy consumption and fewer greenhouse gases (GHG) emissions [1,2,3].
GSHP consists of two main parts: the conventional heat pump and the ground heat exchanger (GHE). During the heating mode, the working fluids coming from the GHE, usually water, exchange their energy with the refrigerator at the evaporator of the conventional heat pump (HP), which decreases the temperature of the water and evaporates the refrigerator. The cold water then goes back to the underground soil and extracts an amount of heat, which leaves the underground soil colder after each cycle of the water throughout the winter season. During the summer season, the cycle is inversed, allowing the water to transfer the heat from the condenser of the conventional HP to the underground [1].
The previously mentioned concept of the GSHP is the ideal concept, where the heating and cooling loads are completely balanced when the gradual decrease in the underground average temperature throughout the winter season is recovered by a gradual increase throughout the summer season, leaving the underground temperature at its origin every year. However, in northern climate regions, the winter heating load exceeds the summer cooling load, which will decrease the average underground soil temperature gradually every year [4,5,6], leading to poor system performance, and over the time the GHE could fail to extract heat from the underground, leading to a system failure [7]. In addition, an extreme increase or decrease in the underground average temperature could be considered to be an environmental threat [4].
While GSHP systems have proven their capability of enhancing the performance of traditional HP, and to decrease GHG emission, the adaptation rate of GSHP is low due to the following limitations: (1) lack of drilling space, which could be impossible within the residential areas; (2) high initial cost of drilling and installing the system, and long payback periods compared to this of the conventional HP [8]; (3) the unbalanced heating and cooling loads depending on the region weather, and in a specialized building that requires high cooling loads, i.e., (restaurants, skating rinks) or high heating loads, i.e., (processing plants) [9]; and (4) failing to cover the building requirements during the peak load.
To overcome the limitation of the large space required for the borehole field, and the drilling cost itself, many research studies have used the building foundation piles as a GHE instead of a borehole field. This system is known as the energy pile, at which the building foundation piles are used for load-bearing and as GHE. The ground surface boundary condition of the energy piles could enhance its thermal performance over the performance of the borehole system, as the ground surface of the energy pile is covered from the solar radiation and ambient air [10]. The number of energy piles required mainly depends on the building’s structural design, so it is predicted to have thermal interference between the nearly designed foundation piles [10,11].
The available solutions for unbalanced heating and cooling are (1) increasing the GHE depth, (2) increasing the borehole field spacing and number, (3) using a standby heat pump, and (4) using thermal energy storage [12,13]. Increasing the GHE number and depth in case of energy pile depends mainly on the building structure design, and any change of this design will increase the capital cost of the project. While increasing GHE spacing could not be considered as a potential solution in highly populated areas. Usually, the stand-by heat pump is designed to take over during the peak load, and the more the system depends on the stand-by heat pump, the more the system loses the GSHP advantages, and the more the running cost increases.
In regions with a heating dominant load requirement, solar energy storage is a potential solution for the unbalanced heating and cooling loads. Where solar collectors are connected to the GHE to cover the imperfection of heating load [14,15,16]. Han et al. [15] investigated numerically the performance of a solar-assisted GSHP with latent heat energy storage tank in cold regions, the results showed that the storage tank played a very important role during operation, the system could be operated more effectively and stably by the heat charge and discharge.
In this study, the concept of energy pile with phase change materials (PCM) containers is investigated numerically and experimentally, to study the effect of the PCM on the performance of the energy piles. PCM could absorb, store, and release an amount of energy during the phase transition without any significant temperature change, due to its internal molecular energy change. This feature made the PCM an attractive element for energy storage systems, especially the thermal energy storage systems. PCM is one of the most common techniques used to enhance the buildings envelope’s thermal inertia; increasing the building envelope’s thermal inertia would increase the indoor temperature stability regardless of the variations of the outdoor condition [17]. PCM could be categorized into three different groups according to their phase change state: solid-solid, solid-liquid, and liquid–gas PCM [17,18].
The solid–liquid PCM is the most suitable material for thermal energy storage systems, as it has a small volume change during melting and solidification, large phase change enthalpy, and large varieties of the melting temperature [17]. This enables it to be used for many different applications. The solid–liquid PCM could be classified as organic compound, inorganic compounds, and eutectics [19,20,21]. The following Table 1 summarizes the components of each compound, their characteristics and their environmental effect [18,19,22,23,24].
The quantity of reported industrially available PCM types has surpassed more than one thousand types [25], which will lead to a big challenge to choose the optimal type of PCM for a specific application. However, many studies [18,19,25,26,27,28] have reported the required PCM characteristics for building applications as shown in Table 2.
The fact is there is no single PCM that has the best characteristics over all the other PCM materials, for example, a single selection could have high thermal conductivity and high latent heat of fusion, but its phase change temperature is not suitable for the application. Another example is a selection that has a suitable phase change temperature for the application, but it also has low thermal conductivity and/or low latent heat of fusion. So, it is impossible to recommend one single material for all applications, and the selection should depend on the application requirements, the material availability in the market, and the firm’s experience with PCM materials [25]
There are different methods of integrating PCM into the building materials: (1) direct impregnation of PCM into the porous building material [25,29,30], (2) enclosing PCM in a microscopic polymer capsules(micro-encapsulation) then add these capsules to the building construction materials [25,31,32,33], (3) shape-stabilized PCM at which a liquid mixture of PCM and supporting material is cooled down below the glass transition temperature of the supporting material until it becomes solid [29,34,35], (4) and macro-encapsulation method which is considered to be the most promising method in building applications at which the PCM could filled into customized container, i.e., tube containers [36,37,38,39].
Many research studies have presented the effect of integrating the PCM to the building wall [40,41,42,43,44,45,46], floor [41,47,48], roof [42,45,49,50], these studies proved that PCM enhanced the thermal performance of the building envelops and decreased the energy required for the heat pump. Up to the knowledge of the author, the studies that have been conducted in utilizing PCM within the foundation piles of the building are very limited. Thus, this study will present a novel idea of implementing PCM container tubes inside the concrete piles of the building foundation which is used as GHE within the GSHP components. A paraffin wax PCM with a melting temperature range (22–26 °C) and a latent heat of 100 J/g is the most suitable choice for the study application due to its chemical stability, containers compatibility, relatively cheap price, and its market availability. The study objective is to present the impact of the PCM containers on the performance of the energy pile samples, and the effect of different flow rates on the concrete’s thermal behavior. In this document, chapter two delivers the experiment description and procedure, while chapter three delivers the uncertainty calculation. Chapter four explains the CFD model. The results and discussions are in chapter five.
2. Experimental Setup
2.1. Experimental Description
A test rig was built to simulate two scaled concrete foundation piles models; the first model had no PCM containers, while the second model had 4 PCM containers. The experimental setup dimensions of both piles were the same, with a length and diameter of 30 and 10 cm, respectively, each pile contains 16 rebars with 0.36 cm diameter. A heat exchanger (HEX) with 4-U tubes was placed in each model. The difference between both scaled piles was the presence of the PCM containers. The first model has no PCM as shown in Figure 1a, while the second model contains 4 tubes with 16 mm outer diameter with a thickness of 1 mm, each tube was located at an angle of 90° with a radius of 31.9 mm as shown in Figure 1b.
Figure 2 presents the experiment test rig components as the following: 4 U-tube HEX, data acquisition system (DAQ), water-bath, PCM containers, flowmeter, ball valve, and thermocouples
The rebar cage was fastened inside the mold, then a circular ring has surrounded the rebar cage to keep its circular shape. Four U-tube HEX were placed inside the circular rebar cage as in Figure 3a to prevent a thermal short circuit between HEX tubes, the inlet of each U-tube was attached to the inlet of the next leg, and the outlet of each U-tube was attached to the outlet of the next leg. A small space was left between each leg to allow inserting clamps and water-tubes as in Figure 3b. Then PCM containers were inserted into the samples as shown in Figure 1.
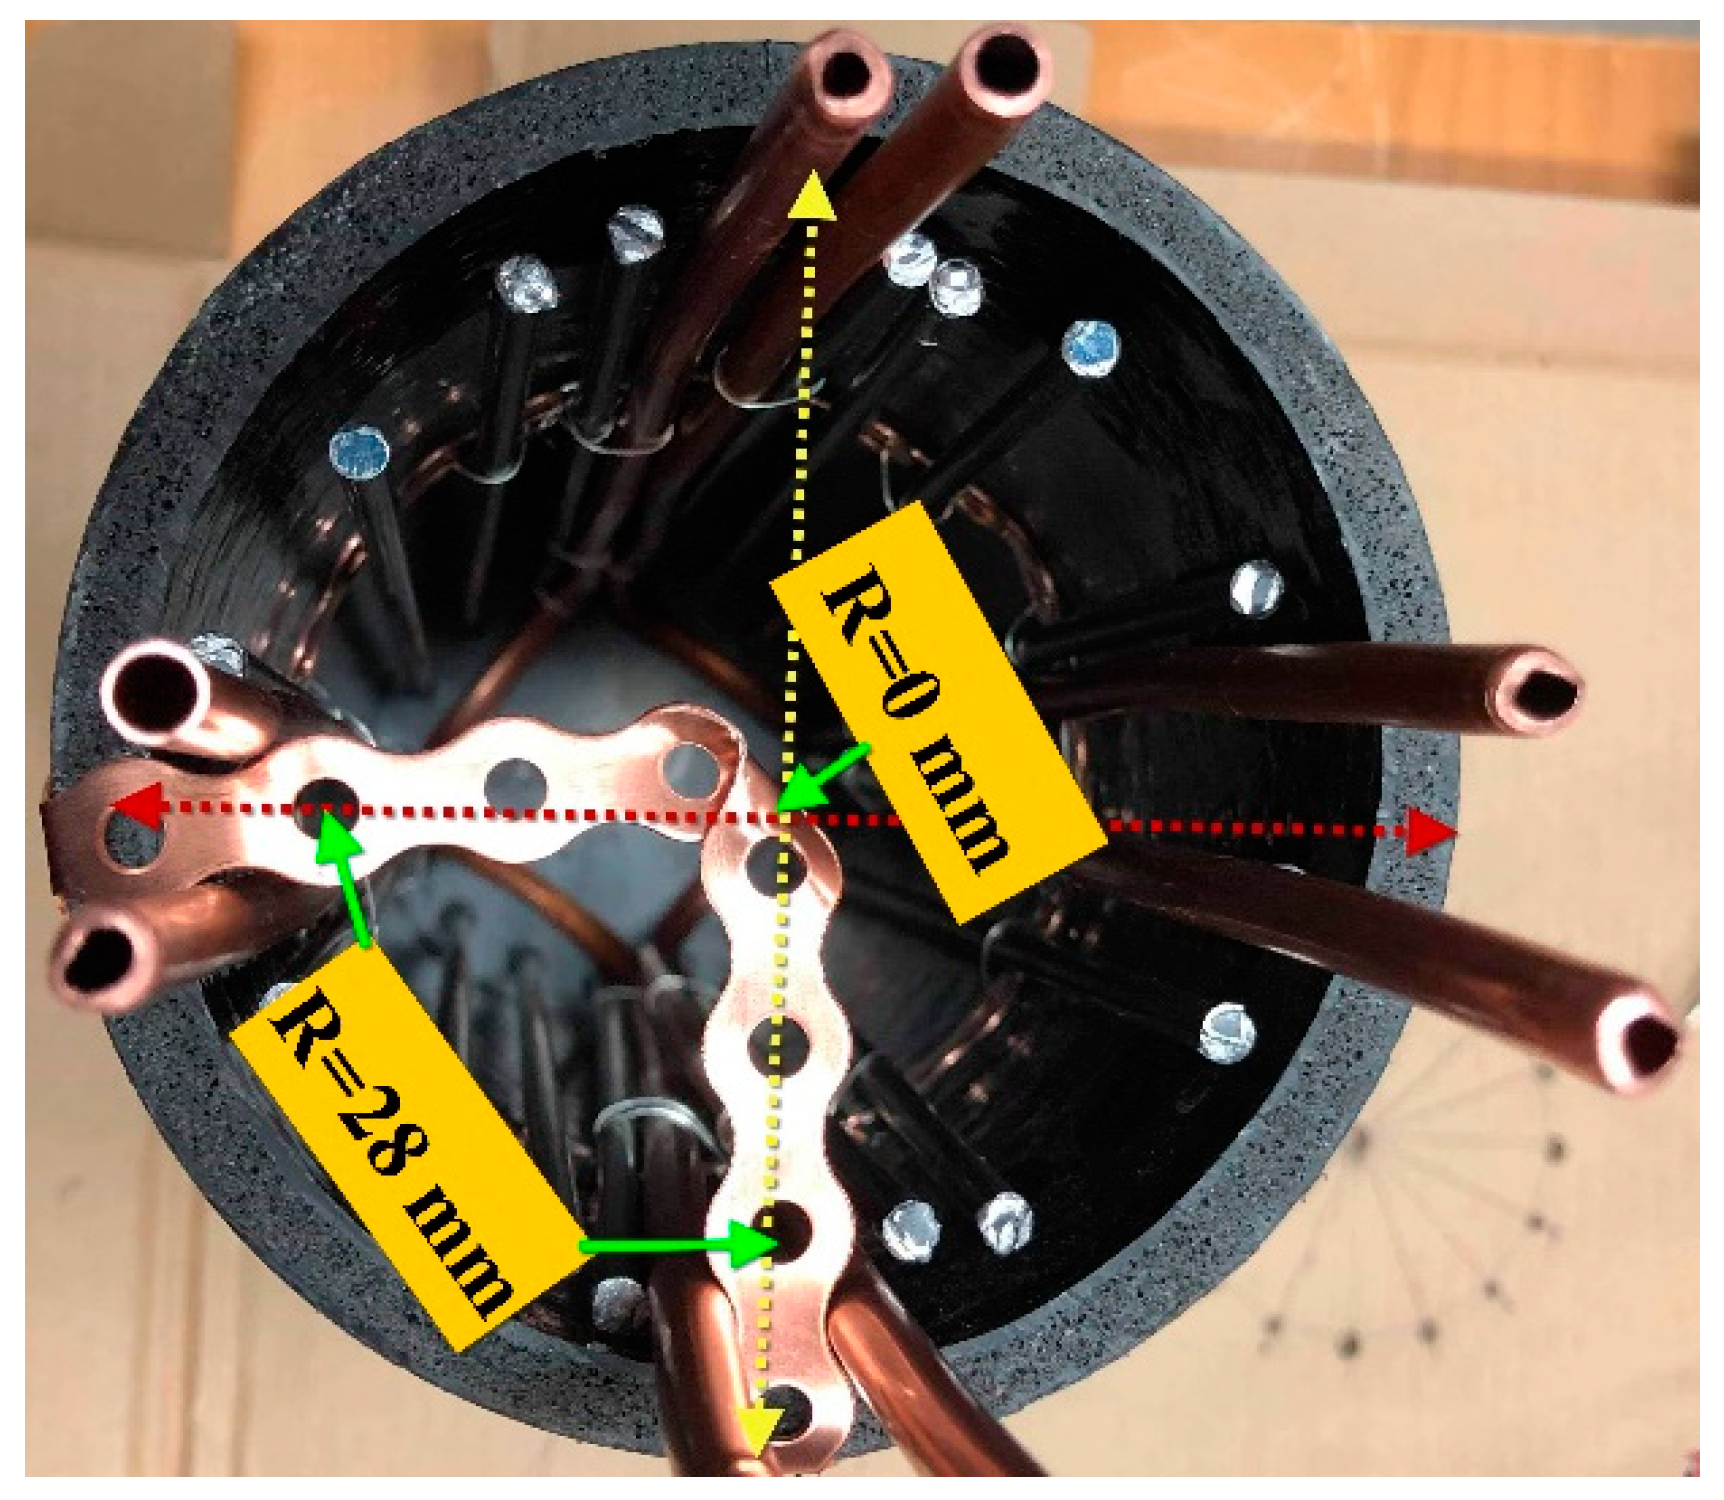
Then thermocouples at different locations were placed inside each sample.it was expected that the mode is quarter symmetric across the red and yellow lines, as in Figure 4. Thus, thermocouples were located along these lines to measure the temperature distribution. These thermocouples were in the middle of each sample (15 cm). Thermocouples Th1, Th2, and Th3 were located at a radius of 0, 2.8, and 2.8 cm, respectively.
A concrete mixture of water per cement ratio (W/C) equals 0.5 was used to fill the two molds. After a solidification period of one week, both models were ready for testing. Clear Polyvinyl chloride (PVC) tubes were used to connect the U-tubes legs with the water-bath, valve, and flowmeter as in Figure 5a. Heavy-duty construction cardboard with a diameter and length of 20 and 40 cm, respectively, was used to surround the sample and a foam insulation layer of 5 cm thickness as in Figure 5b.
2.2. Experimental Procedure
The main objective of the present study is to investigate the effect of PCM containers on the performance of energy piles. To simulate the average underground temperature corresponding to that of Ontario, Canada—which is 8–10 ℃ [51]—the concrete pile samples were nearly at ambient temperature (20 °C ± 2 °C), then were cooled to the desired initial temperature by using a cold water stream from the water-bath, which passed through the HEX tubes. The average temperature distribution inside the concrete cylinder at the end of the precooling process was 8.7 °C.
After a precooling procedure was completed, the charging process was started. The required maximum temperature was 35 ℃. That value was used to study the potential of coupling the GSHP with solar collectors at the regions with a dominant heating load. The water bath delivers a realistic simulation of the real process of charging and discharging the underground soil, since the coupled HP outlet temperature at the beginning of the summer period increases gradually. Furthermore, if the GSHP was connected to solar collector panels, the collector output temperature would increase gradually during the day to reach the maximum value, then cool down during the night.
The charging procedure lasted 1.5 h and the cooling procedure was initiated immediately by decreasing the set-point from 35 to 6 . Although the heating response of the water bath was higher than its cooling response, both processes lasted for the same period (1.5 h.).
In real GSHP systems, one ton of refrigeration requires a flow rate of 3 gallons per minute (3.78 L per minute) [52]. A simplified similarity calculation was based on having the same Reynolds number inside the industrial tube with a diameter of 3.4 cm, and a scaled tube with a diameter of 0.425 cm. The final calculated experimental flow rate was 1471 mL/min.
3. Uncertainty Analysis
To evaluate the random errors associated with each thermocouple used to measure the temperature distribution inside the concrete samples, the experimental procedure at a flow rate of 147 mL/min was performed three times with the same conditions. The thermocouples were of type K with a systematic error percentage of 0.75. The calculation of the random errors was performed using the Taylor method [53] as follows:
If y1, y2, ………, yN indicate Z separate measurements of one quantity y, then we can define:
The associated random error equals , while the combined errors equal the summation of systematic errors and random errors.
The maximum uncertainty value for each different thermocouple was calculated as in Table 3.
For the propagation calculation of uncertainty associated with the heat transfer rate value, the Taylor method [53] has been used:
where δq defines the uncertainty value in the heat transfer rate, ΔT defines the temperature difference, and Q defines the water flow rate. The flowmeter accuracy was ± 6%, and the total calculated uncertainty was 11%.
4. Numerical Model Description
The COMSOL Multiphysics (version 5.2a by COMSOL AB company, Sweden) finite element method [54] was used to obtain the numerical predictions. The two COMSOL physics models used were (1) heat transfer in solids and (2) heat transfer in pipes. The PCM containers were included inside the first physics model. The experimental results were then compared with the numerical predictions.
4.1. Governing Equations
A 3-D numerical model was developed using the COMSOL Multiphysics finite element method for the experimental samples. Four U-tubes HEX was inserted inside the concrete, where the 4 U-tubes HEX had outer and inner diameters of 6.35 mm and 4.35 mm, respectively. Figure 6a presents the main layers which have been placed to mimic the material surrounding the U-tubes. The layers consist of heavy-duty cardboard, concrete material, foam insulation, and a PVC material. Table 4 provides the properties of each layer. Tetrahedral mesh elements were used to describe the numerical domain, as shown in Figure 6b.
Using the transient state heat transfer assumption and both the laminar and turbulent flow behavior assumption, a governing equations system that describes the fluid flow through the U-tube HEX and the heat transfer was obtained. The current model contains an interaction between the fluid flow heat transfer (e.g., water inside HEX) and the energy transfer and storage in the solid domains. The equations system is as follows:
Conservation equations of solid domains:
The Nusselt number is obtained inside the U-tube HEX by the following equations [55] for the laminar and turbulent flow behavior:
where is solid layers density, define the heat capacity, T defines the temperature, is the solid’s thermal conductivity, define Reynolds number, Pr is the Prandtl Number, Nusselt number, and the constant n is given to be 0.4 and 0.3 for cooling and heating, respectively.
Heat transfer in tubes model:
where is the liquid’s density, U (u, v, w) define the field vector of velocity, is the liquid’s specific heat, is the liquid’s thermal conductivity, defines the factor of friction inside the heat exchanger tubes, and A defines HEX tube’s area. The convergence criterion for the velocity and temperature at each iteration is set as follows:
where F represents one of the equation’s unknowns u, v, w, or T, b is the iteration number, (i, j) is the grid’s coordinates. The solution converges if the value of R is below 1 × 10⁻⁶ in two consecutives iterations for each unknown.
4.2. Initial and Boundary Conditions
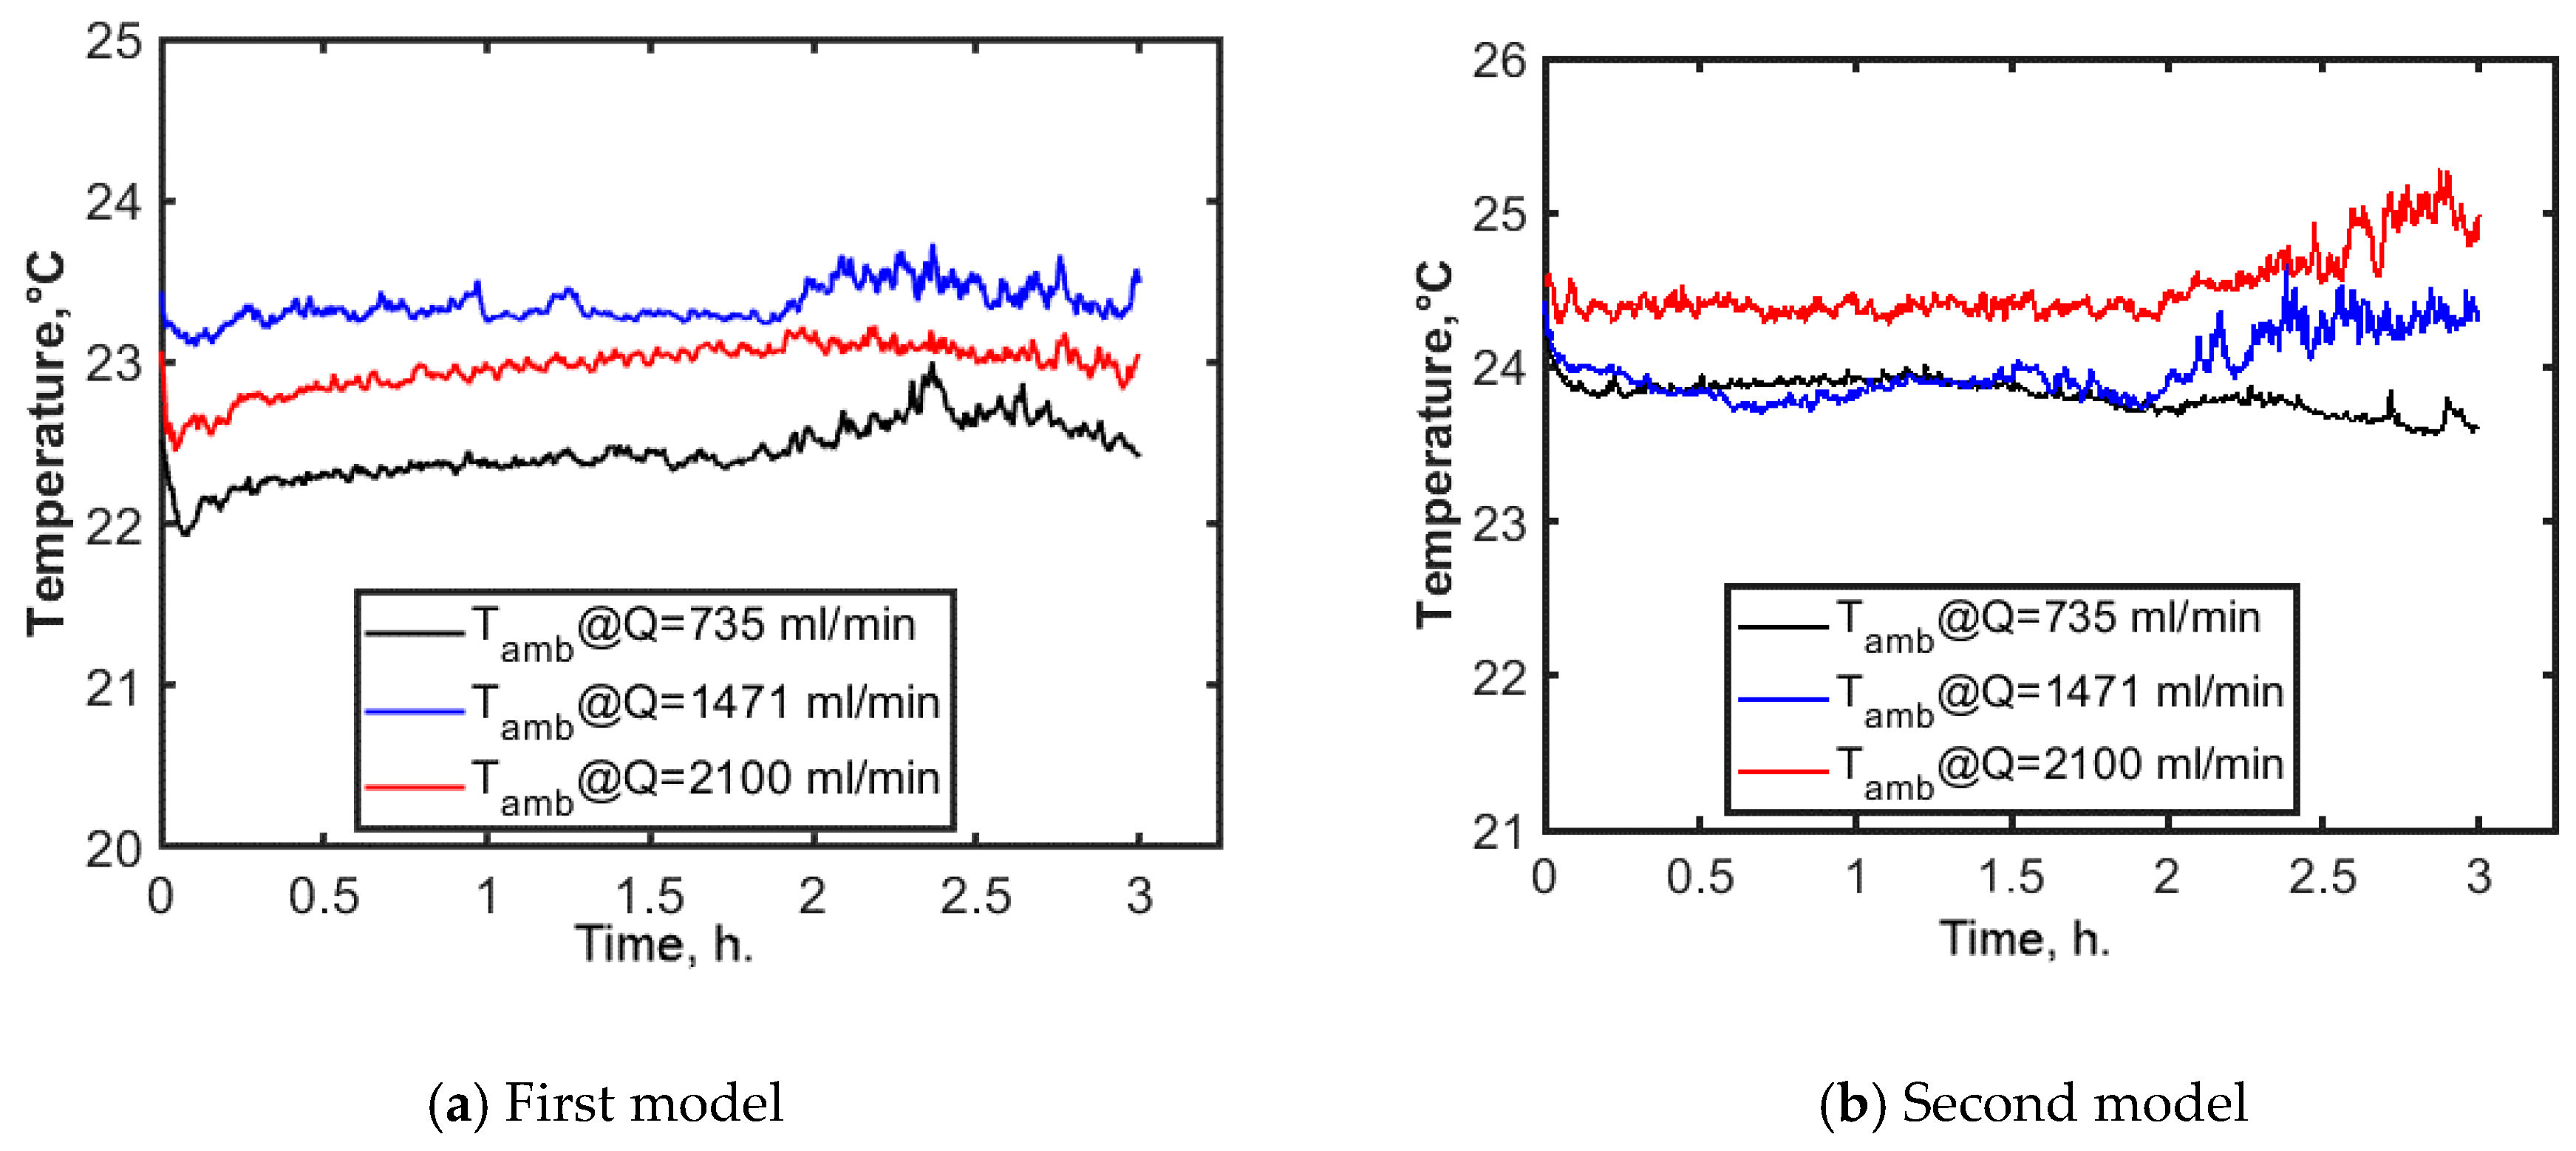
The final temperature distribution inside the concrete best at the end of the precooling process was 8.7 °C. The temperature profile of inlet water for the first model was nearly the same as shown in Figure 7a, but there were small variations of the second model inlet temperature profile as in Figure 7b. The profile of ambient temperature for first model experiments was as in Figure 8a, with an average temperature of 22.5 ± 0.5 °C. That of the second model is shown in Figure 8b, which shows an average temperature of 24 ± 1 °C. The exact temperature profiles of all the previous conditions have been used in the numerical model of each case.
4.3. Mesh Independence Analysis
The current study used a tetrahedral mesh element for describing the numerical domains. To inspect the sensitivity of the grid, the outlet water’s maximum temperature was investigated at the outlet surface of the HEX legs with different values of domain mesh elements. Figure 9 shows the variation of the maximum outlet temperature with the number of elements used, the maximum number of used mesh elements was 1.5 × 10⁵, while the maximum error variation was 0.015. The current study used the aforementioned maximum number of mesh elements.
5. Results and Discussion
5.1. Outlet Water Temperature Profile
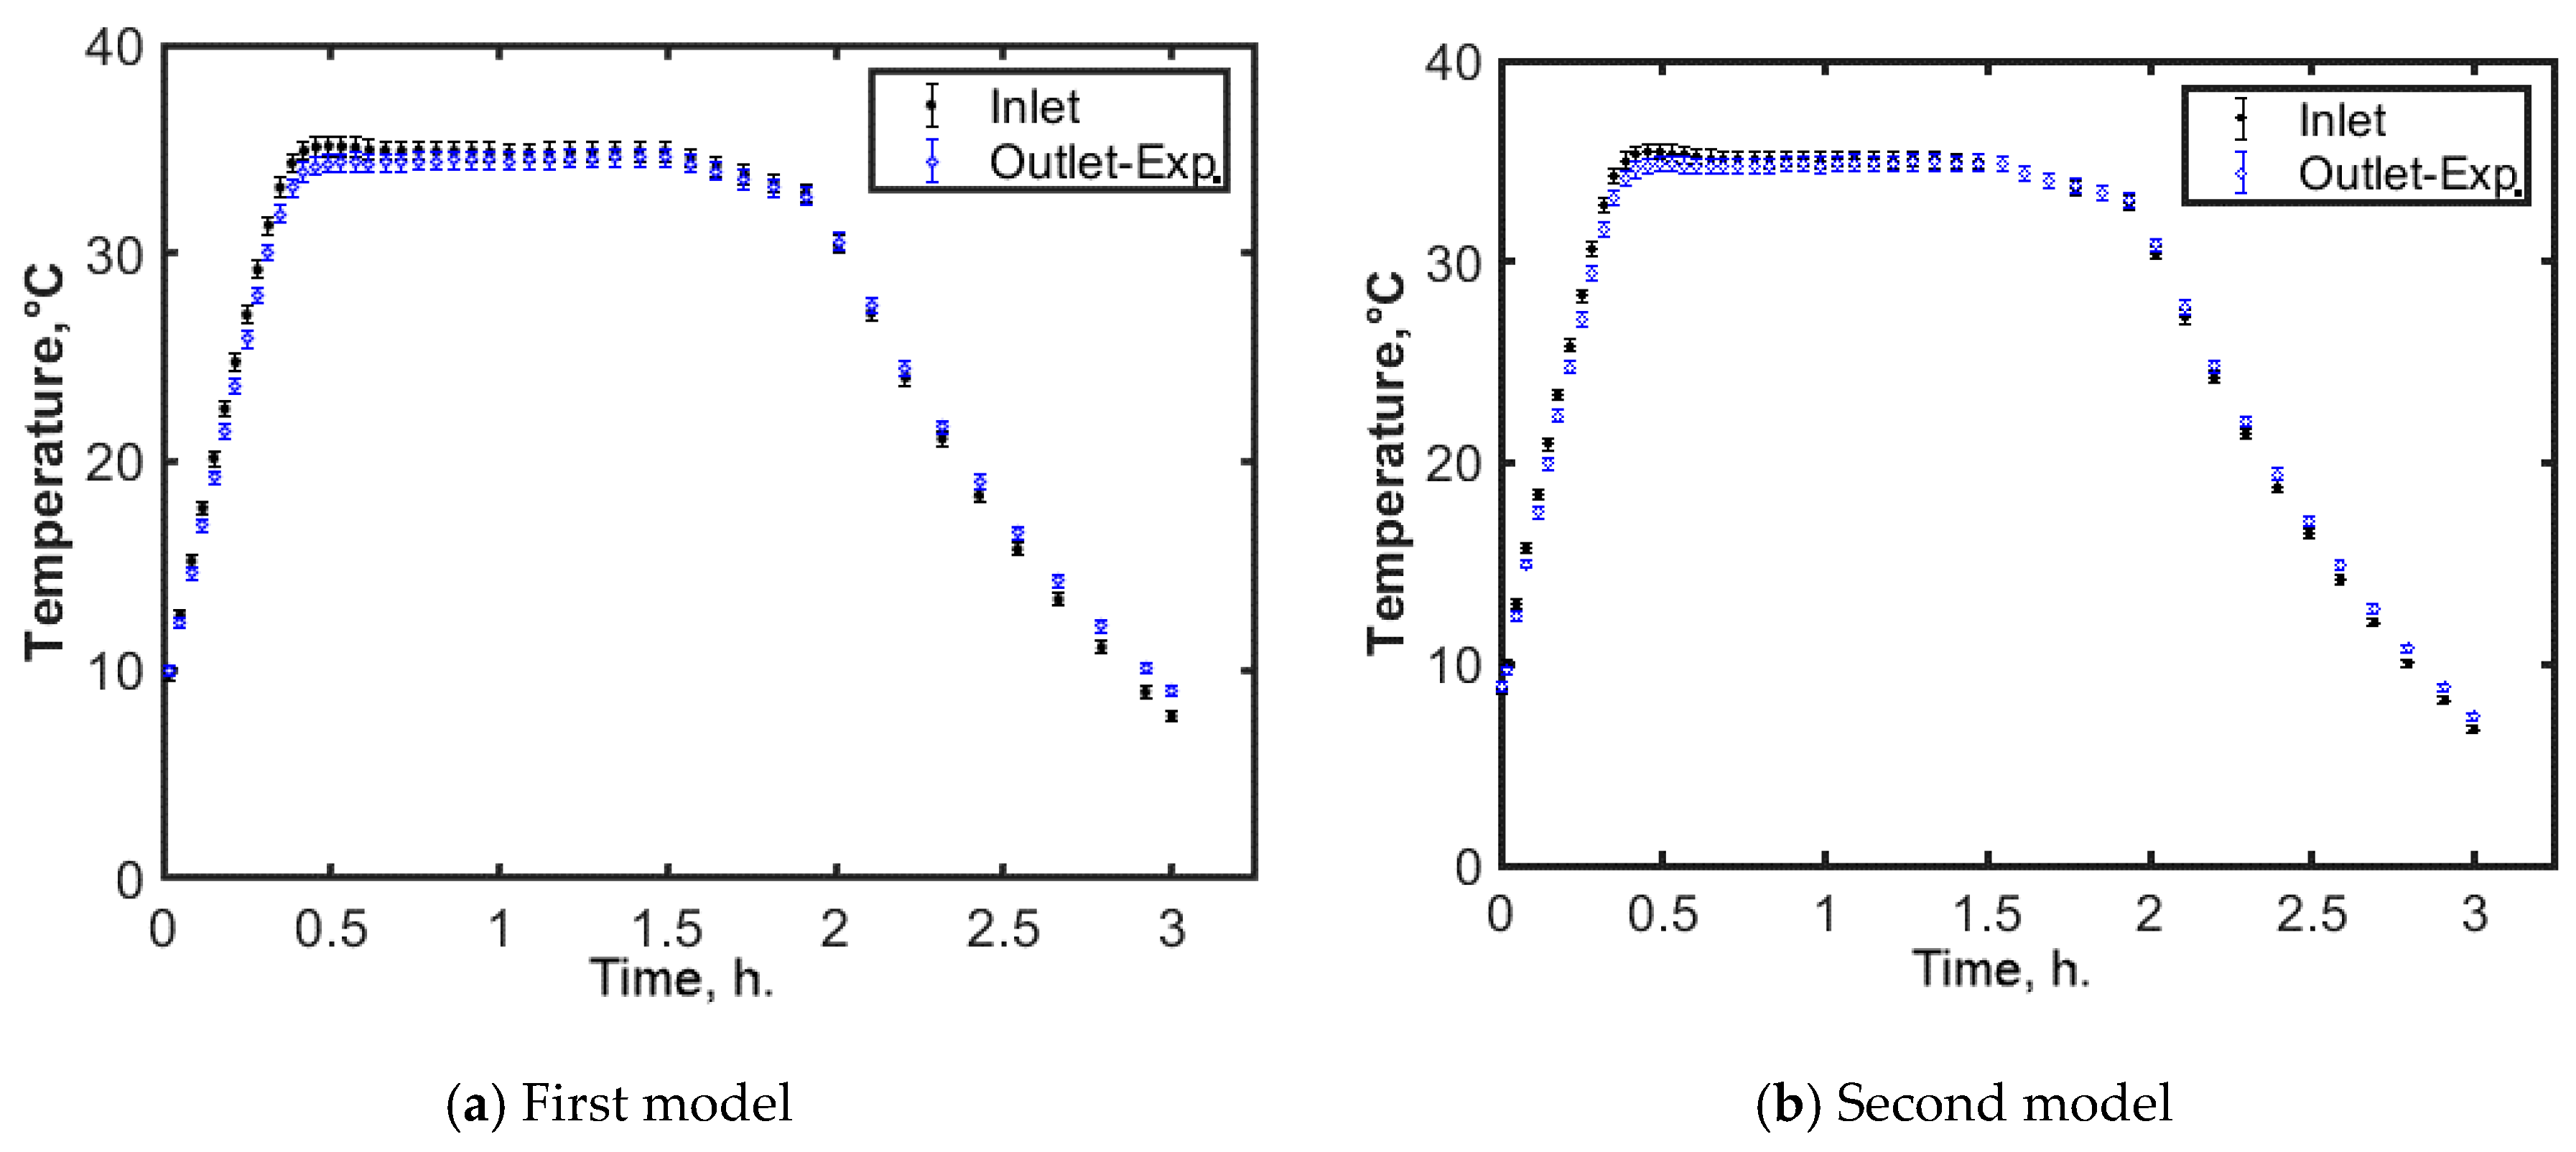
Figure 10 shows the experiment inlet and outlet water temperature profiles for both models. The charging process was initiated directly after the precooling process at which the inlet water temperature was nearly 8.7 °C. The figure shows that the inlet temperature increased gradually until it reached the water-bath set point 35 °C. The outlet water temperature profile followed the same trend of the inlet profile with a small temperature difference. This difference was caused by the heat transfer to the energy piles models. After 1.5 h., the charging process was discontinued and the discharging process was initiated instantaneously. The inlet water started to cool down to allow heat transfer from the models to the working fluid, which inverted the temperature differences between inlet temperature profile and the outlet profile.
To validate the numerical predictions, the outlet water temperature profiles obtained by the numerical model and the experimental observation are plotted versus the time, as shown in Figure 11. The figure showed that the numerical predictions and the experimental results were in-line for both models.
5.2. Phase Change Materials Meting and Solidification
Figure 12 shows the temperature profile inside the PCM containers at a depth of 15 mm. Figure 12a shows the experimental PCM temperature profile with its melting temperature range (22–26 °C). PCM temperature started to increase gradually after the beginning of the charging process until it reached its melting temperature range starting point 22 °C. Beyond this temperature, the PCM containers started their melting process at 0.5 h., at which they absorbed the latent heat of fusion. The melting process was completed nearly after 1 h. Then, the temperature started to increase again, which assured that the whole amount of PCM was melted completely. After the discharging process was initiated, the PCM temperature started to decrease gradually, then it started its solidification process at nearly 2.4 h., which lasted for nearly 0.5 h. During the solidification process, the PCM containers released their latent heat, which was then transferred to the working fluid. Figure 12b shows the numerical predictions along with the experimental results. The graph shows that the numerical temperature profile was in good agreement with the same experimental trend. However, the numerical predictions does not show a constant temperature period during the solidification.
5.3. Effect of the PCM on the Concrete’s Temperature Distributions
Figure 13 shows the temperature distribution inside both models at different locations during charging process and discharging process. Figure 13a shows the temperature distribution at the center of both samples (radius = 0 mm) and in the middle of the sample’s depth (l = 15 mm). The graph shows that the difference between both samples is small, and the temperature slope of the PCM plot has a smaller increase in temperature than that of the base sample plot during the first hour of the experiment. However, this difference has vanished after the effect of PCM melting reached the center of the sample. Although the discharging process was initiated after 1.5 h, the temperature of the model’s center continued to increase beyond this point due to the transient conduction effect.
Figure 13c shows the temperature profile at a radius of 28 mm and 150 mm depth for each sample during the charging process. The red lines indicate the PCM melting process period. The concrete’s temperature started to increase gradually for both samples. However, the temperature profile of the PCM sample showed a slower increase in temperature than that of the first model. This could be explained as the PCM model distributes the working fluid’s heat energy not only to the concrete, but also to the PCM containers. These containers started melting when its temperature reached the melting range, which slowed down the temperature increase of the energy piles surfaces, as could be seen during the period of 0.5–1 h. Since the melting process requires a large amount of heat equal to the latent heat of PCM (100 kJ/kg), this process occurs within the melting range of the PCM temperature, which means a sudden discontinuity of the surrounding concrete temperature.
After the discharging process was started, the concrete’s temperature started to decrease allowing the heat transfer from the concrete to the HEX working fluid. The same trend of the charging process was repeated during the discharging where the first sample’s temperature decreased faster than that of the PCM sample, as shown in Figure 13c. This is a result of the heat energy stored inside the PCM containers beginning to be released again, allowing the solidification process to occur.
5.4. Thermal Maps
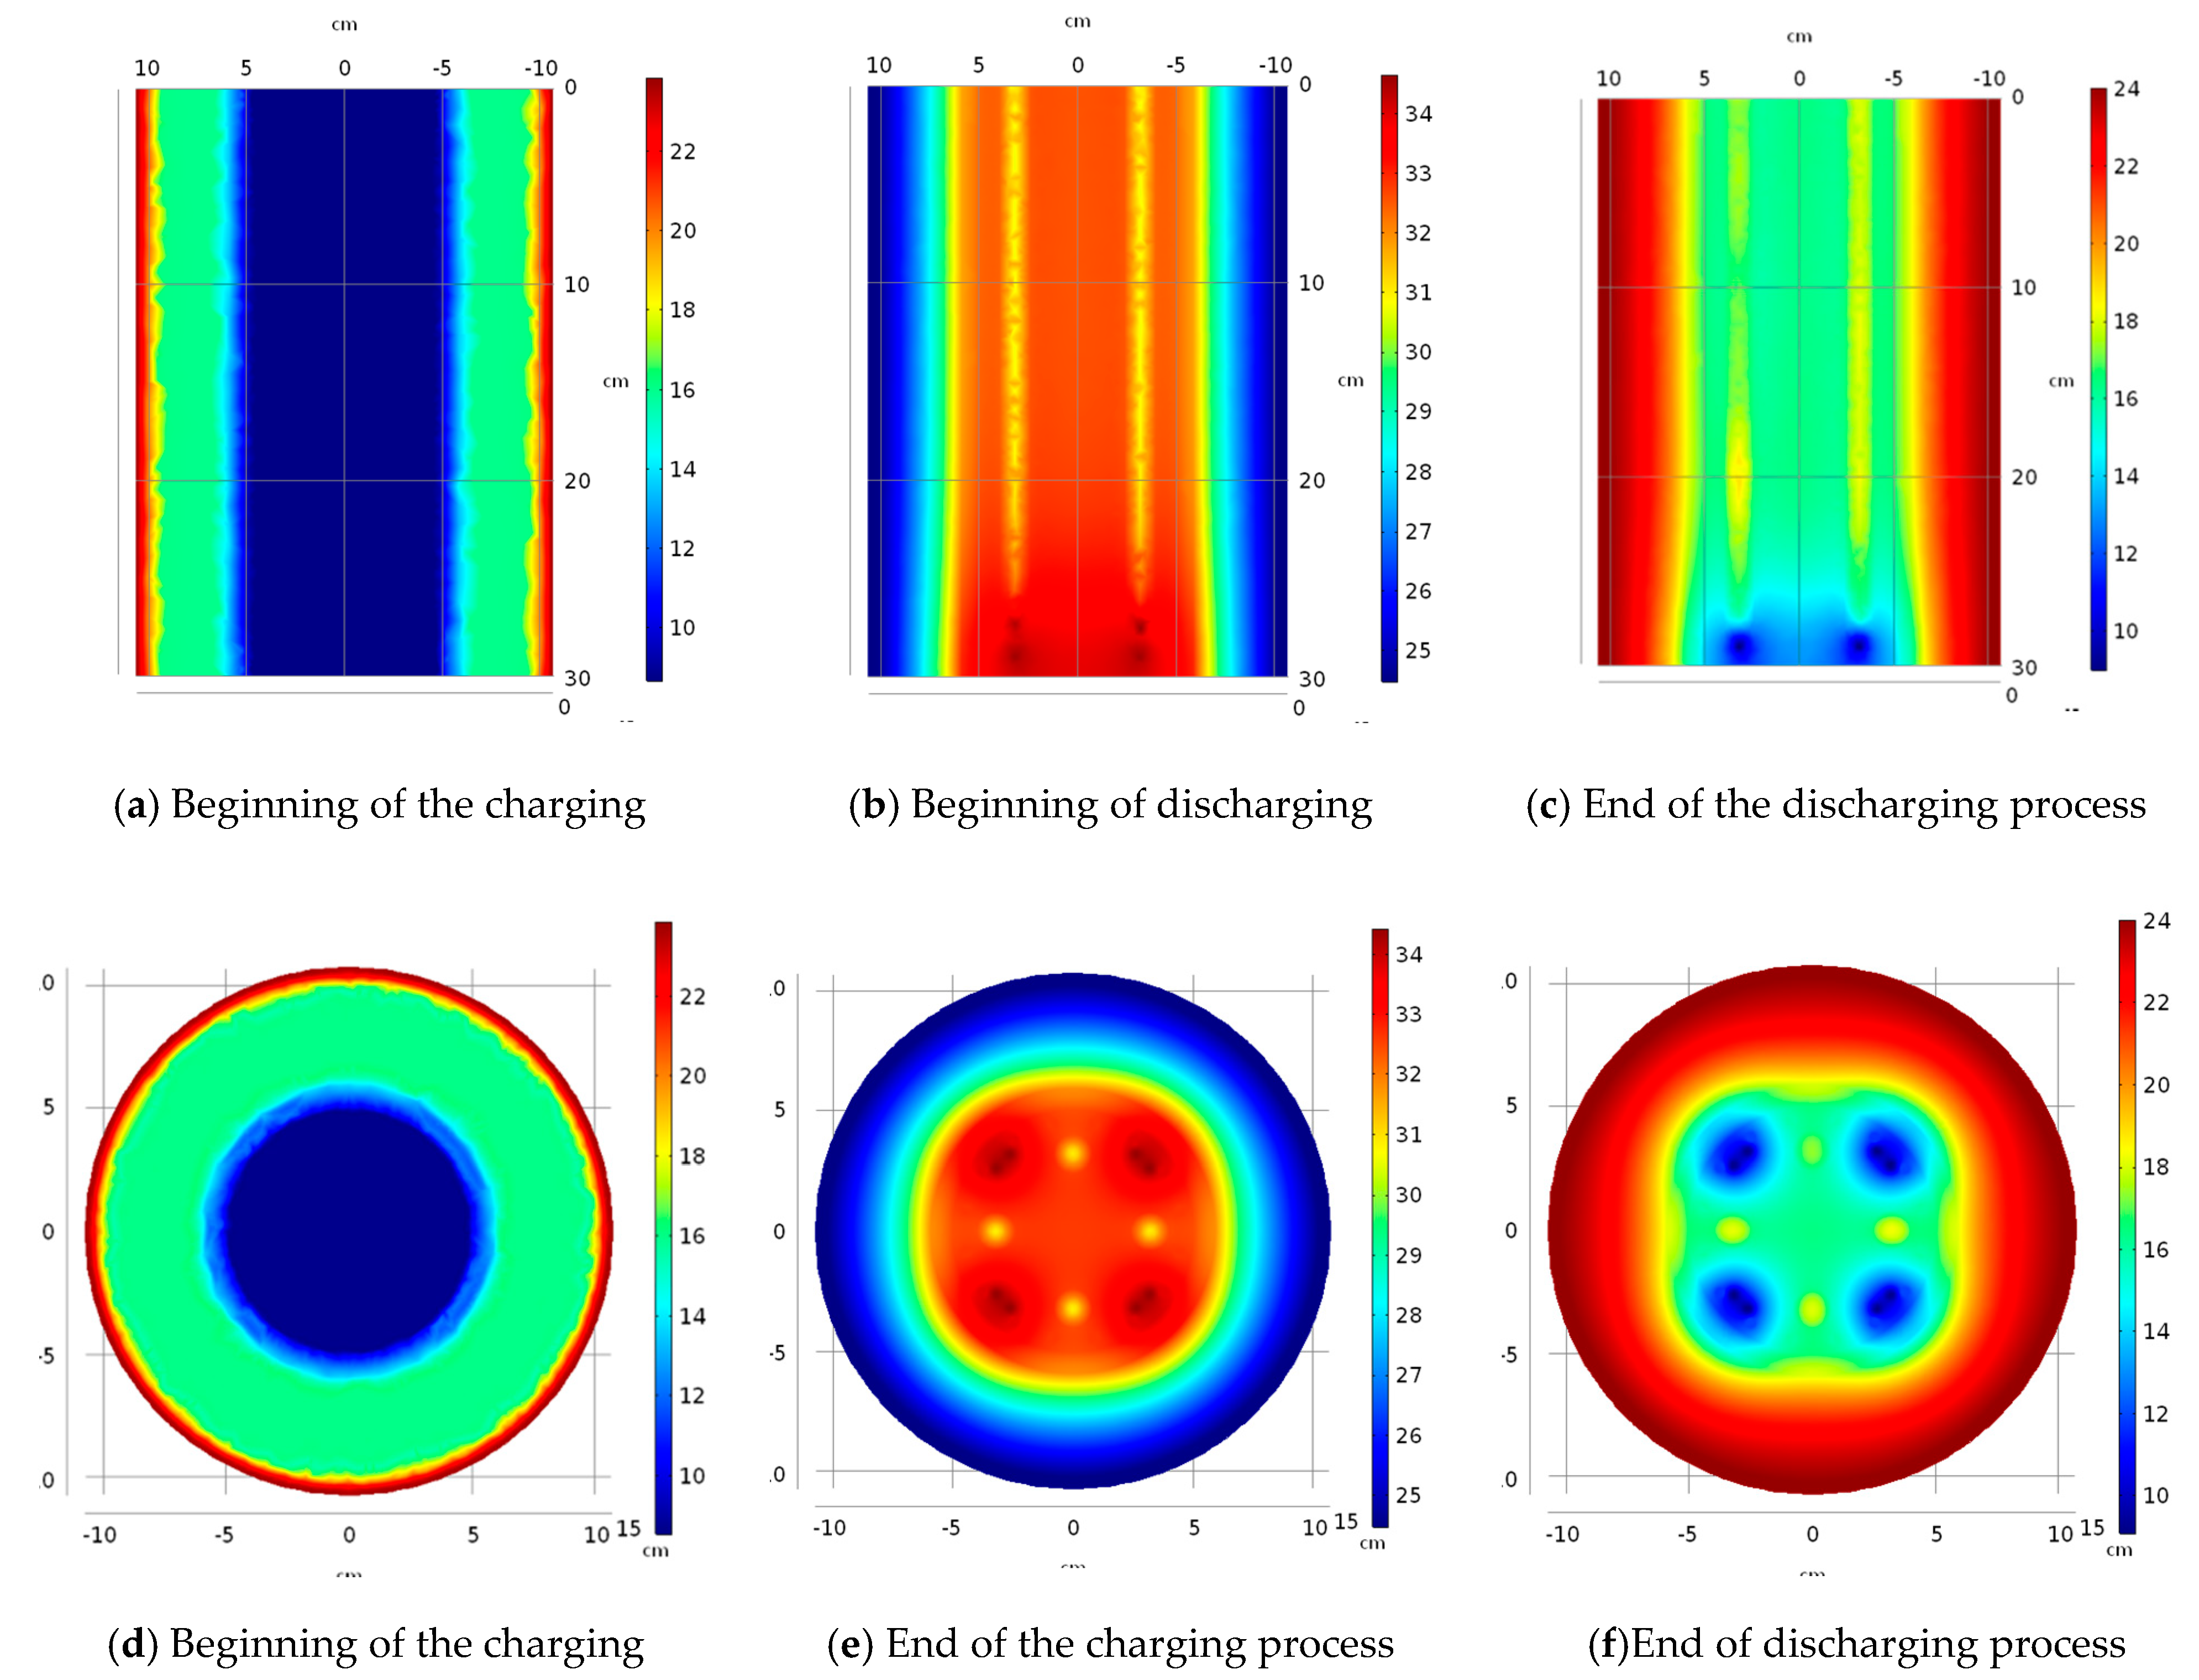
Figure 14 describes the thermal map for a chosen sections inside the second model where the vertical plane was at 0 mm radius, and the horizontal plane was at a depth of 15 cm. The figure shows the numerical temperature distribution inside the model at the beginning and the end of each process. Figure 14a,d show that the concrete pile and the PCM containers were at a uniform temperature of 8.7 °C at the beginning of the charging process while the PVC tube, foam insulation, and the heavy-duty cardboard were at a higher temperature. After the charging process was initiated the heat energy was transferred from the HEX fluid to the concrete and then to the PCM tubes, which increased the PCM temperature and initiated its melting process, as shown in Figure 14b,e. These figures assure the complete melting of the PCM containers as it indicates that the container’s temperature is more than 30 °C.
Finally, Figure 14c,f show that the upper internal layers of the PCM were just below the melting temperature range. This indicates that not all the sensible heat added during the charging process was extracted from the PCM containers. The same is true for the concrete cylinder and the insulation layers, which will be explained in the storage capacity section.
5.5. Effect of Different Flow Rates
To investigate the effect of the flow rate on the performance of the energy piles, the same experiment was conducted for three different flow rates. The flow rate of 1471 mL/min was used as a base flow rate to simulate the actual Reynolds number inside the real GHE. Moreover, the influence of the flow rate was examined by using half and double the base flow rate, 735 mL/min and 2942 mL/min, respectively. However, the max flow that the water-bath could deliver was 2100 mL/min which replaced the desired 2942 mL/min.
Figure 15 represents the effect of the flow rate on the heat transfer rate between the HEX tubes and the concrete domain. Figure 15a shows the wall heat transfer of the HEX tubes inside the first model during the charging and discharging. It is clear that the higher flow rate increased the heat transfer rate during both processes due to the enhancement of the internals’ heat transfer coefficient of the tubes. While Figure 15b shows that when the flow rate was increasing, the temperature difference between the inlet temperature and outlet temperature was decreasing, as the percentage increase in the heat transfer rate was less than the percentage increase in the flow rate amount.
5.6. Effect of PCM on Energy Storage Capacity
Figure 16 describes the effect of flow rate along with the presence of PCM containers on the storage capacity of the PCM model. Figure 16a represents the change of the heat rejection amount during the charging process. The graph depicts that the increase in the flow rate has a small effect on the heat rejection amount, while it shows that the PCM containers increased the heat rejection by nearly 70% of the original values since the PCM absorbed a high amount of energy during the charging process, not only as latent heat but also as sensible heat. Figure 16b shows that the amount of heat extracted was affected by the flow rate. However, the effect of the PCM was higher than that of the flow rate.
Figure 17 shows the effect of PCM on the HEX tubes wall heat transfer rate at different flow rates during both charging process and discharging process. Figure 17a shows that effect at a flow rate of 735 mL/min, and Figure 17 b at a flow rate of 1471 mL/min. The graphs showed that the heat transfer rate of the second model appears to follow that of the first model with a small increase until the PCM containers melting process was activated at 0.5 h., then the heat transfer rate started to become more than that of the first model. The same trend could be seen during the discharging process, at which the solidification process was initiated nearly at 2.4 h. from the start of the experiment.
Table 5 summarizes the final numerical results of both models during charging and discharging process for each flow rate examined where the reference temperature is 20 °C. The results show that increasing the HEX flow rate increased both the total amount of heat stored or extracted for each model and the storage efficiency (the ratio between the amount of energy stored to the amount of energy extracted from the sample). For a flow rate of 735, 1471, 2100 mL/ min, the storage efficiency was 75%, 76%, and 82%, respectively for the first model, and 80%, 84%, and 93%, respectively, for the second model. The presence of the PCM containers increased the total amount of heat stored by 12.2, 12.3, and 12.4 kJ/kg of concrete, respectively, for the studied flow rates. While for the same flow rates, it increased the total amount of heat extracted by 10.5, 11.7, 13.3 kJ/kg, respectively.
6. Conclusions
Two lab-scaled energy piles models with a diameter of 10 cm and a height of 30 cm were designed and a 4 U-tube HEX was placed inside each model, to investigate the effect of phase change materials along with the different flow rates inside the HEX tubes on the performance of the energy piles models experimentally and numerically. The study used four PCM tube containers each with a diameter of 16 mm. This was conducted on flow rates of 735, 1471, and 2100 mL/min. The following points summarize the main findings of the study:
- The numerical predictions of both models showed a good agreement with the experimental measurements, in terms of the concrete’s thermal response and the outlet water temperatures.
- The presence of the macro-encapsulated PCM decreased the temperature increase and decrease slope during the charging and discharging processes, respectively, of the second model than that of the first model, which would enhance the heat transfer from the HEX tubes to the concrete then to the underground soil during charging, and vice versa during the discharging process.
- Increasing the flow rate increased both the amount of heat stored and extracted for each sample, and the storage efficiency. For the flow rate of 735, 1471, and 2100 mL/min, the heat rejection to the first model was 16.5, 16.8, and 17.1 kJ/ kg of the concrete weight, respectively, and the heat rejection for the PCM model was 28.7, 29.2 and 29.5 kJ/kg for the same flow rates. The heat extraction from the first model at the aforementioned flow rates was 12.5, 12.9, 14.1 kJ/kg, respectively, and heat extraction from the second model was 23, 24.7, and 27.4 kJ/kg.
- The presence of PCM increased the amount of heat stored and extracted for the same flow rate, as well as storage efficiency. For the flow rate of 735 mL/min the storage efficiency increased from 75% to 80%; for 1471 mL/min the storage efficiency increased from 76% to 84%; and for 2100 mL/min it increased from 82% to 98%.
7. Future Work
The real borehole depth is much longer than the previous sample, which will affect the temperature difference between the inlet and outlet flow. Furthermore, the underground soil was replaced with three layers of insulation to study the effect of PCM on the thermal behavior of the concrete pile, along with the charging and discharging capacity. Some of our future work is to examine the same samples without the insulation layers inside real soil and to use a longer sample depth. The validated numerical model will be used to optimize the PCM volume, location, and melting temperature for the new sample’s designs.
Author Contributions
Conceptualization, M.M.M., A.M.B.; methodology, M.M.M., A.M.B., M.Z.S.; software, M.M.M., A.M.B.; validation, M.M.M., A.M.B.; formal analysis, M.M.M. and A.M.B.; investigation, M.M.M., A.M.B., M.Z.S.; resources, M.Z.S.; data curation, M.M.M., A.M.B., M.Z.S., writing—original draft preparation, M.M.M.; writing—review and editing, A.M.B., M.Z.S.; visualization, M.M.M.; supervision, A.M.B. and M.Z.S.; project administration, M.Z.S.; funding acquisition, M.Z.S. All authors have read and agreed to the published version of the manuscript.
Funding
This research was funded by, NSERC, Ryerson University and Qatar National Research Foundation (NPRP12S-0123-190011).
Acknowledgments
The authors acknowledge the full financial support of the National Science and Engineering Research Council Canada (NSERC), Ryerson University for the financial support and Qatar National Research Foundation Grant number NPRP12S-0123-190011.
Conflicts of Interest
The authors declare no conflict of interest.
Nomenclature
| Nomenclature | Greek symbols | ||
| A | Area (m2) | ρ | Density (kg/m3) |
| Cp | Specific heat (J/kg.°C) | Dynamic viscosity (Pa.s) | |
| d | Diameter (m) | Standard deviation | |
| f | Fanning friction factor | δ | Uncertainty |
| k | Thermal conductivity (W/m.K) | Subscripts | |
| Nu | Nusselt number | s | Solid |
| Pr | Prandtl number | l | Liquid |
| Q | Volumetric flow rate (mL/min) | Abbreviations | |
| q | Heat transfer rate (w) | CFD | Computational fluid dynamics |
| Re | Reynolds number | COP | Coefficient of performance |
| T | Temperature () | Exp | Experimental |
| t | Time (s) | GHG | Greenhouse gases |
| U | Velocity fields vector (m/s) | GSHP | Ground source heat pump |
| V | Average velocity (m/s) | HDPE | High-density polyethylene |
| Best value | HEX | Heat exchanger | |
| Num | Numerical | HP | Heat pump |
| PCM | Phase change materials | PVC | Polyvinyl chloride |
References
- Mustafa Omer, A. Ground-source heat pumps systems and applications. Renew. Sustain. Energy Rev. 2008, 12, 344–371. [Google Scholar] [CrossRef]
- Ozyurt, O.; Ekinci, D.A. Experimental study of vertical ground-source heat pump performance evaluation for cold climate in Turkey. Appl. Energy 2011, 88, 1257–1265. [Google Scholar] [CrossRef]
- Bayer, P.; Saner, D.; Bolay, S.; Rybach, L.; Blum, P. Greenhouse gas emission savings of ground source heat pump systems in Europe: A review. Renew. Sustain. Energy Rev. 2012, 16, 1256–1267. [Google Scholar] [CrossRef]
- Deng, Y.; Feng, Z.; Fang, J.; Cao, S.J. Impact of ventilation rates on indoor thermal comfort and energy efficiency of ground-source heat pump system. Sustain. Cities Soc. 2018, 37, 154–163. [Google Scholar] [CrossRef]
- Rybach, L.; Eugster, W.J. Sustainability aspects of geothermal heat pump operation, with experience from Switzerland. Geothermics 2010, 39, 365–369. [Google Scholar] [CrossRef]
- Zheng, X. Long-term effects of ground source heat pumps on underground temperature. In Proceedings of the 2013 COMSOL Conference, Newton, MA, USA, 9–11 October 2013. [Google Scholar]
- Hu, S.; Song, W.; Zhang, Y.; Pan, D.; Meng, D. Study of cold/hot stacking problem based on balance storage of ground source heat pump. In Proceedings of the 2010 2nd International Conference on Computer Engineering and Technology, Chengdu, China, 16–18 April 2010. [Google Scholar]
- Ahheng, B.C.; Dunbar, J.; Haufler, T. Impacts and Limitations of Residential Geothermal Heating Systems. Worcester Polytech. Inst. 2011. Available online: https://digitalcommons.wpi.edu/iqp-all/2977/?utm_source=digitalcommons.wpi.edu%2Fiqp-all%2F2977&utm_medium=PDF&utm_campaign=PDFCoverPages (accessed on 18 July 2020).
- Law, Y.L.E.; Dworkin, S.B. Characterization of the effects of borehole configuration and interference with long term ground temperature modelling of ground source heat pumps. Appl. Energy 2016, 179, 1032–1047. [Google Scholar] [CrossRef]
- Fadejev, J.; Kurnitski, J. Geothermal energy piles and boreholes design with heat pump in a whole building simulation software. Energy Build. 2015, 106, 23–34. [Google Scholar] [CrossRef]
- Fadejev, J.; Simson, R.; Kurnitski, J.; Haghighat, F. A review on energy piles design, sizing and modelling. Energy 2017, 122, 390–407. [Google Scholar] [CrossRef]
- Wu, W.; Wang, B.; You, T.; Shi, W.; Li, X. A potential solution for thermal imbalance of ground source heat pump systems in cold regions: Ground source absorption heat pump. Renew. Energy 2013, 59, 39–48. [Google Scholar] [CrossRef]
- Wu, W.; You, T.; Wang, B.; Shi, W.; Li, X. Simulation of a combined heating, cooling and domestic hot water system based on ground source absorption heat pump. Appl. Energy 2014, 126, 113–122. [Google Scholar] [CrossRef]
- Wang, H.; Qi, C. Performance study of underground thermal storage in a solar-ground coupled heat pump system for residential buildings. Energy Build. 2008, 40, 1278–1286. [Google Scholar] [CrossRef]
- Han, Z.; Zheng, M.; Kong, F.; Wang, F.; Li, Z.; Bai, T. Numerical simulation of solar assisted ground-source heat pump heating system with latent heat energy storage in severely cold area. Appl. Therm. Eng. 2008, 28, 1427–1436. [Google Scholar] [CrossRef]
- Wang, X.; Zheng, M.; Zhang, W.; Zhang, S.; Yang, T. Experimental study of a solar-assisted ground-coupled heat pump system with solar seasonal thermal storage in severe cold areas. Energy Build. 2010, 42, 2104–2110. [Google Scholar] [CrossRef]
- Akeiber, H.; Nejat, P.; Majid, M.Z.A.; Wahid, M.A.; Jomehzadeh, F.; Zeynali Famileh, I.; Calautit, J.K.; Hughes, B.R.; Zaki, S.A. A review on phase change material (PCM) for sustainable passive cooling in building envelopes. Renew. Sustain. Energy Rev. 2016, 60, 1470–1497. [Google Scholar] [CrossRef]
- Chandel, S.S.; Agarwal, T. Review of current state of research on energy storage, toxicity, health hazards and commercialization of phase changing materials. Renew. Sustain. Energy Rev. 2017, 67, 581–596. [Google Scholar] [CrossRef]
- Zhou, D.; Zhao, C.Y.; Tian, Y. Review on thermal energy storage with phase change materials (PCMs) in building applications. Appl. Energy 2012, 92, 593–605. [Google Scholar] [CrossRef] [Green Version]
- Anisur, M.R.; Mahfuz, M.H.; Kibria, M.A.; Saidur, R.; Metselaar, I.H.S.C.; Mahlia, T.M.I. Curbing global warming with phase change materials for energy storage. Renew. Sustain. Energy Rev. 2013, 18, 23–30. [Google Scholar] [CrossRef]
- Cao, L.; Su, D.; Tang, Y.; Fang, G.; Tang, F. Properties evaluation and applications of thermal energystorage materials in buildings. Renew. Sustain. Energy Rev. 2015, 48, 500–522. [Google Scholar] [CrossRef]
- Sharma, A.; Tyagi, V.V.; Chen, C.R.; Buddhi, D. Review on thermal energy storage with phase change materials and applications. Renew. Sustain. Energy Rev. 2009, 13, 318–345. [Google Scholar] [CrossRef]
- Soares, N.; Costa, J.J.; Gaspar, A.R.; Santos, P. Review of passive PCM latent heat thermal energy storage systems towards buildings’ energy efficiency. Energy Build. 2013, 59, 82–103. [Google Scholar] [CrossRef]
- Paris, J.; Falardeau, M.; Villeneuve, C. Thermal storage by latent heat: A viable option for energy conservation in buildings. Energy Sources 1993, 15, 85–93. [Google Scholar] [CrossRef]
- Liu, Z.; Yu, Z.; Yang, T.; Qin, D.; Li, S.; Zhang, G.; Haghighat, F.; Joybari, M.M. A review on macro-encapsulated phase change material for building envelope applications. Build. Environ. 2018, 144, 281–294. [Google Scholar] [CrossRef]
- Abhat, A. Low temperature latent heat thermal energy storage: Heat storage materials. Sol. Energy 1983, 30, 313–332. [Google Scholar] [CrossRef]
- Memon, S.A. Phase change materials integrated in building walls: A state of the art review. Renew. Sustain. Energy Rev. 2014, 31, 870–906. [Google Scholar] [CrossRef]
- Waqas, A.; Ud Din, Z. Phase change material (PCM) storage for free cooling of buildings—A review. Renew. Sustain. Energy Rev. 2013, 18, 607–625. [Google Scholar] [CrossRef]
- Kuznik, F.; David, D.; Johannes, K.; Roux, J.J. A review on phase change materials integrated in building walls. Renew. Sustain. Energy Rev. 2011, 15, 379–391. [Google Scholar] [CrossRef] [Green Version]
- Khudhair, A.M.; Farid, M.M. A review on energy conservation in building applications with thermal storage by latent heat using phase change materials. Energy Convers. Manag. 2004, 45, 263–275. [Google Scholar] [CrossRef]
- Konuklu, Y.; Ostry, M.; Paksoy, H.O.; Charvat, P. Review on using microencapsulated phase change materials (PCM) in building applications. Energy Build. 2015, 106, 134–155. [Google Scholar] [CrossRef]
- Wahid, M.A.; Hosseini, S.E.; Hussen, H.M.; Akeiber, H.J.; Saud, S.N.; Mohammad, A.T. An overview of phase change materials for construction architecture thermal management in hot and dry climate region. Appl. Therm. Eng. 2017, 112, 1240–1259. [Google Scholar] [CrossRef]
- Salunkhe, P.B.; Shembekar, P.S. A review on effect of phase change material encapsulation on the thermal performance of a system. Renew. Sustain. Energy Rev. 2012, 16, 5603–5616. [Google Scholar] [CrossRef]
- Sari, A. Form-stable paraffin/high density polyethylene composites as solid-liquid phase change material for thermal energy storage: Preparation and thermal properties. Energy Convers. Manag. 2004, 45, 2033–2042. [Google Scholar] [CrossRef]
- Xiao, M.; Feng, B.; Gong, K. Preparation and performance of shape stabilized phase change thermal storage materials with high thermal conductivity. Energy Convers. Manag. 2002, 43, 103–108. [Google Scholar] [CrossRef]
- Medina, M.A.; King, J.B.; Zhang, M. On the heat transfer rate reduction of structural insulated panels (SIPs) outfitted with phase change materials (PCMs). Energy 2008, 33, 667–678. [Google Scholar] [CrossRef]
- Voelker, C.; Kornadt, O.; Ostry, M. Temperature reduction due to the application of phase change materials. Energy Build. 2008, 40, 937–944. [Google Scholar] [CrossRef] [Green Version]
- Zhang, M.; Medina, M.A.; King, J.B. Development of a thermally enhanced frame wall with phase-change materials for on-peak air conditioning demand reduction and energy savings in residential buildings. Int. J. Energy Res. 2005, 29, 795–809. [Google Scholar] [CrossRef]
- Güçeri, S.I.; Faunce, S.F. Modeling of a thermal wall panel using phase change materials. Energy 1979, 4, 695–699. [Google Scholar] [CrossRef]
- Memon, S.A.; Cui, H.Z.; Zhang, H.; Xing, F. Utilization of macro encapsulated phase change materials for the development of thermal energy storage and structural lightweight aggregate concrete. Appl. Energy 2015, 139, 43–55. [Google Scholar] [CrossRef]
- Ye, H.; Long, L.; Zhang, H.; Zou, R. The performance evaluation of shape-stabilized phase change materials in building applications using energy saving index. Appl. Energy 2014, 113, 1118–1126. [Google Scholar] [CrossRef]
- Kong, X.; Lu, S.; Li, Y.; Huang, J.; Liu, S. Numerical study on the thermal performance of building wall and roof incorporating phase change material panel for passive cooling application. Energy Build. 2014, 81, 404–415. [Google Scholar] [CrossRef]
- Biswas, K.; Abhari, R. Low-cost phase change material as an energy storage medium in building envelopes: Experimental and numerical analyses. Energy Convers. Manag. 2014, 88, 1020–1031. [Google Scholar] [CrossRef] [Green Version]
- Barreneche, C.; Navarro, L.; de Gracia, A.; Fernández, A.I.; Cabeza, L.F. In situ thermal and acoustic performance and environmental impact of the introduction of a shape-stabilized PCM layer for building applications. Renew. Energy 2016, 85, 281–286. [Google Scholar] [CrossRef] [Green Version]
- Sage-Lauck, J.S.; Sailor, D.J. Evaluation of phase change materials for improving thermal comfort in a super-insulated residential building. Energy Build. 2014, 79, 32–40. [Google Scholar] [CrossRef]
- Biswas, K.; Lu, J.; Soroushian, P.; Shrestha, S. Combined experimental and numerical evaluation of a prototype nano-PCM enhanced wallboard. Appl. Energy 2014, 131, 517–529. [Google Scholar] [CrossRef]
- Royon, L.; Karim, L.; Bontemps, A. Optimization of PCM embedded in a floor panel developed for thermal management of the lightweight envelope of buildings. Energy Build. 2014, 82, 385–390. [Google Scholar] [CrossRef]
- Karim, L.; Barbeon, F.; Gegout, P.; Bontemps, A.; Royon, L. New phase-change material components for thermal management of the light weight envelope of buildings. Energy Build. 2014, 68, 703–706. [Google Scholar] [CrossRef]
- Li, D.; Zheng, Y.; Liu, C.; Wu, G. Numerical analysis on thermal performance of roof contained PCM of a single residential building. Energy Convers. Manag. 2015, 100, 147–156. [Google Scholar] [CrossRef]
- Jaworski, M.; Łapka, P.; Furmański, P. Numerical modelling and experimental studies of thermal behaviour of building integrated thermal energy storage unit in a form of a ceiling panel. Appl. Energy 2014, 113, 548–557. [Google Scholar] [CrossRef]
- Williams, G.P.; Gold, L.W. Ground Temperatures. Available online: https://nrc-publications.canada.ca/eng/view/object/?id=386ddf88-fe8d-45dd-aabb-0a55be826f3f (accessed on 1 June 2020).
- Ground-Source Heat Pumps Earth-Energy Systems. Available online: https://www.nrcan.gc.ca/energy/publications/efficiency/heating-heat-pump/6833 (accessed on 1 June 2020).
- Taylor, J.R. An Introduction to Error Analysis: The Study of Uncertainties in Physical Measurments; University Science Books: New York, NY, USA, 1997. [Google Scholar]
- COMSOL Multiphysics. Available online: http://www.comsol.com/comsol-multiphysics (accessed on 1 March 2015).
- Meyer, J.P.; Everts, M.; Coetzee, N.; Grote, K.; Steyn, M. Heat transfer coefficients of laminar, transitional, quasi-turbulent and turbulent flow in circular tubes. Int. Commun. Heat Mass Transf. 2019, 105, 84–106. [Google Scholar] [CrossRef]
Figure 1.
Models’ configuration.

Figure 2.
Schematic diagram of the third sample.

Figure 3.
Experimental rebar cage.

Figure 4.
Symmetry lines and thermocouples locations.

Figure 5.
Concrete pouring and insulating processes.

Figure 6.
3-D geometry and meshing.

Figure 7.
Inlet temperature profile at different flow rates.

Figure 8.
Ambient temperature profile at different flow rates.

Figure 9.
Mesh independence analysis.

Figure 10.
Experiment inlet temperature and outlet temperature profiles at Q = 1471 mL/min.

Figure 11.
Experimental and numerical outlet temperature at Q = 1471 mL/min.

Figure 12.
Phase change material temperature profiles.

Figure 13.
Temperature distributions inside the concrete at different radius for Q = 1471 mL/min.

Figure 14.
Thermal map at Q = 1471 mL/min.

Figure 15.
Effect of flow rate on wall heat transfer and temperature difference.

Figure 16.
Effect of PCM on storage capacity.

Figure 17.
Effect of PCM wall heat transfer.


Table 1.
PCM characteristics and environmental effect.
| Organic | Inorganic | Eutectics | |
|---|---|---|---|
| Compounds |
|
|
|
| Merits |
|
|
|
| Demerits |
|
|
|
| Environmental effect | Paraffin wax | Salt hydrates | Eutectics |
|
|
| |
| Fatty acids | |||
|
Table 2.
Selection criteria for PCM in building applications.
| Thermodynamics Properties | Kinetics Properties | Chemical Properties | Economics Properties |
|---|---|---|---|
|
|
|
|
Table 3.
Maximum thermocouples uncertainty for different samples.
| First Model | Second Model | ||||
|---|---|---|---|---|---|
| Th# | Radius (mm)/Function | Max Uncertainty | Percentage of Reading | Max Uncertainty | Percentage of Reading |
| Th1 | 0 | 0.364 | 1.0% | 0.356 | 1.0% |
| Th2 | 28 | 0.424 | 1.2% | 0.394 | 1.1% |
| Th3 | 0 | 0.355 | 1.0% | - | - |
| Th4 | 28 | 0.417 | 1.2% | 0.395 | 1.2% |
| Th5 | Inlet | 0.464 | 1.3% | 0.382 | 1.0 % |
| Th6 | Outlet | 0.436 | 1.2% | 0.381 | 1.0% |
| Th7 | Surface | 0.436 | 3.1% | 0.51 | 2.0% |
| Th8 | Ambient | 0.811 | 3.3% | 0.687 | 2.8% |
| Th9 | PCM | - | - | 0.504 | 1.5% |
Table 4.
Layer thermal properties.
| Material | Thermal Conductivity (W/m.K) | Density (kg/m3) | Specific Heat (kJ/kg.K) |
|---|---|---|---|
| Cement paste | 0.7 | 1500 | 0.7 |
| Rebar steel | 44.5 | 7850 | 0.457 |
| PVC | 0.19 | 1380 | 1 |
| Foam insulation | 0.024 | 35 | 1.45 |
| heavy-duty cardboard | 0.21 | 900 | 1.88 |
| Copper | 401 | 8960 | 0.385 |
| PCM solid phase | 0.24 | 921 | 1.4 |
| PCM liquid phase | 0.15 | 857 | 1.9 |
Table 5.
Flow rate and PCM effect on the storage capacity and storage efficiency of both models.
| Volumetric Flow Rate [mL/min] | 735 | 1471 | 2100 | 735 | 1471 | 2100 |
|---|---|---|---|---|---|---|
| Model | First Model | Second Model | ||||
| Initial average temperature () | 8.69 | 8.68 | 8.66 | 8.69 | 8.75 | 8.81 |
| Volumetric flow rate percentage increase | - | 100 | 185.7 | - | 100 | 185.7 |
| Initial concrete’s total internal energy (J/kg) | −7857.3 | −7857.3 | −7857.3 | −21,158 | −21,158 | −21,158 |
| Concrete’s total internal energy at the end of charging (J/kg) | 8702 | 9002.5 | 9298.8 | 7605 | 8042.6 | 8372.6 |
| Final concrete’s total internal energy (J/kg) | −3832.3 | −3922.7 | −4868.6 | −15,431 | −16,666 | −19,171 |
| Total energy stored (J/kg) | 16,559.3 | 16,859.8 | 17,156.1 | 28,763 | 29,200.6 | 29,530.6 |
| Total energy extracted (J/kg) | 12,534.3 | 12,925.2 | 14,167.4 | 23,036 | 24,708.6 | 27,479.6 |
| Storage efficiency | 0.75 | 0.76 | 0.82 | 0.80 | 0.84 | 0.93 |
© 2020 by the authors. Licensee MDPI, Basel, Switzerland. This article is an open access article distributed under the terms and conditions of the Creative Commons Attribution (CC BY) license (http://creativecommons.org/licenses/by/4.0/).
Share and Cite
MDPI and ACS Style
Mousa, M.M.; Bayomy, A.M.; Saghir, M.Z. Experimental and Numerical Study on Energy Piles with Phase Change Materials. Energies 2020, 13, 4699. https://0-doi-org.brum.beds.ac.uk/10.3390/en13184699
AMA Style
Mousa MM, Bayomy AM, Saghir MZ. Experimental and Numerical Study on Energy Piles with Phase Change Materials. Energies. 2020; 13(18):4699. https://0-doi-org.brum.beds.ac.uk/10.3390/en13184699
Chicago/Turabian StyleMousa, M. M., A. M. Bayomy, and M. Z. Saghir. 2020. "Experimental and Numerical Study on Energy Piles with Phase Change Materials" Energies 13, no. 18: 4699. https://0-doi-org.brum.beds.ac.uk/10.3390/en13184699
Note that from the first issue of 2016, this journal uses article numbers instead of page numbers. See further details here.