Large Scale Smart Charging of Electric Vehicles in Practice

ElaadNL, Utrechtseweg 310, building B42, 6812 AR Arnhem, The Netherlands
*
Author to whom correspondence should be addressed.
Energies 2020, 13(2), 298; https://0-doi-org.brum.beds.ac.uk/10.3390/en13020298
Submission received: 17 October 2019
/
Revised: 18 December 2019
/
Accepted: 24 December 2019
/
Published: 7 January 2020
(This article belongs to the Special Issue Flexibility in Distribution Systems from EVs and Batteries)
Abstract
:The energy system is changing due to a steady increase in electric vehicles on the demand side and local production (mostly through solar panels) on the production side. Both developments can put the energy grid under stress during certain timeframes, while there might be enough capacity on the grid most of the day. Smart charging of electric vehicles might be a solution to time dependent congestion. In this study, a smart charging strategy was developed and tested in large scale with 1000 public chargers, operated in the real word. We developed and tested protocols to temporarily limit the charger capacity based on the transformer data and the number of running sessions. Over 150,000 sessions were handled, of which almost half were influenced by the smart charging strategy applied. We found that we were able to keep within the grid limits by using these controls, without hindering the driver experience. Further improvements to the smart charging strategy can be made as soon as car manufacturers share information about the car battery such as the state of charge.
1. Introduction
The world is at the eve of a revolutionary change in mobility. The number of people driving an electric vehicle (EV) is steadily increasing, with the Netherlands among the front runners in both the number of cars and the number of charge points [1,2].
This increase is expected to continue at an exponential pace due to a number of factors:
- (1)
- EVs are cleaner, also with respect to CO2, and are more silent and cheaper to drive than petrol based cars.
- (2)
- Batteries have continuously improved, evolving from cars with a 100 km range in 2014 to more than 400 km range in 2019.
- (3)
Historically, the Dutch low voltage grid is laid out with plenty of capacity reserve, with current daily loads only using 20–30% of the maximum capacity. Typically, households have a three phase connection with 25 amperes per phase (3 × 25 A), which can deliver 17.3 kW. However, the grid is built for a maximum of a 4 kW per 3 × 25 A connection, with the average after diversity peak demand currently even lower, at about 0.8 kW [4]. At the current number of EVs and charge points, there are hardly any limitations in the charging infrastructure because EVs are limited in number and only increase the average peak demand between 1–2.8 kW [5]. This impact will change, since the number of cars and the capacity of car batteries will continue to increase. The increase in the amount of local electricity production through photovoltaic (PV) panels will add further stress on the grid. The grid issues we face arise from the characteristics of these new components that have been added: A modern EV has a capacity demand of 11 kW, which is more than 10 times as much as the after diversity peak demand of an average household [4]. Recent studies have predicted an increase in the total annual electricity demand of 23% when the current fleet is replaced by EVs. The peak load will then rise up to 43% [6]. On the production side, the average roof with PV in the Netherlands has a peak production rate of 4 to 5 kW. Aside from this large power, this electricity is produced primarily around midday, which is historically a period of low consumption for households. Solar production on a low voltage grid, but also on a mid-voltage grid, is expected to continue a steady growth [7]. In conclusion, because local production is increasing and takes place at a different times of the day and year than peak usage, and because peak usage will increase drastically due to EV charging, smart solutions are needed to bring balance to the system and to prevent overloads on cables and transformers. Smart EV charging can offer this balance. This paper presents insights from real-world data that are used to predict the near-future scenario and the practical implementations of smart charging.
This study offers a simulation of the impact on actual grid performance of two large groups of real public chargers that are virtually coupled to a real grid transformer. We demonstrate a smart charging solution that will continuously and in real time monitor the amount of charging in relation to the available capacity on the transformer. The system was developed to allow EV charging for the number of cars representative of the (near) future, within the grid limitations.
2. Materials and Methods
In the Netherlands, around 26% of chargers are public chargers, against the 74% of private or semi-private chargers at homes or businesses [8]. This ratio is reflective of the number of households with a private driveway compared to the number of households that do not have the requirements for a private charger. This means that public charging has and will continue to have a large impact on the grid. Whereas it is difficult to control charging activities behind a private meter, it is possible for charge point operators to take into account the grid limitations for their public sessions. Distribution system operators (DSOs) are therefore more and more interested in the impact on the grid at foreseen charger locations, and specifically on the transformers in a low voltage grid [9,10,11].
With respect to the placement of public chargers, local governments until recently followed demand (i.e., a charger was placed when EV drivers expressed their need of one). Recently, local policy has shifted and municipalities now tend to monitor the usage per charger and proactively add chargers to their population with a focus on an even distribution across the municipality [12]. Proactive analysis of the impact of large numbers of EV-chargers on the transformers in place will help DSOs to provide advice on the actual placement of chargers and to plan their investments. Thus, this will help to limit the costs of grid reinforcement, which are estimated to be up to €2.2 billion if smart charging is not applied [11].
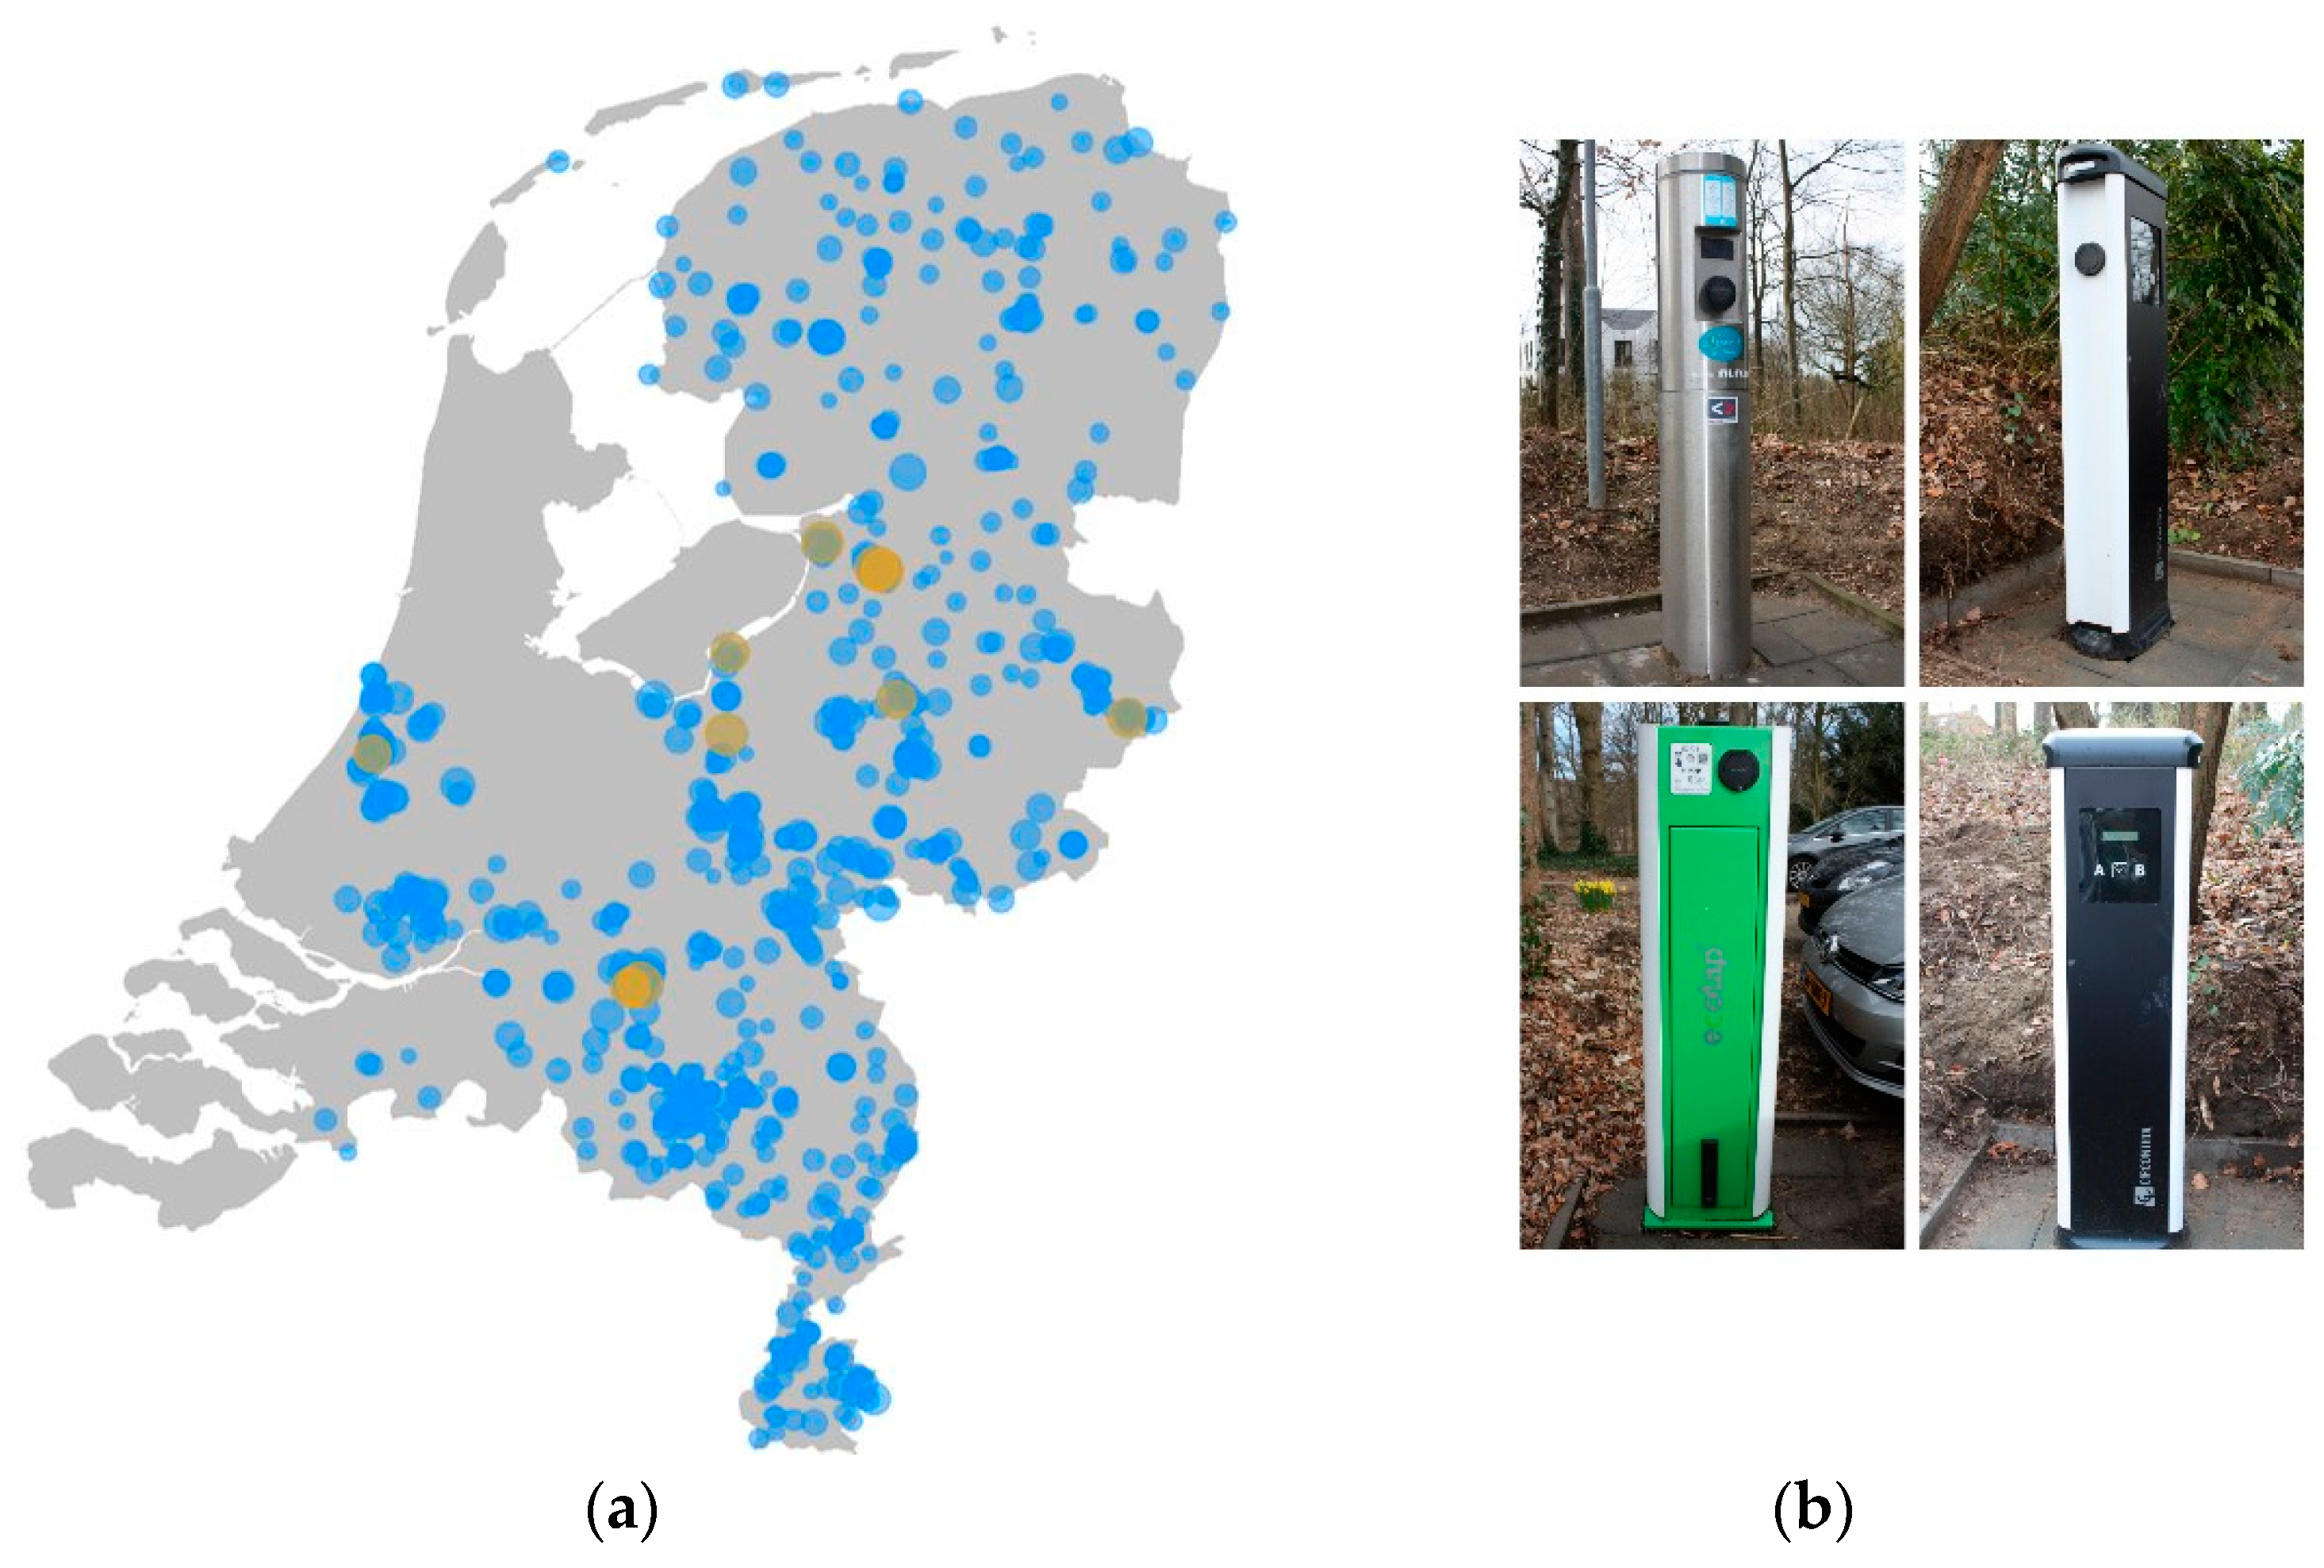
ElaadNL, through its partner EVnetNL, has access to the charging information of over 1000 public chargers spread throughout the Netherlands. The AC charge stations, which are from a handful of different suppliers, are connected through 3 × 35 A connections (being part of the ElaadNL foundation, all EVnetNL chargers are smart charging ready and therefore have a larger connection than the standard 3 × 25 A connection) and all support the open communication protocol OCPP1.6. See Figure 1 for an overview of the geographic spread of the chargers and their appearance.
These chargers are representative of public chargers from other companies, with usage representing a combination of work-, visit-, and home-charging. The diversity in usage offers us a dynamic charging schema, with many changes in the number of sessions throughout each day. This makes this population of chargers a good testing ground for our study as it will help us prove that our developed smart charging protocol is capable of the continuous adjustment of charging sessions in response to changes in available capacity. The chargers are used by EV drivers with different types of contracts and the drivers were not informed of the study carried out at the EVnetNL chargers.
We selected two neighborhoods in the Netherlands based on the following selection criteria:
- A relative high number of cars per inhabitant;
- A representative amount of local PV production; and
- Full-electric households.
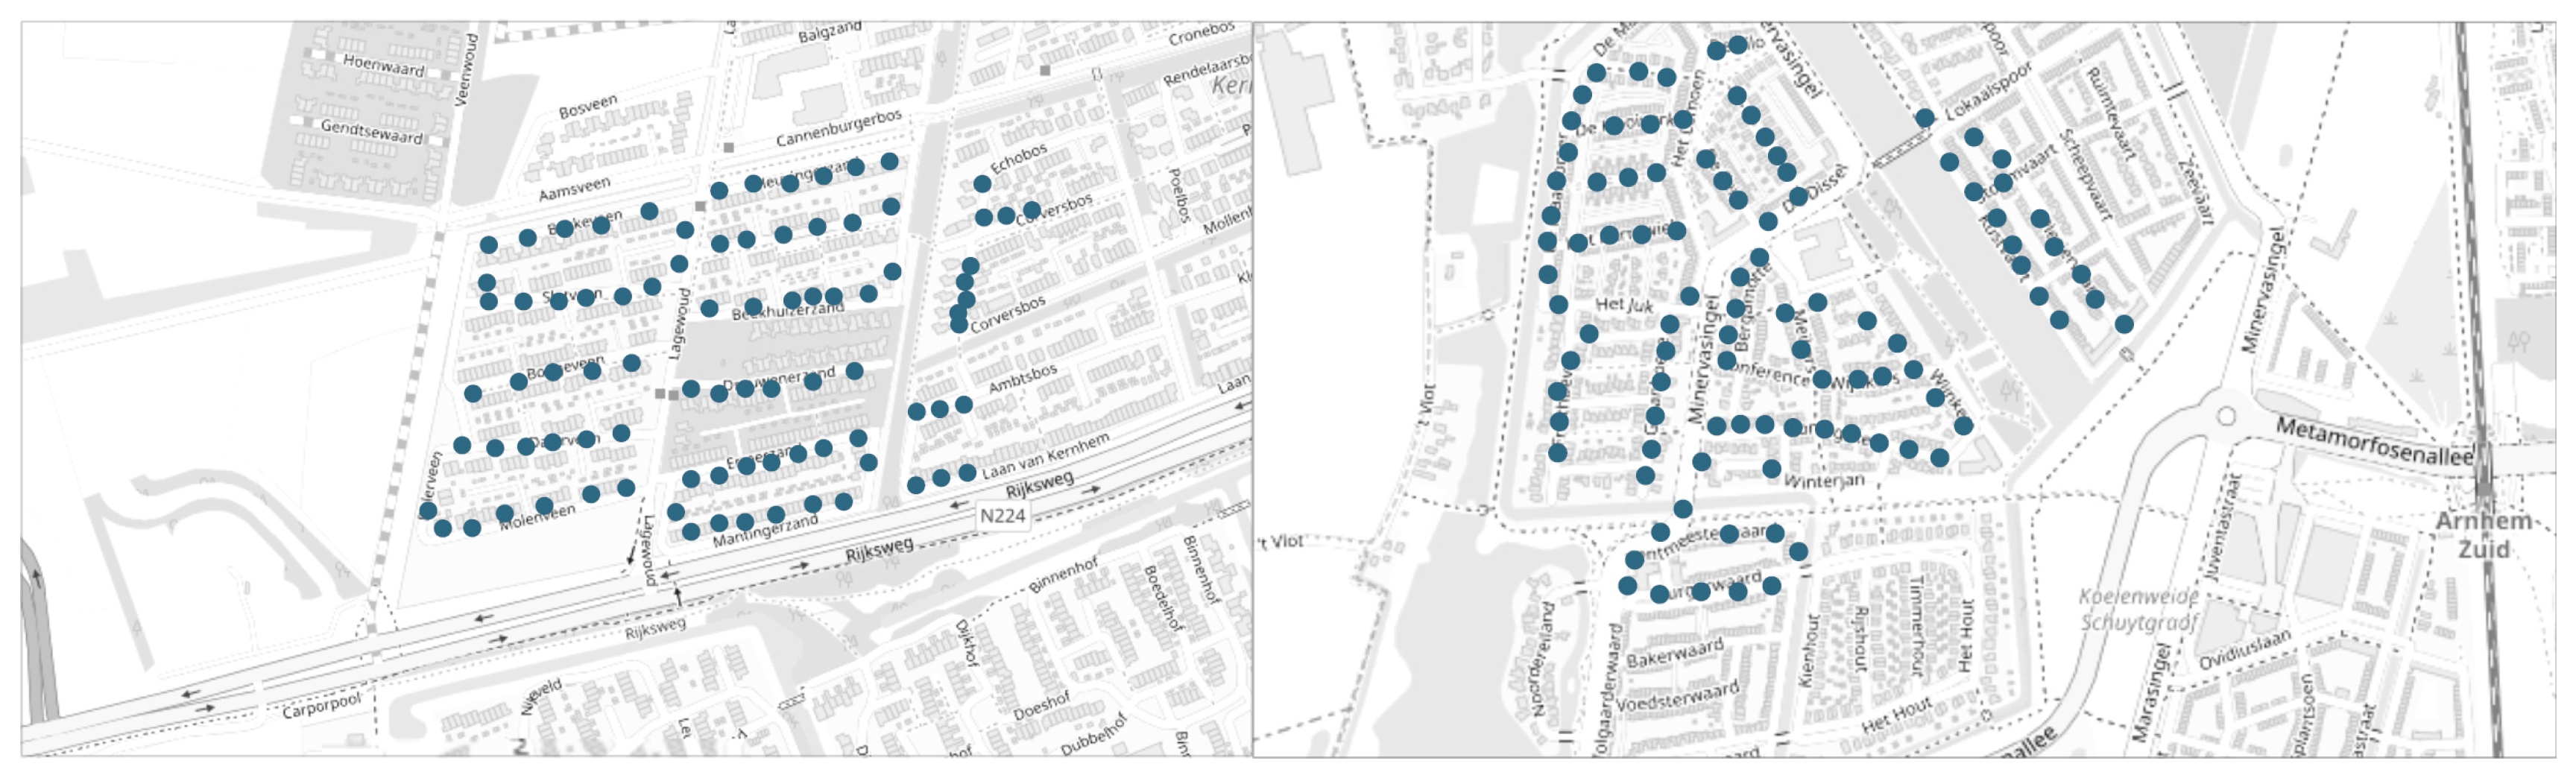
Through the combination of high energy demand for domestic usage and expected EV charging and high production through PV panels on the same grid, a smart charging solution is likely to be beneficial for preventing costly grid reinforcements in neighborhoods that fit these criteria. After selecting neighborhoods in Ede and Arnhem, we virtually relocated the EVnetNL chargers to these neighborhoods, keeping the number of households connected to the local transformer as a guideline for the number of virtual chargers placed (Figure 2). We used the transformer data of the neighborhood as the input for the charging sessions. The choice for transformer data was made based on the knowledge that real-time transformer data are likely to become widely accessible in the near future [12,13], as opposed to cable measurements (which are not available) or smart meter readings (which are incomplete due to privacy regulations).
This Dutch pilot, part of the Horizon 2020 project INVADE, takes into account all national and international regulations, but also makes use of open standard communication protocols like Open Charge Point Protocol (OCPP) and Open Smart Charging Protocol (OSCP), for which we developed a new version in order to send and receive profiles to and from the aggregator.
The experiments in this paper were the test case to prove the value of our OSCP additions, which were shown to be a useful addition to the protocol and can be utilized easily.
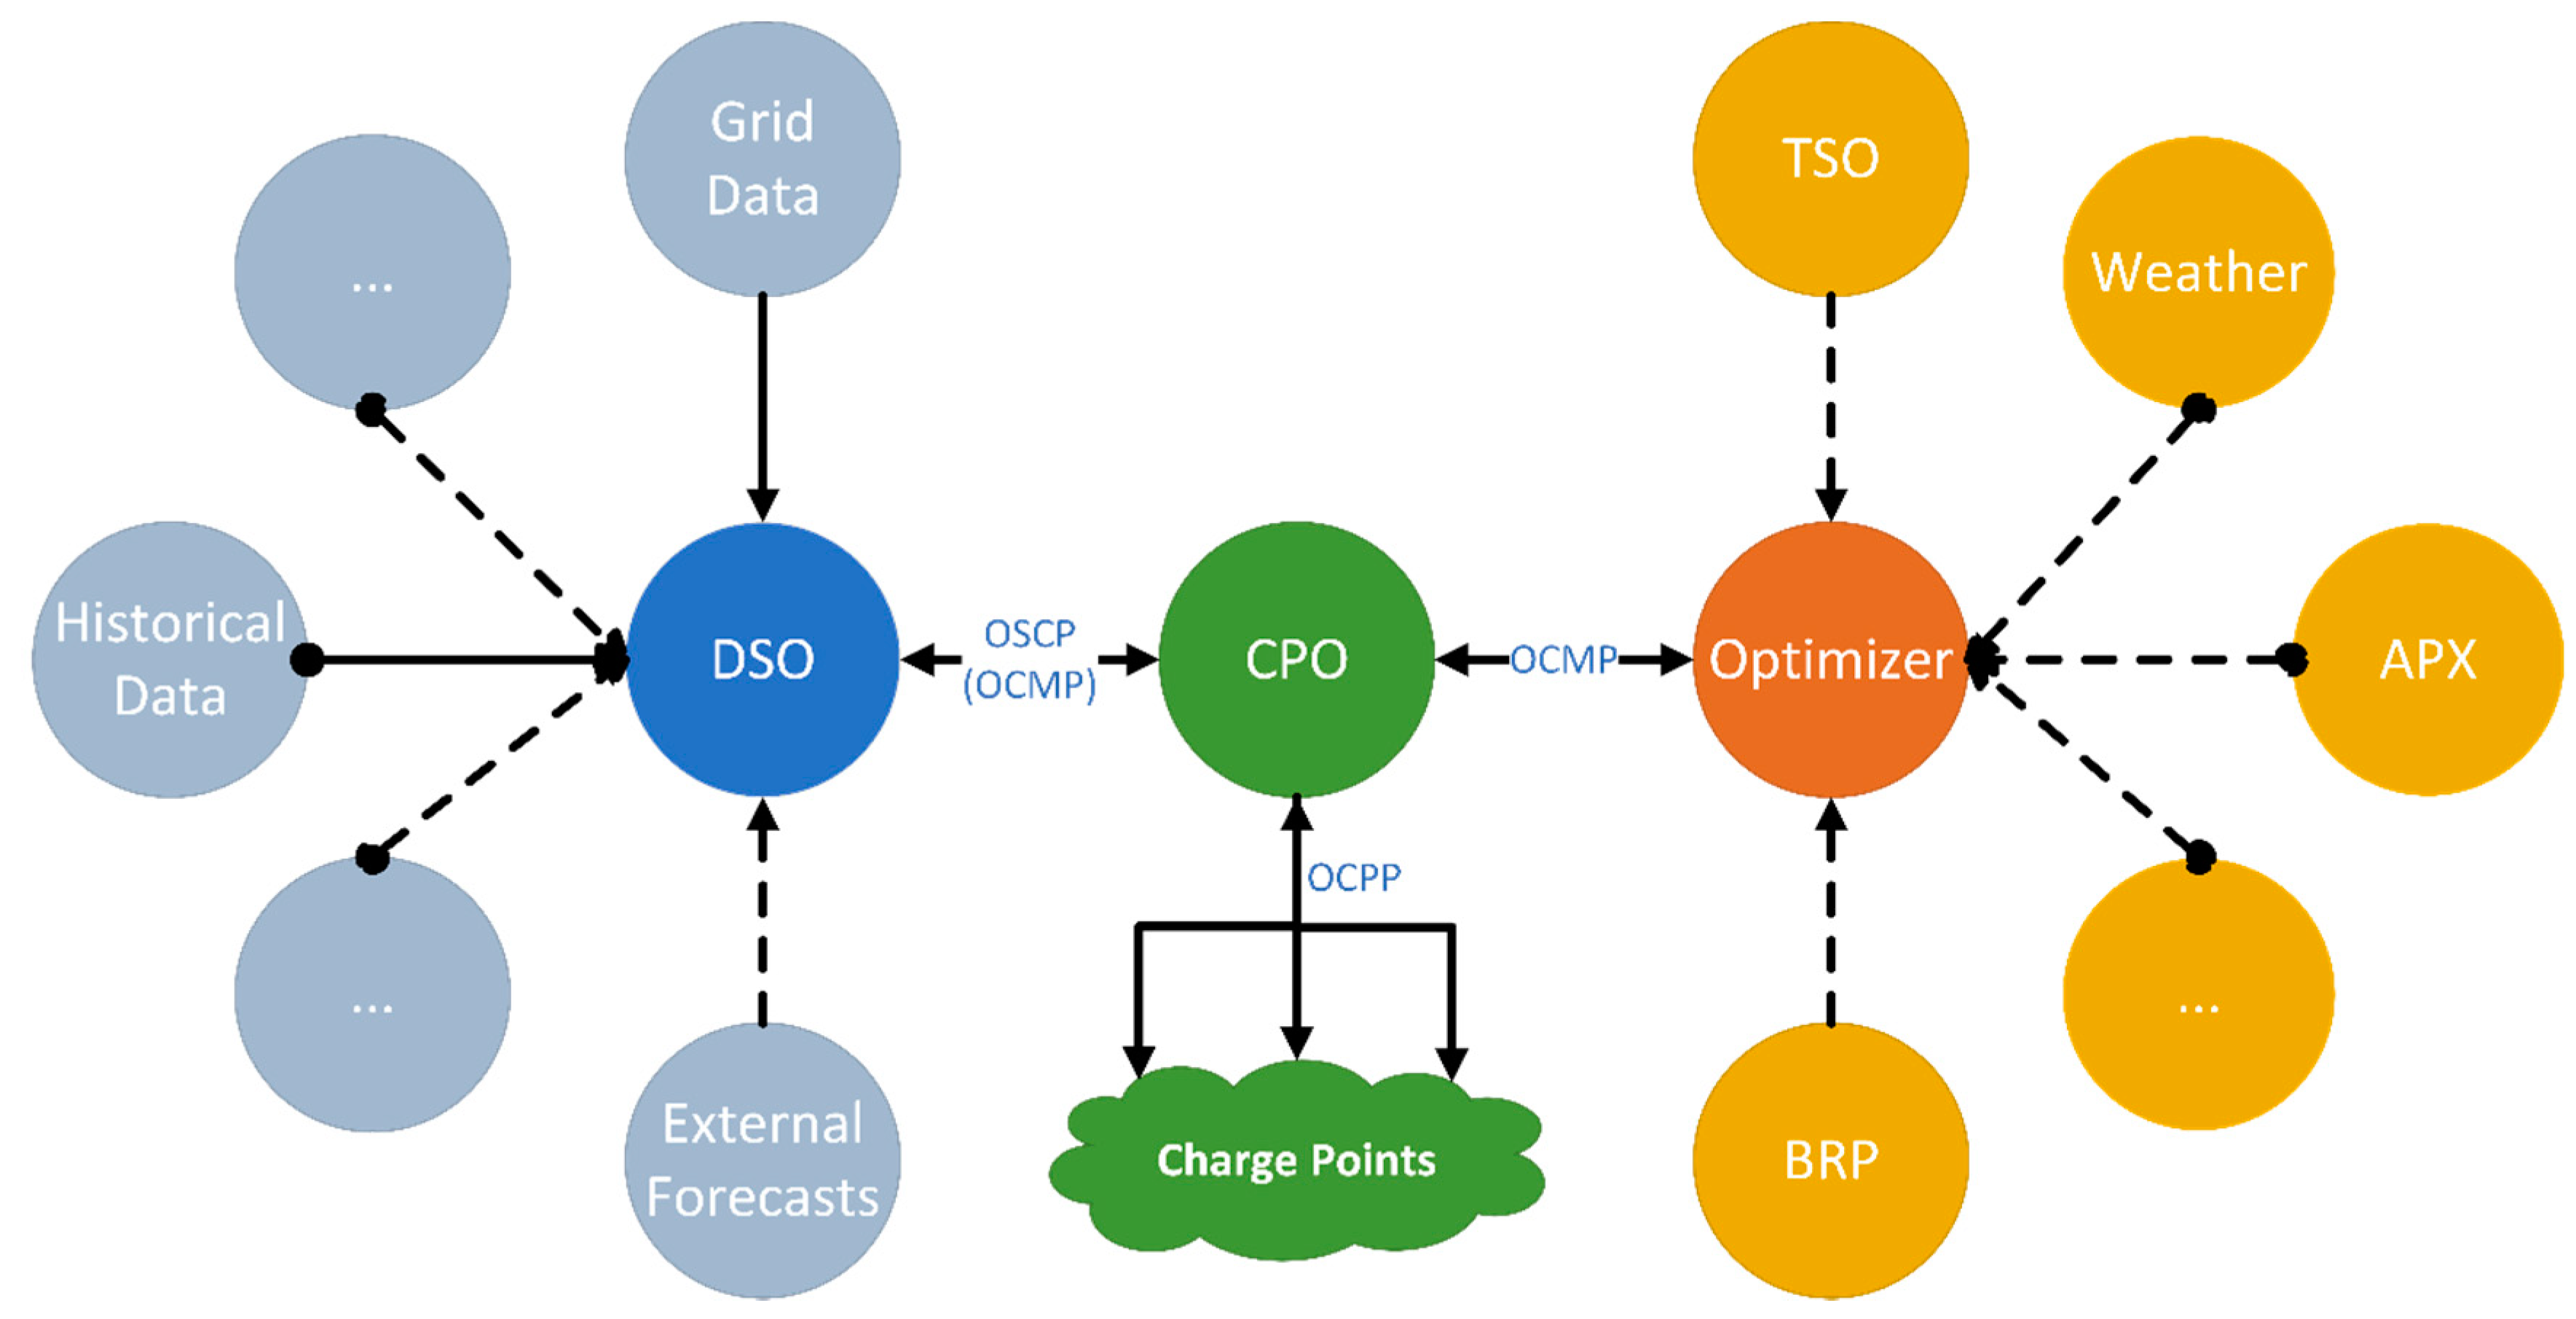
Major achievements and results for this Dutch study were realized in software development, incorporating all stakeholders. The following software building blocks have been created:
- Distribution System Operator (DSO): Prediction of electricity grid usage on the district level (system approach)
- Charge Point Operator (CPO): Controlling charge transactions on the grid connection level
- Optimizer: INVADE platform energy management on the district level (system approach).
Exchange of information between the roles stated above runs via the standard open source protocols OSCP and OCPP. In this study, we developed additions to OSCP (named OCMP during the project) in order to run our smart charging strategy. These additions will be released to the new version of OSCP (OSCP 2.0).
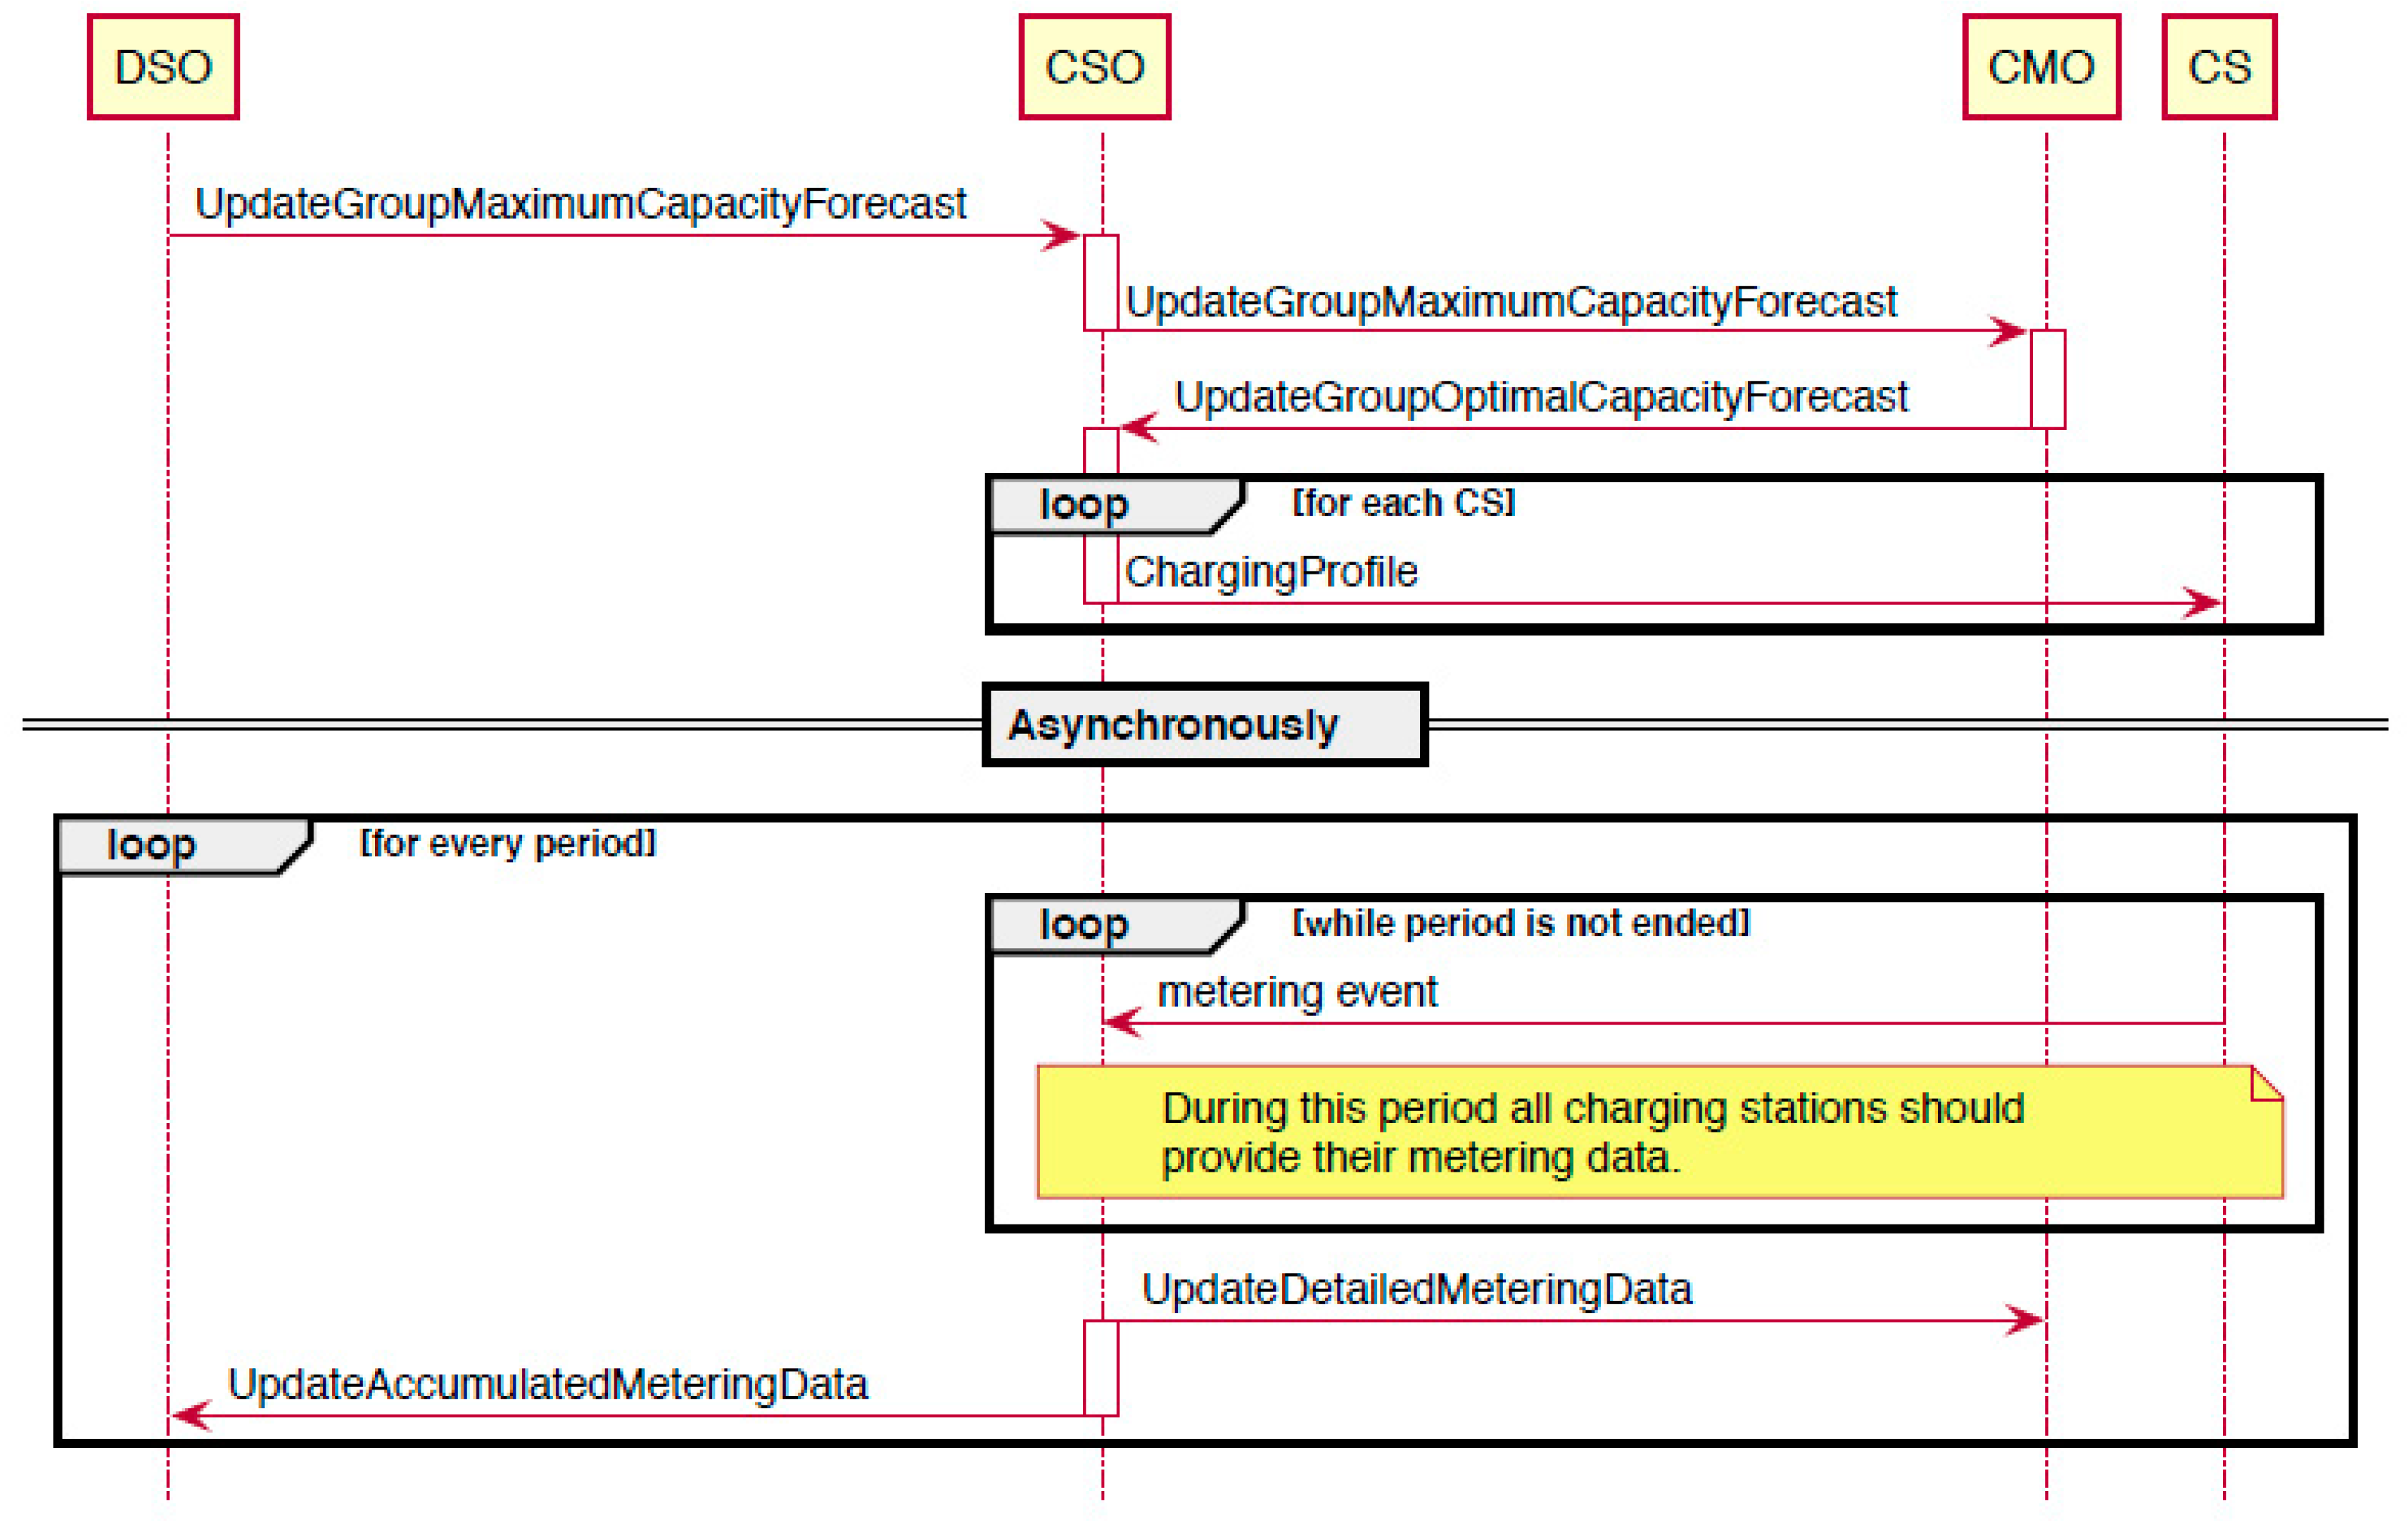
A schematic overview of the communication protocols used is given in Figure 3, with a more detailed insight into the control loops shown in Figure 4.
The triggers for recalculating the charging speed are either the update of the capacity limit (every 15 min) or the start or end of a charging session. The actions following a trigger are:
- calculation of the new charging speed (based on the capacity limit and the number of running sessions);
- check if the new charging speed is different from the previous charging speed;
- check if the proposed new charging speed is within acceptable limits; and
- send new charging profiles to all sessions (all sessions are limited or increased in charging speed equally),
It must be noted that although delivered energy (in kWh) is the final goal of charging, the amount of kWh flowing into an EV cannot be controlled effectively for groups of chargers by the CPO since it is dependent on car characteristics. This is the reason why our protocol uses amperage as steering input for smart charging.
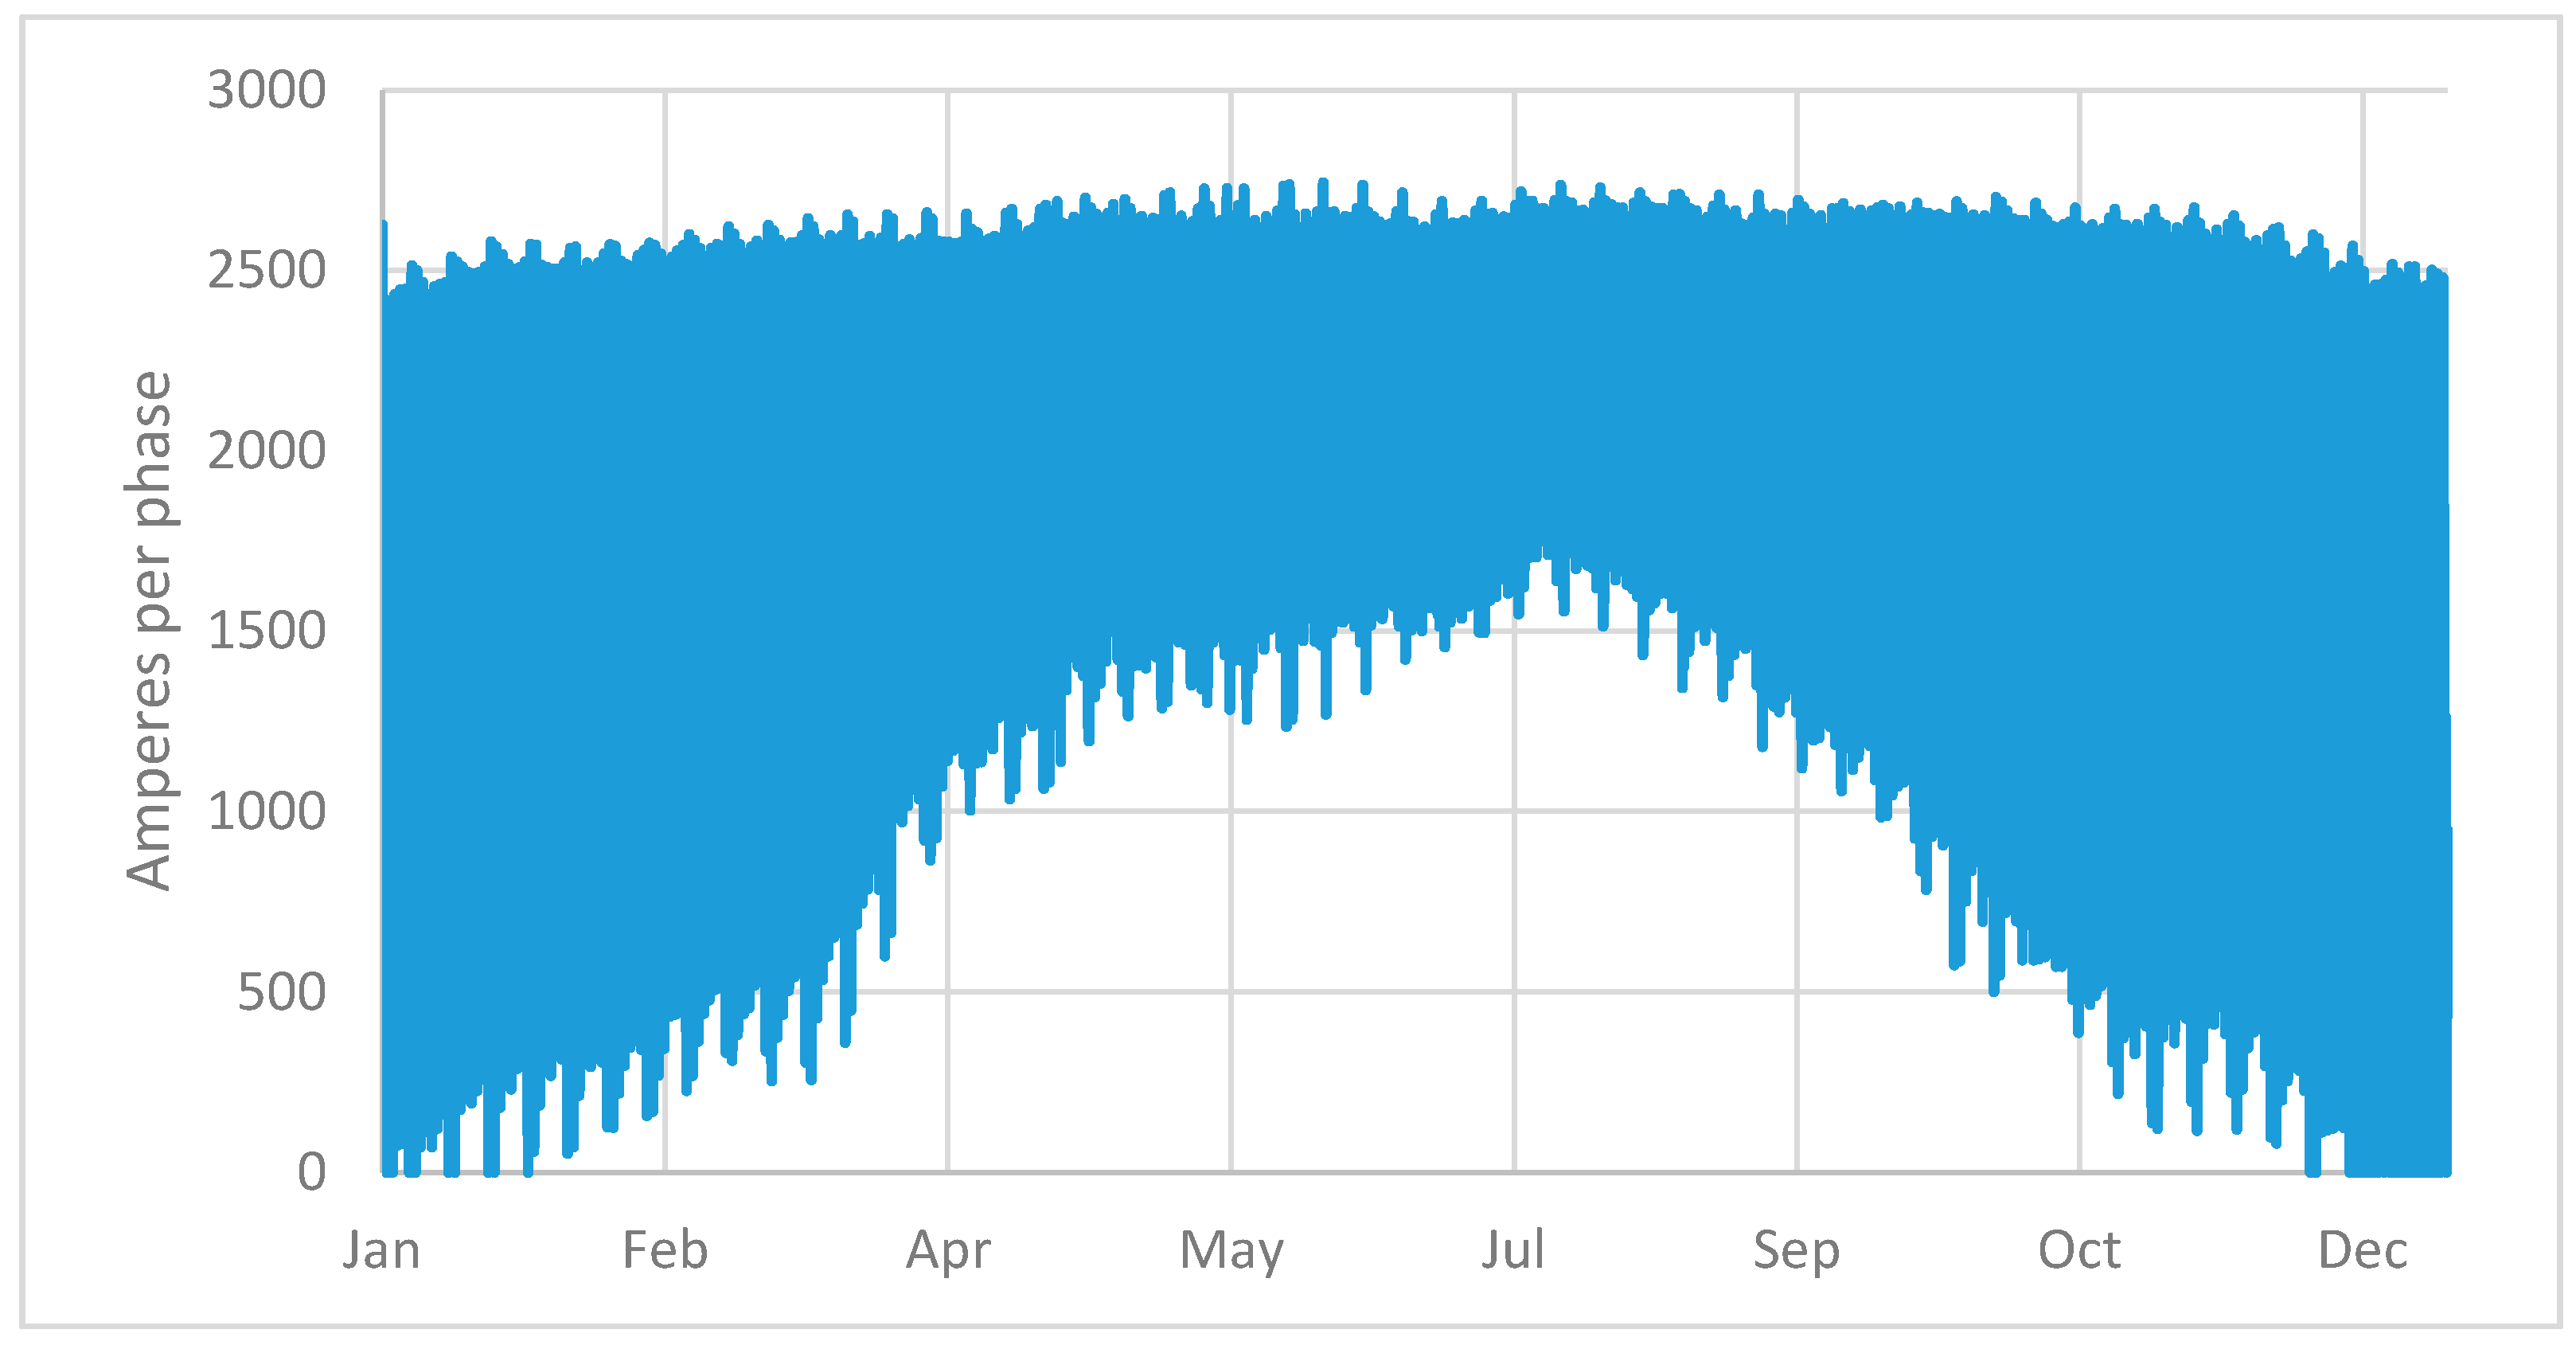
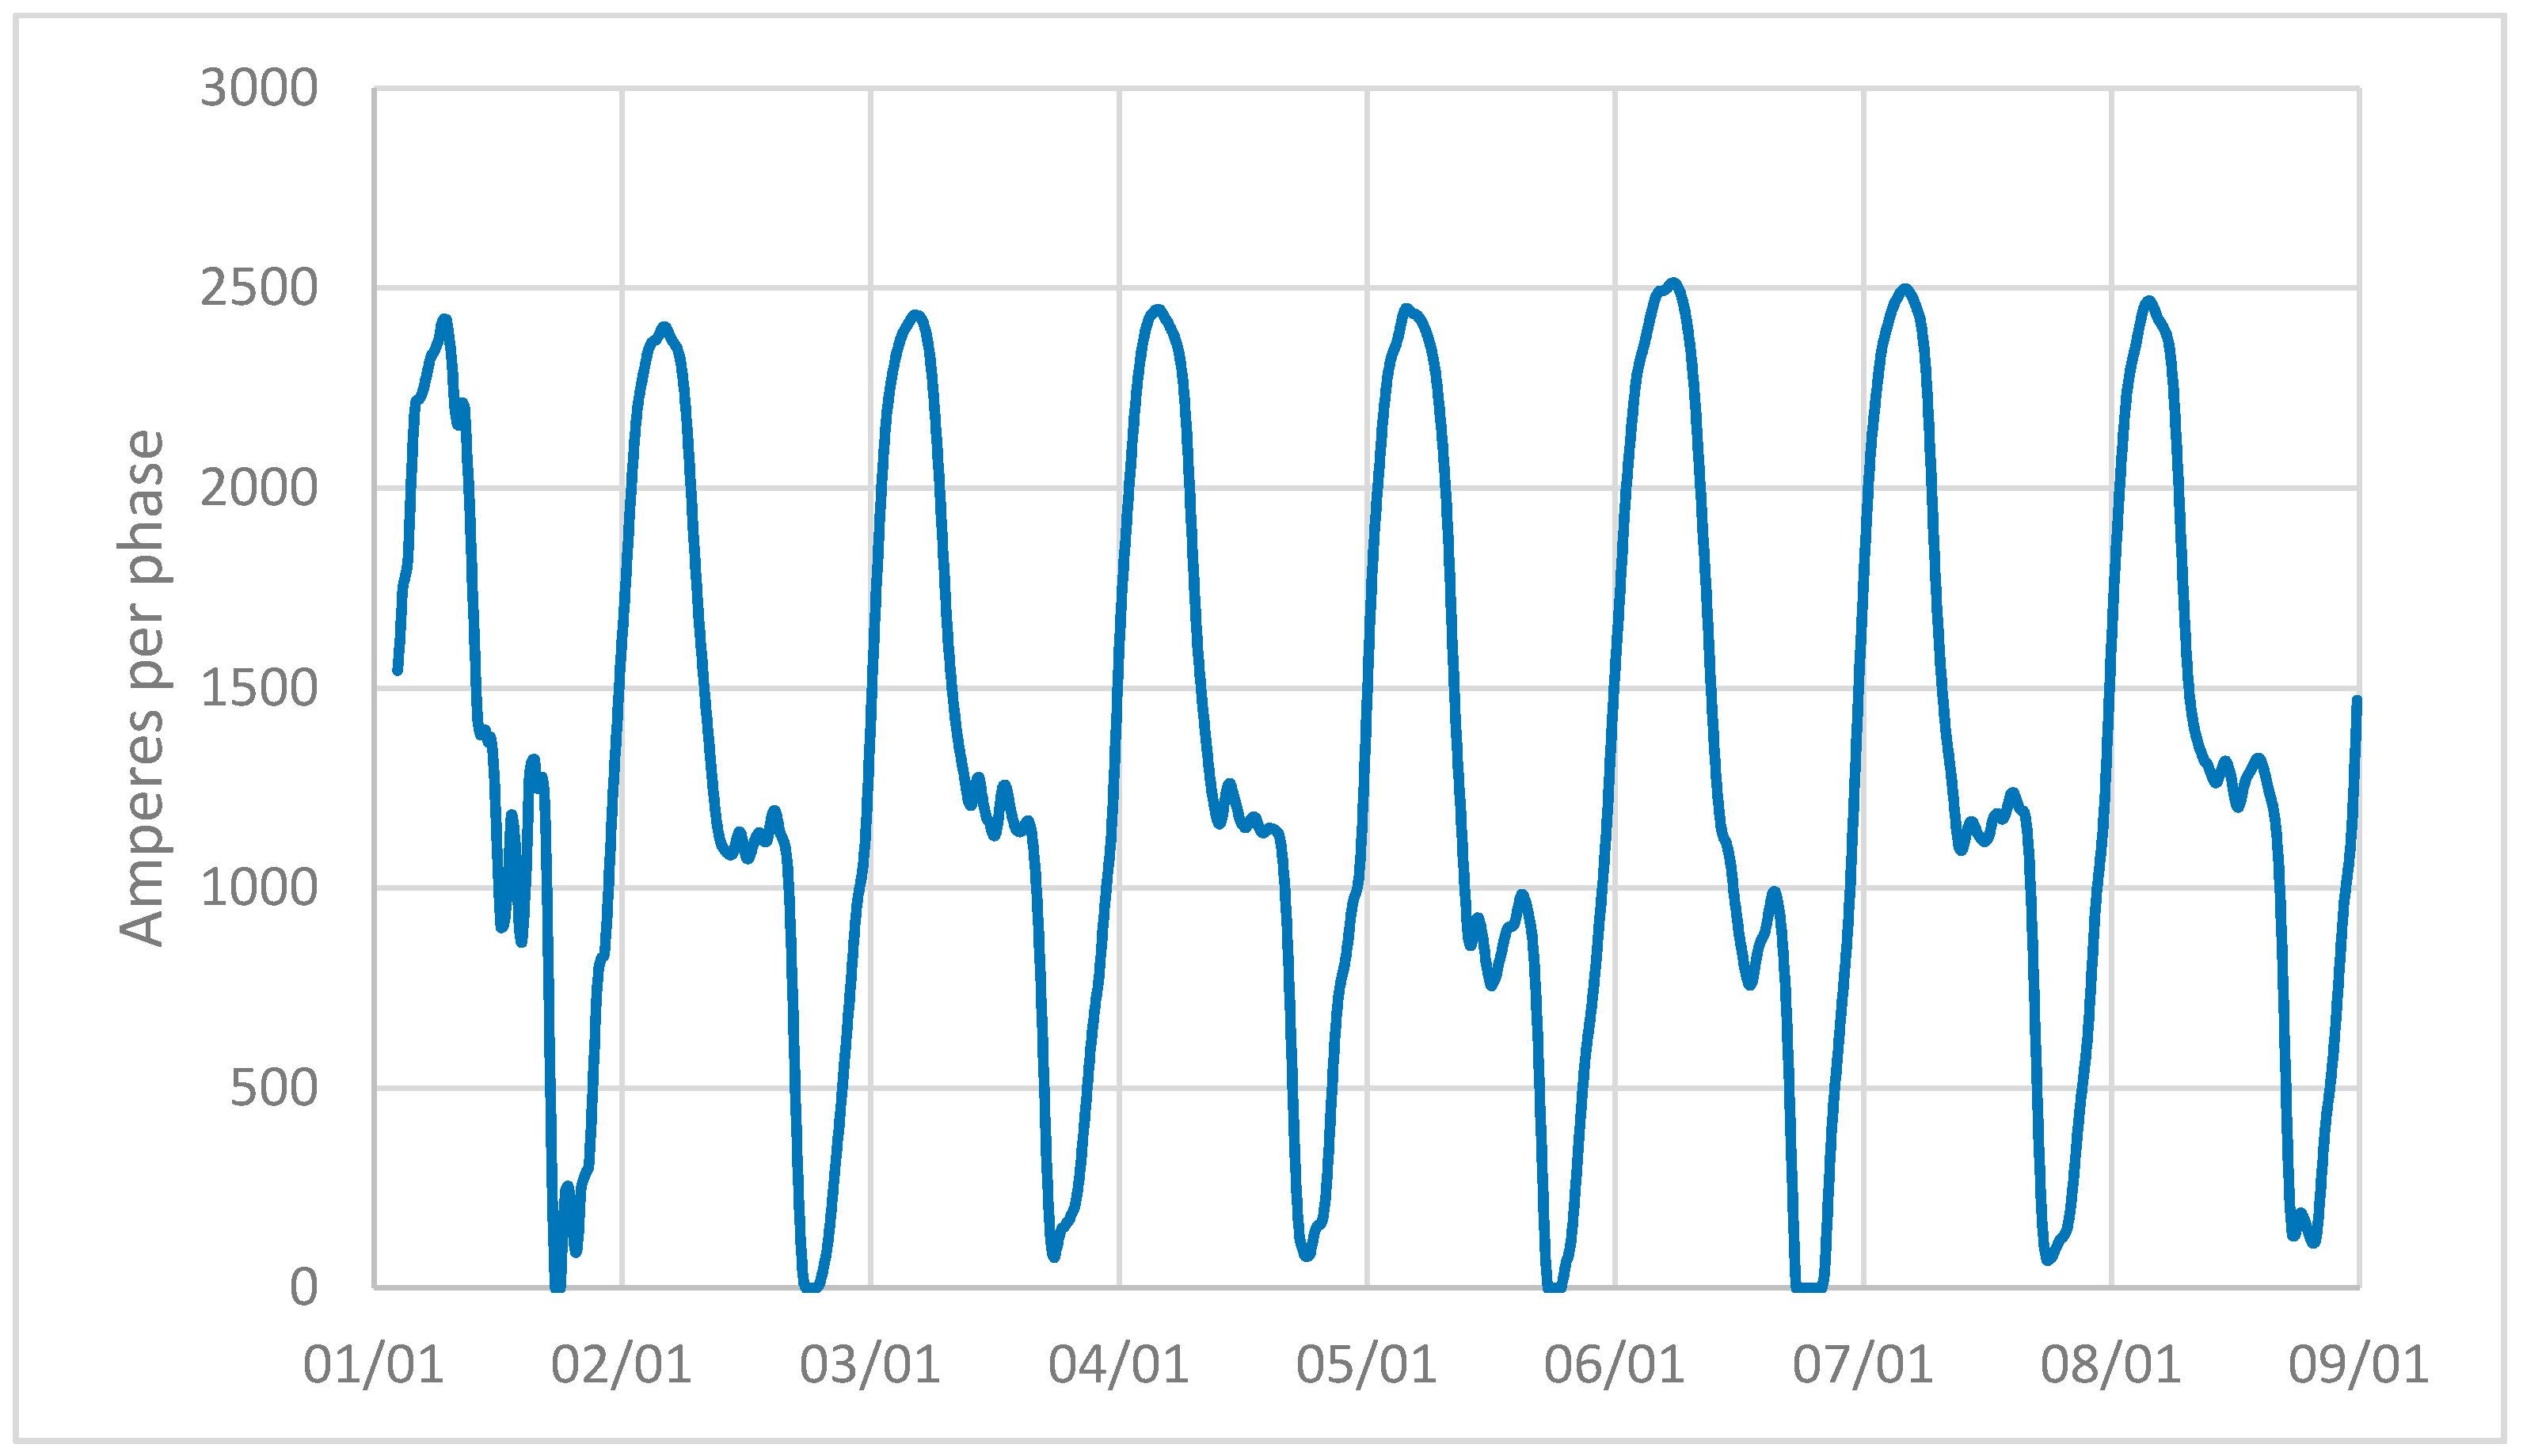
For both groups of chargers (=neighborhoods), we specified the capacity limits based on the maximum available capacity on the transformer in that neighborhood. Ideally, we would use live measurements for this, but in the absence of such measurements, we calculated the available capacity as follows: we multiplied the number of households connected to the transformer with historical usage profiles for energy consumption, available at 15 min intervals. The total amount of energy consumed determines the non-flexible load profile for the transformer. The following graphs, Figure 5 and Figure 6, show the profiles for the resulting available capacity, on a yearly and hourly basis, respectively. These graphs are shown for only one of the transformers. The transformer load for any neighborhood is highest in the early evening in winter. Differences in the number of households connected have resulted in unique capacity profiles for both neighborhoods (Table 1).
As the charge points are not physically connected to the transformers, the actual available capacity for charging is only influenced by existing domestic usage and PV production. The system tested in this pilot responds to triggers as above-mentioned. The protocols used offer possibilities of adding extra decision rules, for instance, based on the price or capture of durable energy. These types of adjustments have not been included in this study.
In our smart charging algorithm, all charge points are treated equally. That is to say, once an adjusted profile is sent out, it is used for all active sessions. We identified a session as impacted by our control algorithms when the charging speed was lower than 20 ampere at any stage during the session. We deliberately chose to never allow charging below 13 A. This boundary was chosen to avoid the charging sessions losing connection with the charge point operator (some cars go into irreversible “sleep” mode when not charged or charged at too low an amperage). We estimated that this was also a safe boundary to allow enough charging on the connections to avoid dissatisfied customers. This was important as we carried out our experiments on public charge points that were already in use before our smart charging protocol was applied, without the means to communicate our experiment to all of the drivers using them.
Our main hypothesis is that smart charging within the limitations we used in this set-up will result in transformer loads that comply with the capacity restrictions.
The second hypothesis is that EV drivers will not experience any significant difference in charged energy when smart charging is applied following the controls described.
3. Results
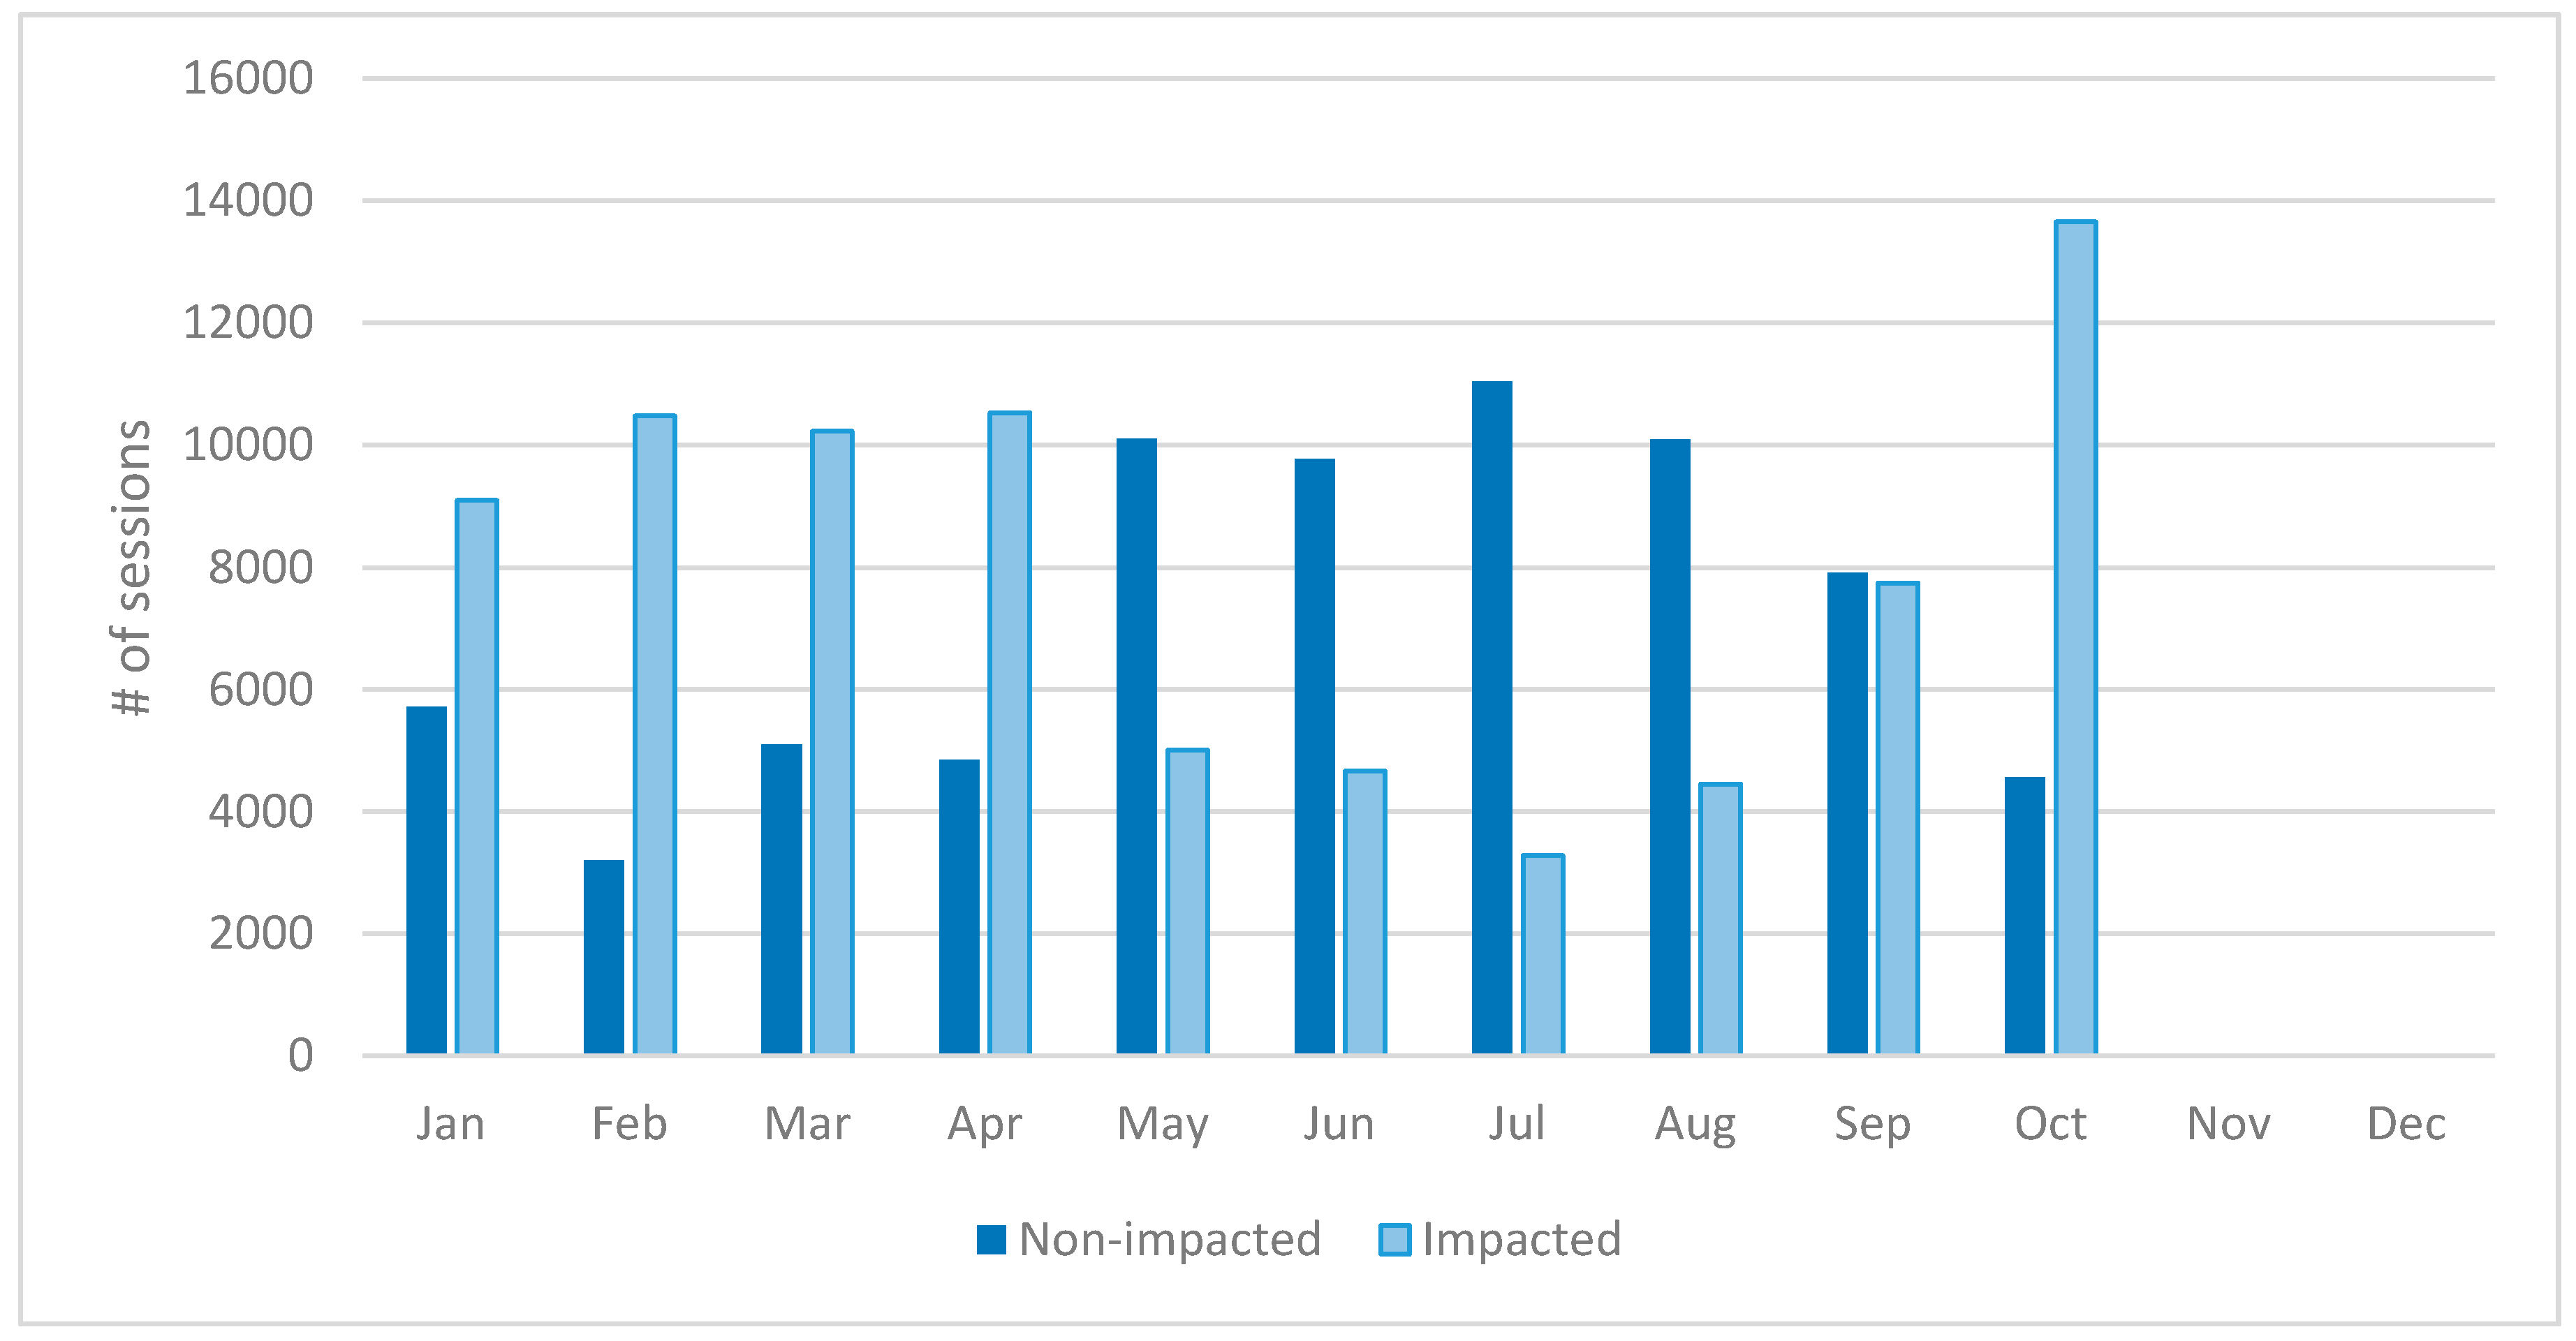
We charged over 150,000 sessions between January 2019 and November 2019, all of which were operated through the smart charging setup described above. Of these sessions, more than 79,000 were impacted by our control algorithm to charging speeds below 20 A at least once during the charging process. The spread of the impacted and non-impacted sessions can be seen in Figure 7.
As shown in Figure 4, the DSO limits were lower in winter. This is due to the higher energy demand by all end users and is a permanent phenomenon in electricity usage profiles. This higher demand causes a smaller bandwidth in the flexibility capacity profile, which is why in winter, a larger share of charging sessions was impacted when compared to the summer period. To be more specific, in February, 77% of charging sessions were affected by the control algorithm when compared to 23% in July.
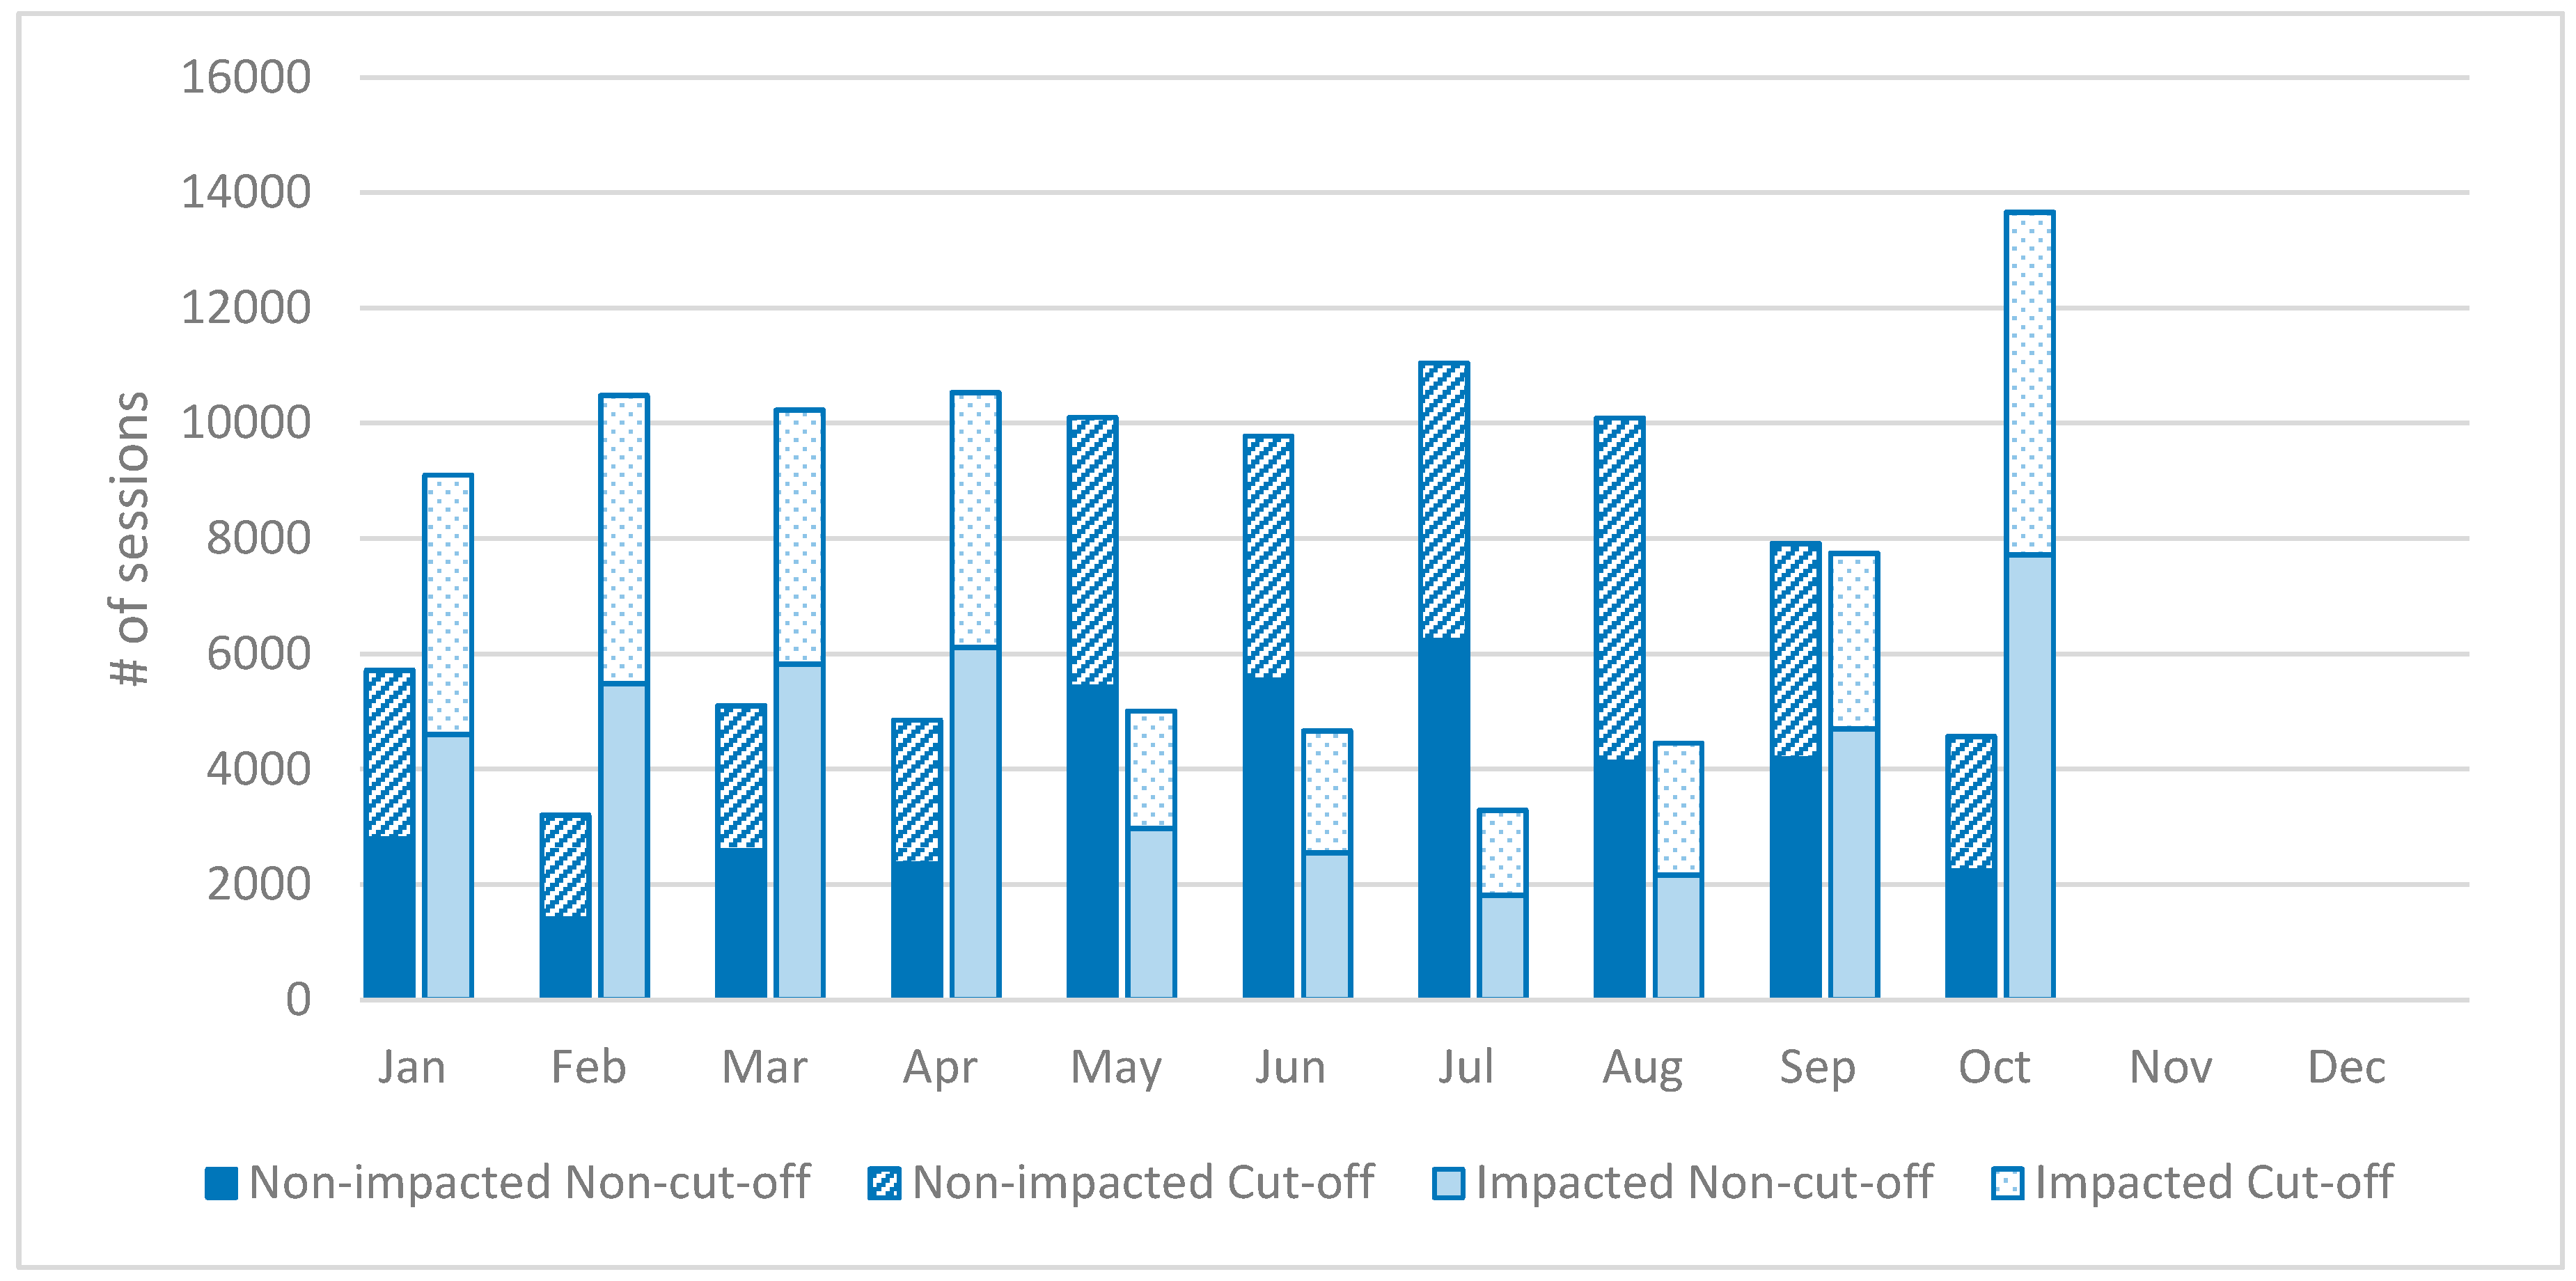
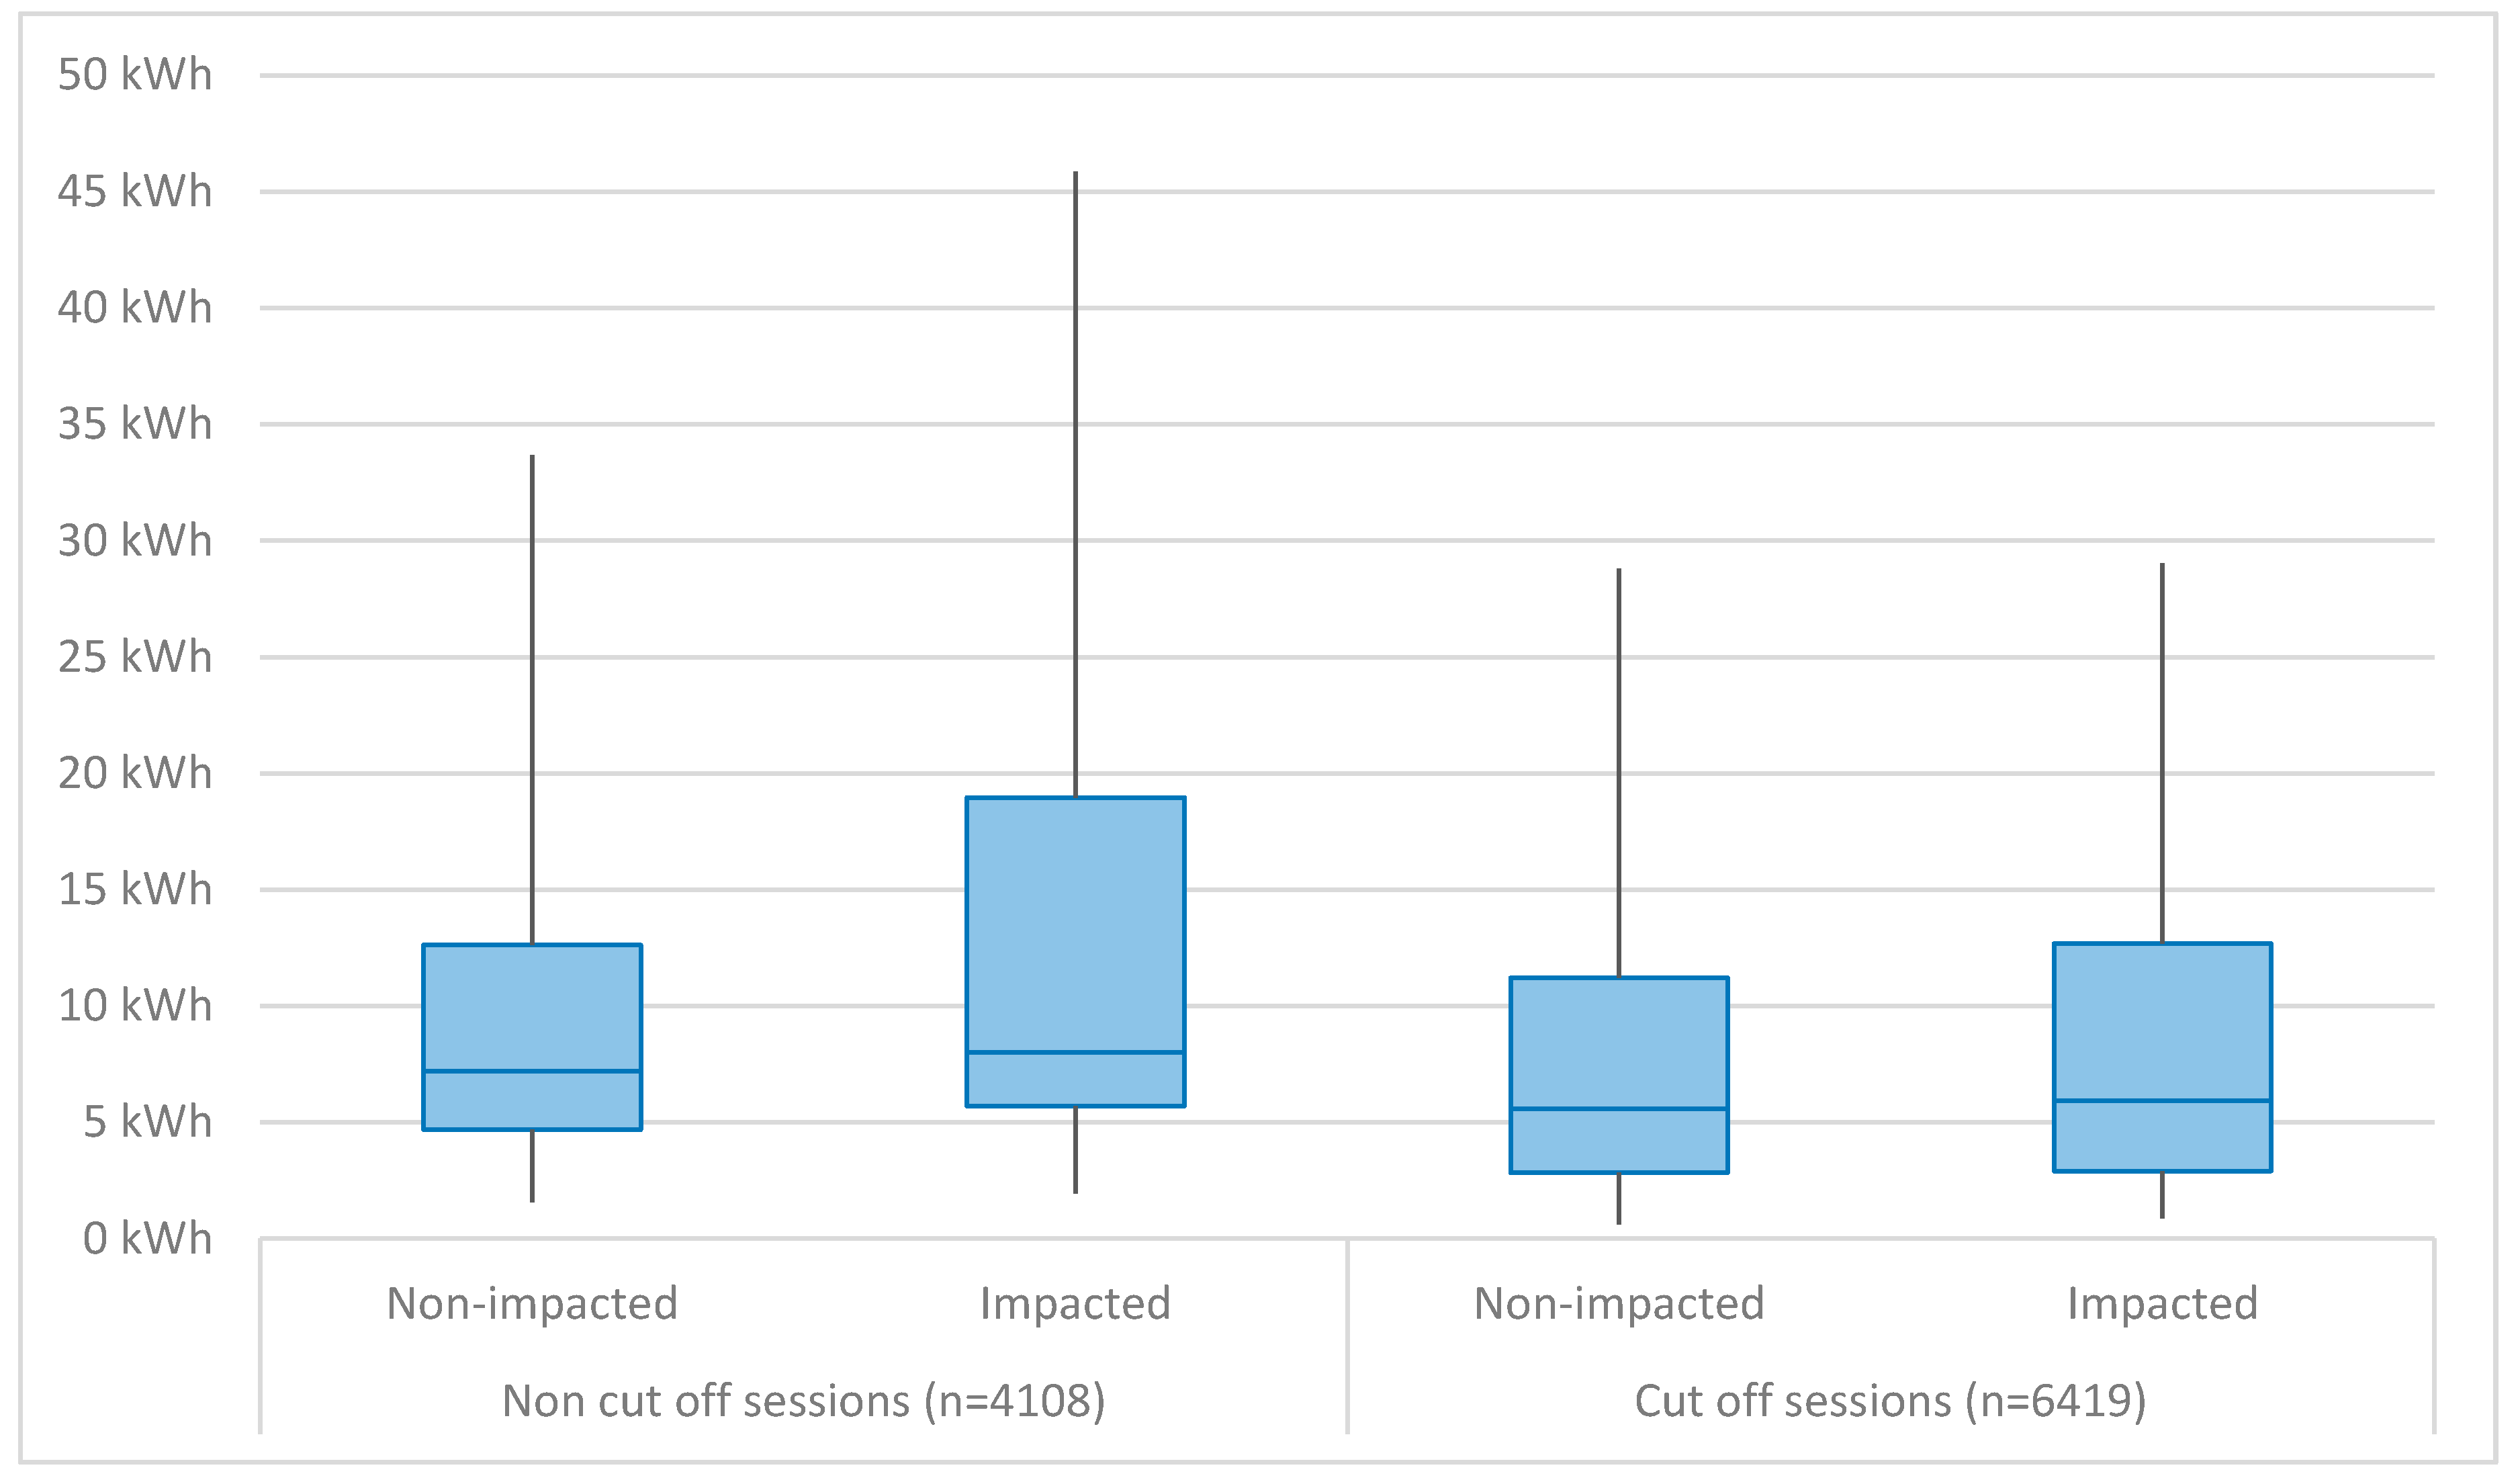
We looked a bit further into the 150,000 sessions to determine the impact of our algorithms on charging with respect to the amount of energy charged. As mentioned earlier, we treated all sessions equally and did not take into account the car characteristics in our decisions. In theory, the reduced charging rate can lead to more vehicles being cut off before they are fully charged, compared to the standard situation. In a cut off, the charging session is not finished when the connection to the charger is ended. Figure 8 shows the analysis results in this respect. Contrary to our expectations, the impacted sessions were cut off slightly less than the sessions that were not impacted by the rate limits; 44% vs. 49%, respectively. One explanation for this observation is that the connection times of the sessions that were impacted were 40.2 min longer on average (because a large portion of the impacted sessions started in the early evening and stayed connected all through the night). It is also possible that the impacted sessions arrived at a higher state of charge on average, but we do not have data available from the car to verify this possible explanation.
When looking in more detail at a group of sessions with a large percentage of cut-offs, as shown in Figure 9, the impacted sessions charged more kWh. A difference was visible in the non-cut-off sessions, shown on the left, but also present in the cut-off sessions. This was the opposite of our expectation, which was that the cut-off sessions within the impacted group would have charged lower amounts of kWh. This shows that for this population, the group that was smart charged did not experience any effect of the smart charging with respect to the kWh they could charge. To understand why the impacted group could charge as much as they did, we need more detailed information about the vehicles, which we currently do not have access to.
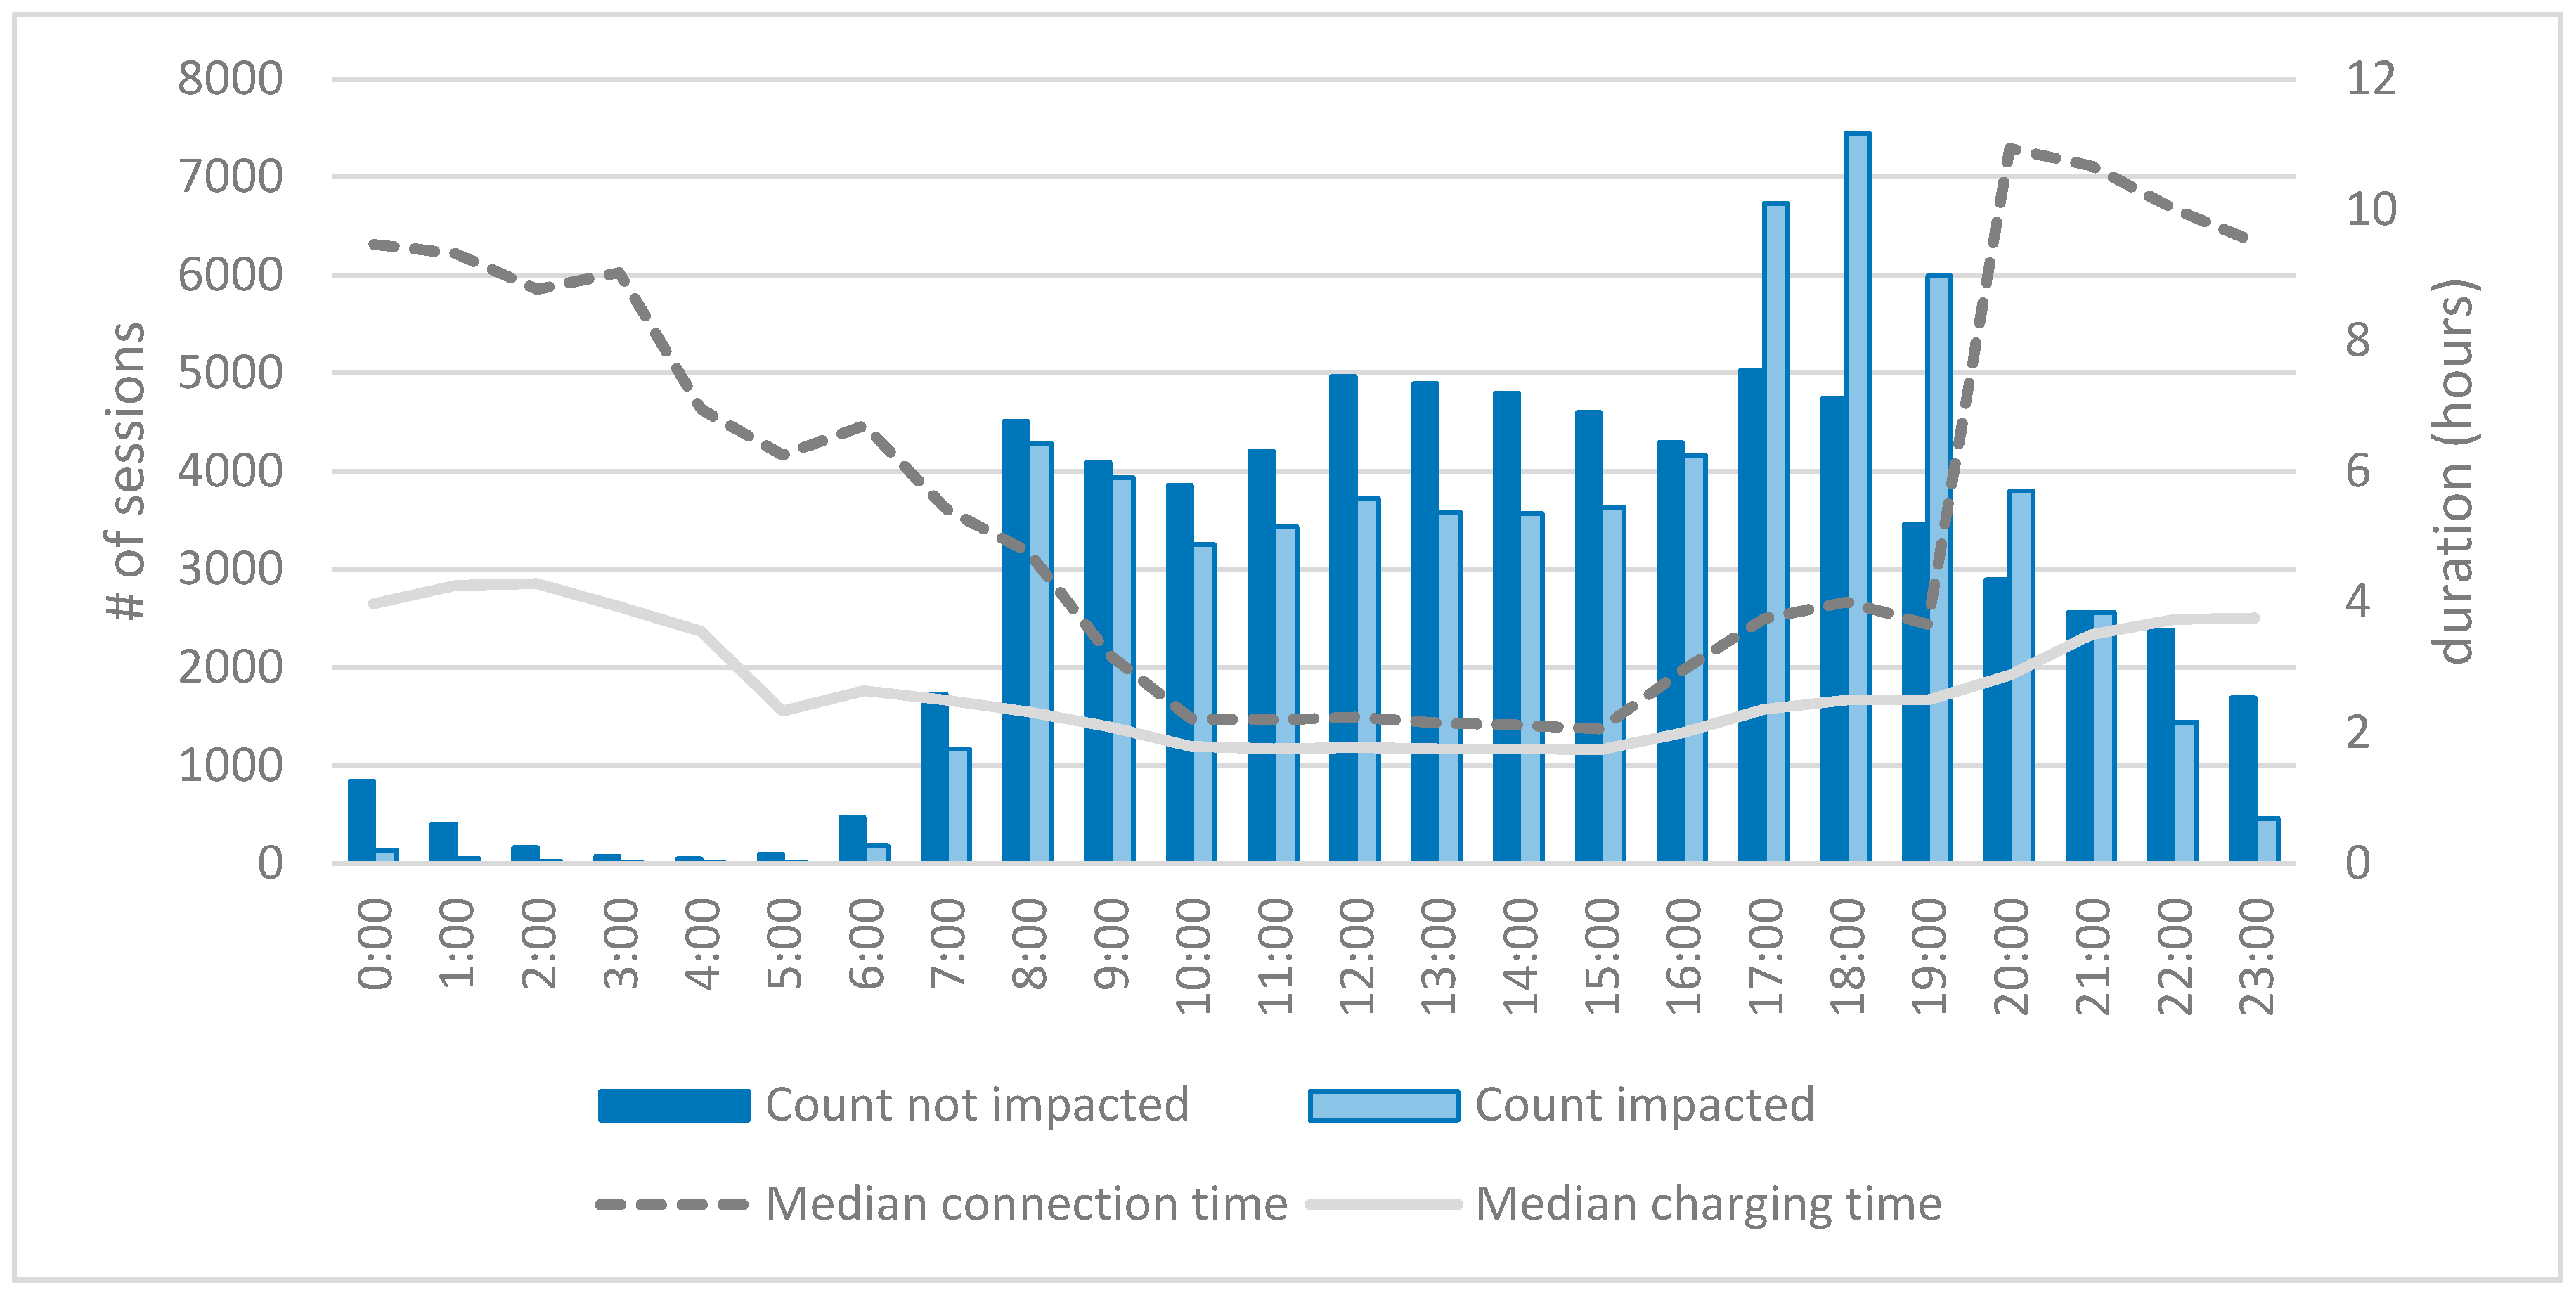
An analysis of the distribution of charging start times throughout the day, compared to the total connection time of each session (Figure 10), provides valuable information on the likely impact of our smart charging algorithm per starting hour of the session. As can be expected, sessions that start in the early evening generally stay connected all through the night. We also know from Figure 5 that energy consumption is highest around these hours. This means that sessions that start in the early evening are more often impacted by our smart charging regime, but are less likely to experience any effect on the total charged energy because of their long connection time compared to other impacted sessions.
To check the hypothesis that the sessions did not experience any negative effects from our algorithms because they were connected long enough, we looked into the specifics of the sessions that represented the largest portion of our data, namely the sessions that started in the early evening. The following two figures show the impact of limiting the charging speed for those sessions in more detail. When looking into the connection duration compared to the charging duration, as shown in Figure 11, the average connection time of both impacted and non-impacted sessions was almost similar, but the charging time logically differed. Based on the overlap in the averages for connection and charging time, there appears to be a group of early evening sessions that leaves relatively soon and is likely to experience a cut-off during the session. To assess the way in which the DSO profiles impact these drivers, we need to know what percentage of early evening sessions is cut-off and how much energy these sessions received.
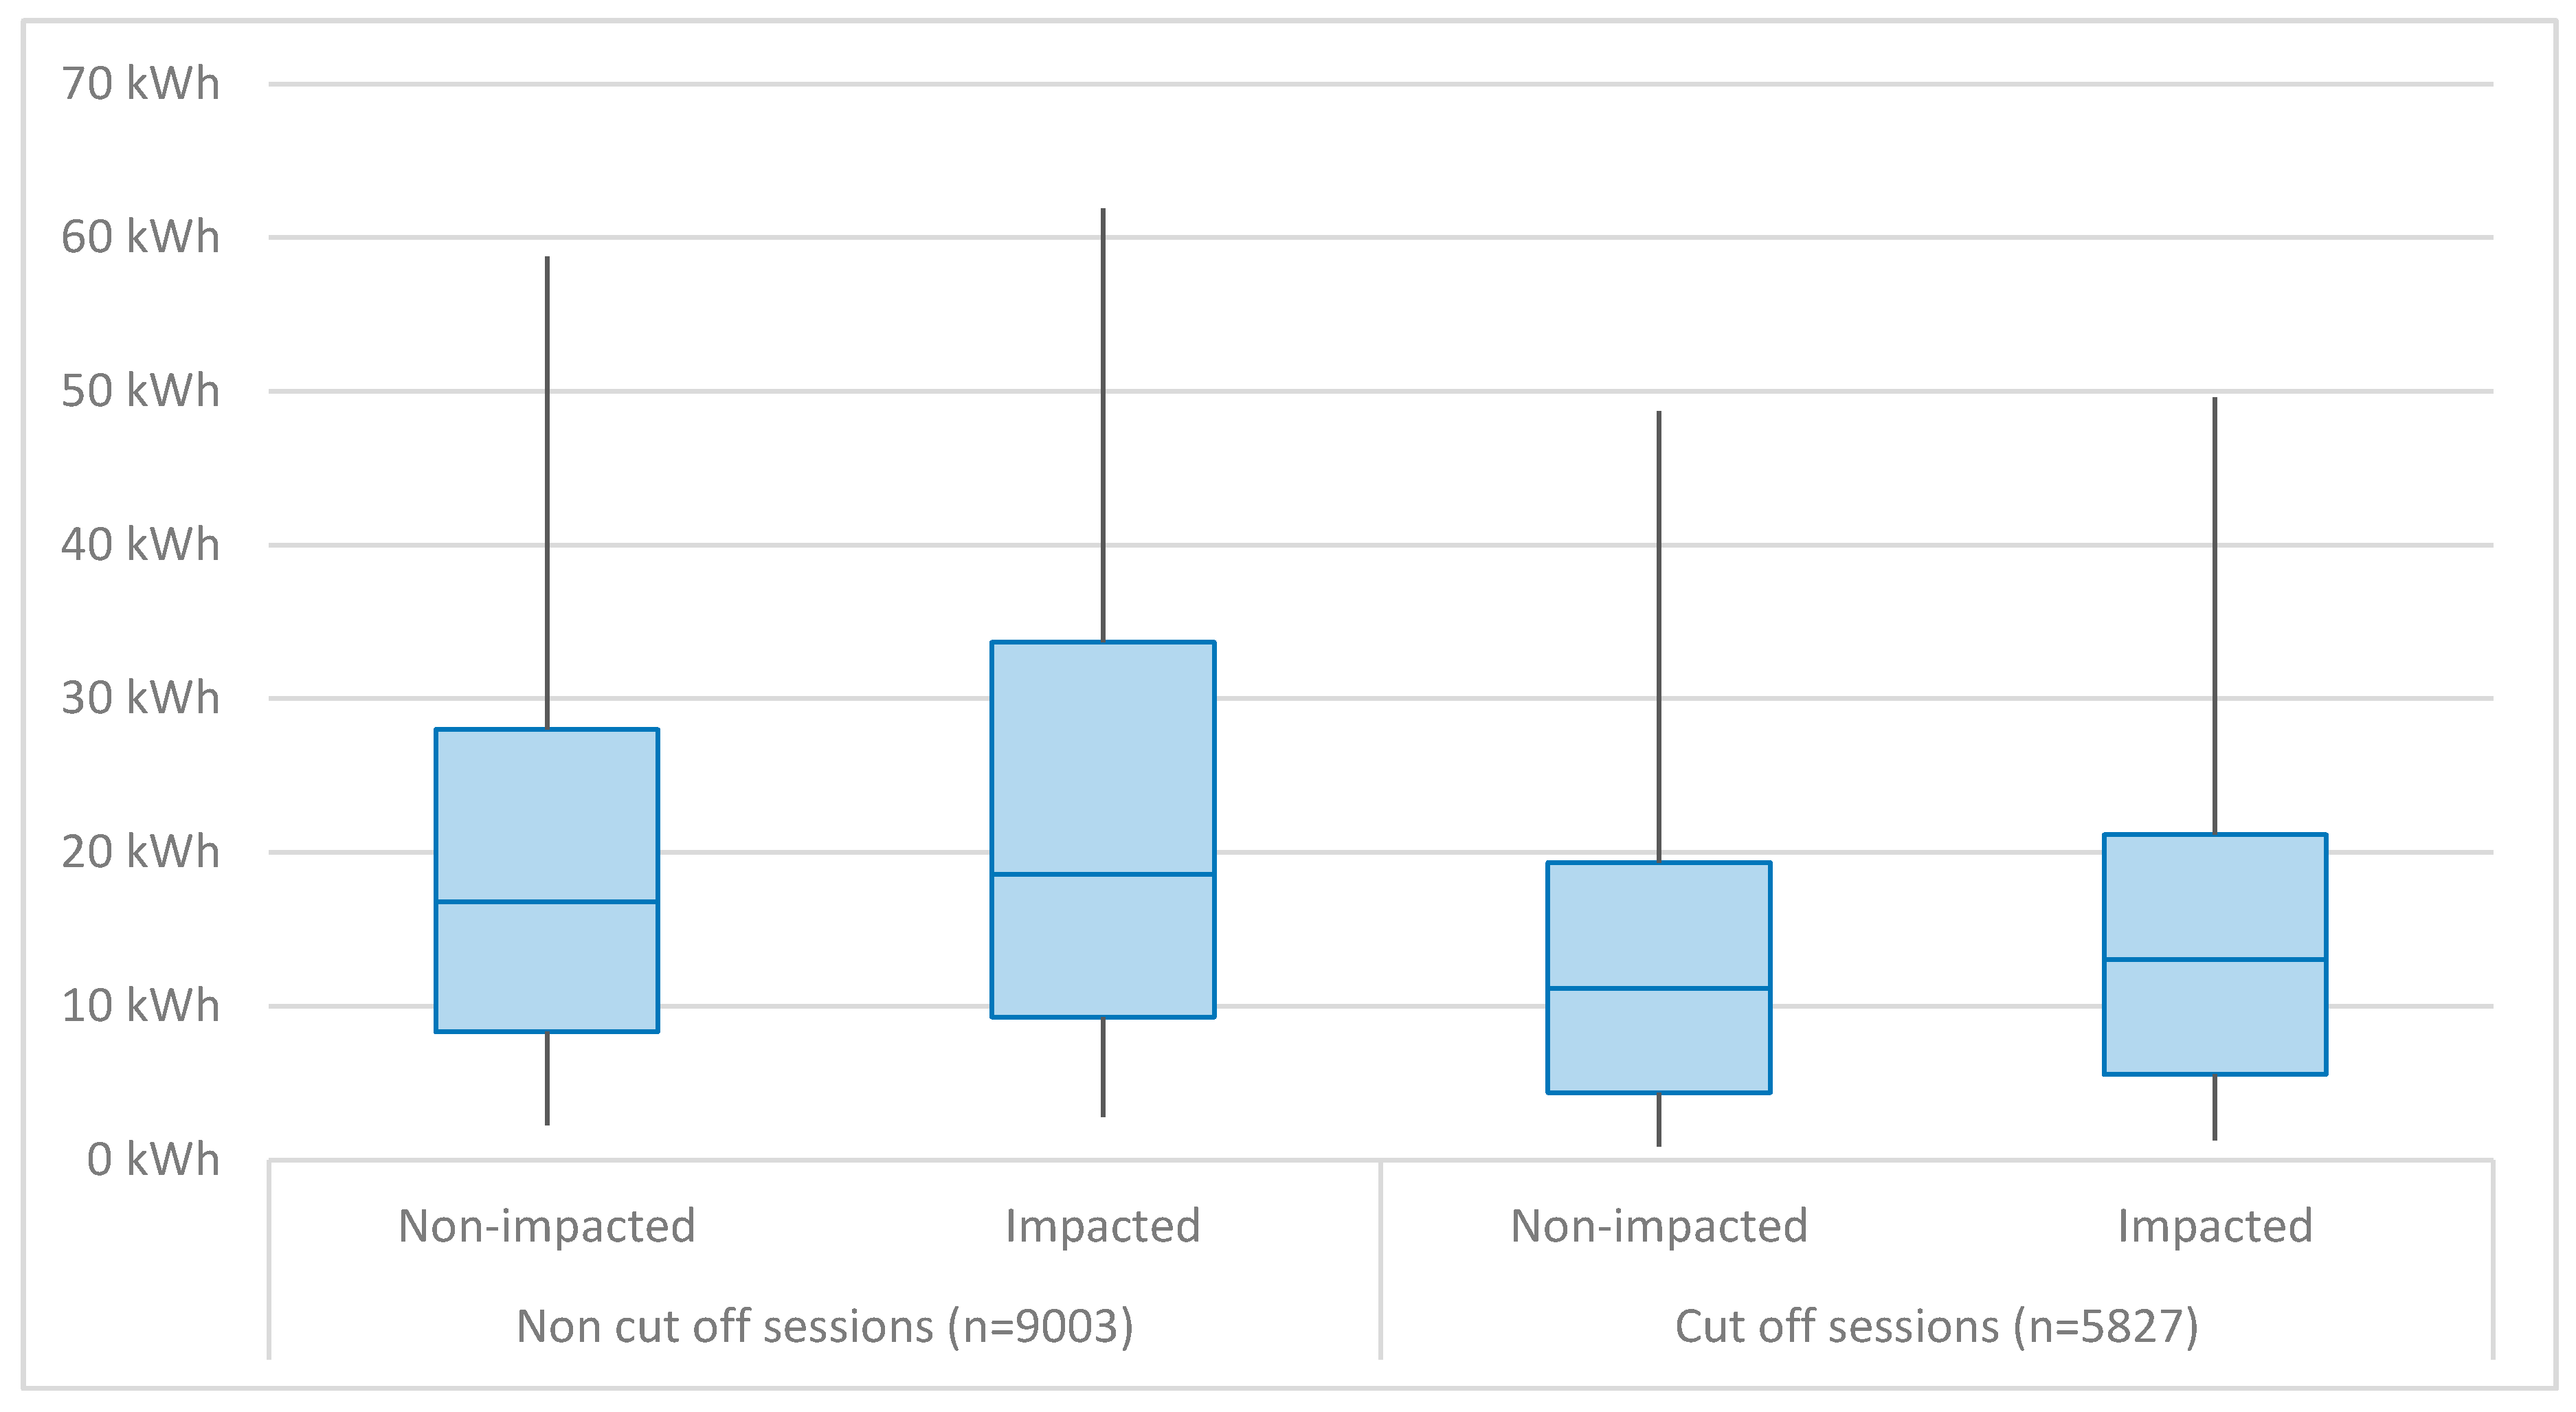
Figure 12 shows the amount of energy charged in the cut-off sessions from Figure 11, in other words, the sessions in which the connection time equaled the charging time. The cut-off sessions are shown for both the impacted and non-impacted sessions. The amount of energy charged in the cut-off sessions that were impacted by smart charging was slightly higher than in the non-impacted cut-off sessions. The most likely explanation is that, similar to what was found in Figure 8, the sessions were not similar with respect to the starting conditions and parking duration, with the cut-off impacted sessions having more favorable conditions with respect to the amount of energy they could charge than the non-impacted cut-offs. That we found this result with this large number of sessions (almost 15,000 sessions in this timeframe) was unexpected, but shows that smart charging does not necessarily cause different charging outcomes with respect to delivered energy, even in cut-off sessions. However, with the current system, working with the information available at present, we cannot divide sessions into groups with special strategies to distribute the energy equally amongst the cars.
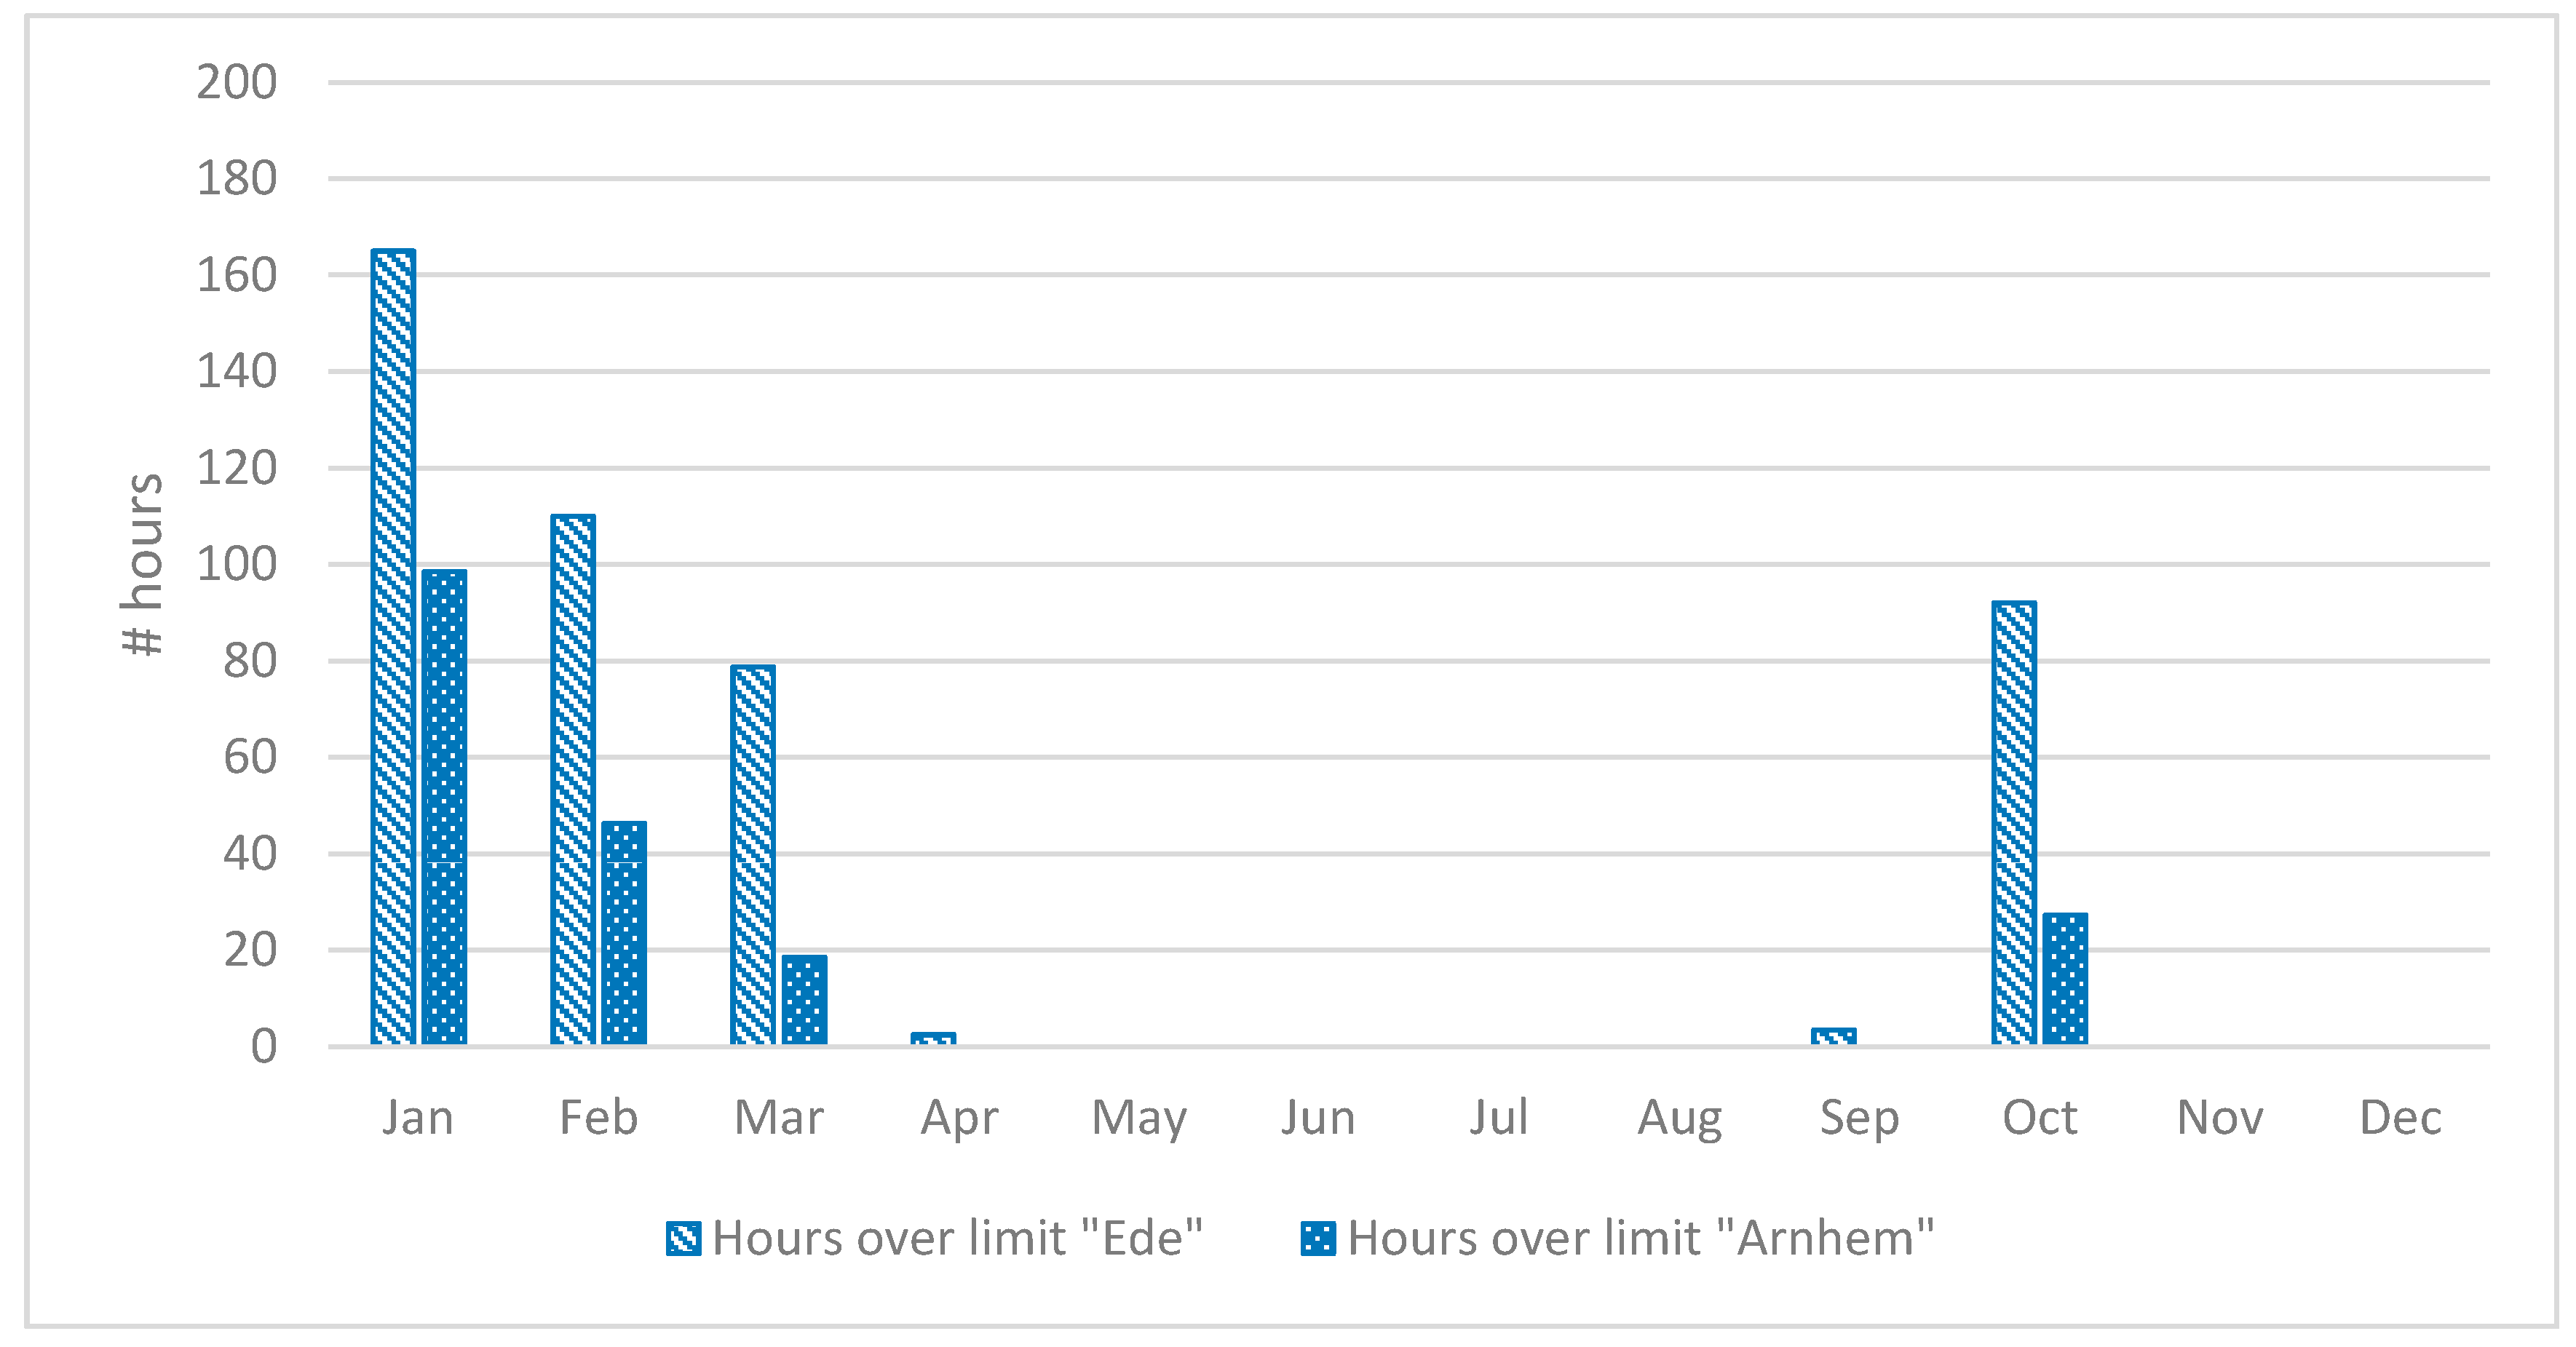
As stated in paragraph 2, we chose an experimental set-up where we did not allow charging speeds below 13 A. Within this limitation and given the number of chargers we introduced per transformer, we obtained proof that we could control the charging effectively. However, as Figure 13 shows, the lower limit of the sessions was not low enough to prevent transformer overload in the winter months. In these situations, our sequence of actions, as described in paragraph 2, resulted in an overrule situation for the calculated charging speed below 13 A, setting it at 13 A instead.
Since our set-up was virtual, no actual damage to the transformer occurred in the periods of transformer overload. However, it is clear that seasonal effects can be of influence to EV charging and this should be taken into account in smart charging strategies.
4. Discussion
We have developed a system that can control a large number of charging sessions to respond to real time grid limitations. Using standard controls, operated for all active sessions simultaneously, we monitored over 150,000 sessions and successfully sent out adjusted charging profiles to 52% of these sessions, limiting the charging to below 20 A (but not lower than 13 A). Additionally, we found that in the other 48% of the sessions, we could charge the electric vehicles at higher power than is normally available throughout the entire charging period, without any negative impact on the grid. The fact that we could do this is due to our connections being 3 × 35 A instead of the regular 3 × 25 A. We have not found a significant effect on the kWh charged between sessions that were and were not impacted. With these results, both our hypotheses have been proven: Our protocol (within the limitations we used) allows for the efficient charging of large numbers of EVs within the capacity restrictions of the transformer the chargers are (virtually) connected to. This could be done without any significant difference in the charged energy between groups of EVs that did and did not have smart charging rules applied to their session.
During our project, we found indications that the sessions that were impacted by smart charging might have been sessions that were connected for longer than average. The impacted sessions also seem to have charged more kWh than the average, even though they were restrained by our protocol. Due to these characteristics, the impact of the smart charging algorithms on driver experience with respect to how much kWh they received was reduced, which is positive. However, since it was not under our control, we cannot claim this as our success.
Since our pilot results are positive, we will further develop our protocol adaptions to a new release of OSCP (OSCP 2.0).
If we could obtain more information per charging session to use as input for the charging, this could be used to further optimize smart charging in connected groups of chargers such as our pilot group. The most useful data for this improvement would be arrival state of charge and total battery capacity. The same data could also be used to identify possible outliers in the sessions that take place in situations with severe grid limitations (mostly early evenings in winter months). If we could take into account the expected energy needs per vehicle, smart charging could be improved without the need to add user input. We therefore invite car manufacturers to supply these data through the protocols already in place between the vehicle and charger, so that other parties can use it in their decisions.
Author Contributions
Conceptualization, F.G.; Methodology, M.Z. and S.J.; Software, S.J.; Validation, M.Z., S.J., and F.G.; Formal analysis, S.J.; Investigation, M.Z.; Resources, F.G.; Writing—original draft preparation, M.Z.; Writing—review and editing, F.G. and S.J.; Visualization, M.Z. and S.J.; Supervision, F.G.; Project administration, F.G.; Funding acquisition, F.G. All authors have read and agreed to the published version of the manuscript.
Funding
This research was funded by the European Union’s Horizon 2020 Research and Innovation Program under grant agreement number 731148.
Acknowledgments
The authors thank the program partners from INVADE for their valuable discussions during.
Conflicts of Interest
The authors declare no conflicts of interest.
References
- Downloaded pdf-file “Green Deal Electric Transport 2016–2020” from Greendeals Website. Available online: https://www.greendeals.nl/sites/default/files/downloads/Green-Deal-Electric-Transport-2016-2020.pdf (accessed on 12 November 2019).
- International Energy Agency. Global EV Outlook 2019; IEA Publications: Paris, France, 2019; pp. 35, 115–119, 214. [Google Scholar]
- Downloaded pdf-file “Coalition Agreement 2017-Confidence in the Future” from Kabinetsformatie 2017. Available online: https://www.kabinetsformatie2017.nl/documenten/verslagen/2017/10/10/coalition-agreement-confidence-in-the-future (accessed on 12 November 2019).
- Van Amstel, M. Flexibility System Design for Electric Vehicles. Performing Congestion Management for the DSO; University of Twente: Drienerlolaan, The Netherlands, 2018; Available online: https://www.elaad.nl/uploads/files/Final_report_Marieke_van_Amstel.pdf (accessed on 12 November 2019).
- Fischer, D.; Harbrecht, A.; Surmann, A.; McKenna, R. Electric vehicles’ impacts on residential electric local profiles—A stochastic modelling approach considering socio-economic, behavioural and spatial factors. Appl. Energy 2019, 233, 644–658. [Google Scholar] [CrossRef]
- Beltramo, A.; Julea, A.; Refa, N.; Drossinos, Y.; Thiel, C.; Quoilin, S. Using electric vehicles as flexible resource in power systems: A case study in the Netherlands. In Proceedings of the 14th International Conference on the European Energy Market (EEM), Dresden, Germany, 6–9 June 2017. [Google Scholar]
- Central Bureau for Statistics Website. Available online: https://www.cbs.nl/en-gb/news/2019/17/solar-panel-capacity-up-by-more-than-half (accessed on 12 November 2019).
- Rijksdienst Voor Ondernemend Nederland Website. Available online: https://www.rvo.nl/onderwerpen/duurzaam-ondernemen/energie-en-milieu-innovaties/elektrisch-rijden/stand-van-zaken/cijfers (accessed on 15 October 2019).
- Netbeheer Nederland Website, File on Grid Capacity. Available online: https://www.netbeheernederland.nl/dossiers/netcapaciteit-60 (accessed on 12 November 2019).
- Netbeheer Nederland Website, Position Paper on Built Environment. Available online: https://www.netbeheernederland.nl/_upload/Files/Position_Paper_Gebouwde_Omgeving_tbv_rondetafel_28_maart_2019_144.pdf (accessed on 12 November 2019).
- Klimaatakkoord Website, National Agenda Charging Infrastructure. pp. 9, 13. Available online: https://www.klimaatakkoord.nl/documenten/publicaties/2019/06/28/achtergrondnotitie-mobiliteit-laadinfrastructuur (accessed on 12 November 2019).
- Helmus, J.R.; Spoelstra, J.C.; Refa, N.; Lees, M.; van den Hoed, R. Assessment of public charging infrastructure push and pull rollout strategies: The case of the Netherlands. Energy Policy 2018, 121, 35–47. [Google Scholar] [CrossRef]
- Energiekaart Website. Available online: https://www.energiekaart.net/trending-products/distributie-automatisering-light/ (accessed on 12 November 2019).
Figure 1.
Overview of (a) the actual geographic distribution of the chargers used and (b) some photos of the hardware.
Figure 1.
Overview of (a) the actual geographic distribution of the chargers used and (b) some photos of the hardware.

Figure 2.
Layout of the neighborhoods used in the pilot, visualizing the number of chargers virtually placed there.
Figure 2.
Layout of the neighborhoods used in the pilot, visualizing the number of chargers virtually placed there.

Figure 3.
Schematic routing of the communication involved in steering charge points to the combination of distribution system operator (DSO) and commercial profiles. All communication takes place through open protocols.
Figure 3.
Schematic routing of the communication involved in steering charge points to the combination of distribution system operator (DSO) and commercial profiles. All communication takes place through open protocols.

Figure 4.
Schematic overview of the control algorithms in the Open Smart Charging Protocol OSCP, resulting in steering messages in Open Charger Point Protocol OCPP going to the charging station (CS) and metering results being fed back to the DSO.
Figure 4.
Schematic overview of the control algorithms in the Open Smart Charging Protocol OSCP, resulting in steering messages in Open Charger Point Protocol OCPP going to the charging station (CS) and metering results being fed back to the DSO.

Figure 5.
Flexible loads for electricity throughout the year, used as input for the charging sessions in the Ede neighborhood. The area below the plot is the available capacity on the grid. The profile shows that there is more available capacity on the transformer in summer.
Figure 5.
Flexible loads for electricity throughout the year, used as input for the charging sessions in the Ede neighborhood. The area below the plot is the available capacity on the grid. The profile shows that there is more available capacity on the transformer in summer.

Figure 6.
Flexible load per day of the week. A clear daily usage profile occurs with the evening peak causing the biggest load on the transformer, resulting in minimal amounts of available capacity on the transformer. The profile is shown here for a week in January, where electricity usage is at its highest. The load follows the same basic shape in summer, but the minimum available load is higher in summer.

Figure 7.
Total number of charging sessions per month, divided in non-impacted and impacted sessions.
Figure 7.
Total number of charging sessions per month, divided in non-impacted and impacted sessions.

Figure 8.
Comparison of cut-offs in the two groups of sessions: non-impacted and impacted. Both groups have cut-off sessions. The non-impacted sessions have slightly more cut-offs than the sessions that were smart charged.
Figure 8.
Comparison of cut-offs in the two groups of sessions: non-impacted and impacted. Both groups have cut-off sessions. The non-impacted sessions have slightly more cut-offs than the sessions that were smart charged.

Figure 9.
The amount of energy charged across all sessions that started between 12:00 and 13:00 h.

Figure 10.
Number of sessions (left y-axis) and session duration (right y-axis) per starting hour.

Figure 11.
Connection times versus charging times for all sessions started in the early evening (18:00–19:00 h). Horizontal lines in the box plots are the averages, column shows the first standard deviation.
Figure 11.
Connection times versus charging times for all sessions started in the early evening (18:00–19:00 h). Horizontal lines in the box plots are the averages, column shows the first standard deviation.

Figure 12.
Cut-off sessions within the group of sessions that started in the early evening (18:00–19:00 h).
Figure 12.
Cut-off sessions within the group of sessions that started in the early evening (18:00–19:00 h).

Figure 13.
Hours per month in which the granted capacity exceeded the transformer limits. Please note that no data for November and December had been collected at the time of writing.
Figure 13.
Hours per month in which the granted capacity exceeded the transformer limits. Please note that no data for November and December had been collected at the time of writing.


Table 1.
Sociodemographic characteristics of the two neighborhoods used as input for the calculated capacity profiles and distribution of the charge points.
Table 1.
Sociodemographic characteristics of the two neighborhoods used as input for the calculated capacity profiles and distribution of the charge points.
| Ede | Arnhem | |
|---|---|---|
| Household connections | 490 | 305 |
| Energy consumption/year (measured) | 3.14 GWh | 1.16 GWh |
| Actual amount of cars | 349 | 217 |
| Virtual charging stations | 364 | 322 |
© 2020 by the authors. Licensee MDPI, Basel, Switzerland. This article is an open access article distributed under the terms and conditions of the Creative Commons Attribution (CC BY) license (http://creativecommons.org/licenses/by/4.0/).
Share and Cite
MDPI and ACS Style
Zweistra, M.; Janssen, S.; Geerts, F. Large Scale Smart Charging of Electric Vehicles in Practice. Energies 2020, 13, 298. https://0-doi-org.brum.beds.ac.uk/10.3390/en13020298
AMA Style
Zweistra M, Janssen S, Geerts F. Large Scale Smart Charging of Electric Vehicles in Practice. Energies. 2020; 13(2):298. https://0-doi-org.brum.beds.ac.uk/10.3390/en13020298
Chicago/Turabian StyleZweistra, Marisca, Stan Janssen, and Frank Geerts. 2020. "Large Scale Smart Charging of Electric Vehicles in Practice" Energies 13, no. 2: 298. https://0-doi-org.brum.beds.ac.uk/10.3390/en13020298
Note that from the first issue of 2016, this journal uses article numbers instead of page numbers. See further details here.