1. Introduction
In addition to overhead lines, cable lines (CLs) are one of the basic components of power systems. Overhead lines are more often used due to investment costs. Cable lines are used in areas where the construction of an overhead line is difficult or impossible, e.g., in highly urbanized areas [
1]. Another argument deciding about the using of the cable line is also the need to increase the reliability of the power supply. Overhead lines, due to their construction, are exposed to weather conditions, i.e., wind, lightning, or rime. As a result, overhead lines become damaged more often than cable lines. In Poland, it was particularly visible in 2017, when overhead lines were damaged almost twice as often as cable lines (
Figure 1). The reasons for this were mainly weather anomalies, in particular, hurricanes in August and October in 2017.
Due to the consumers’ power supply quality, the low values of SAIDI (System Average Interruption Duration Index) and SAIFI (System Average Interruption Frequency Index) are desirable, which illustrate the frequency and time of interruptions in the supply of electricity to customers. The need to reduce these indicators is currently visible in Poland. Using appropriate regulations [
3], a several-year plan was adopted to bring Polish distribution system operators (DSOs) closer to SAIDI and SAIFI ratios observed in Western European power systems. One of the basic methods is the use of cable lines instead of overhead lines, which makes it possible to completely protect the power line against atmospheric conditions. Therefore, it should be expected that the MV cable lines comparing to overhead lines will be more frequently constructed in the Polish power system in the coming years.
It should be noted that the percentage of cable lines in MV networks in Poland has not changed significantly in recent years (
Figure 2) and Poland is placed in the group of countries with a low share of cable lines compared to other European countries [
4].
The increase in electricity demand, the development of distributed energy sources and the planned development of electromobility causes that DSOs are considering the economic efficiency of solutions used to reduce transmission losses. The most common and most preferred solution used by operators to reduce the power losses is the optimal locations of tie open points in MV networks. It is also used for existing MV networks [
5].
Medium voltage cable lines are usually built using cables with a coaxial return wire. In such cases, DSOs use a scheme in which the sheaths are earthed on both sides of the cable line. In this system, currents are induced in the sheaths [
6,
7,
8,
9]. It creates an additional component of energy losses. The magnitude of the induced currents, and thus energy losses, depends on many parameters, including the cross-section of the conductor and the sheath, the distances between the cables, the length of the cable line, the currents flowing in the conductors, etc. The currents flowing in the return cores constitute an additional source of cable heating, which may have a negative effect on the cable lifetime and at the same time, it limits its current-carrying capacity. For this reason, in practice, HV cable lines without cross-bonding are not used, unless the line is lightly loaded.
Unearthing of sheaths is a solution that effectively limits the currents flowing in them. Another way is to use the cross-bonding of sheaths while leaving both sides earthed. The first solution is not considered by Polish DSOs in MV networks. The main reason is the intention to keep the sheaths’ potential close to zero, and to ensure a path for short-circuit currents during failure. The second solution, i.e., cross-bonding, is also not commonly used. The main reason is the low load of the MV network, hence the losses in the sheaths are relatively small. However, as the demand for electricity increases, the areas of the MV network appear with a greater power lines load, which makes it economically legitimate to use sheath cross-bonding. An example of the use of cross-bonding in the MV cable line in the Polish power system is presented in the publication [
10].
According to the World Bank, energy losses associated with the transmission of electricity in the world’s power systems are at the level of 7% to 10% of all generated energy [
11]. More than half of the energy losses are related to the distribution network [
12,
13]. For example, in 2018 electricity generation amounted to 26,672 terawatt-hour (TWh) worldwide [
14], assuming transmission losses of 7%, this translates into 1867 TWh of energy losses. Thus, assuming an energy price of 0.2159 €/kWh [
15], a reduction of losses of up to 0.1% could bring a global benefit of 5.8 billion euros. This means that the search for solutions to reduce losses associated with the transmission of energy remains justified.
2. The Analysis of Cable Lines
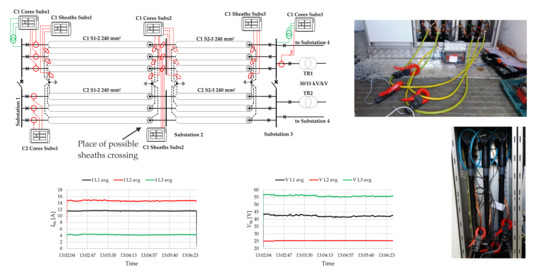
Although MV networks operate with low load, there are cases where MV cable lines are loaded enough that the cost-effectiveness of transmission loss optimization can be considered. This article presents an example where the coastal area of northern Poland is powered by two 30 kV cable lines with a cross-section of 240 mm
2 (
Figure 3). Both cable lines link the same power stations (Substation 1 with Substation 3). Their route is slightly different, hence, there are differences in the lengths of sections of cable lines.
In normal operating conditions, both cable lines work independently, reserving each other. The given example is an interesting case, because in about 70% of the length of the line, there is an intermediate substation. In the substation, both lines are connected to the busbars, and their sheaths are earthed. There is no power output at this substation. This is a possible place where sheaths crossing can be easily done while the investment cost is practically zero.
For the above example, calculations of currents induced in sheaths were made. The analyses were carried out in two steps. In the first step, the measurements were carried out on a real object for various systems of crossing sheaths at Substation 2. In the second step, model analyses were performed, where the measurements from step 1 were used in the construction and validation of the mathematical model. Thanks to this, it was possible to bring the mathematical model closer to reality. This is important, because the cable lines routes are not in a straight line along their entire length. They change their direction many times, hence, their arrangement may often differ from the planned one. As a result, the values obtained from the simplified mathematical model may differ significantly from reality.
The cable lines described in this publication have already been analyzed, and the results of these analyses are presented in the publication [
16]. Those analyses were based on measurements made on 29 June 2018 for one cable line only. Measurements were carried out sequentially at two substations, first at Substation 3 and then at Substation 2. Then the sheaths cross-bonding in Substation 2 was also not scheduled. Based on those analyses, the operator did not decide to change the way of connection of the sheaths, but decided to carry out more comprehensive measurements. It was planned, inter alia, that the measurements should include both cable lines, ensure measurement in three substations simultaneously and additionally check the different sheaths crossing in Substation 2.
Before the measurements made on 30 October 2019, there was verified (not measured at 29 October 2018) the cable lines cross-section. The operator independently measured the resistance of the conductors, which shows that both cable lines cross-section is 240 mm2. The obtained resistance values are equal to:
C1 S1-2: RL1 = 3.691 Ω; RL2 = 3.689 Ω; RL3 = 3.689 Ω;
C1 S2-3: RL1 = 2.663 Ω; RL2 = 2.664 Ω; RL3 = 2.660 Ω;
C2 S1-2: RL1 = 3.795 Ω; RL2 = 3.793 Ω; RL3 = 3.802 Ω;
C2 S2-3: RL1 = 2.641 Ω; RL2 = 2.646 Ω; RL3 = 2.639 Ω.
The analyses included in this publication should be considered as a broader view in relation to the publication [
16], providing a more complete look at the issue in question.
In economic analyses, when the profitability of the considered solutions was assessed (Chapter 5.1), the active and reactive power loads on both lines and the phase voltages in Substation 1 recorded by the Supervisory Control And Data Acquisition system (SCADA) in 2017 were used. They were presented in the publication [
16], in
Figure 2,
Figure 3, Figures 7 and 8, respectively.
In the area supplied by the considered cable lines, the load increases (Figure 2 in [
16]) in the summer, which is characteristic for the coastal, recreational area. The load increase on Circuit 1 cable line is also visible in November and December of the considered year. The reason was a planned outage of Circuit 2 cable line during this period and taking over its load by Circuit 1 cable line. Both power lines are also significantly loaded with reactive power throughout the year, and this power flows towards the HV/MV supply (Figure 3 in [
16]). About 60% of reactive power is generated by the considered cable lines. The remaining part, comes from other 30 kV cable lines and 15 kV network supply by transformers in Substation 3. The analysis of reactive power values suggests that it may be economically reasonable to realize reactive power compensation. The place and var compensator rating remains an open question, and it is not considered in the paper.
The main purpose of the article is to verify whether there is an economic reason for the use of incomplete cross-bonding in an MV cable line, i.e., for crossing sheaths only in one place. The analyses were performed in the DIGSILENT PowerFactory program.
3. Measurements of the Real Object
Determination of energy losses incurred in the cable line, including sheaths, can be done in a simulation environment using a mathematical model. For this purpose, a model of the analyzed cable line and its load should be made. However, it should be taken into account that the route of the actual cable line is usually associated with the occurrence of crossing with other technical objects, which forces the use of casing pipes for cables [
17]. These sections have individual cable spacing apart. In addition, there are also changes in the direction of the line route, which affect the mutual displacement of cables. Therefore, building a mathematical model containing all the details of a cable route is difficult. On the other hand, when analyzing a cable line operation for several years, relying on technical documentation may not reflect the exact current state. The above causes mean that the use of the simplified model of the cable line, in which the distance between individual cables are constant along its entire length, can lead to erroneous conclusions regarding the values induced in sheaths [
18]. Thus, this leads to an incorrect assessment of the reasonability of the use of solutions to reduce transmission losses. In turn, making measurements gives the opportunity to verify and correct the mathematical model of the cable line. Based on the measurements, alternative distances between individual cables can be selected [
16], so that the values obtained from the model coincide with the values measured on the real object. This approach was used in this case. It should be noted here, that currently, Polish distribution operators do not have procedures for multi-point measurements of currents flowing in cable lines and do not carry them out. The reason is the relatively low MV network load, which causes the problem of transmission losses in sheaths to be neglected.
For the operator, taking measurements is usually a state of disruption to standard work and involves a certain organizational effort and the involvement of human resources. The assumptions made before the measurements envisaged carrying out measurements at all three substations simultaneously. This required the application of an appropriate measurement strategy, so that recordings could later be used to verify the mathematical model. For this purpose, the following assumptions were made before the measurements:
Measurements were made independently for both cable lines;
In each of the three substations, for the cable line under analysis, the currents flowing in the cores and the currents flowing in the sheaths were measured;
In Substations 1 and 2, the voltages of the cable cores were measured;
In Substation 1, the current flowing in the cores of the second cable line (not currently analyzed) was measured;
Measurements were made for the following five operating systems of sheaths in Substation 2:
- ◦
Sh1 sheaths earthed;
- ◦
Sh2 sheaths unearthed and uncrossed;
- ◦
Sh3 sheaths cross-bonded according to sequence: L1 → L2, L2 → L3, L3 → L1;
- ◦
Sh4 sheaths cross-bonded according to sequence: L1 → L3, L2 → L1, L3 → L2;
- ◦
Sh5 sheaths cross-bonded according to sequence: L1 → L3, L2 → L2, L3 → L1;
Measurements were made for three different operating systems of both lines: (1) unilateral switching on of the analyzed line, (2) parallel operation of both cable lines, (3) power transmission only by the analyzed cable line, (the second cable line turned off).
The location of measuring devices is shown in
Figure 4.
The measurement of currents flowing in the sheaths was done using measuring clamps mounted directly on the sheaths. In Substation 1, currents flowing in cores were measured using existing current transformers of the analyzed cable line. In turn, currents flowing in cores in Substation 3 were measured by existing current transformers of TR1/TR2 30/15 kV/kV transformers. The cable lines from Substation 3 to Substation 4 were turned off during the measurements. Thanks to this, the entire line load flowed through the metered transformer (
Figure 4).
Measurements in Substation 2 were made by two measuring devices. One device measured currents in the cores, and the other device measured currents in the sheaths. The cores and the sheaths current measurements were done with clamps (
Figure 5).
In the case of measuring currents flowing in the sheaths at this station, for sheaths, clamps were placed to measure the flowing currents both towards Substation 1 and towards Substation 3.
3.1. Actual Scheme Work of Cable Lines Sh1
The currently operating (Sh1) sheaths system in Substation 2 was analyzed first. For this work system, the examples of recorded waveforms at Substation 2 are shown in
Figure 6,
Figure 7 and
Figure 8. Some asymmetry is visible in the waveforms, both in the currents flowing in the cores (
Figure 6) and, as a consequence, in sheaths (
Figure 7 and
Figure 8). It is notable that the values of sheaths currents measured in direction to Substation 3 (
Figure 8), compared to the currents measured in direction to Substation 1 (
Figure 7) are more than twice as high. The reason is the share of capacitive currents in sheaths currents, which increase with the length of the line in the direction to Substation 1. Thus, the ratio of the sheaths currents to the cores currents for these two measurement sites is different, and for the direction to Substation 1, it is about 15%, and for the direction to Substation 3, it is about 31%.
The ratio of these two currents is at a similar level at the ends of both sections of the analyzed cable line. It changes with the line load change. This is apparent for various work schemes of cable lines (
Figure 9). The highest values of this ratio are observed for the system with a cable line switch on at one side.
3.2. Sheaths Unearthed and Uncrossed Sh2
Another analyzed operating scheme of sheaths in Substation 2 is their unearthing and interconnecting without crossing, using specially prepared bridges (Sh2). This enabled the continuity of sheaths for each cable along the entire length of the line from Substation 1 to Substation 3 (
Figure 10). Such a system allows to not only measure sheaths currents, but also the voltages of these wires in a certain length of the cable line, which is usually not possible.
In the analyzed case, the currents flowing in the cores are at a similar level to the previous sheaths operating system Sh1 (
Figure 11 vs.
Figure 6). In turn, sheaths currents are approximately the average value of currents measured in directions to Substation 1 and Substation 3 for the previous case (
Figure 12 vs.
Figure 7 and
Figure 8). The sheaths voltage measured at Substation 2 is about 26 V (
Figure 13).
3.3. Cross-Bonding of Sheaths in Substation 2—Cases Sh3–Sh5
The main purpose of the measurements was to check whether crossing the sheaths only in one place on the cable line would effectively reduce sheaths currents. Three different schemes of cross-bonding were checked:
Sh3: L1→L2, L2→L3, L3→L1, scheme recommended by [
6];
Sh4: L1→L3, L2→L1, L3→L2, scheme contrary to the recommended one;
Sh5: L1→L3, L2→L2, L3→L1, not recommended.
In the first system of sheaths cross-bonding (recommended) Sh3, sheaths currents in Substation 2 decrease to below 5 A (
Figure 14), at the same time with cores currents at the level of about 70 A (
Figure 15). Comparing these values to the measurements obtained for the actual operating system of sheaths, there is a reduction of these currents in Substation 2, depending on the measured side: measurement in direction to the Substation 1—by approximately 56%, measurement in direction to the Substation 3—by approximately 80%.
The unearthing of the sheaths in Substation 2 causes that the voltage distribution in these wires changes along the length of the entire cable. Voltages measured in Substation 2, with the load of the analyzed line shown in
Figure 15 and with the first sheaths system, reach values of about 56 V (
Figure 16). The values are more than twice as high as for unearthed, not crossed sheaths in Substation 2 (case Sh2).
The results for the other two cross-bonded systems of sheaths—Sh4, Sh5 are presented below. In both cases, the whole load of Substation 3 is also transmitted only by the analyzed cable line, and the currents flowing in the cores in Substation 2 are at the level of about 70 A.
Another system of sheaths cross-bonding, contrary to the recommended one, is less effective than it (
Figure 17). However, there is still a reduction of currents value compared to the actually used sheaths system and the sheaths voltages are reduced by about 25% (
Figure 18).
In turn, the last analyzed sheaths system is characterized by a large asymmetry of the currents flowing in sheaths (
Figure 19), where the range of these currents is from about 4 A to about 15 A. There is also visible a relatively high sheaths voltages asymmetry: from about 25 V to about 56 V (
Figure 20).
3.4. Switching Cable Line
Energizing a cable line is comparable to switching on a capacitor. In the initial phase, this process is accompanied by a temporary large increase in voltage and current. These values depend primarily on the length of the cable line and the voltage level. The values occurring for both analyzed cable lines can be observed in the measurements recording made at Substation 1, where the peak currents and voltages of working conductors were measured. In the case of Circuit 1 cable line and the actual sheaths system, the current peak in the cores reaches 574 A, which is marked as “Sh1” in
Figure 21. Subsequent changes in the sheaths system do not significantly affect the peak currents.
At the time of peak current, there is also a peak voltage, which for all sheaths systems is presented in
Figure 22. The use of sheaths cross-bonding does not increase these values, except for the not recommended cross-bonding system (Sh5).
4. Mathematical Model
The mathematical model of the analyzed part of the power system was made on DIgSILENT PowerFactory software. The cable system model consists of three single-core cables per one cable line. Each cable is modelled by conducting and insulating layers in a coaxial arrangement. These layers represent the core and the sheath, separated by semiconducting and insulating layers. The couplings between the single-core cables are also modelled by determining the cable layout and spacing. The impedance
Z and admittance
Y of cables are defined by the two matrix equations [
19,
20]:
where:
|V| and |I| are the voltage and current vectors respectively, at the distance x along the cable line;
|Z| and |Y| are square matrices of the impedance and admittance, respectively.
The complexity of |
Z| and |
Y| matrices depends on the number of cables and the number of layers per single cable. The impedance and the admittance matrices can be described in the following way:
where:
The matrices with subscript i define core, sheath and armour parameters;
The matrices with subscript 0 define parameters of the cable outer media (air, earth);
The matrices with subscript p and c define a pipe enclosure (if applied);
K is a potential coefficient matrix;
s = jω.
Details of the calculation of the individual components of the impedance and admittance matrices can be found in [
19].
The analysis of technical documentation regarding the route of both cable lines allows to reach a conclusion that the distance between those lines is large practically along their entire length. Therefore, they do not significantly affect each other, and the modelling of the couplings between them in PowerFactory is not necessary.
The single-core cables are positioned in the trefoil arrangement for both cable lines, according to technical documentation. This is justified by similar phase current values obtained from measurements made (Chapter 3). It should be remembered that the observed current asymmetry is also caused by the not balanced load of the supplying network. The not balanced load is taken into consideration in the model. In Substation 3, the independent loads are used for each phase of both cable lines. The active and reactive power demand for each phase (loads L1, L2, L3 in
Figure 23) for both cable lines (C1, C2) were changed during the analysis, according to the measurements recorded in 2017.
Graphical representation of the cables lines system model in PowerFactory is shown in
Figure 24. It contains elements used in the load flow and the short circuit analyses.
The voltage sources in the Substation 1 supply the analyzed network according to voltage measurement records from the year 2017 (Figures 7 and 8 in [
16]).
In the first approach, it was assumed that single-core cables are perfectly positioned in the trefoil, i.e., they contact each other along the entire length of the line. With this assumption, the values of sheaths currents deviate from the measured values.
Table 1 shows examples of values measured in Substation 2, for the study case where all the power was transmitted by the tested cable line. The approximation error between the sheath current values (measured values versus calculated values) ranges from 6.9% to 20.6%, depending on the section of the cable line (towards Substation 1 or towards Substation 3).
In turn, the change in the cable arrangement causes that the sheath current values change. Therefore, it is possible to search for a substitute cable layout (closer to real arrangement) by changing the position of the cables by about 0.5 cm in the horizontal and vertical axes, assuming that one of the cables is fixed (cable “L3” on
Figure 25). During the search, 2277 different cable arrangements were checked. Several cable arrangements gave similar values to the measured ones. The verification of the correctness of the selected arrangement was checked for two cases of scheme of sheaths (actual and with sheaths crossing), by comparing the measured values with those obtained from the model.
In the analyzed case, using this method, sheath currents obtained from the model were adjusted to the values measured on the real object (
Table 1).
The cable spacing obtained by the proposed method was used in further model analyses to assess the relevance of changing the earthing system of sheaths at Substation 2.
5. Model Analysis
Carrying out measurements on a real object, with simultaneous changing of the sheaths crossing and earthing system configuration, is a good way for the distribution network operator to assess what current values can be expected for various sheaths earthing systems. In addition, the electrical measurements made give the opportunity to tune and verify the mathematical model of the cable system, which allows to assess the economic efficiency of such a solution for a larger number of data in a wider time span. For this purpose, phase to earth voltage, active power (Figure 2 in [
16]), and reactive power (Figure 3 in [
16]) measurements recorded by the SCADA system at Substation 1 for the whole year 2017 for both cable lines were used.
The main incentive that may persuade the operator to change the arrangement of sheaths bonding in the MV cable lines is the possible economic effect. In this case, it is the result of reducing energy losses in sheaths, the cost of which should cover the cost of changing the arrangement in an acceptable time. At the same time, the change of the arrangement of sheaths bonding should ensure safe operation of the cable line, both in normal states and during possible short-circuits. These two aspects are presented below. The following variants of cables sheaths crossings were considered:
No crossings, sheaths bonded and earthed in Substation 1, 2, and 3 (existing layout);
Sheaths cross-bonding in Substation 2 (recommended layout);
Sheaths cross-bonding in 1/3 and in 2/3 of the line length (best layout);
Sheaths cross-bonding in 1/3 of the line length and in Substation 2;
Sheaths cross-bonding in 1/2 of the line length.
5.1. Short-Circuit Condition
Short-circuit analyses were performed on a model, in which the HV/MV station was modeled with three-winding transformer. The earth-fault compensation device was connected to the third transformer winding. In
Figure 3 and
Figure 24, the compensation device is represented by two shunt reactor in Substation 1, connected to the star point of the transformers. Additionally, the model of cable lines was modified by increasing of the number of sections to 28. As a result, more accurate information was obtained about the expected values of currents and voltages along the entire length of the cable line. Line-to-earth short circuit occurrence was analyzed every 1/28 of the line length (every 0.87 km), starting with Substation 1 and ending with Substation 3. The results presented below (
Figure 26) refer to Circuit 1 and depict the different arrangements of the sheaths bonding. Each of the presented Figures shows 28 charts of induced voltages along the entire length of the cable line. Each chart corresponds to a different point on the line where the line-to-earth short-circuit (S-C) is modeled.
The short-circuit analysis shows that, in the actual arrangement of the sheaths bonding, the voltage induced in the sheaths is highest for a short circuit halfway along the line section between Substation 1 and Substation 2. The value is relatively low and does not exceed 0.3 kV. Any other sheaths arrangement considered increases the maximum value of the voltage induced voltage. However, these values are still relatively low, and do not exceed 0.6 kV. Therefore, it can be concluded that the change of arrangement of the sheaths bonding in the cable lines under consideration does not cause the risk of the sheath’s excessive voltage (above voltage which could damage the outer sheath). It should be mentioned here that the commonly accepted value of the voltage induced in the sheath, considered as safe, is 5 kV. In fact, it is not a catalog value, because the outer sheath is not an insulating material, therefore, cable manufacturers do not provide electrical parameters for it.
5.2. Economic Analysis
The energy losses that were incurred in the system were assessed, depending on the different working configuration of cables sheaths. In order to compare the considered sheaths layouts, for each layout, the values of energy losses occurring in the entire cable line (including sheaths losses) were determined independently. It should be remembered that at the end of the year 2017, the cable line of Circuit 2 was de-energized, and the total load was transmitted by Circuit 1 (The cable line was re-connected in 2018). Hence, the energy losses should are considered together, as a sum of both cable lines energy losses. The price of the energy was assumed EUR 125.1 per 1 MWh for the calculation of the energy losses cost (non-household consumers electricity price in the EU during the first half of 2019 [
15]). In addition, the cost of crossing sheaths at a point other than in Substation 2 was estimated. The operator in this case requires a cable well that will allow the power brigade to access cables at the crossing point. This is dictated by the possible need to locate the place to the cable line failure. The cost of the crossing was estimated at EUR 1780 (EUR 1000 for cable well construction and EUR 780 for cable connector). The results of the economic analysis are summarized in
Table 2.
From the obtained results, it can be concluded that the sheaths cross-bonding at Substation 2 results in a reduction of sheath losses by over 8% throughout the year. This gives a measurable financial benefit by reducing the cost of losses by EUR 8565 in total for both cable lines. This is an interesting solution for the operator, because it is associated with a small modernization of the existing system (the cost of modernization was assumed to be zero). In this case, sheaths should be crossed only in Substation 2, which should be considered as a low investment cost.
Of course, the use of full cross-bonding allows to achieve the lowest energy losses in the sheaths. However, the implementation of such a solution, even using the Substation 2 as the second crossing point, involves the necessity to excavate a cable line and install cable well. However, in the three remaining cases, the investment cost is returned after the first year. A comparison of the cost of energy losses in the considered cases, to the actual cost of losses in both cable lines sheaths (equal to EUR 12,972) would be:
Sheaths cross-bonding in 1/3 and in 2/3 of the line length. The cost reduction in the first year is equal to EUR 4991, with a cost reduction of EUR 12,111 in each subsequent year.
Sheaths cross-bonding in 1/3 of the line length and in Substation 2. The cost reduction in the first year is equal to EUR 8310, with a cost reduction of 11,870 EUR in each subsequent year.
Sheaths cross-bonding in 1/2 of the line length. The cost reduction in the first year is equal to EUR 5536, with a cost reduction of EUR 9096 in each subsequent year.
Summing up, one can say that the each proposed solution allows the operator to save on the cost of energy losses after the first year.
6. Discussion
Sheaths cross-bonding in high voltage lines is a commonly used solution, especially in the case of relatively long lines with a significant load. In the case of medium voltage lines, such a solution is encountered sporadically, as exemplified by Polish distribution systems. The main reason is the low load of the MV network resulting in relatively low sheath energy losses for a typical cable line. Therefore, network operators are not interested in the investments with a long payback period to reduce sheath losses. The disinterest is understandable from the point of view of profitability, but it also translates into little practical and operational knowledge related to cross-bonding in MV networks.
However, the presented example shows that, in MV networks, there are cases of cable lines loaded so heavily that the validity and profitability of cross-bonding can be considered. The example is interesting because the analyzed cable line is already divided into two sections in one place, where the sheaths cross-bonding can be done with relatively low cost. It turns out that the sheath crossing only one place, i.e., the use of incomplete, asymmetrical cross-bonding, can effectively reduce the currents induced in sheaths, reduce energy losses, and bring the financial benefit to the distribution operator. The short-circuit analysis performed on the mathematical model showed that the sheaths in Substation 2 crossing, does not cause risk of excessive voltage on the outer sheath of the cable.
It should be emphasized that the distribution operator always applies to both endings of the sheaths. However, the operator may be persuaded to change this arrangement by a measurable financial benefit. The economic effect may occur in significantly loaded cable lines, which is not common at present. The use of cross-bonding can also be a good solution when the cable line load is close to the current-carrying capacity. Then, by eliminating the sheaths currents, their influence on the cable temperature is reduced, which, in turn, increases the current-carrying capacity of the cable line.
The cases like considered in this paper are certainly not common. Nevertheless, in the MV network, it can find similar cases that do not seem similar to the one presented in the paper at first glance. This applies to the main MV cable lines that connect various MV/LV substations. In this case, it is possible to select some part of the main cable line that begins and ends with an MV/LV substation with earthed sheaths. Between these substations, there are other MV/LV substations where the sheaths must be unearthed. An issue to be solved is to indicate in which MV/ LV stations the sheaths crossing should be applied. It is not obvious, because the load on each section of the cable line can be different. Moreover, the cross-section of the sections of the cable line may also be varied.
Finally, the long time (over a year) that elapsed between the two measurement days mentioned in the paper should also be emphasized. This shows that the operator’s decision to engage its resources in activities not directly related to the normal operation of the network may take a long time.

 ,
, 


