Design of Kinetic-Energy Harvesting Floors †


 , ,
, ,
Abstract
:1. Introduction
2. Design of Subsystems
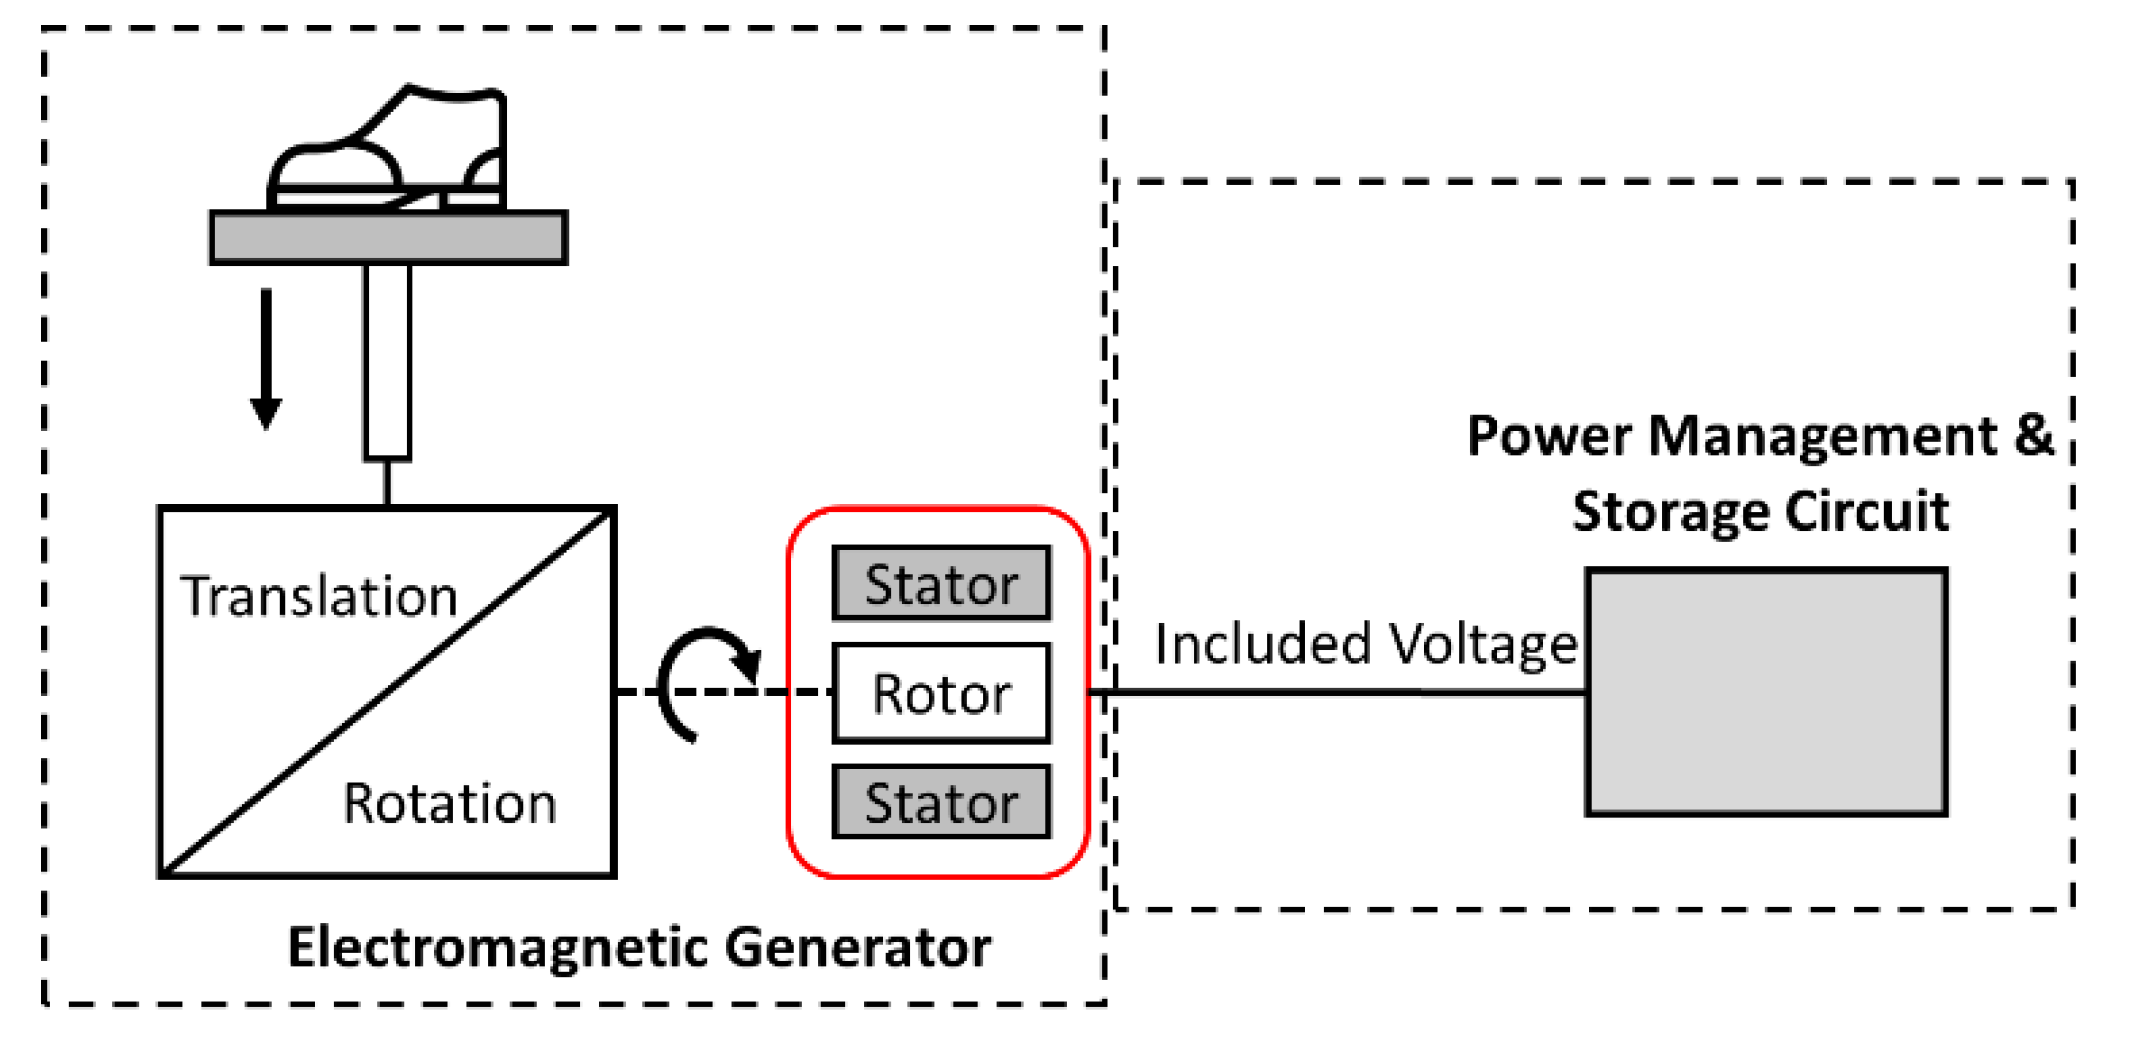
2.1. The System of EM Generator
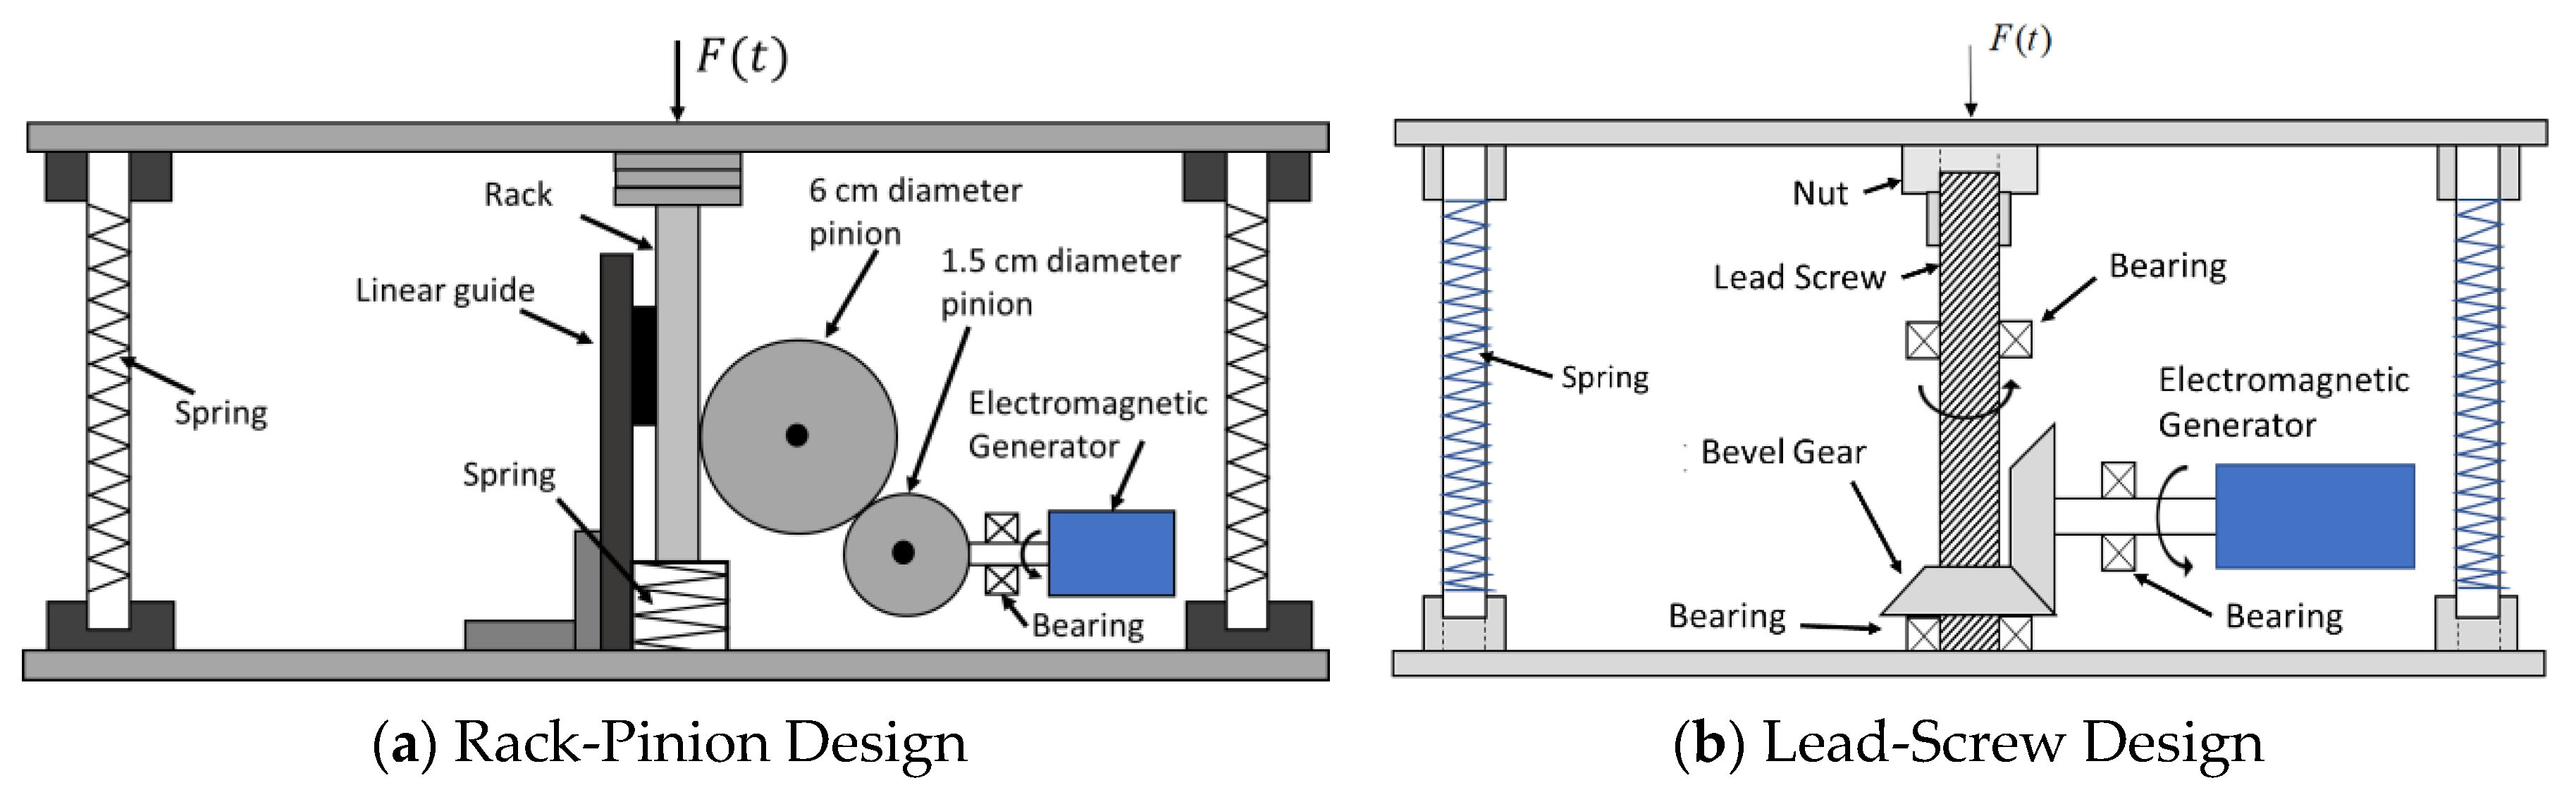
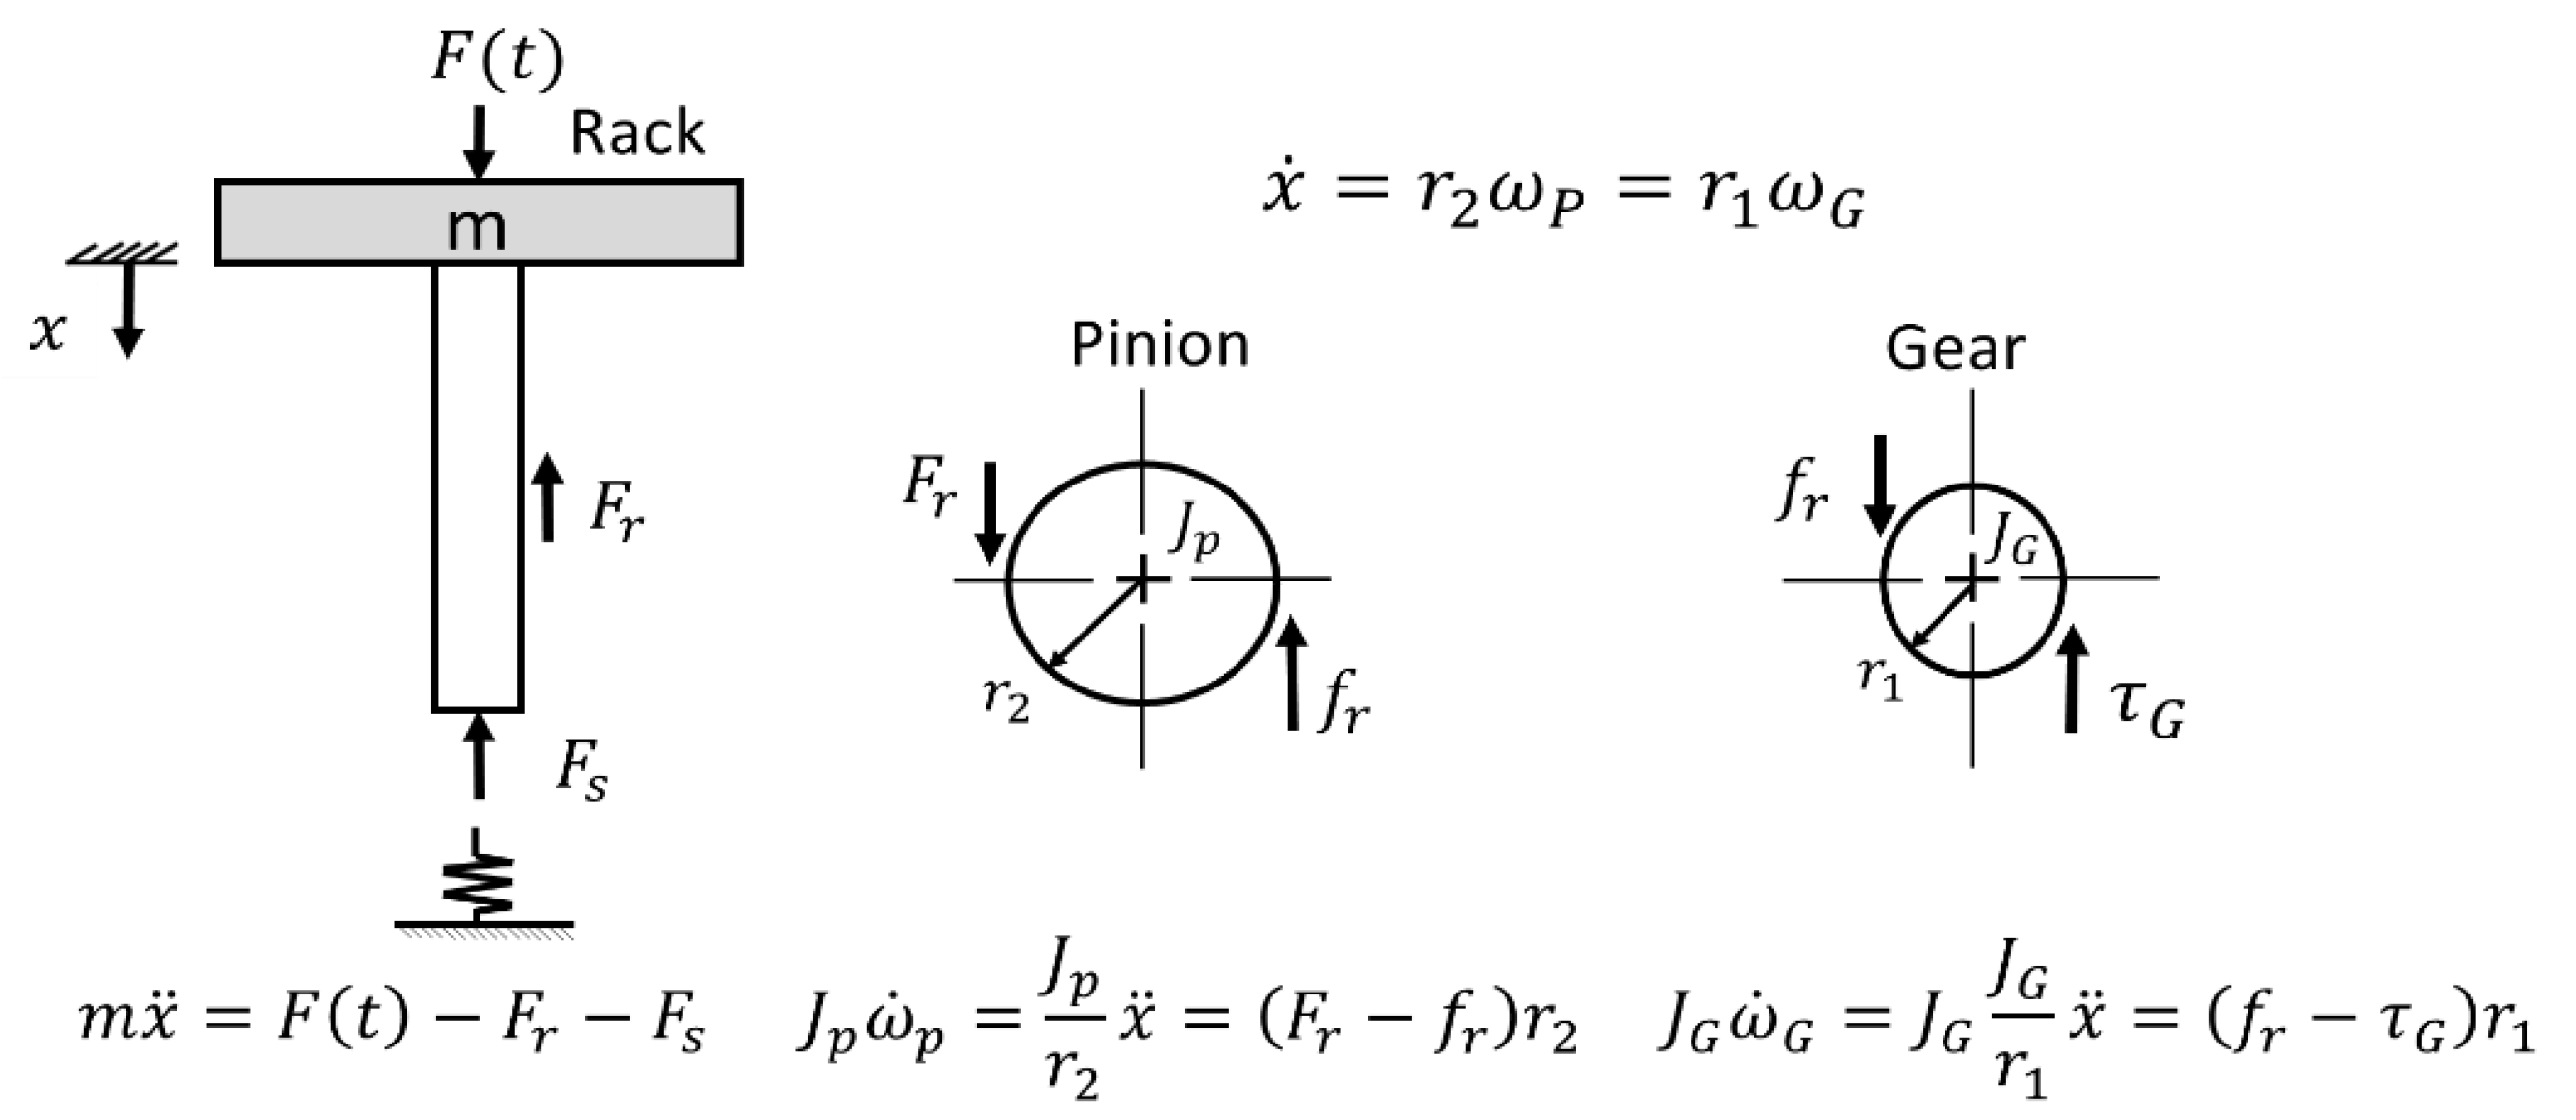
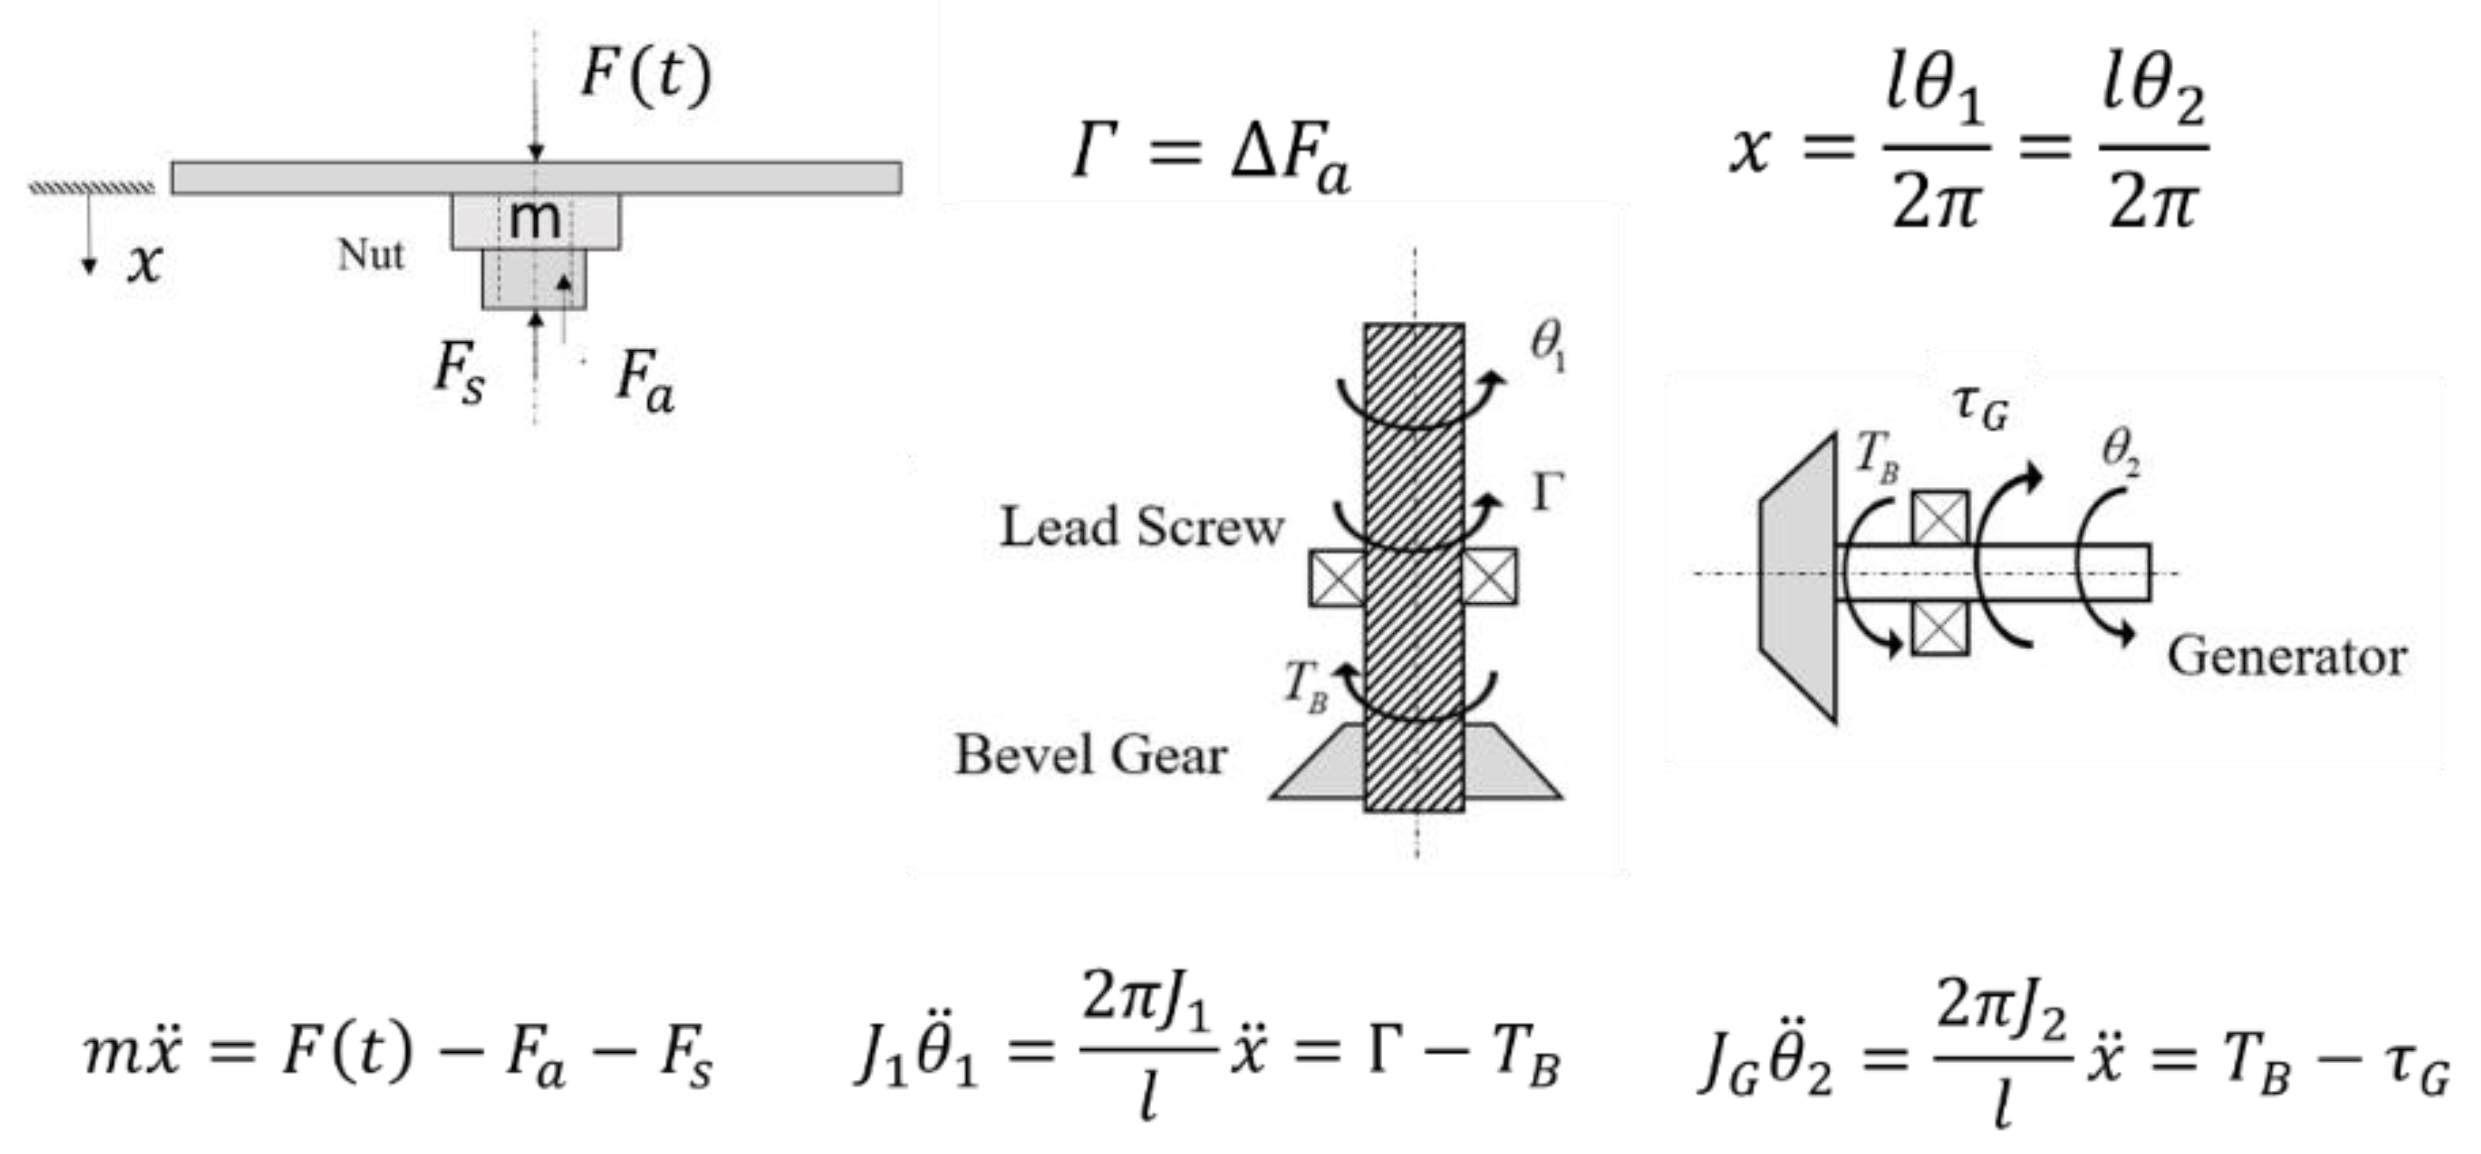
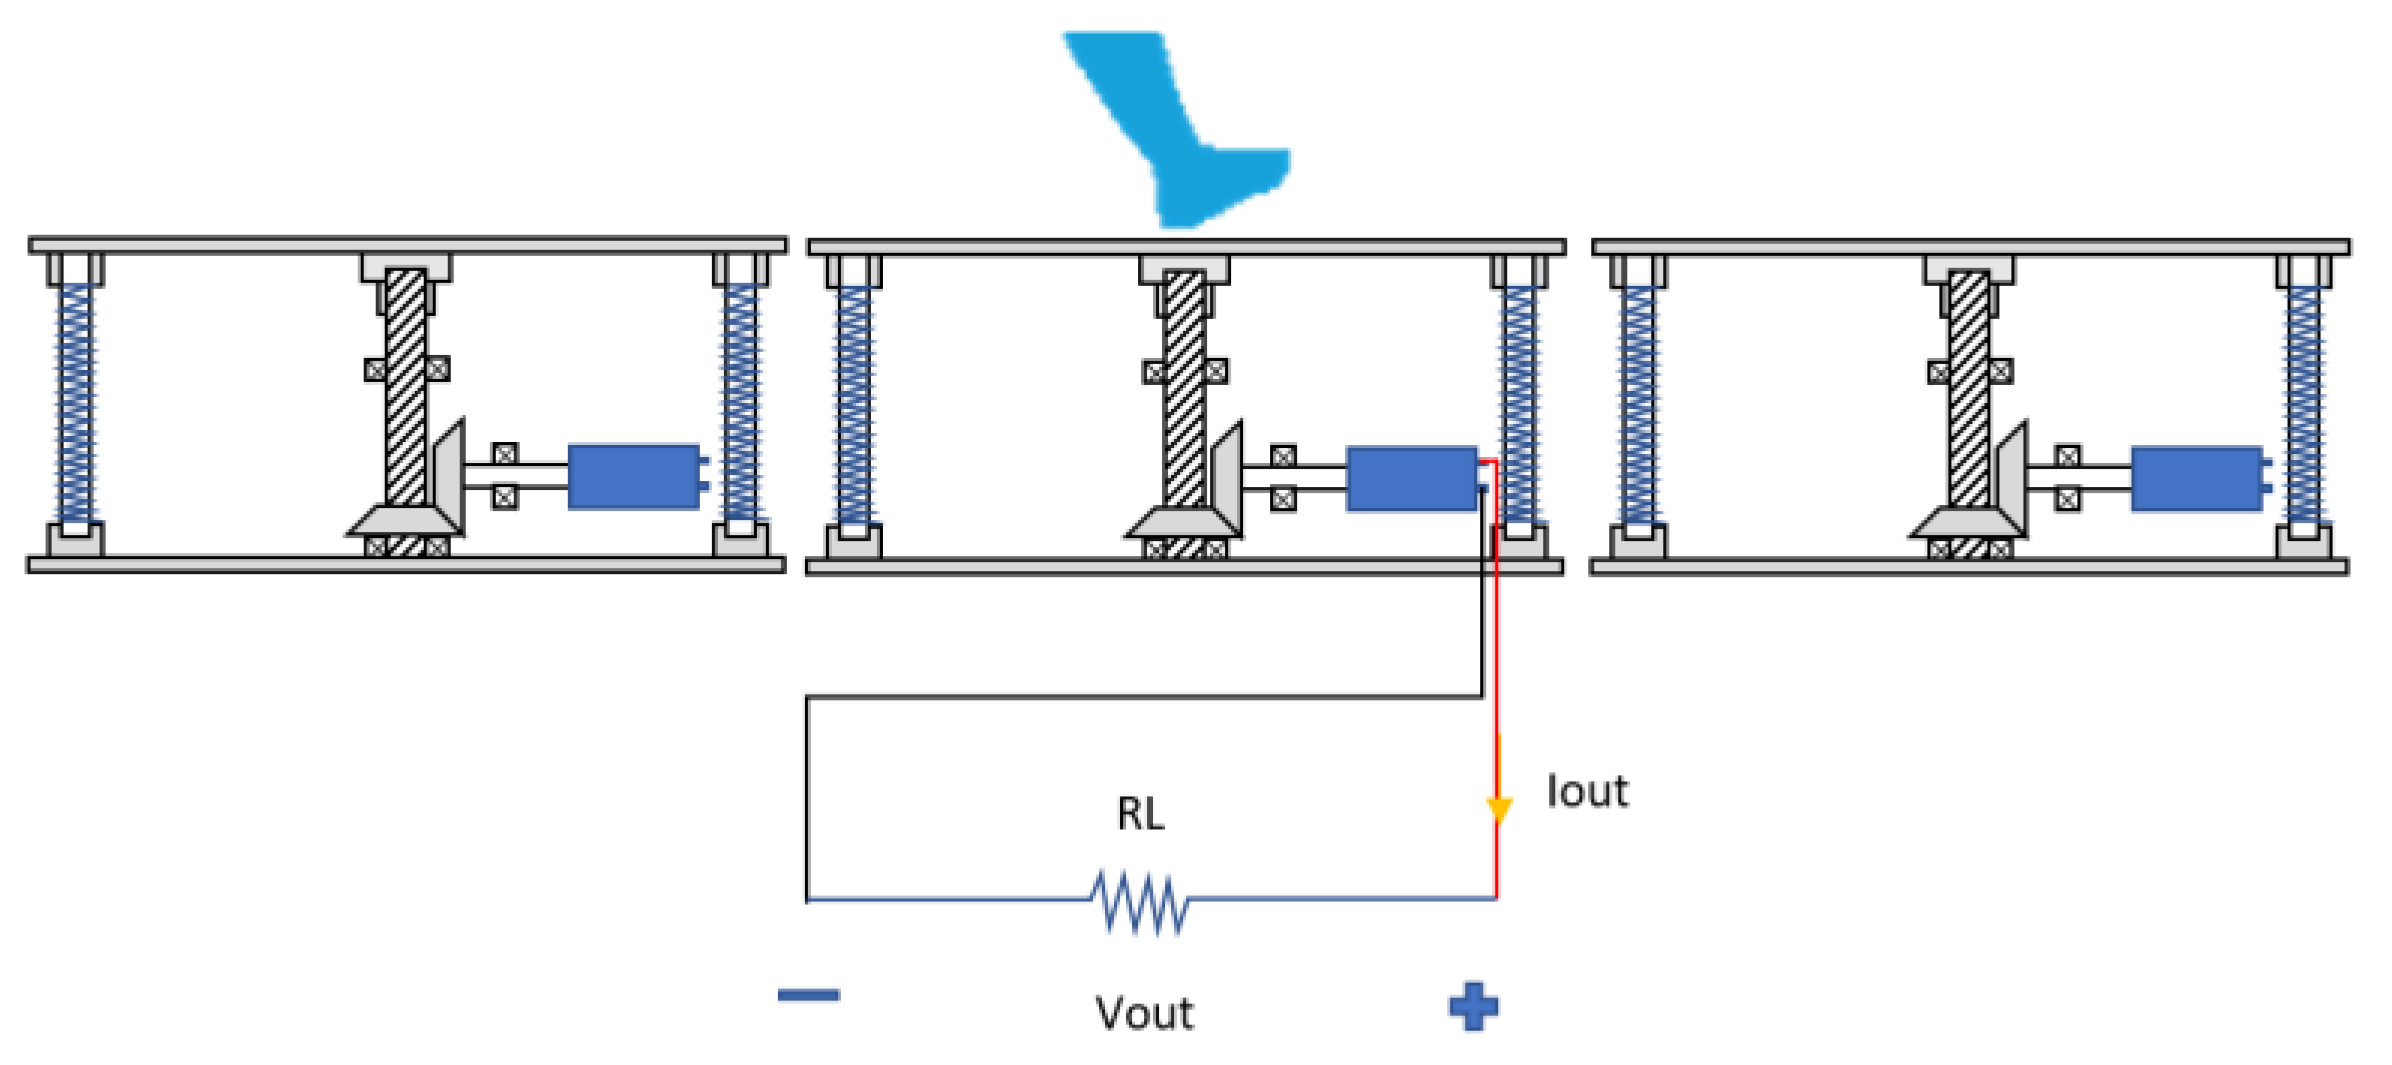
2.1.1. Conceptual Design
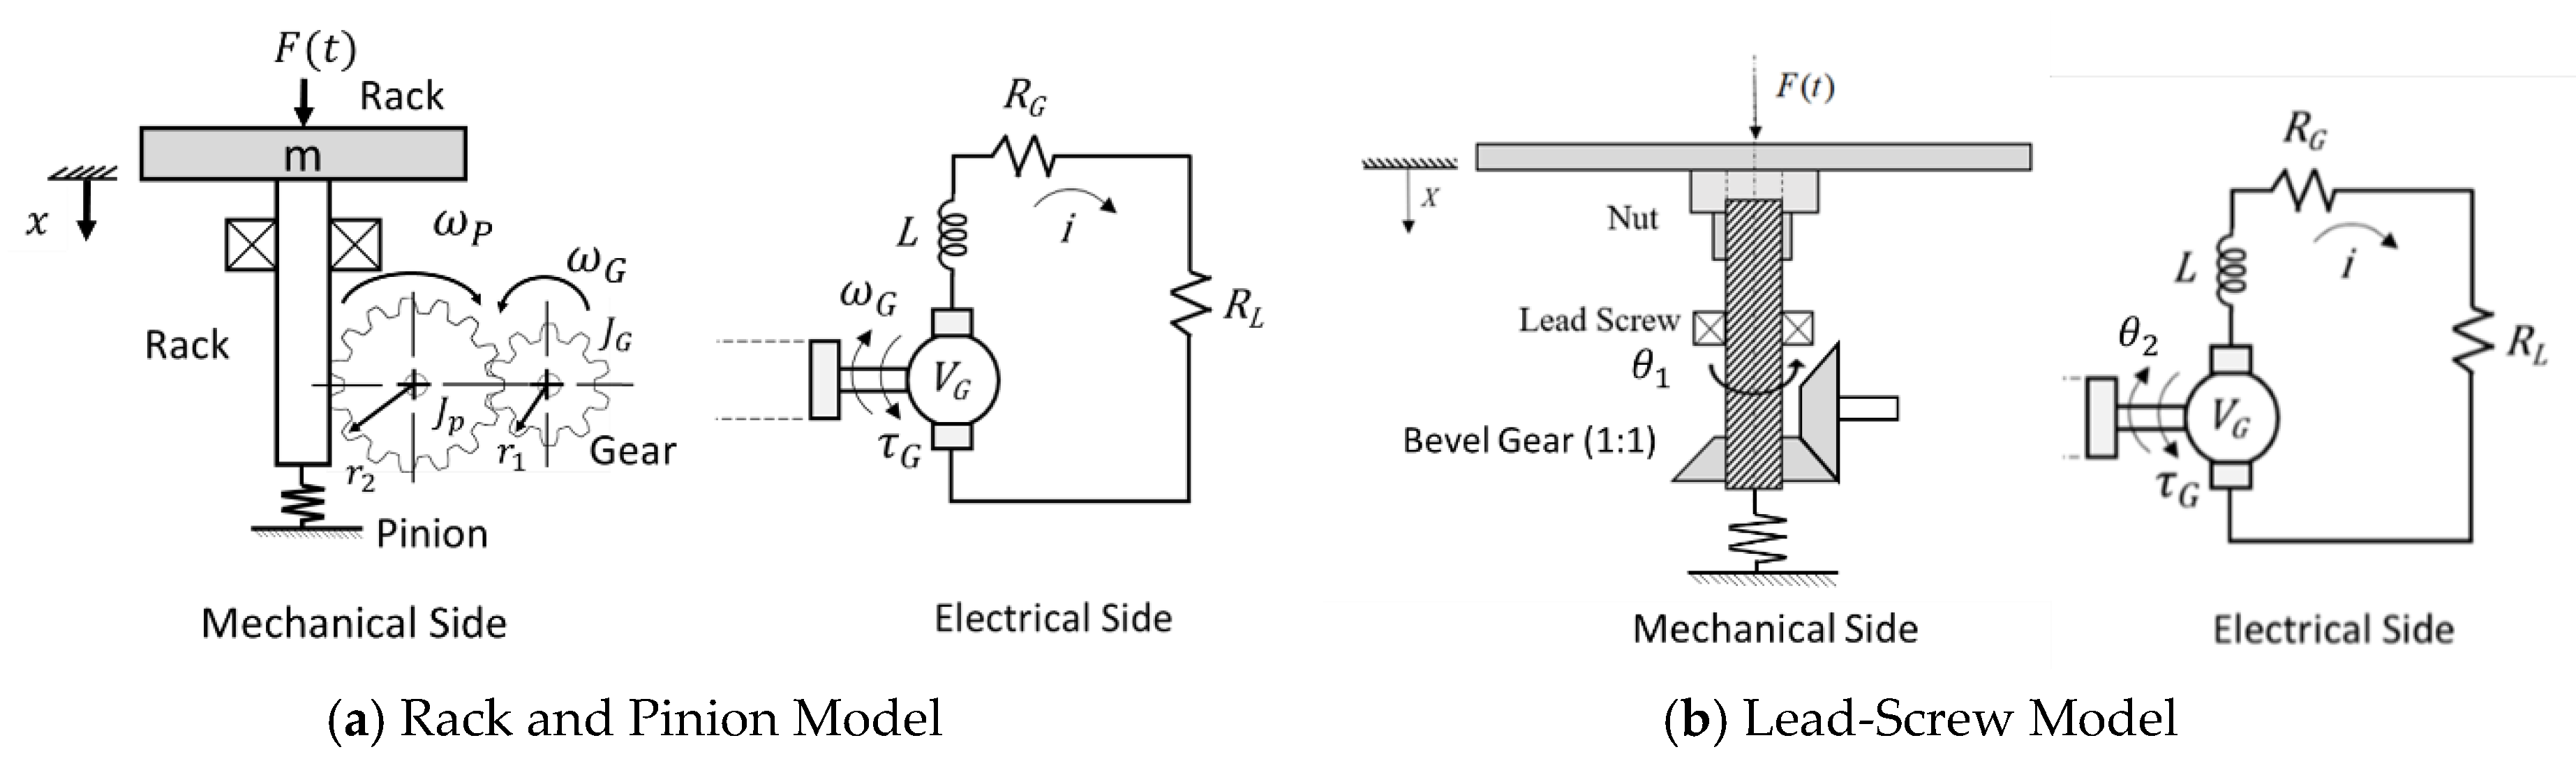
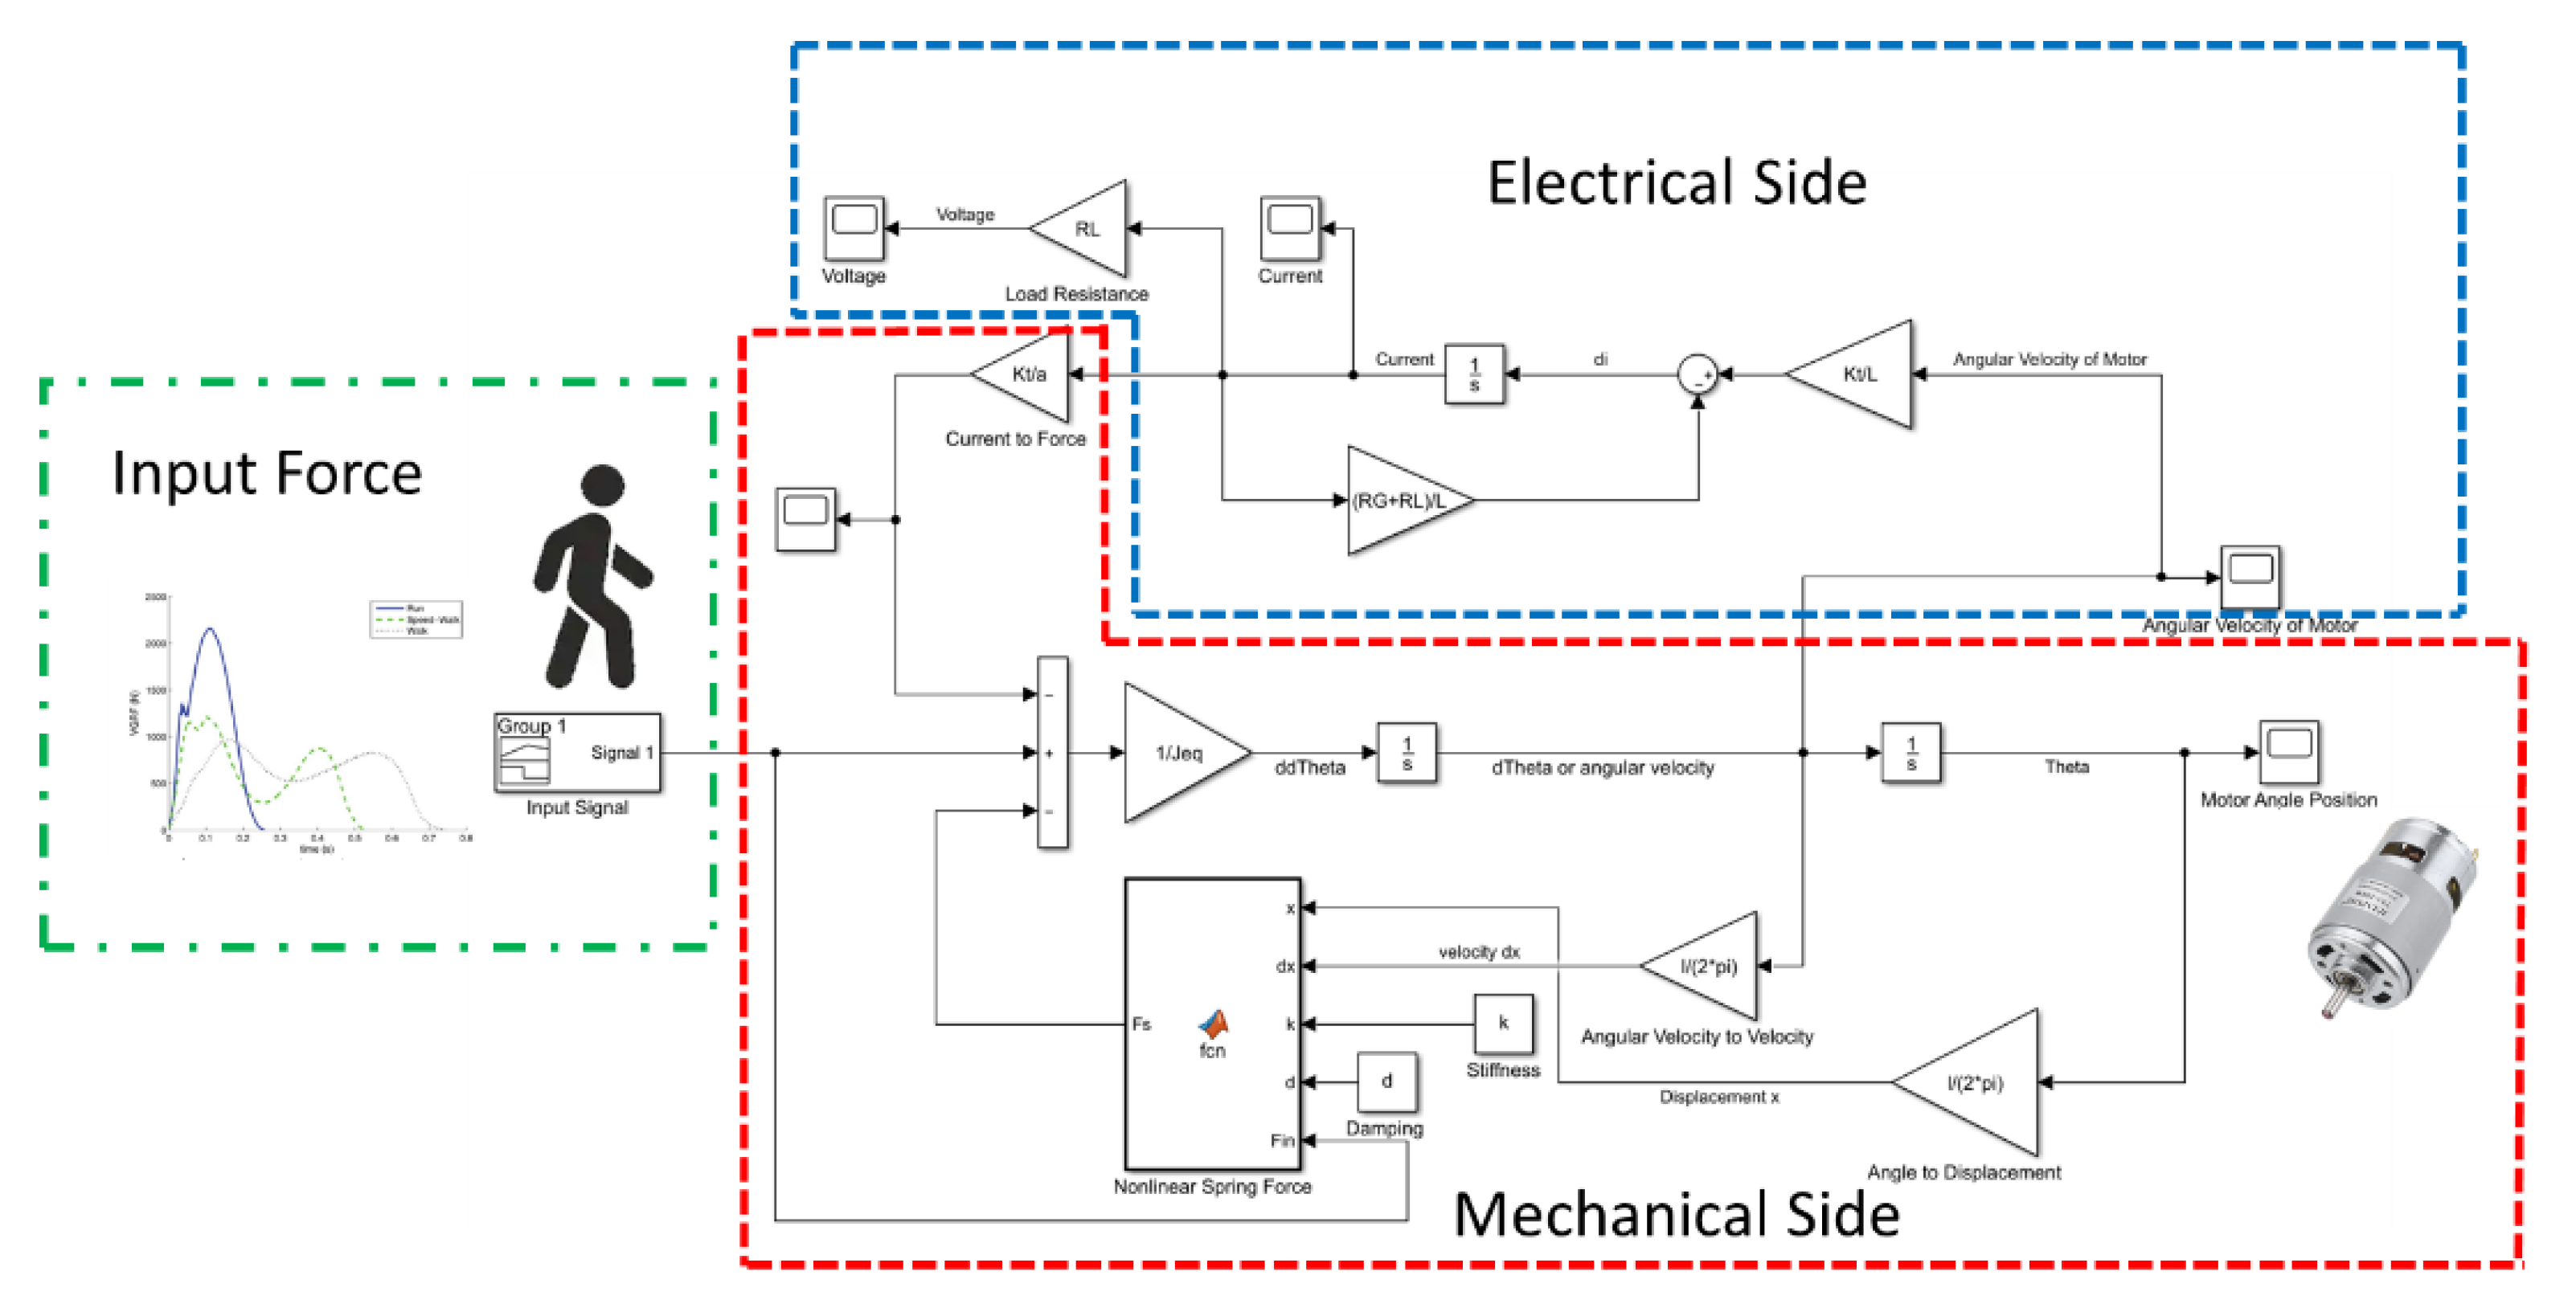
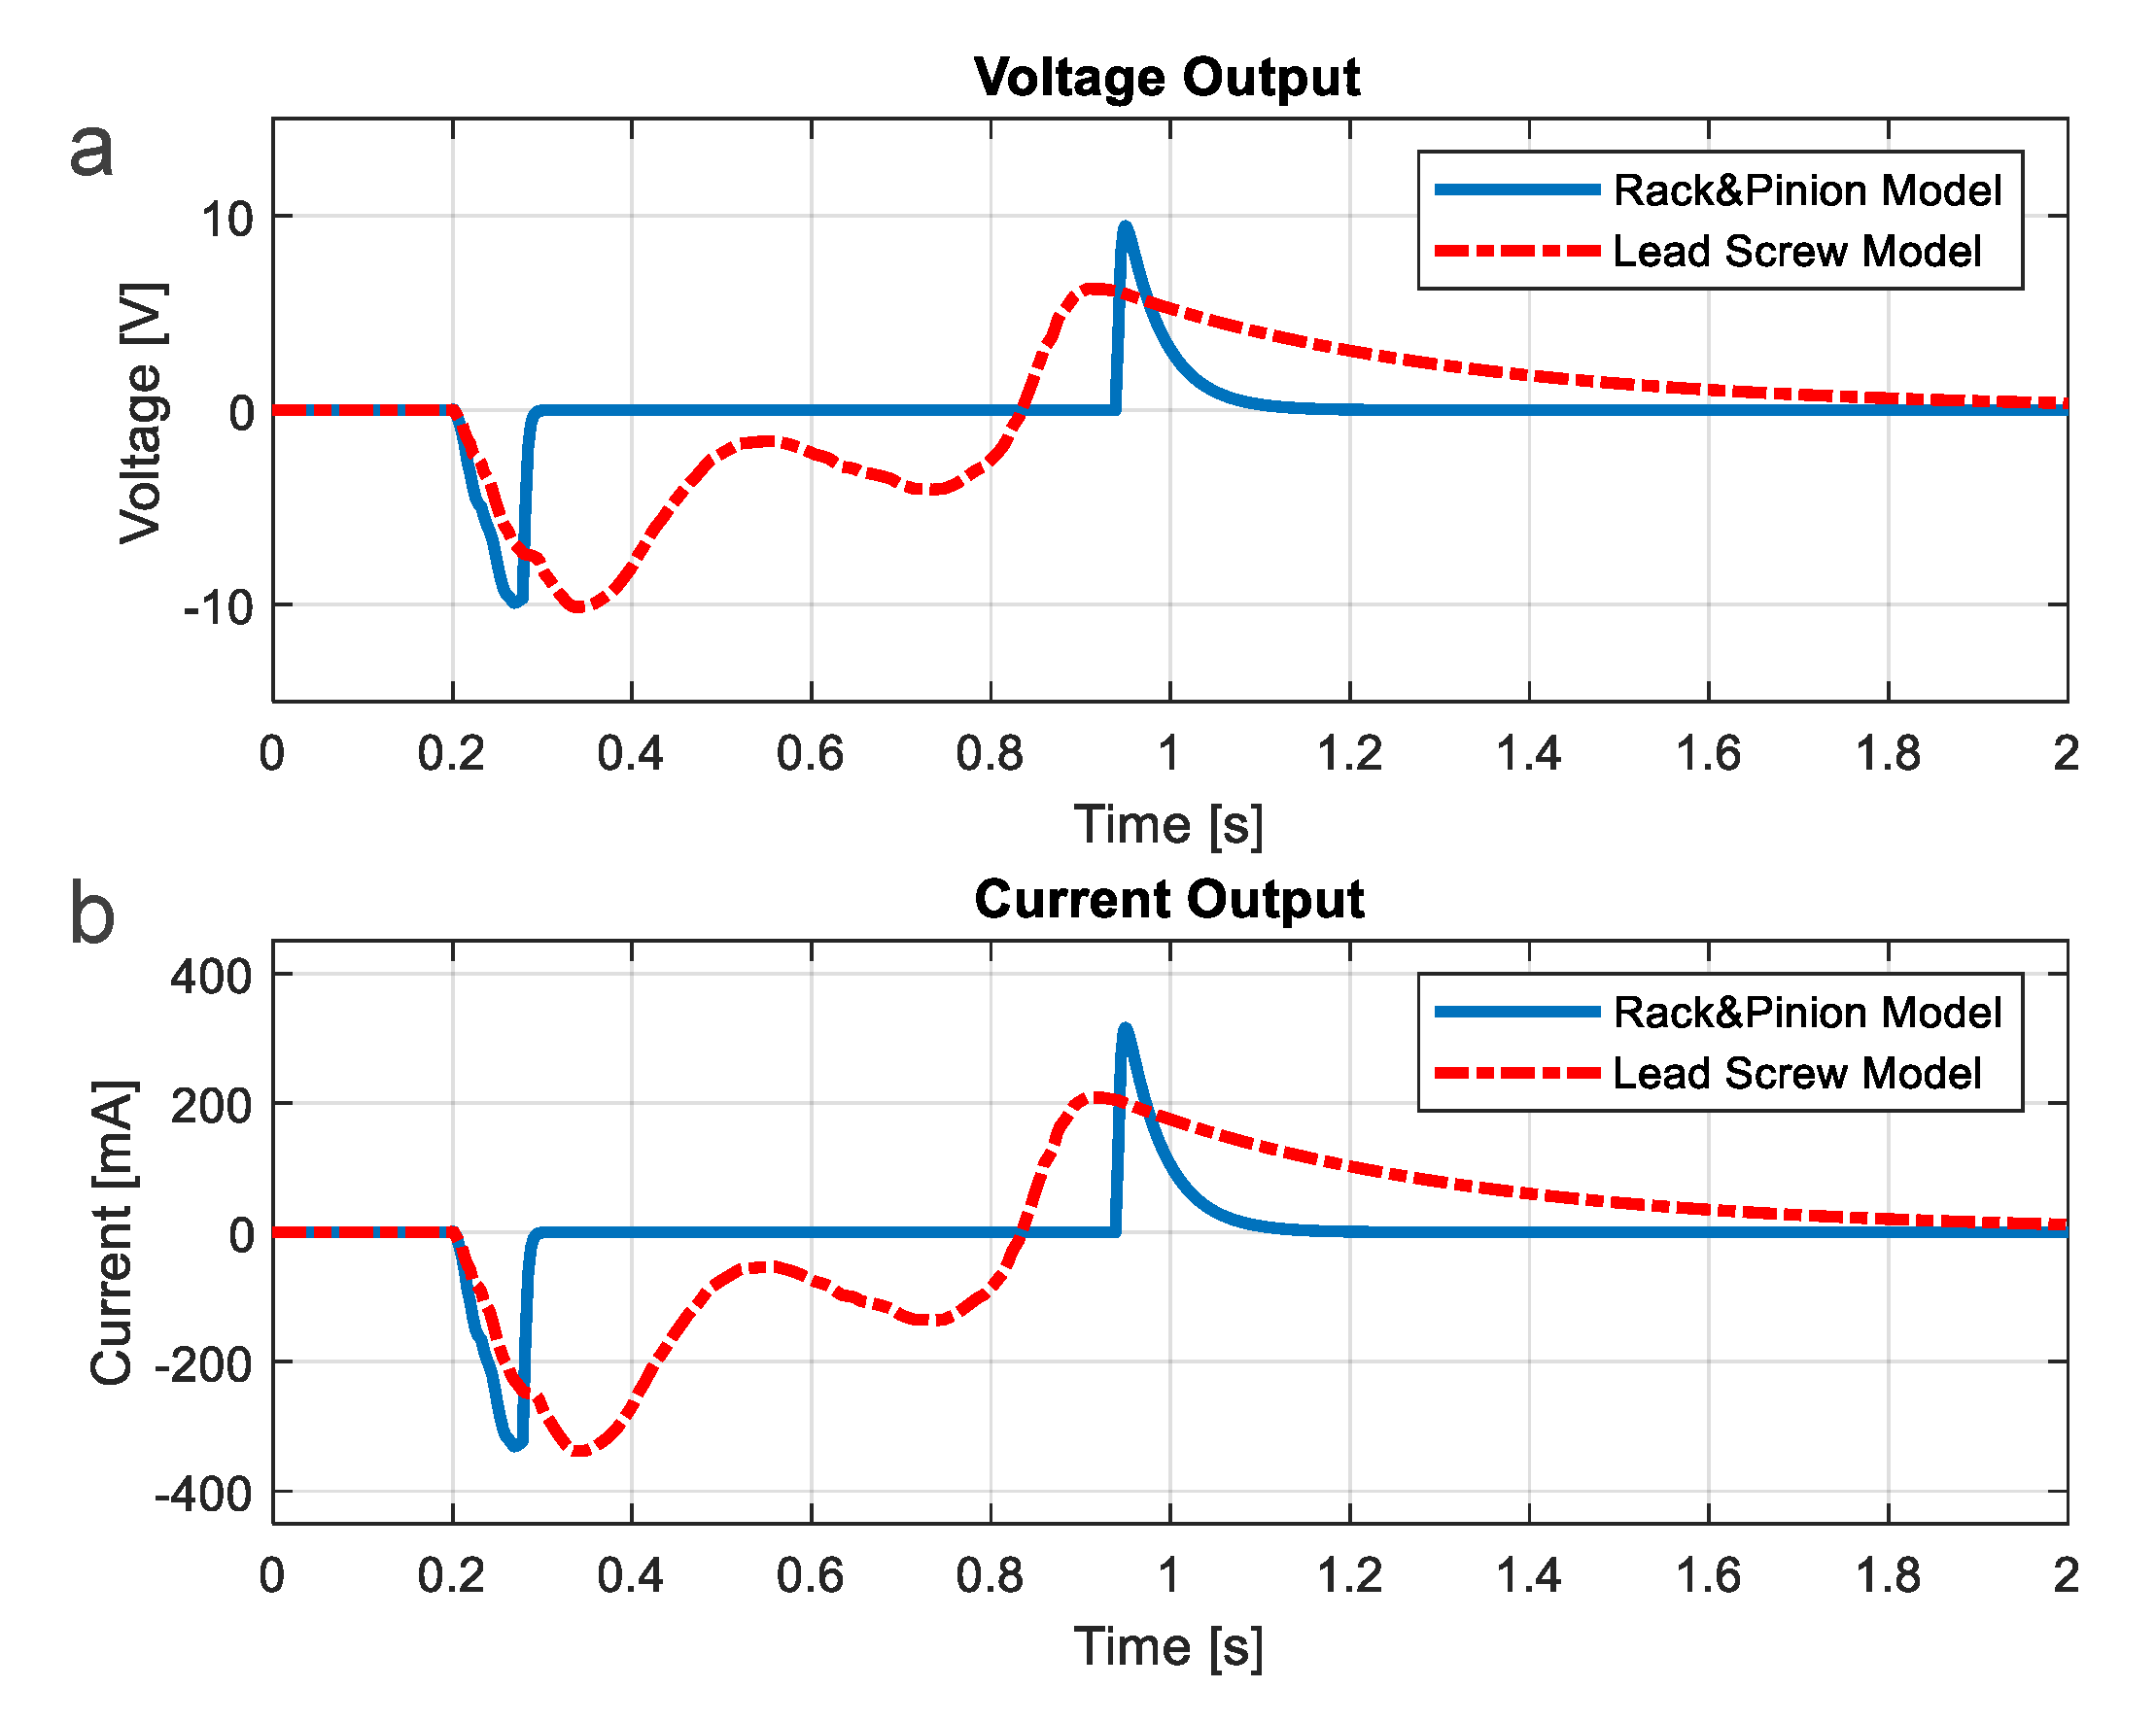
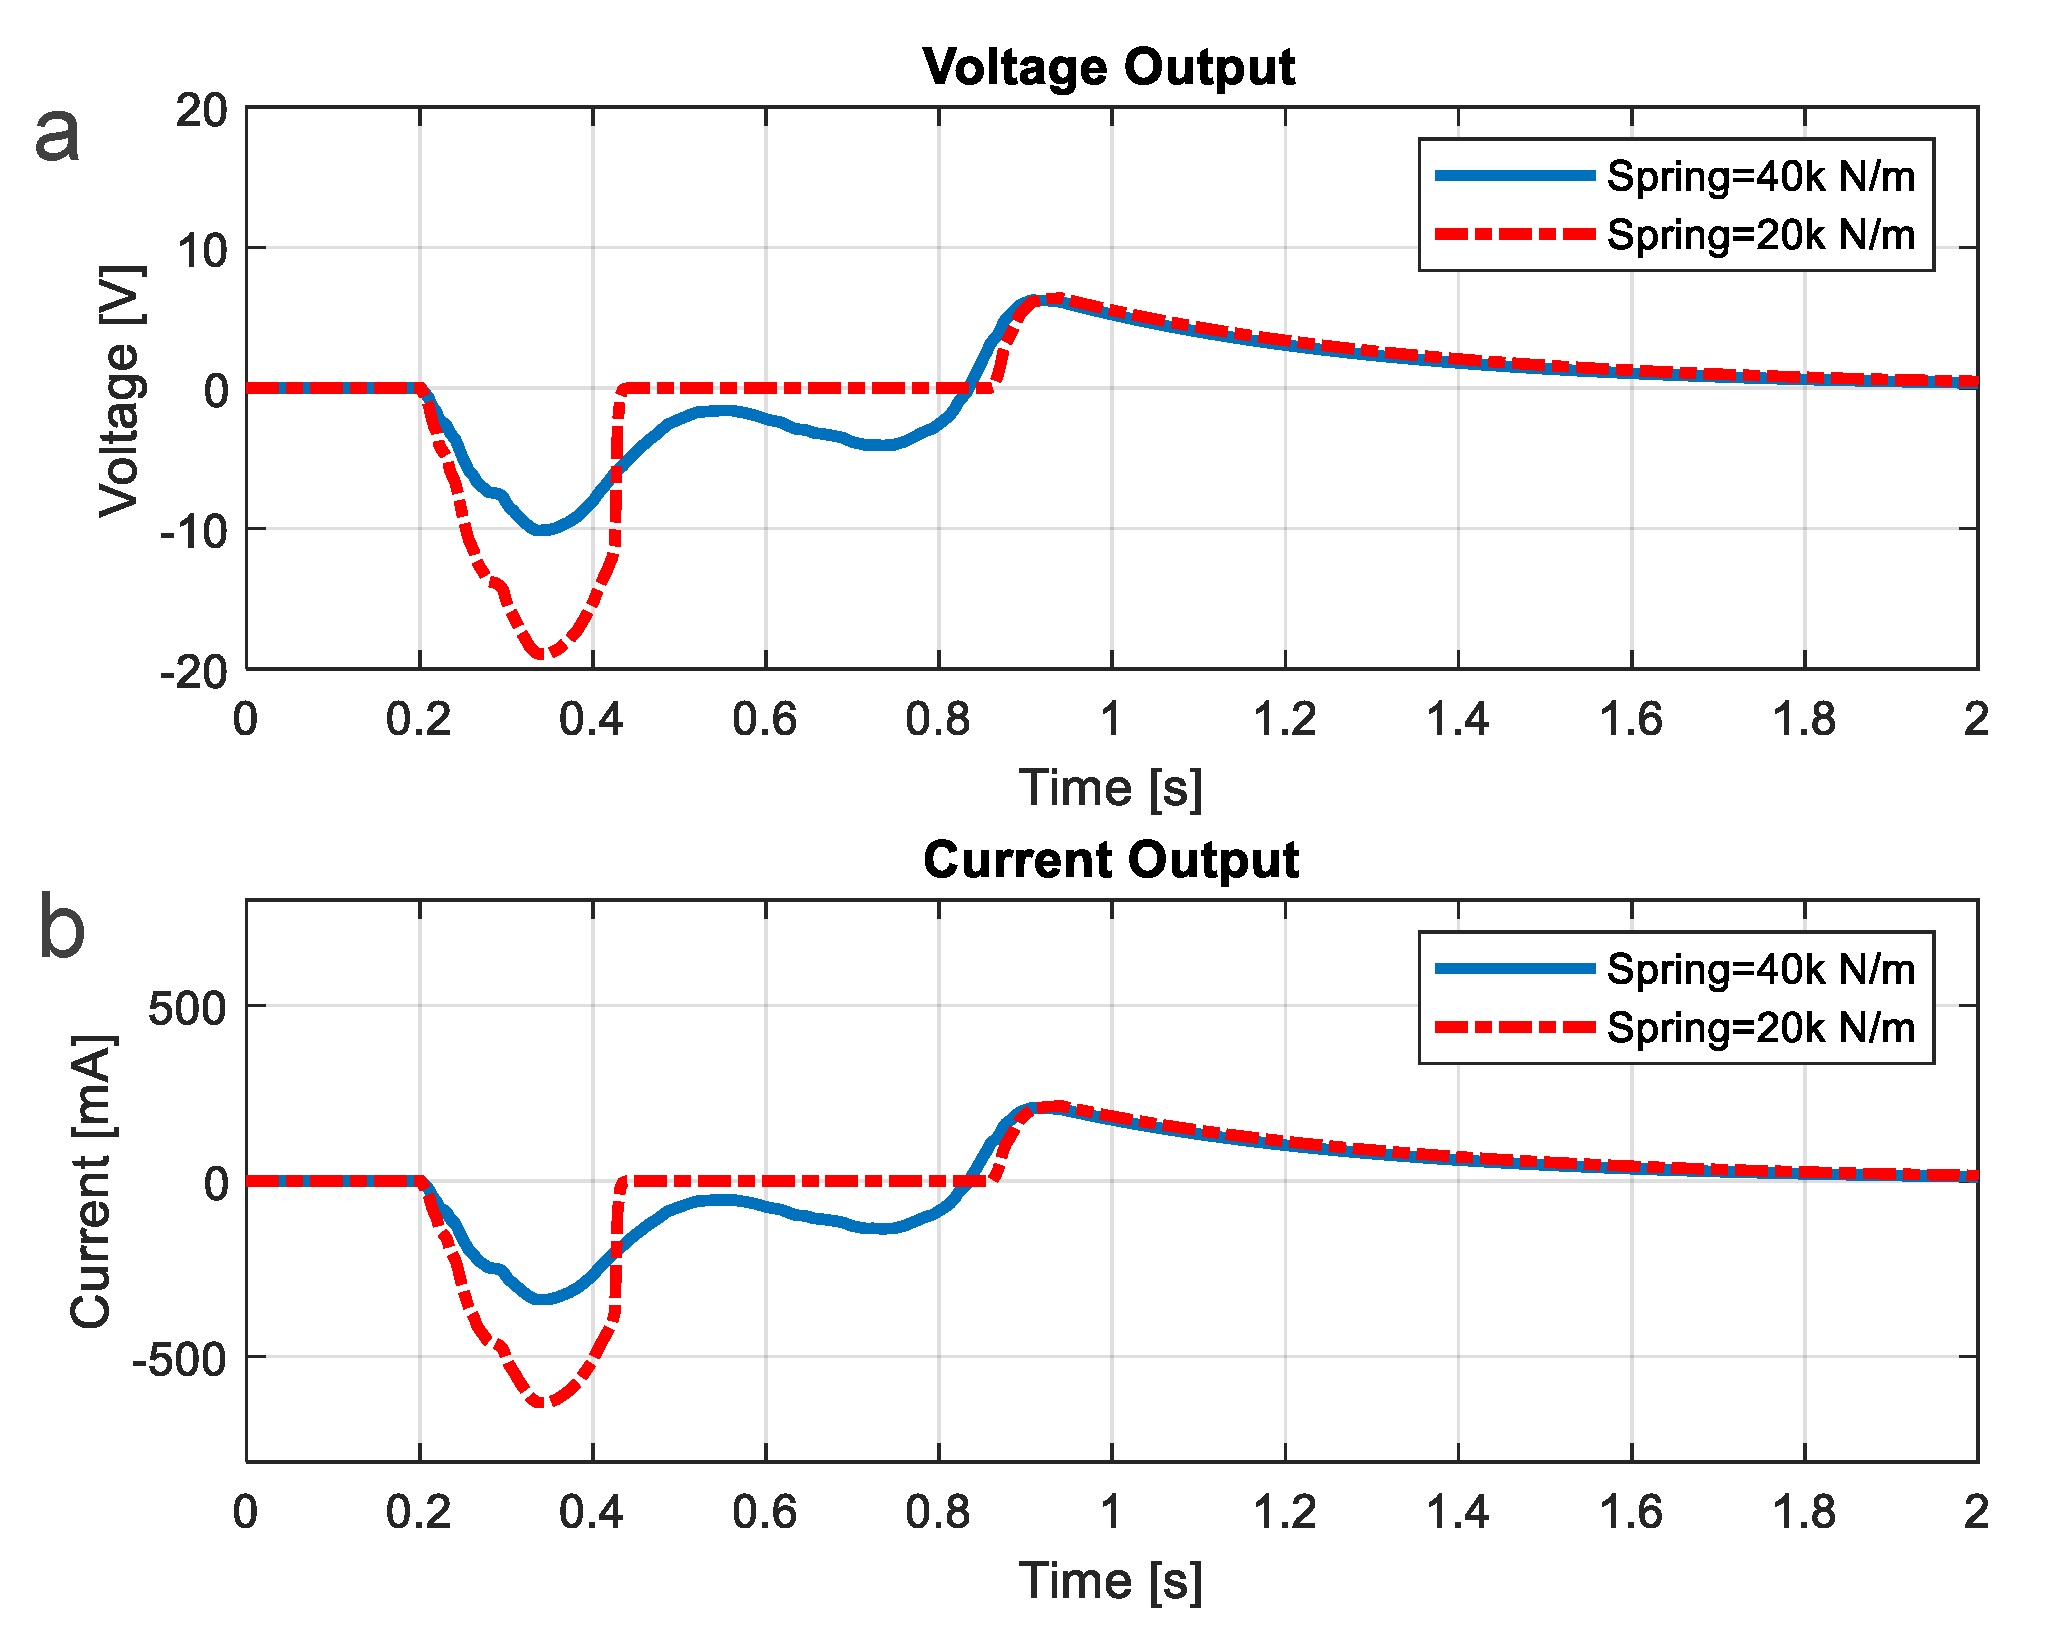
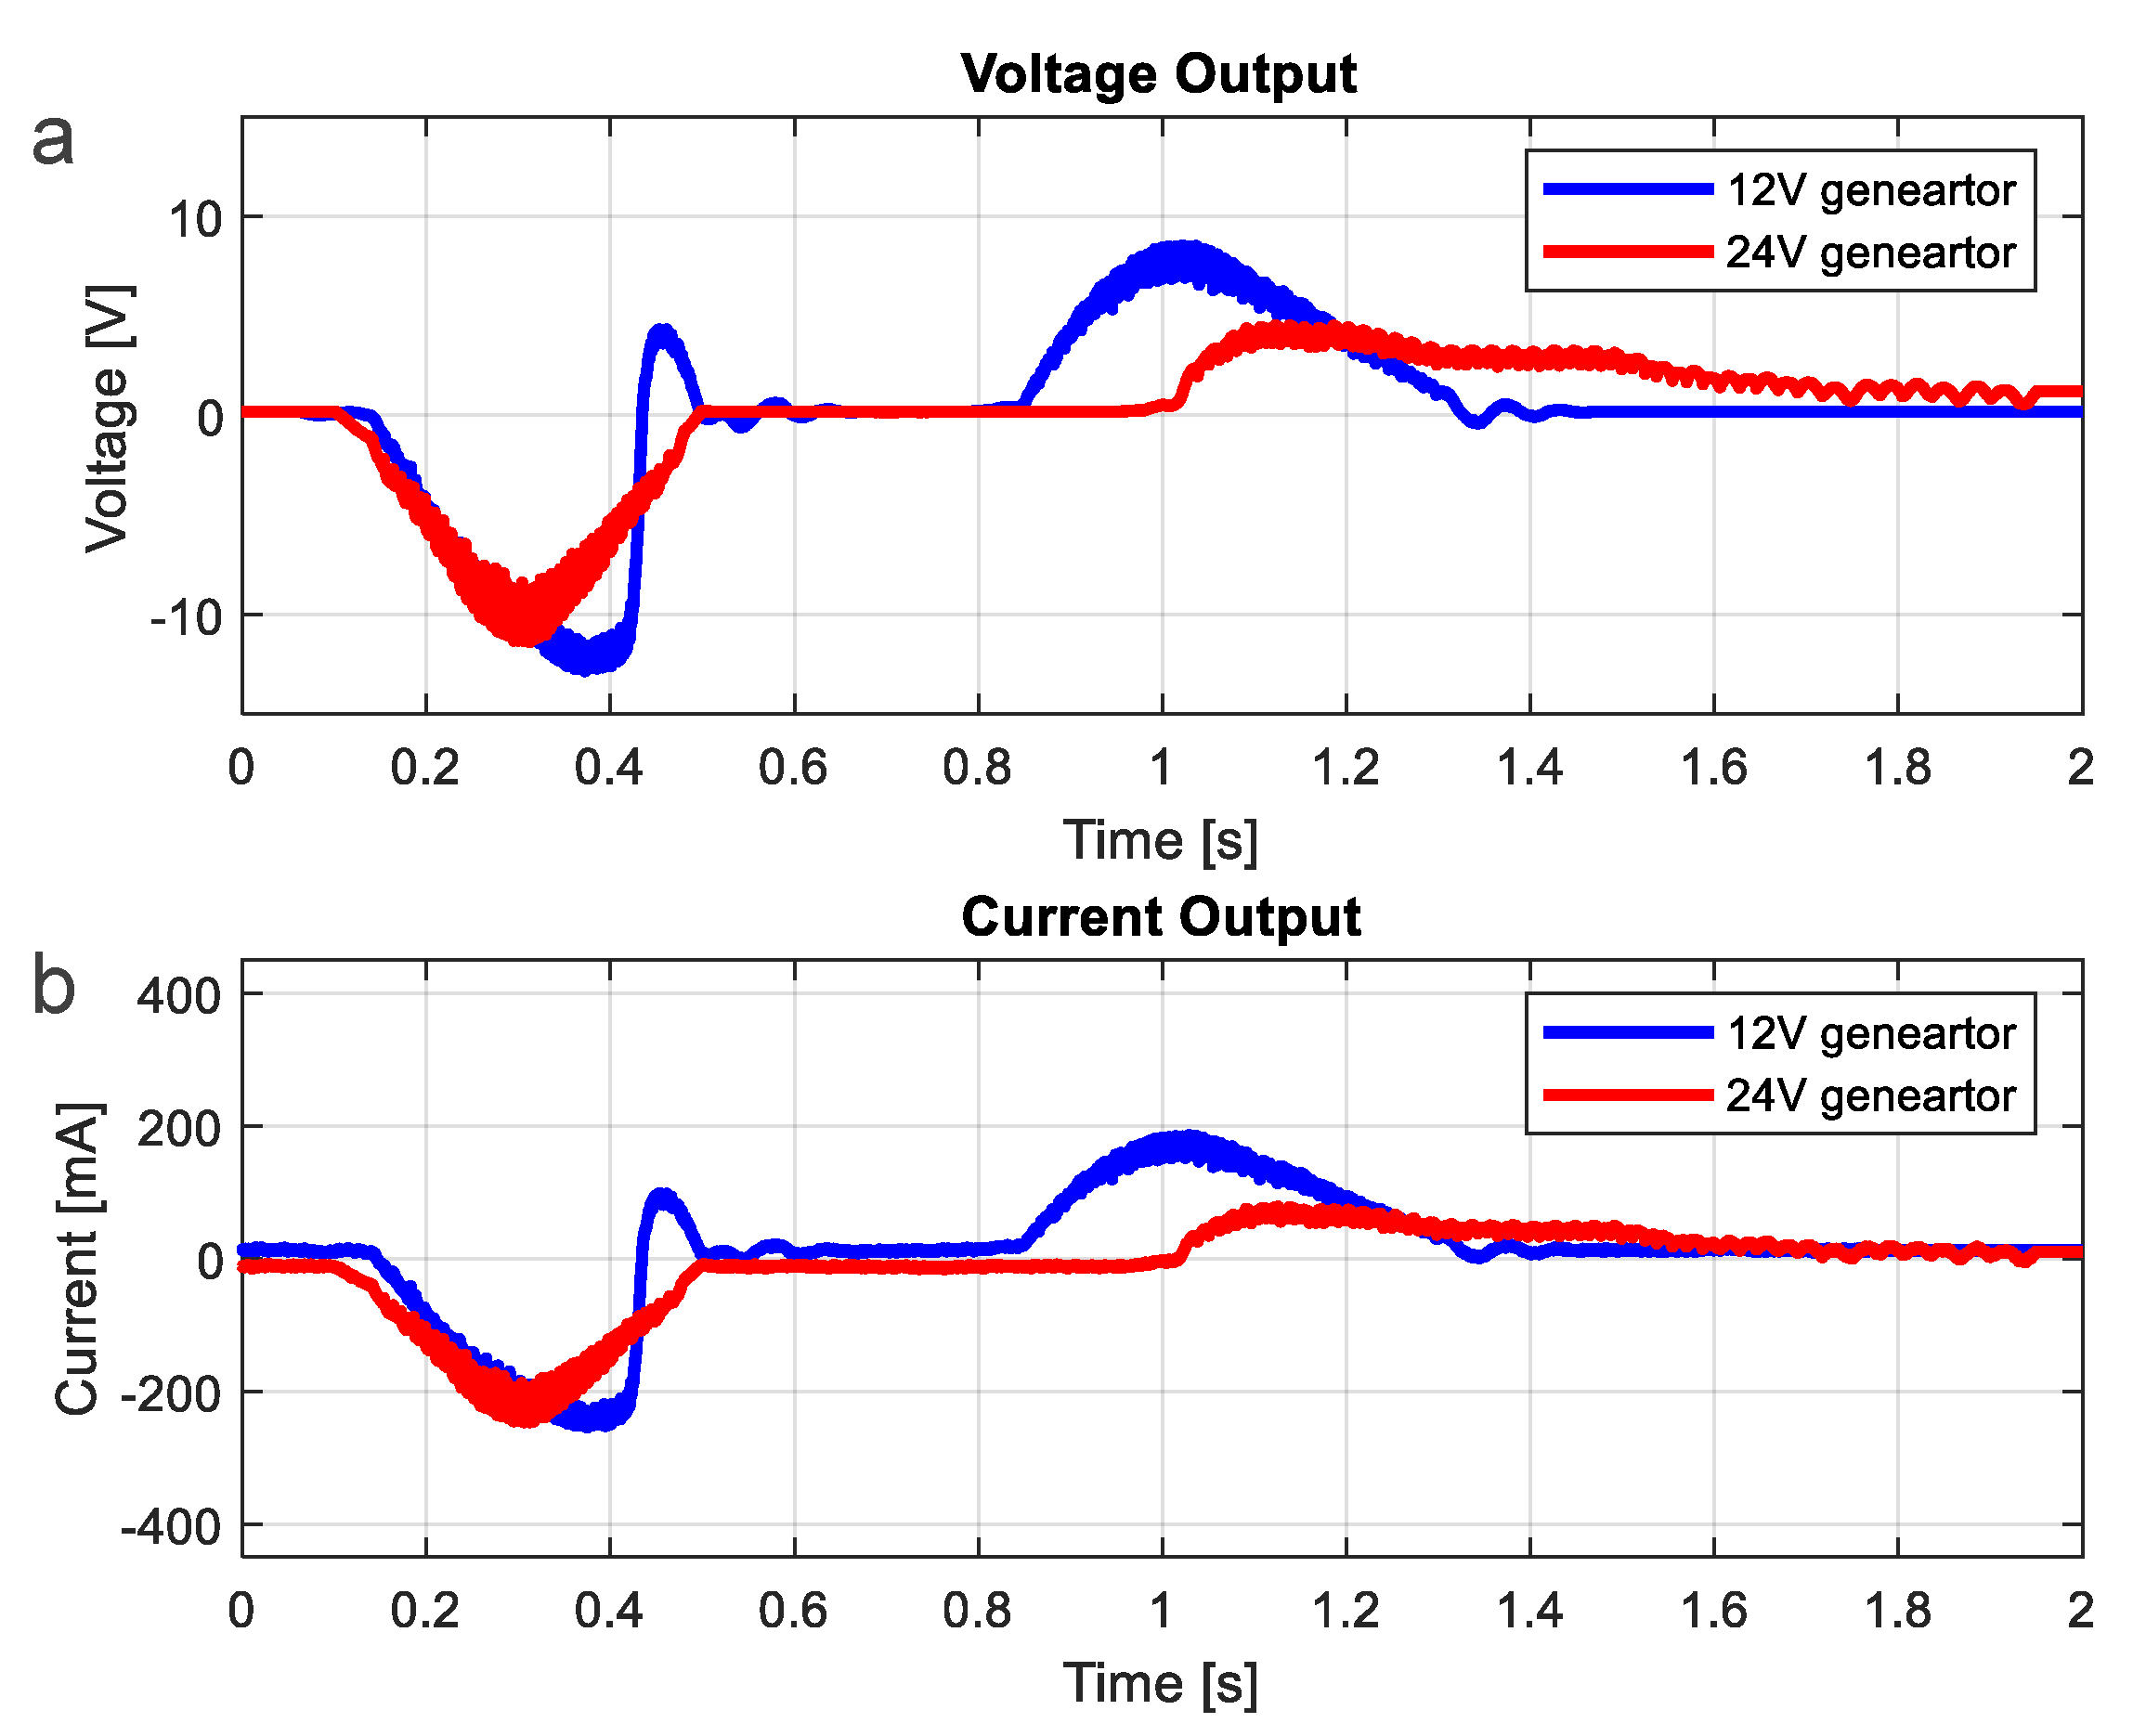
2.1.2. Analysis
2.1.3. Design of Elements
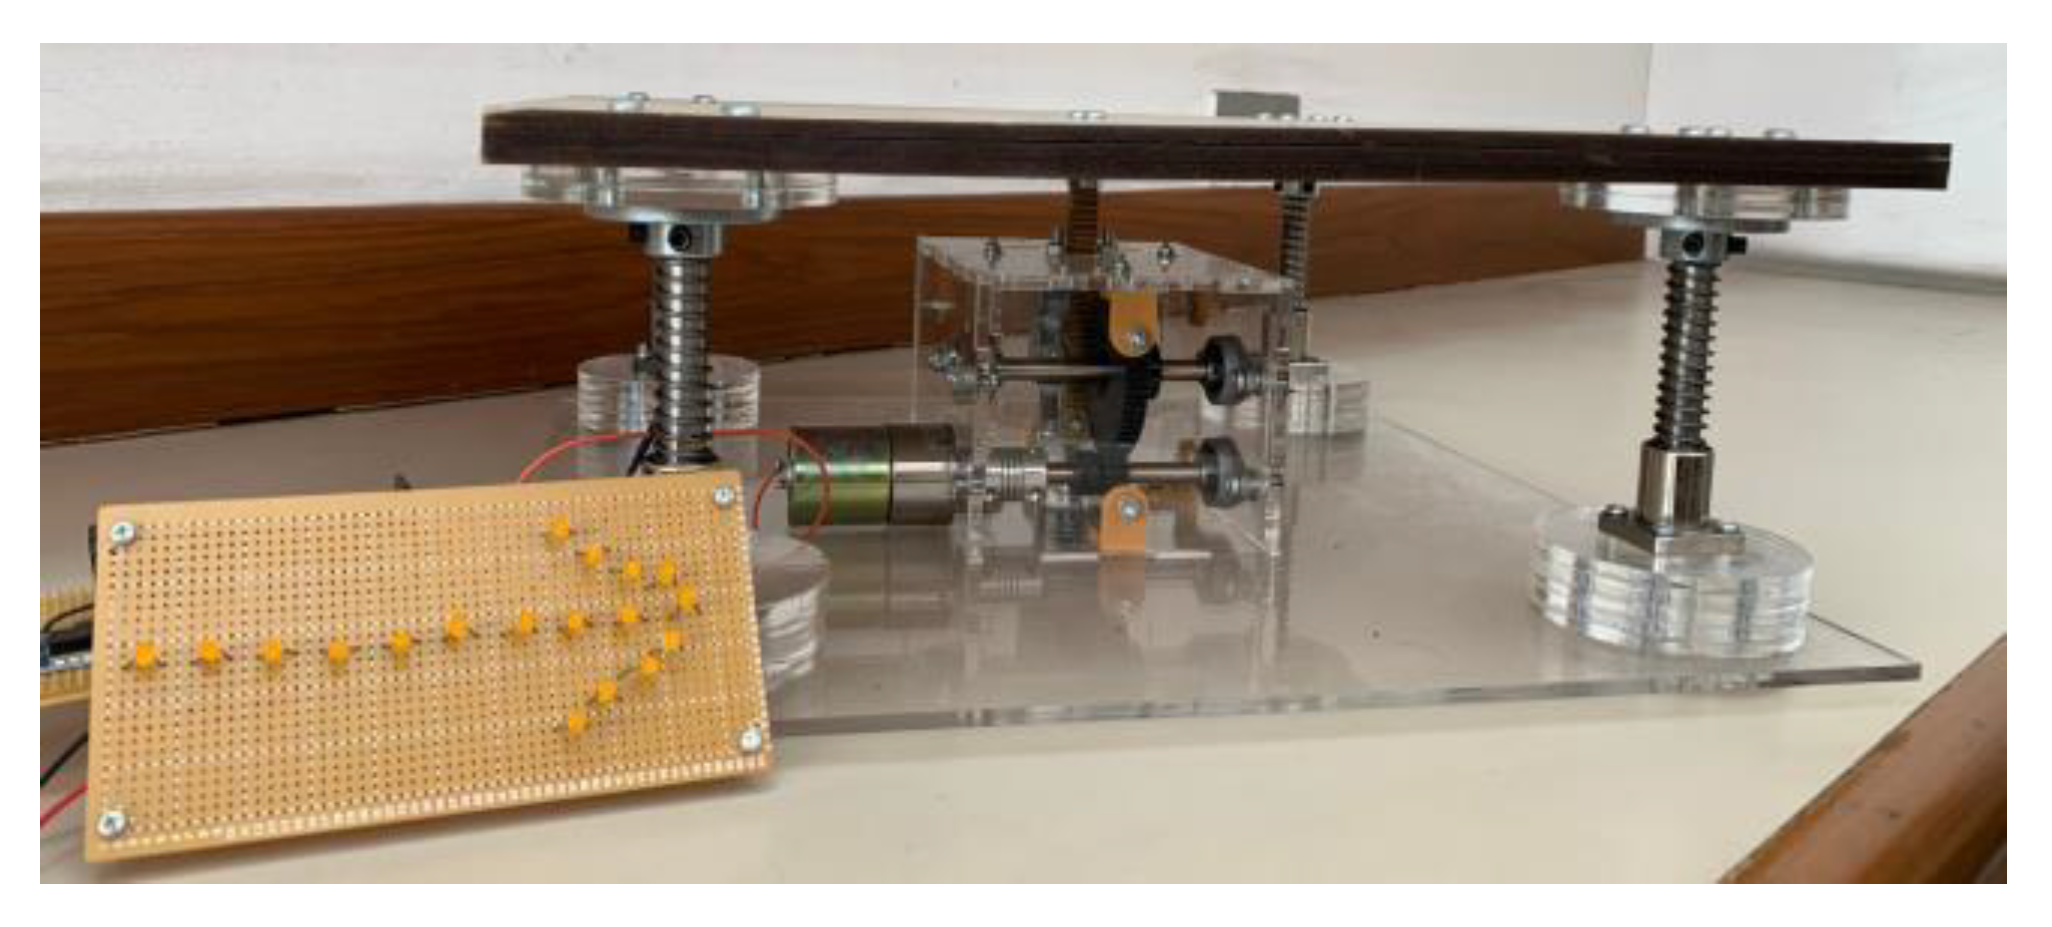
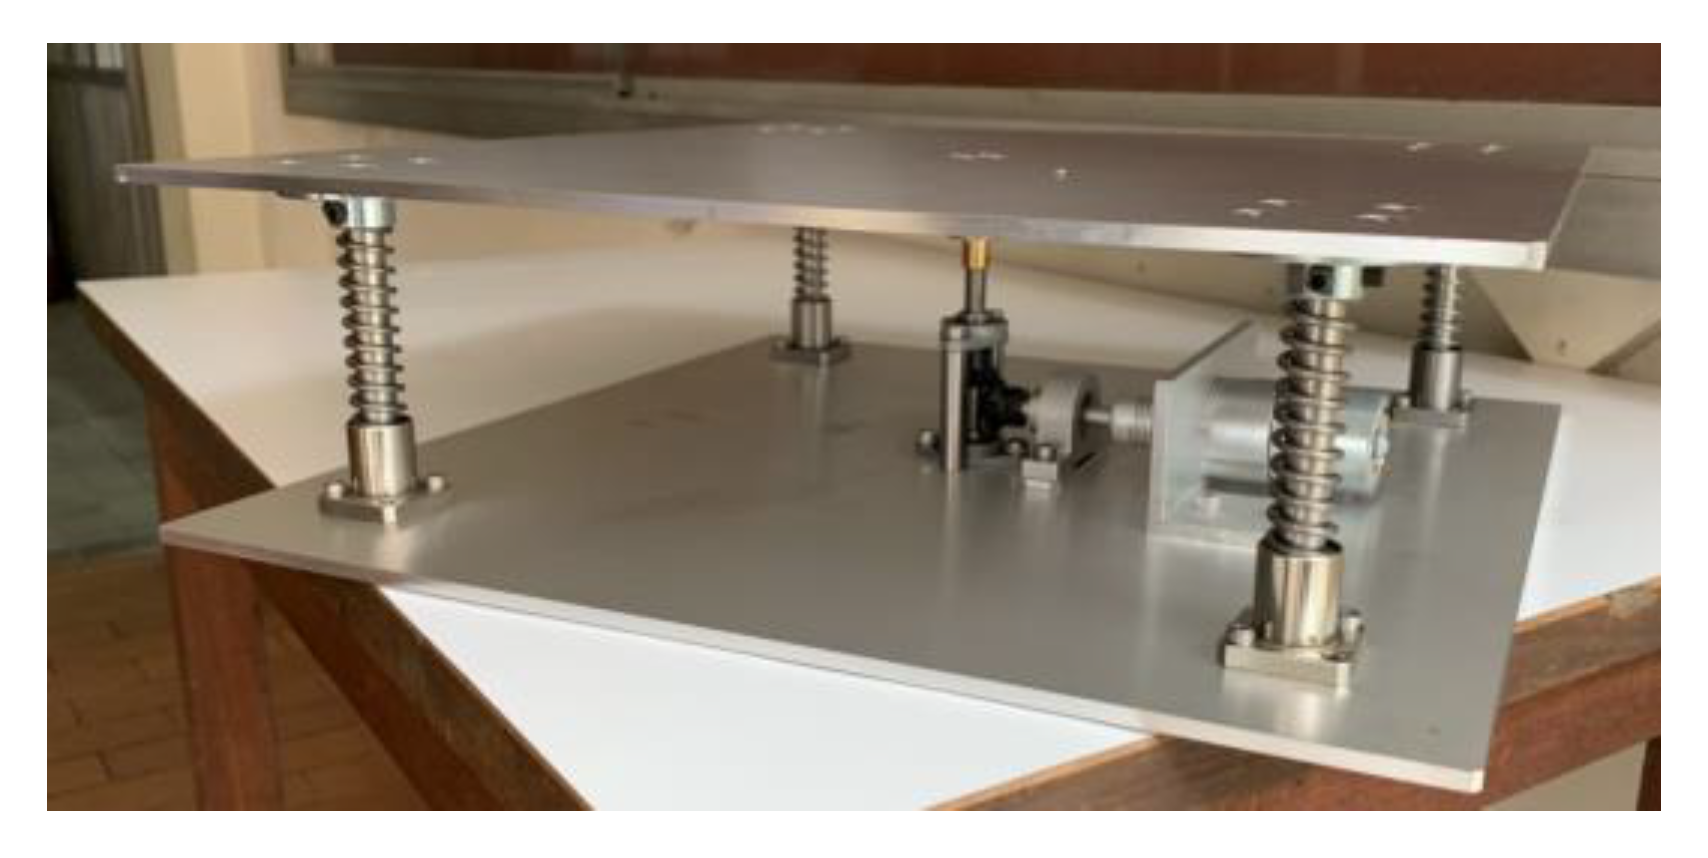
2.1.4. Development of the Prototypes
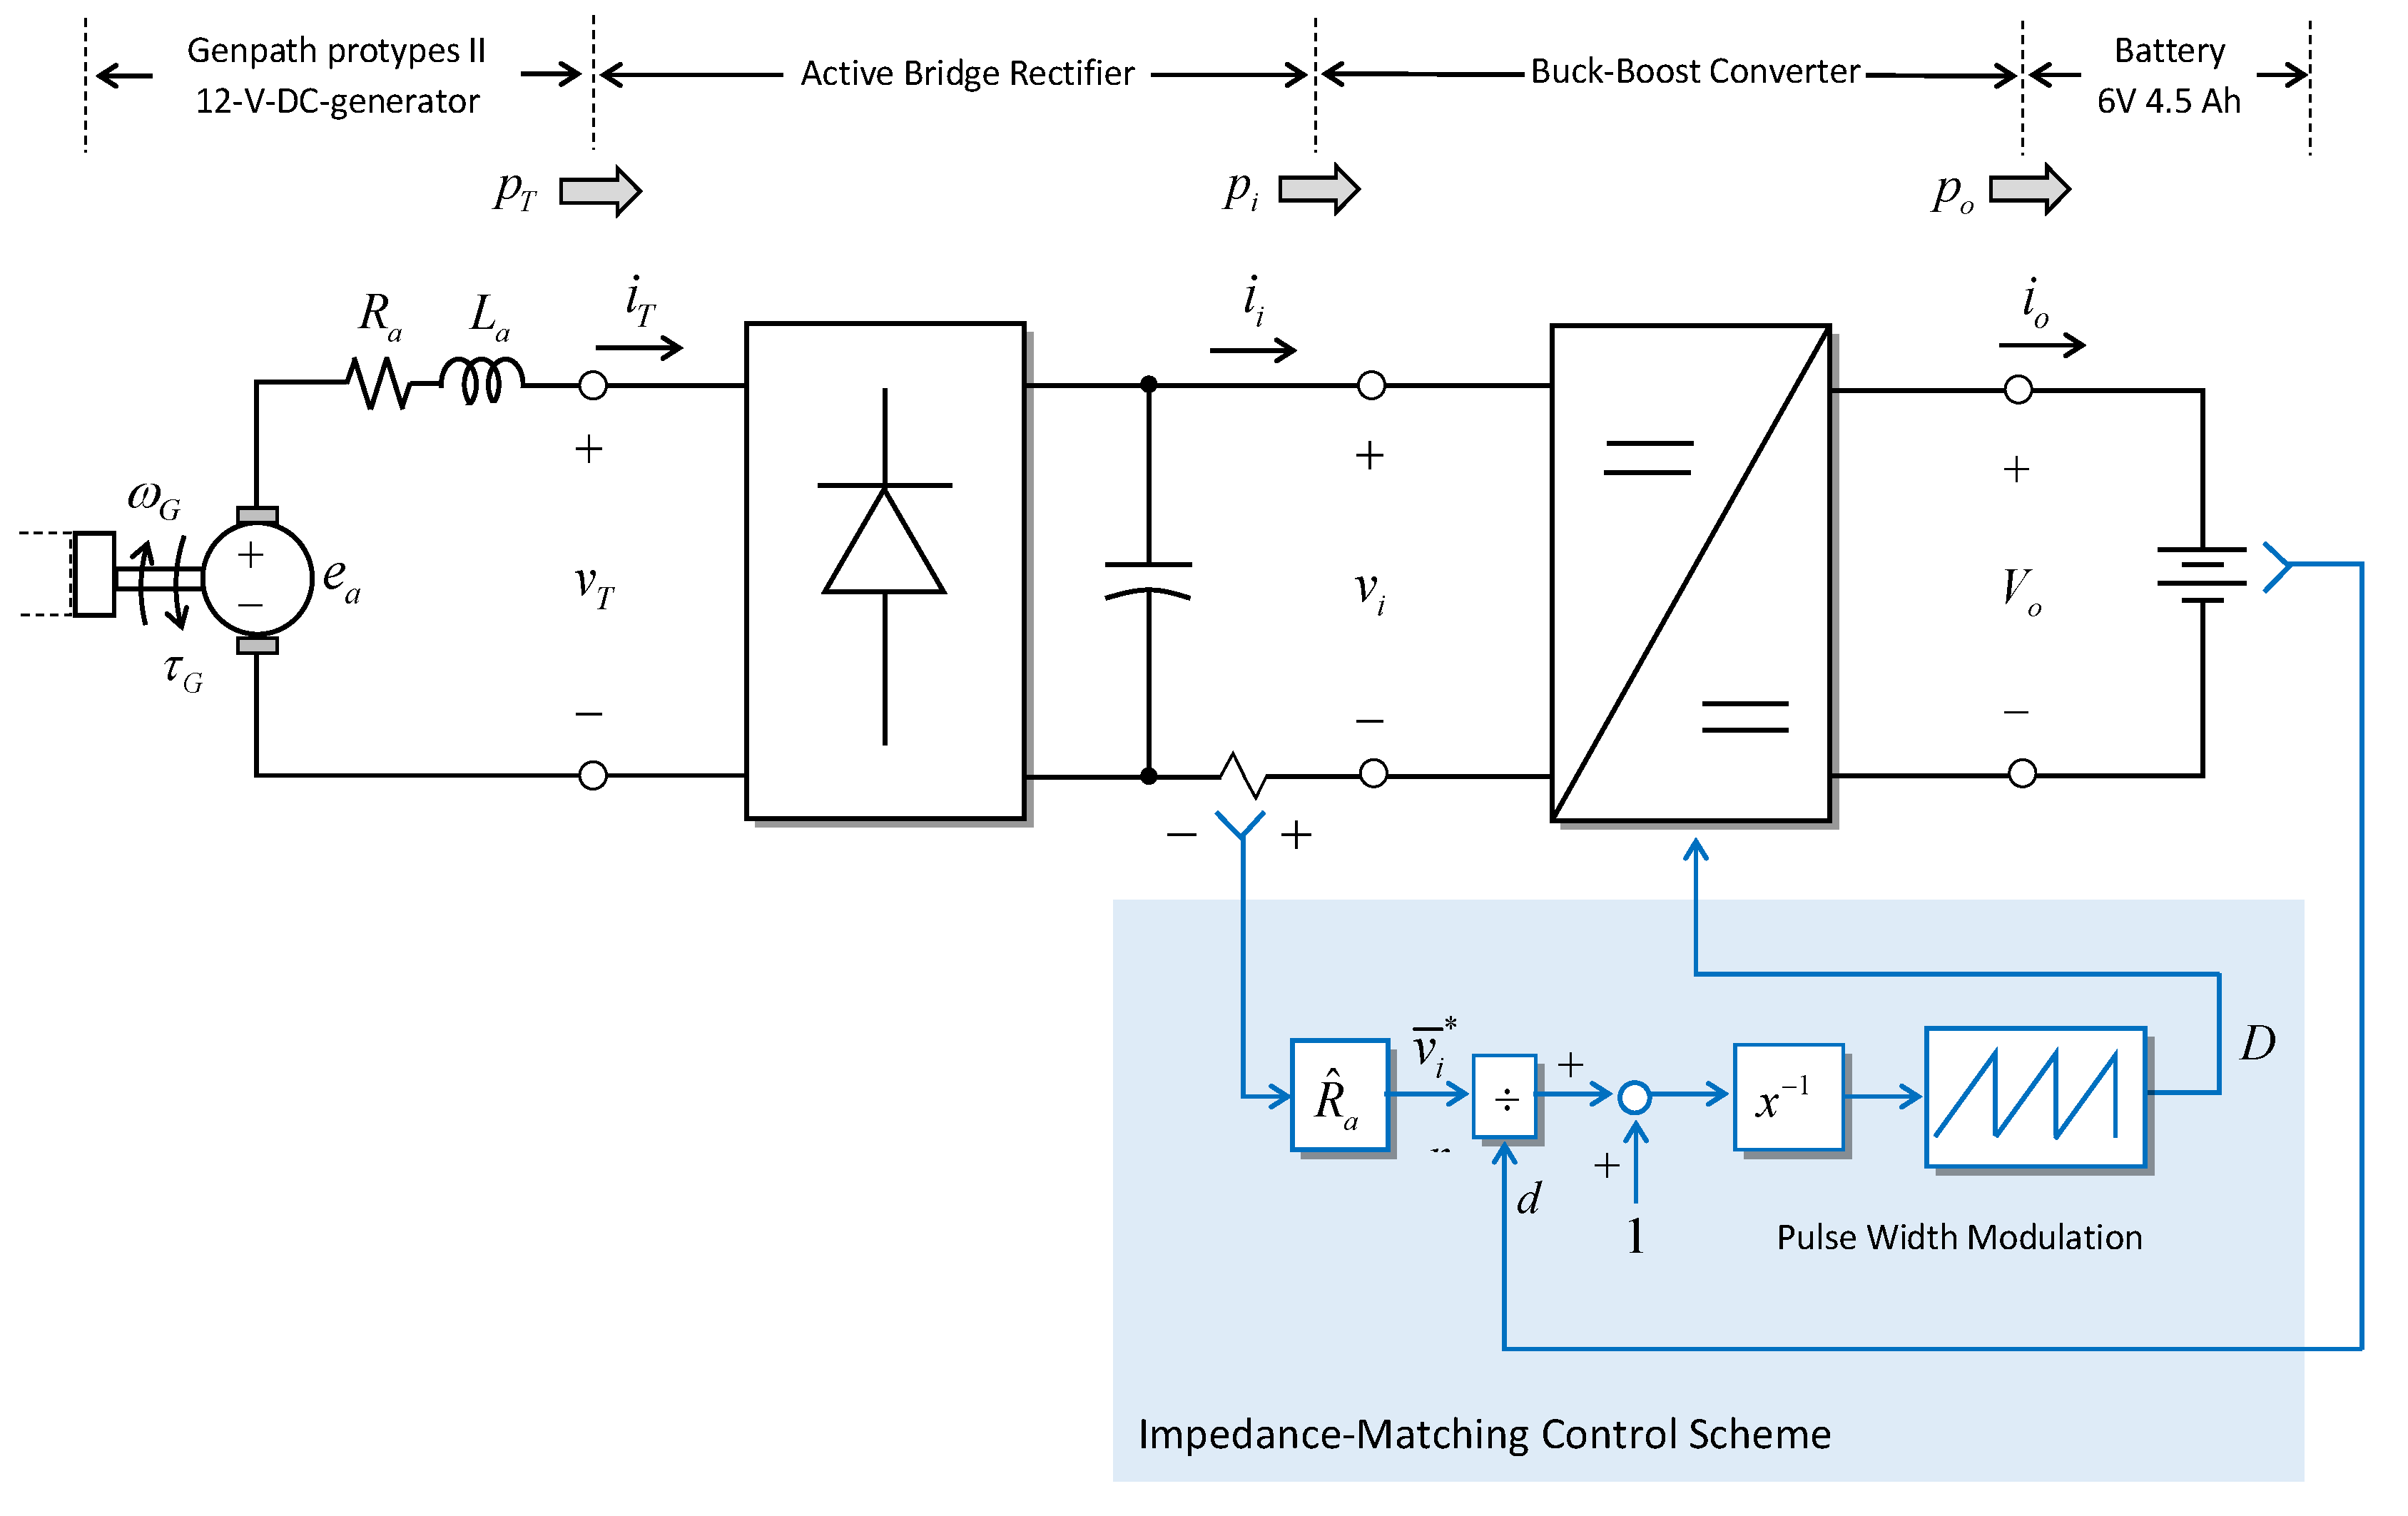
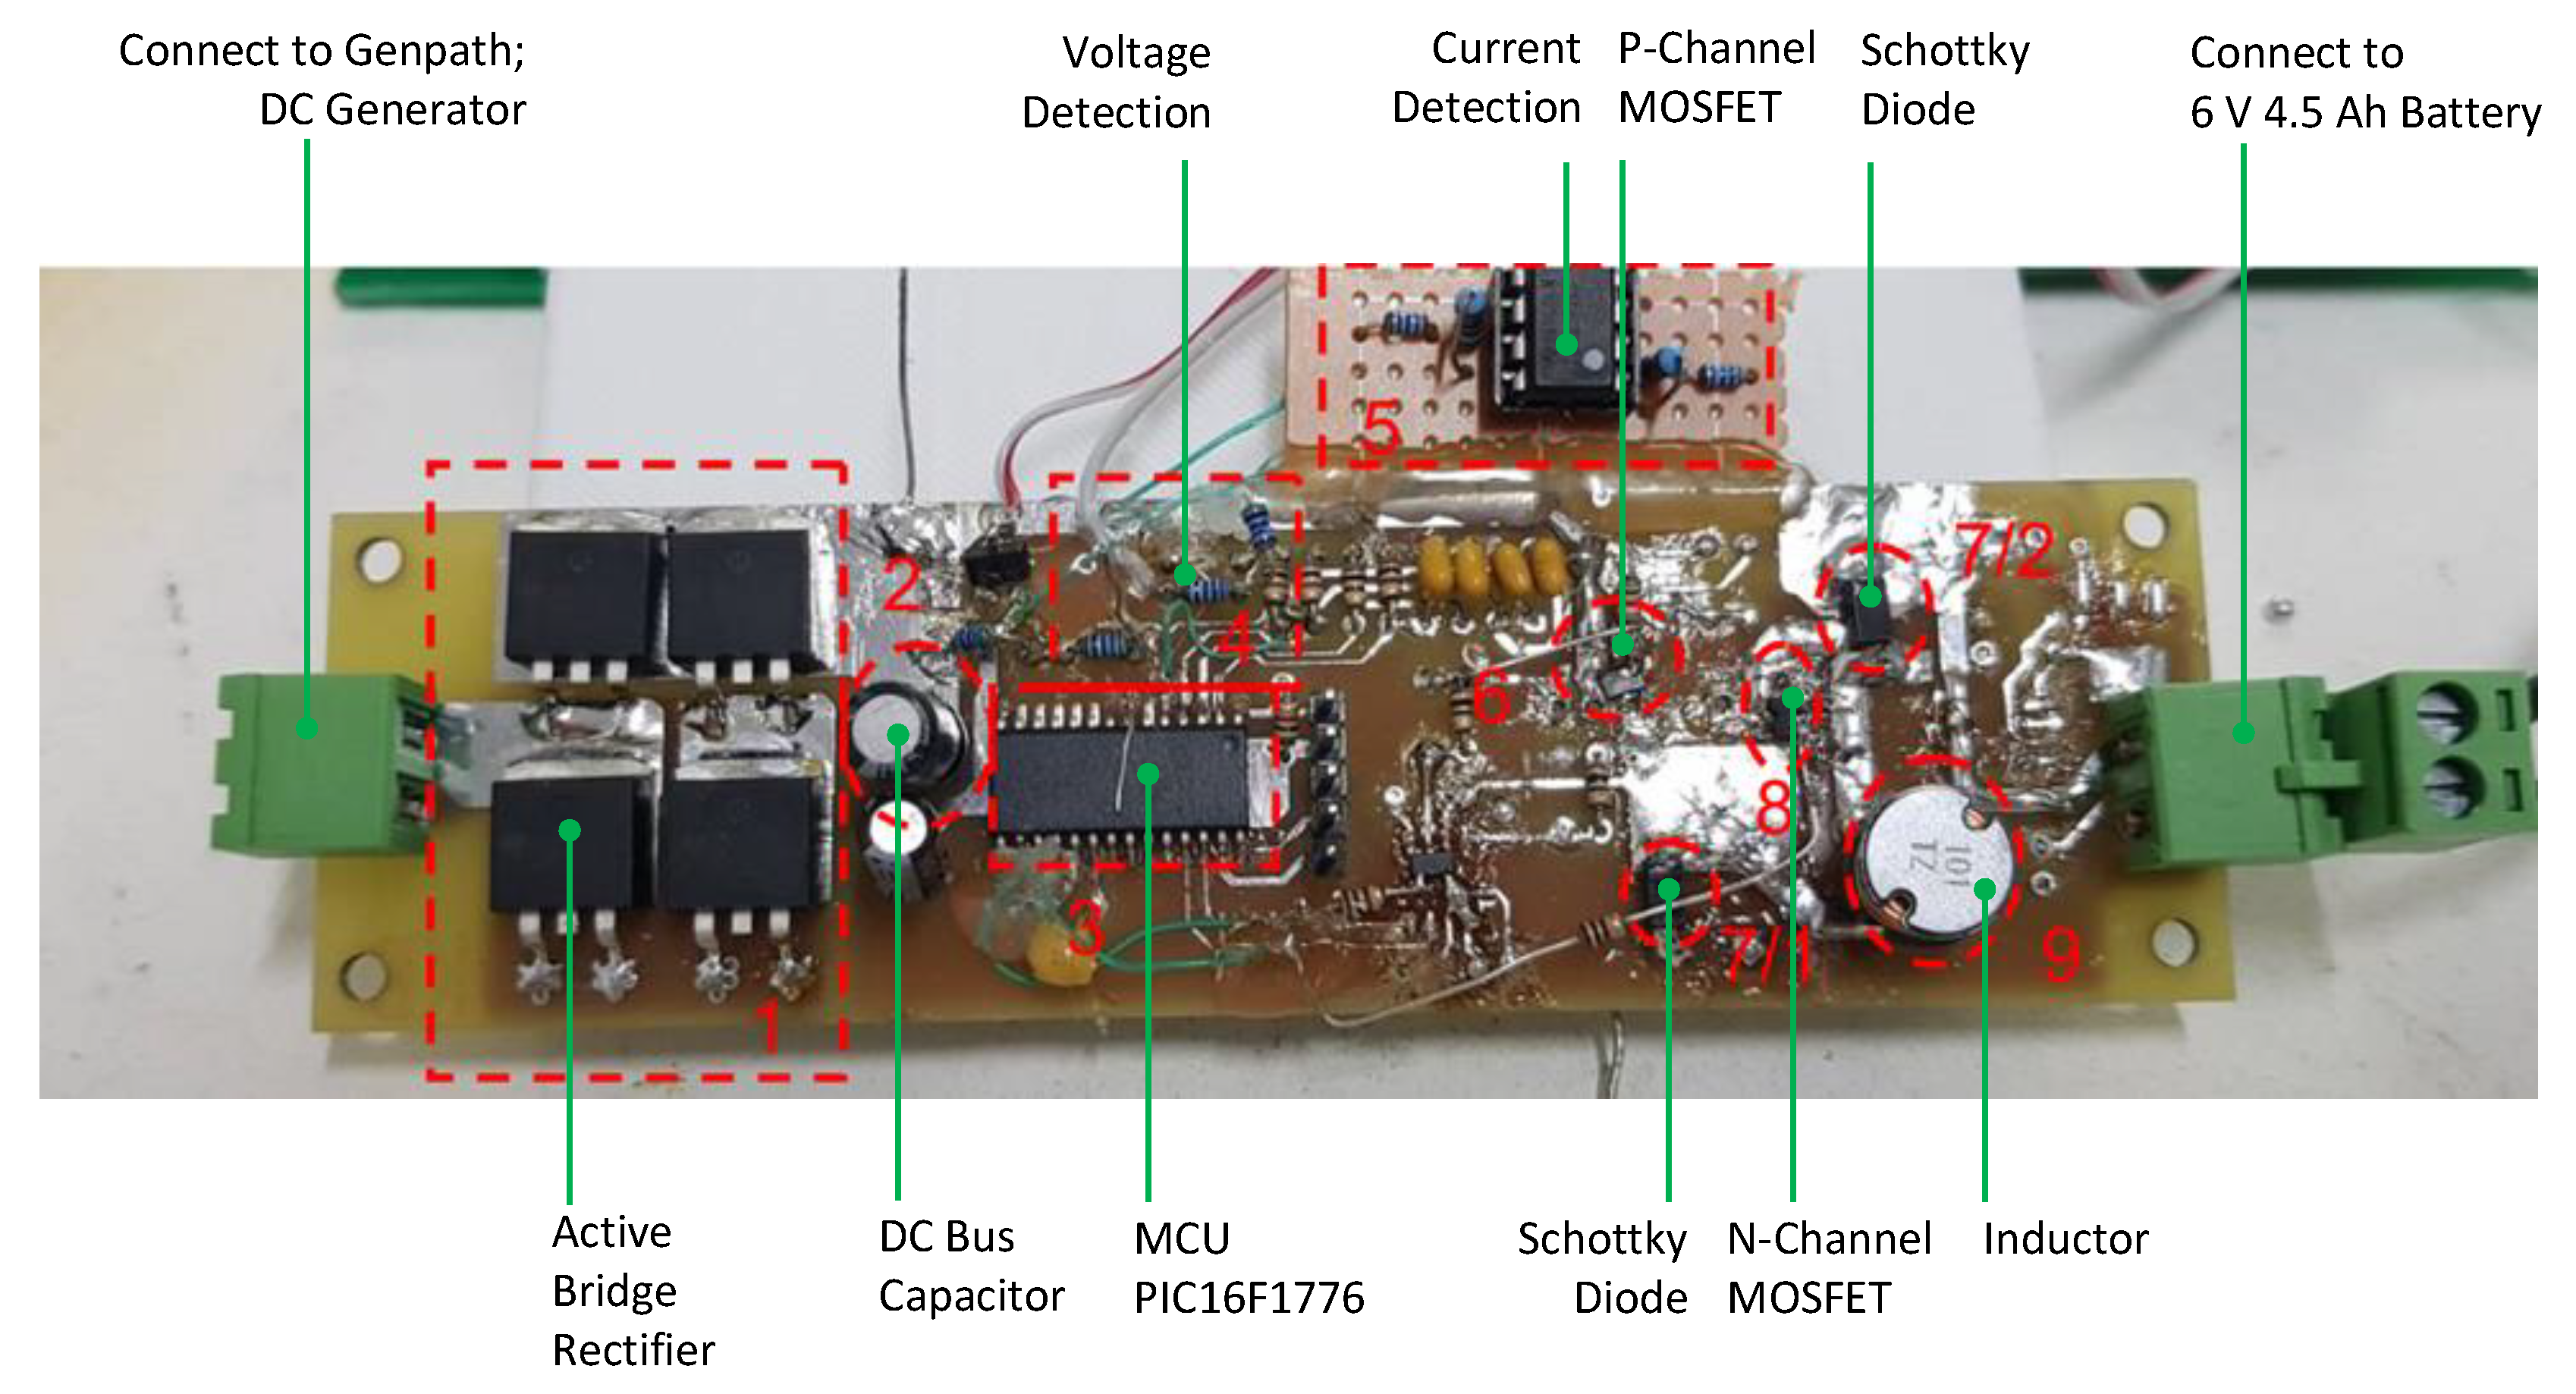
2.2. The system of Power Management and Storage Circuit
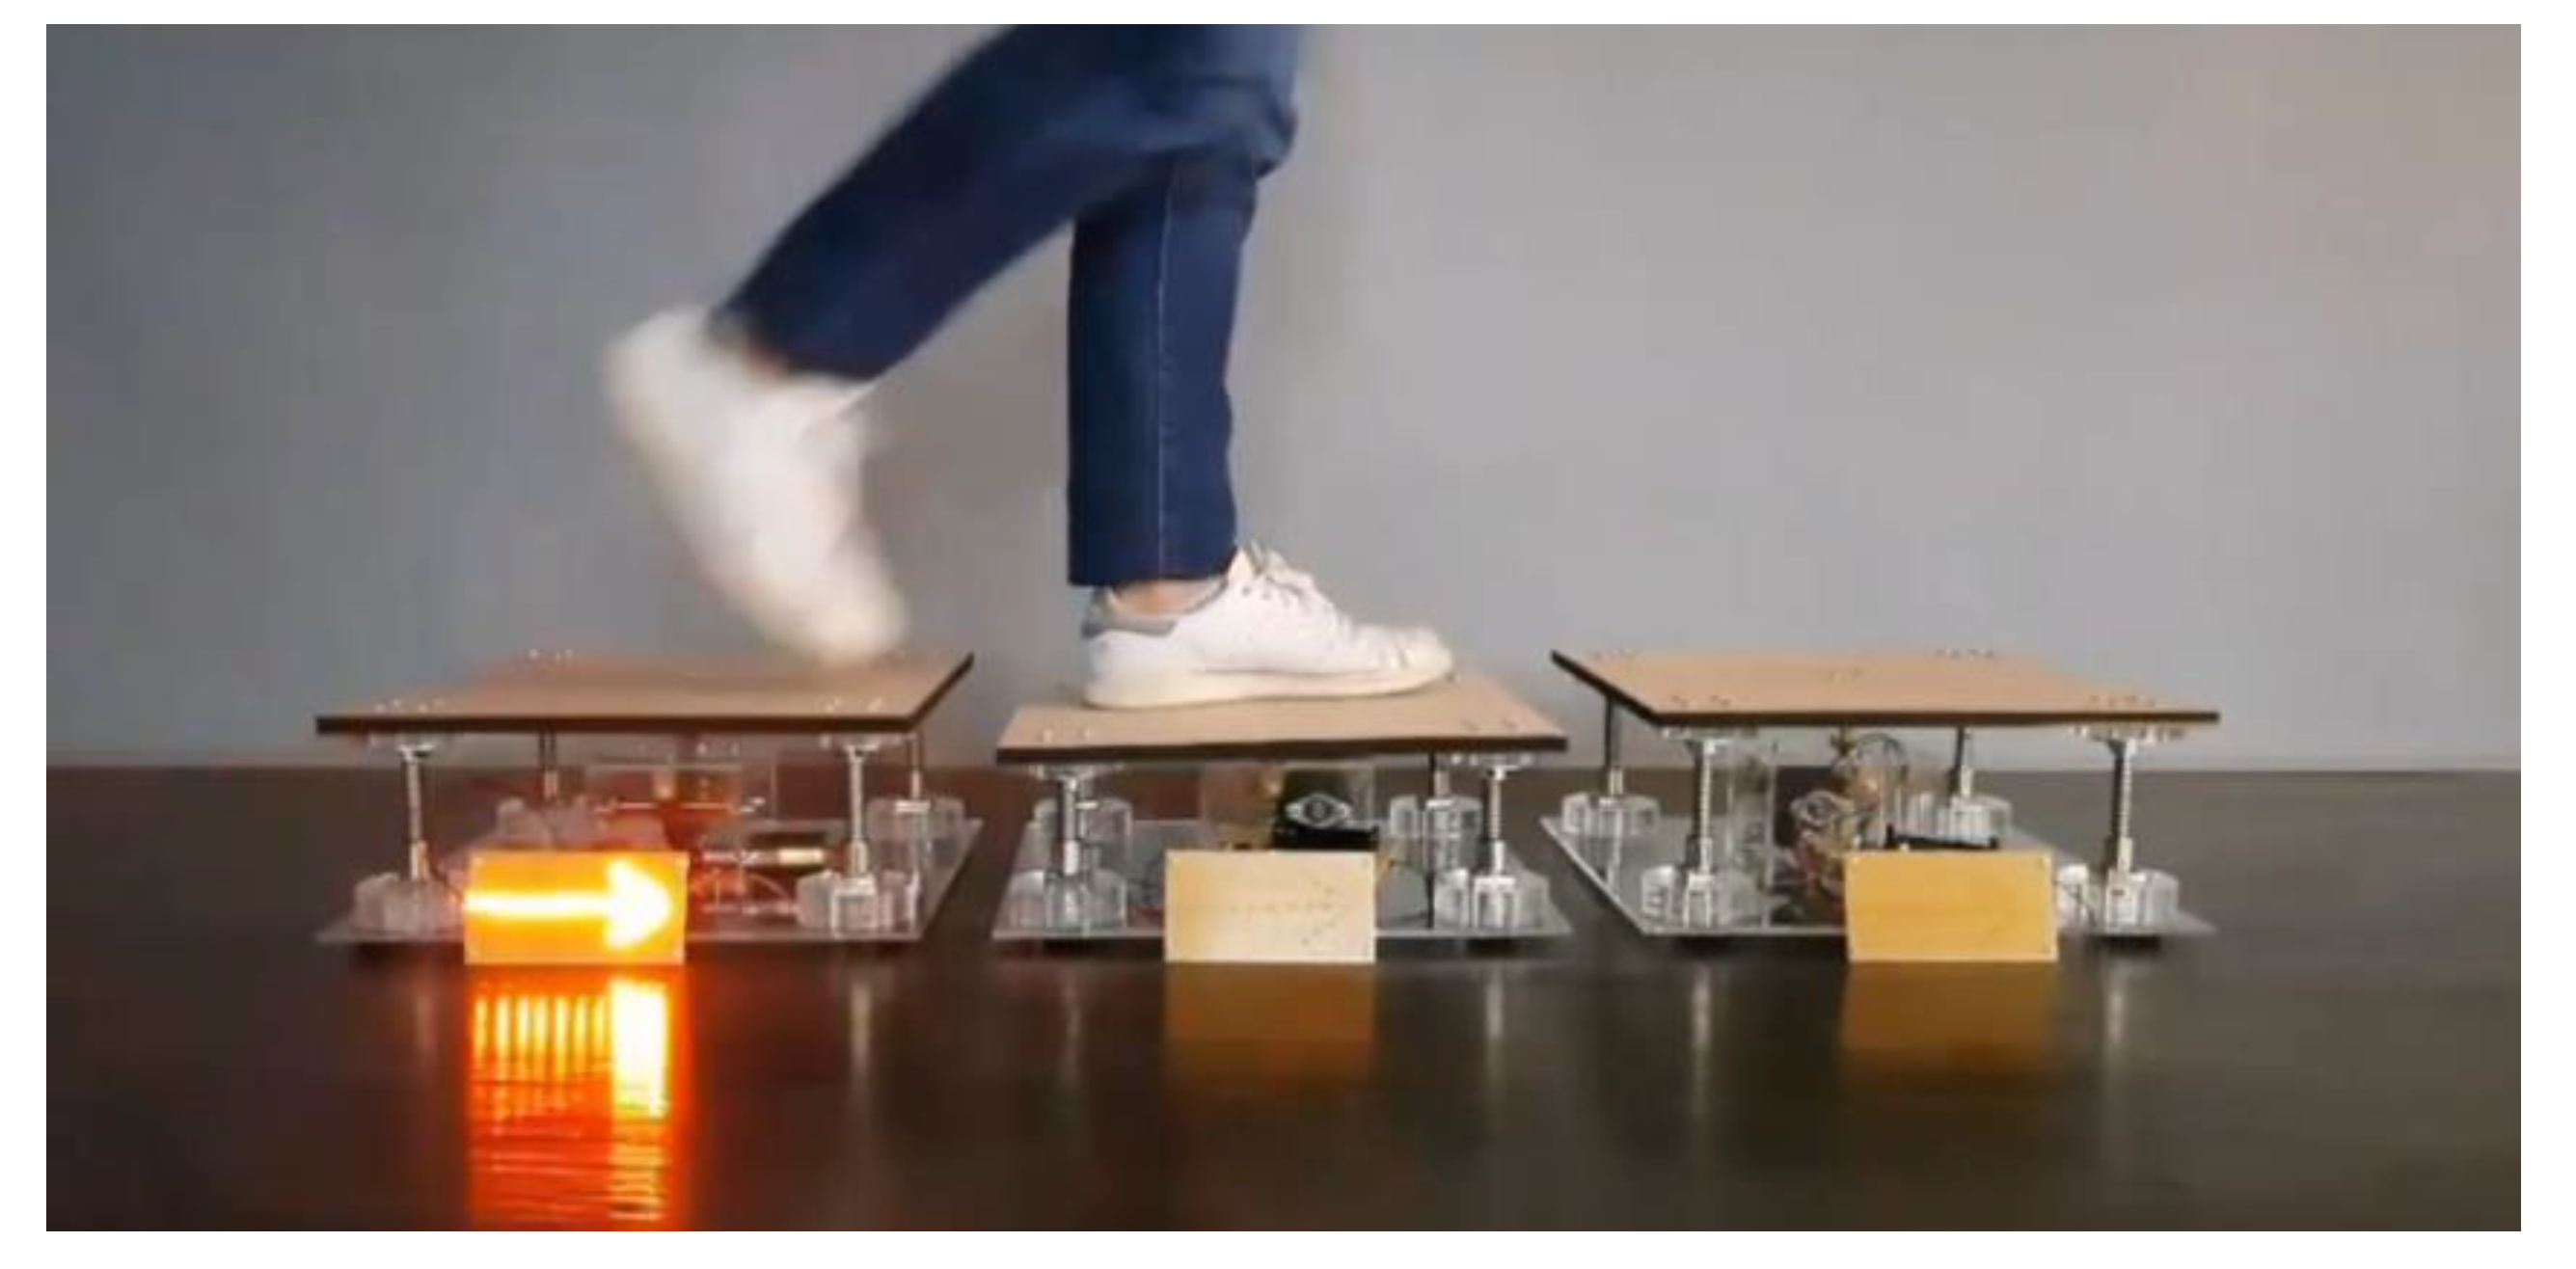
3. Installation and Demonstration
4. Conclusions
Author Contributions
Funding
Acknowledgments
Conflicts of Interest
References
- Lazaro, A.; Villarino, R.; Girbau, D. A Survey of NFC Sensors Based on Energy Harvesting for IoT Applications. Sensors 2018, 18, 3746. [Google Scholar] [CrossRef] [PubMed] [Green Version]
- Cottone, F. Energy Harvesting: Introduction. In Proceedings of the NiPS Summer School, Fiuggi, Italy, 7–12 July 2015; p. 50. [Google Scholar]
- Panwar, N.L.; Kaushik, S.C.; Kothari, S. Role of Renewable Energy Sources in Environmental Protection: A Review. Renew. Renew. Sustain. Energy Rev. 2011, 15, 1513–1524. [Google Scholar] [CrossRef]
- Beeby, S.P.; Torah, R.N.; Tudor, M.J.; Glynne-Jones, P.; O’Donnell, T.; Saha, C.R.; Roy, S. A Micro Electromagnetic Generator for Vibration Energy Harvesting. J. Micromech. Microeng. 2007, 17, 1257–1265. [Google Scholar] [CrossRef]
- Riemer, R.; Shapiro, A. Biomechanical Energy Harvesting from Human Motion: Theory, State of the Art, Design Guidelines, and Future Directions. J. Neuroeng. Rehab. 2011, 8, 22. [Google Scholar] [CrossRef] [PubMed] [Green Version]
- Energy Floors 2019. Available online: https://energy-floors.com (accessed on 1 March 2019).
- Pavegen 2020. Available online: https://pavegen.com/ (accessed on 7 October 2020).
- Rain-Noe. Swingset-Powered Phone Chargers. Ieyenews. 2020. Available online: https://www.ieyenews.com/swingset-powered-phone-chargers/ (accessed on 7 October 2020).
- Liu, M.; Lin, R.; Zhou, S.; Yu, Y.; Ishida, A.; McGrath, M.; Kennedy, B.; Hajj, M.; Zuo, L. Design, Simulation and Experiment of a Novel High Efficiency Energy Harvesting Paver. Appl. Energy 2018, 212, 966–975. [Google Scholar] [CrossRef]
- Hwang, S.J.; Jung, H.J.; Kim, J.H.; Ahn, J.H.; Song, D.; Song, Y.; Lee, H.L.; Moon, S.P.; Park, H.; Sung, T.H. Designing and Manufacturing a Piezoelectric Tile for Harvesting Energy from Footsteps. Curr. Appl. Phys. 2015, 15, 669–674. [Google Scholar] [CrossRef]
- Kim, K.B.; Cho, J.Y.; Jabbar, H.; Ahn, J.H.; Hong, S.D.; Woo, S.B.; Sung, T.H. Optimized Composite Piezoelectric Energy Harvesting Floor Tile for Smart Home Energy Management. Energy Convers. Manag. 2018, 171, 31–37. [Google Scholar] [CrossRef]
- Vocca, H.; Cottone, F. Kinetic Energy Harvesting. In ICT-Energy-Concepts Towards Zero–Power Information and Communication Technology; Intechopen: London, UK, 2014. [Google Scholar] [CrossRef] [Green Version]
- Yang, Z.; Zhou, S.; Zu, J.; Inman, D. High-Performance Piezoelectric Energy Harvesters and Their Applications. Joule 2018, 2, 642–697. [Google Scholar] [CrossRef] [Green Version]
- Larkin, M.; Tadesse, Y. HM-EH-RT: Hybrid Multimodal Energy Harvesting from Rotational and Translational Motions. Int. J. Smart Nano Mater. 2013, 4, 257–285. [Google Scholar] [CrossRef]
- Arnold, D.P. Review of Microscale Magnetic Power Generation. IEEE Trans. Magn. 2007, 43, 3940–3951. [Google Scholar] [CrossRef]
- Lowattanamart, W.; Suttisung, V.; Sintragoonchai, S.; Phanomchoeng, G.; Jintanawan, T. Feasibility on Development of Kinetic-Energy Harvesting Floors. IOP Conf. Ser. Earth Environ. Sci. 2020, 463, 12107. [Google Scholar] [CrossRef]


| Parameters | Value |
|---|---|
| Mass of Rack and Plate () | 3.016 |
| Radius of Pinion () | 0.72 × 10⁻² m |
| Radius of Gear () | 3 × 10⁻² m |
| Moment of inertia of bevel gear () | 8.6756 × 10⁻⁷ |
| Moment of Inertia of Pinion () | 1 × 10⁻⁵ kg m |
| Spring Coefficient () | 20,500 N/m |
| Damping Coefficient () | 900 N·s/m |
| Resistance of Generator () | 42 Ohm |
| Inductance () | 19.6 × 10⁻³ H |
| Generator constant () | 0.5854 Vs/rad |
| Resistance of Load () | 30 Ohm |
| Parameters | Value |
|---|---|
| Pitch of Lead Screw () | 8 |
| Mass of Nut and Plate () | 2.16 |
| Moment of inertia of bevel gear () | 8.6756 × 10⁻⁷ |
| Moment of Inertia of lead screw () | 2.5536 × 10⁻⁶ kg m2 |
| Lead angle | 45 degree |
| Spring Coefficient () | 40,000 N/m |
| Damping Coefficient () | 13,600 N·s/m |
| Resistance of Generator () | 37 Ohm |
| Inductance () | 19.6 × 10⁻³ H |
| Generator constant () | 0.392 Vs/rad |
| Resistance of Load () | 30 Ohm |
| Friction coefficient (µ) | 0.21 |
| Efficient of thrust bearing | 0.6529 |
| Efficient of thread | 0.8132 |
| Variables | Rack-Pinion Design | Lead-Screw Design |
|---|---|---|
| Values per Footstep | Values per Footstep | |
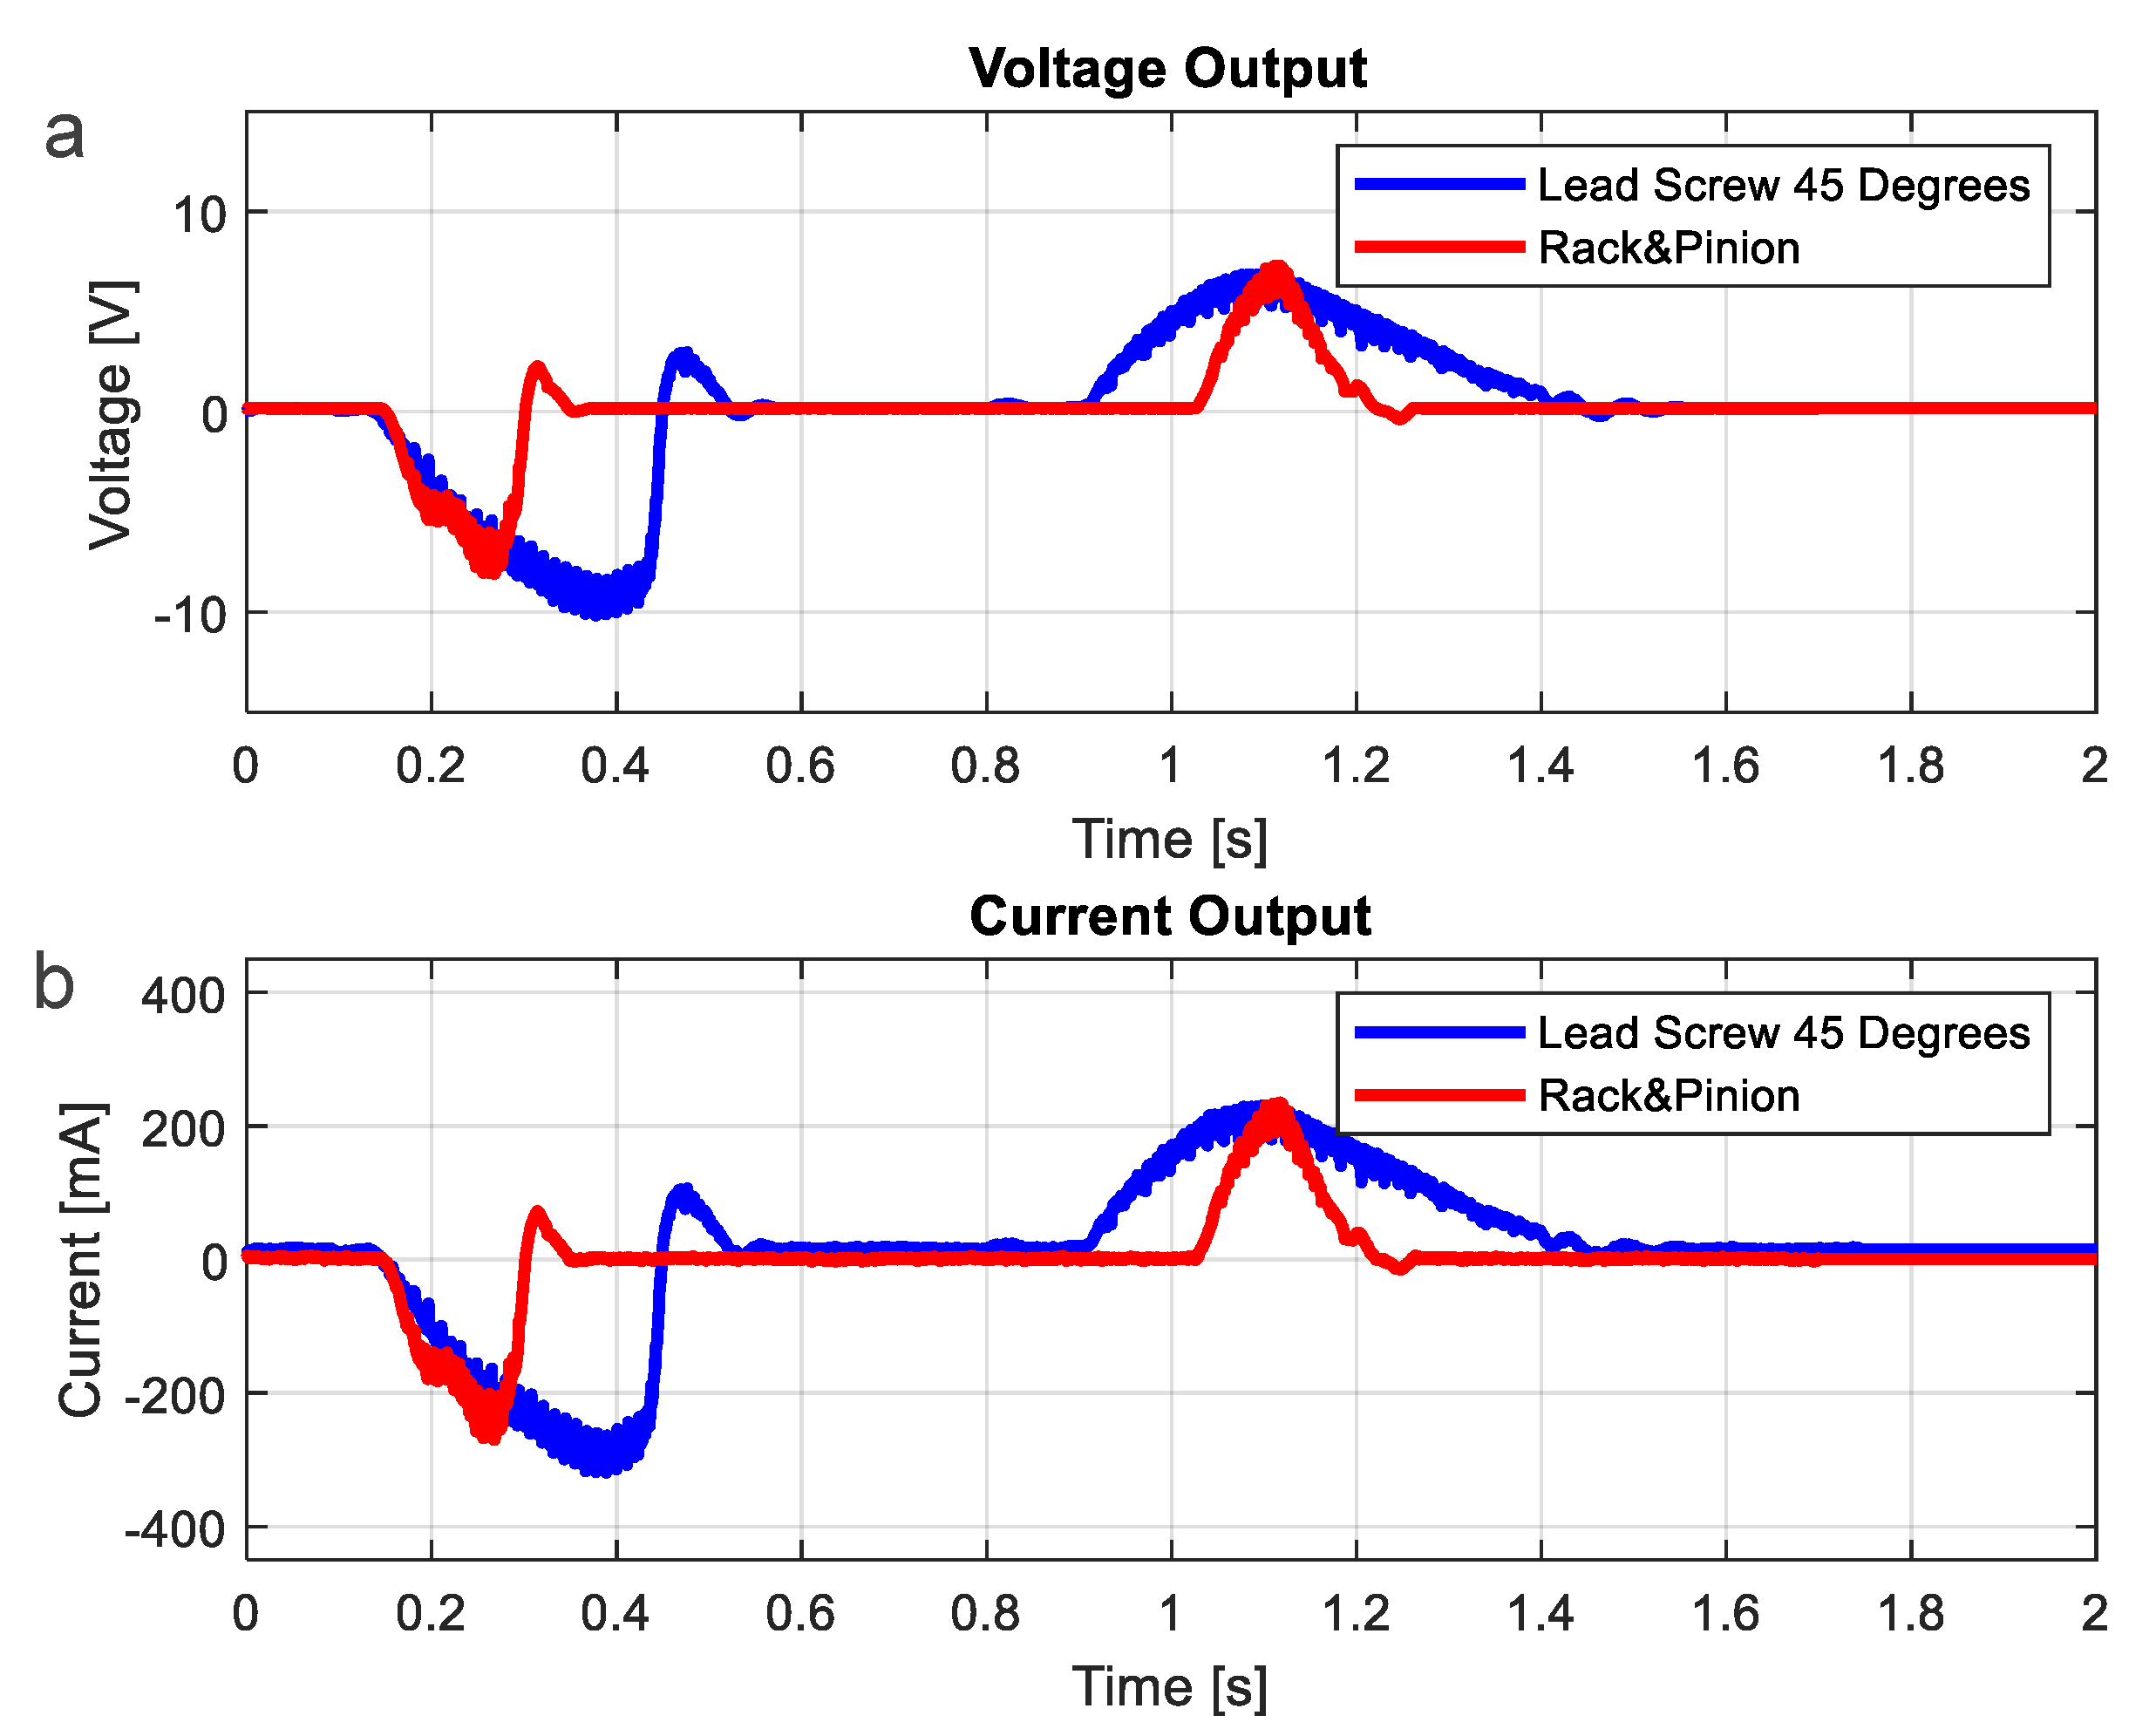
| Maximum voltage | 9.92 V | 10.13 V |
| Average voltage | 0.99 V | 4.16 V |
| Maximum current | 330.9 mA | 337.9 mA |
| Average current | 33.15 mA | 138.8 mA |
| Maximum power | 3.28 W | 3.42 W |
| Average power | 216.4 mW | 590.3 mW |
| Wave duration | 1.00 s | 1.50 s |
| Average energy | 216.4 mJ | 885.8 mJ |
| Design | Averaged Energy (mJ) |
|---|---|
| Rack pinion | 319 |
| 60° lead angles Lead screw | 353 |
| 45° lead angles Lead screw | 488 |
| Voltage (V) | Resistance RG (Ω) | Inductance L (mH) | Kt (Vs/rad) |
|---|---|---|---|
| 12 | 37 | 3.6 | 0.2903 |
| 24 | 42 | 19.6 | 0.5854 |
| Load (Ω) | Average Energy (mJ) | |
|---|---|---|
| 12 V | 24 V | |
| 30 | 798.2 | 321.5 |
| 39 | 750.0 | 313.2 |
| 49 | 745.5 | 488.2 |
| Prototype I (Rack and Pinion) | Prototype II (Lead Screw) | ||||
|---|---|---|---|---|---|
| Item | Dimensions | # | Item | Dimensions | # |
| Acrylic plate | 400 × 400 × 10 mm | 2 | Wood plate | 400 × 400 × 5 mm | 2 |
| Linear guide | Dia 12 Length 90 mm | 4 | Linear guide | Dia 12 Length 90 mm | 4 |
| Linear bearing | Inner dia 12 mm | 4 | Linear bearing | Inner dia 12 mm | 4 |
| Shaft coupling | Inner dia 12 mm | 4 | Shaft coupling | Inner dia 12 mm | 4 |
| Coil spring | Length 60 mm Dia 1.6 mm | 4 | Coil spring | Length 60 mm Dia 2.2 mm | 4 |
| Shaft to generator | Dia 8 mm Length 60 mm | 1 | Shaft to generator | Dia 8 mm Length 60 mm | 1 |
| Rack and pinion | Pinion radius 3 cm | 1 | Nut and lead screw | Dia 8 mm Pitch 2 mm | 1 |
| Flexible coupling | 8 mm | 1 | Flexible coupling | 8 mm | 1 |
| Gear | Radius 0.75 cm | 1 | Bevel gear | Inner dia 8 mm | 2 |
| Ball bearing | Inner dia 8 mm | 3 | Ball bearing | Inner dia 8 mm | 3 |
| Generator | ZGA37RG 24V 300 rpm | 1 | Generator | ZGA37RG 12V 300 rpm | 1 |
| Variables | Prototype I (Rack-Pinion) | Prototype II (Lead-Screw) |
|---|---|---|
| Values per Footstep | Values per Footstep | |
| Maximum voltage | 7.5 V | 9.5 V |
| Average voltage | 1.26 V | 2.88 V |
| Maximum current | 246 mA | 285 mA |
| Average current | 42.5 mA | 88 mA |
| Maximum power | 1.85 W | 2.71 W |
| Average power | 216 mW | 520 mW |
| Wave duration | 1.14 s | 1.35 s |
| Average energy | 247 mJ | 702 mJ |
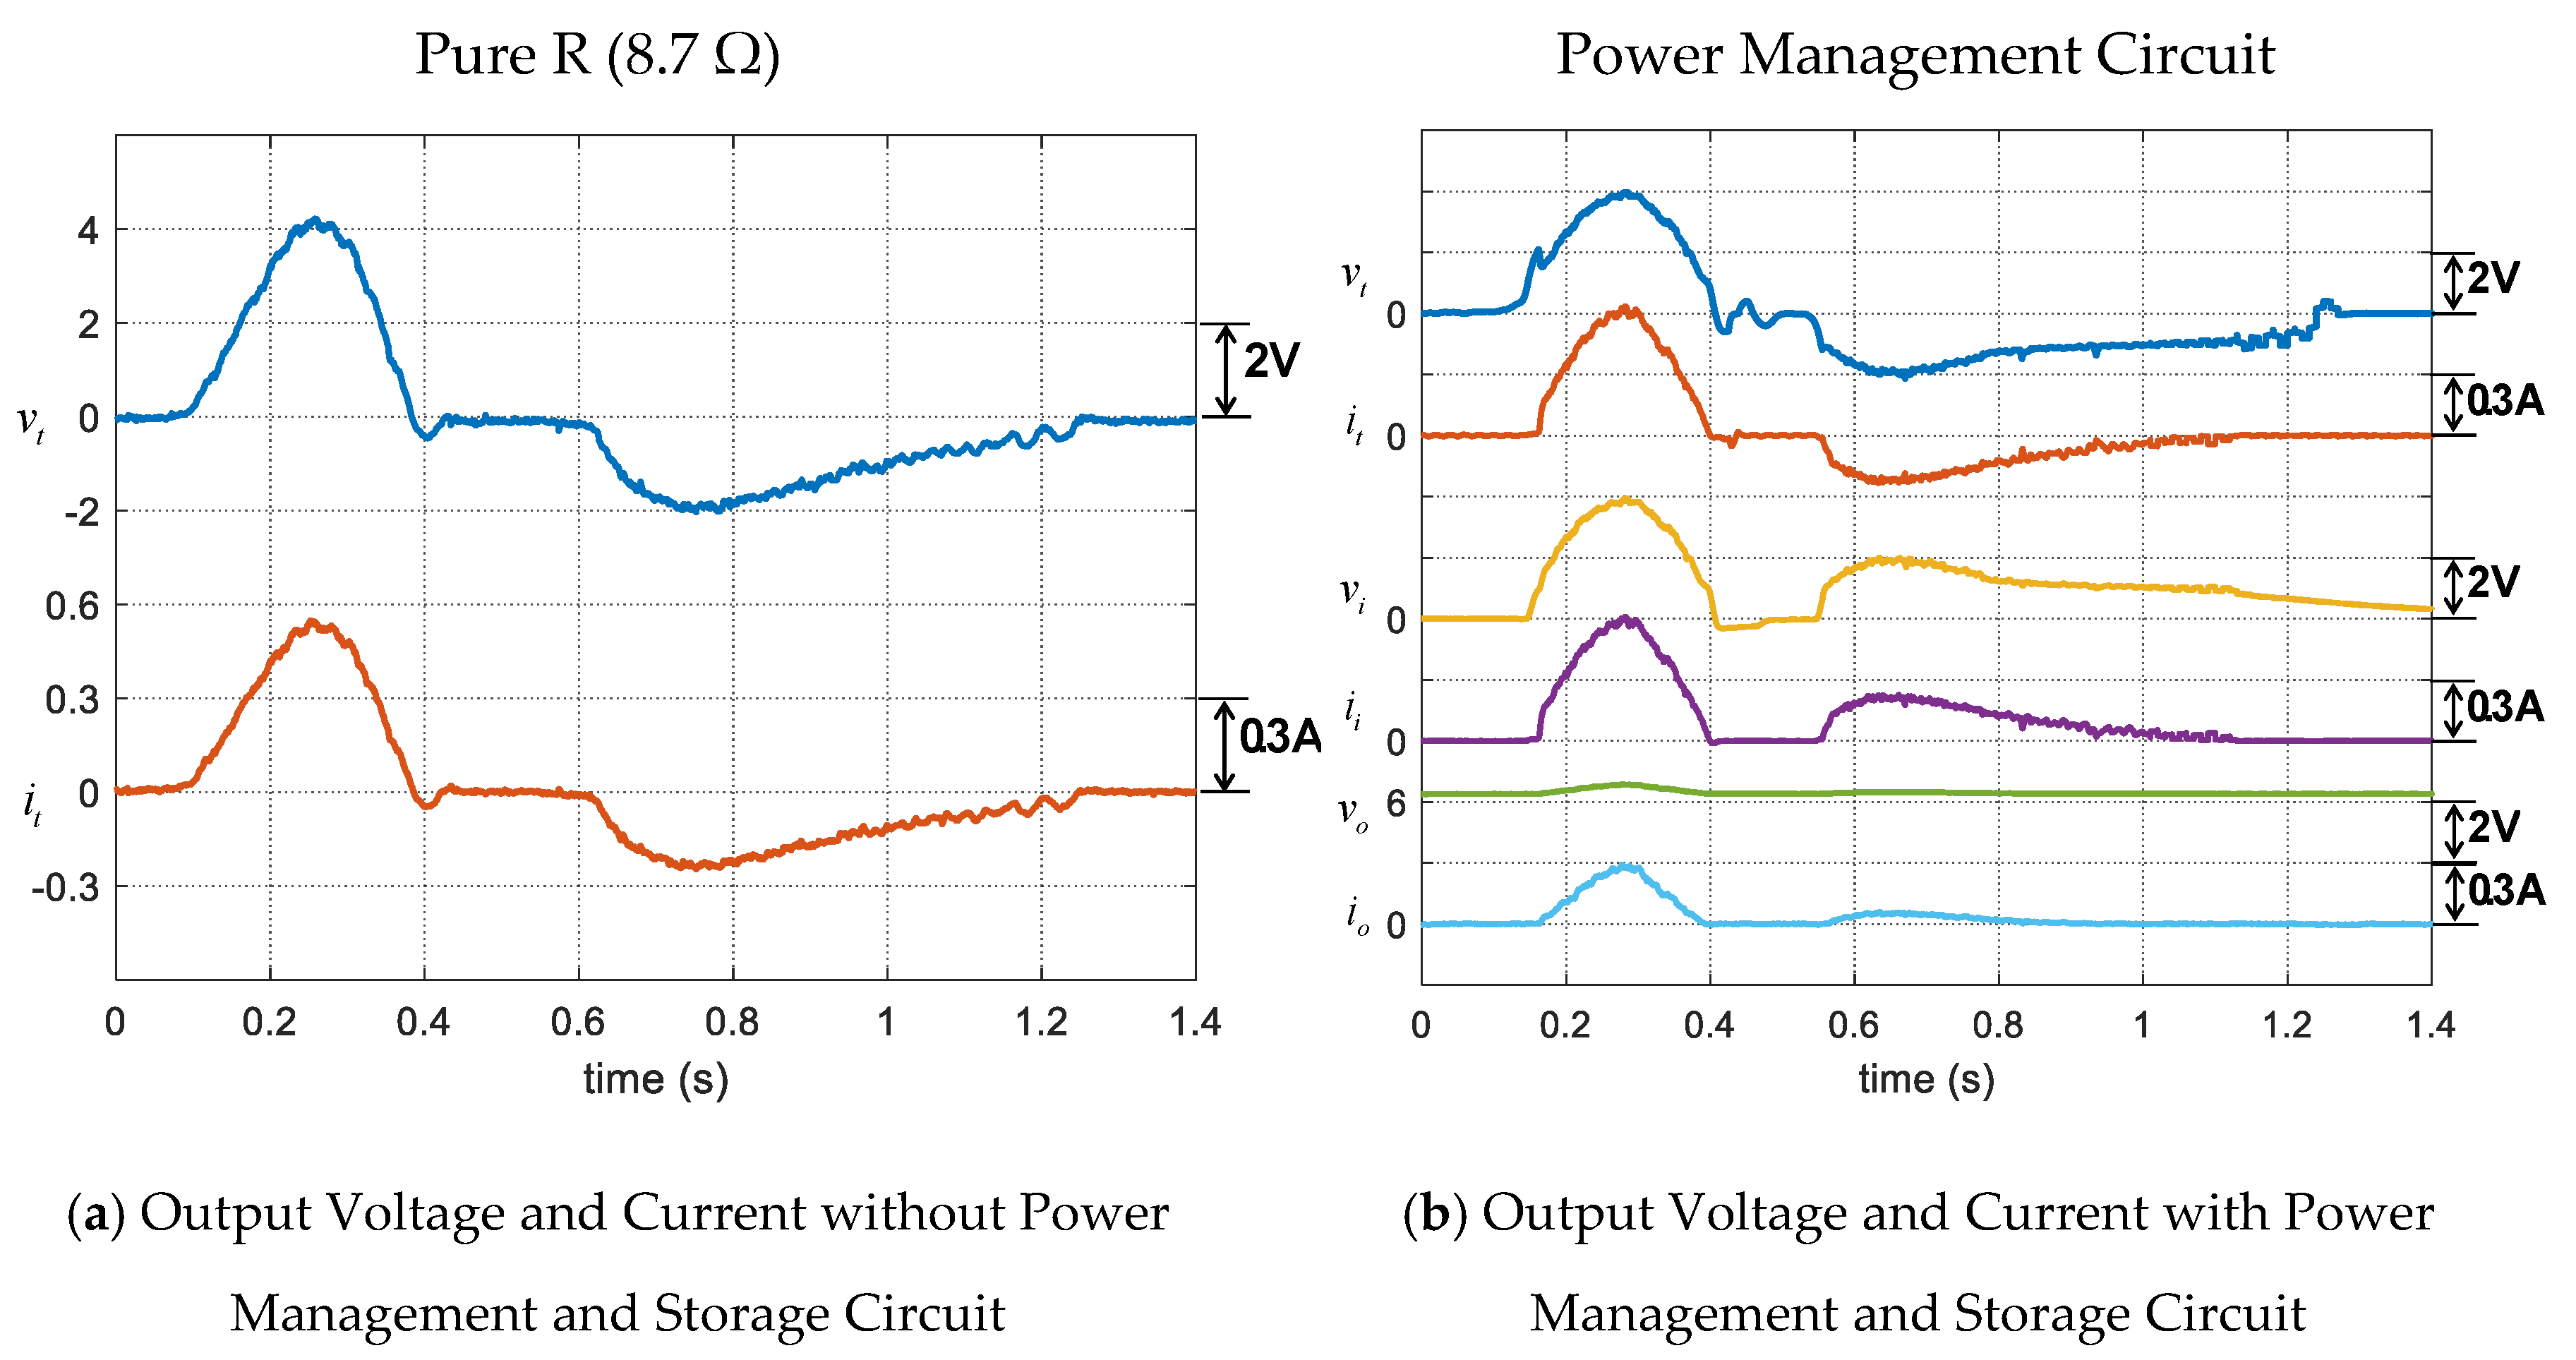
| Variables | Values per Footstep | |
|---|---|---|
| Pure (8.7 Ω) | Power Management and Storage Circuit | |
| Maximum voltage; max () | 4.22 V | 3.97 V |
| Maximum current; max () | 548 mA | 635 mA |
| Maximum power; max () | 2.29 W | 2.48 W |
| Average power; | 351 mW | 374 mW |
| Average power; | - | 359 mW |
| Average power; | - | 280 mW |
| Wave duration | 1.18 s | 1.08 s |
| Stored energy at 1.4 s; (t = 1.4 s) | 415 mJ | 302 mJ |
| Efficiency of Active Rectifier | - | 95.78% |
| Efficiency of Buck-Boost Converter | - | 78.00% |
| Overall Efficiency | - | 74.72% |
Publisher’s Note: MDPI stays neutral with regard to jurisdictional claims in published maps and institutional affiliations. |
© 2020 by the authors. Licensee MDPI, Basel, Switzerland. This article is an open access article distributed under the terms and conditions of the Creative Commons Attribution (CC BY) license (http://creativecommons.org/licenses/by/4.0/).
Share and Cite
Jintanawan, T.; Phanomchoeng, G.; Suwankawin, S.; Kreepoke, P.; Chetchatree, P.; U-viengchai, C. Design of Kinetic-Energy Harvesting Floors. Energies 2020, 13, 5419. https://0-doi-org.brum.beds.ac.uk/10.3390/en13205419
Jintanawan T, Phanomchoeng G, Suwankawin S, Kreepoke P, Chetchatree P, U-viengchai C. Design of Kinetic-Energy Harvesting Floors. Energies. 2020; 13(20):5419. https://0-doi-org.brum.beds.ac.uk/10.3390/en13205419
Chicago/Turabian StyleJintanawan, Thitima, Gridsada Phanomchoeng, Surapong Suwankawin, Phatsakorn Kreepoke, Pimsalisa Chetchatree, and Chanut U-viengchai. 2020. "Design of Kinetic-Energy Harvesting Floors" Energies 13, no. 20: 5419. https://0-doi-org.brum.beds.ac.uk/10.3390/en13205419