Properties of Vacuum Arcs Generated by Switching RMF Contacts at Different Ignition Positions

 , , ,
, , , 
Abstract
:1. Introduction
2. Materials and Methods
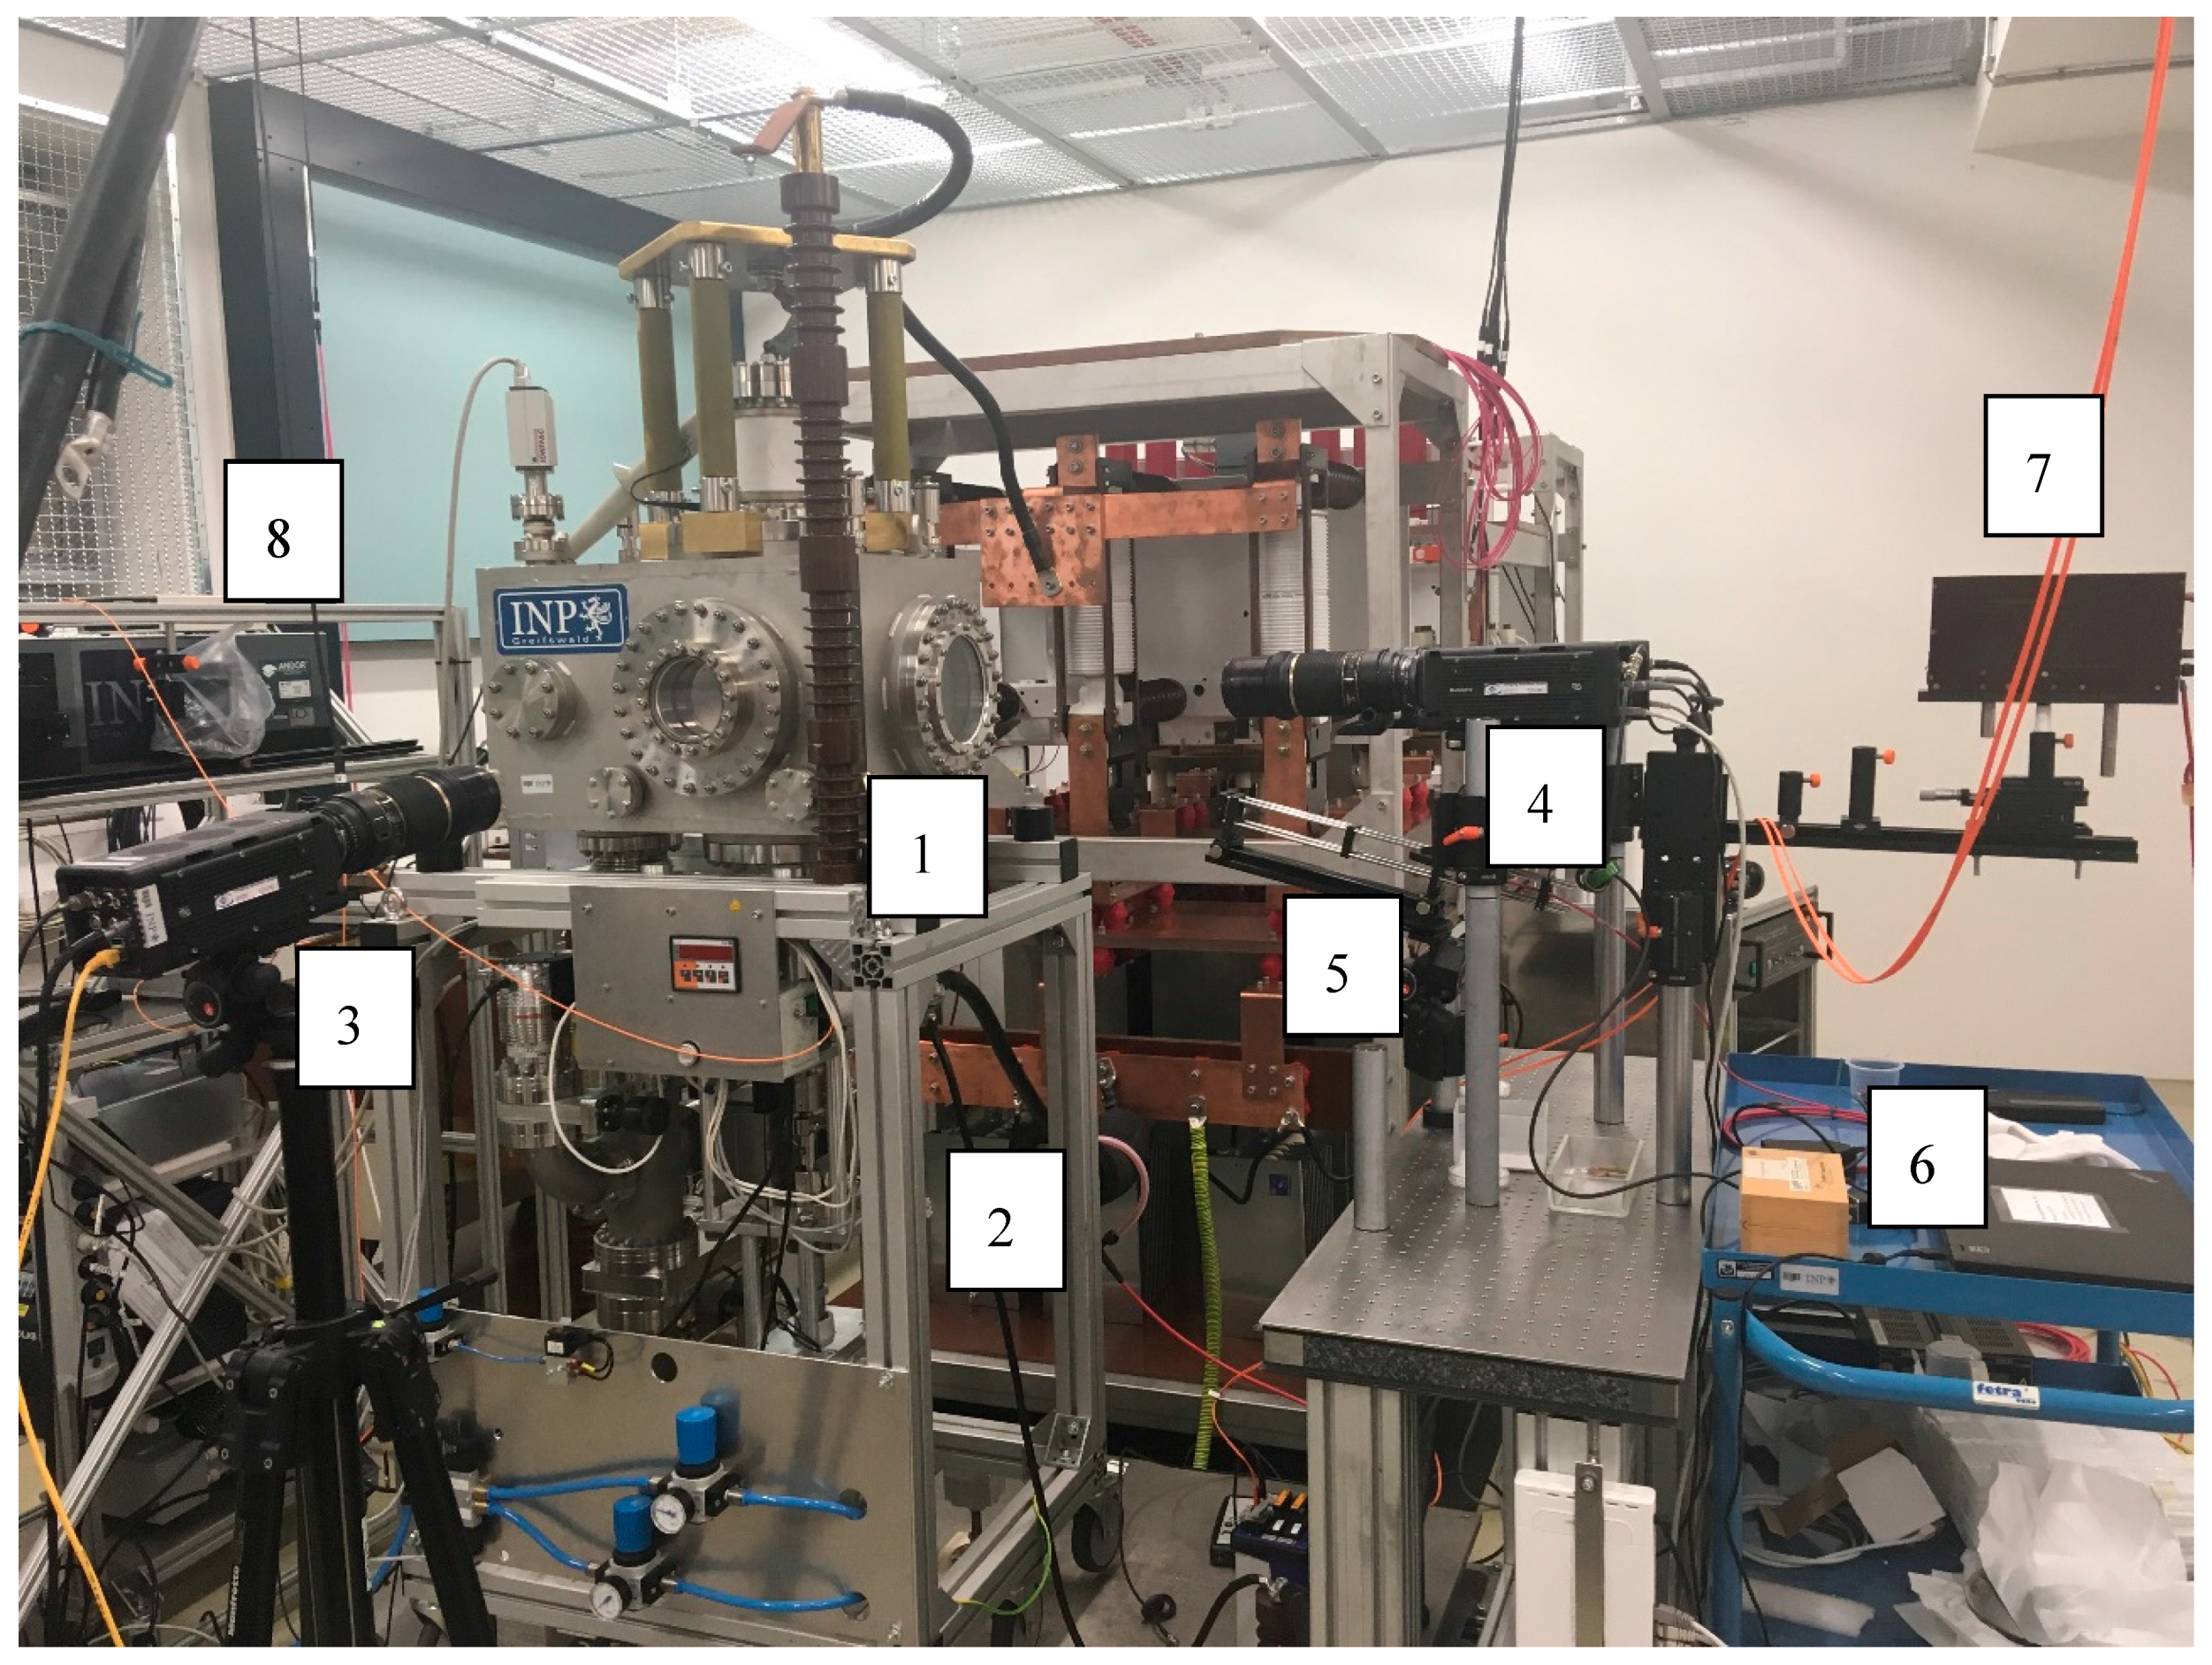
2.1. Experimental Setup
2.2. Power Source
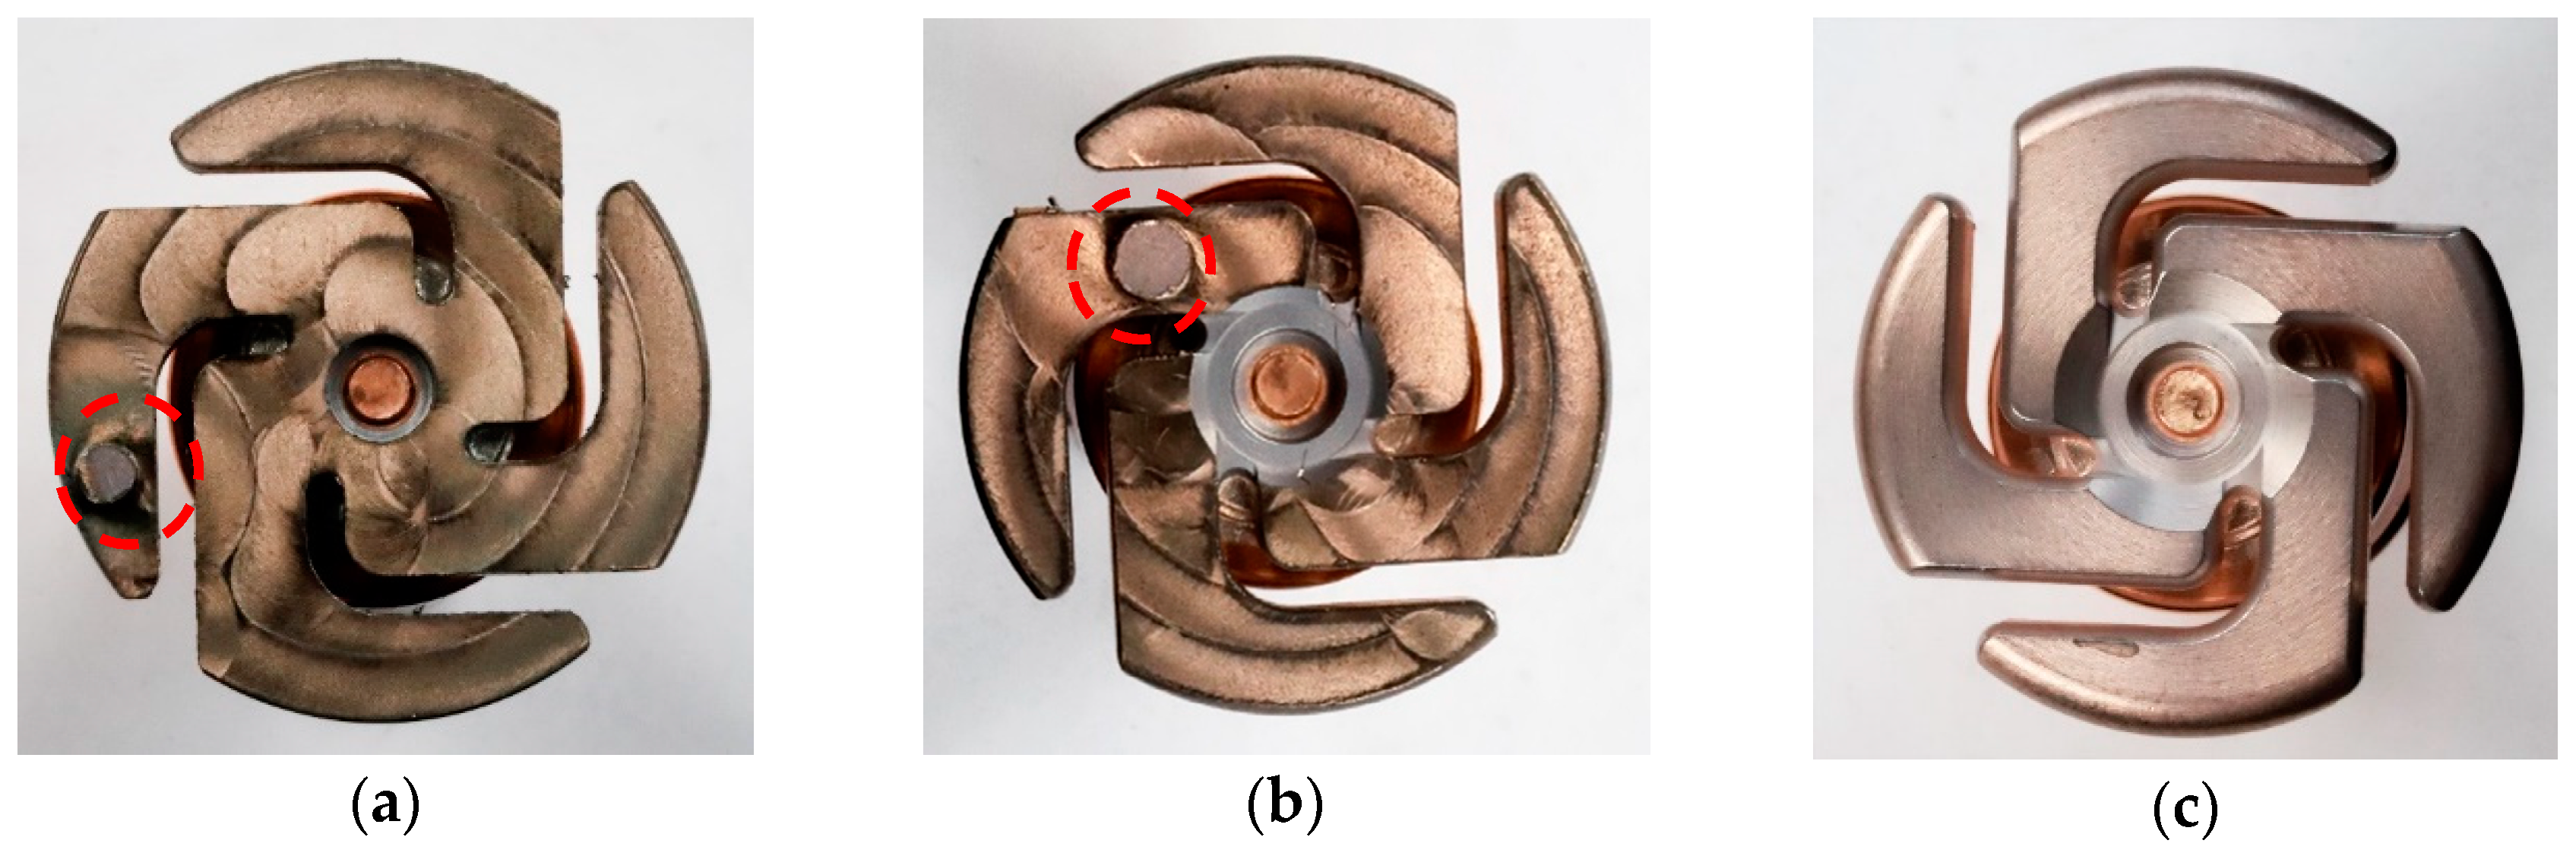
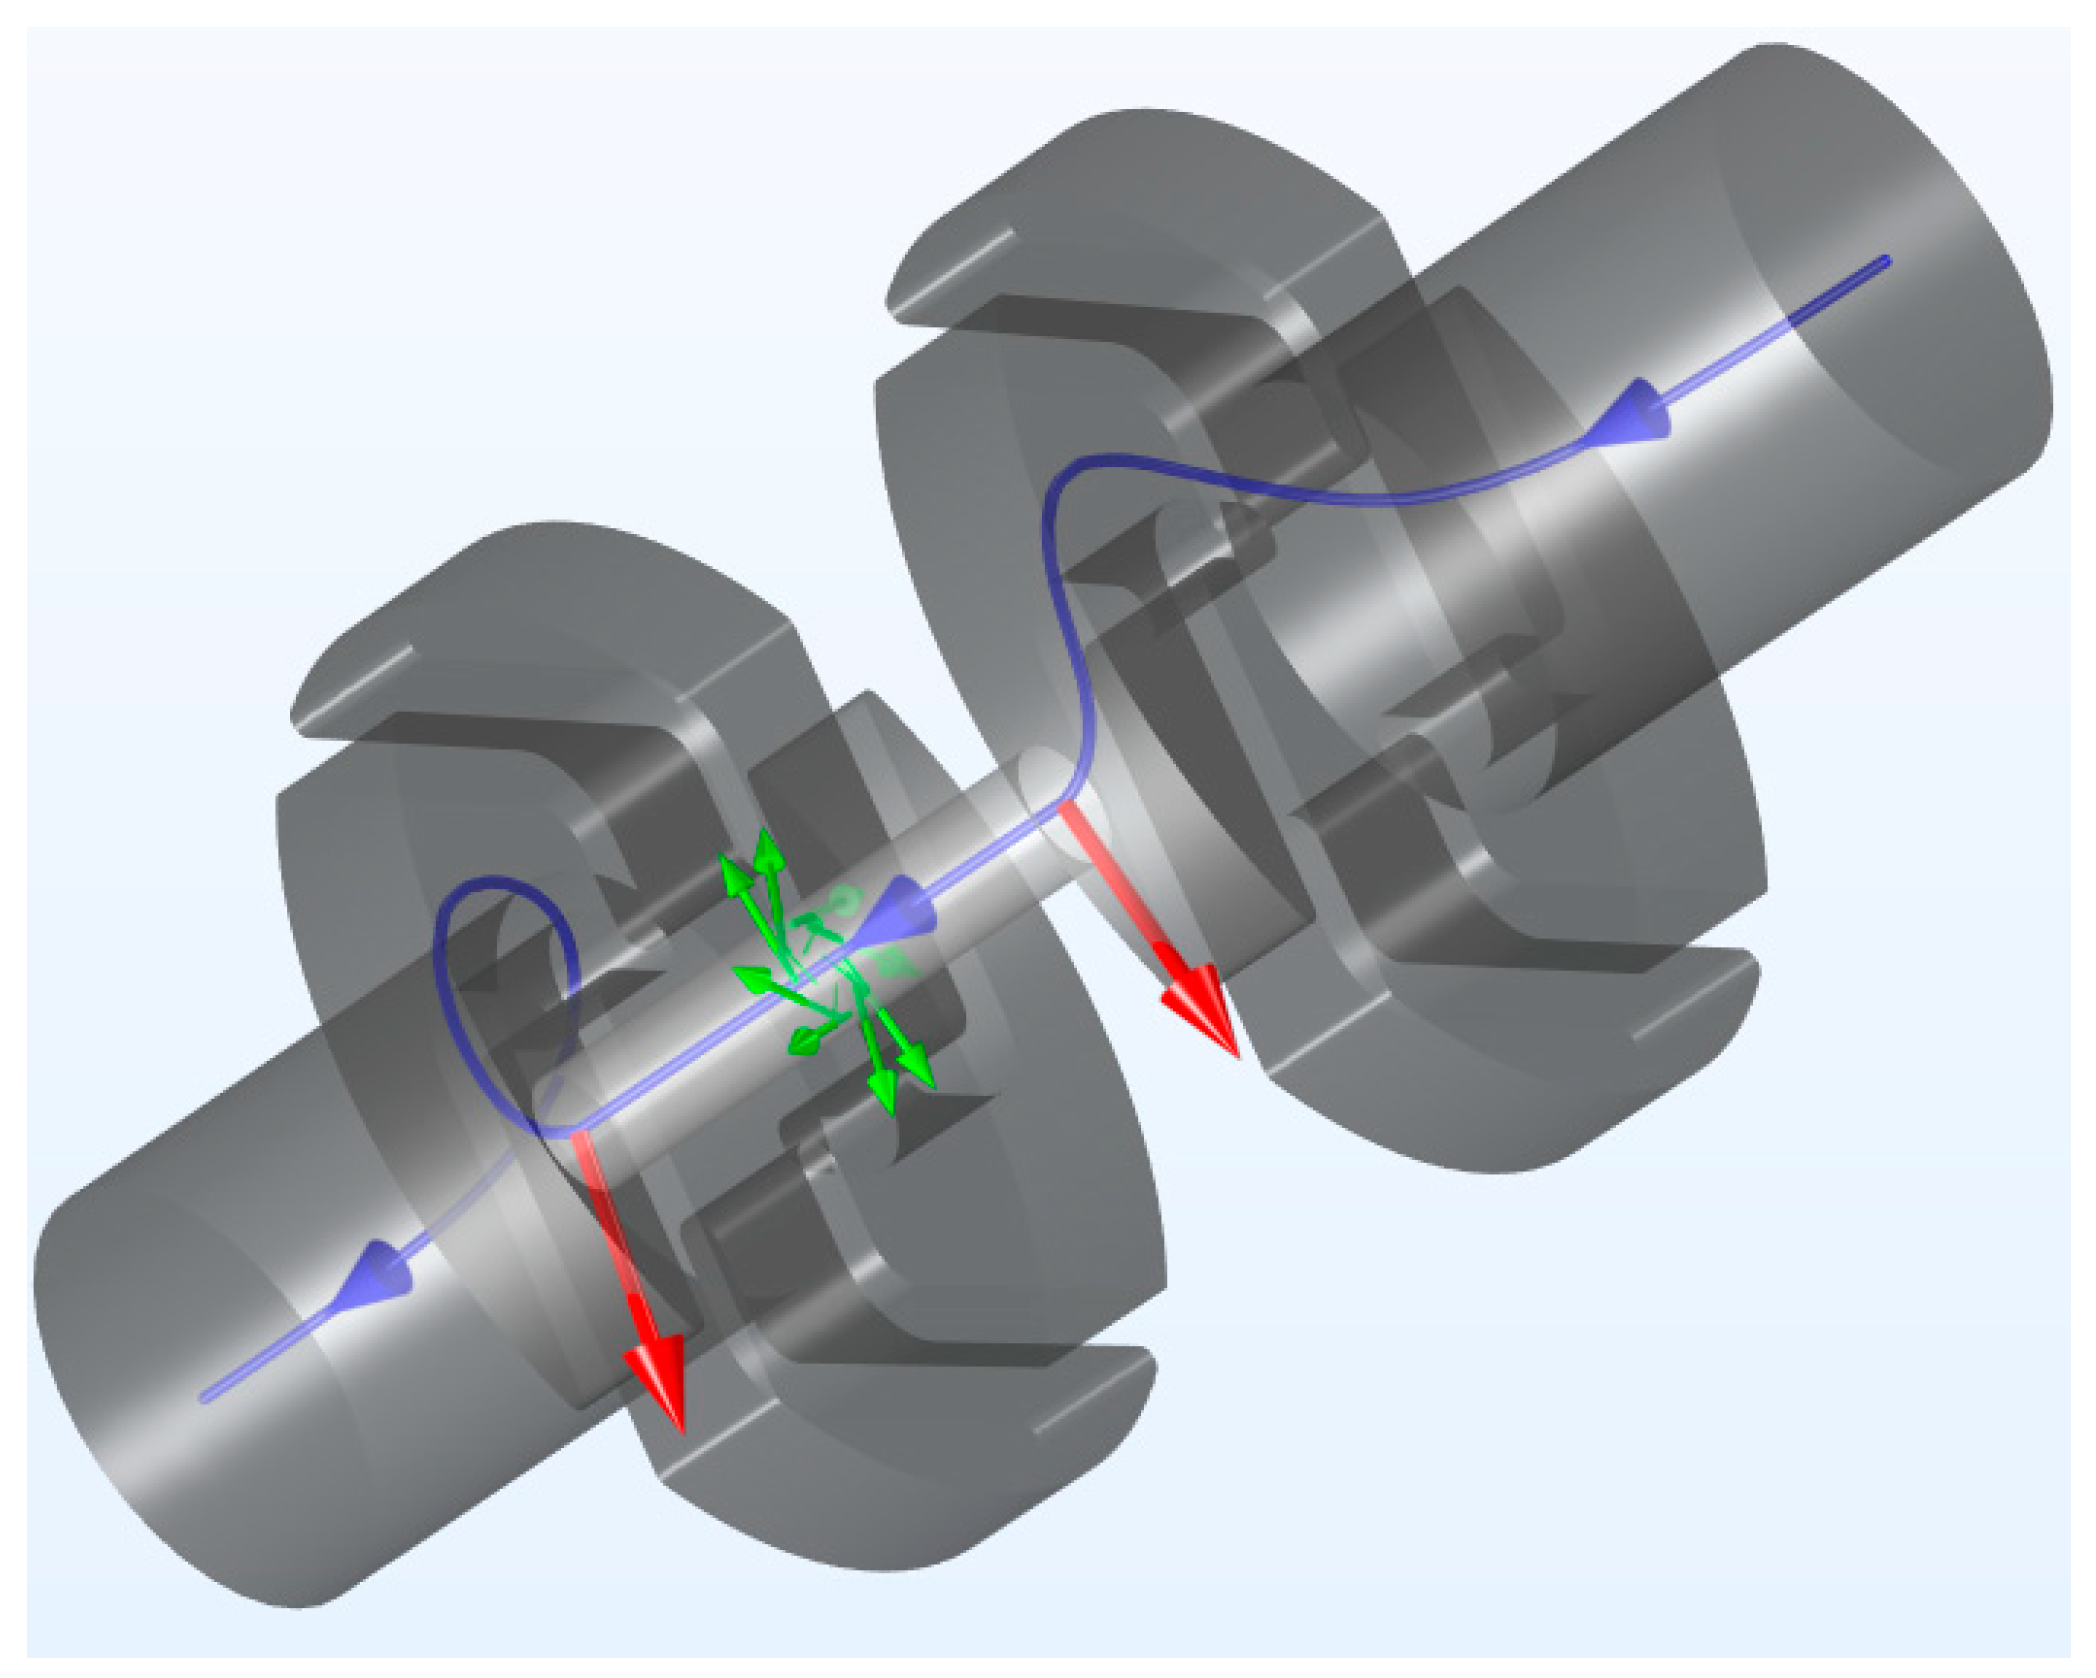
2.3. Electrodes
2.4. Diagnostics
2.4.1. Electrical Diagnostics
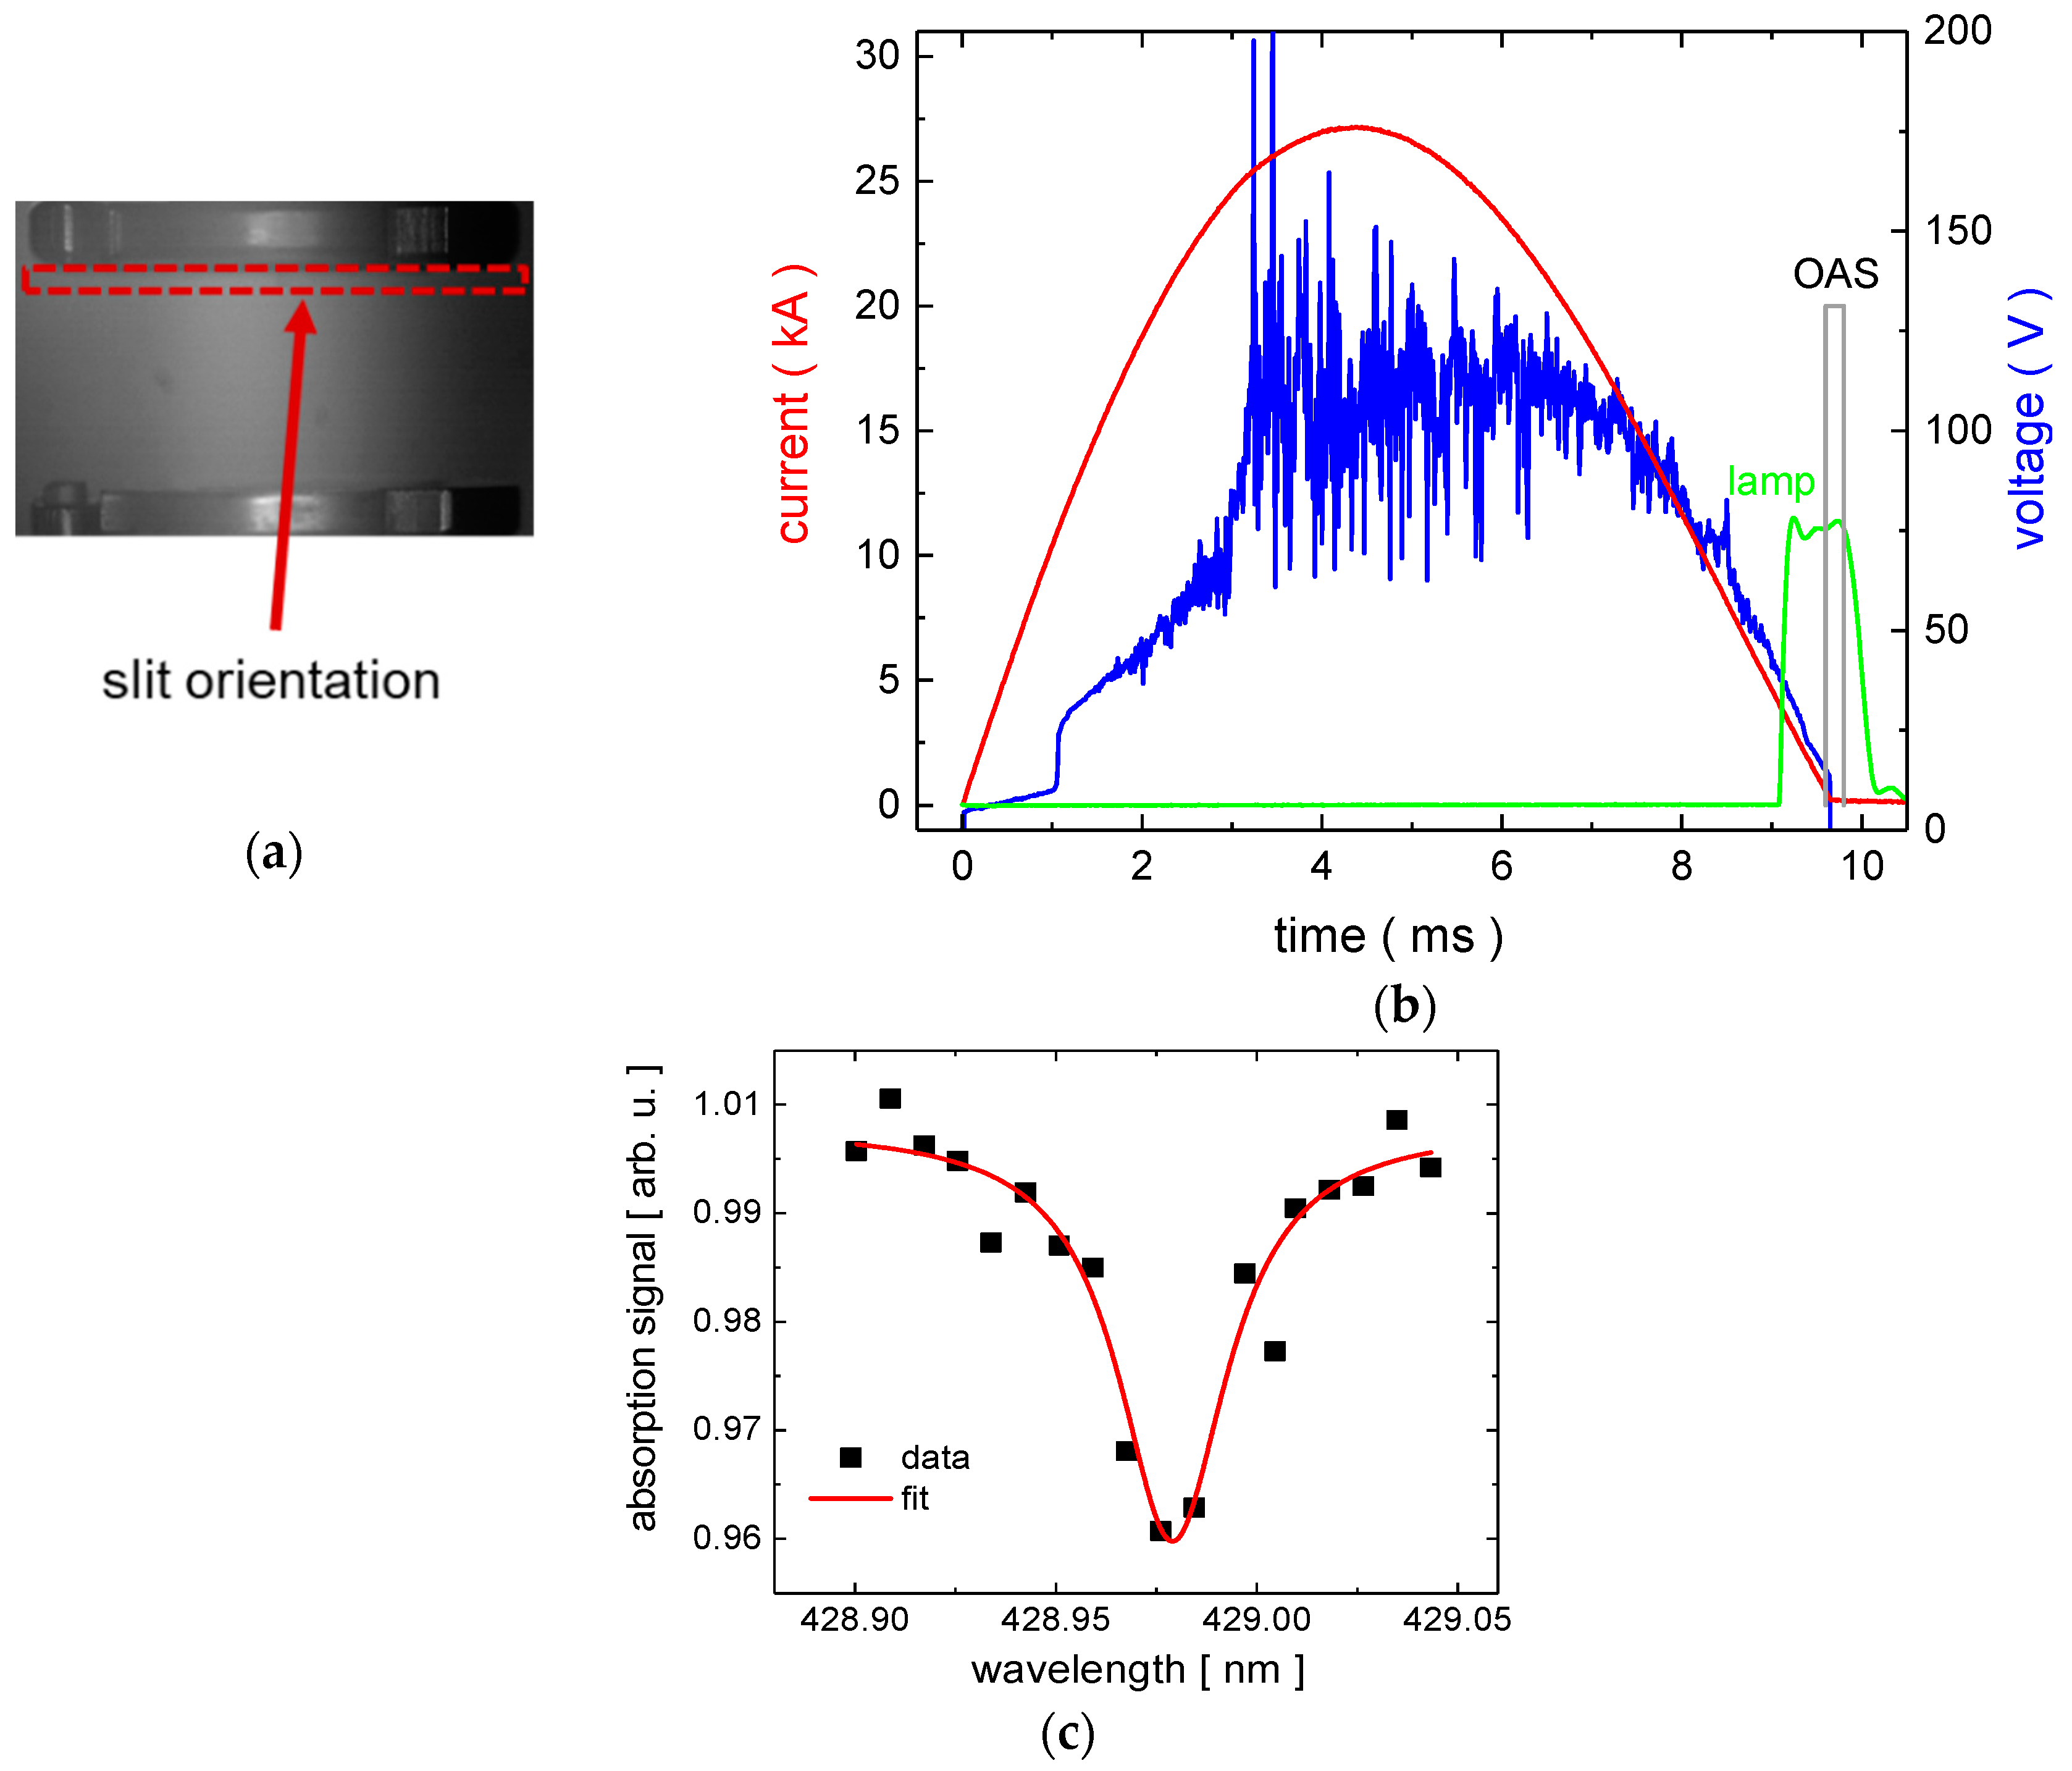
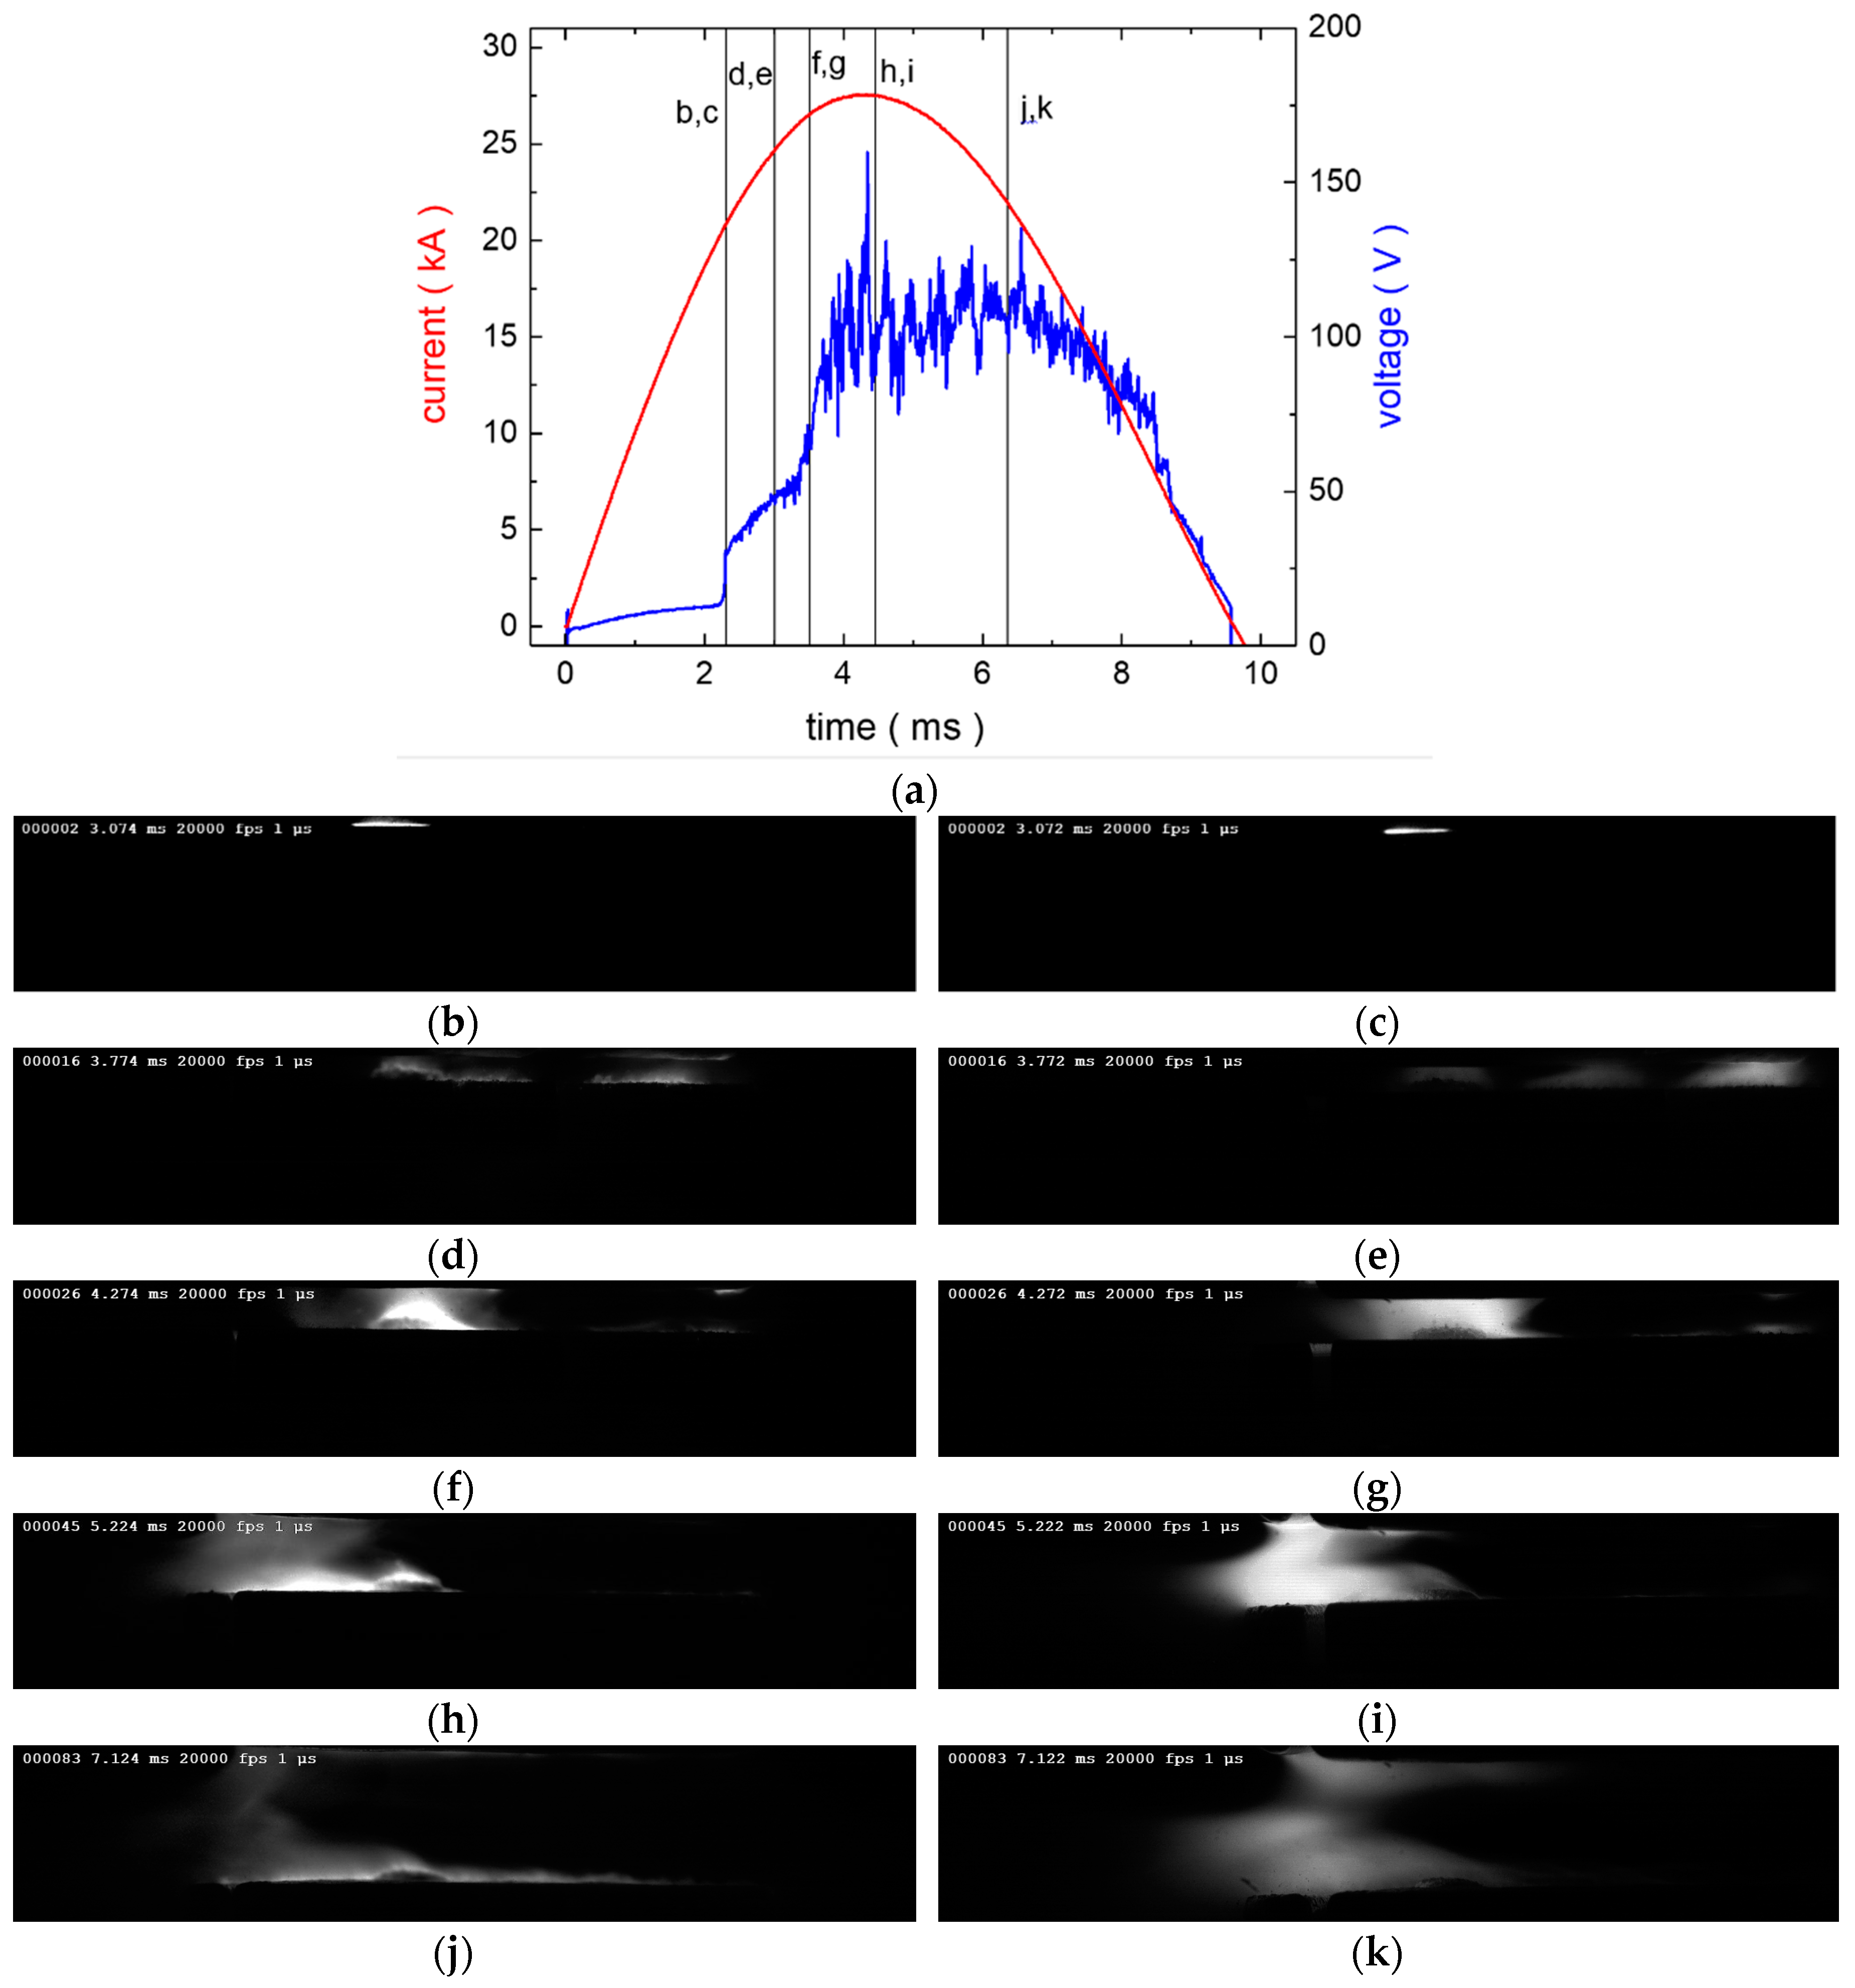
2.4.2. Arc Images
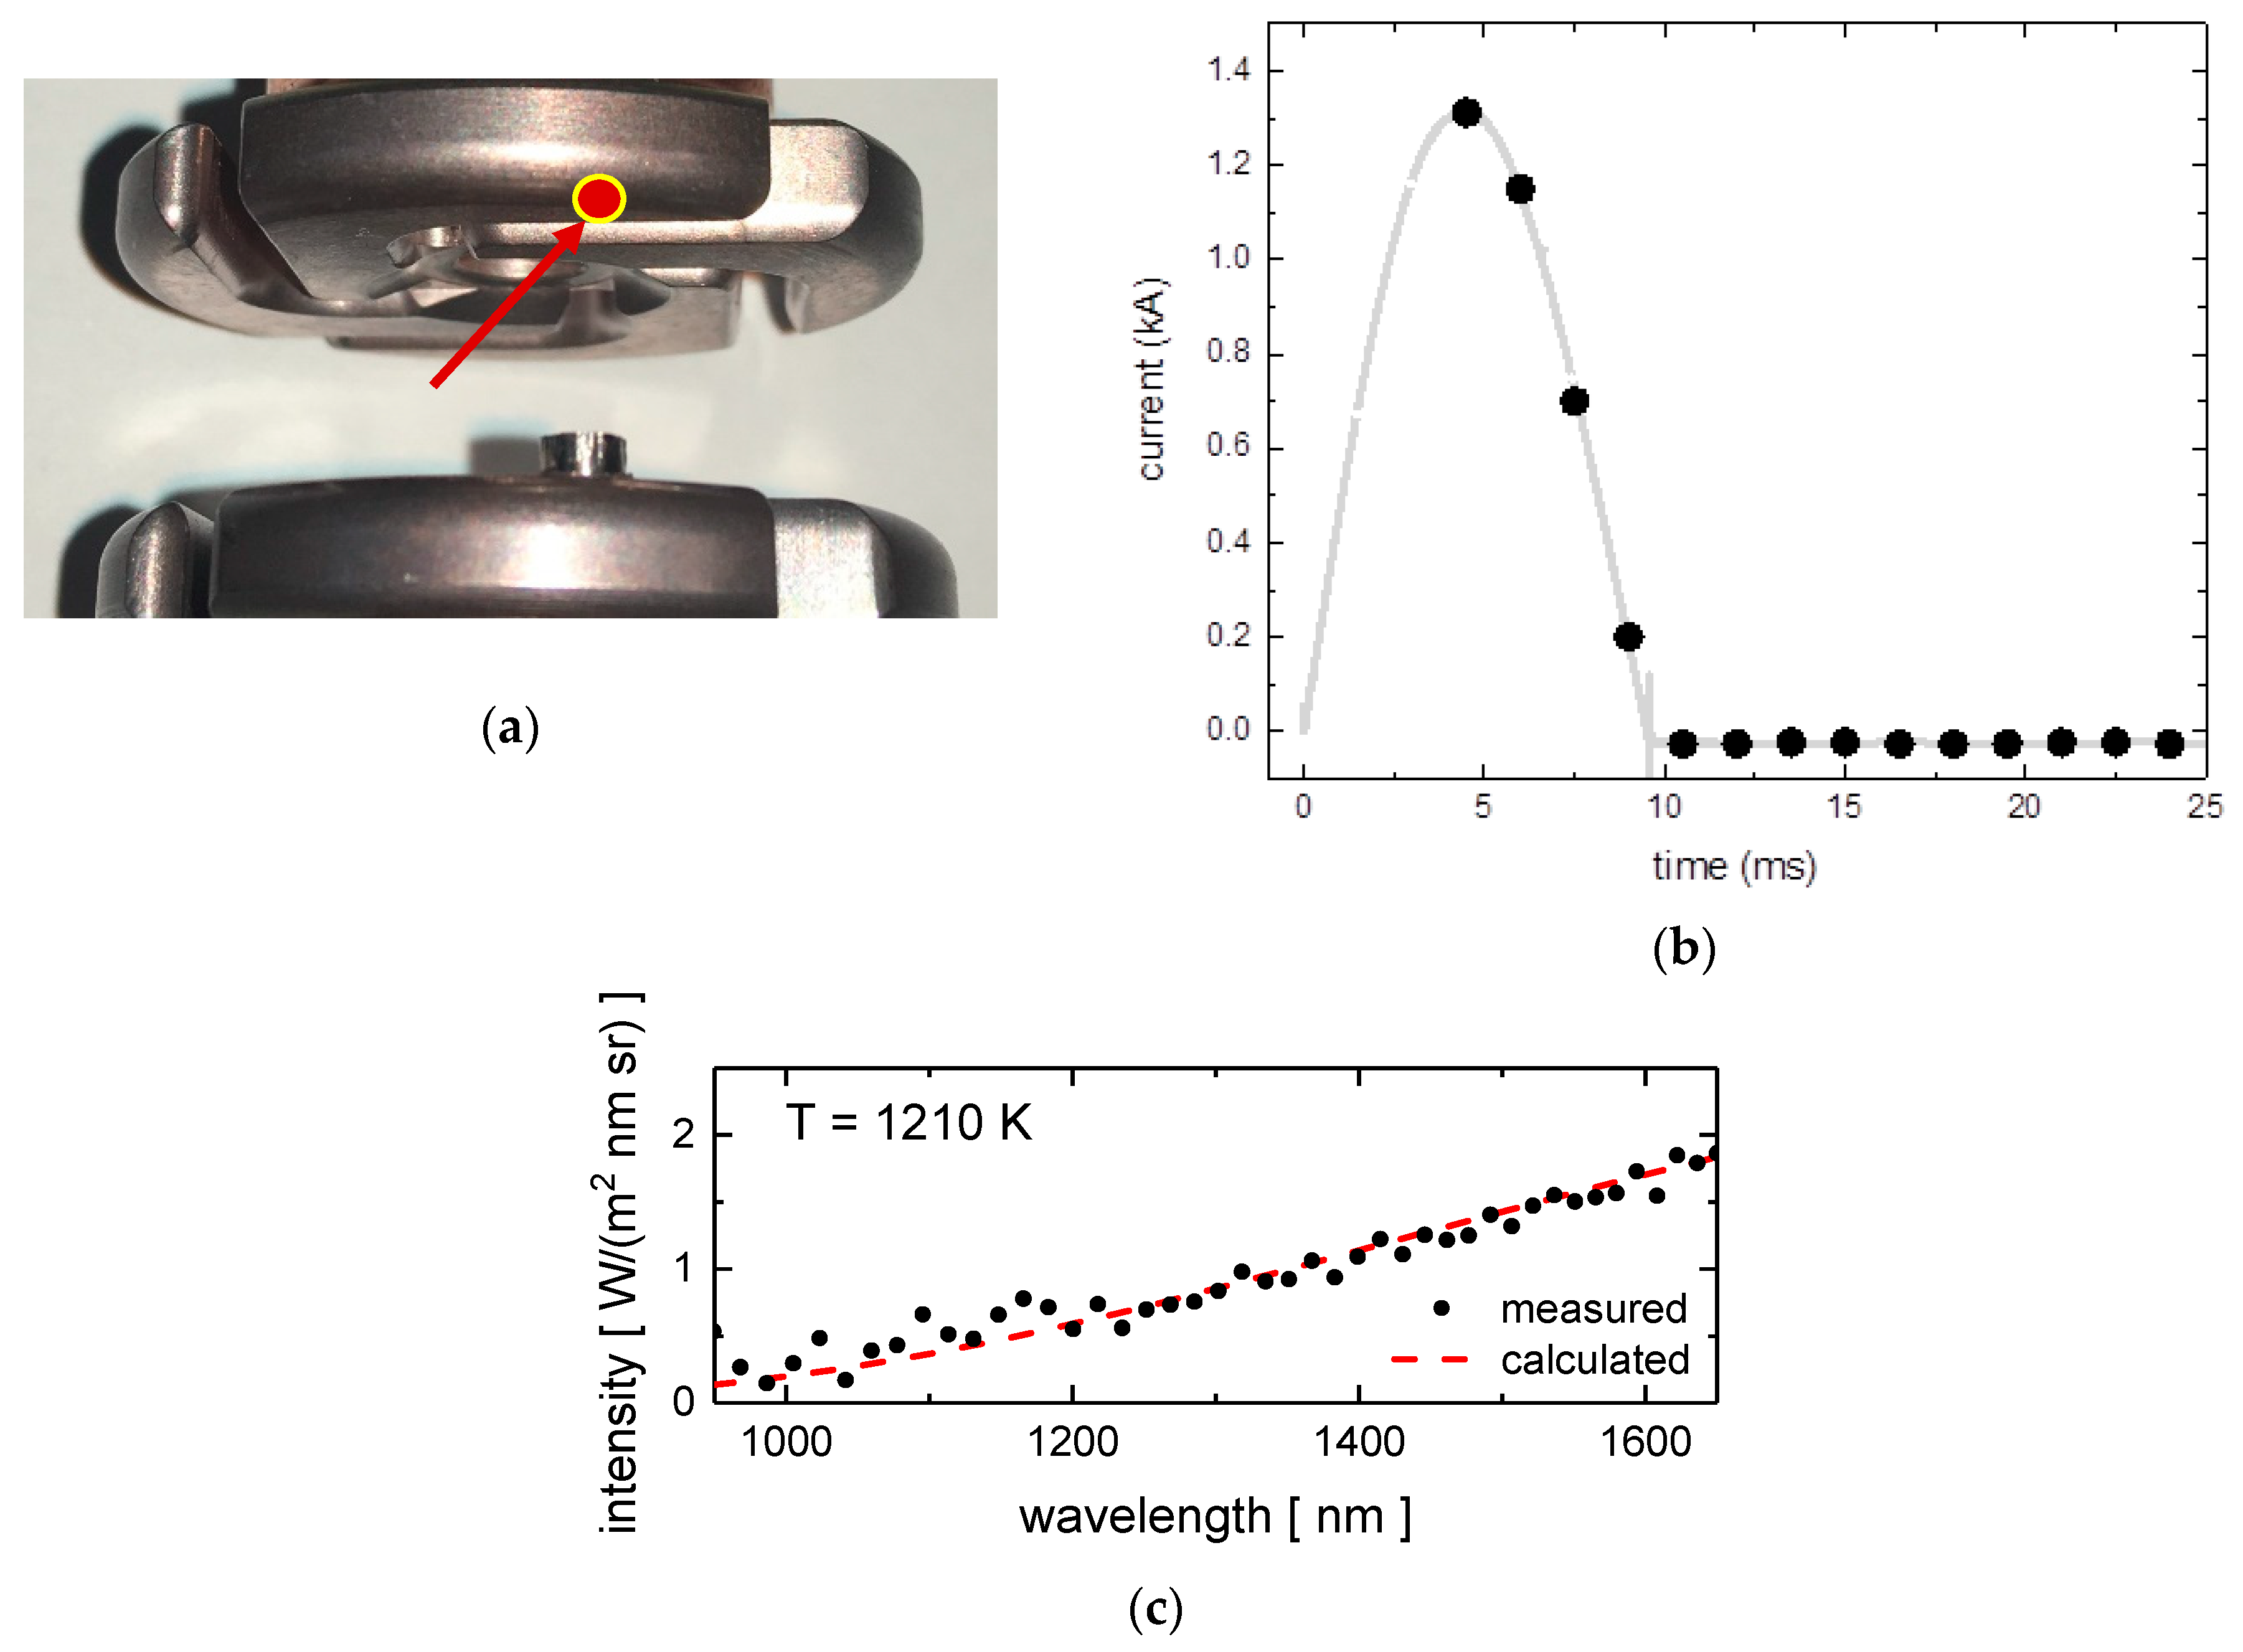
2.4.3. Determination of Surface Temperature
2.4.4. Absorption Spectroscopy for Species Density Determination
3. Results and Discussion
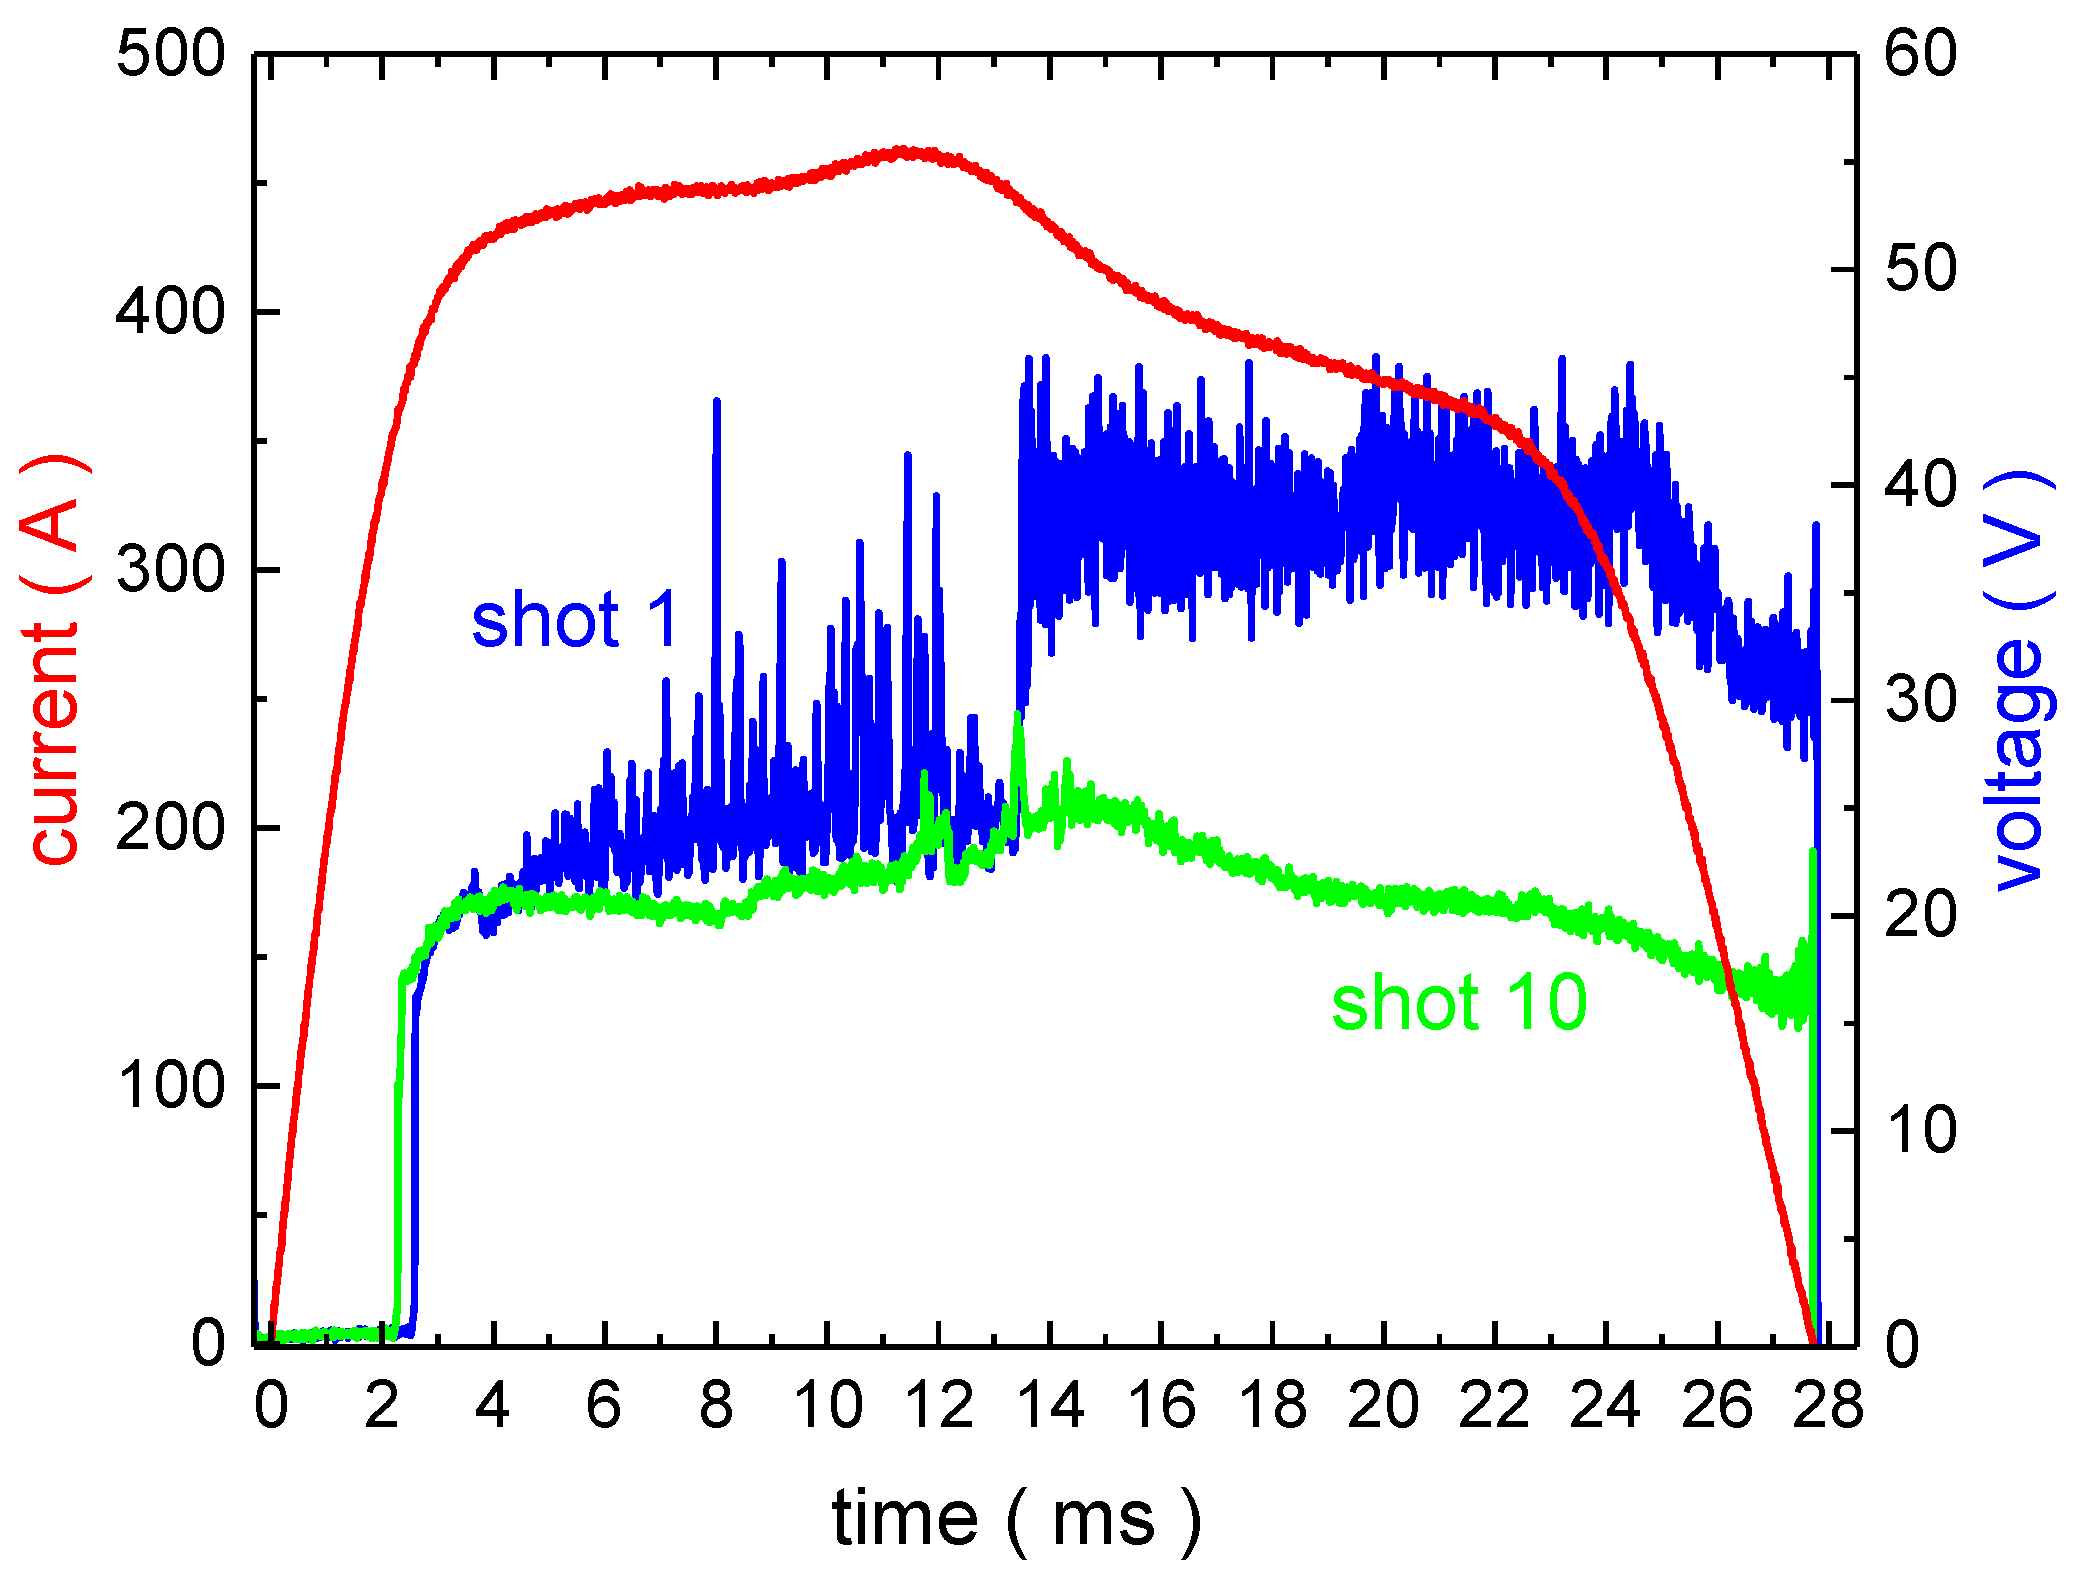
3.1. Electrode Preparation
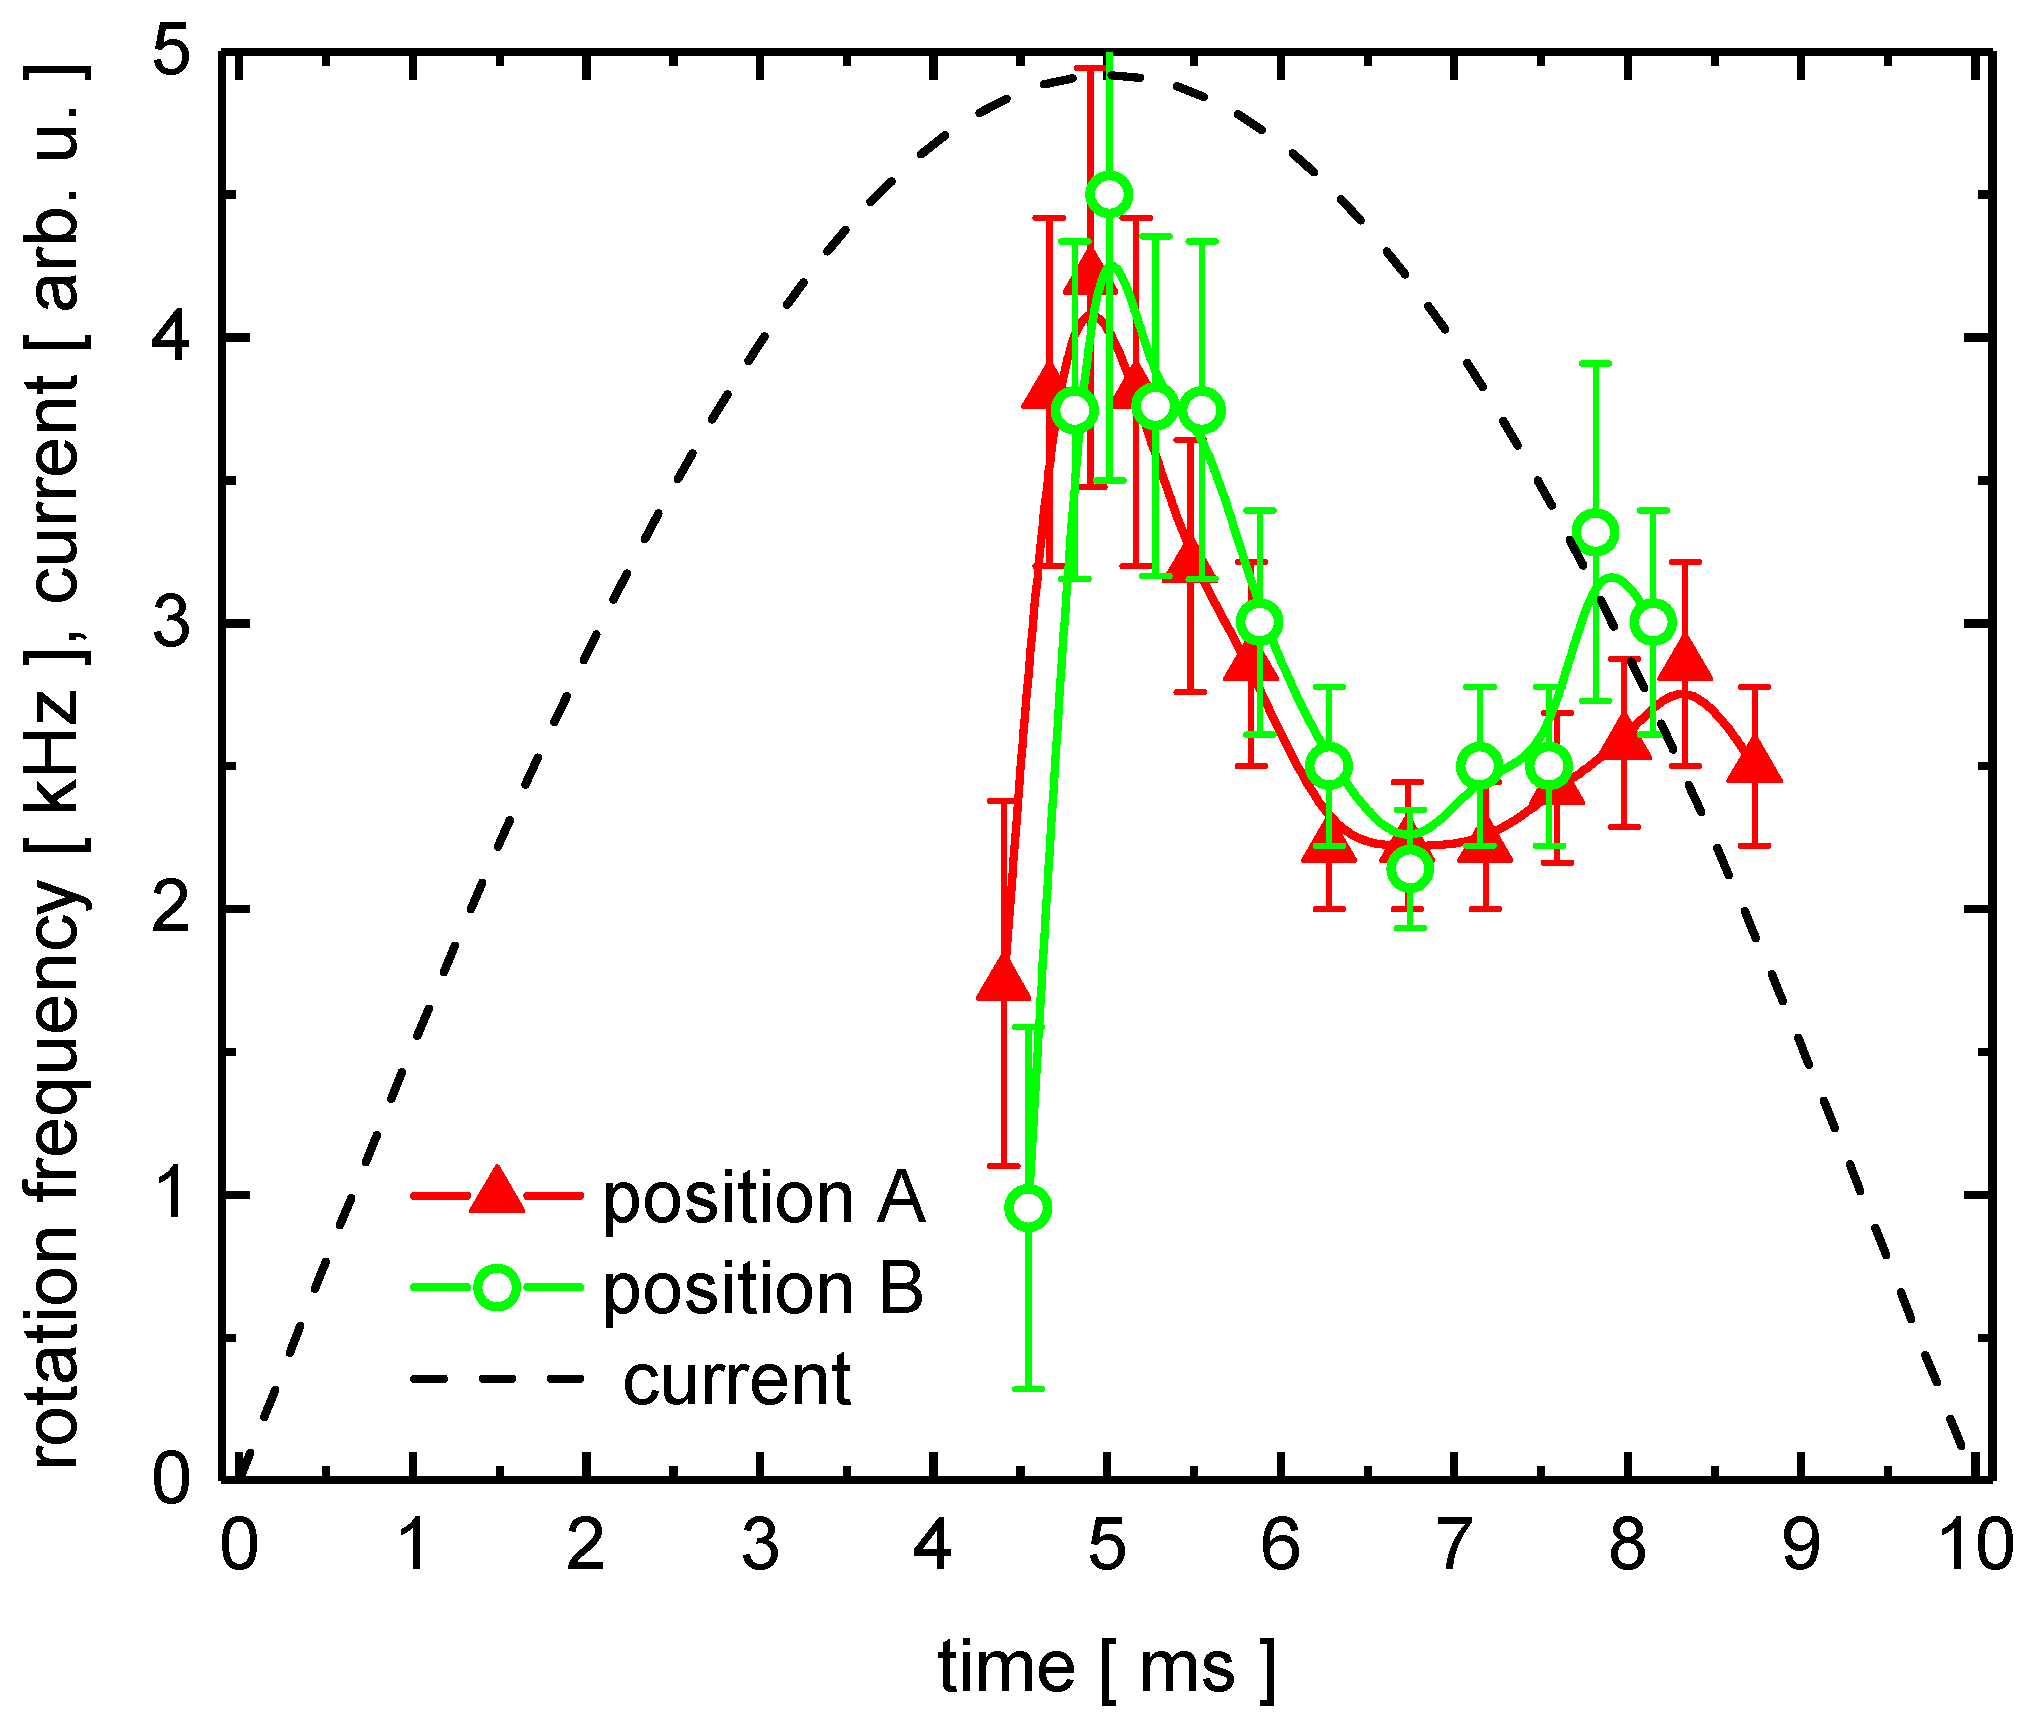
3.2. Arc Dynamics
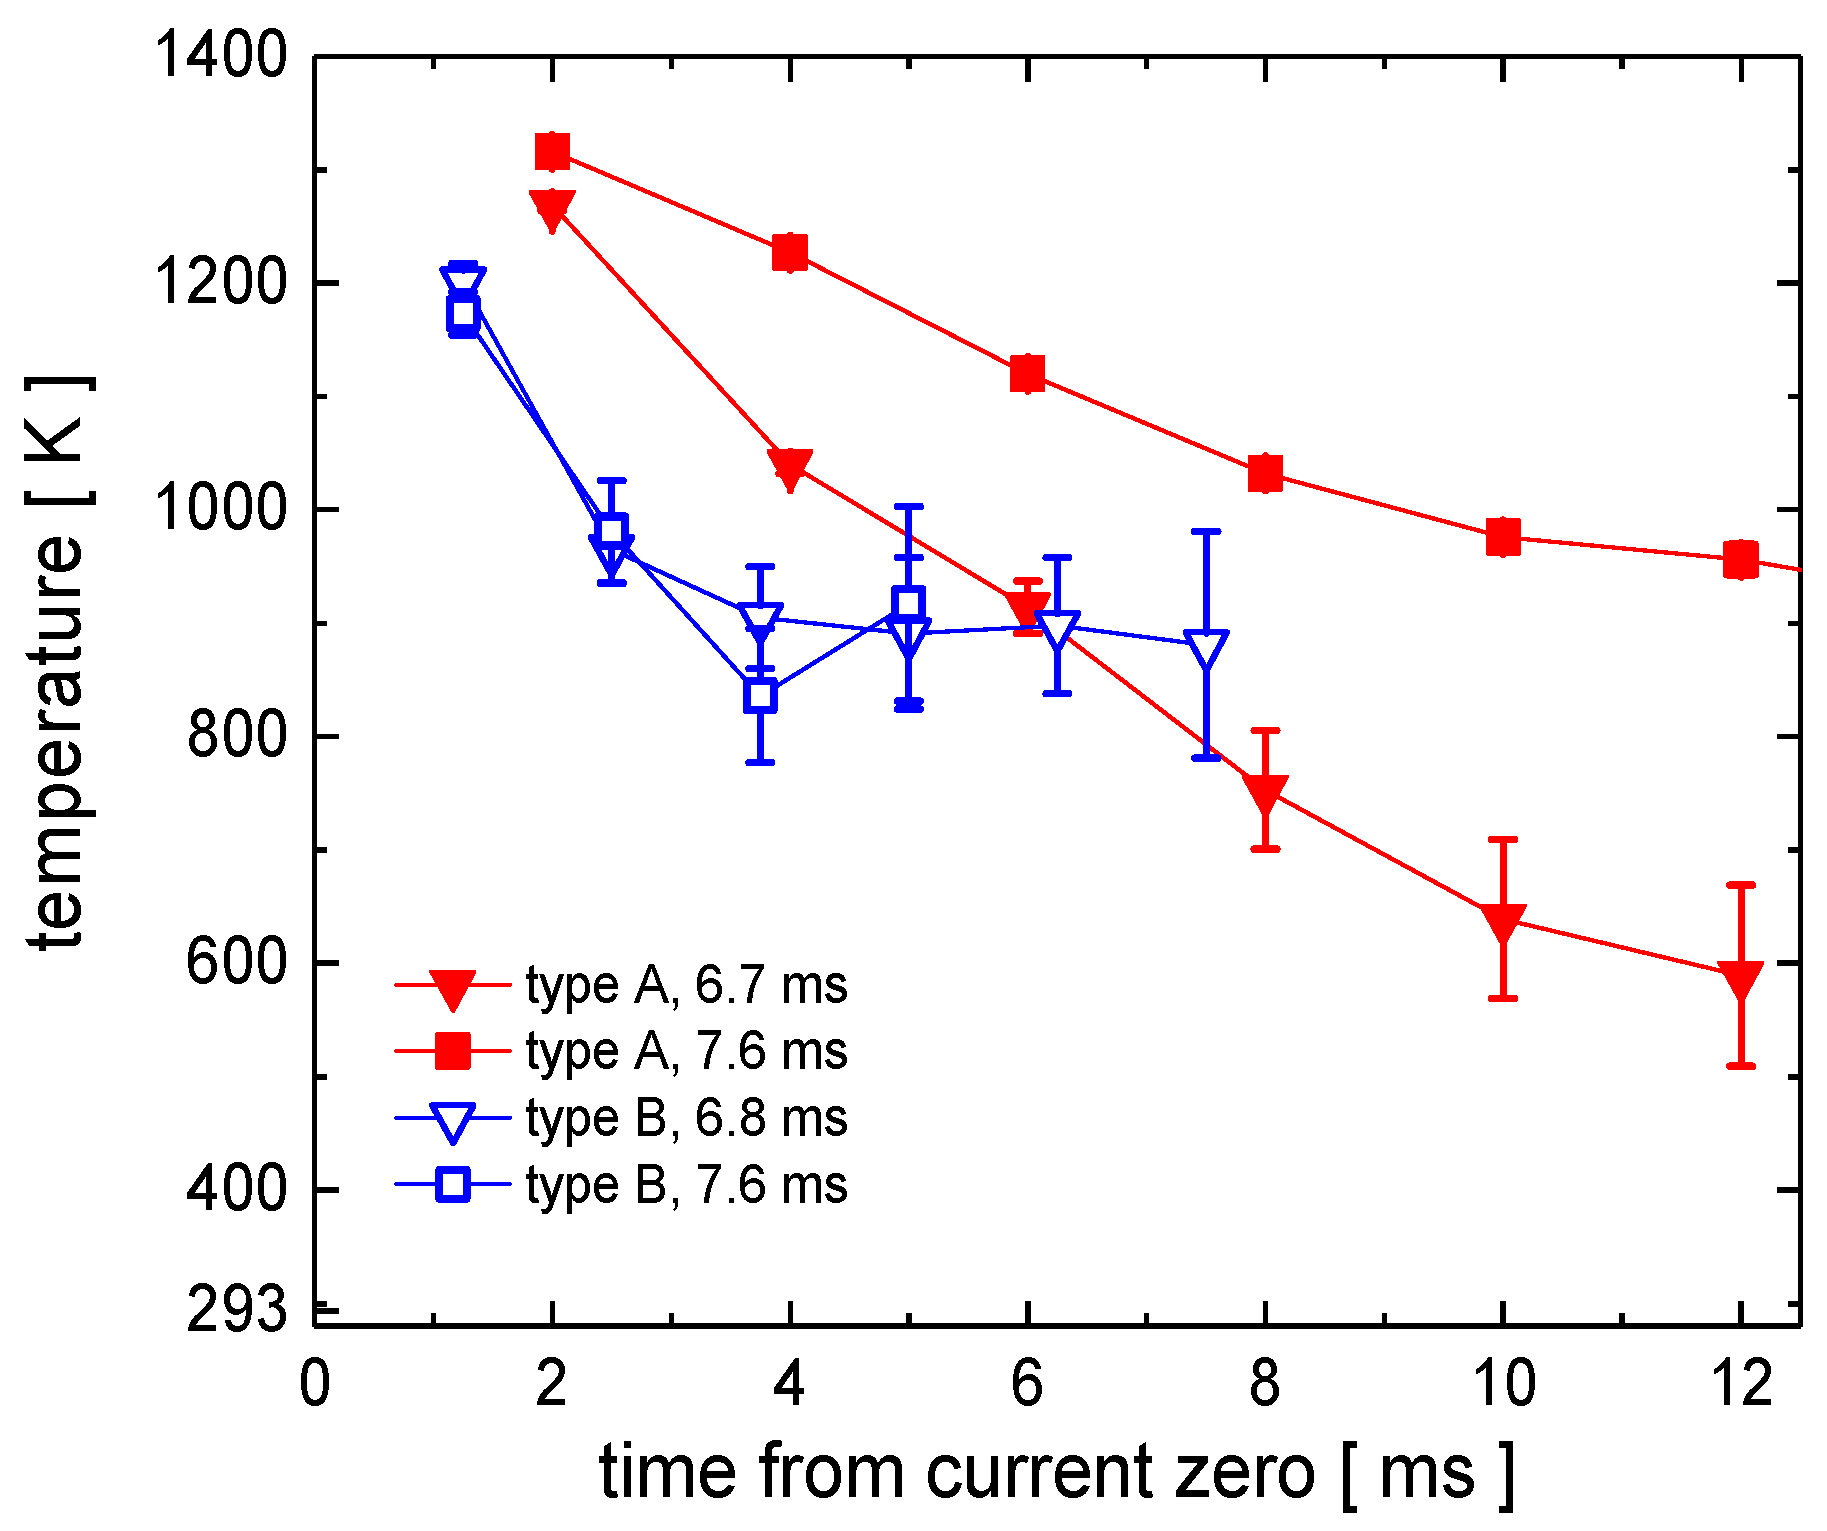
3.3. Anode Surface Temperature
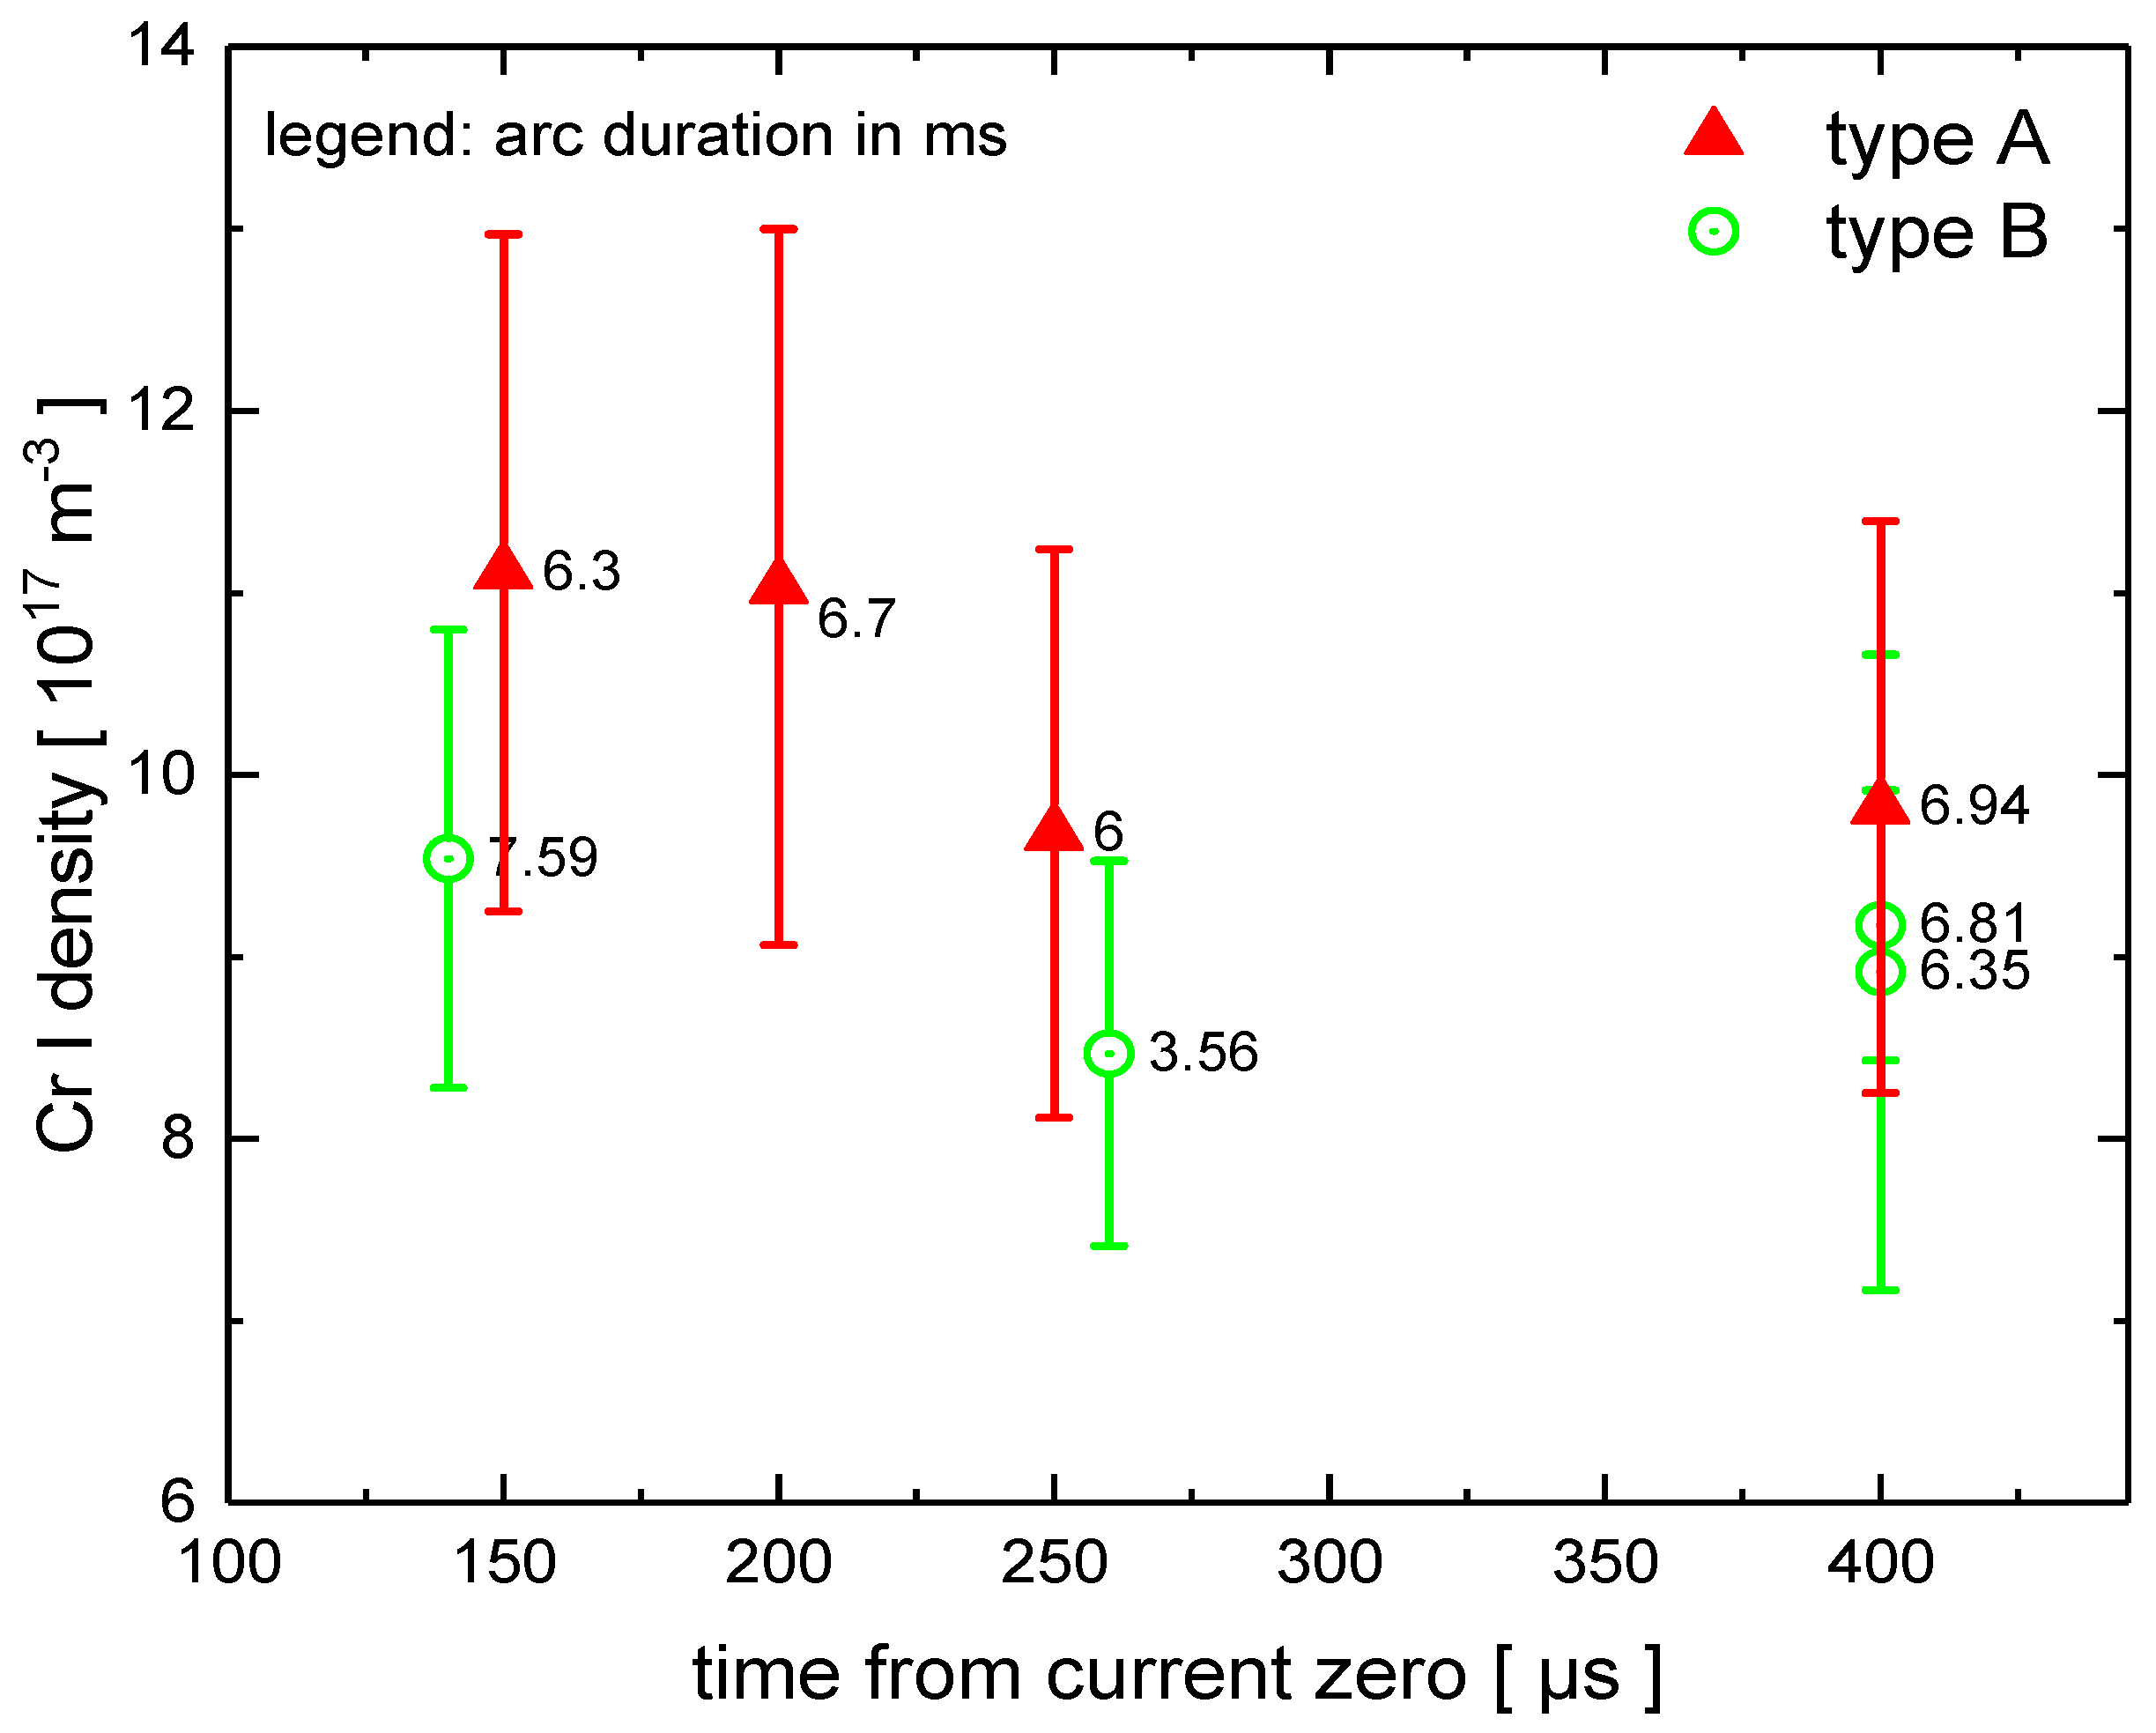
3.4. Cr Density after Current Interruption
4. Summary
Author Contributions
Funding
Conflicts of Interest
References
- Slade, P.G. The Vacuum Interrupter: Theory, Design, and Application; CRC Press: Boca Raton, FL, USA, 2008. [Google Scholar]
- Giere, S.; Hellig, D.; Koletzko, M.; Kosse, S.; Rettenmaier, T.; Stiehler, C.; Wenzel, N. Vacuum interrupter unit for CO2-neutral 170kV/50kA switchgear. In ETG-Fb. 157: VDE-Hochspannungstechnik 2018; 12.-14.11.2018; VDE Verlag GmbH: Berlin, Germany, 2018; pp. 28–31. [Google Scholar]
- Lippmann, H.J. Schalten im Vakuum, Physik und Technik der Vakuumschalter; VDE Verlag GmbH: Berlin, Germany, 2003. [Google Scholar]
- Schneider, H.N. Contact Structure for an Electric Circuit Interrupter. U.S. Patent 2,949,520, 19 August 1958. [Google Scholar]
- Lake, A.A.; Reece, M.P. Improvements Relating to Vacuum Switch Contact Assemblies. UK Patent 997,384, 7 July 1965. [Google Scholar]
- Hundstad, R.L. Contact Structures for Vacuum-Type Circuit Interrupters Having Cantilevered-Supported Annularly-Shaped Outer Arc-Running Contact Surfaces. U.S. Patent 3,845,262, 29 October 1974. [Google Scholar]
- Lamara, T.; Hencken, K.; Gentsch, D. A Novel Vacuum Interrupter Contact Design for Improved High Current Interruption Performance Based on a Double-TMF Arc Control System. IEEE Trans. Plasma Sci. 2015, 43, 1798–1805. [Google Scholar] [CrossRef]
- Dullni, E.; Schade, E. Investigation of high-current interruption of vacuum circuit breakers. IEEE Trans. Electr. Insul. 1993, 28, 607–620. [Google Scholar] [CrossRef]
- Miller, H.C. Anode modes in vacuum arcs: Update. IEEE Trans. Plasma Sci. 2017, 45, 2366–2374. [Google Scholar] [CrossRef]
- Schulman, M.B.; Schellekens, H. Visualization and characterization of high-current diffuse vacuum arcs on axial magnetic field contacts. IEEE Trans. Plasma Sci. 2000, 28, 443–451. [Google Scholar] [CrossRef]
- Shang, W.; Dullni, E.; Fink, H.; Kleberg, I.; Schade, E.; Shmelev, D.L. Optical investigations of dynamic vacuum arc mode changes with different axial magnetic field contacts. IEEE Trans. Plasma Sci. 2003, 31, 923–928. [Google Scholar] [CrossRef]
- Gentsch, D.; Shang, W. High-speed observations of arc modes and material erosion on RMF- and AMF-contact electrodes. IEEE Trans. Plasma Sci. 2005, 33, 1605–1610. [Google Scholar] [CrossRef]
- Wolf, C.; Kurrat, M.; Lindmayer, M.; Wilkening, E.-D.; Gentsch, D. Optical investigations of high-current vacuum arc behavior on spiral-shaped and cup-shaped RMF-contacts. In Proceedings of the 55th IEEE Holm Conference on Electrical Contacts, Vancouver, BC, Canada, 14–16 September 2009; pp. 270–275. [Google Scholar]
- Methling, R.; Franke, S.; Gortschakow, S.; Abplanalb, M.; Sütterlin, R.-P.; Delachaux, T.; Menzel, K.O. Anode surface temperature determination in high current vacuum arcs by different methods. IEEE Trans. Plasma Sci. 2017, 45, 2099–2107. [Google Scholar] [CrossRef]
- Chaly, A.M.; Poluyanova, I.N.; Yakovlev, V.V.; Zabello, K.K.; Logatchev, A.A.; Shkol′nik, S.M. Experimental study of anode surface temperature after current zero for a range of current levels. In Proceedings of the 27th International Symposium on Discharges and Electrical Insulation in Vacuum (ISDEIV), Suzhou, China, 18–23 September 2016; pp. 1–4. [Google Scholar] [CrossRef]
- Logachev, A.A.; Poluyanova, I.N.; Zabello, K.K.; Begal, D.I.; Shkol’nik, S.M. Analysis of cathode surface state and cathode temperature distribution after current zero of AMF-contacts. In Proceedings of the 28th International Symposium on Discharges and Electrical Insulation in Vacuum (ISDEIV), Greifswald, Germany, 23–28 September 2018; pp. 329–332. [Google Scholar]
- Gortschakow, S.; Popov, S.; Khakpour, A.; Schneider, A.; Methling, R.; Franke, S.; Uhrlandt, D. Cu and Cr density determination during high-current discharge modes in vacuum arcs. In Proceedings of the 28th International Symposium on Discharges and Electrical Insulation in Vacuum(ISDEIV), Greifswald, Germany, 23–28 September 2018; pp. 181–184. [Google Scholar]
- Horvath, B.; Lamara, T. Time-resolved optical resonant absorption spectroscopy of Cr metallic vapor in air using a broadband LED light source. Plasma Sources Sci. Technol. 2013, 22, 035006. [Google Scholar] [CrossRef]
- Wang, H.; Wang, Z.; Liu, U.J.; Zhou, Z.; Wang, J.; Geng, Y.; Liu, Z. Optical absorption spectroscopy of metallic (Cr) vapor in a vacuum arc. J. Phys. D Appl. Phys. 2018, 51, 035203. [Google Scholar] [CrossRef]
- Khakpour, A.; Popov, S.; Franke, S.; Kozakov, R.; Methling, R.; Uhrlandt, D.; Gortschakow, S. Determination of Cr density after current zero in a high-current vacuum arc considering anode plume. IEEE Trans. Plasma Sci. 2017, 45, 2108–2114. [Google Scholar] [CrossRef]
- Gortschakow, S.; Khakpour, A.; Popov, S.; Franke, S.; Methling, R.; Uhrlandt, D. Determination of Cr density in a high-current vacuum arc considering anode activity. Plasma Phys. Technol. 2017, 4, 190–193. [Google Scholar] [CrossRef]
- Methling, R.; Gorchakov, S.; Lisnyak, M.V.; Franke, S.; Khakpour, A.; Popov, S.; Batrakov, A.; Uhrlandt, D.; Weltmann, K.-D. Spectroscopic investigation of high-current vacuum arcs. In Proceedings of the 26th 2014 International Symposium on Discharges and Electrical Insulation in Vacuum (ISDEIV), Mumbai, India, 28 September–3 October 2014; pp. 221–224. [Google Scholar]
- Günther, K.; Radtke, R. A proposed radiation standard for the visible and UV region. J. Phys. E 1975, 8, 371–376. [Google Scholar] [CrossRef]
- Boxman, R.L.; Martin, P.J.; Sanders, D.M. Handbook of Vacuum Arc Science and Technology; Noyes: Hammonton, NJ, USA, 1995. [Google Scholar]


Publisher’s Note: MDPI stays neutral with regard to jurisdictional claims in published maps and institutional affiliations. |
© 2020 by the authors. Licensee MDPI, Basel, Switzerland. This article is an open access article distributed under the terms and conditions of the Creative Commons Attribution (CC BY) license (http://creativecommons.org/licenses/by/4.0/).
Share and Cite
Gortschakow, S.; Franke, S.; Methling, R.; Gonzalez, D.; Lawall, A.; Taylor, E.D.; Graskowski, F. Properties of Vacuum Arcs Generated by Switching RMF Contacts at Different Ignition Positions. Energies 2020, 13, 5596. https://0-doi-org.brum.beds.ac.uk/10.3390/en13215596
Gortschakow S, Franke S, Methling R, Gonzalez D, Lawall A, Taylor ED, Graskowski F. Properties of Vacuum Arcs Generated by Switching RMF Contacts at Different Ignition Positions. Energies. 2020; 13(21):5596. https://0-doi-org.brum.beds.ac.uk/10.3390/en13215596
Chicago/Turabian StyleGortschakow, Sergey, Steffen Franke, Ralf Methling, Diego Gonzalez, Andreas Lawall, Erik D. Taylor, and Frank Graskowski. 2020. "Properties of Vacuum Arcs Generated by Switching RMF Contacts at Different Ignition Positions" Energies 13, no. 21: 5596. https://0-doi-org.brum.beds.ac.uk/10.3390/en13215596