A Holistic Approach to Electric Shared Mobility Systems Development—Modelling and Optimization Aspects


1
Department of Automotive Vehicle Construction, Faculty of Transport and Aviation Engineering, Silesian University of Technology, 8 Krasińskiego Street, 40-019 Katowice, Poland
2
Department of Automotive Vehicle Maintenance, Faculty of Transport and Aviation Engineering, Silesian University of Technology, 8 Krasińskiego Street, 40-019 Katowice, Poland
3
Sino-US Global Logistics Institute, Shanghai Jiao Tong University, Shanghai 200240, China
4
School of Transportation, Lanzhou Jiaotong University, 88 West Anning Road, Lanzhou 730070, China
*
Author to whom correspondence should be addressed.
Energies 2020, 13(21), 5810; https://0-doi-org.brum.beds.ac.uk/10.3390/en13215810
Submission received: 13 September 2020
/
Revised: 24 October 2020
/
Accepted: 4 November 2020
/
Published: 6 November 2020
(This article belongs to the Collection Invited Papers on Electric Vehicles)
Abstract
:Due to the development of the shared economy, increasingly more shared mobility providers have launched services based on the use of electric vehicles. The increasing growth of electric shared mobility services has produced various types of problems that do not occur (or occur with a limited effect) under conventional shared mobility systems. This increase in electric shared mobility problems has led to many effects, including limitations of the system zones or going out of business. To avoid difficulties in the functioning of electric shared mobility systems, various scientific studies have been undertaken to model and optimize the operation of these systems. Modeling and optimization mainly relate to one category of the system—for example, only to bike sharing. However, to understand the system of electric shared mobility holistically, there is a need to define the criteria generally as stimulants or destimulants. Based on these assumptions, we conducted research on the identification of factors influencing the development of electric shared mobility services. We conducted our own expert research based on the Social Network Analysis method. The aim of this study was to determine the factors that influence the development or recession of services in the entire electric shared mobility market in reference to selected stakeholders. The obtained results indicate a non-standard approach to the modeling and optimization of electric shared mobility services. This study could be used as support for creating electric shared mobility models and could also be helpful for service providers or local mobility managers through the developed recommendations.
1. Introduction
Electromobility is one of the prominent world trends related to the phenomenon of sustainable transportation [1]. Since electromobility at its current stage of development is a very costly solution for common citizens, the way to implement it alongside the assumptions of sustainable transport development policy is through the use of electric vehicles in shared mobility systems [2,3,4].
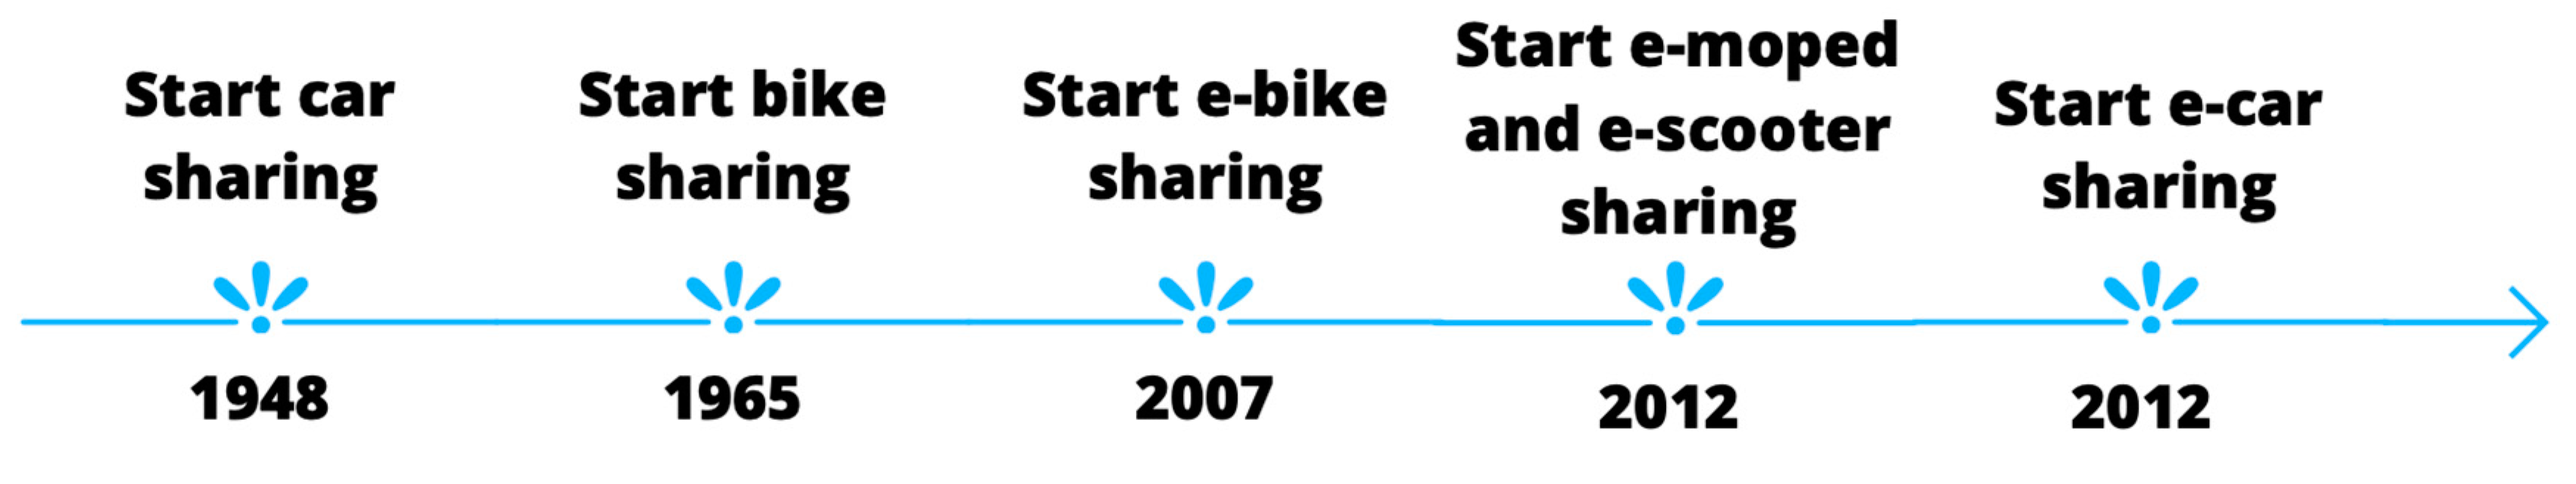
The direction of action towards electromobility can be observed in the changes that have occurred on the market of shared mobility services in recent years. First, changes have been made to bike-sharing and car-sharing fleets by supplementing them with electric vehicles [5,6]. Electric scooter sharing systems and e-mopeds were then successively introduced to the market [7]. The shared mobility timeline, taking into account the breakthrough points related to the inauguration of electrical systems, is presented in Figure 1.
The inclusion of electric vehicles into the fleet of shared mobility services involves taking into account elements such as [5,6,7,8,9,10,11,12]:
- An appropriate number of vehicles in the fleet;
- Ensuring appropriate diversification of the fleet;
- Planning the vehicle charging system (personally by users or via the operator’s employees);
- Providing one’s own charging stations or access to charging stations;
- Solving parking problems via the provision of dedicated spaces, free spaces, or mobility hubs in cooperation with cities.
Despite taking some of the above-mentioned actions, some business practices have indicated various types of problems to occur in electric shared mobility systems. These kinds of problems have appeared at the stage of both system planning and operation. For example, the operator Vozilla, a municipal electric car rental company that operated in Wrocław, Poland starting in 2018, ceased its activities after two years [13]. Despite the great interest in this system (over 60,000 people registered in the system during its operation, and the fleet of 240 cars was used nearly 600 thousand times), it was forced to stop functioning. As reasons for the need to shut down its system, the company indicated, for example [13]:
- Rising electricity prices;
- Too little relief for electric vehicles;
- Too little aid from the government;
- Too slow a development of infrastructure for vehicle charging.
Another famous example of electric car-sharing systems shutting down was the case of the French Autolib system [14]. This system operated in Paris starting in 2011 and was equipped with 4000 battery-powered cars stationed at over 1100 self-service docking stations [14]. Autolib’s functioning was planned up to 2023, and its evaluation system was one of the best developed in Europe. Unexpectedly, the system ceased to function in 2018 [14]. Interestingly, economic issues were not the main reason for ceasing its operations. The detailed reasons for shutting down the system were as follows [14,15,16]:
- The changing mobility behavior of Parisians;
- The poor technical condition of vehicles in terms of their servicing;
- The poor condition of vehicles in terms of the cleanliness of the vehicle both inside and outside;
- No control of items left in vehicles (users reported that the vehicles contained food residues, rubbish, or even drugs);
- A lack of vehicle security checks (break-ins and homeless people staying overnight in the vehicles).
Problems with functioning in the world markets do not only apply to electric car-sharing. For example, the electric scooter-sharing operator Bird + Circ was forced to end its systems in the Middle East (Bahrain, UAE, and Qatar) [17]. The given reason was a failure to meet the relevant technical standards for electric scooters [17]. It was determined that the vehicles were too often exploited and that their further use would be dangerous and unsafe for users [16]. The reliability of the vehicles was, therefore, very limited. The scooters were not only unsafe but also unsightly for potential users, which is why the entire fleet was scrapped [17].
In turn, the French city of Marseille was forced to limit the number of operators of electric scooters [17]. In the city’s opinion, too many vehicles led to traffic chaos [17]. It was also mentioned that too many movements were performed using scooters [17]. These indicated factors were connected with the excess accidents caused by the use of scooters with too little responsibility among their users [17]. In another case, Swedish cities introduced special speed limits for scooters, while Germany focused on the need to register scooters, equip them with license plates, and undergo a technical inspection, which resulted in the closure of other scooter-sharing systems [18].
An analysis of the business practices of the electric shared mobility market suggested to us that the factors that act as stimulants in one type of system may become destimulants in another type of electric shared mobility system. Since we observed large discrepancies in the problems emerging on the electric shared mobility market, we also decided to analyze the aspects that were taken into account by scientists during the modeling and optimization of electric shared mobility systems around the world. In the article we aimed at investigation of significant factors influencing planning and implementation, functioning and governance of all electric shared mobility services which is board area in transport planning and modeling. To identify specific stimulants and destimulants for various types of systems and to provide appropriate recommendations, we preformed our own research and mathematical analyses. This approach allowed us to identify the main factors influencing the development or recession of electric sharing systems, which supplements the research gap.
This article is structured as follows: The first section refers to the necessary information on the research topics undertaken; the next section describes the positioning of the topic in the foreign literature; the third section refers to the description of the SNA methodology; and the fourth section presents a discussion of the obtained results, while the last section summarizes the article with recommendations.
2. Factors Influencing Electric Shared Mobility Services
Even though many different aspects are referred to as problems or growth factors in market practices, it is important to analyze what factors are highlighted by scientists during the modelling and optimization of various electric shared mobility systems. The conducted literature analysis compiles the factors for every type of electric shared mobility system [19,20,21,22,23,24,25,26,27,28,29,30,31,32,33,34,35,36,37,38,39,40,41,42,43,44]. The factors presented below include the stages of planning the system’s implementation, its functioning, and its maintenance, thereby covering the entire service life cycle [42,43,44]. The data sheets are presented in Table 1, Table 2 and Table 3.
The prepared lists of factors mainly concern issues related to the appropriate location of vehicles and their fleet size. Moreover, the research conducted by foreign scientists has focused only on selected types of shared mobility services, e.g., electric-bike-sharing or electric-scooter-sharing systems [19,20,21,22,23,24,25,26,27,28,29,30,31,32,33,34,35,36,37,38,39,40,41]. However, when considering real business practices, not all factors taken into account in the modeling and optimization are consistent with the reality of the electric shared mobility market’s functioning [5,7,45,46,47,48]. Moreover, we observed a lack of scientific studies dedicated to a holistic approach for the whole electric shared mobility market that takes into account specific stakeholders’ needs [49,50,51,52]
The article aims to define the main factors related to all of the electric shared mobility service types at the stages of planning, implementation, and functioning while considering the problems of various stakeholder groups. The analysis was performed using the heuristic method and Social Network Analysis (SNA).
3. Methods
Based on the literature review related to the factors influencing electric shared electric mobility, we prepared the plan for our own research. The next step was to conduct expert interviews based on the heuristic methods to verify the problems defined and designate new research areas. Then, the next step of the study was based on Social Network Analysis (SNA).
Social Network Analysis is a research method related to the behavior of the individual at the micro-level, the pattern of relationships at the macro level, and the interactions between the two [53,54,55]. This method allows one to study collectively by assessing the relationships between different units. SNA combines elements of statistics, sociology, and social psychology and was introduced by Moreno in 1934 [53,54,55]. Now, SNA is widely used in many research disciplines, such as social and behavioral sciences, computer science, technological forecasting, production, project management, environmental and energy sciences, and risk management [56,57,58,59,60]. SNA characterizes networked structures by nodes/knots (individual actors, people, or things within the network) with the relationships described as named arrows between the nodes (relationships or interactions) that connect them [55]. These relationships could include interdependence, communication, the level of influence, competence, linkage, or the economy [55,56,57,58,59,60]. SNA discovers the relationships between individuals and assesses the impact of these relationships on the behavior of individuals. These relationships are focused not on individual actors and their relations but their interrelationships. Several characteristics describe the level of relationships, which can be defined by their frequency, the type of relationship, and the strength-level of the interaction [55]. The underlying assumption is that this relational place in the structure (the network) determines the behavior of individuals [61,62,63]. Finally, the data collected were analyzed by means of several techniques that illustrate the relationships [61,62,63]. The main advantage of the SNA method is its ability to reconstruct, visualize, and analyze complex and multilevel relationships occurring in a given phenomenon, given both the direct and indirect relationships between the issues. Research using SNA analysis can determine the impact of individual groups on the processes occurring in a given network [64]. The detailed analysis steps are presented in the subsection related to the research process.
Referring to the assumptions of the Social Network Analysis method, we defined the groups of the main stakeholders who are related to electric shared mobility services. Three main stakeholder groups were identified [65,66,67]:
- Users (further marked as “U”);
- Governments (further marked as “G”);
- Operators (further marked as “O”).
These are the groups most closely connected to electric shared-mobility [65,66,67]. Extended interactions among the indicated groups of stakeholders may improve the state of the current shared mobility market situation and may exert an influence on local transport policy-makers when creating sustainable urban mobility plans or the new sustainable transportation regulations [65,66,67].
The next step was to prepare a questionnaire for expert research and to conduct that research. We conducted this research in 2019 during annual workshops related to shared electric mobility in Paris, France. These workshops attracted more than 100 participants from different professions and included, among others, electric shared mobility operators, local self-government officials, SUMP experts, and researchers familiar with shared mobility solutions. The research was carried out during a session dedicated to the “Electric mobility impact factors”. All who were willing to participate in the session reported their willingness through limited registration via a mobile application. During the selection, the individual’s professional position and experience related to electric mobility sharing services were considered. Based on the participants’ submissions, 25 participants were invited to participate in the research session. For the number of participants to be sufficient to obtain statistically correct results, Equation (1) for the minimum number of experts was used [68]:
where Emin is the minimum number of experts, and p = is statistical significance, = 10%.
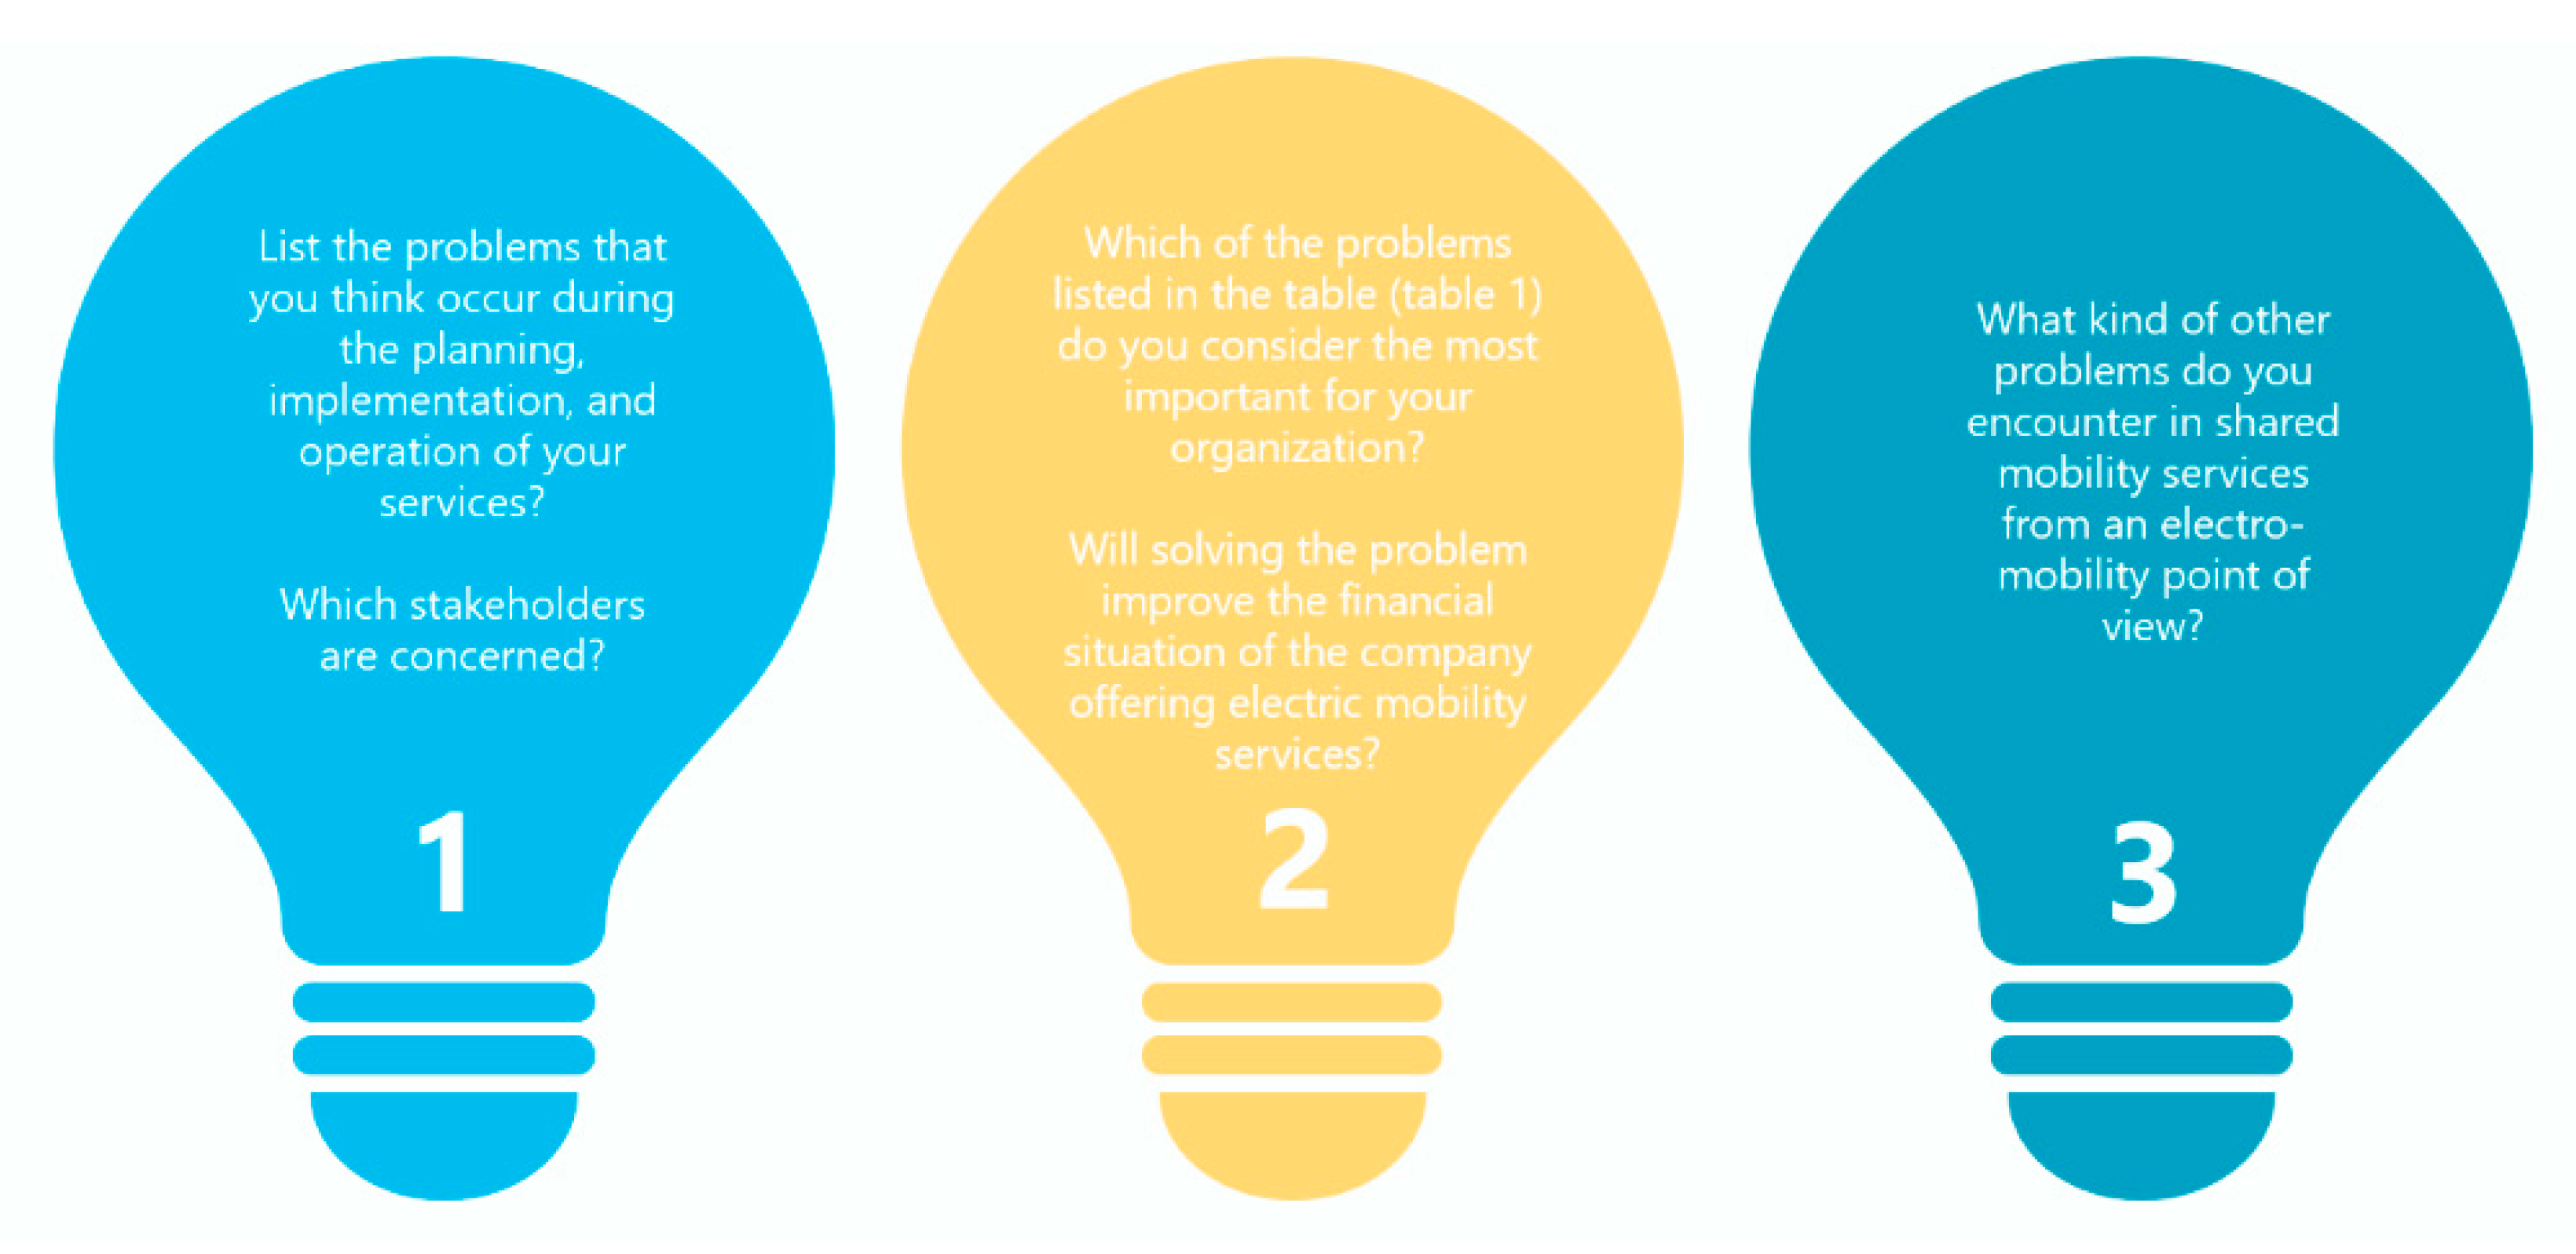
Following the guidelines for conducting expert research presented in [68], the indicated minimum number of experts was a representative sample. In the case of expert research, this result reflects the general publics’ opinion. This type of approach to expert research has been expressed, for example, in the works [69,70,71,72]. The 25 experts were composed of: seven representatives of electric shared mobility operators, eight representatives of local self-government officials, three representatives of SUMP experts, and seven representatives of researchers familiar with shared mobility solutions representing various academic backgrounds (technical universities, universities, and business academies). Twenty-five experts were worked in the group system. According to Arrow’s theory, a group decision support system was used because there is no ideal decision-making mechanism that would allow for a rational selection of group preferences based on individual preferences of individual group members [68]. However, if group members have common goals, appropriate ways of aggregating assessments and opinions from individual members of the expert group may be helpful. Therefore, the group needed to be composed of such a wide range of experts representing various scientific disciplines, branches of the economy, and the public sector. During the work, techniques related to group decision support based on the heuristic methods were used. We proposed a group activating method based on the Gordon’s Techniques that are appropriate heuristic methods for making group decisions [73]. The used method was the Forced Relations Technique, based on a register of characteristics, also called “selective listing” or “attribute listing” [73]. The technique consists of specifying various features related to a given problem and then considering modifying, replacing these elements, and using these elements’ characteristics to obtain better results. It is also used to position problems and match problems to defined sets [73]. Based on the methods’ principles, we proposed a list of factors (problems) connected with the experts’ shared electric mobility markets’ development. After the experts had reviewed the list of problems, they were asked three questions related to the existing problems, problem solving/solutions, and financial aspects. The main questions posed are shown in Figure 2 below.
The interviews were also able to retrieve additional expert answers. The next step was to assign each of the assessment factors to indicate their level of importance. Based on the experts’ responses and the development of synthetic assessments, 19 factors were obtained. All the factors that were results of the working meeting were considered in further analyses (see Table 4) to contribute to the calculations using the SNA method. The research sample size was compatible with the requirements of data analysis applied to previous shared mobility studies [34,38,54]. In the next step, five main areas were defined, which are related to the problems and the stakeholders. The experts indicated five areas of electric shared mobility system functioning:
- planning (A1);
- implementing (A2);
- functioning (A3);
- governance (A4);
- others (A5).
In the Social Network Analysis method, the nodes represent the identified problem and link a problem and stakeholders with the other problem. In turn, the interviewees had to specify the full potential impact of the problem on the stakeholder, the impact of the problem on another problem, and the problem in the given area. A list of the problems with detailed descriptions is presented in Table 4.
A list of problems with the related stakeholders and areas considered in the Social Network Analysis is presented in Table 5.
4. Results
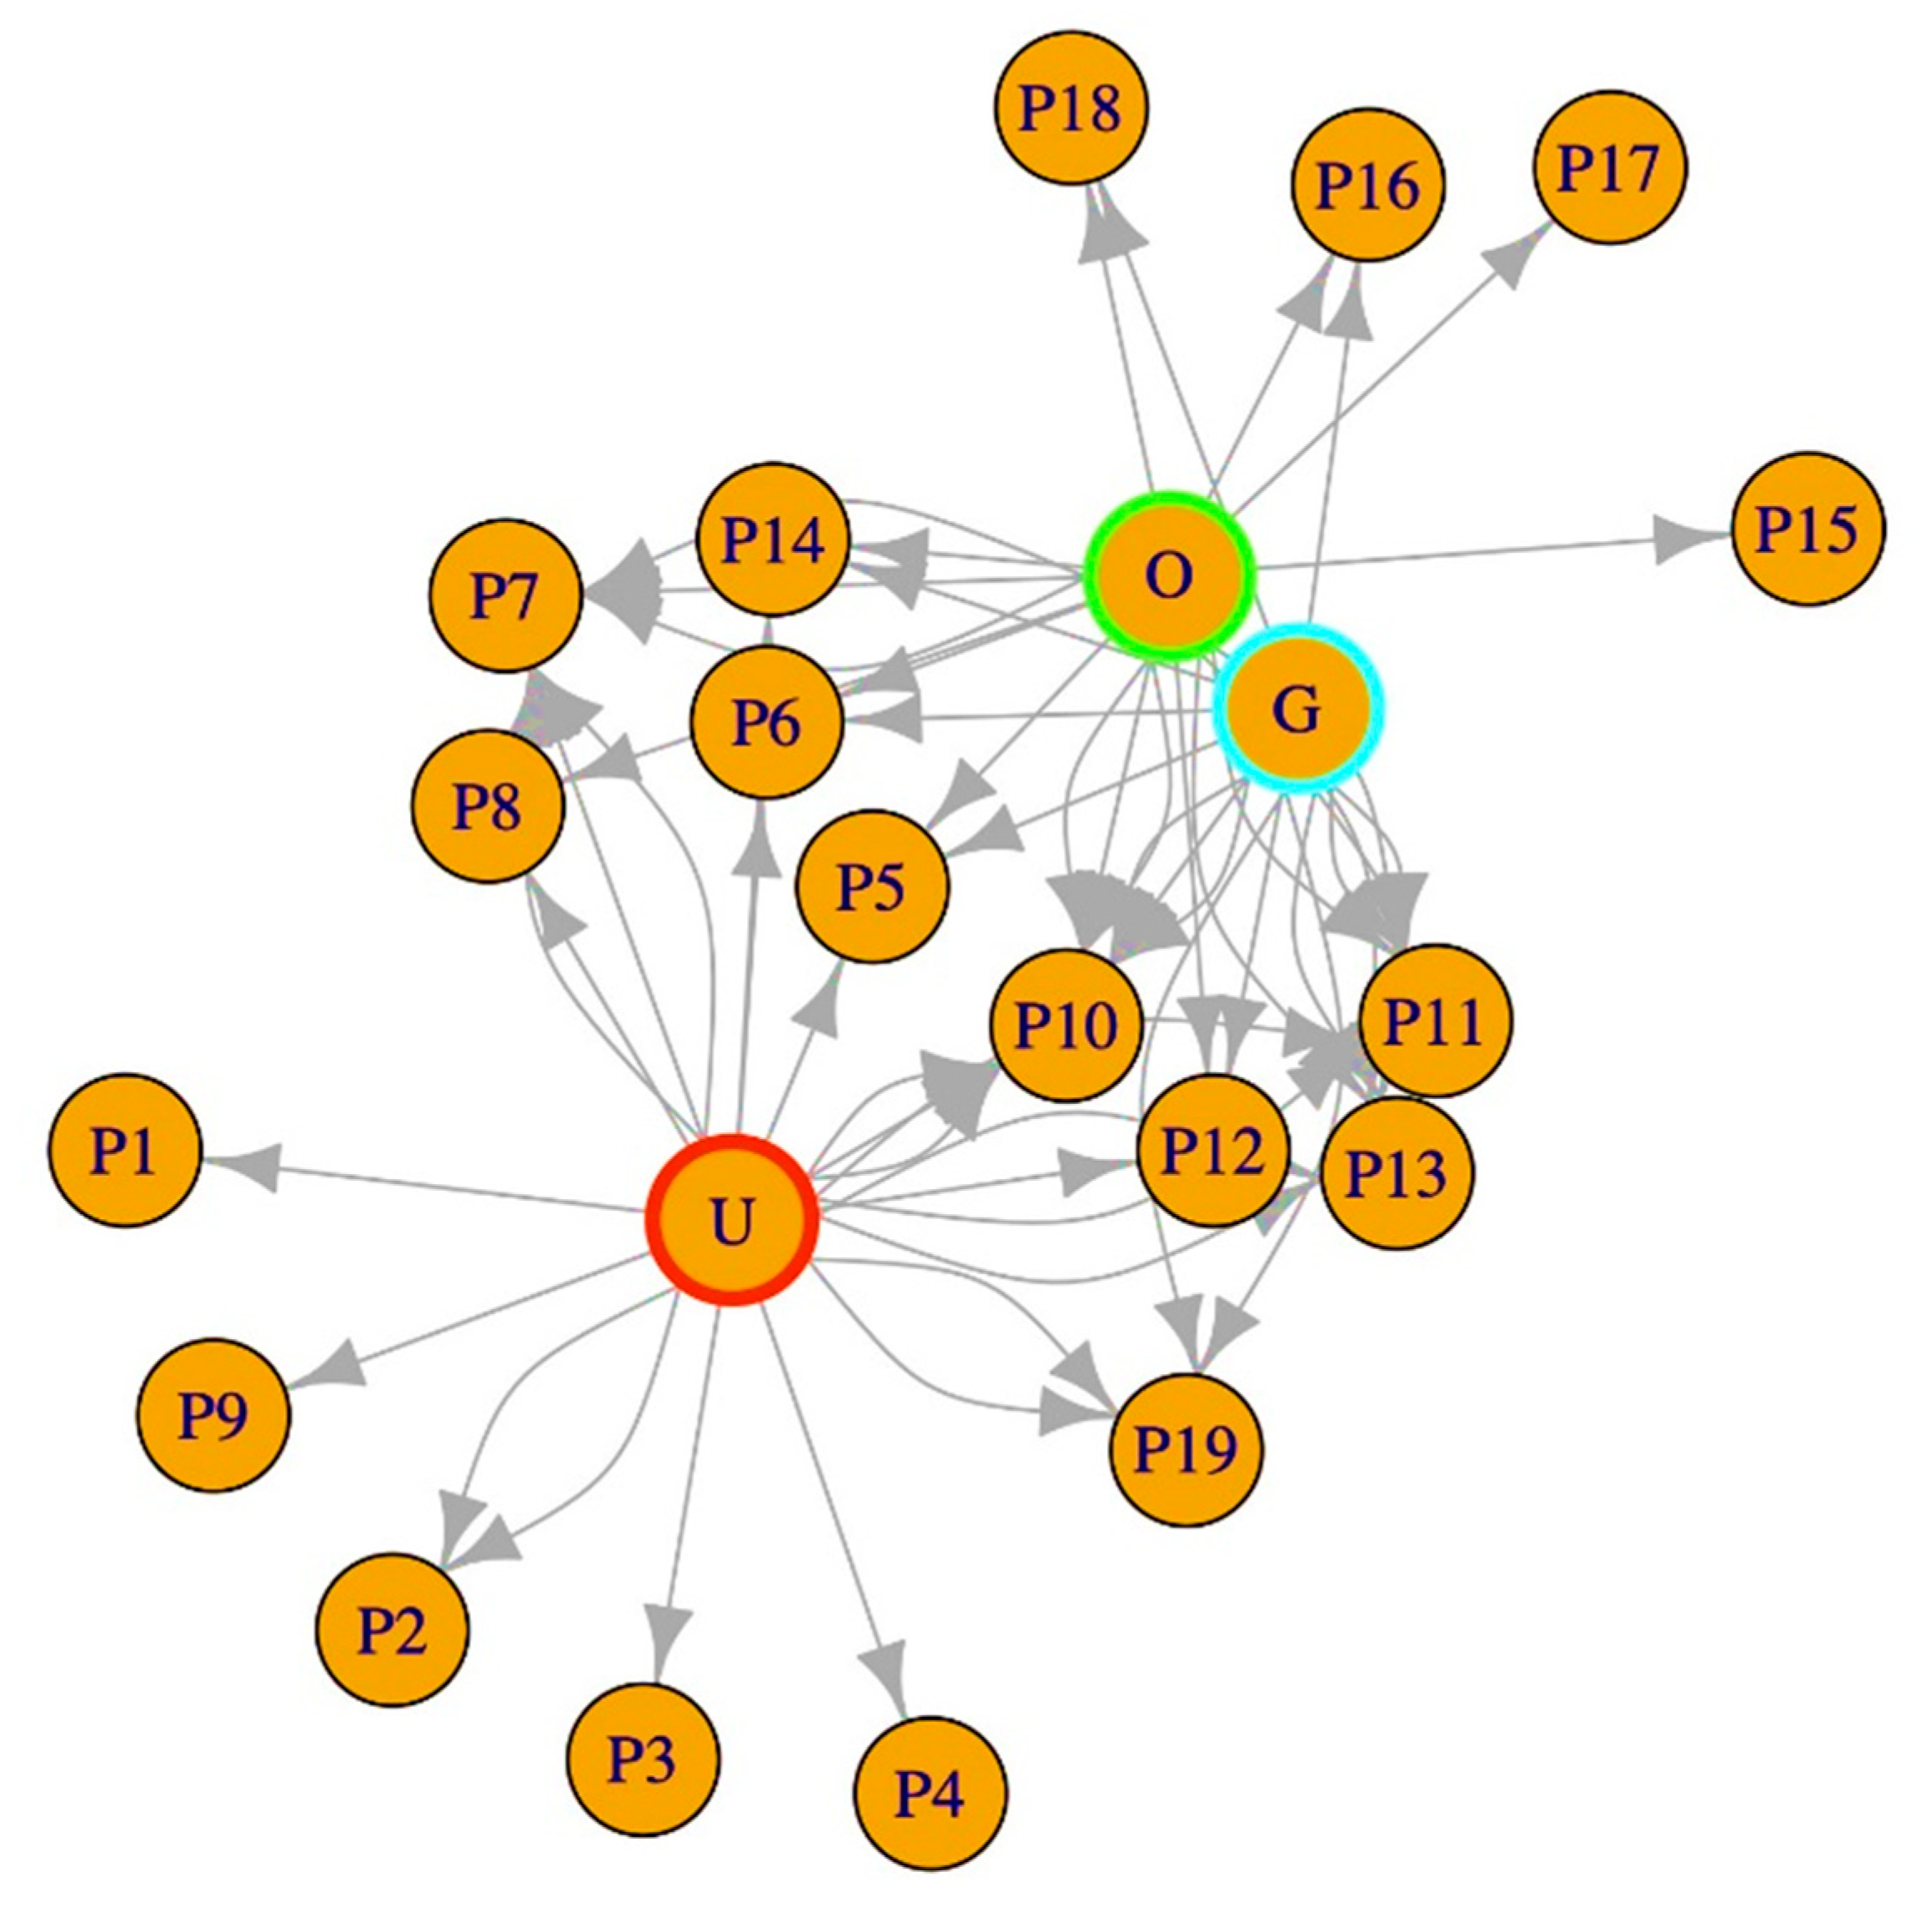
This analysis was performed using the R programming and the Igraph library. The results of the network-level analysis are shown in Figure 3. The network shown is made up of 22 nodes and is connected by 56 links. The colors of the nodes represent the categories of stakeholders and problems. The arrowhead direction of the link arrow shows the direction and relationship between a pair of stakeholders and the problem. The problems affecting more links are located in the center of the network, and the nodes with fewer links are closer to the network border.
The spatial view of the network makes it possible to clearly define the relations of stakeholders with the problems occurring in the network and to determine the main problems arising from this network structure. The large number of arrows (Figure 3) indicates that there are many relations between stakeholders and problems and also indicates that the same problem occurs in many stakeholder groups. In practice, a change in one factor affects a change in the rest of the network, which is essential for stakeholders. Table 6 and Table 7 present the number of input and output connections for a given node.
We subsequently determined the closeness centrality. Closeness centrality is a useful measure of the average shortest distance from each vertex to each other vertex. Specifically, it is the inverse of the average shortest distance between the vertex and all other vertices in the network. The network closeness centrality was calculated based on Equation (2) [69]:
where C(x) is closeness centrality, and d(x,y) is the distance between vertices x and y.
The average node distances are shown in Table 8. As noted in Table 8, average node distances higher than C(x) values indicate problems that go beyond the closest centrality area. The occurrence of values greater than the calculated range interferes with the proper functioning of the network. The results of this analysis can be used for further research, modeling, and optimization of electric cooperative mobility systems that consider criteria whose values C(x) > 0.314 in more detail. These values indicate that the network is intense and that the factors are closely related. The challenges associated with these influencing factors will, therefore, be very complex and challenging to manage due to the intense network of connections. The presence of multiple shared nodes at the center of the network indicates that operator performance plays a crucial role in the sustainable development of the entire system.
When analyzing the obtained values of individual factors in detail (see Table 7), the most important problem is factor P10—infrastructure. Subsequently, three factors, P7, P11, and P13, obtained very similar values, which means that when modeling and optimizing systems, it is worth considering these factors simultaneously because they complement each other. Moreover, it is worth paying attention to factor P19, which is an area of system operation important for the functioning of any type of system. Factors P5, P6, P12, and P14 should also be discussed together. However, they have a very statistically small significance for system development.
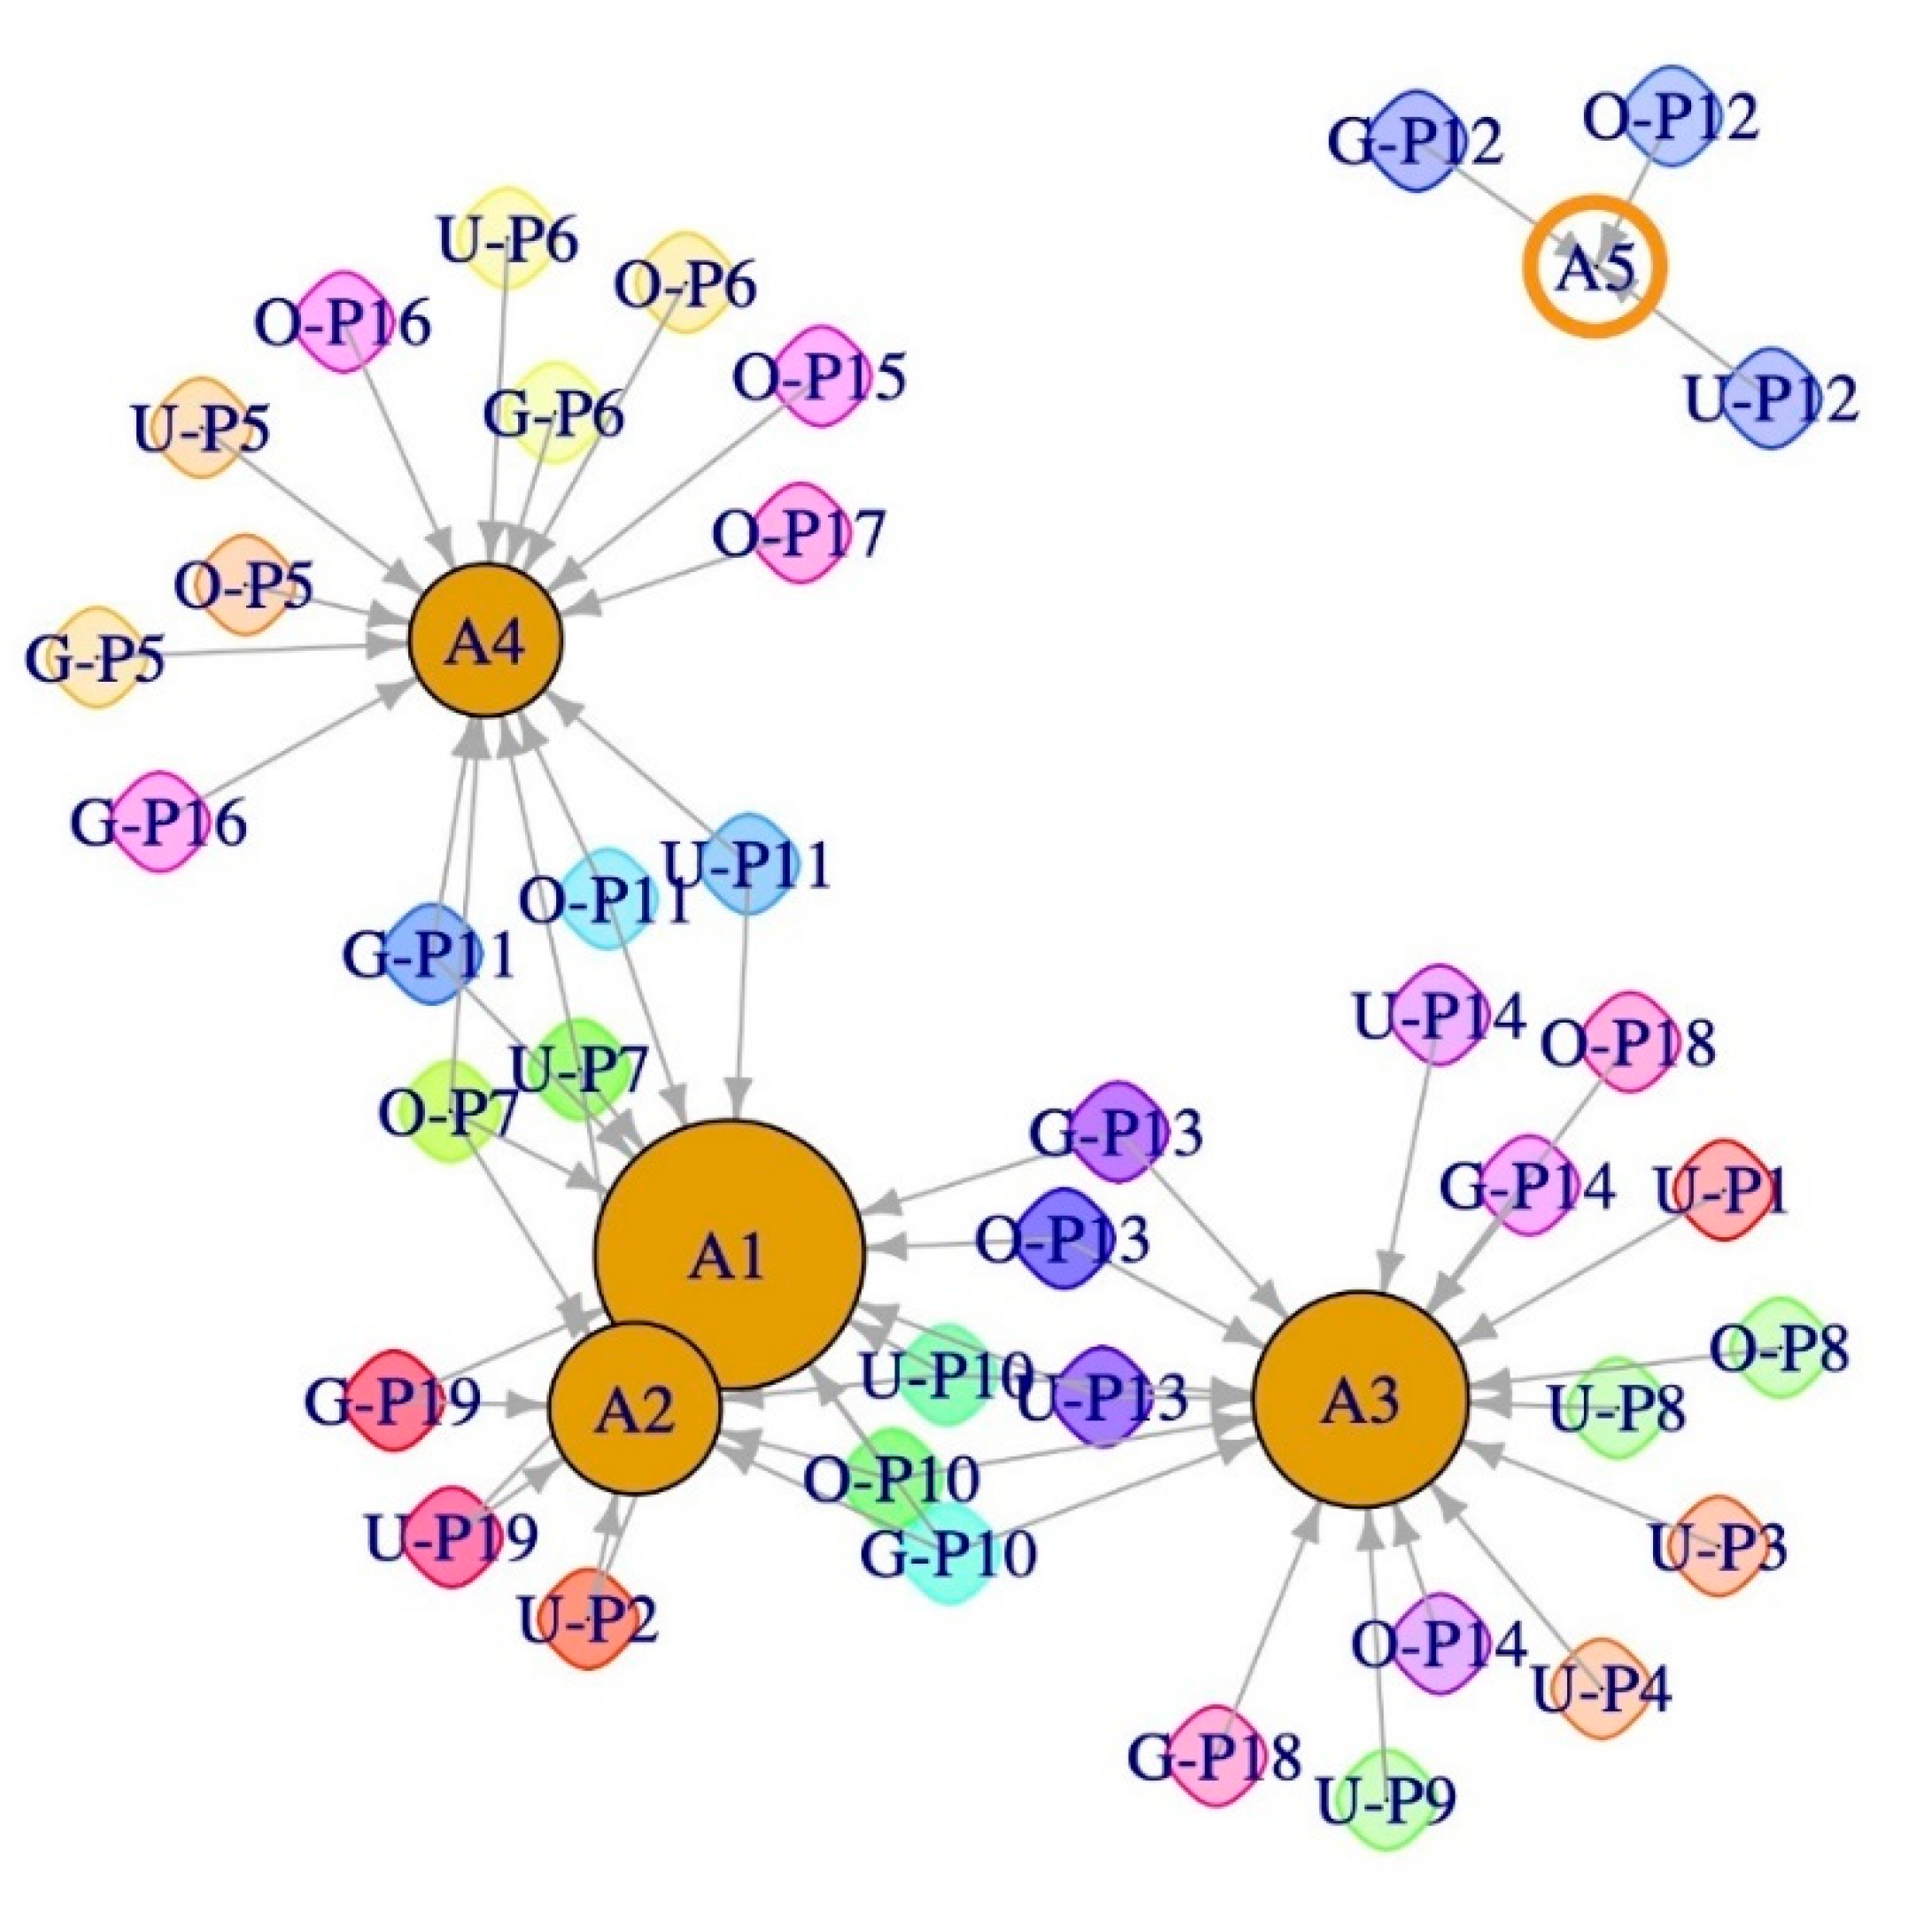
Moreover, factors P1, P3, P4, P9, and P17, despite representing seemingly important features, are the least important factors in optimizing systems for efficient functioning. Indeed, they were almost irrelevant to the analysis performed. Therefore, they are not valuable areas of interest for modeling and optimization. Based on the conducted research, new network topography was created, showing the connection of areas with stakeholder problems. The network structure is shown in Figure 4.
Knowledge of the network structure allows one to establish appropriate management of the individual elements in the network. The sizes of the circles shown in the SNA method indicate the scope of the problems (Figure 4). Only the A5 (others) area has no connection to the rest of the network, which means that problem in this part of the network does not affect proper operation in the rest of the network. The A1 (planning) area has the most considerable impact on the network and is directly linked to the A4 (governance) and A3 (functioning) areas. Combining these areas with existing problems and their proper management will significantly reduce the risk of the incorrect operation of the network in this structure.
Based on the results of the Social Network Analysis, the distribution of individual factors in the network, and expert research, we determined the types of individual factors influencing the development of electric mobility market services. The conducted research allowed us to additionally determine the impact of the type of stakeholder (the group of stakeholders) on the nature of a given variable in the electric services model of shared mobility. Table 10 presents the set of variables and their characteristics depending on the group of stakeholders.
Based on the conducted research, it can be concluded that the type of stakeholder depends on the nature of a given variable representing the selected factor. Importantly, the variability of this type of characteristic can be observed for the factors with average node distances > C(x). This type of compilation can be very helpful for modeling and using, for example, multi-criteria decision support methods.
5. Discussion
The research carried out using the Social Network Analysis method allowed us to determine the most crucial mobility factors for the electric shared mobility industry. Moreover, it allowed us to identify areas to focus on to ensure the optimal use and profitability of these systems. By analyzing the most important problems in the network in detail, it is possible to highlight (see Table 8) aspects such as infrastructure, fleet condition, user security, prices, and rental area. Importantly, the proposed approach and the results obtained take into account all types of electric shared mobility services. Although the systems differ in the type of vehicles, the concept of their functioning is based on the same idea (electric shared mobility). The most significant impact on the operation of the network appears to be problem P10 (infrastructure), which affects all groups of stakeholders and three areas of functioning. Interestingly, the problems of properly matched infrastructure (including the number of chargers and their technical reliability, the number of parking spaces, the number of dedicated areas where vehicles can be parked, electromobility hubs, and more) are not clearly highlighted in the optimization models. It is, therefore, particularly important to link the services to local SUMPs and to ensure that the services have a clearly laid out approach to power supply for juicers, individual clients, and company employees. Therefore, the models should assume specific data not only about the number of infrastructures but also the data related to the people connected with the system’s operational aspects.
The second important aspect is the P7 problem, which indicates the proper condition of the vehicle fleet. Notably, in the proposed models presented in the literature, the focus was only on the number of vehicles. Such a result among research and business practices should take into account the issues of fleet diversification and the technical condition of the fleet. Operational issues are very often overlooked, and, as the examples show, they are one of the main problems leading to the shutdown of electric shared mobility systems.
The third major problem is user security (P11). This goal for this factor is not road safety. Instead, the task is not to violate the user’s comfort and ensure that the condition of the vehicles does not endanger user security, as well as ensure that there is no fraud or other legal irregularities involved. This aspect is particularly important during the design stage to ensure adequate monitoring of the condition of the vehicles. Moreover, this factor is directly related to the number of vehicle rentals [5,9,74,75].
Another important factor is the well-known problem of appropriate pricing. Notably, the problems related to the condition of the vehicle fleet, user security, and prices, according to the analysis, achieved very similar values. Therefore, it is suggested to consider these factors together during modeling because they complement each other. This, therefore, indicates that such issues cannot be ignored when performing mathematical modeling, which is an important guideline for scientists modeling electrical shared mobility services.
Moreover, the analysis indicated one more group of factors that should be systematically examined, which includes aspects such as legal requirements, parking space location, weather, and vehicle relocation. This set indicates the correct direction of activities in the field of service development and supports the creation of appropriate legal regulations on the use of services that will allow, for example, the additional relocation of vehicles depending on the weather. This could mean, for example, temporarily allowing operators to set up virtual mobility hubs at stations, collective communication stops, or transfer points in bad weather when an increase in demand for electric shared mobility services is possible. It may also entail the need to create relocation models of vehicles under changing weather conditions. We suggest that the relevant parties develop scenarios for travel chains using shared vehicles depending on the weather while taking into account the condition of the vehicle battery, the charging time, and the necessary infrastructure.
Importantly, based on the analysis performed, factors such as vehicle location, registration process, rental process, vehicle safety, and urban traffic accessibility are the least important when modeling and optimizing systems. These factors achieved the lowest statistical values during the performed analysis. The registration and rental processes are organizational issues that are important for first-time users. When analyzing the system, active users are considered as a whole, so these elements may be omitted. In turn, issues such as the location of vehicles or the safety of users are beyond the control of the operator or analyst. It is impossible to predict specific vehicle locations because shared mobility systems based on dockless (free-floating) models do not have clearly defined parking spaces. In turn, safety issues depend on the condition of the roads, the users’ predispositions, and, for example, weather conditions, which also cannot be influenced directly at the level of mathematical modeling. Importantly, these two aspects are often found in scientific models and could be replaced with other factors.
Based on the obtained results, it can be stated that the main challenges facing today’s industry of shared electric mobility are the following:
- Directing more attention to monitoring the quality of services and their availability for users of electric shared mobility systems;
- Establishing cooperation with the authorities to develop a standard policy for the development of electric shared mobility systems, developing joint plans for the location of chargers and parking spaces for electric vehicles, and establishing privileges for users and operators;
- Researching the number of electric vehicles and their distribution in a given area in the city to improve access to services for potential system users;
- Developing plans for cooperation between operators and cities as mutual business partners, which would increase transport accessibility and obtain a more favourable pricing policy for services for urban residents;
- Promoting electric shared mobility services (among both operators and city authorities).
Comparing the obtained results with the research of other authors, it is worth pointing out that we have classified the model network structures in terms of nodes and relations between them. Commonly, models of transport networks are described only by directed graphs. The authors’ approach was based on the use of a complex network, which, unlike directed graphs, is characterized by a more complicated architecture than networks described by graphs with a specific (predetermined) number of nodes and connections (edges) [76,77,78,79]. Moreover, the obtained detailed results regarding the aspects that can be taken into account when analyzing electric shared mobility systems are an original added value due to the SNA method used in modeling transport processes.
Moreover, based on the performed analyses, it was possible to determine which of the factors are stimulants, destimulants, and neutral for the development of electric shared mobility systems for each of the stakeholders. This type of compilation provides valuable support for analysts in the process of modeling and optimizing systems and could be widely used in the field.
6. Conclusions
In the current era of striving to create the most sustainable mode of transport, it is very important to have guidelines on how to properly model and optimize implemented or existing shared electric mobility market services.
The analysis presented in the present study offers an innovative approach to the factors influencing the development of shared electric mobility services. Based on the use of the Social Network Analysis method supported by expert research, we developed a list of factors that are important in creating a holistic model of electric services for shared mobility. Moreover, the analysis made it possible to identify the main areas that should be considered as criteria in related mathematical models. Moreover, we showed that some of the proposed approaches, such as infrastructure, user safety, and aspects of fleet maintenance and operation, are overlooked in the literature. Notably, the results obtained in the conducted research were confirmed in real business practices.
In conclusion, the research in this study showed that there is great potential in using the SNA method for more comprehensive transport analyses in the field of modern transport mobility. This type of analysis is essential when designing new mobility services and implementing them in a specific area. What is more, knowing the character of the factors as stimulants, destimulants, and neutrals (see Table 10) is crucial during modeling and optimizing services in modern urban transport systems. Also, knowledge of the challenges that operators may face at the stage of service implementation will facilitate faster integration of the service within the area and with other systems operating in the city. We recommend that researchers who have access to more detailed trip data for electric shared mobility services use the present method together with elements of machine learning. A combination of SNA analysis and machine learning can support the process of creating an intelligent, integrated MaaS (Mobility as a Service) system, which is a significant challenge in the electric shared mobility industry.
Based on the provided Social Network Analysis, it is recommended to:
- Improve mobile applications with a module containing the possibility of assessing the quality of services and then monitoring and analysing the quality of services by operators in real time using machine learning and big data;
- Develop a local policy of shared electric mobility in cooperation with local self-governments with focusing on the aspects related to the infrastructure for charging electric vehicles (number, availability, location; infrastructure dedicated to vehicles from electric sharing systems, creating mobility hubs and parking spaces); technical fleet issues (condition of vehicles, including their mileage, wear, and reliability level); ensuring the security of users’ (in the case of personal data, safe payments, and General Data Protection Regulation issues); monitoring the number of fares, account activation fees, deposits, costs of violations, and subscriptions; system operational area (ground surface); providing the number of zones; type of system within the zone offered (see Table 8);
- Develop mathematical models that contain algorithms describing the principles of efficient operation of systems in the field of vehicle location and their availability to users;
- Create joint hubs for shared electro-mobility that function as a separate and specially arranged public space, where charging points and docks for vehicles with shared electric mobility are located;
- Create a Mobility as a Service Urban Platform that will gather all operators under one application. This type of solution will give users and operators equal access to the market for shared electric mobility.
As noted in Table 8, the average node distances higher than the C(x) values indicate problems that go beyond the closeness centrality area. The occurrence of values greater than the calculated range interferes with the proper functioning of the network. These values indicate that the network is intense and that the factors are closely related. The challenges associated with these influencing factors will, therefore, be very complex and challenging to manage due to the intense network of connections. The presence of multiple shared nodes at the center of the network indicates that operator performance plays a crucial role in the sustainable development of the entire system.
The results of this analysis can be used for further research, modeling, and optimization of electric cooperative mobility systems that consider criteria whose values C(x) > 0.314 in more detail. Moreover, the obtained results of this analysis can be used to assess the validity of a given criteria, e.g., when applying the multi-criteria methods used to develop a model of the transport system in the studied area. Moreover, the analysis showed which of the problems (factors) are most relevant for the holistic modeling and optimization of electric co-green mobility systems. Because each of these groups is associated with different types of sub-criteria, some selected criteria are worth considering during modeling and optimization, including:
- Infrastructure: the number of vehicles charging stations, types of chargers, charging time, availability of chargers, and the presence and number of dedicated parking spaces and e-mobility hubs;
- Fleet condition: mileage, technical inspections, and the occurrence of daily technical inspections;
- User security: existence of a protection system for users’ personal data and vehicle disinfection frequency;
- Rental area: number of zones for the functioning of the area, the number of sub-zones, the type of the system, and the size of the area;
- Law requirements: legal provisions regarding the movement of a specific type of vehicle, e.g., parking rules and operator regulations;
- Location of parking spaces: number of parking spaces, number of private and public parking spaces dedicated to electric sharing systems, geographic location, accessibility, and parking fees;
- Weather: the occurrence of rainy days and rules of operation on cold days (issues of battery status and user safety);
- Vehicles replacements: number of vehicles, number of employees to service, relocations during charging, and external human resources to handle battery charging.
Additionally, this analysis provides initial research results for the further advisement of valid and cost-effective electric shared-mobility systems in urban transport. We are planning to upgrade this analysis in our subsequent articles by considering a more significant number of initial data and preparing similar studies in other areas of systems to verify and improve the presented method.
Author Contributions
K.T. and A.K. discovered the challenges in electric shared mobility systems. A.K. performed the analyses. H.W. proposed the research scheme and then conducted the experiments and analyzed the experimental results. F.C. and B.Ł. provided guidance and critical suggestions for this study. All authors have read and agreed to the published version of the manuscript.
Funding
The research and analyzes performed for this article were funded by the Research University program at the Silesian University of Technology, 2019—Decision nr 06/FSW18/0003-05/2019. The APC was funded by Silesian University of Technology.
Acknowledgments
Publication supported under the Excellence Initiative—Research University program at the Silesian University of Technology, 2019—Decision nr 06/FSW18/0003-05/2019.
Conflicts of Interest
The authors declare no conflict of interest.
References
- Schuh, G.; Schwartz, M.; Kolz, D.; Jussen, P.; Meyring, T.L. Scenarios for the Development of Electromobility. In Proceedings of the 7th International Conference on Informatics, Environment, Energy and Applications, Beijing, China, 28–31 March 2018; Association for Computing Machinery: New York, NY, USA, 2018; pp. 174–178. [Google Scholar]
- European Union. White Paper on Transport. Available online: https://ec.europa.eu/transport/sites/transport/files/themes/strategies/doc/2011_white_paper/white-paper-illustrated-brochure_en.pdf (accessed on 9 September 2020).
- Mounce, R.; Nelson, J.D. On the potential for one-way electric vehicle car-sharing in future mobility systems. Transp. Res. Part A Policy Pract. 2019, 120, 17–30. [Google Scholar] [CrossRef]
- Macioszek, E.; Świerk, P.; Kurek, A. The bike-sharing system as an element of enhancing sustainable mobility—A case study based on a city in Poland. Sustainability 2020, 12, 3285. [Google Scholar] [CrossRef] [Green Version]
- Shaheen, S.; Chan, N.; Bansal, A.; Cohen, A. Shared mobility—A sustainability & technologies workshop, definitions. In Industry Developments and Early Understanding; University of California—Transportation Sustainability Research Center: Richmond, CA, USA, 2015; pp. 1–30. [Google Scholar]
- Shaheen, S.; Cohen, A. Carsharing and personal vehicle services: Worldwide market developments and emerging trends. Int. J. Sustain. Transp. 2013, 7, 5–34. [Google Scholar] [CrossRef]
- Turoń, K.; Czech, P. The concept of rules and recommendations for riding shared and private e-scooters in the road network in the light of global problems. In Modern Traffic Engineering in the System Approach to the Development of Traffic Networks; Macioszek, E., Sierpiński, G., Eds.; Springer: Cham, Switzerland, 2019; Volume 1083, pp. 275–284. [Google Scholar]
- Civitas Project, Car-Sharing. Available online: http://civitas.eu/car-independent/car-sharing (accessed on 18 March 2018).
- Hadryś, D.; Bąkowski, H.; Stanik, Z.; Kubik, A. Analysis of shaft wear in turbocharges of automotive vehicles. Transport Problems 2019, 14, 85–95. [Google Scholar] [CrossRef] [Green Version]
- Cherry, C.; Worley, S.; Jordan, D. Electric bikesharing system requirements and operational concepts. In Proceedings of the Transportation Research Board 90th Annual Meeting, Washington, DC, USA, 23–27 January 2011; pp. 1–13. [Google Scholar]
- Kolaković-Bojović, M.; Paraušić, A. Electric scooters—Urban security challenge or moral panic issue. TEME 2020, 18, 1045–1061. [Google Scholar]
- Zagorskas, J.; Burinskienė, M. Challenges caused by increased use of e-powered personal mobility vehicles in European cities. Sustainability 2020, 12, 273. [Google Scholar] [CrossRef] [Green Version]
- Zwoliński, A. Vozilla is Disappearing from Wrocław. The Municipal Car Rental Company Ends Its Activity. What about Cars? Wroclaw Newspaper. Available online: https://gazetawroclawska.pl/vozilla-znika-z-wroclawia-miejska-wypozyczalnia-aut-konczy-dzialalnosc-co-z-samochodami/ar/c1-14720892 (accessed on 9 September 2020).
- The Local French Portal. Available online: https://www.thelocal.fr/20180619/wheels-set-to-come-off-paris-autolib-electric-cars (accessed on 9 September 2020).
- Uyttebroeck, B. Shake-Up in Paris Car Sharing as Wheels Have Come Off Autolib, Fleet Europe. Available online: https://www.fleeteurope.com/en/smart-mobility/france/analysis/shake-paris-car-sharing-wheels-have-come-autolib (accessed on 9 September 2020).
- Kubik, A.; Turoń, K.; Stanik, Z. Car-sharing systems vehicles versus taxis in urban transport system—Legal requirements, technical service, operation. In Proceedings of the International Conference on Traffic and Transport Engineering (ICTTE), Belgrade, Serbia, 27–28 September 2018; pp. 923–930. [Google Scholar]
- Korosec, K. Bird Shuts Down Circ Operations in Middle East, Scraps as Many as 10,000 Scooters, Techcrunch Portal. Available online: https://techcrunch.com/2020/06/02/bird-shuts-down-circ-operations-in-middle-east-scraps-as-many-as-10000-scooters/ (accessed on 9 September 2020).
- Keating, D. Cities Are Cracking Down On Shared E-Scooters. Forbes Portal. Available online: https://www.forbes.com/sites/davekeating/2019/10/29/cities-are-cracking-down-on-shared-e-scooters/#69752d2c1ffc (accessed on 9 September 2020).
- Pérez, V.C. Simulation of a Public E-Bike Sharing System; Universitat Politechnica Di Catalugna: Barcelona, Spain, 2016. [Google Scholar]
- Wu, L.; Gu, W.; Fan, W.; Cassidy, M. Optimal design of transit networks fed by shared bikes. Transp. Res. Part B Methodol. 2020, 13, 63–83. [Google Scholar] [CrossRef]
- Wang, J.; Lindsey, G. Do new bike share stations increase member use: A quasi-experimental study. Transp. Res. Part A Policy Pract. 2019, 121, 1–11. [Google Scholar] [CrossRef]
- Campbell, A.; Cherry, C.; Ryerson, M.; Yang, X. Factors influencing the choice of shared bicycles and shared electric bikes in Beijing. Transp. Res. Part C Emerg. Technol. 2016, 67, 399–414. [Google Scholar] [CrossRef] [Green Version]
- Hu, Y.; Zhang, Y.; Lamb, D.; Zhang, M.; Jia, P. Examining and optimizing the BCycle bike-sharing system—A pilot study in Colorado, US. Appl. Energy 2019, 247, 1–12. [Google Scholar] [CrossRef]
- Feng, X.; Sun, H.; Wu, J.Z.; Lv, Y. Trip chain based usage patterns analysis of the round-trip carsharing system: A case study in Beijing. Transp. Res. Part A Policy Pract. 2020, 140, 190–203. [Google Scholar] [CrossRef]
- Shaheen, S.; Martin, E.; Totte, H. Zero-emission vehicle exposure within U.S. carsharing fleets and impacts on sentiment toward electric-drive vehicles. Transp. Policy 2020, 85, 23–32. [Google Scholar] [CrossRef]
- Huang, K.; An, K.; de Almeida Correia, G.H. Planning station capacity and fleet size of one-way electric carsharing systems with continuous state of charge functions. Eur. J. Oper. Res. 2020, 287, 1075–1091. [Google Scholar] [CrossRef]
- Grüger, F.; Dylewski, L.; Robinius, M.; Stolten, D. Carsharing with fuel cell vehicles: Sizing hydrogen refueling stations based on refueling behavior. Appl. Energy 2018, 228, 1540–1549. [Google Scholar] [CrossRef]
- Carrese, S.; D’Andreagiovanni, F.; Giacchetti, T.; Nardin, A.; Zamberlan, L. An optimization model for renting public parking slots to carsharing services. Transp. Res. Procedia 2020, 45, 499–506. [Google Scholar] [CrossRef]
- Abbasi, S.; Ko, J.; Kim, J. Carsharing station location and demand: Identification of associated factors through Heckman selection models. J. Clean. Prod. 2021, 279, 123846. [Google Scholar] [CrossRef]
- Repoux, M.; Kaspi, M.; Boyacı, B.; Geroliminis, N. Dynamic prediction-based relocation policies in one-way station-based carsharing systems with complete journey reservations. Transp. Res. Part B Methodol. 2019, 130, 82–104. [Google Scholar] [CrossRef]
- Clemente, M.; Fanti, M.P.; Iacobellis, G.; Ukovich, W. Modeling and simulation of an electric car sharing system. In Proceedings of the 25th European Modeling and Simulation Symposium, Athens, Greece, 23–25 September 2013; pp. 587–592. [Google Scholar]
- Benarbia, T.; Omari, A.; Aour, B.; Labadi, K.; Hamaci, S. Electric cars-sharing systems modeling and analysis. In Proceedings of the International Conference on Control, Automation and Diagnosis (ICCAD), Hammamet, Tunisia, 19–21 January 2017; pp. 30–35. [Google Scholar]
- Boyacı, B.; Zografos, K.G. Modelling user preferences in one-way electric carsharing systems. In Proceedings of the 60th Annual Conference of the Operational Research Society, Lancaster, UK, 11–13 September 2018. [Google Scholar]
- Hamroun, A.; Labadi, K.; Lazri, M. Modelling and Performance Analysis of Electric Car-Sharing Systems Using Petri Nets. E3S Web Conf. 2020, 170, 03001. [Google Scholar] [CrossRef]
- Axsen, J.; Sovacool, B.K. The roles of users in electric, shared and automated mobility transitions. Transp. Res. Part D Transp. Environ. 2019, 71, 1–21. [Google Scholar] [CrossRef]
- Gambella, C.; Malaguti, E.; Masini, F.; Vigo, D. Optimizing relocation operations in electric car-sharing. Omega 2018, 81, 234–245. [Google Scholar] [CrossRef]
- Lee, M.; Chow, J.; Yoon, G.; He, B.Y. Forecasting e-Scooter Competition With Direct and Access Trips by Mode and Distance in New York City. Available online: https://arxiv.org/ftp/arxiv/papers/1908/1908.08127.pdf?fbclid=IwAR0qZkxTDj-8qYeerGpHtqnacR6ylFfgHsmYisQ1hrXxpp1qkTT0XylO5Mw (accessed on 10 September 2020).
- Aguilera-García, A.; Gomez, J.; Sobrino, N. Exploring the adoption of moped scooter-sharing systems in Spanish urban areas. Cities 2020, 96, 102424. [Google Scholar] [CrossRef]
- Moran, M.E.; Laa, B.; Emberger, G. Six scooter operators, six maps: Spatial coverage and regulation of micromobility in Vienna, Austria. Case Stud. Transp. Policy 2020, 8, 658–671. [Google Scholar] [CrossRef]
- Chen, Y.-W.; Cheng, C.-Y.; Li, S.-F.; Yu, C.-H. Location optimization for multiple types of charging stations for electric scooters. Appl. Soft Comput. 2018, 67, 519–528. [Google Scholar] [CrossRef]
- Younes, H.; Zou, Z.; Wu, J.; Baiocchi, G. Comparing the Temporal Determinants of Dockless Scooter-share and Station-based Bike-share in Washington, D.C. Transp. Res. Part A Policy Pract. 2020, 134, 308–320. [Google Scholar] [CrossRef]
- Chen, T.D.; Kockelman, K.M. Carsharing’s life-cycle impacts on energy use and greenhouse gas emissions. Transp. Res. Part D Transp. Environ. 2016, 47, 276–284. [Google Scholar] [CrossRef]
- Ding, N.; Pan, J.; Zhang, Z.; Yang, J. Life cycle assessment of car sharing models and the effect on GWP of urban transportation: A case study of Beijing. Sci. Total Environ. 2019, 688, 137–144. [Google Scholar] [CrossRef] [PubMed]
- Luo, H.; Kou, Z.; Zhao, F.; Cai, H. Comparative life cycle assessment of station-based and dock-less bike sharing systems. Resour. Conserv. Recycl. 2019, 146, 180–189. [Google Scholar] [CrossRef]
- Cohen, A.; Shaheen, S. Planning for Shared Mobility; University of California—Transportation Sustainability Research Center: Berkeley, CA, USA, 2016. [Google Scholar]
- Sprei, F.; Habibi, S.; Englund, C.; Pettersson, S.; Voronov, S.; Wedlin, J. Free-floating car-sharing electrification and mode displacement: Travel time and usage patterns from 12 cities in Europe and the United States. Transp. Res. Part D Transp. Environ. 2019, 71, 127–140. [Google Scholar] [CrossRef]
- Ciari, F.; Bock, B.; Balmer, M. Modeling stationbased and free-floating carsharing demand: A test case study for Berlin, Germany. In Emerging and Innovative Public Transport and Technologies; Transportation Research Board of the National Academies: Washington, DC, USA, 2014. [Google Scholar]
- Ferrero, F.; Perboli, G.; Rosano, M.; Vesco, A. Car-sharing services: An annotated review. Sustain. Cities Soc. 2018, 37, 501–518. [Google Scholar] [CrossRef]
- Eccarius, T.; Lu, C.C.-C. Adoption intentions for micro-mobility—Insights from electric scooter sharing in Taiwan. Transp. Res. Part D Transp. Environ. 2020, 84, 102327. [Google Scholar] [CrossRef]
- Hadryś, D.; Kubik, A.; Stanik, Z.; Łazarz, B. Declaration and deformation during dynamic load of model longitudinals—real conditions and simulations. Sci. J. Sil. Univ. Technol. Ser. Transp. 2019, 102, 53–64. [Google Scholar]
- Gössling, S. Integrating e-scooters in urban transportation: Problems, policies, and the prospect of system change. Transp. Res. Part D Transp. Environ. 2020, 79, 102230. [Google Scholar] [CrossRef]
- Thomas, D.; Klonari, V.; Vallée, F.; Ioakimidis, C.S. Implementation of an e-bike sharing system: The effect on low voltage network using pv and smart charging stations. In Proceedings of the International Conference on Renewable Energy Research and Applications (ICRERA), Palermo, Italy, 22–25 November 2015; pp. 572–577. [Google Scholar]
- Yu, T.; Shen, G.Q.; Shi, Q.; Lai, X.; Li, C.Z.; Xu, K. Managing social risks at the housing demolition stage of urban redevelopment projects: A stakeholder-oriented study using social network analysis. Int. J. Proj. Manag. 2017, 35, 925–941. [Google Scholar] [CrossRef]
- Hatala, J.P. Social network analysis in human resource development: A new methodology. Hum. Resour. Dev. Rev. 2006, 5, 45–71. [Google Scholar] [CrossRef] [Green Version]
- Caniato, M.; Vaccari, M.; Visvanathan, C.; Zurbrügg, C. Using social network and stakeholder analysis to help evaluate infectious waste management: A step towards a holistic assessment. Waste Manag. 2014, 34, 938–951. [Google Scholar] [CrossRef]
- El-adaway, I. Analyzing Traffic Layout Using Dynamic Social Network Analysis; Technical Report; Mississippi State University—National Center for Intermodal Transportation for Economic Competitiveness: Starkville, MS, USA, 2014; pp. 1–39. [Google Scholar]
- Rudikowa, L.; Myslivec, O.; Sobolevsky, S.; Nenko, A.; Savenkov, A. The development of a data collection and analysis system based on social network users’ data. Procedia Comput. Sci. 2019, 156, 194–203. [Google Scholar] [CrossRef]
- Lee, K.; Jung, H. Dynamic semantic network analysis for identifying the concept and scope of social sustainability. J. Clean. Prod. 2019, 233, 1510–1524. [Google Scholar] [CrossRef]
- Yuan, J.; Chen, K.; Li, W.; Ji, C.; Wang, Z.; Skibniewski, M. Social network analysis for social risks of construction projects in high-density urban areas in China. J. Clean. Prod. 2018, 108, 940–961. [Google Scholar] [CrossRef]
- Li, Z.; Sun, Z.; Geng, Y.; Dong, H.; Ren, J.; Liu, Z.; Tian, X.; Yabar, H.; Higano, Y. Examining industrial structure changes and corresponding carbon emission reduction effect by combining input-output analysis and social network analysis: A comparison study of China and Japan. J. Clean. Prod. 2017, 162, 61–70. [Google Scholar] [CrossRef] [Green Version]
- Hagen, L.; Neely, S.; Robert-Cooperman, C.; Keller, T.; DePaula, N. Crisis communications in the age of social media: A network analysis of zika-related tweets. Soc. Sci. Comput. Rev. 2018, 36, 523–541. [Google Scholar] [CrossRef]
- Freeman, L.C. Centrality in social networks conceptual clarification. Soc. Netw. 1979, 1, 215–239. [Google Scholar] [CrossRef] [Green Version]
- Kim, J.; Rasouli, S.; Timmermans, H.J.P. Social networks, social influence and activity-travel behaviour: A review of models and empirical evidence. Transp. Rev. 2017, 38, 499–523. [Google Scholar] [CrossRef] [Green Version]
- Kawa, A. Analiza sieci przedsiębiorstw z wykorzystaniem metody SNA. Przeds. Zarz. 2013, 14, 39–49. [Google Scholar]
- Le Pira, M.; Marcucci, E.; Gatta, V.; Ignaccolo, M.; Inturri, G.; Pluchino, A. Towards a decision-support procedure to foster stakeholder involvement and acceptability of urban freight transport policies. Eur. Transp. Res. Rev. 2017, 9, 54. [Google Scholar] [CrossRef]
- Dörry, S.; Decoville, A. Governance and transportation policy networks in the cross-border metropolitan region of Luxembourg: A social network analysis. Eur. Urban Reg. Stud. 2016, 23, 69–85. [Google Scholar] [CrossRef]
- Le Pira, M.; Ignaccolo, M.; Inturri, G.; Pluchino, A.; Rapisarda, A. Modelling stakeholder participation in transport planning. Case Stud. Transp. Policy 2016, 4, 230–238. [Google Scholar] [CrossRef]
- Mishin, V.M. Research of Control Systems; Textbook for Universities; Unity-Dana: Moscow, Russia, 2003. [Google Scholar]
- Li, C.Z.; Hong, J.; Xue, F.; Shen, G.Q.; Xu, X.; Mok, M.K. Schedule risks in prefabrication housing production in Hong Kong: A social network analysis. J. Clean Prod. 2016, 134, 482–494. [Google Scholar] [CrossRef] [Green Version]
- Liu, J.; Yu, S.; Chu, J. Comfort evaluation of an aircraft cabin system employing a hybrid model. Sustainability 2020, 12, 8503. [Google Scholar] [CrossRef]
- Turoń, K.; Kubik, A. Economic aspects of driving various types of vehicles in intelligent urban transport systems, including car-sharing services and autonomous vehicles. Appl. Sci. 2020, 10, 5580. [Google Scholar] [CrossRef]
- Bonner, B.; Baumann, M.; Dalal, R. The effects of member expertise on group decision-making and performance. Organ. Behav. Hum. Decis. Process. 2002, 88, 719–736. [Google Scholar] [CrossRef]
- Gordon, W. Synectics: The development of creative capacity. Collier Books 1968, 1, 56–78. [Google Scholar]
- Turoń, K.; Kubik, A.; Chen, F. Operational aspects of electric vehicles from car-sharing systems. Energies 2019, 12, 4614. [Google Scholar] [CrossRef] [Green Version]
- Chen, F.; Turoń, K.; Kłos, M.J.; Czech, P.; Pamuła, W.; Sierpiński, G. Fifth-generation bikesharing systems: Examples from Poland and China. Sci. J. Sil. Univ. Technol. Ser. Transp. 2018, 99, 5–13. [Google Scholar]
- Arnold, D.; Furmans, K. Materialfluss in Logistiksystemen; Springer: Berlin/Heidelberg, Germany, 2009; pp. 153–209. [Google Scholar]
- Ambroziak, T.; Jacyna, M. Queueing theory approach to transport process dynamics. Part 1. Dynamics of transport network connections. Arch. Transp. 2002, 14, 5–20. [Google Scholar]
- Ortúzar, J.d.D.; Willumsen, L.G. Modelling Transport, 4th ed.; Wiley: New York, NY, USA, 2011; pp. 50–84. [Google Scholar]
- Szumska, E.; Jurecki, R.; Pawełczyk, P. Evaluation of the use of hybrid electric powertrain system in urban traffic conditions. Eksploat. Niezawodn. Maint. Reliab. 2020, 22, 154–160. [Google Scholar] [CrossRef]
Figure 1.
Shared mobility and electric-shared mobility timeline.

Figure 2.
The specific content of the research questions asked during the expert analysis.

Figure 3.
The network of stakeholder-associated problems.

Figure 4.
The network of stakeholders and associated factors (problems) for the five main areas.


Table 1.
Factors that are taken into account when modeling and optimizing electric bike-sharing systems—a literature review.
Table 1.
Factors that are taken into account when modeling and optimizing electric bike-sharing systems—a literature review.
| Factor | Sub-Factor | Type of Research | Literature |
|---|---|---|---|
| Costs | operational cost | optimization | [19,20] |
| reposition costs | |||
| infrastructure cost | |||
| Fleet | range | optimization | [19] |
| safety | |||
| cost of purchase | |||
| Parking | location of (dockless) bikes | modelling | [21,22] |
| location of docking stations | |||
| Weather | Weather | optimization | [23] |
Table 2.
Factors that are taken into account when modeling and optimizing electric car-sharing systems—a literature review.
Table 2.
Factors that are taken into account when modeling and optimizing electric car-sharing systems—a literature review.
| Factor | Sub-Factor | Type of Research | Literature |
|---|---|---|---|
| Costs | operational cost | optimization | [24,25] |
| reposition costs | |||
| infrastructure cost | |||
| Fleet | range | modelling | [26] |
| safety | |||
| Fleet | size | modelling | [25] |
| optimization | [27] | ||
| Parking | location of parking areas | modelling | [28,29] |
| location of vehicles | |||
| Fees | pricing policy | modelling | [30] |
| Charging | number of the charging stations | modelling | |
| location of the charging stations | modelling | [31,32,33] | |
| recharging policy | modelling | ||
| time of charging | optimization | [34,35] | |
| battery capacity | optimization | ||
| Model of system | rental rules | modelling | [31] |
| vehicles relocation time | optimization | [36] |
Table 3.
Factors that are taken into account when modeling and optimizing electric scooter-sharing and electric moped-sharing systems—a literature review.
Table 3.
Factors that are taken into account when modeling and optimizing electric scooter-sharing and electric moped-sharing systems—a literature review.
| Factor | Sub-Factor | Type of Research | Literature |
|---|---|---|---|
| Costs | operational cost | optimization | [37,38] |
| reposition costs | |||
| infrastructure cost | |||
| Parking | location of parking areas | modelling | [39] |
| Fees | pricing policy | modelling | [38] |
| Charging | location of the charging stations | optimization | [40] |
| recharging policy | |||
| time of charging | |||
| battery capacity | |||
| Weather | weather | optimization | [41] |
Table 4.
Influencing factors (problems) with their corresponding descriptions.
| Problem Nodes | Problem Name | Description |
|---|---|---|
| P1 | location of vehicles | the distribution of vehicles in the electric sharing zones of operation |
| P2 | mobile apps | the functioning of the application and accessibility for the user (UX and UI) |
| P3 | registration process | the form of registration in the system, e.g., via a mobile application or requiring reporting to the customer service office |
| P4 | rental process | Rules for renting vehicles, e.g., through a mobile application, using a card, on a subscription basis, etc. |
| P5 | law requirements | legal provisions regarding the movement of a specific type of vehicle, e.g., scooters, parking rules, operator regulations, etc. |
| P6 | location of parking spaces | number, geographic location, accessibility, and parking fees |
| P7 | fleet condition | technical condition of vehicles, including their mileage, wear, and reliability level |
| P8 | security of vehicles | the level of protection and monitoring of vehicles and monitoring the condition of vehicles in terms of break-ins, thefts, etc. |
| P9 | safety of users | the level of safety of users using vehicles—the use of vehicles with a high NCAP score, considering the technical condition of vehicles and their timely service inspections, rewarding safe driving among users, etc. |
| P10 | infrastructure | infrastructure for charging electric vehicles—number, availability, location; infrastructure dedicated to vehicles from electric sharing systems, e.g., mobility hubs and parking spaces |
| P11 | user security | ensuring the security of users’ personal data, safe payments, and General Data Protection Regulation issues |
| P12 | weather | weather conditions—mainly rainy and cold days |
| P13 | prices | the amount of fares, account activation fees, deposits, costs of violations, and subscriptions |
| P14 | vehicle replacements | relocation of vehicles within the offered zone—issues of human resources that perform this service, privileges for relocating vehicles, etc. |
| P15 | privileges for operators | the possibility of co-creating a system with the city, separation of zones only for electrical sharing systems, etc. |
| P16 | surcharges for operators | reduced parking costs, |
| P17 | urban traffic accessibility | adaptation of the municipal transport system to support electrical sharing systems, e.g., the presence of an integrated ITS system; willingness to create a shared mobile application for all systems; electronic parking fees; electronic fees for entering city zones, etc. |
| P18 | serviceability safety | focusing on the safe driving of the user, controlling journeys based on compliance with road regulations |
| P19 | rental area | system operational area (ground surface); number of zones; type of system within the zone offered |
Table 5.
Influencing factors (problems) with the corresponding stakeholders and areas.
| Stakeholder Nodes | Problem Nodes | Areas |
|---|---|---|
| U | P1 | A3 |
| U | P2 | A1, A2 |
| U | P3 | A3 |
| U | P4 | A3 |
| O, U, G | P5 | A4 |
| O, U, G | P6 | A4 |
| O, U | P7 | A1, A2, A4 |
| O, U | P8 | A3 |
| U | P9 | A3 |
| O, U, G | P10 | A1, A2, A3 |
| O, U, G | P11 | A1, A4 |
| O, U, G | P12 | A5 |
| O, U, G | P13 | A1, A3 |
| O, U, G | P14 | A3 |
| O | P15 | A4 |
| O, G | P16 | A4 |
| O | P17 | A4 |
| O, U | P18 | A3 |
| U | P19 | A1, A2 |
Table 6.
The number of inputs for stakeholders.
| Stakeholders | In Degree |
|---|---|
| User (U) | 23 |
| Operators (O) | 19 |
| Government (G) | 15 |
Table 7.
The number of outputs of problem nodes.
| Problem Nodes | Out Degree |
|---|---|
| P10 | 9 |
| P7 | 6 |
| P13 | 6 |
| P11 | 6 |
| P19 | 4 |
| P6 | 3 |
| P5 | 3 |
| P14 | 3 |
| P12 | 3 |
| P8 | 2 |
| P2 | 2 |
| P18 | 2 |
| P16 | 2 |
| P9 | 1 |
| P4 | 1 |
| P3 | 1 |
| P17 | 1 |
| P15 | 1 |
| P1 | 1 |
Table 8.
The average node distances.
| Problem Nodes | Average Node Distances |
|---|---|
| P10 | 1 |
| P7 | 0.72 |
| P11 | 0.666 |
| P13 | 0.666 |
| P19 | 0.44 |
| P5 | 0.333 |
| P6 | 0.333 |
| P12 | 0.333 |
| P14 | 0.333 |
| P2 | 0.254 |
| P8 | 0.24 |
| P16 | 0.206 |
| P18 | 0.206 |
| P15 | 0.129 |
| P1 | 0.127 |
| P3 | 0.127 |
| P4 | 0.127 |
| P9 | 0.127 |
| P17 | 0.112 |
Table 9.
The number of connections related to the areas.
| Areas | Number of Connections |
|---|---|
| A3 | 17 |
| A4 | 15 |
| A1 | 14 |
| A2 | 8 |
| A5 | 3 |
Table 10.
Set of variables and their characteristics depending on the group of stakeholders.
| Problem Nodes | Problem Description | Stakeholders | ||
|---|---|---|---|---|
| User | Operators | Government | ||
| P1 | location of vehicles | S | S | S |
| P2 | mobile apps | S | S | S |
| P3 | registration process | S | S | S |
| P4 | rental process | S | S | S |
| P5 | law requirements | N | D | S |
| P6 | location of parking spaces | S | S | D |
| P7 | fleet condition | S | D | D |
| P8 | security of vehicles | S | D | S |
| P9 | safety of users | S | S | S |
| P10 | infrastructure | S | D | D |
| P11 | user security | S | D | D |
| P12 | weather | N | D | N |
| P13 | prices | D | S | N |
| P14 | vehicle replacements | S | D | D |
| P15 | privileges for operators | N | S | D |
| P16 | surcharges for operators | N | S | D |
| P17 | urban traffic accessibility | S | S | S |
| P18 | serviceability safety | S | S | S |
| P19 | rental area | S | D | N |
D—destimulant, S—stimulant, N—neutral.
Publisher’s Note: MDPI stays neutral with regard to jurisdictional claims in published maps and institutional affiliations. |
© 2020 by the authors. Licensee MDPI, Basel, Switzerland. This article is an open access article distributed under the terms and conditions of the Creative Commons Attribution (CC BY) license (http://creativecommons.org/licenses/by/4.0/).
Share and Cite
MDPI and ACS Style
Turoń, K.; Kubik, A.; Chen, F.; Wang, H.; Łazarz, B. A Holistic Approach to Electric Shared Mobility Systems Development—Modelling and Optimization Aspects. Energies 2020, 13, 5810. https://0-doi-org.brum.beds.ac.uk/10.3390/en13215810
AMA Style
Turoń K, Kubik A, Chen F, Wang H, Łazarz B. A Holistic Approach to Electric Shared Mobility Systems Development—Modelling and Optimization Aspects. Energies. 2020; 13(21):5810. https://0-doi-org.brum.beds.ac.uk/10.3390/en13215810
Chicago/Turabian StyleTuroń, Katarzyna, Andrzej Kubik, Feng Chen, Hualan Wang, and Bogusław Łazarz. 2020. "A Holistic Approach to Electric Shared Mobility Systems Development—Modelling and Optimization Aspects" Energies 13, no. 21: 5810. https://0-doi-org.brum.beds.ac.uk/10.3390/en13215810
Note that from the first issue of 2016, this journal uses article numbers instead of page numbers. See further details here.