Roadblocks to Low Temperature District Heating


1
James Watt School of Engineering, James Watt Building, University of Glasgow, Glasgow G12 8QQ, UK
2
Hoare Lea, Highlander House, Glasgow G2 7DA, UK
3
Department of Civil and Environmental Engineering, James Weir Building, University of Strathclyde, Glasgow G1 1XQ, UK
*
Author to whom correspondence should be addressed.
Energies 2020, 13(22), 5893; https://0-doi-org.brum.beds.ac.uk/10.3390/en13225893
Submission received: 12 September 2020
/
Revised: 18 October 2020
/
Accepted: 27 October 2020
/
Published: 12 November 2020
(This article belongs to the Special Issue Recent Studies in District Heating and Cooling Systems)
Abstract
:Energy usage in buildings is coming increasingly under the spotlight as carbon policy focus shifts towards the utilization of thermal energy. In the UK, heating and hot water accounts for around 40% of energy consumption and 20% of greenhouse gas emissions. Heating is typically produced onsite, making widescale carbon or energetic improvements challenging. District heating networks (DHNs) can offer significant carbon reduction for many users but can only be implemented if the end user buildings have good thermal energy efficiency. This greatly limits the ability to implement advancing 4th and 5th generation DHNs, which are the most advanced systems available. We elucidate the current state of thermal efficiency in buildings in the UK and provide recommendations for necessary building requirements and modifications in order to accommodate 4th and 5th generation district heating. We conclude that key sectors must be addressed including creating a skilled workforce, producing relevant metrics and benchmarks, and providing financial support for early stage design exploration.
1. Introduction
Following the 1992 Kyoto Protocol, there has been an increasing amount of legislation dictating cleaner energy in the UK (e.g., the Climate Change Act 2008, the Carbon Reduction Commitment and the Energy Performance of Buildings Directive) [1,2,3,4,5]. These frameworks are driving changes in everything, from energy efficiency measures to material choices in manufacturing, and the related carbon emission targets are forcing a significant re-think about power and heat production, supply and use within buildings. The UK government has implemented a net zero carbon policy which commits to being carbon neutral by 2050, in order to limit global warming to 1.5 °C above pre-industrial levels [3]. This compels the decarbonization of heat, which accounted for about 37% of UK carbon emissions in 2016 [6]. It has been suggested that in order to meet these targets, around 18% of heat in UK buildings will have to be met by heat networks by 2050, while less than 2% of heat is currently met from heat networks [6,7].
Heat networks, or District Heating Networks (DHNs), across Europe are generally 3rd generation district heating networks (3GDHNs). These schemes typically operate above 80 °C and are often supplied by a combined heat and power engine (CHP). 3GDHNs offered a significant energetic and safety benefit over previous generations, however with advancing technology and understanding, the move is now being made towards lower temperature and renewable technology-based heat networks, described as 4th and 5th generation DHNs. These steps must be used to encourage a sustainable energy market, which meets future heating needs.
Energy sustainability can be described from the World Energy Council’s Energy Trilemma. This ranks three metrics equally—environmental sustainability, energy security, and energy equity. Each criterion should be well balanced to achieve a robust energy system and can be used to monitor for potential trade-offs between the three weightings during a time of significant grid change and evolution, like the global transition currently taking place. Of the top five ranked countries, Denmark and Sweden have significant share in district heating [8]. District heating may pose energy security risks as a single, smaller provider becomes responsible for supplying a large number of users, yet this may be balanced by the ability to accept heat to the network from a much wider range of sources [9]. Using district energy schemes may also reduce the dependence of national energy imports, if the heat source is renewable (e.g., borehole, solar thermal etc.), more so than individual renewable heat as the source can be integrated to a larger number of users. DHNs can also increase the share of low carbon and renewable energy sources, however pricing and fair market strategies must be adopted to improve energy equity [10].
Although numerous reviews on district heating exist [10,11,12,13,14,15,16,17], very few have focused on the UK market, which is likely due to the relatively small share heat networks have in the UK heating market [18]. However, the UK government has made DHNs part of the energy strategy and so it is the aim of this paper to present a review which primarily focuses on the problems and challenges in implementing modern, low temperature heat networks into the current UK infrastructure. We do not give an extensive review of heat networks in general; our aim is to address some of the key technical challenges which must be considered and have not been discussed in detail elsewhere.
2. Background: 5G District Heating Networks
The UK’s lack of district heating is now affording the opportunity to install higher efficiency networks than those already installed in DHN leading countries like Denmark and Sweden. 5th generation district heating is an emerging type of heat network which allows the exchange of heat and coolth between different buildings. This differs from the first four generations of heat network as the primary heat source is not from an energy centre but is from matching user heat demand with another user’s cooling demand and wider integration of low-grade heat. Examples of this could be supplying the rejected heat from supermarket refrigeration to local residential blocks, capturing low-grade industry waste-heat or offset heat from data centre cooling. This moves from a consumer driven heat market to a much more active, distributed prosumer market. There have been a few suggested ways that this might work, with a variety of terms being applied such as balanced energy networks, ambient loop systems, smart thermal grids, neutral temperature networks and heat sharing networks. The supply temperature of heat in a 5G ambient network is generally accepted as in the region of 10–40 °C [19]. This is far below the required temperature for domestic hot water or space heating, so it is necessary to upgrade this heat, typically with a water to water heat pump. The real benefit of a 5GDHC ambient network is the flexibility to provide heating and cooling from a single supply line, which may offer improved efficiency and reduced capital investment over the alternative four pipe heating and cooling system. Figure 1, Figure 2 and Figure 3 show the proposed distribution methods for a 5G 4-pipe system, a 5G ambient loop system and a traditional system.
5G networks will now face intense scrutiny to be able to enter the market on an even par with gas heating, or even traditional heat networks due to the novelty and lack of tried and tested schemes. There are many questions to be answered such as pricing strategies, how to prevent a monopoly market and equipment configuration. This may be an innovative solution, but energetic value is yet to be proven.
3. Background: 4th Generation District Heating Networks
4th generation district heating networks (4GDHNs) are most notably discussed and defined in [15]. Lund describes some key challenges to be addressed by 4GDHNs. These include lower distribution temperatures, smarter pre-fabricated components and flexible materials [15,20]. Lund goes on to defines 4GDHNs as
“4GDH systems provide the heat supply of low-energy buildings with low grid losses in a way in which the use of low-temperature heat sources is integrated with the operation of smart energy systems…”
It is unclear how well these objectives have been adopted in industry; however, these aims have been well discussed in literature. The aims can be broken into the following sections:
- Low energy buildings
- Low distribution losses
- Integrated low temperature heat.
Much of the work surrounding heat networks has been focused on reducing the supply temperature of the network, which has been suggested to relate to an energy saving of around 0.05 to 0.5 €/MWh·°C [21,22,23,24,25,26]. Gadd and Werner [27] present notable work to identify technical faults which persist in heat networks. They discuss fault detection in low temperature systems and divide heat network faults into three categories: construction faults, component faults and operation faults. In newer systems, construction faults are largely eliminated by the evolution of pre-fabricated energy centres and installations. Component and operation faults are much more likely to occur and are often related. Examples could be malfunctioning valve actuators, hot water temperature control or distribution pipe degradation [28]. These faults will be present in 5G networks as well, and so it is important to implement systems to reduce the likelihood of faults developing. It is likely that through reducing the temperature to 5G levels, many of these fault probabilities will be reduced due to lower temperatures and less harsh conditions.
4. Technical/Skills: Diversity and Sizing
Correct system sizing is paramount to an efficient and productive heat network, yet it is far too often that equipment is greatly oversized. This has been a problem for many well-intentioned DHNs, which has led to the network becoming poorly managed, inefficient and expensive.
During design phase, it can be easy to assume that the peak load on a network is simply the sum of the peak demand of each individual user, known as the aggregate demand. However, this is assuming that all users will require peak demand at the same time. For clarity, this means every user is simultaneously running hot water from every bath, sink and shower connected to the scheme when it’s −11 °C outside. The reality is that this never happens, yet some design engineers will still size the network for this as a worst-case scenario. A more realistic peak load can be accounted for by applying a diversity factor to the domestic hot water demand, which reduces peak load from the aggregate load by taking into account the variability of user demands. The sizing method for traditional DHNs recommended by the heat network code of practice suggests Danish standard DS 439, however other methods have been used in the UK, such as BS 6700 and now BS 8558 or BS EN 806 [29,30,31].
Figure 4 shows a comparison of diversity factors for DS 439, BS 6700, BS EN 806-3 and German standard DIN 1988 [32]. It can be seen that using the traditional British method (BS 6700) will lead to vastly over-sized pipe networks and increased capital cost, while adopting the Danish standard can significantly reduce installation size. It is not common to apply diversity to space conditioning demands; external air temperature is the largest driver in heating demand and will have a similar impact on all users. However, the updated CIBSE Code of Practice (CP1.2) introduces a diversified space heating load based on Danish standards.
Comparing Figure 4 and Figure 5 show the significance of correct pipe sizing; oversized pipe can lead to significant thermal losses.
Diversity should also be applied to sizing heating equipment, not just pipe sizing. The temptation to oversize a network can often be related to the economy of scale and the low cost of capacity, particularly with CHP and gas boiler systems, which can be seen from Figure 6. Heat pumps can be very expensive per kW installed capacity, however there is still an economy of scale. When Figure 6 is considered in the context of Figure 4, it is very clear that correct sizing is of paramount importance and there is clearly a balance between sizing reservedly and incurring un-necessary cost to developers.
Oversized equipment has been identified in numerous studies as a significant cause of underperforming heat networks. This could be accredited to a lack of understanding at design stage, combined with apprehension around design failure. This is a clear challenge in the emerging heat network market and must be well investigated to produce affordable and feasible heat networks. This challenge is aggravated by the lack of low carbon options; currently only electrified solutions are available as low carbon and sustainable heat options, which are often significantly more expensive than a combustion based alternative.
5. Technical: Legionella and Legionnaire’s Disease
Legionella pneumophila is a pathogenic bacteria, which can cause legionellosis, a group of diseases including Legionnaires’ disease, Pontiac fever and Lochgoilhead fever. Legionella occur in natural water systems but can usually only reach significant levels when allowed to incubate and grow in a warm, purpose-built system, like a water pipe or storage tank [34]. Legionella enters a strong growth phase between 25 °C and 45 °C (shown in Figure 7) which poses problems for low temperature heating systems [34,35,36,37,38,39]. Even in standard heating systems, 3rd generation storage tanks are often kept below 60 °C to reduce losses, creating a breeding ground for bacteria [38,40,41]. Control methods have been suggested such as copper-silver ionization, UV irradiation and chemical treatments, and are summarised in Table 1. In the UK, guidance on Legionella control is provided by the Health and Safety Executive Approved Code of Practice. We discuss some of the more promising methods of legionella control here.
Copper and silver ions are antibacterial and have been proven to control legionella growth in water systems [42,43,44]. This method electrolytically produces Cu2+ and Ag2+ cations from a small electrical current between copper and silver electrodes, which are introduced to the water system. The recommended dosage is 0.2–0.4 mg/L copper and 0.02–0.04 mg/L silver which may pose problems with local water quality compliance, and cases have been reported of legionella outbreak when the only method of treatment has been with Cu2+/Ag+ below the recommended dosage [45,46,47]. In the UK, the upper legal limit of Cu2+ at outlets is 2 mg/L [48]. There is no legal limit of Ag+, however the recommended upper limit is 0.1 mg/L. These limits are well above the required dosage for Legionella prevention, making copper/silver ionization a viable option. The cost benefits have not been well documented (either capital or operating), however for a typical 250 bed hospital the capital is estimated at approximately $50–10 k [44,47]. This treatment system has the potential to work very well with low temperature district heating networkss, however further study would be needed to quantify influence this system would have on the energetic and economic case.
Chlorine dioxide has been used extensively to disinfect water for many years and has proven efficacy [49,50,51,52]. This is most commonly achieved by producing chlorine dioxide gas (ClO2 (g)) on site and dissolving in the water system via a controlled dosing pump. While chlorine dioxide has been successful in limiting legionella growth, many studies have reported significant reduction only after several weeks or even years [50,52,53,54].
The efficacy of chlorine disinfection is strongly dependent on the chlorine concentration, contact time, water pH, temperature, organic solids concentration and the types of bacteria present [34]. This makes system monitoring vital to preventing legionella build up. The HSE recommend monthly checks of chlorine concentration at outlet taps, with dosing adjustment if the concentration is out-with the range of 0.5–1.0 mg/L. In the context of heat networks, this type of treatment is likely to be inefficient on its own and therefore an alternative used.
Ultra-Violet (UV) irradiation has been proven as a biocide and since used to limit legionella in water systems, however there are few cases of its application [57,58]. Unlike other methods of prevention, after irradiation there is no lingering effect meaning that legionella is only prevented at the point of contact with the UV light. This is a significant disadvantage as it can lead to biofilm accumulation upstream of the treatment point.
There is clearly no conclusive method to eradicate legionella in pipework, and while 5G networks will likely distribute as a closed loop, biofilm prevention must be established to maintain strong heat transfer between the distribution loop and the end user loop. On the consumer side, heat pumps may still operate up to 60/65 °C for a short period on a daily cycle to prevent Legionella growth but smarter, more efficient methods must be further tried and tested.
6. Political: Low Energy Buildings
One of the largest energetic losses from a heating network is from the end user, or secondary distribution loop. To minimize energy loss and increase the efficiency of the network, building standards must be improved to be able to maintain thermal comfort within a building using a low temperature 4th or 5th generation DHN. The EU Energy Efficiency Directive (2012/27/EU) describes the energy efficiency target for 2020 and the Directive on Energy Efficiency2018/2002 describes targets for 2030. The legislation sets targets to member states but allows each member to meet these targets as they wish. This has caused significant disparity across the EU energy efficiency in buildings. Some countries have enforced significant and drastic targets, while others have opted for a less heavy-handed approach.
Denmark currently has one of the strictest low energy building standards in the world. By 2020, all new build homes must have an energy demand less than 20 kWh/m2.annum and non-residential buildings a peak demand less than 25 kWh/m2.annum [59]. In the UK, energy efficiency is typically based on carbon emissions, with standards varying across each member nation. In Scotland, there are no mandatory standards on energy usage and the standards are based on Section 7 of the Energy Performance of Buildings (Scotland) Regulations 2008 [5]. For residential buildings, each dwelling is given a rating based on current energy efficiency, environmental impact and then the potential room for improvement. This forms a compulsory energy performance certificate (EPC). At the moment, there is scarce incentive for private owners to improve EPC rating, however dwellings in the private rented sector must have an EPC band C or better by 2030.
Additionally, all new buildings must show that the proposed development has a building emission rate (BER) less than the target emissions rate (TER) [60]. The TER is based on a notional dwelling of the same dimensions as the proposed dwellings but using reference construction values. The TER can cause deviation in compliance from Scotland to England as the TER in Scotland is based on Section 6 of the Building (Scotland) Regulations, while England and Wales use the Building Regulations 2013 Part L. The Scottish regulations assume some form of renewable energy is used, which is hoped to encourage housing developers to include a renewable share in building design. However, many developers can circumvent this by improving the building fabric. Improving the building fabric can reduce the DER below the TER, without using clean energy. This loophole has been exploited for some time and must be addressed to encourage clean heat. Although renewable energy is not included in the TER calculation in England, the UK government has identified the same need for clean heat, and so has banned the use of gas boilers in new build homes from 2025. This may create a significant market for low temperature district heating, particularly in areas with high housing costs; for small dwellings, the additional plant space for individual clean heat solutions may be preventatively large. Therefore, heat networks may be preferred as the equipment in each dwelling can be reduced to a heat interface unit, which is much smaller than some alternatives.
District heating networks can only be efficient and economically viable when the end users have a good level of thermal efficiency. As the standard calculation method of EPC rating across the UK varies, a direct comparison of energy efficiency from EPC reports is difficult and widely considered inappropriate [61]. However, while a direct comparison cannot be drawn, general trends in energy efficient dwellings in each country can be considered in the context of DHNs. Figure 8 shows the 2017 energy efficiency for each nation in the UK, based on their respective methodology [62,63,64,65]. It has been suggested that a 4GDHN can be implemented to a low energy building, where a low energy building is defined as “a building that is designed to achieve or come close to the Passivhaus standard” [14,66,67]. For residential dwellings in the UK to meet this definition, as a rule of thumb will mean 15 kWh/m2.year space heating demand or approximately 10% of a traditional dwelling’s annual heating energy [66,68,69]. Note that the definition of a low-energy building is not a hard definition and will vary from region to region. Passivhaus is considered one of the lowest energy demand building types yet may still have a poor EPC rating. The disparity is made clear in Figure 8. In many cases, a lower banded EPC rating can have a significantly lower energy usage in practice than a better rated building, shown in Figure 9. This shows a clear disconnect between evaluated energy performance and in-life energy performance, which makes it difficult for developers to easily assess suitability of low carbon technology from energy performance certificates; these EPCs are therefore not fit for purpose. It stands to reason that EPC criteria must be adjusted to give a more tangible, applicable and useful metric.
District heating in the UK is in its infancy compared with countries at the forefront, like Denmark. For this reason, it is difficult to assess quantitively the steps necessary for 4/5GDHN compatible building stock; instead a qualitative approach can be adopted based on progress elsewhere.
There have been many studies on the compatibility of LTDHN with current building stock [23,67,70,71,72,73,74,75,76,77,78,79,80,81]. Several of these papers present an analysis of the existing radiator system [67,81]. Tunzi, Østergaard, Svendsen, Boukhanouf and Cooper [67] discuss the impact of LTDH on existing radiator systems for a typical 1930s Danish house. The work focuses on optimizing radiator performance by minimizing the radiator supply and return temperatures. This is a common theme in LTDH applications; however, consideration must be made to practical systems. To minimize the return temperature, the flowrate of water in the radiator system must be lowered. As the flowrate is lowered, the flow regime moves away from turbulent flow towards laminar flow, particularly when there is a large pressure drop e.g., when the radiator is far from the heating circulator or the pipe feeds a terminal unit. When the flow becomes laminar, heat transfer is grossly reduced. This should be considered in future work and lower bounds set on the supply flow rate in computational models. Flow guidelines are given in CIBSE Guide B1; for pipes up to 50 mm a minimum velocity of 0.75 ms−1 is set to prevent sedimentations [82]. However, many engineers will ignore these lower bounds in order to achieve the large ΔT, particularly in CHP systems where overall efficiency is much closer related to the ΔT between supply and return [83]. The work in [67] concludes that significant energy savings could be made in some buildings with LTDH in standard radiator systems, purely by smarter use of thermostatic radiator valves (TRVs) and mitigating human error. These lessons on human error can certainly be transferred, however a duplicate study using UK housing stock is necessary to assess the suitability for LTDH, due to the varying weather patterns, housing condition and human behaviour.
While there are certainly technical building challenges to be addressed in implementing 4GDHNs, the greatest challenges are in meeting the cost and in sourcing the technical skills and experience to successfully complete the job. A study from the department of energy and climate change (now BEIS), identified a critical financial barrier to obtaining feasibility studies for local authority-led schemes, while for private developers identifying suitably qualified consultants and accepted contract mechanisms was a key barrier [84]. By reconsidering the current criteria of energy compliance, easier access to well performing heat networks may be achieved by closing the performance gap and offering simpler initial feasibility assessment.
Low Grid Losses
Heat losses in DHNs can be from the production point, in distribution or from the end user. The key to reducing losses will always be an inherently efficient design. Heat losses from the end user are largely out with the scope of most energy managers, however this can be minimized through a well thought passive design. Heating networks are often managed by a third-party company on a network operation contract, however there is often ambiguity around the required efficiency measures the operators are expected to achieve. It is not uncommon for efficiency to be described from the percentage of non-useful heat that leaves the production area, however this can be misleading as when production is low, the percentage loss can appear high. This may encourage operators to increase heat production, therefore lowering the percentage losses, in order to meet contracted KPIs [85].
Distribution losses are described in the Heat Network Code of Practice for the UK (CP1) [86]. The code of practice is not compulsory for heat networks in the UK but is offered as a benchmark for best practice. Heat losses are largely described by objective 3.5, 6.4.4 and Appendix E. The recommendation is for heat losses in the network to not exceed around 10% but in practice, many network operators do not monitor or account for losses in the network in enough detail to take corrective action when needed. In cases where there is a surplus of heat, as is often the case with electrically-led CHP systems, there can be even less incentive to monitor heat loss. Other reasons can be:
- The network is managed by an external company and there is no contractual incentive to monitor losses
- The network manager lacks the skills to monitor losses
- The network is not fitted with sufficient monitoring equipment to calculate losses.
Water loss and quality is a common cause of heat loss in DHNs. Water can be lost along the network for a host of reasons, commonly:
- Degradation of pipework. Often in older DHNs, management systems to monitor operational change and maintenance can be scarce. This can lead to pipes falling into neglect, especially when the network is substantial. Some examples of causes of degradation can be corrosion, mechanical faults (e.g., axial strain of pipework) and equipment ageing [87,89,90]. Degradation of pipework is a serious issue and even a small degree of wear and tear can cause significant damage and efficiency loss due to accelerated pitting corrosion, shown in Figure 10 [91,92].
Water loss from the network will necessitate water replacement, which can be used as a guideline KPI of the network efficiency. CP1 does not set a benchmark for the number of water replacements, however it is generally accepted that less than one full water change per year is indication of a tight, well maintained and operated network [93,94]. An estimate of the heat loss from carrier fluid leakage is given in Figure 11.
It is unclear how vast an issue leakage is from heat networks, however, it is clear that many operators lack the training, understanding and equipment to control this. A summary of this discussion is given in Table 2, below.
It should also be noted that pipe insulation is a significant factor in reducing distribution losses. These are discussed in great detail elsewhere and so not discussed here.
7. Other Roadblocks
7.1. Policy: Electrification of Heat
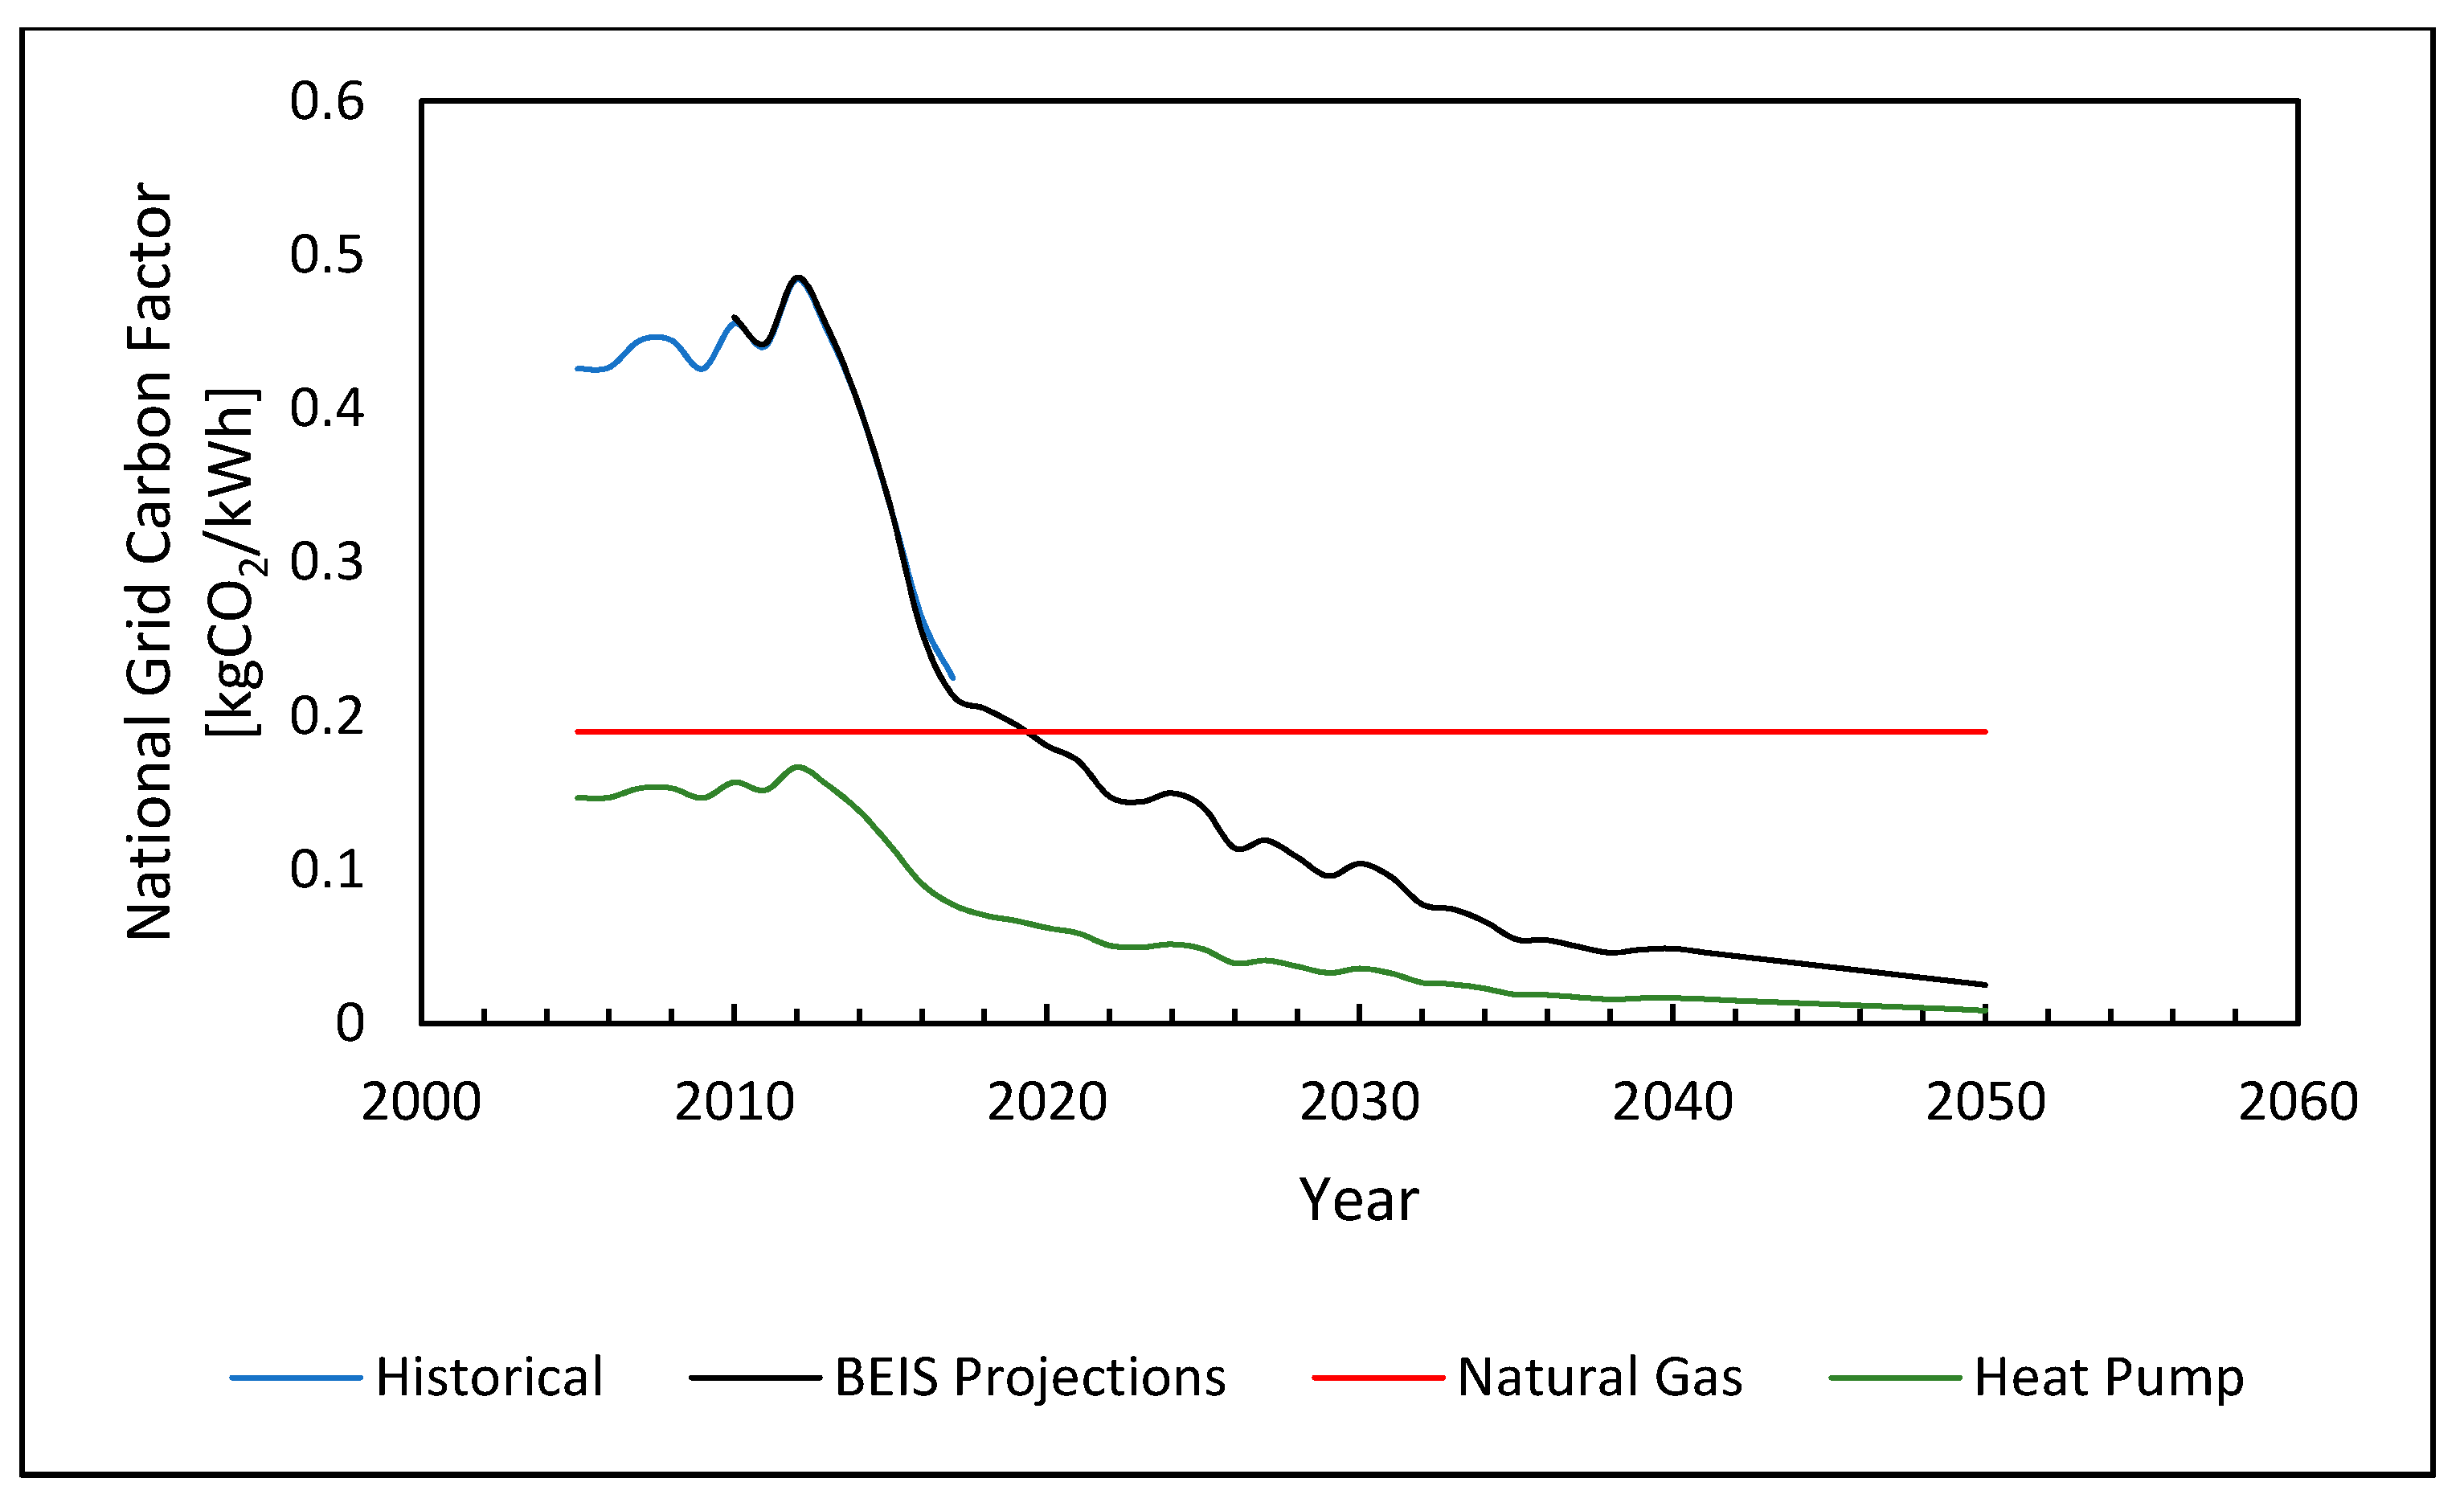
A huge effort has been made to decarbonize electricity in the UK through assimilation of cleaner, renewable electricity production to the wider electrical grid. A similar approach is not currently possible for heating and the gas network, and so the electricity grid in the UK is expected to become cleaner than natural gas usage, shown in Figure 12.
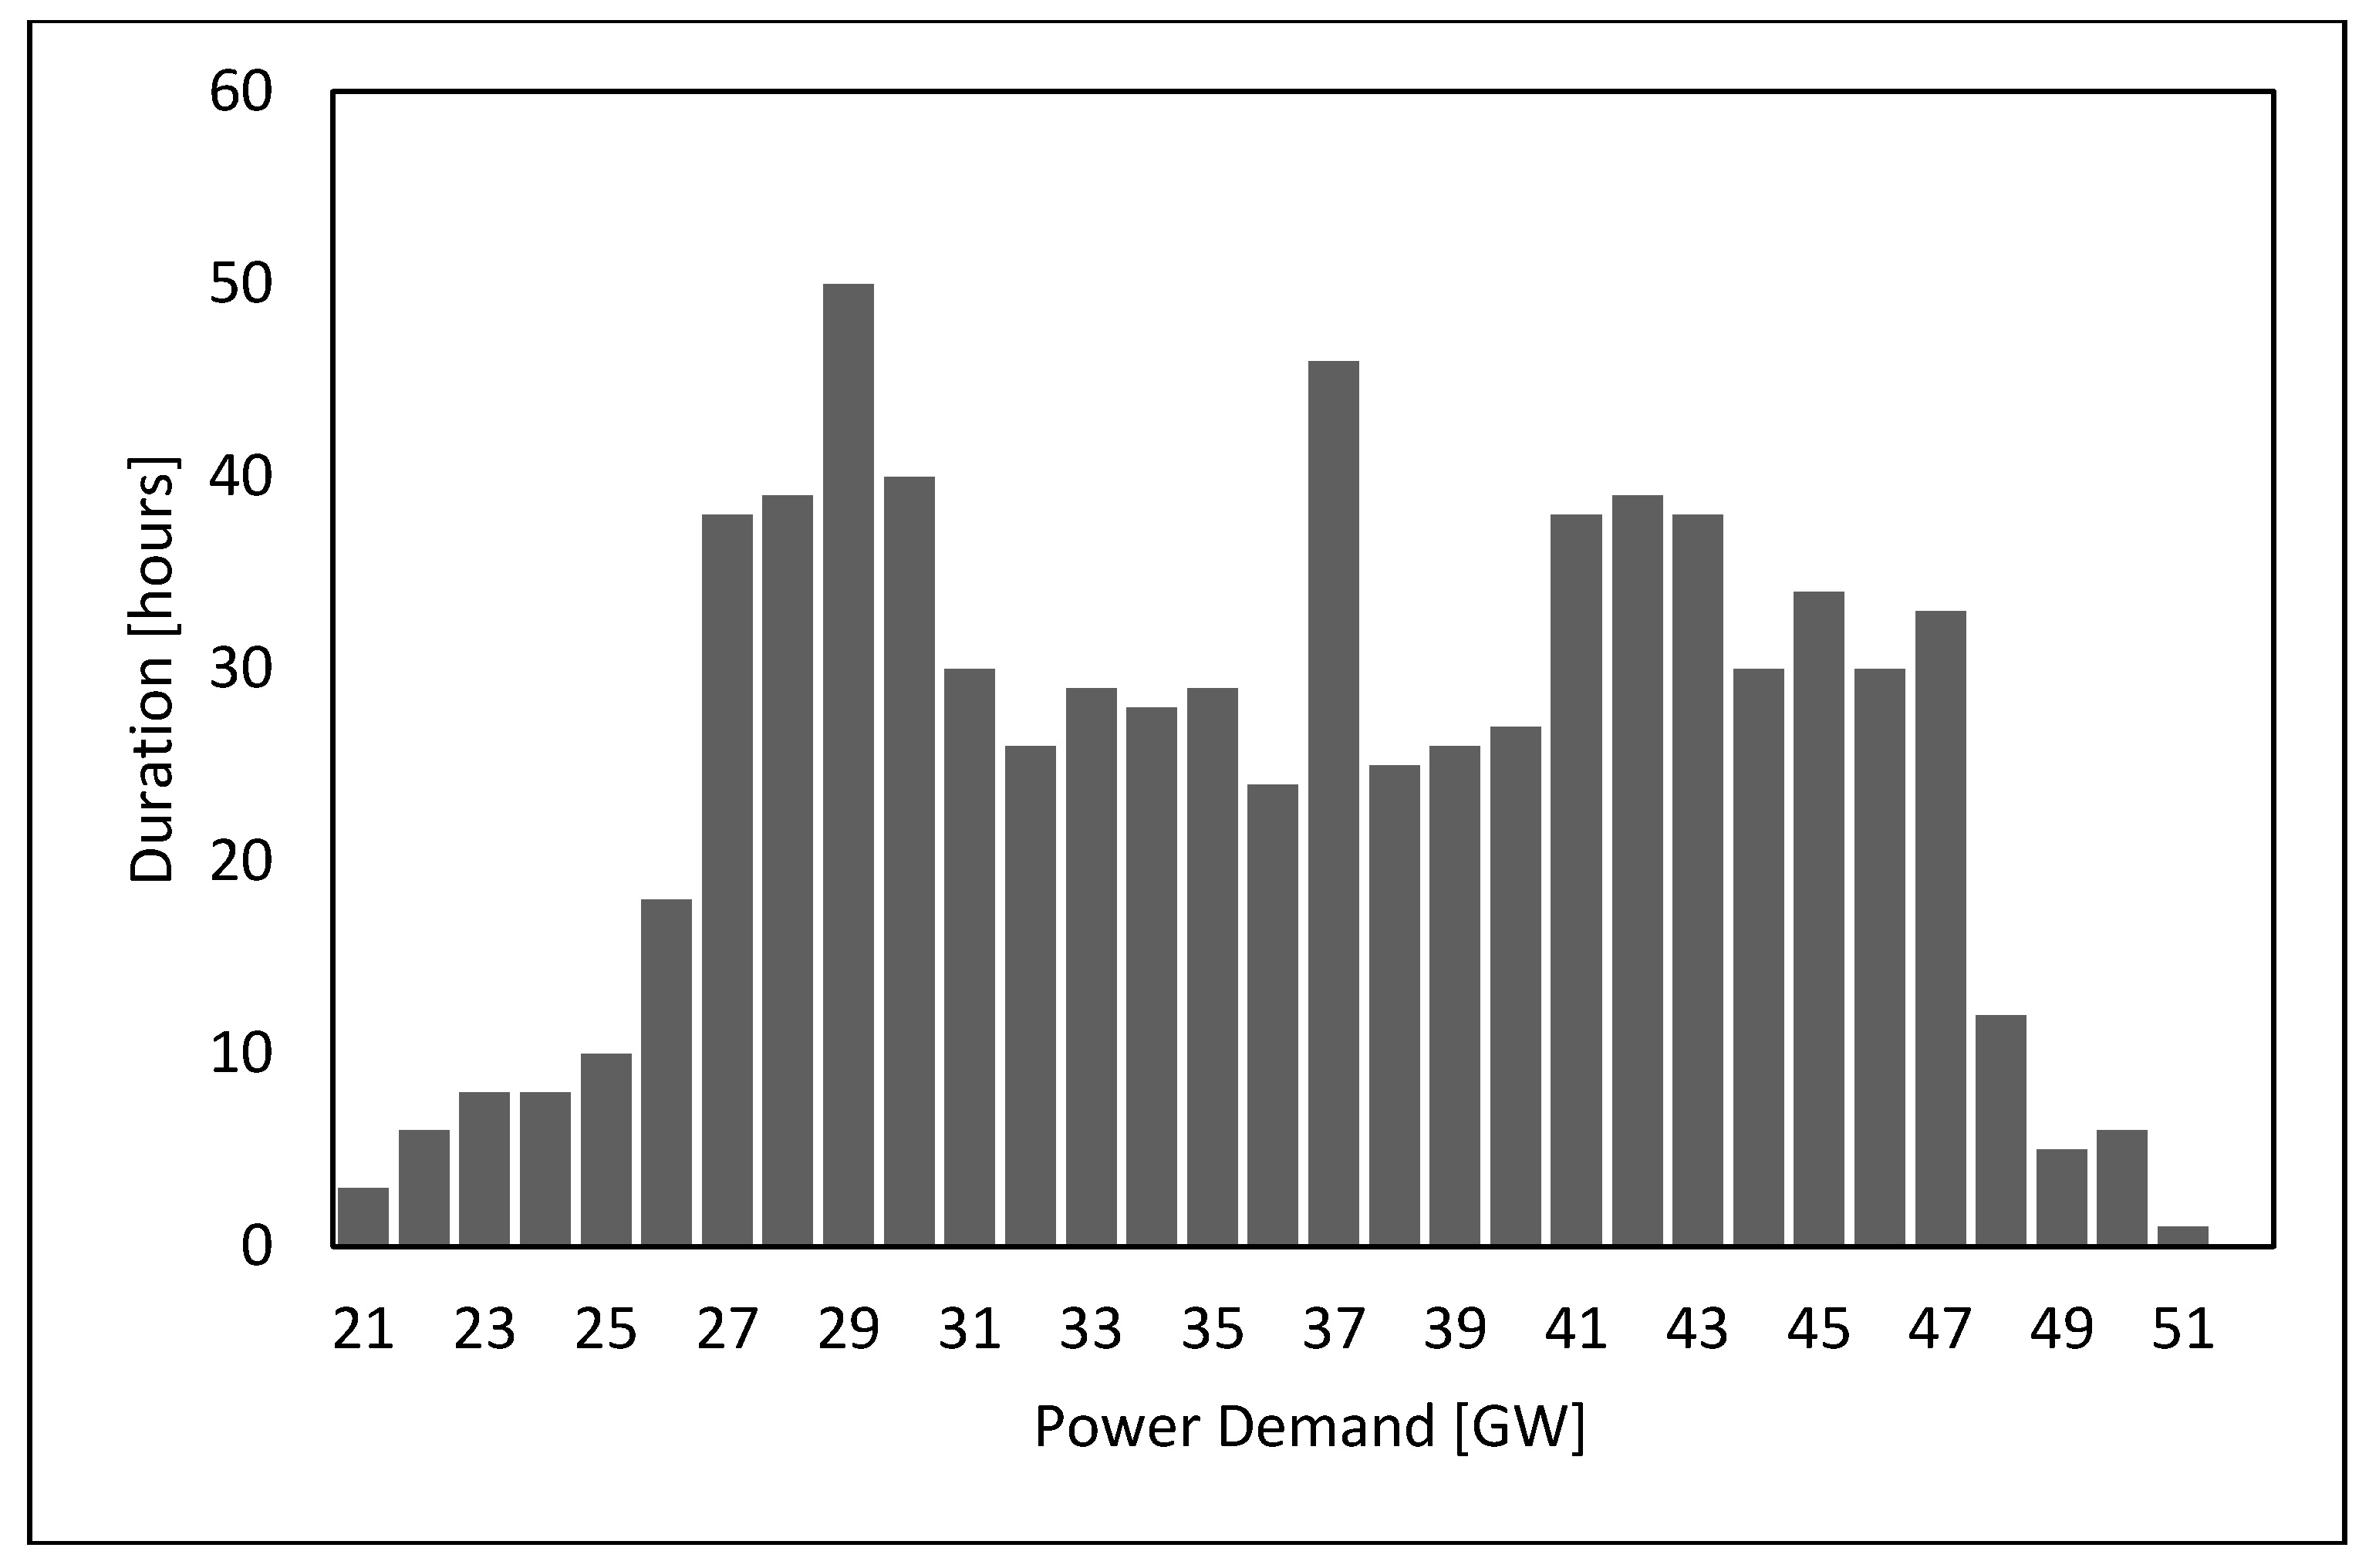
To take advantage of the rapidly de-carbonizing electrical grid, heat production can be moved to an electrically led market, described as the electrification of heat. The most widely suggested method involves utilization of vapor compression cycle (VCC) heat pump technology, one of the most efficient, widely available heating and cooling methods [95,96]. Love, et al. [97] suggest that the mass deployment of electrical heat is expected to have four critical challenges on both the transmission system operator (TSO) and on the distribution network operator (DNO). At a national level, the challenges relate to the increased peak demand on both the transmission line and the generation devices, and the grid ramp rate. The peak demand is the maximum instantaneous electrical demand on the network and the installed capacity in transmission and production must be able to meet this in order to continue providing a secure and stable electrical network. However, as heat is electrified, rather than drawing energy from the gas grid, this additional power will come from the electrical network. The increased electrical demand has been estimated to be 7.5 GW (14%) from a 20% uptake of heat pumps alone [97]. This does not account for any additional capacity required for other electrified process; primarily transport as electric vehicles become widespread. Others have suggested a peak increase of 25% peak demand using heat pumps compared with a 100% increase using direct heating; Oxford Energy suggest complete electrification of heat would require an additional 50 GW capacity at a cost of £100 billion [98,99]. Some studies show a much smaller increase, estimating only 0.8 GW peak increase with the deployment of an additional 1 million heat pumps [100]. The ramp rate is the rate of change of electrical production over time. The UK electricity demand is not smooth; it has sharp, short peaks throughout the day, typically only lasting 2–3 h [100]. A load duration curve is given for December 2016 in Figure 13. The figure shows a fairly even distribution across the low power section and the high-power section, with significant peak durations at the end of the plot.
While there is no clear census on the additional peak load, it is clear that transformation of the electricity generation and distribution must adapt with the heating sector to be able to truly deliver an integrated energy system. It is unlikely that low carbon heat will be realized without significant government incentive to reduce renewable heating to comparable cost with natural gas. This first requires a general government supported consensus on the best approach, which is unlikely to be realized any time soon with the current political climate in the UK over Brexit. Without government backing, it is difficult to enable any market to lead the decarbonization of the heating sector.
7.2. Policy: Procurement, Ownership and Contract Structure
DHNs in the UK are increasingly being identified by the National Health Service and local authorities as a low carbon and sustainable method to meet carbon reduction targets, yet project delivery can be daunting if not approached logically. This can be compounded by the lack of experience in heat network delivery for the UK. This section summarizes some of the challenges specific to DHN project delivery.
From an early stage, it is crucial to invest in an in-depth feasibility study. In particular, the study should include heat mapping, a building type study and consumer analysis. The economic case will be based on the number of consumer connections and so it is essential to understand the client base. This can be helped through market testing and consultation with local authorities. The procurement process can be made much easier if the initial feasibility studies have been completed in detail, allowing detailed risk analysis, defined liability and a clear established agreement for maintenance, performance and management.
Asset ownership in district heating can make this very difficult. If the network is to be installed in a completely new development, then this can be simplified but thought must still be given to the incoming property owners. In the past, many new homeowners have claimed they were not made aware the new property was connected to a heat network, giving the homeowner significantly higher than expected bills with a long commitment period (e.g., 20 years).
In developments connecting to existing infrastructure, each owner must be consulted to connect to the network. This becomes problematic where the tenant does not own the property; the property is leased through the local authority (if they are not the project instigator), leased through a housing association or privately rented. Even then, where works must be carried out on shared communal space (such as a communal stairwell) the individual owners may not be able to offer permission to work. These additional discussions will necessitate additional consultation time and should be duly considered to begin negotiations in a timely fashion, to limit impact on revenue and increase connections.
8. Conclusions and Future Work
District heating technology has come a long way from low efficiency high temperature and pressure steam, but with fast approaching carbon targets and climate change, it is now more important than ever for policy makers to seriously consider and implement high efficiency heating and cooling networks to decarbonize the heating sector. Fourth generation heat networks offer a promising step in the right direction, but fifth generation must not be ignored if we want to create a future-proof, flexible and robust heat market. For either 4th or 5th generation to gain a foothold in the market, it is necessary to integrate with thermally robust and efficient buildings to accommodate for lower supply temperatures. As DHNs become more widespread, clearer energy performance metrics must be adopted to be able to easily and cost-effectively determine which buildings are suited for low temperature heating, be it from DHNs or other renewable sources.
We have identified and discussed challenges in minimizing distribution losses; a critical step to efficient DHNs. These losses can be managed through regular monitoring and maintenance of the network. These losses are primarily from operation and component failure. Operational failure can be minimized through stringent management guidelines and operator training, while component failure must be continuously monitored. The framework for EPC and energy efficiency should be reconsidered to reflect the developing blend of renewable technology and the growing performance gap. The methodology should encourage clearer and more applicable energy ratings. This could offer a simpler initial feasibility study and therefore reduce costs to prospective developments.
With increased efficiency and lower supply temperatures, other problems have emerged. Legionella control methods are available for low temperature heating applications but, to the best of our knowledge, cost and energetic assessments have not been carried out. This is compounded by the lack of experience from design engineers in correct sizing approaches for emerging equipment applications. This will have significant adverse effect on the stability of the electrical network if not correctly managed.
To summarize, we conclude that:
- Investment must be made to upskill current talent in the UK to design, build, and operate district heating networks to best practice
- Care must be given in equipment sizing. Applying the “gas boiler” mentality can be expensive and leads to inefficiently designed systems
- Current energy performance metrics (EPCs) are not fit for purpose. These should be replaced with a suitable alternative which places emphasis on energy intensity, rather than carbon intensity.
- In-life performance assessment is crucial to bridge the performance gap between design and reality. Installation of sufficient monitoring equipment is crucial for this to be successful.
We can conclude from this review that a serious and significant overhaul of practices and principles for heating system design and management is the only way to tangibly tackle the decarbonization efforts. Future work should focus on an in-depth evaluation of all widescale and likely low carbon heating technologies to be able identify the best fit for both the current and future heating and electrical market; only then will a truly integrated system be achievable.
Author Contributions
Conceptualization, M.-A.M., B.E., G.J.; methodology, M.-A.M., B.E., G.J., N.M.B., Z.Y.; formal analysis, M.-A.M., B.E., G.J., N.M.B., Z.Y.; investigation, M.-A.M.; resources, B.E., G.J.; writing—original draft preparation, M.-A.M.; writing—review and editing, M.-A.M., B.E., G.J., N.M.B., Z.Y.; supervision, B.E., G.J., N.M.B., Z.Y.; funding acquisition, M.-A.M., N.M.B., Z.Y. All authors have read and agreed to the published version of the manuscript.
Funding
This research was funded by the National Productivity and Investment Fund EPSRC Doctoral Scheme (EP/R512266/1), Hoare Lea, Clyde Gateway and received support from the EPSRC “Combi-Gen” project (EP/P028829/1) and the EU H2020 LCE “DESTRESS” project (EC-691728). The research was also funded by the Newton Fund (EP/R003122/1), research fund EP/N020472/1 and the National Productivity and Investment Fund Innovation Placement Scheme (EP/S515395/1).
Acknowledgments
The authors would like to thank everyone at Hoare Lea who has supported this project.
Conflicts of Interest
The authors declare no conflict of interest.
References
- Scottish Government. Climate Change (Scotland) Act 2009; Scottish Government: Calton Hill, UK, 2009.
- Scottish Government. Climate Change Act 2008; Scottish Government: Calton Hill, UK, 2008.
- Explanatory Memorandum to the Climate Change Act 2008 (2050 Target Amendment) Order 2019 United Kingdom. 2019; Volume 1056. Available online: https://www.legislation.gov.uk/ukdsi/2019/9780111187654 (accessed on 16 July 2020).
- The Energy Performance of Buildings (England and Wales) (Amendment) Regulations. 2018. Available online: https://www.legislation.gov.uk/uksi/2018/362/contents/made (accessed on 16 July 2020).
- The Energy Performance of Buildings (Scotland) Regulations. 2008. Available online: https://www.legislation.gov.uk/ssi/2008/309/contents/made (accessed on 16 July 2020).
- Department for Business Energy and Industrial Strategy (BEIS). Clean Growth—Transforming heating Overview of Current Evidence. 2018. Available online: https://assets.publishing.service.gov.uk/government/uploads/system/uploads/attachment_data/file/766109/decarbonising-heating.pdf (accessed on 16 July 2020).
- Imperial College London; Cardiff University; Committee on Climate Change. Analysis of Alternative UK Heat Decarbonisation Pathways. 2018. Available online: https://www.theccc.org.uk/wp-content/uploads/2018/06/Imperial-College-2018-Analysis-of-Alternative-UK-Heat-Decarbonisation-Pathways.pdf (accessed on 16 July 2020).
- District Heating and Cooling Country by Country Survey. 2017. Available online: https://www.euroheat.org/publications/country-country-2017/ (accessed on 4 November 2020).
- Olsson, O.; Eriksson, A.; Sjöström, J.; Anerud, E. Keep that fire burning: Fuel supply risk management strategies of Swedish district heating plants and implications for energy security. Biomass Bioenergy 2016, 90, 70–77. [Google Scholar] [CrossRef]
- Bartolozzi, I.; Rizzi, F.; Frey, M. Are district heating systems and renewable energy sources always an environmental win-win solution? A life cycle assessment case study in Tuscany, Italy. Renew. Sustain. Energy Rev. 2017, 80, 408–420. [Google Scholar] [CrossRef]
- Lake, A.; Rezaie, B.; Beyerlein, S. Review of district heating and cooling systems for a sustainable future. Renew. Sust. Energ. Rev. 2017, 67, 417–425. [Google Scholar] [CrossRef]
- Li, H.; Nord, N. Transition to the 4th generation district heating - possibilities, bottlenecks, and challenges. Energy Procedia 2018, 149, 483–498. [Google Scholar] [CrossRef]
- Li, H.; Sun, Q.; Zhang, Q.; Wallin, F. A review of the pricing mechanisms for district heating systems. Renew. Sustain. Energy Rev. 2015, 42, 56–65. [Google Scholar] [CrossRef]
- Lund, H.; Østergaard, P.A.; Chang, M.; Werner, S.; Svendsen, S.; Sorknæs, P.; Thorsen, J.E.; Hvelplund, F.; Mortensen, B.O.G.; Mathiesen, B.V.; et al. The status of 4th generation district heating: Research and results. Energy 2018, 164, 147–159. [Google Scholar] [CrossRef]
- Lund, H.; Werner, S.; Wiltshire, R.; Svendsen, S.; Thorsen, J.E.; Hvelplund, F.; Mathiesen, B.V. 4th Generation District Heating (4GDH). Integrating smart thermal grids into future sustainable energy systems. Energy 2014, 68, 1–11. [Google Scholar] [CrossRef]
- Rezaie, B.; Rosen, M.A. District heating and cooling: Review of technology and potential enhancements. Appl. Energy 2012, 93, 2–10. [Google Scholar] [CrossRef]
- Millar, M.-A.; Burnside, N.M.; Yu, Z. District Heating Challenges for the UK. Energies 2019, 12, 310. [Google Scholar] [CrossRef] [Green Version]
- Department for Business Energy and Industrial Strategy (BEIS). Heat Network Investment Project Case Study Brochure. 2018. Available online: https://www.lgt.com/asia/en/private-banking/investment-services/portfolio-advisory/ (accessed on 16 July 2020).
- Von Rhein, J.; Henze, G.P.; Long, N.; Fu, Y. Development of a topology analysis tool for fifth-generation district heating and cooling networks. Energy Convers. Manag. 2019, 196, 705–716. [Google Scholar] [CrossRef]
- Frederiksen, S.; Werner, S. District Heating and Cooling; Studentlitteratur AB: Lund, Sweden, 2013. [Google Scholar]
- Li, H.; Svendsen, S. Energy and exergy analysis of low temperature district heating network. Energy 2012, 45, 237–246. [Google Scholar] [CrossRef]
- Østergaard, P.A.; Lund, H. A renewable energy system in Frederikshavn using low-temperature geothermal energy for district heating. Appl. Energy 2011, 88, 479–487. [Google Scholar] [CrossRef]
- Dalla Rosa, A.; Christensen, J.E. Low-energy district heating in energy-efficient building areas. Energy 2011, 36, 6890–6899. [Google Scholar] [CrossRef] [Green Version]
- Dalla Rosa, A.; Li, H.; Svendsen, S. Method for optimal design of pipes for low-energy district heating, with focus on heat losses. Energy 2011, 36, 2407–2418. [Google Scholar] [CrossRef]
- Alberg Østergaard, P.; Mathiesen, B.V.; Möller, B.; Lund, H. A renewable energy scenario for Aalborg Municipality based on low-temperature geothermal heat, wind power and biomass. Energy 2010, 35, 4892–4901. [Google Scholar] [CrossRef]
- Millar, M.-A.; Burnside, N.; Yu, Z. An Investigation into the Limitations of Low Temperature District Heating on Traditional Tenement Buildings in Scotland. Energies 2019, 12, 2603. [Google Scholar] [CrossRef] [Green Version]
- Gadd, H.; Werner, S. Achieving low return temperatures from district heating substations. Appl. Energy 2014, 136, 59–67. [Google Scholar] [CrossRef] [Green Version]
- Fransson, A.; Göteborg, E. Avkylningsarbete på göteborg energi ab 1995–2004. Fjorrvarme Fou 2005, 132, 146. [Google Scholar]
- British Standards Online (BSOL). Design, Installation, Testing and Maintenance of Services Supplying Water for Domestic Use Within Buildings and Their Curtilages Specification; BSI: London, UK, 2006. [Google Scholar]
- British Standards Online (BSOL). Guide to the Design, Installation, Testing and Maintenance of Services Supplying Water for Domestic Use Within Buildings and Their Curtilages; Complementary Guidance to BS EN 806; BSI: London, UK, 2015; Volume BS 8558:2015. [Google Scholar]
- Dansk Standard (DS). Code of Practice for Domestic Water Supply Installations. Dansk Standard. 2009. Available online: https://webshop.ds.dk/en-gb/standard/ds-4392009?CurrencyCode=EUR (accessed on 26 July 2020).
- German Institute for Standardisation (Deutsches Institut für Normung). Codes of Practice for Drinking Water Installations—Part 300: Pipe Sizing; Dvgw Code of Practice. 2012. Available online: https://standards.globalspec.com/std/10003717/din-1988-300 (accessed on 26 July 2020).
- AECOM (Firm); Taylor & Francis Group. Spon’s Mechanical and Electrical Services Price Book 2019; CRC Press: Cleveland, OH, USA, 2019. [Google Scholar]
- Health and Safety Executive (HSE). Legionnaires’ Disease: The Control of Legionella Bacteria in Water Systems; Health and Safety Executive: London, UK, 2013.
- Fields, B.S.; Benson, R.F.; Besser, R.E. Legionella and Legionnaires’ Disease: 25 Years of Investigation. Clin. Microbiol. Rev. 2002, 15, 506–526. [Google Scholar] [CrossRef] [Green Version]
- Sanden, G.N.; Fields, B.S.; Barbaree, J.M.; Feeley, J.C. Viability ofLegionella pneumophila in choline-free water at elevated temperatures. Curr. Microbiol. 1989, 18, 61–65. [Google Scholar] [CrossRef]
- Yee, R.B.; Wadowsky, R.M. Multiplication of Legionella pneumophila in unsterilized tap water. Appl. Environ. Microbiol. 1982, 43, 1330–1334. [Google Scholar] [CrossRef] [Green Version]
- Knapp, S.; Nordell, B. Energy-efficient Legionella control that mimics nature and an open-source computational model to aid system design. Appl. Therm. Eng. 2017, 127, 370–377. [Google Scholar] [CrossRef]
- Sharaby, Y.; Rodríguez-Martínez, S.; Oks, O.; Pecellin, M.; Mizrahi, H.; Peretz, A.; Brettar, I.; Höfle, M.G.; Halpern, M. Temperature-Dependent Growth Modeling of Environmental and Clinical Legionella pneumophila Multilocus Variable-Number Tandem-Repeat Analysis (MLVA) Genotypes. Appl. Environ. Microbiol. 2017, 83, e03295-16. [Google Scholar] [CrossRef] [Green Version]
- Cassard, H.; Denholm, P.; Ong, S. Technical and economic performance of residential solar water heating in the United States. Renew. Sustain. Energy Rev. 2011, 15, 3789–3800. [Google Scholar] [CrossRef]
- Jaisankar, S.; Ananth, J.; Thulasi, S.; Jayasuthakar, S.T.; Sheeba, K.N. A comprehensive review on solar water heaters. Renew. Sustain. Energy Rev. 2011, 15, 3045–3050. [Google Scholar] [CrossRef]
- National Research Council (US) Safe Drinking Water Committee. The Disinfection of Drinking Water; National Academies Press (US): Washington, DC, USA, 1980; Volume 2. [Google Scholar]
- Kusnetsov, J.; Iivanainen, E.; Elomaa, N.; Zacheus, O.; Martikainen, P.J. Copper and silver ions more effective against Legionellae than against mycobacteria in a hospital warm water system. Water Res. 2001, 35, 4217–4225. [Google Scholar] [CrossRef]
- Chen, Y.S.; Lin, Y.E.; Liu, Y.C.; Huang, W.K.; Shih, H.Y.; Wann, S.R.; Lee, S.S.; Tsai, H.C.; Li, C.H.; Chao, H.L.; et al. Efficacy of point-of-entry copper–silver ionisation system in eradicating Legionella pneumophila in a tropical tertiary care hospital: Implications for hospitals contaminated with Legionella in both hot and cold water. J. Hosp. Infect. 2008, 68, 152–158. [Google Scholar] [CrossRef]
- Cloutman-Green, E.; Barbosa, V.L.; Jimenez, D.; Wong, D.; Dunn, H.; Needham, B.; Ciric, L.; Hartley, J.C. Controlling Legionella pneumophila in water systems at reduced hot water temperatures with copper and silver ionization. Am. J. Infect. Control 2019. [Google Scholar] [CrossRef] [Green Version]
- Stüken, A.; Haverkamp, T.H.A.; Dirven, H.A.A.M.; Gilfillan, G.D.; Leithaug, M.; Lund, V. Microbial Community Composition of Tap Water and Biofilms Treated with or without Copper-Silver Ionization. Environ. Sci. Technol. 2018, 52, 3354–3364. [Google Scholar] [CrossRef] [Green Version]
- Lin, Y.E.; Stout, J.E.; Yu, V.L. Controlling Legionella in Hospital Drinking Water: An Evidence-Based Review of Disinfection Methods. Infect. Control Hosp. Epidemiol. 2011, 32, 166–173. [Google Scholar] [CrossRef] [Green Version]
- Water Supply (Water Quality) Regulations. 2018. Available online: https://www.legislation.gov.uk/wsi/2018/647/contents/made (accessed on 26 July 2020).
- Marchesi, I.; Ferranti, G.; Bargellini, A.; Marchegiano, P.; Predieri, G.; Stout, J.E.; Borella, P. Monochloramine and chlorine dioxide for controlling Legionella pneumophila contamination: Biocide levels and disinfection by-product formation in hospital water networks. J. Water Health 2013, 11, 738–747. [Google Scholar] [CrossRef] [Green Version]
- García, M.T.; Baladrón, B.; Gil, V.; Tarancon, M.L.; Vilasau, A.; Ibañez, A.; Elola, C.; Pelaz, C. Persistence of chlorine-sensitive Legionella pneumophila in hyperchlorinated installations. J. Appl. Microbiol. 2008, 105, 837–847. [Google Scholar] [CrossRef]
- Srinivasan, A.; Bova, G.; Ross, T.; Mackie, K.; Paquette, N.; Merz, W.; Perl, T.M. A 17-month evaluation of a chlorine dioxide water treatment system to control Legionella species in a hospital water supply. Infect. Control Hosp. Epidemiol. 2003, 24, 575–579. [Google Scholar] [CrossRef] [Green Version]
- Miyamoto, M.; Yamaguchi, Y.; Sasatsu, M. Disinfectant effects of hot water, ultraviolet light, silver ions and chlorine on strains of Legionella and nontuberculous mycobacteria. Microbios 2000, 101, 7–13. [Google Scholar]
- Sidari, F.P., III; Stout, J.E.; Vanbriesen, J.M.; Bowman, A.M.; Grubb, D.; Neuner, A.; Wagener, M.M.; Yu, V.L. Keeping Legionella out of water systems. J. Am. Water Work. Assoc. 2004, 96, 111–119. [Google Scholar] [CrossRef]
- Zhang, Z.; McCann, C.; Stout, J.E.; Piesczynski, S.; Hawks, R.; Vidic, R.; Victor, L.Y. Safety and efficacy of chlorine dioxide for Legionella control in a hospital water system. Infect. Control Hosp. Epidemiol. 2007, 28, 1009–1012. [Google Scholar] [CrossRef] [Green Version]
- Trop Skaza, A.; Beskovnik, L.; Storman, A.; Ursic, S.; Groboljsek, B.; Kese, D. Outbreak of Legionnaires’ disease in a nursing home, Slovenia, August 2010: Preliminary report. Eur. Commun. Dis. Bull. 2010, 15, 19672. [Google Scholar]
- Darelid, J.; Löfgren, S.; Malmvall, B.E. Control of nosocomial Legionnaires’ disease by keeping the circulating hot water temperature above 55 °C: Experience from a 10-year surveillance programme in a district general hospital. J. Hosp. Infect. 2002, 50, 213–219. [Google Scholar] [CrossRef]
- Liu, Z.; Stout, J.E.; Tedesco, L.; Boldin, M.; Hwang, C.; Yu, V.L. Efficacy of ultraviolet light in preventing Legionella colonization of a hospital water distribution system. Water Res. 1995, 29, 2275–2280. [Google Scholar] [CrossRef]
- Kim, B.R.; Anderson, J.E.; Mueller, S.A.; Gaines, W.A.; Kendall, A.M. Literature review—Efficacy of various disinfectants against Legionella in water systems. Water Res. 2002, 36, 4433–4444. [Google Scholar] [CrossRef]
- Danish Energy Agency. Denmark’s National Energy Efficiency Action Plan (NEEAP); Danish Energy Agency: København, Denmark, 2015. Available online: https://ec.europa.eu/energy/sites/ener/files/dk_neeap_2017_en.pdf (accessed on 26 July 2020).
- The Chartered Institution of Building Services Engineers. CIBSE Guide F: Energy Efficiency in Buildings (2012); Chartered Institution of Building Services Engineers: London, UK, 2016. [Google Scholar]
- Building Research Establishment (BRE). SBEM—Scottish and English Comparison. Directorate for the Built Environment: Garston; Building Research Establishment: Watford, UK, 2009. [Google Scholar]
- Scottish House Condition Survey: 2017 Key Findings. The Scottish House Condition Survey Team; National Statistics: Edinburgh, UK, 2018.
- Ministry of Housing Communities and Local Government. English Housing Survey 2017–18; Ministry of Housing Communities and Local Government: London, UK, 2019.
- Welsh Government. Welsh Housing Conditions Survey 2017–18. 2018. Available online: https://gov.wales/welsh-housing-conditions-survey (accessed on 28 June 2020).
- Northern Ireland Housing Executive. Northern Ireland House Condition Survey 2017; National Statistics, Ed.; Northern Ireland Housing Executive: Belfast, UK, 2018. [Google Scholar]
- Tofield, B. Delivering A Low-Energy Building; University of East Anglia: Norwich, UK, 2012. [Google Scholar]
- Tunzi, M.; Østergaard, D.S.; Svendsen, S.; Boukhanouf, R.; Cooper, E. Method to investigate and plan the application of low temperature district heating to existing hydraulic radiator systems in existing buildings. Energy 2016, 113, 413–421. [Google Scholar] [CrossRef]
- Heating Load in Passive Houses. Available online: https://passipedia.org/basics/building_physics_-_basics/heating_load (accessed on 6 June 2019).
- Bere, J. An Introduction to Passive House; RIBA Publishing: London UK, 2013. [Google Scholar]
- Østergaard, D.S.; Svendsen, S. Case study of low-temperature heating in an existing single-family house—A test of methods for simulation of heating system temperatures. Energy Build. 2016, 126, 535–544. [Google Scholar] [CrossRef] [Green Version]
- Volkova, A.; Krupenski, I.; Pieper, H.; Ledvanov, A.; Latõšov, E.; Siirde, A. Small low-temperature district heating network development prospects. Energy 2019, 178, 714–722. [Google Scholar] [CrossRef]
- Li, D.H.W.; Yang, L.; Lam, J.C. Zero energy buildings and sustainable development implications—A review. Energy 2013, 54, 1–10. [Google Scholar] [CrossRef]
- Hansen, C.H.; Gudmundsson, O.; Detlefsen, N. Cost efficiency of district heating for low energy buildings of the future. Energy 2019, 177, 77–86. [Google Scholar] [CrossRef]
- Brand, M.; Svendsen, S. Renewable-based low-temperature district heating for existing buildings in various stages of refurbishment. Energy 2013, 62, 311–319. [Google Scholar] [CrossRef]
- Gong, M.; Werner, S. Exergy analysis of network temperature levels in Swedish and Danish district heating systems. Renew. Energy 2015, 84, 106–113. [Google Scholar] [CrossRef]
- Harrestrup, M.; Svendsen, S. Changes in heat load profile of typical Danish multi-storey buildings when energy-renovated and supplied with low-temperature district heating. Int. J. Sustain. Energy 2015, 34, 232–247. [Google Scholar] [CrossRef]
- Østergaard, D.; Svendsen, S. Space heating with ultra-low-temperature district heating – a case study of four single-family houses from the 1980s. Energy Procedia 2017, 116, 226–235. [Google Scholar] [CrossRef]
- Østergaard, D.S.; Svendsen, S. Theoretical overview of heating power and necessary heating supply temperatures in typical Danish single-family houses from the 1900s. Energy Build. 2016, 126, 375–383. [Google Scholar] [CrossRef] [Green Version]
- Østergaard, D.S.; Svendsen, S. Replacing critical radiators to increase the potential to use low-temperature district heating—A case study of 4 Danish single-family houses from the 1930s. Energy 2016, 110, 75–84. [Google Scholar] [CrossRef] [Green Version]
- Østergaard, D.S.; Svendsen, S. Costs and benefits of preparing existing Danish buildings for low-temperature district heating. Energy 2019, 176, 718–727. [Google Scholar] [CrossRef]
- Hasan, A.; Kurnitski, J.; Jokiranta, K. A combined low temperature water heating system consisting of radiators and floor heating. Energy Build. 2009, 41, 470–479. [Google Scholar] [CrossRef]
- Chartered Institution of Building Services Engineers (CIBSE). Heating: CIBSE guide B1: 2016; CIBSE: England, UK, 2016. [Google Scholar]
- Parsloe, C. Dealing with ultra low flow rates. Available online: https://www.parsloeconsulting.co.uk/ultra-low-flow-rates/ (accessed on 6 October 2019).
- Department of Energy and Climate Change. Research into Barriers to Deployment of District Heating Networks; Department of Energy and Climate Change: London, UK, 2013.
- Cole, C. Heat Loss Headaches. Available online: https://carbonlimited.co.uk/2017/03/20/heat-network-losses/ (accessed on 6 November 2019).
- The Chartered Institution of Building Services Engineers (CIBSE); The Association for Decentralised Energy (ADE). Heat Networks: Code of Practice for the UK; CIBSE: London, UK, 2017. [Google Scholar]
- Zhou, S.; O’Neill, Z.; O’Neill, C. A review of leakage detection methods for district heating networks. Appl. Therm. Eng. 2018, 137, 567–574. [Google Scholar] [CrossRef]
- Von Jeinsen, I. Age of district heating networks causes worries: How leakages do not become incalculable risks. Eur. Power/Fernwarme Int. 2009, 38, 54–56. [Google Scholar]
- Andersson, S. Expansion Compensation in District Heating Pipes—Via Axial Compensators, Expansion Arcs, or Both? Fernwarme Int. 1984, 13, 307–309. [Google Scholar]
- Zorc, B.; Kosec, B.; Kosec, L.; Nagode, A. Analysis of hot water pipeline system leakage. Eng. Fail. Anal. 2013, 28, 78–81. [Google Scholar] [CrossRef]
- LaQue, F.L.; Copson, H.R. Corrosion Resistance of Metals and Alloys, 2nd ed.; Chapman & Hall: London, UK; New York, NY, USA, 1963. [Google Scholar]
- Davis, J.R. Corrosion: Understanding the Basics; ASM International: Almere, The Netherlands, 2000. [Google Scholar]
- Wojdyga, K.; Chorzelski, M. Chances for Polish district heating systems. Energy Procedia 2017, 116, 106–118. [Google Scholar] [CrossRef]
- Werner, S. District Heating and Cooling; Elsevier: New York, NY, USA, 2017; pp. 841–848. [Google Scholar]
- MacLean, K.; Gross, R.; Hannon, M.; Parrish, B.; Rhodes, A. Energy System Crossroads—Time for Decisions. UK 2030 Low Carbon Scenarios and Pathways: Key Decision Points for A Decarbonised Energy System; Imperial College: London, UK, 2015. [Google Scholar] [CrossRef]
- Johnston, D.; Lowe, R.; Bell, M. An exploration of the technical feasibility of achieving CO2 emission reductions in excess of 60% within the UK housing stock by the year 2050. Energy Policy 2005, 33, 1643–1659. [Google Scholar] [CrossRef]
- Love, J.; Smith, A.Z.P.; Watson, S.; Oikonomou, E.; Summerfield, A.; Gleeson, C.; Biddulph, P.; Chiu, L.F.; Wingfield, J.; Martin, C.; et al. The addition of heat pump electricity load profiles to GB electricity demand: Evidence from a heat pump field trial. Appl. Energy 2017, 204, 332–342. [Google Scholar] [CrossRef]
- Wilson, I.A.G.; Rennie, A.J.R.; Ding, Y.; Eames, P.C.; Hall, P.J.; Kelly, N.J. Historical daily gas and electrical energy flows through Great Britain’s transmission networks and the decarbonisation of domestic heat. Energy Policy 2013, 61, 301–305. [Google Scholar] [CrossRef] [Green Version]
- Energy, O. Decarbonising Heat: Expert Meeting; University of Oxford: Oxford, UK, 2016. [Google Scholar]
- Boßmann, T.; Staffell, I. The shape of future electricity demand: Exploring load curves in 2050s Germany and Britain. Energy 2015, 90, 1317–1333. [Google Scholar] [CrossRef]
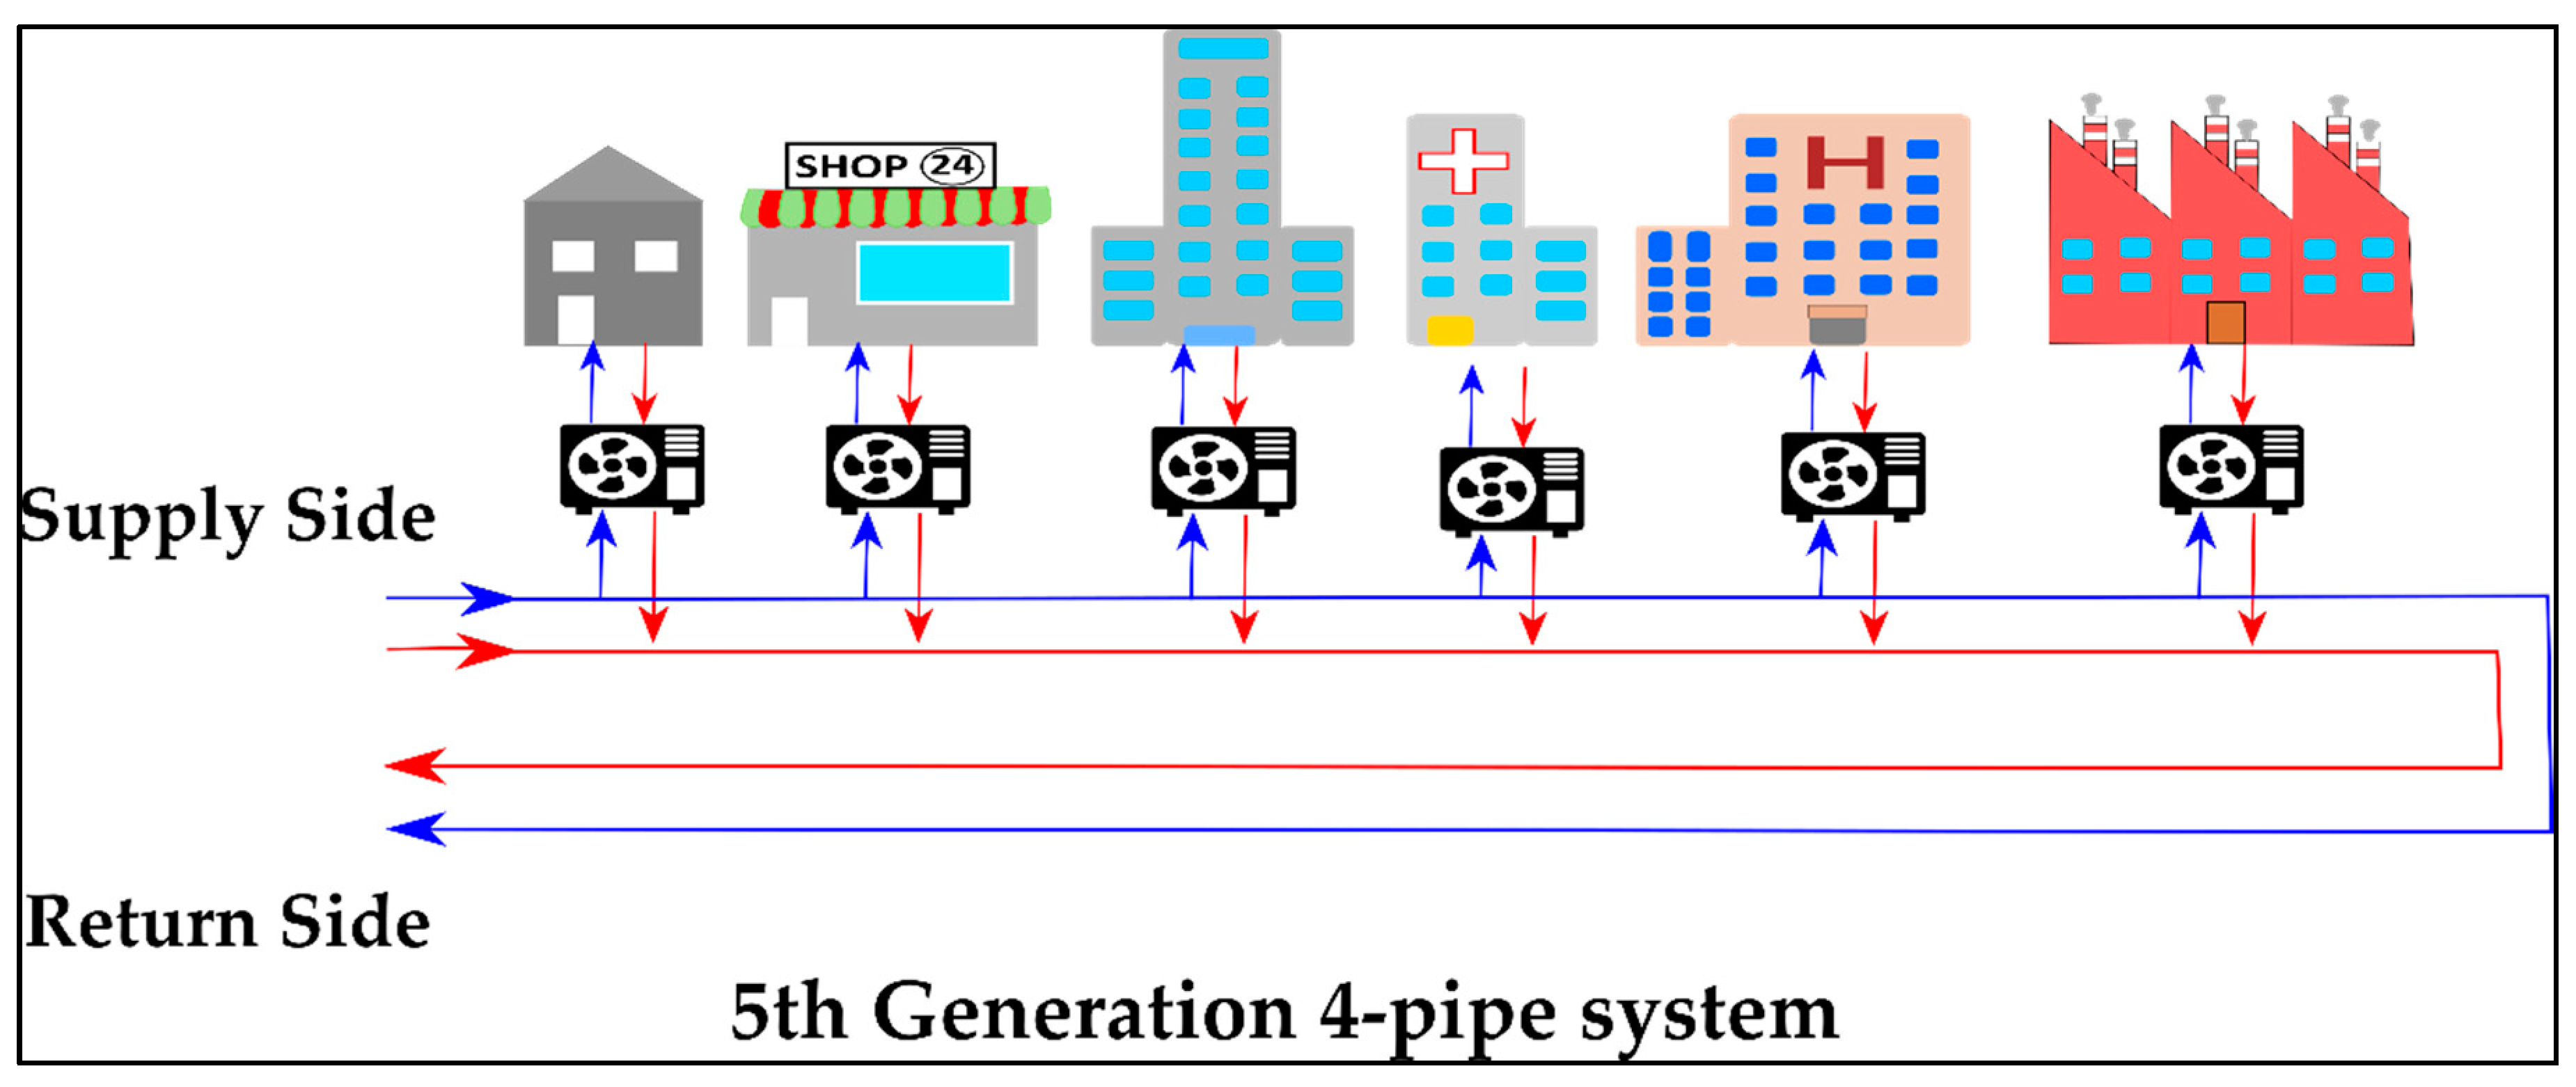
Figure 1.
5th generation heat network with 4-pipe system. This system shows a variety of users accepting and rejecting heating and cooling into a 4-pipe system. This would operate at lower heating supply/higher cooling supply than traditional DHC loops, the primary energy source is supported from internal gains being offset to the network, and maintains a return pipe.

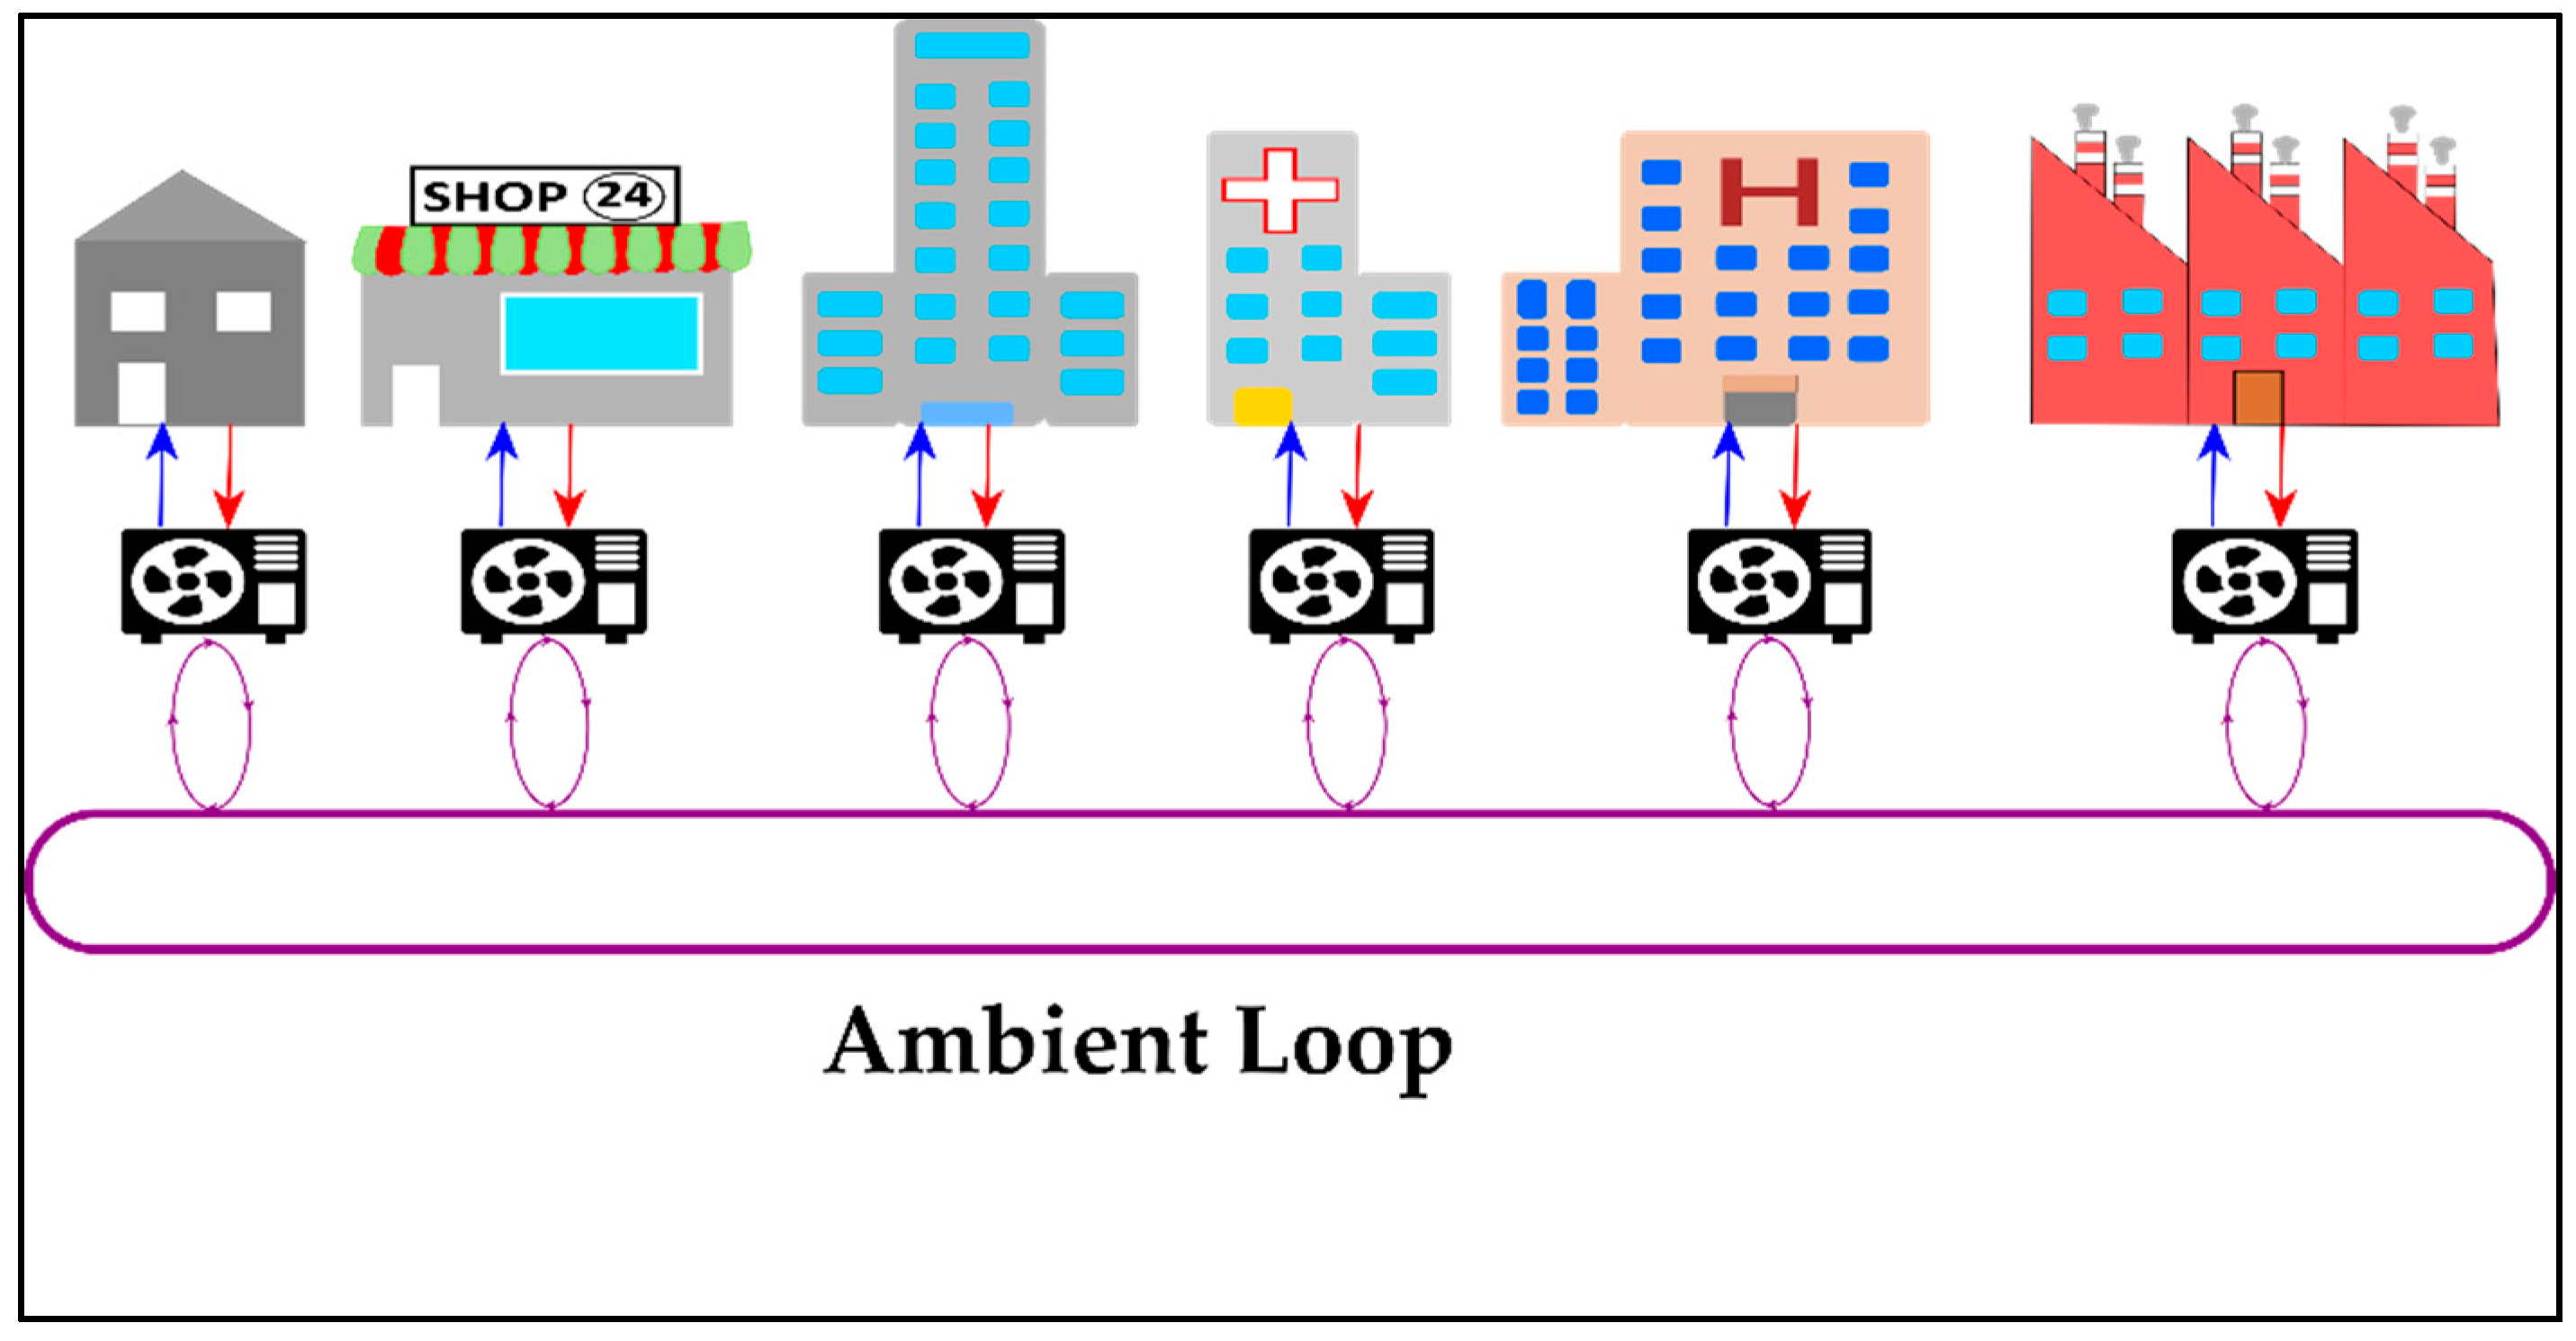
Figure 2.
5th generation ambient loop DHC network. The purple loop operates between 10–25 °C and allows a source of both heating and cooling. Mixed users balance energy loads across the network, with little external heat supply. Where external supply is necessary, it can be taken from natural resources e.g., shallow borehole, mine workings etc.

Figure 3.
Traditional heating and cooling network, shown for comparison. Users have no ability to reciprocate energy across the network and are based on a purely consumer driver market.
Figure 3.
Traditional heating and cooling network, shown for comparison. Users have no ability to reciprocate energy across the network and are based on a purely consumer driver market.

Figure 4.
Comparison of diversity factors applied for water flow sizing, including DS 439, DIN 1988, BS6700, BSEN806-3 and CP1.2 Space Heating. BS6700 (orange) is clearly much higher than alternative methods for DHW, leading to oversizing. CP1.2 for space heat is higher again, which is to be expected.

Figure 5.
Heat loss per length of installed pipework from measured data.

Figure 6.
Graph of installed cost per kW thermal compared with capacity. The installed cost of CHP per kW is typically far less than that of a heat pump, yet gas boilers are even cheaper per kW but do not significantly reduce as capacity increase [33].
Figure 6.
Graph of installed cost per kW thermal compared with capacity. The installed cost of CHP per kW is typically far less than that of a heat pump, yet gas boilers are even cheaper per kW but do not significantly reduce as capacity increase [33].

Figure 7.
Diagram of Legionella growth temperature dependence.

Figure 8.
EPC Band of Domestic housing stock for 2017 based on SAP 2012.

Figure 9.
Measured energy performance compared with certified EPC rating.

Figure 10.
Example of extreme pipe pitting corrosion.

Figure 11.
Source of heat loss from carrier fluid leakage [93].
Figure 11.
Source of heat loss from carrier fluid leakage [93].

Figure 12.
Graph of carbon equivalent predictions for UK electrical grid electricity, natural gas and heat pumps. Heat pump figure based on a CoP of 2.9.
Figure 12.
Graph of carbon equivalent predictions for UK electrical grid electricity, natural gas and heat pumps. Heat pump figure based on a CoP of 2.9.

Figure 13.
UK Load duration curve of electrical demand for December 2016.


| Prevention Method | Advantages | Disadvantages |
|---|---|---|
| Chlorine Dioxide |
|
|
| Super-heat-and-flush |
|
|
| UV Light |
|
|
| Copper/Silver ionization |
|
|
Table 2.
Summary of Distribution Loss Reduction Methods.
| Measures to Reduce Distribution Losses | |||
|---|---|---|---|
| Measure | Description | The Good | The Bad |
| Reduce Supply Temperature | Lowering the supply temperature has been shown to be energetically favourable The supply temperature to the grid is reduced. |
|
|
| Increase supply/return difference | A greater difference will give better utilization of heat produced and reduce losses in the return pipe. |
|
|
| Design for smaller Pipe Sizing | The developed design should use the smallest pipe size possible, while considering the balance between smaller pipes and greater pumping costs. |
|
|
| Network Structure—Reduce network length | Reducing length will reduce heat losses |
|
|
| Network Structure—Smart user placement | By placing large demand users at the start of the network, high grade heat is delivered to larger users and lower grade to lower users. |
| |
| Reduce Water Leakage | Leaking pipes can cause significant heat loss |
|
|
Publisher’s Note: MDPI stays neutral with regard to jurisdictional claims in published maps and institutional affiliations. |
© 2020 by the authors. Licensee MDPI, Basel, Switzerland. This article is an open access article distributed under the terms and conditions of the Creative Commons Attribution (CC BY) license (http://creativecommons.org/licenses/by/4.0/).
Share and Cite
MDPI and ACS Style
Millar, M.-A.; Elrick, B.; Jones, G.; Yu, Z.; Burnside, N.M. Roadblocks to Low Temperature District Heating. Energies 2020, 13, 5893. https://0-doi-org.brum.beds.ac.uk/10.3390/en13225893
AMA Style
Millar M-A, Elrick B, Jones G, Yu Z, Burnside NM. Roadblocks to Low Temperature District Heating. Energies. 2020; 13(22):5893. https://0-doi-org.brum.beds.ac.uk/10.3390/en13225893
Chicago/Turabian StyleMillar, Michael-Allan, Bruce Elrick, Greg Jones, Zhibin Yu, and Neil M. Burnside. 2020. "Roadblocks to Low Temperature District Heating" Energies 13, no. 22: 5893. https://0-doi-org.brum.beds.ac.uk/10.3390/en13225893
Note that from the first issue of 2016, this journal uses article numbers instead of page numbers. See further details here.