Competition in Power Generation: Ex-ante Analysis of Indonesia’s Electricity Market


1
PLN Research Institute, PT. PLN (Persero), Jakarta 12760, Indonesia
2
School of Business and Management, Institut Teknologi Bandung, Bandung 40132, Indonesia
3
School of Electrical Engineering and Informatics, Institut Teknologi Bandung, Bandung 40132, Indonesia
*
Author to whom correspondence should be addressed.
Energies 2020, 13(24), 6741; https://0-doi-org.brum.beds.ac.uk/10.3390/en13246741
Submission received: 15 November 2020
/
Revised: 14 December 2020
/
Accepted: 17 December 2020
/
Published: 21 December 2020
(This article belongs to the Special Issue Energy Policy and Policy Implications 2020)
Abstract
:This research optimises the mix and structure of Generation Companies (GenCos) in the Sumatra power system, Indonesia. Market power, indicating the ability to raise prices profitably above the competitive level, tends to be a significant problem in the aftermath of electricity market restructuring. In the process of regulatory reform and the development of competitive electricity markets, it is desirable and practical to establish an efficient number of competitor GenCos. Simulations of a power system account for multi-plant mergers of GenCos subject to a regulatory measure of the Residual Supply Index and the influence of direct current load flow and the topology of the system. This study simulates the Sumatra power system in order to determine the following: optimal market structure, efficient GenCo generation mix, and the optimal number of competitive GenCos. Further, this study seeks to empirically optimise the electricity generation mix and electricity market structure of the Sumatra power system using DC load flow optimisation, market power index, and multi-plant monopoly analysis. The simulations include generation and transmission constraints to represent network constraints. This research is the first to analyse the Sumatra power system using imperfect (Cournot) competition modelling. Furthermore, this study is the first kind to optimise the mix and structure of the Sumatra generation power market. The guidelines and methodology in this research can be implemented in other countries characterised by a monopoly electricity utility company.
1. Introduction
Based on business segmentation and operation, the electricity industry can be divided into generation, transmission, distribution, and retail segments. Prior to the 1980s, monopoly ownership was believed to be the appropriate model in the electricity market due to the argument that single ownership would help operational coordination between the different segments. It was also believed that one generation company (GenCo) producing the electricity would produce output at a lower price since the average cost would decline with more significant power production. A significant proportion of the extant literature on studies into monopoly strengthened the monopoly argument, stating that competition was more like a nonsense statement when discussing economic work [1]. Thus, before the late 1980s, the electricity market structure operated under a monopoly structure in the form of either a state-owned company or a private corporation with regulated monopolies [2].
In light of electricity market restructuring in the 1980s, electricity market reforms started questioning the market efficiency and performance delivered by the monopoly company, state or private-owned. The motives to reform in developed countries came from a number of intentions: (1) to increase industry efficiency; (2) reduce the inefficient investment of generation and transmission expansion; (3) increase customer choice for electricity services; (4) apply new technology, i.e., CCGT; (5) expand the regional electricity market into a trans-border market [3]. In contrast, by examining 25 years of United States (US) electricity market restructuring, [4] argued that the ultimate reason underlying restructuring was not to improve generator efficiency but to shift rent. The electricity price is influenced more by externals factors, e.g., natural gas price and power plant technology, rather than efficiency deriving from the restructuring itself. However, it is proven by the study in [4] that electricity market restructuring does bring efficiency in power plant operation and investment and power system operation improvement in the market.
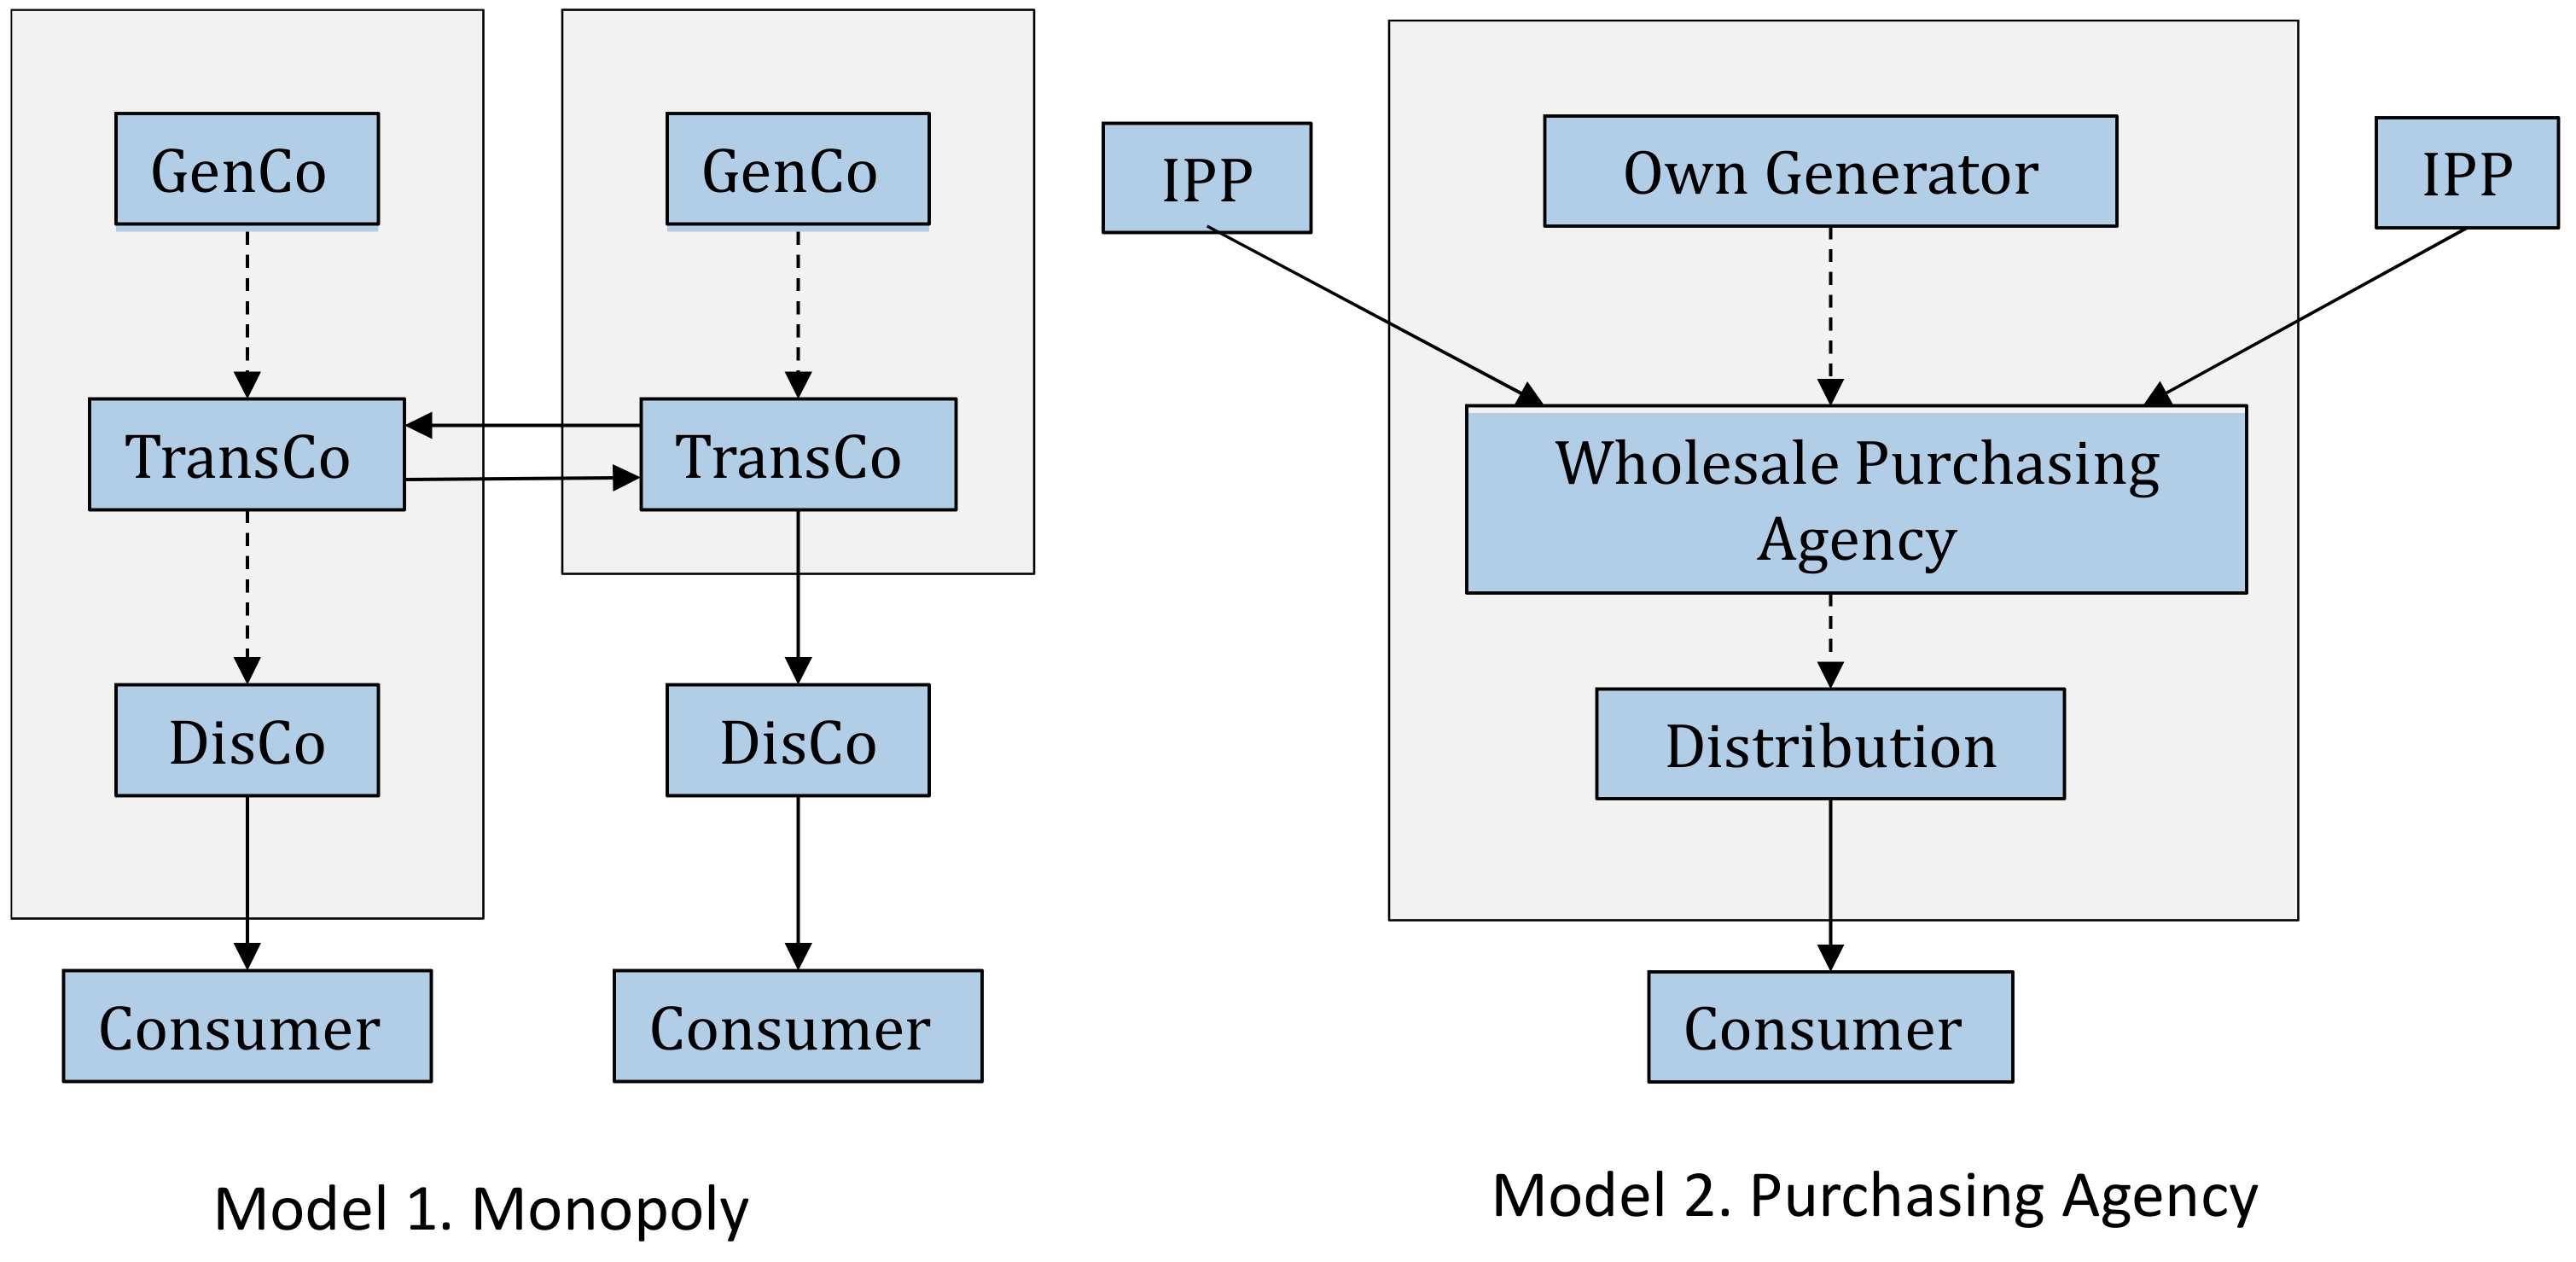
Developing and emerging countries are determined to attract investment from international investors since state-owned companies typically cannot support the level of planned expansion investment by themselves. On the one hand, based on the studies in [3,5], the factors underpinning electricity market reforms in emerging/developing countries are the poor performance of the utility company, the energy subsidy burden, and high power system losses. On the other hand, [6] stated that the reassurance to conduct market reform originated from international donor organisations, e.g., the International Monetary Fund (IMF) and the World Bank. Due to the scale of economics and the nature of electrical energy as a commodity, the transmission and distribution industry is categorised as a natural monopoly. The competition in these sectors could result in inefficient investment, which originated from the duplication of transmission and distribution systems [6]. In contrast, the generation business could be treated as a competitive market [6,7]. Hunt, in [7], explained that the traditional reasoning underpinning economies of scale no longer holds, as the design of trading arrangements, which have worked in real implementation to replace internal coordination, has made competition in the generation business possible. The studies in [7,8] categorised the electricity market model into four categories, namely monopoly (model 1), purchasing agency (model 2), wholesale (model 3), and retail (model 4).
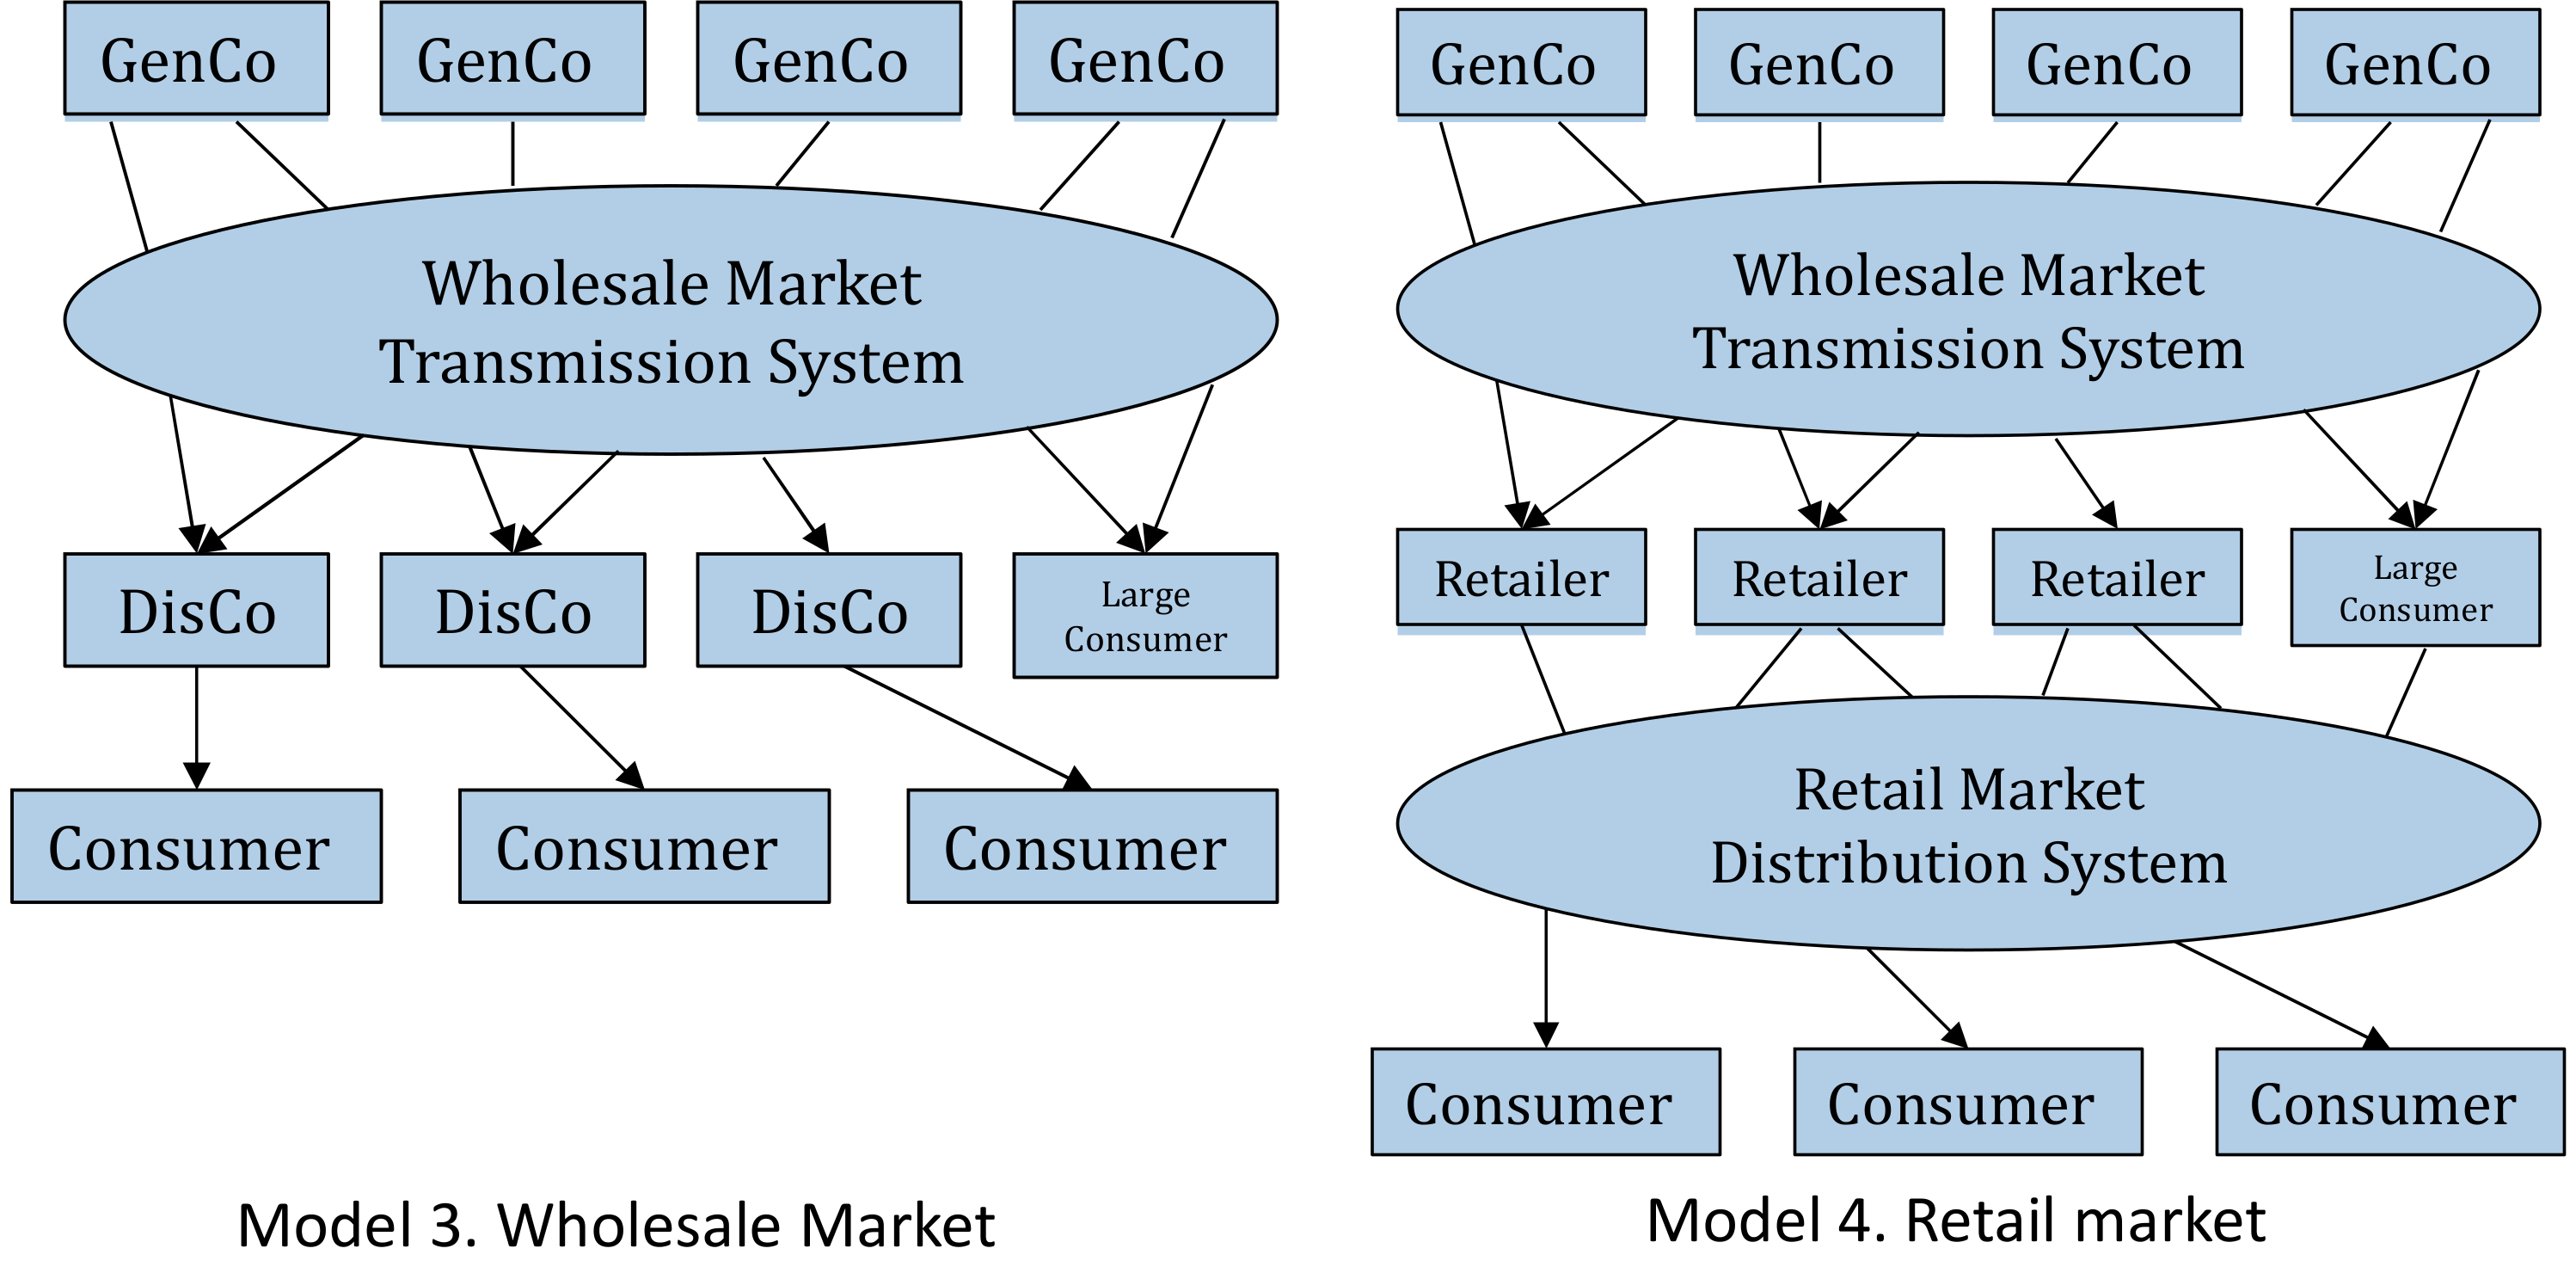
Kirschen in [8] explained that privatisation was not a requirement for the introduction of competition. None of the four models of competition described above implies a particular form of ownership. State-owned electricity companies can and, in numerous cases, do compete with private companies. The interplay of supply and demand in the wholesale market affects the price equilibrium. Fundamentally, the breakdown of a single entity GenCo into several competitive GenCos underpinned the early steps of sound electricity market reform [3]. Figure 1 shows the monopoly and purchasing agency models, while Figure 2 shows the wholesale and retail models following [7,8].
This research will answer the following research question: What is the optimal market structure and generation technology mix in the oligopoly electricity market model with the objective to minimise market power exercise from the potential pivotal player? This research question will be answered by implementing perfect competition and Cournot competition and applying the Residual Supply Index (RSI) as market power mitigation. This research simulates the effect of electricity market restructuring in the Indonesia power generation market. Therefore, this study focuses on determining the optimal market structure, efficient generation mix in the GenCos, and efficient number of competitive GenCos by using the Sumatra power system as a case study. The Indonesia power system consists of two primary power systems, i.e., Sumatra and the Java–Bali power system. This research adopts the ten nodes stylised model for the Sumatra power system by incorporating generation, transmission, and power system stability constraints.
Further, this study implements the preventive approach in electricity market restructuring, thus contributing to the extant body of literature on electricity market modelling and market power studies. This is essential for Indonesia when the market restructuring occurs. This paper is organised as follows: Section 1 provides the research background, research question, objective, and contributions of the study. Section 2 sets out the literature review. Section 3 is an overview of the Indonesia power system, consisting of power generation, transmission, and electricity demand. Section 4 provides the research methodology and modelling of the stylised Sumatra power system. Section 5 explains the result and analysis of the simulations, while Section 6 provides the research limitations and conclusions.
2. Literature Review
2.1. Creating Optimal Market Structure in Electricity Market Restructuring
Creating optimal successor companies from state-owned monopoly electricity company increases competition [3]; increases resource allocation and mitigates unilateral market power [9], increases transparency and efficiency of regulation in the market; reduce inefficient investment from the pre-unbundling company [10]. The optimal and competitive electricity market structure can remove discriminative incentives between competing generators and potential cross-subsidies between regulated and competitive businesses. However, the process of optimising market structure can produce several disadvantages, e.g., lower credit ratings for unbundled companies, and higher transaction costs that resulted in higher transfer payment between agents [11]. Further, market restructuration produces efficiency loss in coordination planning between generation and transmission investment and increases the complexity of the regulatory framework.
It is worth remembering that ownership unbundling in the electricity market is not a panacea [12]. Nonetheless, creating optimal successor companies from a dominant player would be a significant step towards the fully competitive market. Creating optimal successor companies in market restructuring relies on a comprehensive understanding of power system modelling, microeconomics, and competition law. First, the electricity market should be appropriately defined according to technical and legal boundaries. On the one hand, market integration can occur among non-contiguous parts of the grid. On the other hand, market disintegration occurs for isolated power systems, although such a market having applied identical competition policy. The application of different competition laws results in the distinctive use of network code and guidelines.
Second, a lot depends upon political will with the objective of creating an energy sector without significant market power by applying precise and proven policies. The key actions are to form the competition agency, separate transmission from generation business, solve market power within a country, increase cross-border transmission capacity by investment, and by better coordination [12]. The third fundamental is the accuracy of the power system modelling that is based on optimal nodal pricing to create optimal successor companies. Nodal pricing provides several advantages to the market agents: increasing market welfare, providing proper investment signals to the generator, and ignoring bypass issues, i.e., the opportunity to leave the market if the price is not equal to marginal cost [11]. In the England and Wales market, the spatial market is not introduced at divestiture, which causes inefficiency and market power. The competition policy and institution in a proper bidding and spatial market were instituted post-privatisation through demand-side bidding and spatial pricing established in the New Electricity Trading Agreement (NETA).
Finally, market policy enforcement in electricity competition law to create optimal successor companies is crucial due to a typical behaviour of power markets: high concentration in the upstream market, low demand elasticity, and congestion in the transportation market. There are two basic approaches to market power policy: to force structural changes in the market structure and to enact market power mitigation (an example of market power mitigation is the Merger Guidelines by the European Community (EC) and the Horizontal Merger Guidelines (HMG) by Federal Energy Regulatory Commission (FERC) in 2010. Both EC and FERC Merger Guidelines quantify the potential market price increase from the merger by applying Herfindahl-Hirschman Index (HHI) as a market power index. FERC applies HHI to a post-merger threshold of 2500 while the EC applies 2000 as the threshold for required investigation [13,14] in the form of uncompetitive behaviour restriction [15]. The market policy authority needs a significant degree of understanding in market power limitation and threshold to impose competitive behaviour. Additionally, the sensitivity of criteria that stimulate market power is significantly necessary to achieve the ideal market design. Changes in transmission congestion, a threshold in price bidding, and reserve margin cap are the criterion examples that the regulator should examine carefully.
2.2. Preventive Competition Law in Creating Optimal Electricity Market Structure
Stigler in [1] related the importance of economic-focused studies to antitrust policy, explaining as far back as 1890, the concept of competition is “… more a loose description of economic behaviour than an analytical concept. In no sense was the supremacy of competition challenged by the then small, emerging literature on monopoly.” In the essay [1], Stigler explained that the corpus of price theory played a significant role in influencing the perspective of the economist. In other words, competition policy is firmly influenced by the “… good part of the strong virtues we attach to competitive markets and incidence” [1] (p. 18). Antitrust law was designed to promote competition among players in the market. Thus, the purpose of the provision is to decrease prices and increase customer welfare.
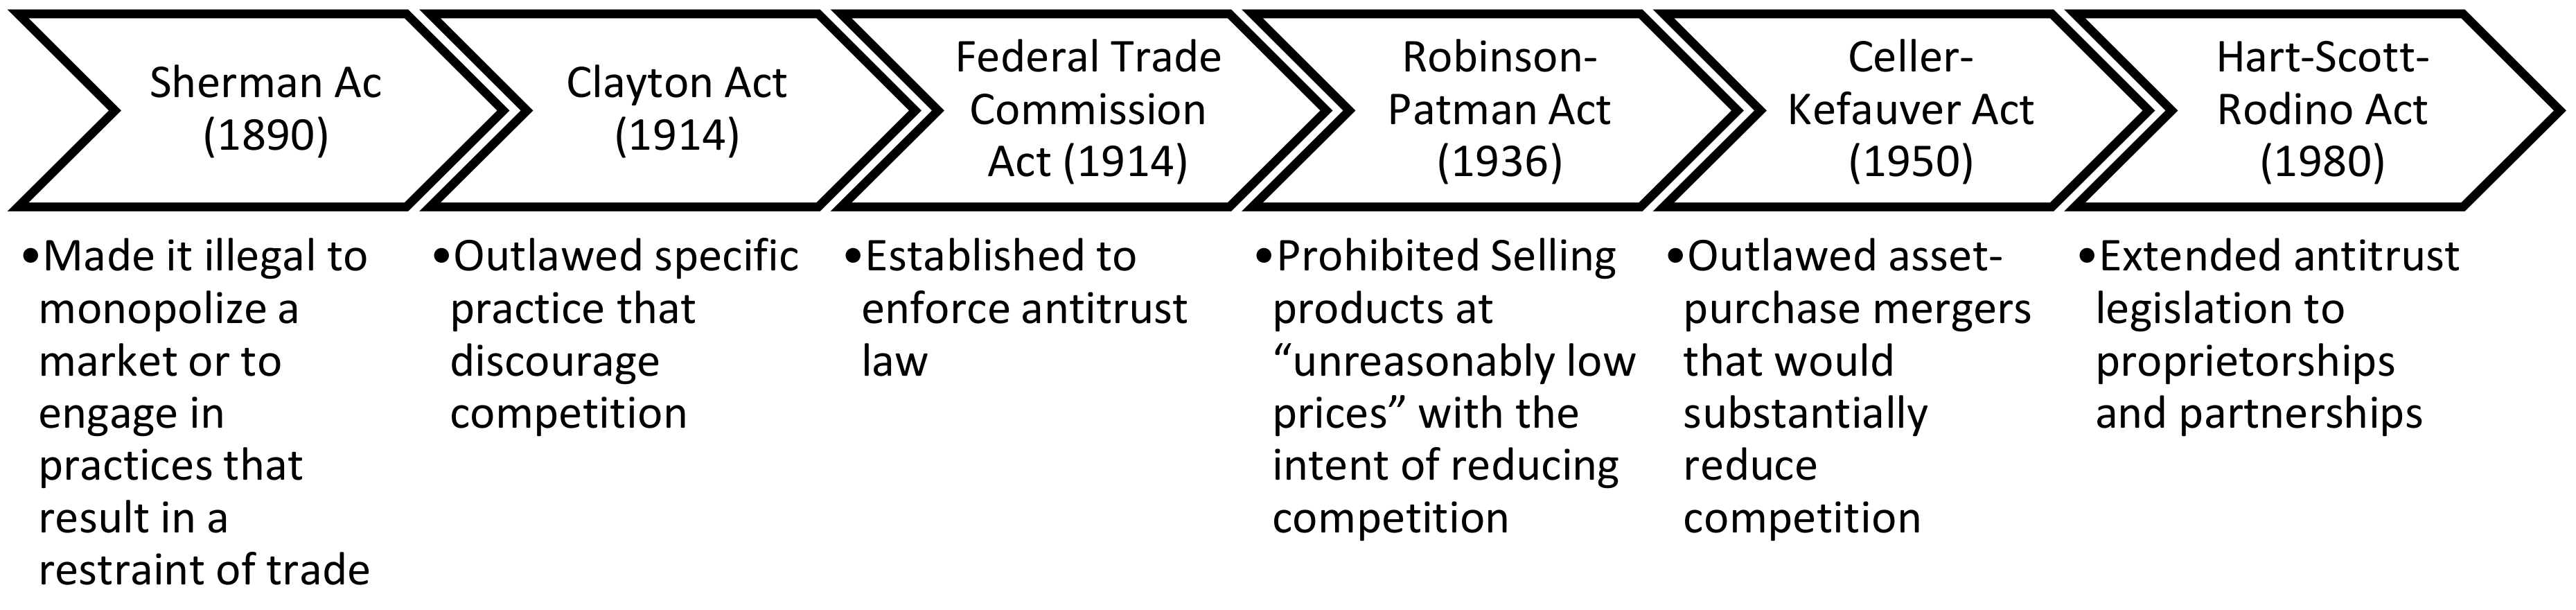
Stigler in [16] explained the different distinctions of antitrust law using two legal instrument categories, i.e., the preventive and corrective antitrust law. In principle, antitrust policy in the US, Stigler argued, is traditionally corrective rather than preventive (See Figure 3); thus, the policy seeks to eliminate monopolistic power already in existence. The system relies on case law developed in a court from antitrust enforcement actions. However, the trial courts and the judges are limited in terms of being able to perform complex economic evaluations. As mentioned in Stigler’s study, it is vital to place the anti-merger statute as the control of mergers in the context of US preventive antitrust policy.
The EC has applied a similar corrective approach regarding competition law, i.e., merger policy to improve the structure of national markets. The approach is to react to the proposed merger and to analyse whether the proposal is better than the status quo. The constraint of this policy is that the EC cannot enforce competitive structure in national markets unless there are proposals for a likely merger. The competition tools in Europe are limited to competition policy rather than regulatory reform since the EU Directive regarding competition is flexible and will not work unless the member state is willing to take action or agree to the directive. These competition tools are insufficient to create a competitive market [12].
Creating a deterrence effect in the market depends on the creation and implementation of antitrust provisions and institutions. Antitrust rules act to guarantee the realisation of legal action and punishment from the illegal action while the antitrust agency has the power to achieve obedience by conducting antitrust action. That is why logical analysis grounding delivered from the economics perspective to antitrust law and policy is pivotal. An economics approach could develop a set of clear and understandable antitrust provisions, and the ability of the trial courts to perform and evaluate antitrust policy design (also the statute developed) should provide clear signals and a framework to the market players regarding allowed and disallowed strategic actions.
The approach in creating optimal antitrust law as in [17] started with the assessment of anti-competitive strategic behaviour from the players in the market. The evaluation is accompanied by market welfare calculations as a basis for antitrust actions. The antitrust rules should be able to detect and intervene on these harmful effects by conducting law enforcement. By identifying and intervening in misconduct behaviours, the antitrust institution also creates a deterrence effect.
Two theories of value underline the microeconomic application in antitrust law. First is a dominant efficiency-based theory of competitive market that prioritises welfare maximisation and resource and efficiency allocation as a primary goal in antitrust policy. The other theory, i.e., competition law based on sanctions, relies on the standard for permissible strategic behaviour, thereby “…promoting economic justice by protecting weaker economic entities (and consumers) from the unrestrained market power of monopolies. Subsequent rules of compensation and sanction follow consistent with the chosen position” [18]. Fines and sanctions play a significant role in enforcing competition law prohibitions.
The study in [19] explained that there are three approaches that sanctions could attribute to antitrust violation prevention: by deterrent effect; by moral effect; by raising the cost of setting up and acting in an anti-competitive manner. The credible threat of committing a violation creates a deterrent effect. The risk of being prosecuted and fined will also have a moral effect on companies in the sense that anti-competitive fines send a law reinforcement message, thus increasing the moral commitment to competition law. Moreover, the circumstance created from the fine, which could increase or decrease the amount of the fine, could raise the cost of anti-competitive behaviour, i.e., setting up and running cartels.
3. Overview of Indonesia Power System
In the Indonesia power system, the electricity business consists of three main classical activities: power generation; transmission; distribution. Power generation is the activity of GenCos to produce electrical energy by converting primary energy sources (i.e., coal. gas, oil, geothermal, hydro, solar, biomass) to electrical power. The transmission system transports electricity from the generation plant to load centres, and the distribution system distributes the electrical energy to consumers. The division of traditional business activities is based on voltage level differentiation. The electricity power flows from a high voltage substation to a lower voltage substation, which determines the arc of load flow. In a restructured electricity market, there are additional business activities that cover the supply of electricity to final consumers, including wholesale and retail marketing activities.
Indonesia’s electricity development plant is set out in The National Electricity Supply Business Plan (Rencana Umum Penyediaan Tenaga Listrik/RUPTL). The aim of RUPTL is to ensure the supply of reliable and sustainable power to consumers. The plan comprises generation expansion planning, electricity demand forecasts, and planning for the transmission–distribution system. Generation planning under RUPTL is based on the least-cost principle and power system reliability optimisation [20,21,22]. The decision by the Indonesia state owned electricity company, i.e., PLN, to build an electric power plant is influenced by: technical studies (i.e., load flow, short circuit and stability analysis); financial studies (i.e., Net Present Value (NPV)); economic studies (i.e., Internal Rate of Return (IRR)); environmental studies [21,22]. The National Electricity Supply Business Plan, as in [21], is planned and reviewed annually to accommodate yearly changes in the assumptions of RUPTL and take into consideration any delays in a power plant’s ability to start selling power. PLN formulates RUPTL based on the specific criteria of the National Electricity Master Plan (Rencana Umum Ketenagalistrikan Nasional/RUKN) from the Ministry of Energy and Mineral Resources.
3.1. Indonesia’s Energy Mix and Power Generation
The total available generational capacity of the Indonesia power system in 2015 was 40,533 MW: The Java Power system is the most extensive (total available capacity 31,815 MW), and the Sumatra power system is the second-largest (total available capacity 6283 MW) [21]. From the largest to smallest share, the Indonesia power system energy mix consists of coal, gas, High-Speed Diesel (HSD), Marine Fuel Oil (MFO), hydro, geothermal, and solar. The system operator dispatches PP based on the characteristics of the generation technology, i.e., baseload PP, intermediate PP, and peaking PP. Based on [23], the Sumatra power system is the most abundant energy source provider for Indonesia, which consists of fossil fuel and renewable energy sources. The total resource capacities (PLN conducted a study in 2012 regarding the potential energy sources in the Sumatra power system. Total resources capacity refers to the potential of energy sources that can be converted to electricity generation, i.e., hydro power plants (run-off river PP) and geothermal power plants. Please see study in [23] for a detailed explanation) in the Sumatra power system for hydro energy are 7642.2 MW, and 11,235 MW for geothermal energy [23].
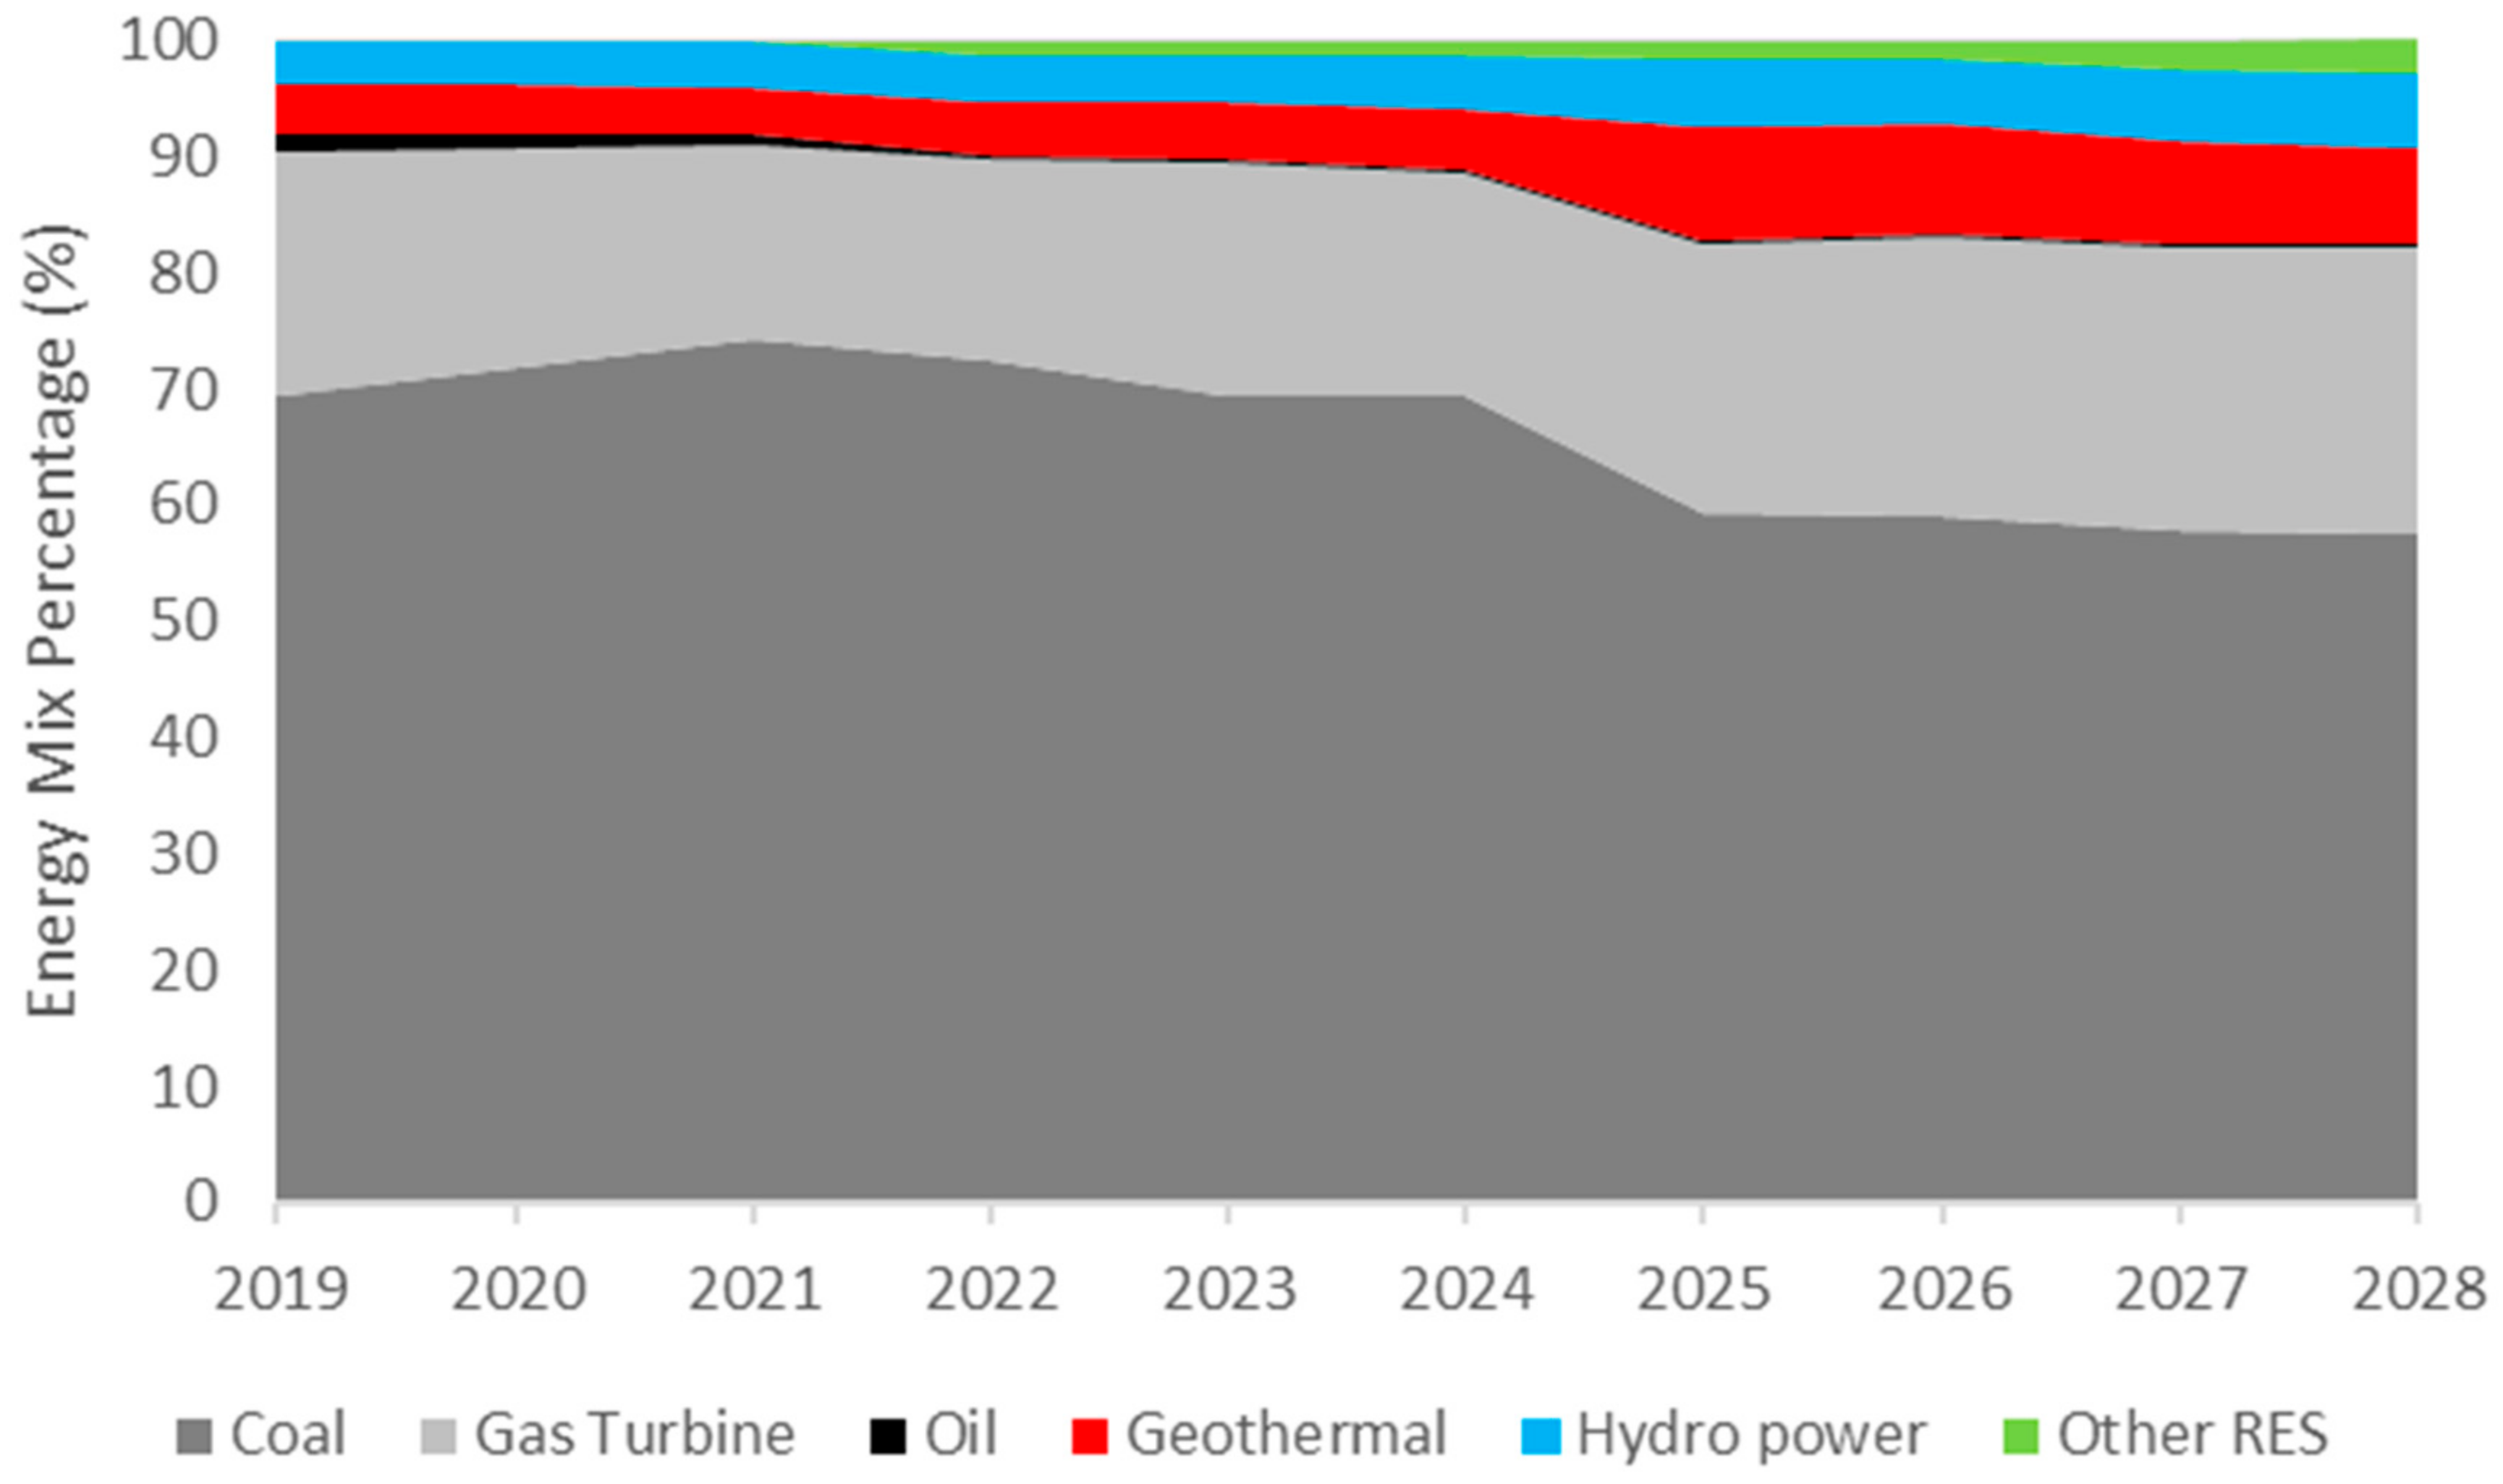
It is clear from Figure 4 that coal-fuel power stations dominate the Indonesia power system as, compared to oil and gas, coal evidently has a lower cost. Thus, coal PP is utilised as baseload generation, resulting in a high capacity factor of coal PPs close to 100%. Gas is the second-largest energy in the fuel mix, playing a critical role as intermediate PP to balance the energy mix. Gas PP and CCGT PP are more flexible in terms of adjusting to electricity demand than coal, hydro (run-off river), and geothermal PP due to having a high ramping rate. According to the ramp-up and ramp-down characteristics and fuel cost profile, the Indonesia power system utilises coal and geothermal PP as baseload PP, gas PP as intermediate PP, and diesel and peaking hydro PP as peak load PP [22].
The Indonesia power system also includes renewable energy sources including biomass, geothermal, hydro, and solar. However, the role of green energy is not as significant as gas and coal according to PLN’s energy system dispatching. This will change, as the Indonesian Government has already committed to more ambitious renewable energy targets: 23% of the total energy mix in 2024 [20,24]. The aim is also for Compressed Natural Gas (CNG) and Liquefied Natural Gas (LNG) replace natural gas utilisation in the power system over time [21].
The merit order (merit order is the power system arrangement of electricity utility to rank the available power generation based on a power plant’s marginal cost. Generation technology with the lowest marginal cost is first to come online) of peaking PP in the Indonesia power system, from the highest to the lowest marginal cost, respectively, is as follows: diesel PP; CNG and LNG gas-fuelled PP; pumped storage PP; run-off river PP (A run-off river power plant is a type of hydropower plant that relies only on water flow from the river to generate electricity. In contrast, pump storage PP needs water flow and storage to generate electricity). The merit order of peaking PP is based on the flexibility of generation technology (ramp-up and ramp-down) and fuel price. Peaking PP is utilised with a low Capacity Factor (CF) for peak load time. Pumped storage PP requires a longer construction period compared to diesel and gas PP. Of note, gas-fuelled PP is considered the most optimal replacement for diesel PP since CNG and LNG PP have a high ramping rate and a short period of project instalment. However, the significance of gas power plant to substitute diesel PP in filling peaking load has resulted in a severe power system problem, since coal PP could not substitute the role of gas PP as intermediate PP (coal PP has a low ramping rate and flexibility to load fluctuation in the system) [22]. Table 1 shows the operational cost of the power plant in Indonesia, which indicates the merit order of the generation technology, while Table A1 in the Appendix A provides the list of generation capacity of the Sumatra power system. Please note that indicates the node allocation, is the demand quantity for node i in MW, is the supply quantity of node i in MW, and MC is the value of marginal cost for each node in the Sumatra power system in US $/MWh.
3.2. Indonesia’s Transmission Power System
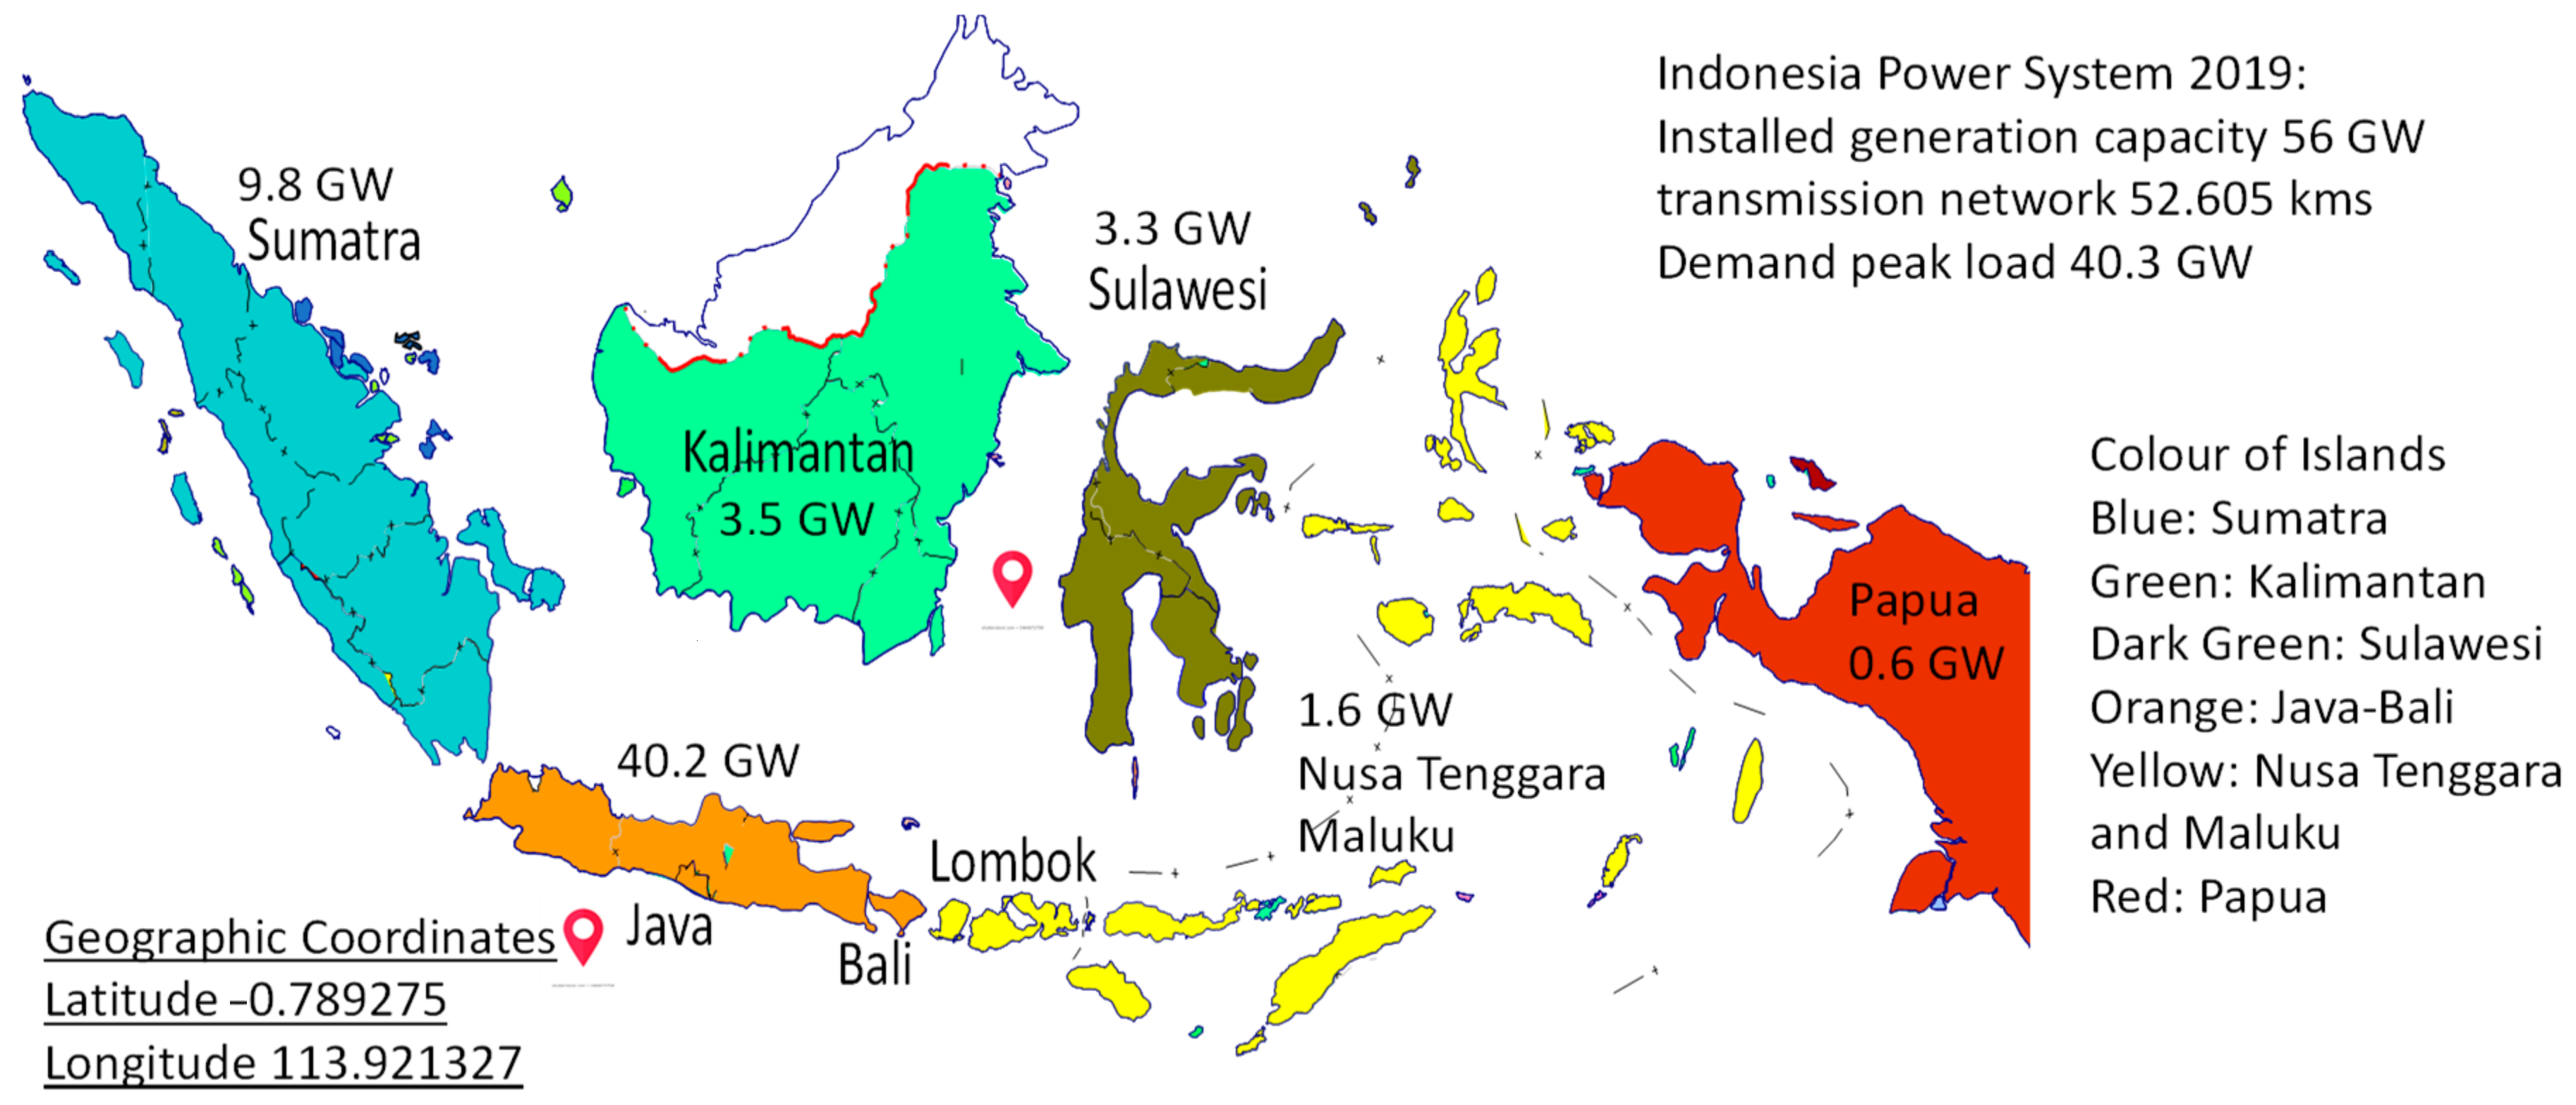
Indonesia is the largest archipelago in the world with 17,000 islands, and it is this that has determined the key features of the Indonesia electrical transmission system. This archipelago characteristic of the system is the reason for unique inter-island and inter-subsystem transmission constraints, resulting in sophisticated electricity market modelling and analysis. The loads are scattered over thousands of islands, and each island is isolated and not connected by overhead/submarine transmission lines. In other words, the transmission network of the Indonesia power system is not a single interconnected system but instead is a multi-power system. However, in an island network, transmission system interconnection is restricted (See Figure 5). The power system dispatcher operates these power systems at 70, 150, 275, and 500 kV, respectively. The existing Sumatra transmission system consists of 70, 150, and 275 kV transmission systems. The power system frequency is operated by PLN at 50 Hz for all Indonesia regions. The 150 kV Sumatra power system is divided into two significant subsystems, the North Sumatra subsystem and the Mid-South Sumatra subsystem [25,26]. The North Sumatra subsystem is composed of two smaller subsystems, i.e., Aceh and Sumut subsystems. The Mid-South Sumatra includes six subsystems: West Sumatra, Riau, Jambi, Bengkulu, South Sumatra, and Lampung. Table 2 shows the characteristics of the 150 kV transmission lines of the Sumatra power system which covers reactance in per unit (), transmission line in MW (), and cable configuration. These transmission lines are the main overhead lines connecting subsystems in Sumatra.
Given its archipelago context, the Indonesia power system has unique characteristics compared to the power system in other countries. As the most prominent archipelago in the world, this naturally creates isolated loads in scattered islands. The power system load of Indonesia is dominated by residential consumers that has resulted in a low load factor. The more moderate power system load factor results in a more significant load delta between base and peak load. The generation system is developed according to the fluctuation of the system peak load, and not the system baseload. Thus, the more significant load delta in the Indonesia power system has resulted in a low capacity factor of peaking generation technology. However, Indonesia’s power system planning should cover a more substantial portion of flexible peaking PP to accommodate the shifting period of baseload to peak load in the power system. Table 3 shows the list of load factor forecast of Indonesia’s power system interconnections.
4. Modelling and Methodology
4.1. Sumatra Power System Modelling
The data of the Sumatra power system was acquired from the 2015–2016 Operation Planning and Evaluation report of Sumatra [25,27], and generation expansion planning data in [21]. The data collection of the Sumatra power system consists of generation, transmission, and demand system data. Generations system data comprises the marginal cost nominal for each power plant in the Sumatra power system. Transmission system data comprises the power transfer limit, circuit diagram of the 150 kV transmission line, and power flow realisation of the Sumatra system. Electricity demand data comprises non-coincident peak load for each 150 kV power substation. The price data for residential and non-residential customers were collected from the Ministry of Energy and Mineral Resources of Indonesia based on [28]. The generation and demand allocation of stylised modelling can be seen in Table 4, which consists of demand peak load (peak load in MW), the total installed power plant capacity (cap in MW), and nominal marginal cost (MC in $/MWh).
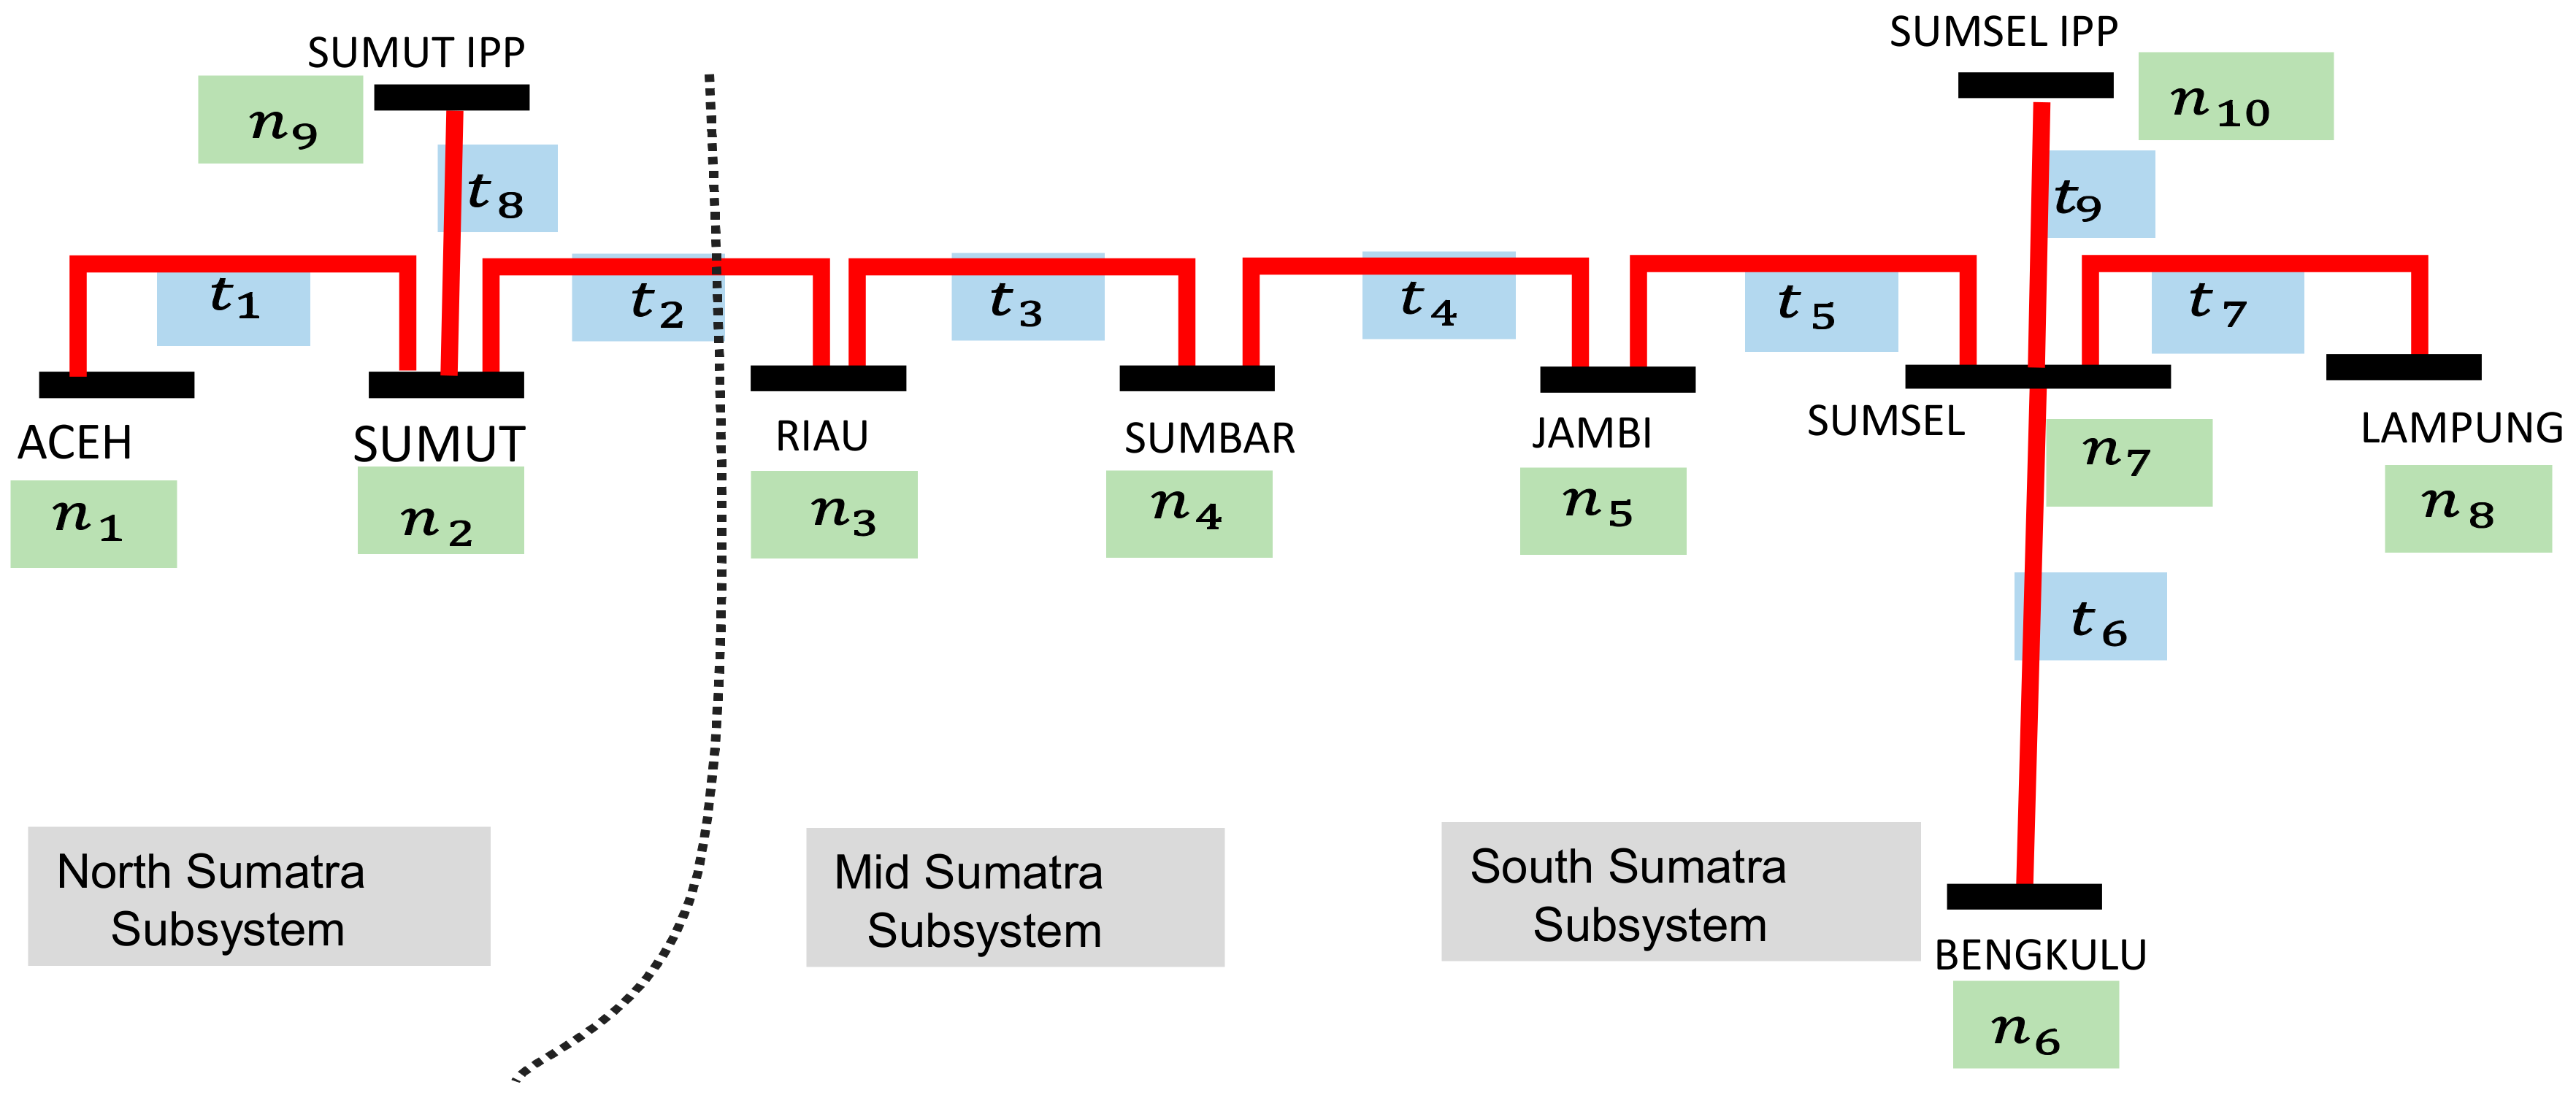
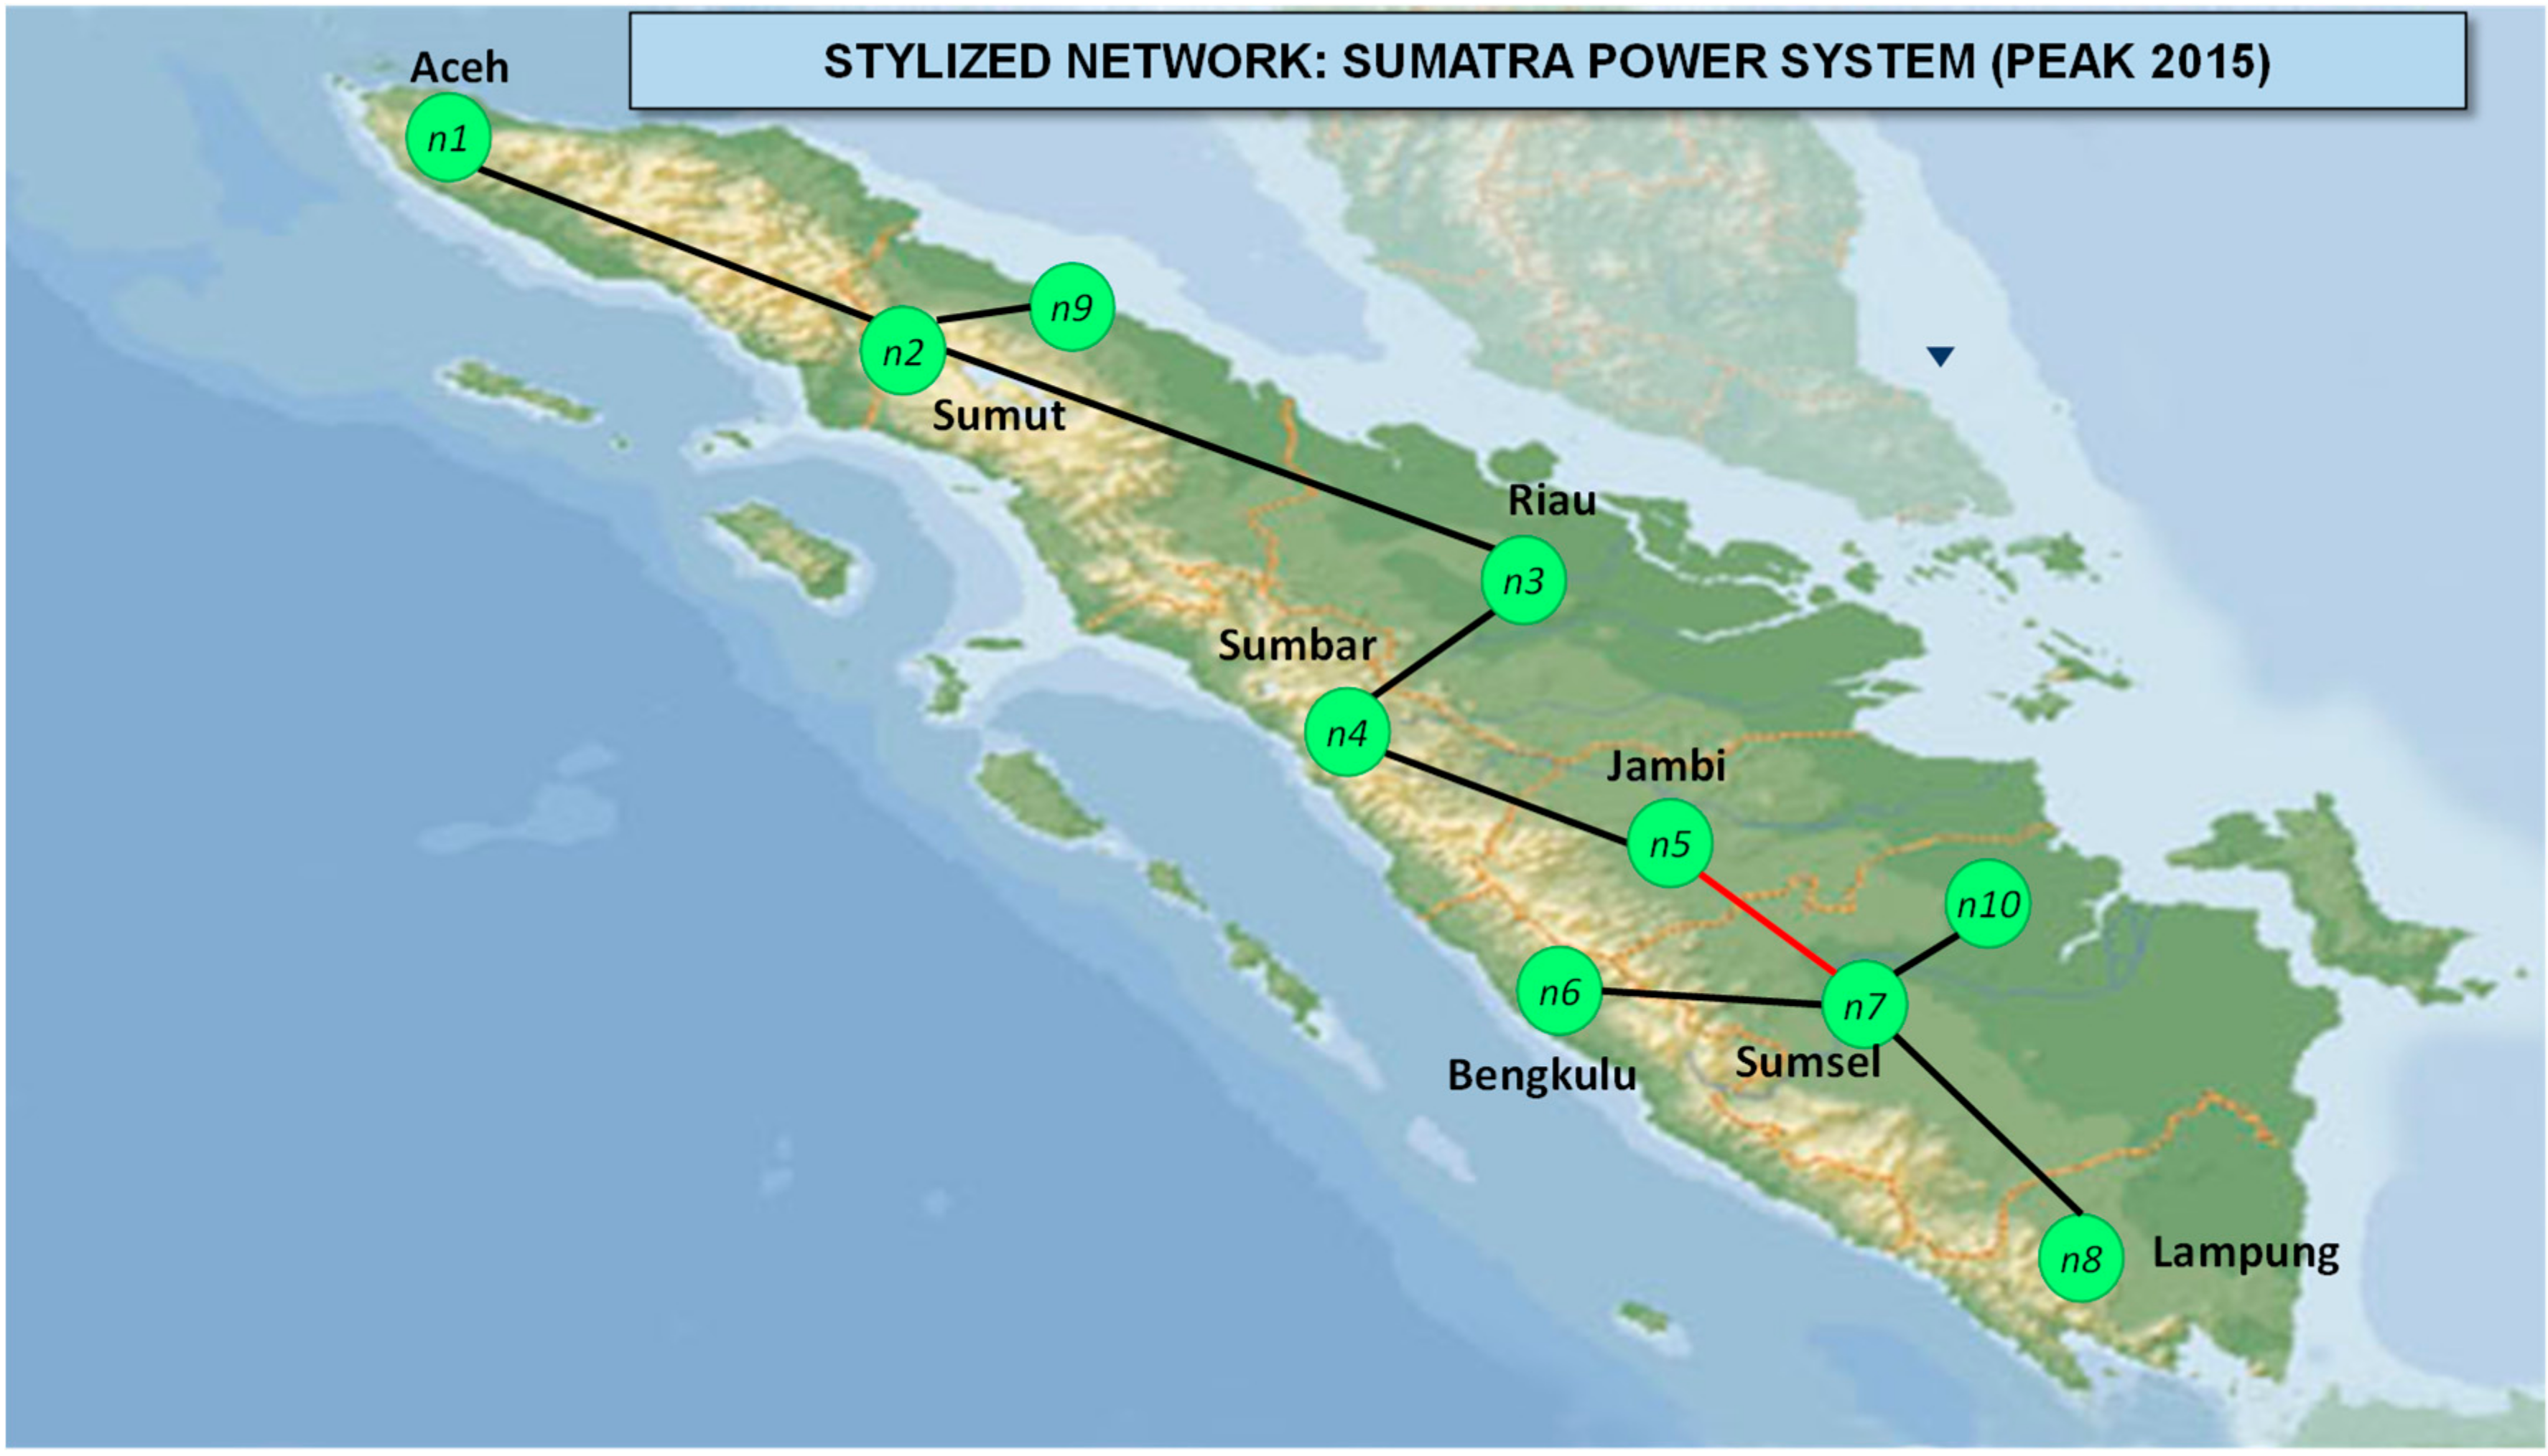
Figure 6 shows the stylised network of the Sumatra power system by adding two additional virtual IPP nodes. Figure 7 shows the Sumatra power system map with virtual IPP nodes, which indicates the geographical location of each node. According to the PLN subsystem division, the Sumatra power system is divided into eight nodes (The nodal pricing model of the Sumatra power system with eight nodes by considering generation and transmission constraints can be found in [29]). However, in this study, we extend the initial eight nodes model into a ten nodes model to accommodate the private parties’ ownership in the Indonesia generation market. The differentiation between state and private ownership is essential prior to the optimisation process. Sumatra with virtual IPP nodes modelling consists of 10 nodes: eight nodes are PLN nodes; the other two nodes are IPP nodes located in the Sumsel and Sumut regions. IPP power generation in the Sumatra power system is limited only in the Sumut (Asahan PP) and Sumsel (Borang, Gunung Megang and Simpang Belimbing PP) subsystems. The Sumut and Sumsel subsystems are the two most significant subsystems in the Sumatra power system. The total installed capacity of the IPP power plant in the Sumatra power system is 667 MW, equating to 10.6% to the total system capacity. A detailed list of IPP power plants in the Sumatra power system is shown in Table 5. Table 6 shows the transmission lines connecting virtual IPP nodes in Sumatra.
The addition of virtual IPP nodes changes the DC load flow calculation according to the shift factor matrix in Table 7. The initial Sumut node is detached into two independent nodes, i.e., node 2 (Sumut) and the new virtual node 9 (Sumut IPP). Similarly, the initial Sumsel node is divided into node 7 (Sumut) and node 10 (Sumsel IPP). Therefore, the arrangement of power injection and electricity supply is different from the previous base case.
4.2. Research Methodology
The research methodology in this paper, following the cascading optimisation algorithm developed by [30,31], has the objective to formulate the optimal structure of successor companies based on RSI. The market structure optimisation consists of four steps as follows. First, we modelled the power system into perfect and imperfect (Cournot) competition models by considering the generation and transmission constraints. The perfect competition modelling in this study is based on research of several studies [11,29,32,33], while the Cournot competition modelling in this paper is based on the market modelling of the previous published papers [34,35,36]. The generation constraints include generation capacity, energy mix, and reserve margin, while transmission constraints cover DC load flow, transmission limit, and line connection. Second, we calibrated the stylised modelling according to the real condition of the Sumatra load flow at non-coincident peak load year 2015, i.e., 3 September 2015, 19.30 for the North Sumatra subsystem and 18 August 2015 19.00 for the Mid-South Sumatra subsystem [27]. Third, we conducted horizontal addition of marginal cost for combined power plants. We assume here that companies that own multi power plants behave as multi-plant monopolist [37]. Fourth, we screened the optimisation result and determined the optimal market structure for each configuration based on an RSI threshold of 110% following the empirical studies by [38,39]. Please note that each cascading optimisation calculates nodal price, nodal demand, nodal supply, nodal consumer surplus, nodal producer surplus, and power flow for each configuration. However, we focus on the RSI calculation for each market setting by opting for the highest RSI for every possible market setting.
The concept of nodal pricing has an objective to determine the optimal price to achieve maximum welfare under specific constraints. Nodal pricing was modelled in the DC load low in matrix form as the result of power injection vector and the Power Transfer Distribution Factor (PTDF) [11,40,41,42]. In power system formulation, is the phase angle and the susceptance is the imaginary part of admittance and could be denoted as where is the transmission lines reactance. The phase angle formulation could then be stated as . Now, consider a power system with m transmission lines and n nodes. is a vector of reactance (m × m). is a vector of DC power flow (m × 1). M is the node-branch incidence matrix for the angle phase vector matrix (n − 1 × m) excluding the reference node (i.e., the slack bus, which has a zero-phase angle). P is the power injection matrix (n − 1 × 1). B is the susceptance matrix. Assuming a DC power flow, therefore, the power injection in node n is the difference between power generation and consumer demand , and the power flowing on the transmission line could be described as a linear function of PTDF and . The DC power flow could then be stated as . Please note that the modelling of the stylised model is based on the law of parallel circuit as in [43,44]. In this research, the parallel circuits were calculated by doubling the transmission capacity and, therefore, will halve the line’s reactance where is the transmission capacity at initial state which connects node to and is the transmission reactance at initial state.
Under perfect competition, the system operator seeks to maximise total welfare, or the sum of consumer and producer surplus, subject to the balance of energy demand and supply in each node and the limits of generation and transmission capacity. In other words, the optimisation formula is , subject to: Energy demand balance , the upper bound of generation capacity , the upper bound of transmission capacity and , and the non-negativity of capacity and . In this study, the demand and marginal cost function were assumed as linear function to represent the real market and .
Cournot competition modelling is widely implemented by electricity market modellers due to its tractability and compatibility with power system characteristics, e.g., generation and transmission constraints, voltage and stability conditions, generation ramp-up and ramp-down, contingency analysis and Power Transfer Distribution Factor (PTDF) [45]. Under Cournot competition, few generation plants are assumed to recognise their strategic interdependence. Each generation plant chooses its output to maximise its profits, given the plants operator’s beliefs about the choices of its rivals. In equilibrium, each generation plant finds that its expectation about other choices is confirmed, and no generation plant will find it profitable to change its output once it discovers the choices made by other generation plants (reaching a Nash equilibrium). The system operator seeks to maximise these profit functions subject to the network constraint. The total demand function is in which is the total demand for an interconnected power system, and is the equilibrium price. The profit function for generation at node i is defined by . The system operator seeks to maximise these profit functions subject to the network constraint. In equilibrium, the optimality condition for each generation plant is .
5. Analysis and Discussion
Three case studies were simulated in this chapter. The first case study involves the simulations to optimise the Sumatra power system considering virtual IPP nodes under perfect competition as in normal operation (unconstrained). The second case study performed simulation under perfect competition and contingency N − 1 (constrained), and the third case study applied Cournot competition in the model (unconstrained). The modelling of the large-scale power system under constrained transmission is tough to solve [30,33]. Therefore, modelling of the Indonesia power system under Cournot constraints is left for a separate future study. However, the three case studies in this paper already reflect the substantial comparisons between perfect and Cournot competition, and between unconstrained and constrained transmission.
5.1. Optimal Number of Generation Companies under Perfect and Cournot Competition
The first result is that the optimal number of successor companies is the same under perfect competition and Cournot competition. According to [46], the threshold for a reasonably competitive market is 120%. The RSI for initial market configuration (10 players setting) is already below 120% (0.83) (the base case scenario (10 players setting) resulted in RSI 0.8341. The cascading optimisation to less participants in the market does not significantly change the market power index. The significant change occurs when the market is moving from a five-players (RSI 0.829) setting to a four players market setting (RSI 0.519)). Thus, the criteria of the optimal number of successor companies for the Sumatra power system is determined by choosing the least number of successor companies to minimise the prospects for high transaction costs. In the Sumatra simulation, the lower bound for the optimal number of successor companies is five players. From the competition policy perspective, moving from ten to five players is practical for both perfect competition and Cournot competition for two main reasons. First, knowing five players, as the lower bound for the optimal number of successor companies, will avoid the transaction cost of unnecessarily forming another successor company. The transaction cost ([47] explained that the transaction cost in forming successor companies from a monopoly company is likely huge) of forming five successor companies is likely less than that of forming ten companies. Second, optimising the Sumatra market into five players from ten players is not harmful to competition policy enforcement. RSI for the ten to the five players setting, as shown in Table 8 and Table 9, is relatively the same (ranging from 0.829–0.831 for the perfect competition case and 0.856–0.870 for Cournot competition). However, moving from a five to four player configuration is likely harmful for competition policy enforcement since it reduces the RSI by a significant number (from 0.83 to 0.52 in perfect competition, and from 0.85 to 0.55 in Cournot competition). RSI is influenced by the equilibrium demand and the capacity of the largest seller. The capacity of the largest seller, for ten players to five players, is the same, determined by the generation capacity of node 2 Sumut (2081.2 MW). Thus, the slight difference in RSI is due to the change in equilibrium demand as a result of the marginal cost change arising from the merger process. Please note that moving the Sumatra structure to a lesser number of successor companies could also slightly increase RSI. Indeed, in the perfect competition case, moving from the nine players to eight player configuration increased RSI from 0.83200 to 0.83202. The lower bound of the optimal number of successor companies in perfect and Cournot competition is the same (five players setting). However, the RSI in Cournot competition is higher compared to RSI in the perfect competition since equilibrium demand under Cournot is higher compared to that under perfect competition. Table 8 and Table 9 provide a comparison of RSI and the combination of firms between perfect competition and Cournot competition.
5.2. Optimal Mix of Power Plants under Perfect and Cournot Competition
The second result is that the optimal mix of power plants in the Sumatra power system under perfect (the generation in node 2 (Sumut), node 9 (Sumut IPP), and node 10 (Sumsel IPP) are not different from the initial generation capacity. However, Aceh, Jambi and Sumsel are combined into one successor company, and likewise, Riau, Sumbar, Bengkulu and Lampung are also merged into a successor company) or Cournot competition is significantly different, as can be seen by comparing Table 10 and Table 11. The largest successor companies in perfect competition (B in Table 10) is identical with the largest successor companies in Cournot competition (K in Table 11). However, the second-largest successor companies in perfect competition (C in Table 10) is substantially different from the second-largest successor companies in Cournot competition (J in Table 11). C, with 1943 MW, is comprised of Riau, Sumbar, Bengkulu, and Lampung, while J, with 2060 MW, consists of Aceh, Riau, Jambi, and Sumsel. IPP nodes in node 9 and 10 are not included in the power plant merger analysis. Thus, the smallest and the second smallest in both cases are identical. In node number 9, D is identical to M while in node number 10, E is identical to N.
5.3. The Effect of Transmission Congestion on Optimal Market Structure
The third implication analysed in these simulations is the effect of transmission congestion on the optimal configuration of successor companies. As shown in Table 10 and Table 12, the composition of the power plant in the five players setting for transmission unconstrained and a constrained case is identical. The second-largest successor companies comprise Aceh, Jambi, and Sumsel, while the third-largest successor companies comprise Riau, Sumbar, Bengkulu, and Lampung. However, the cascading optimisations are not similar to a market setting larger than five, i.e., six to nine player-setting. For example, the optimal merger for nine player configuration, in the transmission unconstrained case is Aceh merged with Sumsel. In the transmission constrained case, the optimal merger for a nine-player configuration is Aceh merged with Jambi. The nominal of RSI in the transmission-constrained case is slightly higher compared to the transmission unconstrained case (See Table 8 and Table 13 for RSI and structure comparison between unconstrained and constrained perfect competition case studies). This is reasonable since congesting transmission resulting Sumsel unable to transfer electricity to Jambi. Sumsel in node seven is dominated by coal power plants with lower fuel costs compared to Jambi in node six, which is dominated by gas and oil fuel power plants. Thus, the transmission bottleneck increased the nodal price and reduced the total equilibrium demand. Recalling the formula of RSI, decreasing the total demand leads to increased RSI.
There are three main implication based on the result of simulations. The first implication is that we could find the lower bound of competing generation companies. For the Sumatra power system, the 10 player configuration as in the base case is the lower bound since the RSI index was already below the threshold. The second implication is that the optimal mix of power generation of the competing companies under perfect competition is substantially different to that under Cournot competition. The third implication is that transmission congestion is affecting the optimal mix of power generation of the successor companies. Therefore, this result could give a broad perspective to the policy maker in designing constituent power plants considering the risk of N − 1 contingency in the transmission lines.
6. Conclusions
This research consists of a multidisciplinary approach in optimising the mix and structure of successor companies in electricity market restructuring. Thus, this study covers the aspects of electricity market design, including power engineering, microeconomics, and law. This research provides an empirical simulation to optimise power generation mix and electricity market structure of the Sumatra power system using DC load flow optimisation, market power index, and multi-plant monopoly analysis. The simulations in this study incorporate network constraints, e.g., generation and transmission constraints. The ex-ante approach proposed in this study is vital to mitigate the risk of market power abuse in electricity market restructuring. This study provides guidelines for competition policy regulators in the electricity market on how to configure the mix and structure (portfolio) of successor companies. The portfolio optimisation applied in this study is based on a preventive law approach using recursive optimisation, power system modelling and market power mitigation to create the optimal market structure ex-ante.
This study extends the application of preventive competition policy in [30] by applying the cascading optimisation algorithm in a stylised Sumatra power system. Utilising a similar methodology (e.g., multi plant monopoly, cascading optimisation, and RSI application) as study [30] was deliberate in order to validate the premise of this study, namely the implementation of the proposed algorithm in any electricity market characterised by monopoly. As such, the guidelines and methodology in this research can be generalised to other countries characterised by a monopoly electricity utility company. In this study, both the case study and the result differ for the Sumatra and the Java–Bali power systems. Further, differences were determined for the Sumatra and Java–Bali systems regarding the optimal structure and efficient number of competing GenCos. Comparing the different results is critical as it enables the regulator to prevent companies from mimicking the so-called standard electricity market structure and standard number of competing GenCos; mitigate the potential market power abuse, considering the initial characteristics of the interconnected power system.
The first ever research to simulate the Sumatra power system using imperfect (Cournot) competition modelling, this study is also the first to optimise the Sumatra generation power market in terms of energy mix and structure. This study also extends the study of Sumatra power system modelling in [42] by applying imperfect (Cournot) competition in the Sumatra system. Therefore, the contributions of this study are as follows: First, this research is the first to analyse the Sumatra power system using imperfect (Cournot) competition modelling. Second, this study is the first to optimise the mix and structure of the Sumatra generation power market.
There are a number of limitations to this research. First, PP data is only for the interconnected system; thus, the isolated power plant is not considered in the system analysis. The ex-ante analysis is for one shot modelling using ex-post data for the year 2015. The strategic market behaviour consists of perfect competition and imperfect market. For the reason of analysis tractability, Cournot market modelling is implemented to model the imperfect power system market. The Cournot simulations with transmission constraints are left for future research. The transmission line is limited under the transmission capacity constraint and varied based on the thermal limit, cable type, and size. This transmission constrained model is more realistic to model the real power system based on nodal pricing, where the transmission constraint causes the price differences. We performed a contingency analysis to examine the electricity model response to the generators and transmission line outages. This study performed load flow analysis based on DC calculation. Thus, the power flow arc and quantity ignore the nominal influence from the voltage (the voltage level was set for all nodes to 1 p.u. and there is no voltage drop), phase angle, and reactive power flow. Furthermore, we consider transmission lines as lossless and also neglect line resistance. Peak load demand consists of coincident and non-coincident peak load. Market power exercise occurs in peak load demand state. In the case of the California crisis, market power occurs from the small size power plants.
Author Contributions
Conceptualization, D.F.H.; methodology, D.F.H.; software, D.F.H.; validation, D.F.H., N.H.; formal analysis, D.F.H., S.K.W.; investigation, D.F.H.; resources, D.F.H.; writing—original draft preparation, D.F.H.; writing—review and editing, D.F.H., S.K.W., N.H.; visualization, D.F.H.; project administration, D.F.H. All authors have read and agreed to the published version of the manuscript.
Funding
This research received no external funding.
Acknowledgments
This research is supported by PLN.
Conflicts of Interest
The authors declare no conflict of interest.
Abbreviations
| CNG | Compressed natural gas |
| CCGT | Combined Cycle Gas Turbine |
| CF | Capacity Factor |
| DC | Direct Current |
| EC | European Community |
| FERC | Federal Energy Regulatory Commission |
| GenCo | Generation Company |
| HHI | Herfindahl-Hirschman Index |
| HSD | High-Speed Diesel |
| HMG | Horizontal Merger Guidelines |
| IMF | International Monetary Fund |
| IPP | Independent Power Producer |
| IRR | Internal Rate of Return |
| LNG | Liquefied Natural Gas |
| MC | Marginal Cost |
| MFO | Marine Fuel Oil |
| NETA | New Electricity Trading Agreement |
| NPV | Net Present Value |
| PLN | Perusahaan Listrik Negara (State Owned Electricity Company) |
| PP | Power Plant |
| PTDF | Power Transfer Distribution Factor |
| RUKN | Rencana Umum Ketenagalistrikan Nasional (National Electricity Master Plan) |
| RUPTL | Rencana Usaha Penyediaan Tenaga Listrik (National Electricity Supply Business Plan) |
| RSI | Residual Supply Index |
Appendix A

| Node | Subsystem | Power Plant | MC ($/MWh) | |||
|---|---|---|---|---|---|---|
| ns1 | Aceh | 290 | 264.2 | Nagan Raya | 160 | 85.83 |
| KKA Lhokseumawe | 20 | |||||
| Lueng Bata | 31.9 | |||||
| Cot Trueng | 12.5 | |||||
| Pulau Pisang | 9.8 | |||||
| Sewa Aggreko | 30 | |||||
| ns2 | Sumut | 1570 | 2260.1 | Belawan | 163 | 74.27 |
| Labuhan Angin | 105 | |||||
| Pangkalan Susu | 400 | |||||
| Growth Sumatra | 19 | |||||
| Growth Asia | 20 | |||||
| PKS Rambutan | 1.8 | |||||
| Harkat Sejahtera | 10 | |||||
| Belawan | 637 | |||||
| Belawan | 90 | |||||
| Glugur | 21 | |||||
| Paya Pasir | 34 | |||||
| Titikuning | 16 | |||||
| Rental Paya Pasir | 115 | |||||
| Rental Belawan (AKE) | 65 | |||||
| Rental Belawan MFO | 120 | |||||
| Sibayak | 10 | |||||
| Sipansipahoras | 50 | |||||
| Lau Renun | 80 | |||||
| Asahan | 180 | |||||
| Inalum (Transfer) | 90 | |||||
| Tersebar | 5 | |||||
| Parlilitan | 7.5 | |||||
| Silau | 7.5 | |||||
| Hutaraja | 5 | |||||
| Karai | 8.3 | |||||
| ns3 | Riau | 526 | 468.1 | Teluk Lembu | 32 | 43.35 |
| Balai Pungut | 34 | |||||
| Rental Teluk Lembu | 122 | |||||
| Balai Pungut (ex Belawan) | 40 | |||||
| Balai Pungut | 100.1 | |||||
| Riau Power | 26 | |||||
| Koto Panjang | 114 | |||||
| ns4 | Sumbar | 487 | 642.4 | Ombilin | 133 | 30.1 |
| Teluk Sirih | 200 | |||||
| Pauh Limo | 49.5 | |||||
| Maninjau | 67.8 | |||||
| Batang Agam | 10.5 | |||||
| Singkarak | 174.6 | |||||
| Selo Kencana | 7 | |||||
| ns5 | Jambi | 272 | 284.9 | Biomassa RSPL | 10 | 95.0 |
| Batang Hari | 56.6 | |||||
| Payo Selincah | 93.6 | |||||
| Sei Gelam (CNG) | 89.5 | |||||
| Sei Gelam | 12 | |||||
| Tanjung Jabung | 7.2 | |||||
| Payo Selincah | 16 | |||||
| ns6 | Bengkulu | 123 | 253.3 | Musi | 209.5 | 0.36 |
| Tes | 18.1 | |||||
| Tes extension | 4.3 | |||||
| Lebong | 11.5 | |||||
| Lahat | 9.9 | |||||
| ns7 | Sumsel | 768 | 1530.2 | Bukit Asam | 233.1 | 51.22 |
| Simpang Belimbing | 227 | |||||
| Rental PTBA | 6 | |||||
| Banjarsari | 220 | |||||
| Baturaja | 20 | |||||
| Keramasan | 24.8 | |||||
| Talang Dukuh | 68.6 | |||||
| LM Borang | 11 | |||||
| Borang | 67.2 | |||||
| Jakabaring | 50.5 | |||||
| Rental Keramasan | 45 | |||||
| Rental Jambi | 29.7 | |||||
| Prabumulih | 11.6 | |||||
| Sako | 11.8 | |||||
| Musi Rawas | 8 | |||||
| Borang | 150 | |||||
| Indralaya | 120.5 | |||||
| Gunung Megang | 110 | |||||
| Musi II | 19.4 | |||||
| Keramasan | 74 | |||||
| Sungai Juaro | 22 | |||||
| ns8 | Lampung | 851 | 579.5 | Tarahan | 178 | 33.38 |
| Sebalang | 89 | |||||
| Gunung Sugih | 14 | |||||
| Pelabuhan Tarahan | 10 | |||||
| Tarahan | 16 | |||||
| Tarahan | 20.5 | |||||
| Teluk Betung | 12.6 | |||||
| Tegineneng | 18 | |||||
| Ulubelu | 103.8 | |||||
| Besai | 89.6 | |||||
| Batutegi | 28 | |||||
| Total | 4887 | 6282.7 | 6282.7 |
References
- Stigler, G.J. Monopoly and the problem of the economists. Univ. Chic Law Rev. 1983, 19, 1–22. [Google Scholar]
- Sioshansi, F.P. Competitive Electricity Markets: Design, Implementation, Performance, 1st ed.; Elsevier: Oxford, UK, 2013. [Google Scholar]
- Joskow, P.L. Lessons learned from electricity market liberalization. Energy J. 2008, 29, 9–42. [Google Scholar] [CrossRef]
- Borenstein, S.; Bushnell, J. The US Electricity Industry After 20 Years of Restructuring. Annu. Rev. Econom. 2015, 7, 437–463. [Google Scholar] [CrossRef] [Green Version]
- Newbery, D.M.; Pollitt, M.G. The Restructuring and Privatisation of Britain’s CEGB-Was It Worth It? J. Ind. Econ. 2003, 45, 269–303. [Google Scholar] [CrossRef]
- Zhang, Y.F.; Parker, D.; Kirkpatrick, C. Electricity sector reform in developing countries: An econometric assessment of the effects of privatization, competition and regulation. J. Regul. Econ. 2008, 33, 159–178. [Google Scholar] [CrossRef]
- Hunt, S. Making Competition Work in Electricity, 1st ed.; John Wiley & Sons, Inc.: New York, NY, USA, 2002. [Google Scholar]
- Kirschen, D.S.; Strbac, G. Fundamentals of Power System Economics, 2nd ed.; Wiley: London, UK, 2019. [Google Scholar]
- Arellano, M. Diagnosing and Mitigating Market Power in Chile’s Electricity Industry; MIT: Cambridge, UK, 2003. [Google Scholar]
- Green, R.; Newbery, D. Competition in the British electricity spot market. J. Polit. Econ. 1992, 100, 929–953. [Google Scholar] [CrossRef]
- Green, R. Nodal pricing of electricity: How much does it cost to get it wrong? J. Regul. Econ. 2007, 31, 125–149. [Google Scholar] [CrossRef]
- Green, R. European Union Regulation and Competition Policy among the Energy Utilities. In Competition Policy in the EU: Fifty Years on from the Treaty of Rome; Vives, X., Ed.; Oxford Scholarship Online: Oxford, UK, 2009; pp. 284–313. [Google Scholar]
- DOJ; FTC. Horizontal Merger Guidelines 1992. Available online: https://www.ftc.gov/sites/default/files/attachments/merger-review/hmg.pdf (accessed on 15 September 2020).
- DOJ; FTC. Horizontal Merger Guidelines 2010. Available online: https://www.justice.gov/sites/default/files/atr/legacy/2010/08/19/hmg-2010.pdf (accessed on 15 September 2020).
- Hobbs, B.; Helman, U. Complementarity-Based Equilibrium Modeling for Electric Power Markets. In Modeling Prices in Competitive Electricity Markets; Bunn, D., Ed.; J. Wiley: London, UK, 2003; Volume 32, pp. 54–55. [Google Scholar]
- Stigler, G.J. Mergers and Preventive Antitrust Policy. Univ. PA Law Rev. 1955, 104, 176. [Google Scholar] [CrossRef] [Green Version]
- Huschelrath, K. Competition Policy Analysis: An. Integrated Approach, 1st ed.; Physica-Verlag: Heidelberg, Germany, 2009; Volume 41. [Google Scholar]
- Robertson, E.L. A Corrective Justice Theory of Antitrust Regulation. Cathol. Univ. Law Rev. 2000, 49, 741–783. [Google Scholar]
- Wils, W.P.J. Optimal Antitrust Fines: Theory and Practice. World Compet. 2005, 29, 1–32. [Google Scholar]
- PLN. Rencana Usaha Penyediaan Tenaga Listrik PT. PLN (Persero) 2019–2028; RUPTL: Jakarta, Indonesia, 2019. [Google Scholar]
- PLN. Rencana Umum Penyediaan Tenaga Listrik (National Electricity Supply Business Plan); RUPTL: Jakarta, Indonesia, 2015. [Google Scholar]
- Hakam, D.F.; Asekomeh, A.O. Gas monetisation intricacies: Evidence from indonesia. Int. J. Energy Econ. Policy 2018, 8, 174–181. [Google Scholar]
- Hakam, D.F.; Arif, L.; Fahrudin, T. Sustainable Energy Production in Sumatra Power System. In Proceedings of the 2012 International Conference on Power Engineering and Renewable Energy (ICPERE); Institute of Electrical and Electronics Engineers (IEEE): New York, NY, USA, 2012; pp. 1–4. [Google Scholar]
- Tambunan, H.B.; Hakam, D.F.; Prahastono, I.; Pharmatrisanti, A.; Purnomoadi, A.P.; Aisyah, S.; Wicaksono, Y.; Sandy, I.G.R. The Challenges and Opportunities of Renewable Energy Source (RES) Penetration in Indonesia: Case Study of Java-Bali Power System. Energies 2020, 13, 5903. [Google Scholar] [CrossRef]
- P3BS. Operation Planning Year 2016: Sumatra Power System; P3BS: Pekanbaru, Indonesia, 2016. [Google Scholar]
- Hakam, D.F.; Wahyuni, R.; Pramono, E.Y. Switching study for 275 kV Padang Sidempuan-Payakumbuh Transmission Line. In Proceedings of the 2011 International Conference on Electrical Engineering and Informatics, Bandung, Indonesia, 17–19 July 2011; pp. 10–13. [Google Scholar]
- P3BS. Operation Evaluation Year 2015: Sumatra Power System; P3BS: Pekanbaru, Indonesia, 2015. [Google Scholar]
- ESDM. Ministry of Energy and Mineral. Resources Regulation No. 31 Year 2014 Regarding Electric Energy Tariff Provided by PLN; ESDM: Jakarta, Indonesia, 2014; pp. 1–16. [Google Scholar]
- Hakam, D.F. Nodal pricing: The theory and evidence of Indonesia power system. Int. J. Energy Econ. Policy 2018, 8, 135–147. [Google Scholar]
- Hakam, D.F. Mitigating the risk of market power abuse in electricity sector restructuring: Evidence from Indonesia. Util. Policy 2019, 56, 181–191. [Google Scholar] [CrossRef]
- Hakam, D.F.; Macatangay, R.E. Optimising Indonesia’s electricity market structure: Evidence of Sumatra and Java-Bali power system. In Proceedings of the IEEE International Conference on Industrial Technology, Lyon, France, 20–22 February 2018; pp. 1266–1271. [Google Scholar]
- Berry, C.A.; Hobbs, B.F.; Meroney, W.A.; O’Neill, R.P.; Stewart, W.R. Understanding how market power can arise in network competition: A game theoretic approach. Util. Policy 1999, 8, 139–158. [Google Scholar] [CrossRef]
- Leuthold, F.U.; Weigt, H.; Von Hirschhausen, C. A Large-Scale Spatial Optimization Model of the European Electricity Market. Netw. Spat. Econ. 2012, 12, 75–107. [Google Scholar] [CrossRef]
- Borenstein, S.; Bushnell, J.; Wolak, F.A. Measuring market inefficiencies in California’s restructured wholesale electricity market. Am. Econ. Rev. 2002, 92, 1376–1405. [Google Scholar] [CrossRef] [Green Version]
- Cunningham, L.; Baldick, R.; Baughman, M. An Empirical Study of Applied Game Theory: Transmission Constrained Cournot Behavior. IEEE Trans. Power Syst. 2002, 17, 166–172. [Google Scholar] [CrossRef]
- Willems, B.; Rumiantseva, I.; Weigt, H. Cournot versus Supply Functions: What does the data tell us? Energy Econ. 2009, 31, 38–47. [Google Scholar] [CrossRef] [Green Version]
- Dahl, C.A. International Energy Markets: Understanding Pricing, Policies, and Profits, 2nd ed.; PennWell: Tulsa, OK, USA, 2015. [Google Scholar]
- Sheffrin, A. Critical Actions Necessary for Effective Market Monitoring. Presented at FERC RTO Workshop, Folsom, CA, USA, 15–19 October 2001. [Google Scholar]
- Sheffrin, A. Predicting Market Power Using the Residual Supply Index. Presented at FERC Market Monitoring Workshop, Folsom, CA, USA, 3–4 December 2002. [Google Scholar]
- Schweppe, F.; Caramanis, M.; Tabors, R.; Bohn, R. Spot Pricing of Electricity, 1st ed.; Kluwer Academic Publishers: MA, USA, 1988. [Google Scholar]
- Macatangay, R.E.A. Space-time prices of wholesale electricity in England and Wales. Util. Policy 1998, 7, 163–188. [Google Scholar] [CrossRef]
- Hakam, D.F.; Haryadi, E.; Indrawan, H.; Simaremare, A.A. Economic valuation of Efficient Pricing: Case study of Java Bali Power System. In Proceedings of the 2nd International Conference on High Voltage Engineering and Power Systems (ICHVEPS), Denpasar, Bali, Indonesia, 1–4 October 2019. [Google Scholar] [CrossRef]
- Hagspiel, S.; Jagemann, C.; Lindenberger, D.; Brown, T.; Cherevatskiy, S.; Troster, E. Cost-optimal power system extension under flow-based market coupling. Energy 2014, 66, 654–666. [Google Scholar] [CrossRef] [Green Version]
- Hogan, W.; Rosellon, J.; Vogelsang, I. Toward a combined merchant-regulatory mechanism for electricity transmission expansion. J. Regul. Econ. 2010, 38, 113–143. [Google Scholar] [CrossRef] [Green Version]
- Hakam, D.F. Market power modelling in electricity market: A critical review. Int. J. Energy Econ. Policy 2018, 8, 347–356. [Google Scholar]
- Rahimi, A.F.; Member, S.; Sheffrin, A.Y. Deregulated Electricity Markets. IEEE Trans. Power Syst. 2003, 18, 486–493. [Google Scholar] [CrossRef]
- Joskow, P.L. Transaction Cost Economics, Antitrust Rules, and Remedies. J. Law Econ. Organ. 2002, 18, 95–116. [Google Scholar] [CrossRef]
Figure 1.
Pre-breakdown models (monopoly and purchasing agency).

Figure 2.
Post-breakdown models (wholesale and retail).

Figure 3.
US Antitrust Law.


Figure 5.
Indonesia map, adapted from [20].
Figure 5.
Indonesia map, adapted from [20].

Figure 6.
Stylised network of Sumatra power system with virtual IPP nodes.

Figure 7.
Map of Sumatra power system with virtual IPP nodes.

Table 1.
Generation Cost of Indonesia power system [21].
Table 1.
Generation Cost of Indonesia power system [21].
| Generation Technology | Operational Cost (Cent $/kWh) | |||||
|---|---|---|---|---|---|---|
| Fuel | Maintenance | Depreciation | Misc. | Employee | Total | |
| Hydro PP | 0.15 | 0.22 | 0.59 | 0.03 | 0.13 | 1.13 |
| Coal PP | 4.54 | 0.45 | 0.82 | 0.01 | 0.05 | 5.87 |
| Diesel PP | 16.73 | 4.02 | 1.31 | 0.13 | 0.75 | 22.95 |
| Gas PP | 15.48 | 0.48 | 1.05 | 0.02 | 0.09 | 17.12 |
| Geothermal PP | 7.36 | 0.13 | 0.51 | 0.01 | 0.12 | 8.13 |
| Steam Gas PP | 6.41 | 0.32 | 0.48 | 0.02 | 0.03 | 7.26 |
| Trans | From i | To j | Xij (p.u) | Tl (MW) | Configuration | ||
|---|---|---|---|---|---|---|---|
| ts1 | 1 | Langsa | 2 | Pangkalan Brandan | 0.06 | 591 | 2 × 78.27 kms; AC3 |
| ts2 | 2 | Kota Pinang | 3 | Bagan Batu | 0.05 | 301.6 | 2 × 68 kms; single Haw |
| ts3 | 3 | Koto Panjang | 4 | Payakumbuh | 0.07 | 363.2 | 2 × 85 kms; Duck |
| ts4 | 4 | Kiliranjao | 5 | Muarabungo | 0.08 | 835 | 2 × 117 kms; twin Zebra |
| ts5 | 5 | Bangko | 7 | Lubuk Linggau | 0.13 | 835 | 2 × 195 kms; twin Zebra |
| ts6 | 7 | Lubuk Linggau | 6 | Pekalongan | 0.04 | 835 | 2 × 68 kms; ACSR 2 × 340 mm2 |
| ts7 | 7 | Baturaja | 8 | (Umpu—Kemuning) | 0.10 | 446 | 1 × 98.37 kms; AC3 (Kemuning) |
Table 3.
Load factor in Indonesia power system [21].
Table 3.
Load factor in Indonesia power system [21].
| No | Power System | Load Factor 2015 (%) | Load Factor 2024 (%) |
|---|---|---|---|
| 1 | Java-Bali | 79 | 80 |
| 2 | Sumatra | 69 | 77 |
| 3 | West Kalimantan (Kalbar) | 66 | 66 |
| 4 | South-Southeast-East-North Kalimantan (Kalseltengtimra) | 67 | 68 |
| 5 | South Sulawesi | 68 | 69 |
| 6 | North Sulawesi | 68 | 73 |
Table 4.
Peak load and generation allocation in Sumatra power system with virtual IPP nodes.
| Node | Subsystem | Peak load (MW) | Cap (MW) | MC ($/MWh) |
|---|---|---|---|---|
| Aceh | 290 | 264.2 | 85.83 | |
| Sumut | 1558.19 | 2080.1 | 85.17 | |
| Riau | 527 | 468.1 | 43.35 | |
| Sumbar | 487 | 642.4 | 30.15 | |
| Jambi | 272 | 284.9 | 94.95 | |
| Bengkulu | 123 | 253.3 | 0.36 * | |
| Sumsel | 737 | 1043.2 | 65.45 | |
| Lampung | 851 | 579.5 | 33.38 | |
| Sumut IPP | 11.81 | 180 | 0.54 | |
| Sumsel IPP | 30 | 487 | 31.82 | |
| Total | 4887 | 6282.7 |
* The Sumut Independent Power Producer (IPP) subsystem consist of 2 × 90 MW of hydro power plant, i.e., AsahanI.1 PP and AsahanI.2 PP, as explained in Table 5. The low marginal cost of this subsystem is due to the low fuel cost of hydro energy from run-off river.
Table 5.
IPP power plant in Sumatra power system.
| Power Plant | Type | Fuel | |
|---|---|---|---|
| AsahanI.1 | Hydro PP | Hydro | 90 |
| AsahanI.2 | Hydro PP | Hydro | 90 |
| AGPBorang | Steam Gas PP | Gas | 150 |
| GunungMegangGT1.1 | Steam Gas PP | Gas | 40 |
| GunungMegangGT1.2 | Steam Gas PP | Gas | 40 |
| GunungMegangST1.0 | Steam Gas PP | Gas | 30 |
| SimpangBelimbing#1 | Coal PP | Coal | 113.5 |
| SimpangBelimbing#2 | Coal PP | Coal | 113.5 |
| Total | 667 |
Table 6.
Transmissions connecting virtual IPP nodes in Sumatra.
| Trans | From i | To j | Xij (p.u) | Tl (MW) | ||
|---|---|---|---|---|---|---|
| 2 | Porsea | 9 | Simangkok | 0.06 | 603.4 | |
| 7 | Sumsel | 10 | Sumsel IPP | 0.05 | 835.0 | |
Table 7.
Shift factor matrix for Sumatra power system with virtual IPP nodes.
| 1 | 0 | 0 | 0 | 0 | 0 | 0 | 0 | 0 | 0 |
| 0 | 0 | 0 | 0 | 0 | 0 | 0 | 0 | −1 | 0 |
| 1 | 1 | 0 | 0 | 0 | 0 | 0 | 0 | 1 | 0 |
| 1 | 1 | 1 | 0 | 0 | 0 | 0 | 0 | 1 | 0 |
| 1 | 1 | 1 | 1 | 0 | 0 | 0 | 0 | 1 | 0 |
| 1 | 1 | 1 | 1 | 1 | 0 | 0 | 0 | 1 | 0 |
| 0 | 0 | 0 | 0 | 0 | −1 | 0 | 0 | 0 | 0 |
| 1 | 1 | 1 | 1 | 1 | 1 | 1 | 1 | 1 | 0 |
| 0 | 0 | 0 | 0 | 0 | 0 | 0 | −1 | 0 | 0 |
Table 8.
Case perfect competition unconstrained: RSI (r) and combination of firm.
| n Firm | Combination | |
|---|---|---|
| 10 | 0.83142 | - |
| 9 | 0.83200 | 1Merge7 |
| 8 | 0.83202 | 3Merge8 |
| 7 | 0.83202 | 3 + 8Merge4 |
| 6 | 0.83200 | 3 + 8 + 4Merge6 |
| 5 | 0.82913 | 1 + 7Merge5 |
| 4 | 0.51959 | 1 + 7 + 5Merge3 + 8 + 4 + 6 |
Table 9.
Case Cournot competition unconstrained: RSI (r) and combination of firm.
| n Firm | Combination | |
|---|---|---|
| 9 | 0.870 | 3Merge7 |
| 8 | 0.869 | 4Merge8 |
| 7 | 0.868 | 1Merge5 |
| 6 | 0.862 | 1 + 5Merge3 + 7 |
| 5 | 0.856 | 4 + 8Merge6 |
| 4 | 0.550 | 2Merge4 + 8 + 6 |
Table 10.
Case perfect competition unconstrained: optimal structure for 5 player configuration.
| Node | Capacity (MW) | A | B | C | D | E |
|---|---|---|---|---|---|---|
| 1 | 264.2 | Aceh | ||||
| 2 | 2080.1 | Sumut | ||||
| 3 | 468.1 | Riau | ||||
| 4 | 642.4 | Sumbar | ||||
| 5 | 284.9 | Jambi | ||||
| 6 | 253.3 | Bengkulu | ||||
| 7 | 1043.2 | Sumsel | ||||
| 8 | 579.5 | Lampung | ||||
| 9 | 180 | Sumut IPP | ||||
| 10 | 487 | Sumsel IPP | ||||
| Total | 6282.7 | 1592.3 | 2080 | 1943.3 | 180 | 487 |
Table 11.
Case Cournot competition unconstrained: optimal structure for 5 player configuration.
| Node | Capacity (MW) | J | K | L | M | N |
|---|---|---|---|---|---|---|
| 1 | 264.2 | Aceh | ||||
| 2 | 2080.1 | Sumut | ||||
| 3 | 468.1 | Riau | ||||
| 4 | 642.4 | Sumbar | ||||
| 5 | 284.9 | Jambi | ||||
| 6 | 253.3 | Bengkulu | ||||
| 7 | 1043.2 | Sumsel | ||||
| 8 | 579.5 | Lampung | ||||
| 9 | 180 | Sumut IPP | ||||
| 10 | 487 | Sumsel IPP | ||||
| Total | 6282.7 | 2060.4 | 2080 | 1475.2 | 180 | 487 |
Table 12.
Case perfect competition constrained: optimal structure for 5 player configuration.
| Node | Capacity (MW) | E | F | G | H | I |
|---|---|---|---|---|---|---|
| 1 | 264.2 | Aceh | ||||
| 2 | 2080.1 | Sumut | ||||
| 3 | 468.1 | Riau | ||||
| 4 | 642.4 | Sumbar | ||||
| 5 | 284.9 | Jambi | ||||
| 6 | 253.3 | Bengkulu | ||||
| 7 | 1043.2 | Sumsel | ||||
| 8 | 579.5 | Lampung | ||||
| 9 | 180 | Sumut IPP | ||||
| 10 | 487 | Sumsel IPP | ||||
| Total | 6282.7 | 1592.3 | 2080 | 1943.3 | 180 | 487 |
Table 13.
Case perfect competition constrained: RSI (r) and combination of firm.
| n Firm | Combination | |
|---|---|---|
| 10 | 0.8328 | - |
| 9 | 0.8346 | 1Merge5 |
| 8 | 0.8312 | 6Merge8 |
| 7 | 0.8312 | 4Merge6 + 8 |
| 6 | 0.8311 | 3Merge4 + 6 + 8 |
| 5 | 0.8290 | 1 + 5Merge7 |
| 4 | 0.5331 | 1 + 5 + 7Merge3 + 4 + 6 + 8 |
Publisher’s Note: MDPI stays neutral with regard to jurisdictional claims in published maps and institutional affiliations. |
© 2020 by the authors. Licensee MDPI, Basel, Switzerland. This article is an open access article distributed under the terms and conditions of the Creative Commons Attribution (CC BY) license (http://creativecommons.org/licenses/by/4.0/).
Share and Cite
MDPI and ACS Style
Hakam, D.F.; Wiyono, S.K.; Hariyanto, N. Competition in Power Generation: Ex-ante Analysis of Indonesia’s Electricity Market. Energies 2020, 13, 6741. https://0-doi-org.brum.beds.ac.uk/10.3390/en13246741
AMA Style
Hakam DF, Wiyono SK, Hariyanto N. Competition in Power Generation: Ex-ante Analysis of Indonesia’s Electricity Market. Energies. 2020; 13(24):6741. https://0-doi-org.brum.beds.ac.uk/10.3390/en13246741
Chicago/Turabian StyleHakam, Dzikri Firmansyah, Sudarso Kaderi Wiyono, and Nanang Hariyanto. 2020. "Competition in Power Generation: Ex-ante Analysis of Indonesia’s Electricity Market" Energies 13, no. 24: 6741. https://0-doi-org.brum.beds.ac.uk/10.3390/en13246741
Note that from the first issue of 2016, this journal uses article numbers instead of page numbers. See further details here.