Article

The Dynamic Impacts of Oil Price on China’s Natural Gas Consumption under the Change of Global Oil Market Patterns: An Analysis from the Perspective of Total Consumption and Structure

1
International Business School, Shaanxi Normal University, Xi’an 710119, China
2
School of Economics and Management, Xidian University, Xi’an 710162, China
*
Author to whom correspondence should be addressed.
Submission received: 25 December 2019 / Revised: 13 February 2020 / Accepted: 14 February 2020 / Published: 17 February 2020
(This article belongs to the Special Issue Energy Markets and Economics Ⅱ)

Abstract

:
In recent years, China’s energy structure has been adjusted unceasingly, where the proportion of natural gas has been increasing year by year, and its external dependence has also been increasing. Therefore, it is necessary to discuss the correlation between China’s natural gas market and the international energy market. This paper studies the dynamic relationship between China’s total natural gas consumption, consumption structure, and the international price of oil from the perspectives of mutation and time-variance, using the cointegration test with regime shifts and a state space model. The results show that during the global financial crisis in 2008, the cointegration relationship between China’s total natural gas consumption and the international oil price has undergone structural changes. January 2012 and March 2015 are potential structural mutation points. After the structural mutation, the impact of the international price of oil on China’s total natural gas consumption has weakened. From a structural point of view, urban gas and power generation gas have both been greatly affected by the change of oil price, while industrial gas and chemical gas are less affected. The conclusion here will provide an important empirical reference for optimizing the structure of natural gas consumption and maintaining energy security in China.

Graphical Abstract

1. Introduction

In recent years, environmental pollution and climate change have been widely concerned, and the contradiction between the use of fossil energy and environmental protection has become increasingly prominent. The consumption of fossil energy, especially coal, is still high in China, and the consumption of clean energy is still at a low level. Elucidating how to improve the proportion of clean energy and optimize the structure of energy consumption is of great strategic significance for the sound and rapid development of China’s economy [1,2].
In the long run, renewable energy will be the primary means of energy transformation, but in the short term, natural gas can be used as a transitional choice. As a bridge fuel for the transition from combustible fossil energy to zero-emission renewable energy, natural gas not only can reduce the emission of standard pollutants and greenhouse gases, but also has the potential to change into 100% renewable fuel (such as biogas and renewable hydrogen) [3,4]. As clean energy, China’s natural gas is widely used in power generation, the chemical industry, urban gas, and other industrial production and residential areas, and its consumption is also multiplying [5]. The BP Statistical Review of World Energy 2018 shows that China’s apparent consumption of natural gas in 2018 was 283 billion cubic meters, accounting for 7.5% of total energy consumption, an increase of 18% over 2017, of which the import volume reached 121.3 billion cubic meters, an increase of 30.7%, and the external dependence reached 43%. China’s natural gas market is expanding, and the external dependency is increasing. This puts forward higher requirements for the development of natural gas and energy security [6].
China’s economy is heavily dependent on the international energy market, especially the international crude oil market, which accounts for more than half of China’s oil consumption [7]. In China, natural gas prices are linked to international oil prices. International oil prices affect not only natural gas prices, but also upstream investment and mid-stream infrastructure construction in the natural gas industry chain, which in turn affects natural gas consumption. At the same time, China’s natural gas supply sources are diversified, and the linkage effect between natural gas from different sources and the international oil price is also different. Therefore, the international oil price has a complicated influence on China’s natural gas consumption market. The instability of the international energy market, including recent oil price changes and international conflicts in the Middle East, may have a significant impact on China’s economy. China’s policymakers should focus on energy security and the role of energy in sustainable economic growth.
According to the 13th Five-Year Plan, China’s natural gas consumption will reach 360 billion cubic meters in 2020, accounting for 8.3–10% of primary energy. Under such a policy background, it is of practical significance for China’s energy security and the optimization of energy structure to analyze the dynamic impact of the international oil price on China’s total natural gas consumption and structure. Through the cointegration test with regime shifts, this paper studies the dynamic cointegration relationship between China’s natural gas consumption and crude oil price, and then analyzes the impact of the international oil price on China’s natural gas consumption in different periods. By using a state space model, this paper studies the dynamic and time-varying impact of the international price of oil on China’s different types of natural gas consumption and then analyzes the influence of the international oil price on China’s natural gas consumption structure. We believe that the work of this paper will help us to grasp the evolution law and characteristics of China’s natural gas consumption and structure under the change of global oil market patterns, and this has important guiding significance for the optimization of China’s natural gas consumption structure and the reform of natural gas marketization.
The remainder of the paper is organized as follows: Section 2 presents a review on China’s natural gas consumption, which is involved in the cointegration test with regime shifts and consumption structure. In Section 3, we analyze the influence mechanism of international oil price on the total and structure of natural gas consumption in China. In Section 4, we explain the data source and model selection. Section 5 of this paper presents our empirical results and some analysis of the causes of breakpoints and structural changes. Section 6 provides our conclusions and policy discussion on this topic.

2. Literature Review

There is abundant literature about the relationship between the oil price and natural gas price, and the analysis and prediction of natural gas consumption varies. In the context of existing research, this paper discusses the consumption of natural gas from multiple perspectives and levels. The leading research focuses on the following three aspects: The relationship between the natural gas price and oil price, the influencing factors of natural gas consumption, and the structure of natural gas consumption.

2.1. The Relationship between Natural Gas Price and Oil Price

As two essential components of the world energy, oil and gas prices have always been the focus of the international energy industry and researchers. The price of natural gas is affected by the oil price, which can be followed from the perspective of exploitation and transportation. Because of the substitution of natural gas and oil in the field of industrial fuel and chemical raw materials, some scholars believe that there is a common trend of change between the natural gas price and oil price. In recent years, considering the long-time span of the research samples, most scholars who study the relationship between natural gas price and oil price take into account the significant economic policies and system changes, along with technological revolutions and innovations that may lead to shifts of economic structure.
Villar and Joutz used the Chow test to find the structural breakpoint of the natural gas price series and the crude oil price series and studied the relationship between the North American natural gas price and the international crude oil price through the Johansen cointegration test and Vector Error Correction Model. The results show that the US natural gas price series and the oil price series feature stable cointegration in the long run, even if there has been a decoupling phenomenon between them in some periods [8]. Erdos applied an error correction model to find that the price of natural gas and oil in North America decoupled around 2009 [9]. Ramberg and Parsons used the cointegration test with regime shifts to endogenously test whether there was a structural breakpoint between the natural gas price and the oil price sequence of 1997–2010. They found two structural breakpoints in March 2006 and 2009. Their conclusion shows that the relationship between the natural gas price and oil price is unlikely to remain stable for a long period. They will decouple from one relationship and form a new relationship [10]. Huang Zhuo, Li Chao, and Chen Wei divided the whole sample range into two stages and carried out the cointegration test with segmentation in January 2006. They believed that there was a long-term equilibrium relationship between the crude oil price and natural gas price in the US before 2006, but due to the sharp increase in shale gas production in the US, the North American natural gas market became independent of oil prices around 2006 [11]. Boqiang Lin and Jianglong Li detected that 2008 was an important structural breakpoint between natural gas prices and crude oil prices [12]. Ji Qiang, Liu Minglei, and Fan Ying applied a cointegration test with regime shifts and a time-varying parameter model to test the dynamic relationship between natural gas prices and crude oil prices. The results show that the cointegration relationship between international natural gas prices and crude oil prices has undergone two structural shifts during the hurricane season of 2005 and the financial crisis of 2008. In addition, the influential power of oil price on gas price has presented an inverse U-shaped relationship [13].

2.2. Factors Affecting Natural Gas Consumption

Shi Lijun and Zhou Hong considered population, economy, the environment, and other factors, establishing a forecast model of China’s natural gas supply and demand trend using a system dynamics method. The forecast results show that China’s natural gas supply and consumption will experience rapid growth. However, because of the limitation of recoverable reserves, the natural gas supply will start to decline year after year, where it is predicted to reach a maximum in 2028. The demand for natural gas continues to rise, leading to a continuous increase in imports, and the external dependence of natural gas will continue to increase [14]. Wang and Lin believe that the exploitation of unconventional natural gas will greatly improve China’s annual natural gas production and thus promote natural gas consumption [15]. However, Zeng believes that the natural gas price and household population are important factors influencing the consumption of residential gas [16]. Zhang and Yang deem that factors affecting China’s natural gas consumption include the GDP, urbanization rate, energy efficiency, energy consumption structure, industrial structure, and exportation of goods and services [17]. Mukhtar used Structural Vector Auto Regression model (SVAR) to study the impact of macroeconomic variables on natural gas consumption. They found that the devaluation of the exchange rate could boost local production, which in turn would lead to more gas consumption and improved growth in the country [18].

2.3. The Structure of Natural Gas Consumption

More than 50% of China’s natural gas was used for the chemical industry before 1995. In recent years, with the acceleration of China’s urbanization process as well as the improvement of environmental protection and infrastructure, China’s natural gas consumption structure has gradually changed from chemical and industrial fuels to become more diversified. The structure of natural gas consumption has continuously been optimized, with the development of urban gas, natural gas power generation, liquefied natural gas (LNG) vehicles, and other consumption. Figure 1 presents China’s natural gas consumption structure. According to Figure 1, the consumption structure of natural gas in China was 13% urban gas, 45% industrial fuel, 2% power generation, and 40% chemical industry in 1994. While, by 2017, the consumption structure of natural gas in China was 33% urban gas, 32% industrial fuel, 15% chemical industry, and 20% power generation. At present, the average gasification rate of urban natural gas in China is only about 25%, which is expected to increase to 40–50% by 2020. According to the national general plan for natural gas development, 76% of the cities in China will use natural gas by the middle of the 21st century, and natural gas will gradually become the main fuel of the urban gas market. The share of urban gas consumption in natural gas is expected to further close to developed countries’ levels of around 40%.
Wang and Lin divided China’s natural gas consumption into three sectors, namely, residential, industrial, and commercial. The study found that the sensitivity of residential sectors to the natural gas prices is higher than that of industrial and commercial sectors in the long run [19]. Zhang and Ji constructed an autoregressive distributed lag model to study the elasticity of natural gas demand in various sectors of China. Their research shows that natural gas in the industrial and power generation sectors complements coal, while natural gas in the residential sector lacks price elasticity, but, similar to developed countries, it has high income-elasticity [20]. Yan and Qin, using an approach based on particle swarm multi-objective optimization theory, built a natural gas consumption structure model considering supply uncertainty and the peaking capacity constraint. The results show that the optimization of natural gas consumption structure can not only meet the demand of all parties for natural gas consumption but also increase the total revenue and enhance the capacity of gas turbine peak shaving and wind power absorption [21].
Based on the summary of the existing research, it can be seen that the theoretical and empirical research of China’s natural gas consumption mostly studies the price of natural gas and the influencing factors of natural gas consumption from the perspective of total consumption. It is less useful to study the consumption structure of natural gas from the perspective of four industries, especially to take the factors of the international energy market into account. China’s natural gas dependence on foreign countries is increasing day by day, and the influence of the total amount and structure of natural gas consumption on the international energy market is increasing day by day. This paper aims to analyze the dynamic influence of international oil price on the total amount and structure of China’s natural gas consumption under the change of global oil market patterns, which can particularly enrich the existing research of the current natural gas consumption market.

3. Theoretical Analysis

China’s natural gas consumption is affected by the international oil price in three aspects. The first is the income effect. China’s natural gas price is linked with the international oil price, so that the international oil price affects natural gas price, and then affects its consumption. The second is the substitution effect, where, as vital energy in China, oil is the primary alternative energy of natural gas, and the price of alternative energy will affect natural gas consumption. Finally, the change of the international oil price will affect the prediction of producers on the natural gas market, further affecting the upstream investment of the natural gas industry chain and the infrastructure construction in the middle reaches, and ultimately affecting gas consumption.
China’s natural gas consumption mainly falls into four categories, namely, urban gas, natural gas power generation, chemical raw materials, and industrial fuel. The international oil price will have different impacts on different consumption types, and then consequently affect China’s natural gas consumption structure. The main characteristic of urban gas consumption is consumption for heating. In southern cities, residents use air conditioning and other heating equipment more frequently in winter, and the alternative energy is mainly electric power. Daily gas consumption is also affected by electricity consumption, so the primary alternative energy sources of urban gas are liquefied petroleum gas and electric power [19]. With the increase of social electricity consumption, natural gas power generation has become the primary substitute for coal-fired power plants under load limitations [22]. At the same time, under the dual pressure of environmental protection and primary energy consumption, the proportion of new energy power generation, such as water energy, wind energy, and solar energy, has gradually increased [23]. Therefore, the gas consumption of power generation is mainly affected by international oil price, coal price, and new energy price. Compared with coal, natural gas has the advantages of environmental protection and full combustion. Although China vigorously promotes gasification projects and speeds up the pace of natural gas replacement, coal is still the fundamental industrial fuel in China. Coal and petroleum products account for 70% and 14% of industrial fuel, respectively. Therefore, the consumption of industrial fuel gas is affected by both coal and oil [19]. Natural gas is mainly used in chemical industry to synthesize ammonia, methanol, and produce PVC, in combination with the development of the chlor-alkali industry. Therefore, chemical gas consumption is also affected by coal and oil. Figure 2 shows the mechanism of the influence of oil price on natural gas.

4. Data and Models

4.1. Data

Given the leading position of the North American natural gas market in the international energy market, scholars that have studied the relationship between the international natural gas and oil prices have mostly used the West Texas Intermediate (WTI) crude oil price in the United States in the past. However, this paper selects the Brent crude oil price, which is more closely related to China’s energy market, in order to study the relationship between China’s natural gas consumption and the international oil price in more detail. Moreover, the supply of Brent crude oil is generally stable, less affected by local supply and demand, and more internationally representative. This paper selects the apparent consumption of natural gas as the dependent variable. China’s natural gas is mainly used in four fields, namely, urban gas, power generation gas, chemical gas and industrial gas. At the same time, China’s oil consumption and natural gas price are selected as control variables here. The price of natural gas is expressed in terms of the Cost Insurance and Freight (CIF) price of propane. Since 2011, China has begun to liberalize the pilot price control of natural gas, so the price data of natural gas starts from 2011. This paper uses the consumption data of natural gas in different industries. Firstly, 50 sub-industries are used, which have been classified according to their actual functions into four categories. The classification results are shown in Table 1. Secondly, according to the monthly apparent consumption data of natural gas, we have determined the monthly weight index of natural gas consumption every year, dividing the four types of natural gas consumption data into monthly data from the annual data.
The sample range of this paper is from January 1998 to May 2019. The Brent crude oil price data comes from the website of U.S. Energy Information Administration (EIA) and the apparent consumption of natural gas and consumption by sectors have been based on the Wind database.

4.2. Model Selection

In order to study the dynamic influence of the international oil price on China’s total natural gas consumption and structure from the perspective of mutation and gradation, this paper has selected a cointegration test with regime shifts and a state space model.
First of all, considering the long-time span of the research sample, the significant economic events during the sample period may lead to the change of economic structure. However, the traditional Engle-Granger (EG) two-step cointegration test does not consider the situation of structural mutation in the time series data. In order to consider the mutation factors, this paper selects a method proposed by Gregory and Hansen [24]. They considered structural mutation points in a cointegration test. The model mainly includes three types, namely, intercept term change without a time trend (C), intercept term change with a time trend (C/T), and simultaneous intercept term and coefficient term change (C/S). They put forward ADF*, Zt*, and Zα* type tests, the purpose of which is to test the ineffectiveness of non-cointegration and the substitution of cointegration in case of regime shifts. The null hypothesis of the model is that there is no regime shift. If the test statistics obtained reject the null hypothesis, it means that there is cointegration with regime shift. Gregory and Hansen’s method can not only accurately test the cointegration relationship between variables, but also determine the location of an endogenous structural change point in a time series. From the perspective of mutation, it can accurately determine the location and the causes of structural change in the relationship between the international oil price and China’s total natural gas consumption and analyze the influence of the international oil price on China’s natural gas consumption in different periods.
Based on the relationship between the international oil price and China’s total natural gas consumption, we have analyzed the dynamic influence of international oil price on four types of natural gas consumption from the perspective of gradual change using a state space model with a time-varying coefficient, judging the dynamic response of China’s natural gas consumption structure under the condition of international oil price change.

5. Results and Discussion

5.1. Unit Root Test

Table 2 shows the results of the results of Augmented Dickey–Fuller (ADF) and Philips–Perron tests of the data series, and the specific model type of the unit root test was selected according to Akaike information criterion (AIC) and Schwarz Criterion (SC) criteria. In order to overcome the influence of data series volatility and heteroscedasticity, the logarithm transformation of the data was carried out. The consumption of natural gas in China was recorded as lnCN, the international oil price as lnPO, the consumption of crude oil in China as lnCO, and the price of natural gas as lnPN. It can be seen that the gas and oil prices are integrated by an order of one I (1), while the crude oil consumption and natural gas price are stable sequences. Therefore, we can use Engle-Granger (EG) two-step method to test whether there is cointegration relationship between the gas and oil prices.
According to the unit root with the break test, the consumption of natural gas in China (lnCN) and the international oil price (lnPO) both represent non-stationary time series, occurring in August 2008 and February 2004, respectively. The results are shown in Table 3.

5.2. Cointegration Test

5.2.1. EG Two-Step Cointegration Test

As the data of natural gas consumption and the international oil price are stationary regarding the first-order differences, they meet the conditions of the cointegration test. First, the long-term relationship between natural gas consumption and international oil price was analyzed by using the two-step cointegration test proposed by Engle and Grange. It uses the least square method for the first step regression, and the estimated results are shown in Table 4.
In the second step, the unit root test was carried out for the fitting residual sequence ε t , and the ADF and PP test methods were selected. The results are shown in Table 5. It can be seen that both test methods show that the residual is non-stationary, that is, there is no long-term stable cointegration relationship between China’s natural gas consumption and international oil prices.
This result is not consistent with many existing research conclusions. It is generally believed that there is a close substitutional relationship between natural gas and oil in production and consumption. The international oil price has a long-term impact on China’s natural gas consumption, so their series has a long-term cointegration relationship in theory. Through comparison, we found that much of the current research sample ranges were from up to the end of 2007. However, global political and economic events, such as the global financial crisis in 2008, the widespread exploitation of shale gas in 2015, and US sanctions against Iran in 2019, may have led to structural changes in the relationship between the two. Traditional cointegration testing methods cannot detect the cointegration relationship with regime shifts. Therefore, the accuracy of the above tests needs to be further verified.

5.2.2. Cointegration Test with Regime Shifts

This section uses the cointegration test method proposed by Gregory and Hansen (1996), considering the possibility of structural changes in the cointegration vector, using the following three models to test the cointegration relationship. Among them, ln C N , t and ln P O , t represent China’s natural gas consumption and international crude oil price, respectively. Here, “ln” represents the logarithmic processing of the data.
  • Level shift (C):
    ln C N , t = α 1 + α 2 D t ( T B ) + β ln P O , t + ε t
  • Level shift with trend (C/T):
    ln C N , t = α 1 + α 2 D t ( T B ) + γ t + β ln P O , t + ε t
  • Regime shift (C/S):
    ln C N , t = α 1 + α 2 D t ( T B ) + β 1 ln P O , t + β 2 ln P O , t D t ( T B ) + ε t
Table 6 shows the test results under the three different models. The null hypothesis is that there is no cointegration relationship. It can be seen that the statistics of the C and C/T models significantly reject the null hypothesis at the level of 1%, and the C/S model rejects the null hypothesis at the level of 5%, which indicates that there is still a cointegration relationship between China’s natural gas consumption and crude oil price when considering the endogenous structure breakpoint.
By analyzing the location of the structural breakpoint, we have found that the cointegration relationship between natural gas consumption and the oil price has undergone two structural transformations at the end of 2008 and the beginning of 2015. Among them, the global financial crisis broke out in the second half of 2008. In November, the total foreign trade volume of China began to show a negative growth, which fell by 9% year on year. Since November 2008, the global financial crisis has had a substantial impact on China’s foreign trade. Taking 2008 as the boundary, the international energy market began to enter the post financial crisis era. At the beginning of 2015, the construction of the “the Belt and Road” stage entered a stage of pragmatic promotion. China’s natural gas price consolidation plan was promulgated and implemented, unifying the stock and incremental gas gate station price, comprehensively adjusting the price of natural gas for non-resident users, and attempting to liberalize prices of direct gas for customers. At the same time, the energy market began to form the three pillars of Organization of the Petroleum Exporting Countries (OPEC), the United States, and Russia. The driving mechanism between oil and natural gas has changed such that the market has undergone a structural adjustment. The international energy market has entered a new triangle era. The locations of structural change points determined by the model correspond precisely to the nodes of the changing times of the international energy market. According to the results of the cointegration test, we can infer that the relationship between China’s natural gas consumption and international oil price is affected by the global economic performance, the international energy situation, the degree of opening-up strategies, and the market-oriented reform of natural gas price in China.
According to the conclusion of the cointegration test with regime shifts, virtual variables were introduced to fit the above three models, and the results are shown in Table 7.
In order to test the robustness of the model results, the Hatemi-J test of double structure mutation was used in this paper to verify and explain the different structure mutation points of the above three models. The test results are shown in Table 8.
The results of the two methods are November 2008, January 2012, and March 2015. Among them, in January 2012, Guangdong Province and the Guangxi Autonomous Region became the pilots of natural gas price reform, adopting the market net return value to price natural gas for the first time. The price of natural gas has become an essential factor affecting the consumption of natural gas. After the two tests, we found that November 2008 was identified as the structural mutation point of the cointegration relationship between natural gas consumption and the crude oil price in China, and January 2012 and November 2015 were the potential structural mutation points.
According to the results of the cointegration test with regime shifts, we determined November 2008 as the structural mutation point, dividing all the samples into two subsamples, and adding control variables for regression. As the time series of variables are not stable, lnCN and lnPO are I (1) sequences, and lnCO are I (0) sequences, and the autoregressive-distributed lag model (ARDL) is used for regression in this paper. The results are shown in Table 9. From 1998 to 2008, China’s natural gas consumption, international oil price and China’s oil consumption had a cointegration relationship, but after the structural change in 2008, the cointegration relationship was not significant, given that the natural gas price reform made the natural gas price become an essential factor that affects natural gas consumption since January 2012. The natural gas price (lnPN) was added into the model as a control variable to test the data after 2012. The results are shown in Table 10. The inspection results are shown in Table 11.
Before the structural change in 2008, the main effect of the international oil price on natural gas consumption was a substitution effect, that is to say, oil is the alternative energy of natural gas, and the rise of the international oil price will promote the consumption of natural gas. However, after the structural change in 2008, the long-term impact of the international oil price on China’s natural gas consumption is not significant. After 2012, the long-term impact of international oil price on China’s natural gas consumption changed from a positive impact to a negative impact. China’s natural gas consumption is greatly influenced by oil consumption and the natural gas price, while the international oil price has little influence on China’s natural gas consumption. The impact of other factors on the natural gas market has increased, while the impact of the international crude oil market has significantly weakened.

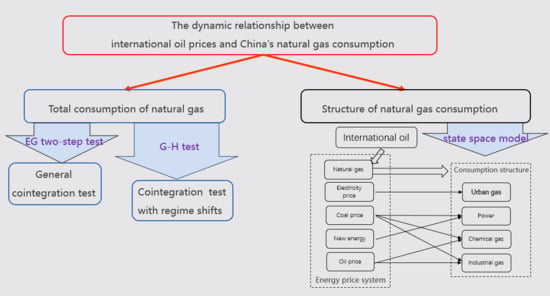
5.2.3. State Space Model

It can be seen from the results in the previous section, the relationship between China’s natural gas consumption and international oil prices is unfixed. Moreover, China’s natural gas consumption structure is becoming increasingly diversified. Therefore, this section focuses on the dynamic relationship between China’s natural gas consumption structure and international oil prices using a state space model, which can be expressed in the following forms:
y i t = α + β t x t + ε t
β t = φ β t 1 + μ t
where y is the consumption of natural gas, x is the international oil price, i stands for types, and t denotes time. Equation (4) is the measurement equation and Equation (5) is the state equation.
The consumption data of the four kinds of natural gas, i.e., urban gas, power generation gas, chemical gas and industrial fuel, and the international oil price data are respectively recorded as lncity, lnelectricity, lnchemistry, lnindustry, and LNP. First of all, the state space equations of the four kinds of natural gas consumption and international oil price were established to study the time-varying dynamic relationship and the structural characteristics between them. Then, the results were normalized to analyze the impact of the international oil price on China’s natural gas consumption structure.
  • Time-varying elasticity coefficient of natural gas consumption to oil price:
Figure 3 shows that the time-varying dynamic relationship between various types of natural gas consumption in China and the international oil price is similar. Nevertheless, different types have their own unique characteristics. From 1998 to 2017, the elasticity of the four types of natural gas consumption to international oil prices decreased first, then increased during the global financial crisis in 2008, where the influence of the international oil price on the four types changed significantly and the elasticity of them fell suddenly and then rebounded rapidly. This feature is consistent with the time of the structural breakpoint detected. As new forms of natural gas consumption, urban gas and power generation gas are greatly affected by the change of oil price, among which the most massive change was found for power generation gas. 
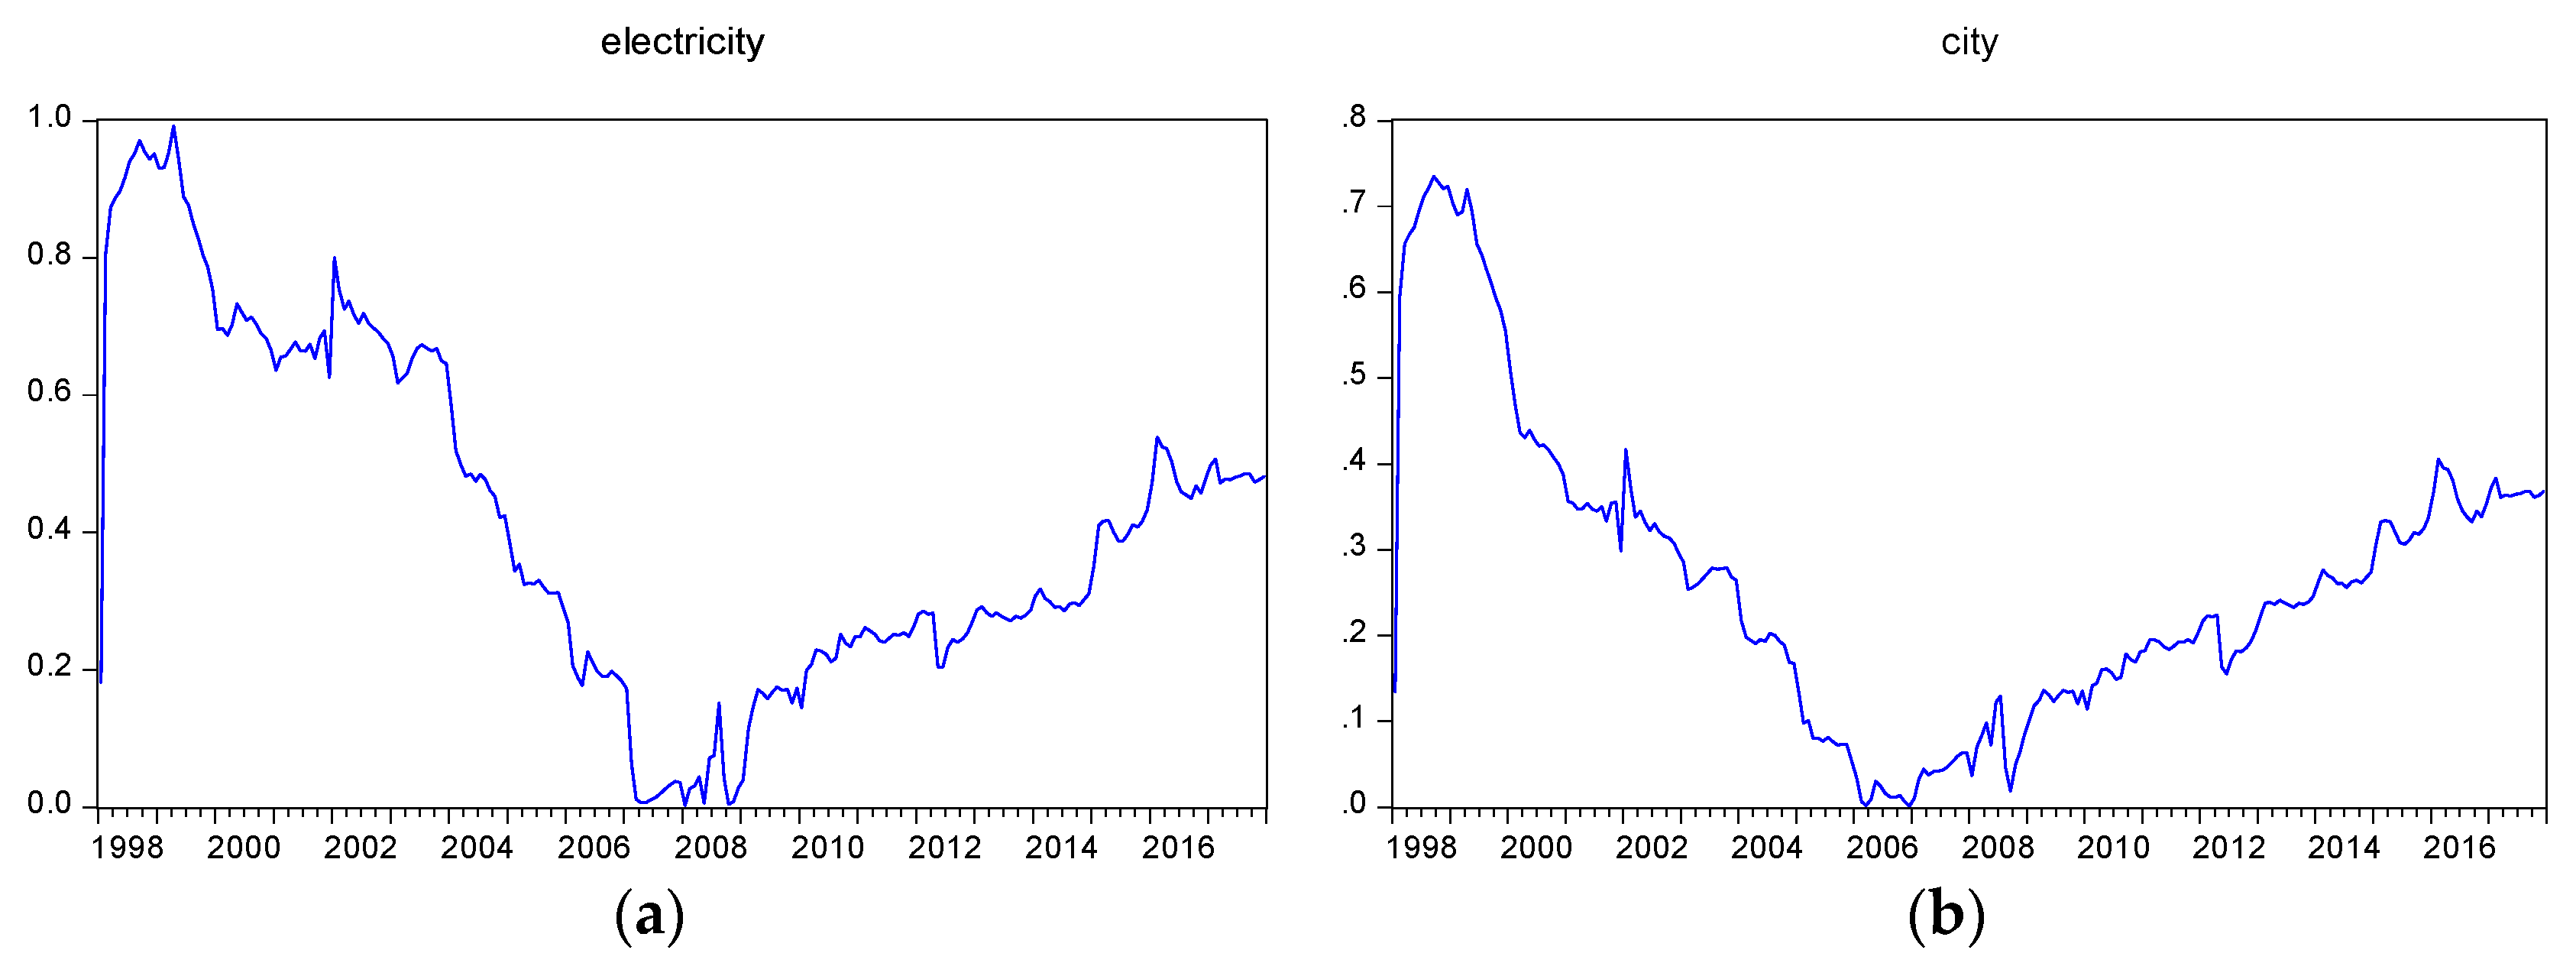
Figure 4 shows that the time-varying elasticity of generation gas and urban gas.
From 1998 to 2017, the elasticity of power generation gas to oil price experienced a tortuous process. China began to vigorously develop natural gas power generation in 2004. From 2004 to 2005, 60 sets of gas-steam combined cycle power generation projects were tendered successively in China. The increase of demand for natural gas in the power generation industry led to producers being more sensitive to the substitution relationship between oil and gas, and the impact of oil price on power generation gas increased. Therefore, the elasticity of power generation gas to oil price continued to increase from 2006 to 2008. After 2014, with nuclear power, wind power, solar energy, and other new energy power generation methods gradually coming into the public view, the growth rate of China’s gas-fired power generation installed capacity continued to decrease, and the increasing trend of the elasticity slowed down from then onwards.
The elasticity of urban gas to oil price has gradually decreased since 1998. After China began to import LNG in 2006, the absolute value of urban gas elasticity was lower than 0.03 from February 2006 to February 2007, during which the change of international oil price had little impact on the consumption of urban gas. While, the long-term LNG trade agreement entered into the “window period”, so that there was a limited supply phenomenon in China in 2016, and the elasticity of the urban gas to oil price started to increase. Residential gas and LNG vehicle gas are the main components of China’s urban gas. Demand for residential gas is rigid, while the LNG vehicle gas demand has large elasticity, which is easily affected by the changes in international oil prices. It is quite common to use natural gas as vehicle fuel in developed countries. As a vehicle fuel, LNG has significant economic and social benefits due to its mature technology, clean emission, and low fuel cost. However, it also has disadvantages, such as the high purchase cost and difficulty of fuel supply. In the period of tight natural gas supply, consumers are sensitive to the substitution relationship between oil and gas, and the guiding ability of oil price to natural gas is further strengthened. While in the case of the excess supply of natural gas, restricted by conversion technology, it is difficult for natural gas to replace the consumption of oil products further. At this time, the impact of oil price changes on urban gas is significantly weakened.
Industrial gas consumption is greatly affected by environmental protection policies, while chemical gas consumption is mainly influenced by coal and other alternative energy prices. As the main consumption form of natural gas, they are less affected by the change of oil price.
2.
The influence of oil price on the consumption structure of natural gas:
According to Figure 5, we can see that the change of oil price has the most significant impact on China’s power generation gas and urban gas consumption, and the contribution of them to the change of China’s natural gas consumption is the highest. Among the changes in natural gas consumption caused by international oil prices, the total proportion of power generation gas and urban gas can reach 70%. It is worth noting that the proportion of power generation gas exceeded 40% before 2006, although it has declined and continued to be less than 40% after 2008, where it still ranks first among the four types of natural gas consumption. The contribution of industrial gas and chemical gas to the change of China’s natural gas consumption is relatively low, which accounts for about 30% of the change caused by the international oil price. The consumption of these two types of natural gas is more stable and less affected by the change in oil price.

6. Conclusions and Policy Discussion

This paper has analyzed the dynamic relationship between China’s natural gas consumption and international oil price through a cointegration test with regime shifts and has used a state space model to estimate the influence of the international price of oil on China’s natural gas consumption structure in different periods. Based on the empirical analysis, this paper has found that:
  • The global financial crisis and China’s significant strategic economic policies are the external drivers of structural changes in the relationship between China’s natural gas consumption and the international crude oil market. The traditional cointegration test cannot test the structural change of the relationship between natural gas consumption and crude oil price adequately, while the cointegration test with regime shifts has better testability and can identify the location of breakpoints endogenously. Although there is a cointegration relationship between natural gas and crude oil prices, structural changes took place in November 2008, and uncertain structural changes took place in January 2012 and March 2015. The breakpoints can correspond to the outbreak of the global financial crisis in the second half of 2008, and when Guangdong Province and Guangxi Autonomous Region became the pilots of natural gas price reform in 2012 and the early part of 2015, which is in line with the natural gas price combination plan in China.
  • The influence intensity of the international oil price on natural gas consumption is not fixed and varies in different periods. In periods of tight supply, the guiding ability of the crude oil price to the natural gas price is relatively stable, and the tendency of natural gas consumption to follow oil prices is pronounced. However, the impact of the international oil price on China’s natural gas consumption has been weakening since 2008, and the two have a trend of separation.
  • Urban gas and power generation gas are new forms of natural gas consumption and they are greatly affected by changes in oil prices. The influence of oil prices on power generation gas increases as the demand for natural gas in the power generation industry increases. With the input and promotion of new energy generation methods, the consumption elasticity growth trend of power generation to oil price slows down. Urban gas has the same characteristics. During periods of tight natural gas supply, consumers are sensitive to the substitution relationship between oil and gas, such that the guiding ability of the oil price to the natural gas consumption is strong. The impact of oil price changes on urban gas is significantly weakened by the abundance of natural gas. However, as the primary consumption forms of natural gas, industrial gas and chemical gas are less affected by changes in oil prices.
Compared with developed countries, China’s natural gas market has two problems, namely, low total consumption and an unreasonable consumption structure. The results of this paper show that different types of natural gas consumption are affected by the international oil price to different degrees. Mindlessly encouraging the development of natural gas and generally carry out energy substitution may achieve little, which will not only increase the burden of the government and enterprises, but also cause the effect of unsatisfactory energy structure optimization. Therefore, in the process of encouraging the development of natural gas, the government should optimize the structure of natural gas consumption on the premise of ensuring the stable and sustainable growth of natural gas consumption. Based on this, this paper puts forward the following suggestions:
  • The results of this paper show that the consumption of gas for power generation is greatly affected by the change of international oil prices and power generation is the most potential field for natural gas development. Combined with the current electricity market situation, we should vigorously develop renewable energy generation to complement and promote natural gas power generation, as to cope with the low trend of natural gas power generation when the oil price is low, thereby maintaining the stability of power generation and ensuring sufficient power supply.
  • From the perspective of urban gas, the development of LNG vehicles should be encouraged to steadily increase the consumption of urban gas and optimize the consumption structure of natural gas. First of all, the government should actively explore ways to improve the competitiveness of natural gas vehicles through financial subsidies, tax incentives, and vehicle purchase differential subsidies. Secondly, in terms of technology, the development of long-distance vehicles, including urban buses and large freight vehicles, should be encouraged to increase the consumption of urban gas.
  • Industrial fuel gas consumption is less affected by changes in international oil prices, so this kind of natural gas consumption is relatively stable, which is essential for the stable development and continuous increase of total natural gas consumption. As an industrial fuel, natural gas is less economical than coal. It is necessary to implement stricter environmental standards and constraints to increase the use of coal, together with subsidies for natural gas consumption, in order to improve the competitiveness of natural gas under the premise of environmental protection and guarantee the stable development of industrial gas.
  • Due to the rigid demand, the impact of the change of oil prices on the chemical gas is least, where the change of oil prices leads to the rise of natural gas prices, and loss in the chemical sector is the most severe compared to the other sectors. As an irreplaceable raw material, natural gas is widely used in the chemical sector. Based on this, two suggestions are put forward in this paper. Firstly, in terms of technology, we should improve the utilization efficiency of natural gas and reduce the cost and economic loss caused by changes in oil prices. Secondly, in terms of the industrial chain, we should subsidize the downstream industries, such as agriculture and medicine industries, in order to improve the economy of chemical gas.

Author Contributions

Conceptualization, J.C. and Y.J.; Methodology, J.C. and Y.J.; Software, J.C. and Y.J.; Validation, J.C. and Y.J.; Formal analysis, J.C. and Y.J.; Investigation, J.C. and Y.J.; Resources, J.C.; Data curation, Y.J.; Writing—original draft preparation, Y.J.; Writing—review and editing, J.C.; Visualization, J.C. and Y.J.; Supervision, J.C.; Project administration, J.C. All authors have read and agree to the published version of the manuscript.

Funding

This research received no external funding.

Acknowledgments

This work was supported by the National Natural Science Foundation of China under grant number 71874133.

Conflicts of Interest

The authors declare no conflict of interest.

References

  1. Li, L.; Zhang, J.R.; Tang, L.; Yu, L.A. Analysis on Factors of China’s energy intensity changes for 1997–2012: Based on Structural Decomposition Analysis. Chin. J. Manag. Sci. 2017, 25, 125–132. [Google Scholar]
  2. Xu, J.Z.; Wang, M.M.; Guan, J. Research on Mechanism of Carbon Emission from Energy Consumption and Green Innovation Efficiency in Dynamic Endogenous Perspective Based on Chinese Equipment Manufacturing Industries. Manag. Rev. 2019, 31, 81–93. [Google Scholar]
  3. Han, S.F.; Zhang, B.S.; Sun, X.Y.; Han, S.; Höök, M. China’s energy transition in the power and transport sectors from a substitution perspective. Energies 2017, 10, 600. [Google Scholar] [CrossRef] [Green Version]
  4. Mac Kinnon, M.; Brouwer, J.; Samuelsen, S. The role of natural gas and its infrastructure in mitigating greenhouse gas emissions, improving regional air quality, and renewable resource integration. Prog. Energy Combust. Sci. 2018, 64, 62–92. [Google Scholar] [CrossRef]
  5. Wang, T.; Lin, B. China’s natural gas consumption peak and factors analysis: A regional perspective. J. Clean. Prod. 2017, 142, 548–564. [Google Scholar] [CrossRef]
  6. Huang, X.Y. Market power is the root cause of large fluctuations in international oil prices. Manag. World 2019, 35, 195–197. [Google Scholar]
  7. Zhang, D.; Cao, H.; Wei, Y.M. Identifying the determinants of energy intensity in China: A Bayesian averaging approach. Appl. Energy 2016, 168, 672–682. [Google Scholar] [CrossRef]
  8. Villar, J.; Joutz, F.L. The Relationship between Crude Oil and Natural Gas Prices; Energy Information Administration, Office of Oil and Gas: Washington, DC, USA, 2006.
  9. Erdős, P. Have oil and gas prices got separated? Energy Policy 2012, 49, 707–718. [Google Scholar] [CrossRef]
  10. Ramberg, D.J.; Parsons, J.E. The Weak Tie Between Natural Gas and Oil Prices. Energy J. 2012, 33, 13–35. [Google Scholar] [CrossRef] [Green Version]
  11. Huang, Z.; Li, C.; Cheng, W. Research on the linkage between crude oil and natural gas prices in the United States—On the impact of shale gas development on the energy market. Price Theory Pract. 2014, 7, 103–105. [Google Scholar]
  12. Lin, B.Q.; Li, J. The spillover effects across natural gas and oil markets: Based on the VEC–MGARCH framework. Appl. Energy 2015, 155, 229–241. [Google Scholar] [CrossRef]
  13. Ji, Q.; Liu, M.L.; Fang, Y. Structural Changes in the Driving Factors of International Natural Gas Price. J. Appl. Stat. Manag. 2016, 35, 951–960. [Google Scholar]
  14. Shi, L.J.; Zhong, H. Supply /Demand Safety Analysis for Natural Gas in China Based on System Dynamics. China Soft Sci. 2012, 3, 162–169. [Google Scholar]
  15. Wang, T.; Lin, B.Q. Impacts of unconventional gas development on China’s natural gas production and import. Renew. Sustain. Energy Rev. 2014, 39, 546–554. [Google Scholar] [CrossRef]
  16. Zeng, S.; Chen, Z.M. Price elasticity, block tariffs, and equity of natural gas demand in China: Investigation based on household-level survey data. J. Clean. Prod. 2018, 179, 441–449. [Google Scholar] [CrossRef]
  17. Zhang, W.; Yang, J. Forecasting Natural Gas Consumption in China by Bayesian Model Averaging. Energy Rep. 2015, 1, 216–220. [Google Scholar] [CrossRef] [Green Version]
  18. Mukhtar, D.G.; Abubakar, W.A. Shocks effects of macroeconomic variables on natural gas consumption in Nigeria: Structural VAR with sign restrictions. Energy Policy 2019, 125, 135–144. [Google Scholar]
  19. Wang, T.; Lin, B.Q. China’s Natural Gas Consumption and Subsidies—From a Sector Perspective. Energy Policy 2014, 65, 541–551. [Google Scholar] [CrossRef]
  20. Zhang, Y.; Ji, Q.; Fan, Y. The price and income elasticity of China’s natural gas demand: A multi-sectoral perspective. Energy Policy 2018, 113, 332–341. [Google Scholar] [CrossRef]
  21. Yan, Q.Y.; Qin, C. A multi-objective optimal allocation model for regional natural gas consumption structure: A case study of Beijing. Nat. Gas Ind. 2019, 39, 156–164. [Google Scholar]
  22. Arora, V.; Cai, Y.; Jones, A. The national and international impacts of coal-to-gas switching in the Chinese power sector. Energy Econ. 2016, 60, 416–426. [Google Scholar] [CrossRef]
  23. Liu, P.K.; Wang, M.B.; Cheng, B. Orderly development of China’s power generation industry: An empirical analysis based on provincial layout and industrial organization. Syst. Eng. Theory Pract. 2018, 38, 1445–1464. [Google Scholar]
  24. Gregory, A.W.; Hanson, J.M.; Watt, D.G. Testing for Structural Breaks in Cointegrated Relationships. J. Econom. 1996, 71, 321–341. [Google Scholar] [CrossRef]
Figure 1. China’s natural gas consumption structure.
Energies 13 00867 g001
Figure 2. Mechanism of the influence of oil price on natural gas.
Energies 13 00867 g002
Figure 3. Time-varying elasticity of the four types of gas usage.
Energies 13 00867 g003
Figure 4. (a) The elasticity of generation gas. (b) The elasticity of urban gas.
Energies 13 00867 g004
Figure 5. Impact of oil price changes on the natural gas consumption structure.
Energies 13 00867 g005
Table 1. Classification of natural gas consumption types.
TypeIndustries
Urban gasConsumption of living, agriculture, wholesale, retail and accommodation, catering, transportation, storage and postal services, construction, water production and supply, and gas production and supply
Power generation gasProduction and supply of electric power and heat
Chemical gasChemical fiber manufacturing, pharmaceutical manufacturing, chemical raw materials, and chemical products manufacturing;
Industrial gasCommunication equipment, computer and other electronic equipment manufacturing, electrical machinery and equipment manufacturing, and transportation equipment manufacturing.
Table 2. Results of unit root test.
VariablesADFPPResult
Level1st DifferenceLevel1st Difference
lnCN−0.17−10.09 ***−1.35−43.30 ***I (1)
lnPO−2.12−12.86 ***−1.96−12.87 ***I (1)
lnCO−4.93 *** −13.47 *** I (0)
lnPN−3.51 ** −3.01 * I (0)
* Significant at a 10% level; ** significant at a 5% level; *** significant at a 1% level.
Table 3. Results of unit root with break test.
VariablesADFBreak Date
lnCN−2.83August 2008
lnPO−3.24February 2004
* Significant at a 10% level; ** significant at a 5% level; *** significant at a 1% level.
Table 4. First step regression results.
ClnPO R 2 ¯
0.1781.011 ***0.518
* Significant at 10% level; ** significant at 5% level; *** significant at 1% level.
Table 5. EG cointegration test results.
ResidualADFPP
ε t ^ (t)−1.55−2.50
* Significant at a 10% level; ** significant at a 5% level; *** significant at a 1% level.
Table 6. Gregory–Hansen cointegration test results.
Regime ShiftsCC/TC/S
ADF−5.18 ***−15.91 ***−5.52 **
Position0.8050.5100.805
TimeMarch 2015November 2008March 2015
* Significant at a 10% level; ** significant at a 5% level; *** significant at a 1% level.
Table 7. Gregory–Hansen cointegration test equation.
ModelCDt (TB)lnPotlnPo Dt (TB) R 2 ¯
C0.1501.295 ***0.953 *** 0.859
C/T2.428 ***0.183 ***0.083 ***0.010 *** 0.964
C/S0.1003.348 ***0.966 *** −0.512 ***0.863
* Significant at a 10% level; ** significant at a 5% level; *** significant at a 1% level.
Table 8. Hatemi-J cointegration test results.
ADF−8.59 ***
Position0.5060.661
TimeNovember 2008January 2012
* Significant at a 10% level; ** significant at a 5% level; *** significant at a 1% level.
Table 9. ARDL long run form of the subsample.
January 1998 to October 2008
ClnCN(−1)lnCOlnPO(−1)D(lnCN(−1))D(lnCN(−2))D(lnPO)D(lnPO(−1))
−4.9 ***0.60 ***0.88 ***0.08−0.34 ***−0.31 ***−0.21−0.49 **
November 2008 to May 2019
ClnCN(−1)lnCOlnPO(−1)DlnCN(−1))D(lnCN(−2))D(lnPO)D(lnPO(−1))
0.08−0.09 **0.07−0.05−0.13 * −0.37 ***
* Significant at a 10% level; ** significant at a 5% level; *** significant at a 1% level.
Table 10. ARDL long run form with the control variable.
January 2012 to May 2019
ClnCn(−1)D(lnCN(−1))lnCO(−1)D(lnCO)D(lnCO(−1))
−8.68 ***0.55 ***0.10 ***1.24 ***−0.71 ***−0.20 ***
D(lnCO(−1))lnPNlnPO(−1)D(lnPO)D(lnPO(−1))
−0.20 ***0.30 ***−0.21 ***−0.44 ***0.10
* Significant at a 10% level; ** significant at a 5% level; *** significant at a 1% level.
Table 11. F-bounds test.
January 1998 to October 2008November 2008 to May 2019January 2012 to May 2019
5.77 ***1.749.16 ***
* Significant at a 10% level; ** significant at a 5% level; *** significant at a 1% level.

